Embed Size (px)
Citation preview
TEC
HN
ICA
L N
OTE
S
Evaluating Occupant Load Factors for Business Operations: Part 3
Virginia Alonso Daniel Alvear
GIDAI Group, University of Cantabria
Fire Protection Research Foundation
© July 2013

2
Acknowledgements
The Fire Protection Research Foundation expresses gratitude to those that assisted with the development and review of the information contained in this report. The Research Foundation appreciates the guidance provide by the Project Technical Panel:
Ken Bush, Maryland State Fire Marshal’s Office
Dave Frable, GSA
Nancy Hurley, NFPA
Erica Kuligowski, NIST
Dan O’Connor, Aon Fire Protection Engineering Corp.
Milosh Puchovsky, WPI
John Tello, Boston Properties
Kristin Bigda, NFPA Staff Liaison
Special thanks are expressed to NFPA for funding this project through the annual Code Fund.
The authors of this report thank the collaboration of Villar-Mir Group, Pacadar, OHL, Fertiberia, FerroAtlántica, Gestión Torre Espacio, PwC, Sacyr Vallehermoso Group, Banco Santander, Bankia, Mutua Madrileña, Mapfre, Embassies of Canada and Netherlands, Iberdrola and the University of Cantabria. They also express their gratitude to Dr. Arturo Cuesta and Dr. Orlando Abreu for his contributions and his support in this Project.
Keywords: occupant load, means of egress, business occupancy, mercantile occupancy
Evaluating Occupant Load Factors for Business Use Areas
3
Abstract The NFPA 101 Life Safety Code and NFPA 5000 Building Construction and Safety Code specify an occupant load factor of 100 feet2/person for business use. Business and office spaces have undergone a big concept transformation and that value may be not adequate for all types of current business uses. We have collected and processed data from several offices areas in order to provide more information for code revision for the Technical Committee on Mercantile and Business Occupancies of NFPA. 1. Introduction The occupant load factor has been widely employed by engineers and architects to determine the means of egress requirements (number of routes, dimensions, etc). The NFPA Standards (NFPA 101, Life Safety Code and NFPA 5000 Building Construction and Safety Code) specify an occupant load factor of 100 square feet/person of floor area for all business occupancies. This value is based on the traditional office layouts in the 1930´s. However the new business uses and the use of these spaces have considerably changed. Call centres or high productivity technology based business can result in higher density levels. Therefore, there is a need for real data in order to evaluate whether the occupant load factor established by NFPA standards can be applied to all business use areas. The goal of the project was to collect and process data regarding the actual occupant loads, specifically in office environments. For that purpose, site surveys have been conducted in different types of office buildings (public administration and private sector companies) in the cities of Santander, Madrid and Bilbao (Spain). 2. Objectives The specific objectives of the project were:
1. To achieve the collaboration of public administration and private companies. We made a selection of the companies to include “concentrated” and “less concentrated” areas.
2. To define a universal questionnaire to be used in any type of business uses. These documents should be useful for other future works or new stages of this project.
3. To collect a significant amount of data through site surveys on business use areas.
Evaluating Occupant Load Factors for Business Use Areas
4
4. To process the information. The data collected was statistically processed in
order to evaluate whether the occupant load factor established by standards can be applied to all business use areas.
3. Methodology The methodology is divided into the following stages:
1. Contacts 2. Questionnaire 3. Data collection: Site surveys 4. Analysis of additional information
3.1. Contacts GIDAI contacted with 29 private companies and 2 public administrations. We sent a letter to presidents or CEO of various large companies in the cities of Bilbao, Madrid and Santander (Spain). This letter explained the aim of the project to support the NFPA Technical Committee to evaluate the current occupant load factor. After the initial letter contact, email contact was used with the companies. The selection of the companies covered a wide range of different business uses. The response of these private companies and public administration was better than expected (22 entities accepted to participate). Data from 20 companies and 1 public administration building are included in this report (71 % of total contacted companies); however we expect that this information could be updated with data from other office buildings in future works. 3.2. Questionnaire Figure 1 shows the questionnaire. This document was approved by the Project Technical Panel. It is expected that this questionnaire can be used for any country and office typology. Previous to the site survey, the questionnaire was sent to the contact person (facilities manager or person in charge) in order to provide them an overview of the data collection. Figure 2 shows the instructions to complete the questionnaire.

Evaluating Occupant Load Factors for Business Use Areas
5
Building General Information Name:…………………………………………………………….……………… Position: ………………………………………………………………………… City:…………………… Phone:......................... E-mail: ………………..…
Building name: …………………………………………………………. Floor: ………….
Total Area (m2): …………………. Floor Height (m): ……… Internal code:
Occupant load density
Total Gross Floor Area GFA(m2): Total Net Floor Area NFA (m2):
Area 1 Area 2 Area 3 Area 4 Area 5 Area 6 Area 7 Area 8 Area 9
Type
Layout
GFA
NFA
Nº of employees
Nº of visitors
Age (%): …….16 – 29 …….30 – 50 …….50 – 65 Gender (%): …….Men ……. Female Disabled people: ………………………………………………
Type of disability:……………………………………………...
Nº of exits: ….. Exit 1 width(m): ….. Maximum evacuation distance (m): ….. Exit 2 width(m): ….. Maximum evacuation distance (m): …..
Exit 3 width(m): ….. Maximum evacuation distance (m): ….. Exit 4 width(m): ….. Maximum evacuation distance (m): …..
Remarks
Name: Date: Signature:
Fig. 1. Questionnaire for data collection.
Evaluating Occupant Load Factors for Business Use Areas
6
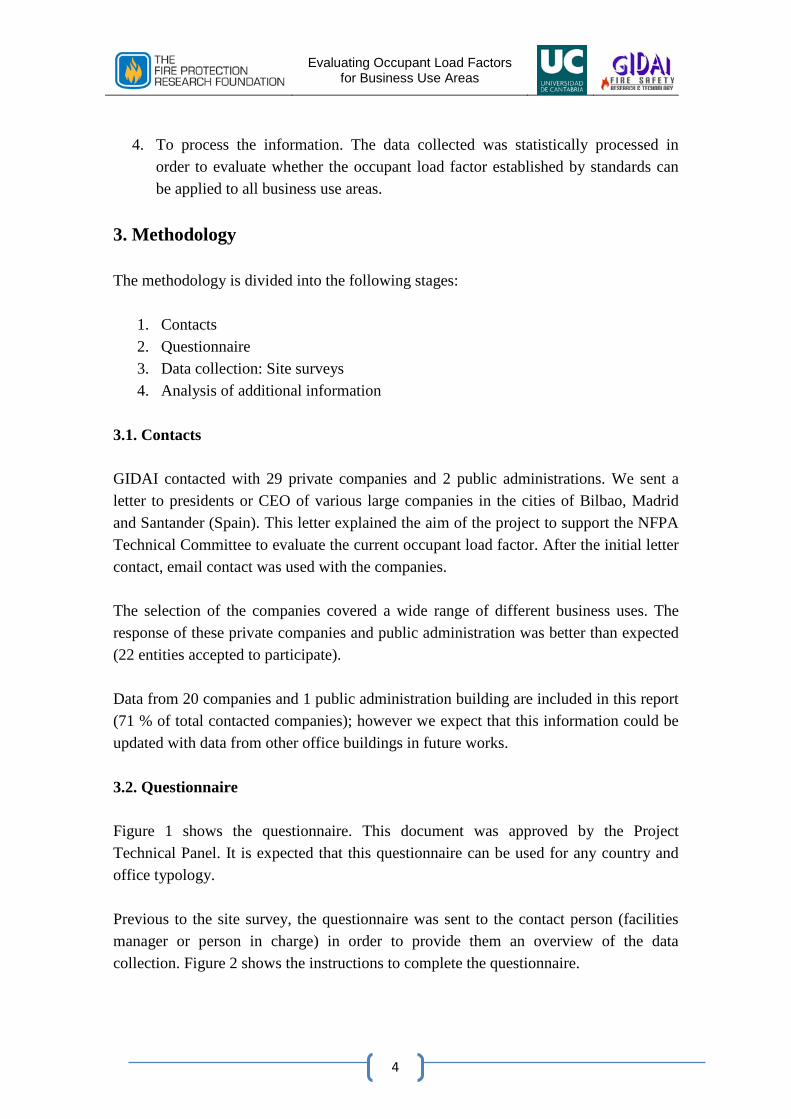
METHODOLOGY TO COMPLETE THE QUESTIONAIRE
Fig. 2. Instructions to complete the questionnaire.
Building General Information Name: The name of the person who is performing the survey Position: Indicate which is he/she position in the company City: city in which the building is located Phone: contact phone E-mail: contact e-mail
Building name: Indicate the name of the office building Floor: Indicate the floor number
Total Area (m2): Indicate the total floor area Floor Height (m): Indicate the floor height
Internal code: An internal code that will be filled by GIDAI
Occupant load density
Total Gross Floor Area GFA(m2): Indicate the total gross floor surface Total Net Floor Area NFA (m2): Indicate the total net floor surface with deduction for hallways, stairs and other features.
Type Select a type of area activity within the floor: 1- work area, 2- conference area or 3 – other area ( break rooms, entrance lobby, etc )
Layout Select one of the following layouts types: 1 - open space, 2 – closed space or 3 – partially closed space (cubicles)
Gross Area Indicate the space area in square meters
Net Area Indicate the space area in square meters with deduction for hallways, stairs and other features.
Nº of employees Indicate the total number of people working on that area
Nº of visitors Indicate the number of visitors that uses and they are not employees.
Age (%):Indicate the percentages of ages on the floor Gender (%): Indicate the percentage of women and men on the floor
Disabled people: Indicate the number of disabled people
on the floor
Type of disability: Indicate the type of disability(ies)
Nº of exits: Indicate the number of floor exits Exit width: Indicate the width of each floor exit Maximum evacuation distance (m): Indicate the maximum distances to each
Remarks: Indicates any other information about that may be considered important or relevant Indicate the Name and Surname of the person who has filled this survey
Indicate the date when the survey has been filled signature of the person who has filled the survey
Evaluating Occupant Load Factors for Business Use Areas
7
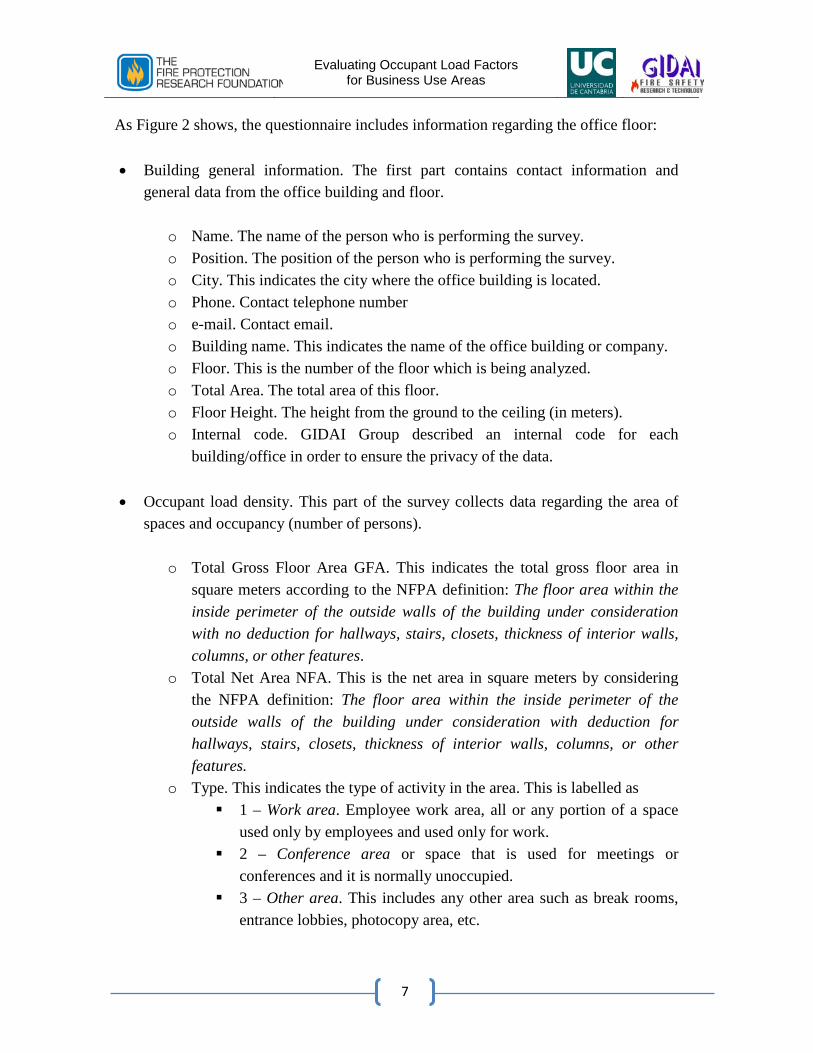
As Figure 2 shows, the questionnaire includes information regarding the office floor:
• Building general information. The first part contains contact information and general data from the office building and floor.
o Name. The name of the person who is performing the survey. o Position. The position of the person who is performing the survey. o City. This indicates the city where the office building is located. o Phone. Contact telephone number o e-mail. Contact email. o Building name. This indicates the name of the office building or company. o Floor. This is the number of the floor which is being analyzed. o Total Area. The total area of this floor. o Floor Height. The height from the ground to the ceiling (in meters). o Internal code. GIDAI Group described an internal code for each
building/office in order to ensure the privacy of the data.
• Occupant load density. This part of the survey collects data regarding the area of spaces and occupancy (number of persons).
o Total Gross Floor Area GFA. This indicates the total gross floor area in square meters according to the NFPA definition: The floor area within the inside perimeter of the outside walls of the building under consideration with no deduction for hallways, stairs, closets, thickness of interior walls, columns, or other features.
o Total Net Area NFA. This is the net area in square meters by considering the NFPA definition: The floor area within the inside perimeter of the outside walls of the building under consideration with deduction for hallways, stairs, closets, thickness of interior walls, columns, or other features.
o Type. This indicates the type of activity in the area. This is labelled as 1 – Work area. Employee work area, all or any portion of a space
used only by employees and used only for work. 2 – Conference area or space that is used for meetings or
conferences and it is normally unoccupied. 3 – Other area. This includes any other area such as break rooms,
entrance lobbies, photocopy area, etc.
Evaluating Occupant Load Factors for Business Use Areas
8
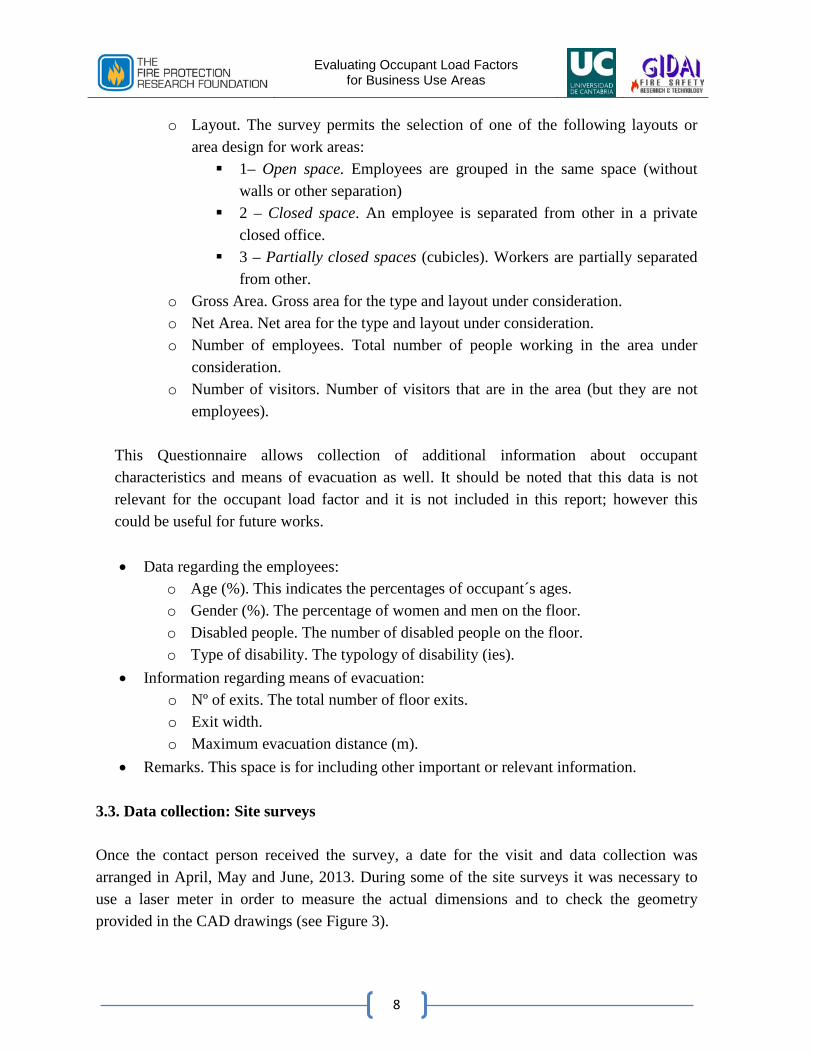
o Layout. The survey permits the selection of one of the following layouts or area design for work areas: 1– Open space. Employees are grouped in the same space (without
walls or other separation) 2 – Closed space. An employee is separated from other in a private
closed office. 3 – Partially closed spaces (cubicles). Workers are partially separated
from other. o Gross Area. Gross area for the type and layout under consideration. o Net Area. Net area for the type and layout under consideration. o Number of employees. Total number of people working in the area under
consideration. o Number of visitors. Number of visitors that are in the area (but they are not
employees). This Questionnaire allows collection of additional information about occupant characteristics and means of evacuation as well. It should be noted that this data is not relevant for the occupant load factor and it is not included in this report; however this could be useful for future works.
• Data regarding the employees:
o Age (%). This indicates the percentages of occupant´s ages. o Gender (%). The percentage of women and men on the floor. o Disabled people. The number of disabled people on the floor. o Type of disability. The typology of disability (ies).
• Information regarding means of evacuation: o Nº of exits. The total number of floor exits. o Exit width. o Maximum evacuation distance (m).
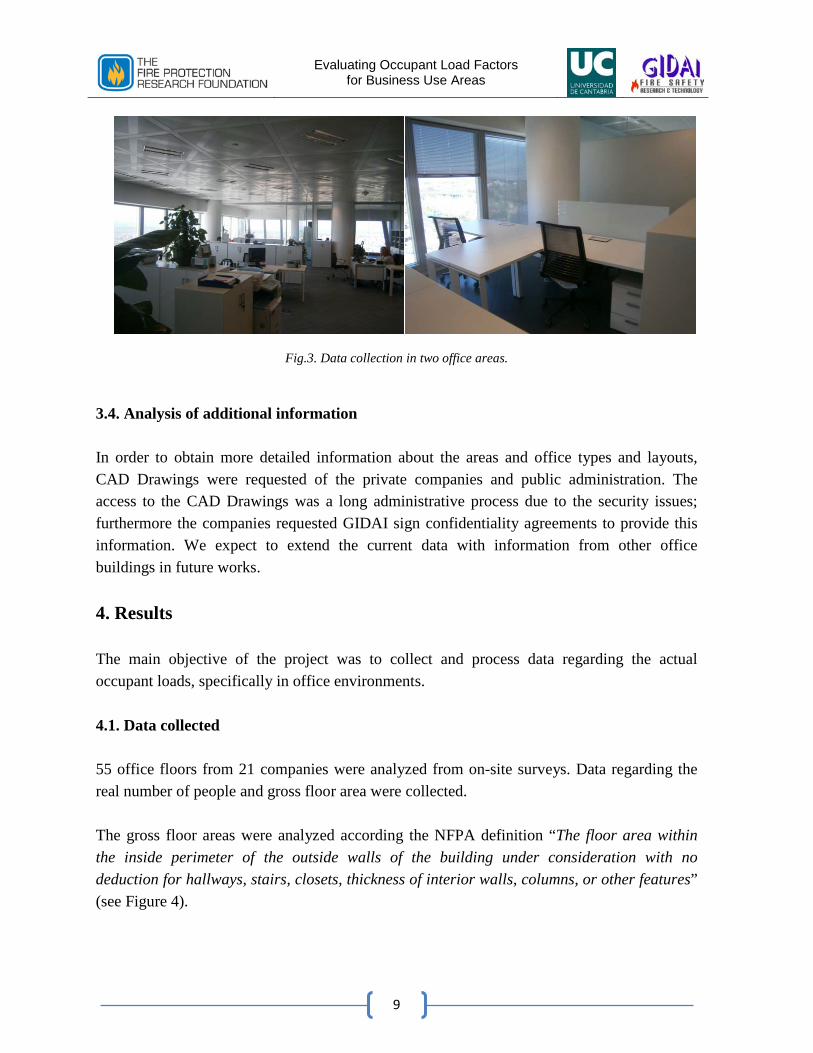
• Remarks. This space is for including other important or relevant information. 3.3. Data collection: Site surveys Once the contact person received the survey, a date for the visit and data collection was arranged in April, May and June, 2013. During some of the site surveys it was necessary to use a laser meter in order to measure the actual dimensions and to check the geometry provided in the CAD drawings (see Figure 3).
Evaluating Occupant Load Factors for Business Use Areas
9
Fig.3. Data collection in two office areas.
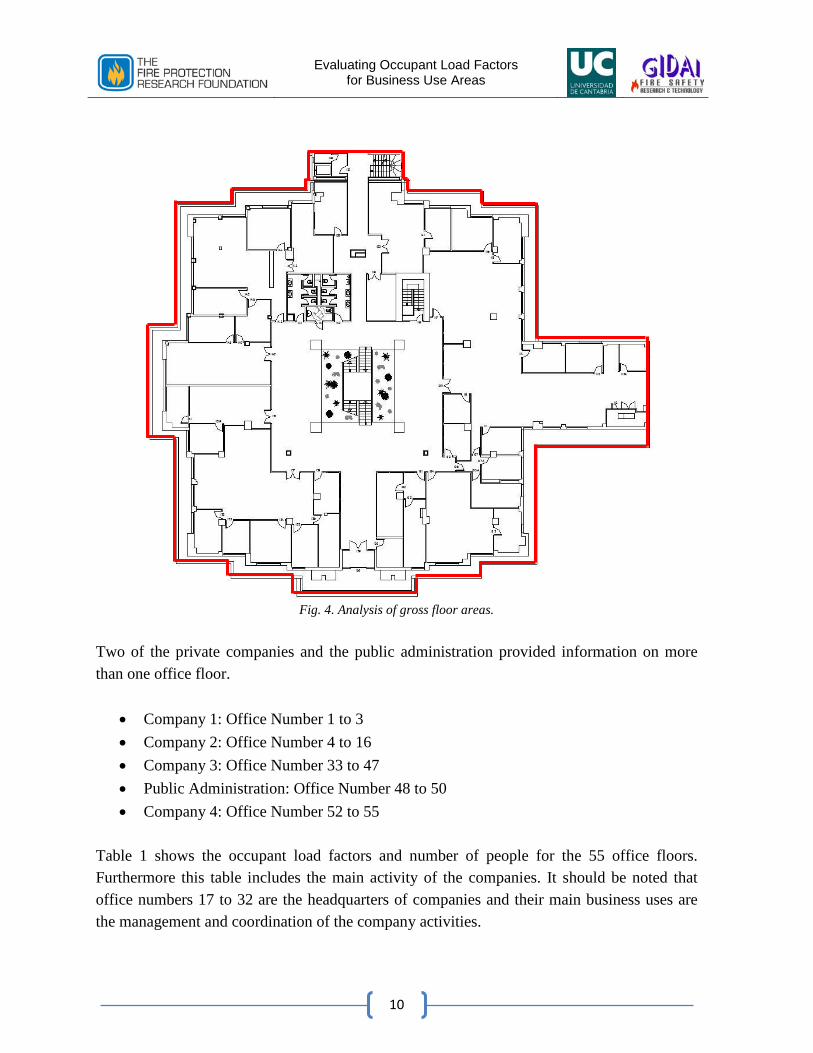
3.4. Analysis of additional information In order to obtain more detailed information about the areas and office types and layouts, CAD Drawings were requested of the private companies and public administration. The access to the CAD Drawings was a long administrative process due to the security issues; furthermore the companies requested GIDAI sign confidentiality agreements to provide this information. We expect to extend the current data with information from other office buildings in future works. 4. Results The main objective of the project was to collect and process data regarding the actual occupant loads, specifically in office environments. 4.1. Data collected 55 office floors from 21 companies were analyzed from on-site surveys. Data regarding the real number of people and gross floor area were collected. The gross floor areas were analyzed according the NFPA definition “The floor area within the inside perimeter of the outside walls of the building under consideration with no deduction for hallways, stairs, closets, thickness of interior walls, columns, or other features” (see Figure 4).
Evaluating Occupant Load Factors for Business Use Areas
10
Fig. 4. Analysis of gross floor areas.
Two of the private companies and the public administration provided information on more than one office floor.
• Company 1: Office Number 1 to 3 • Company 2: Office Number 4 to 16 • Company 3: Office Number 33 to 47 • Public Administration: Office Number 48 to 50 • Company 4: Office Number 52 to 55
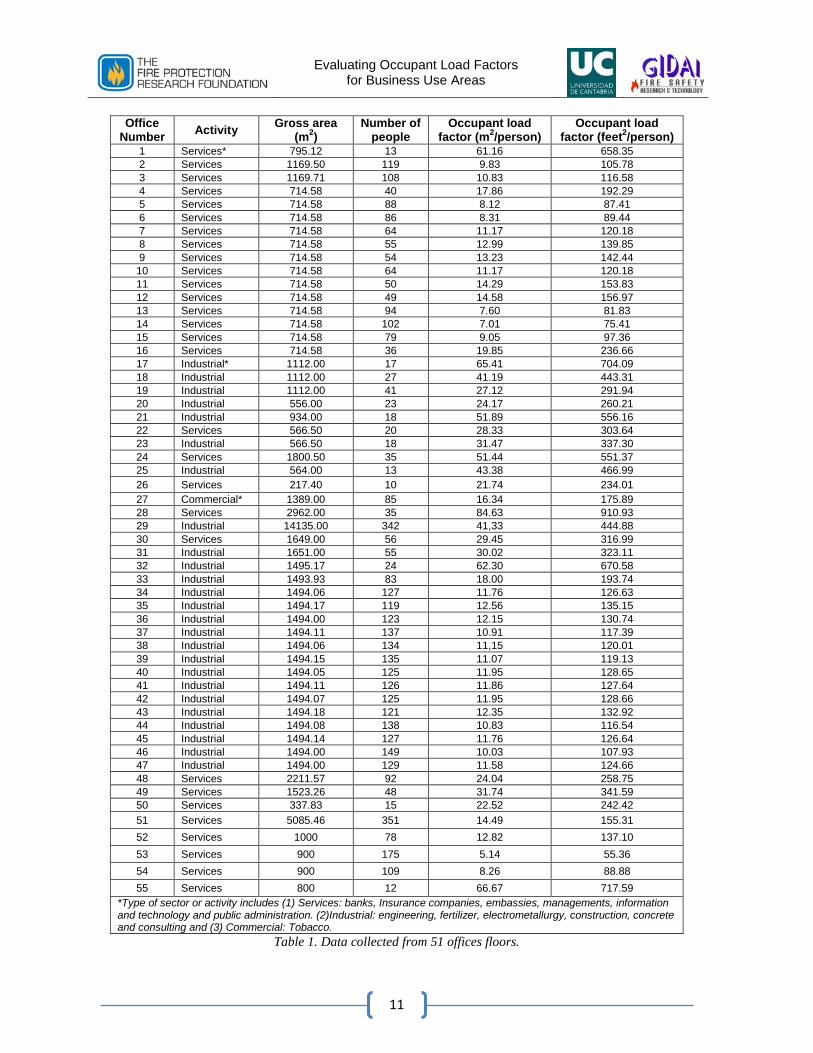
Table 1 shows the occupant load factors and number of people for the 55 office floors. Furthermore this table includes the main activity of the companies. It should be noted that office numbers 17 to 32 are the headquarters of companies and their main business uses are the management and coordination of the company activities.
Evaluating Occupant Load Factors for Business Use Areas
11
Table 1. Data collected from 51 offices floors.
Office Number Activity Gross area
(m2) Number of
people Occupant load
factor (m2/person) Occupant load
factor (feet2/person) 1 Services* 795.12 13 61.16 658.35 2 Services 1169.50 119 9.83 105.78 3 Services 1169.71 108 10.83 116.58 4 Services 714.58 40 17.86 192.29 5 Services 714.58 88 8.12 87.41 6 Services 714.58 86 8.31 89.44 7 Services 714.58 64 11.17 120.18 8 Services 714.58 55 12.99 139.85 9 Services 714.58 54 13.23 142.44 10 Services 714.58 64 11.17 120.18 11 Services 714.58 50 14.29 153.83 12 Services 714.58 49 14.58 156.97 13 Services 714.58 94 7.60 81.83 14 Services 714.58 102 7.01 75.41 15 Services 714.58 79 9.05 97.36 16 Services 714.58 36 19.85 236.66 17 Industrial* 1112.00 17 65.41 704.09 18 Industrial 1112.00 27 41.19 443.31 19 Industrial 1112.00 41 27.12 291.94 20 Industrial 556.00 23 24.17 260.21 21 Industrial 934.00 18 51.89 556.16 22 Services 566.50 20 28.33 303.64 23 Industrial 566.50 18 31.47 337.30 24 Services 1800.50 35 51.44 551.37 25 Industrial 564.00 13 43.38 466.99 26 Services 217.40 10 21.74 234.01 27 Commercial* 1389.00 85 16.34 175.89 28 Services 2962.00 35 84.63 910.93 29 Industrial 14135.00 342 41,33 444.88 30 Services 1649.00 56 29.45 316.99 31 Industrial 1651.00 55 30.02 323.11 32 Industrial 1495.17 24 62.30 670.58 33 Industrial 1493.93 83 18.00 193.74 34 Industrial 1494.06 127 11.76 126.63 35 Industrial 1494.17 119 12.56 135.15 36 Industrial 1494.00 123 12.15 130.74 37 Industrial 1494.11 137 10.91 117.39 38 Industrial 1494.06 134 11,15 120.01 39 Industrial 1494.15 135 11.07 119.13 40 Industrial 1494.05 125 11.95 128.65 41 Industrial 1494.11 126 11.86 127.64 42 Industrial 1494.07 125 11.95 128.66 43 Industrial 1494.18 121 12.35 132.92 44 Industrial 1494.08 138 10.83 116.54 45 Industrial 1494.14 127 11.76 126.64 46 Industrial 1494.00 149 10.03 107.93 47 Industrial 1494.00 129 11.58 124.66 48 Services 2211.57 92 24.04 258.75 49 Services 1523.26 48 31.74 341.59 50 Services 337.83 15 22.52 242.42 51 Services 5085.46 351 14.49 155.31 52 Services 1000 78 12.82 137.10 53 Services 900 175 5.14 55.36 54 Services 900 109 8.26 88.88 55 Services 800 12 66.67 717.59
*Type of sector or activity includes (1) Services: banks, Insurance companies, embassies, managements, information and technology and public administration. (2)Industrial: engineering, fertilizer, electrometallurgy, construction, concrete and consulting and (3) Commercial: Tobacco.
Evaluating Occupant Load Factors for Business Use Areas
12
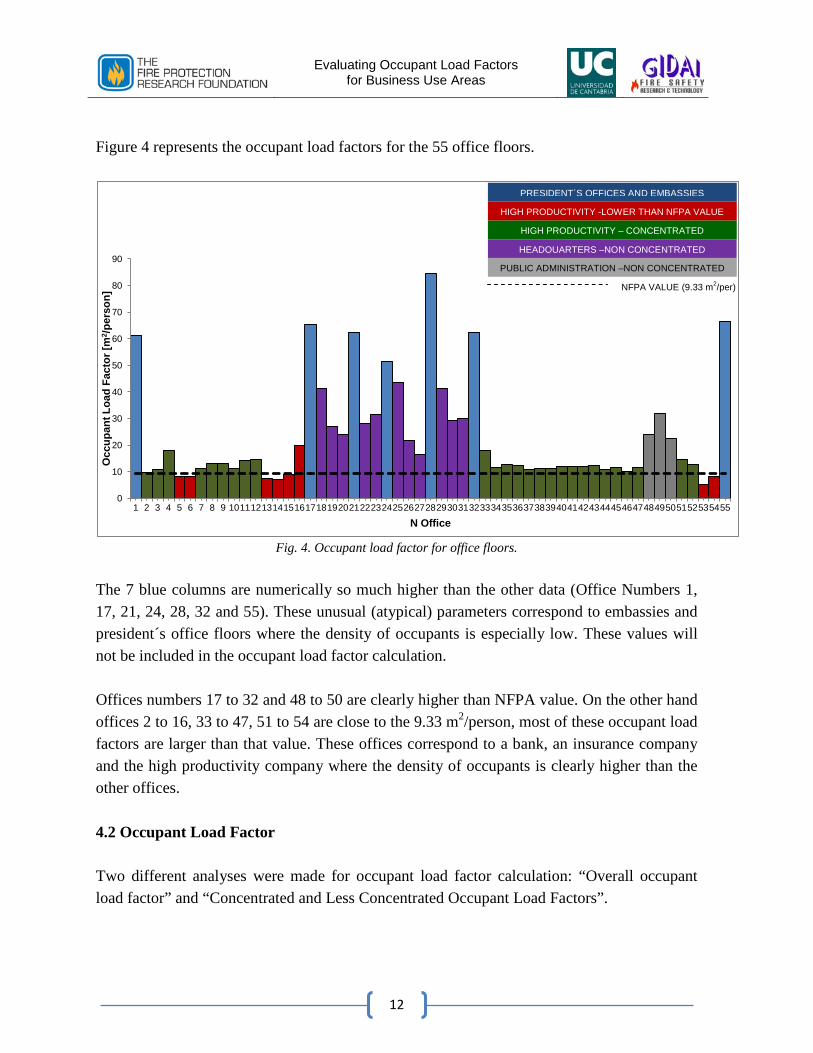
Figure 4 represents the occupant load factors for the 55 office floors.
Fig. 4. Occupant load factor for office floors.
The 7 blue columns are numerically so much higher than the other data (Office Numbers 1, 17, 21, 24, 28, 32 and 55). These unusual (atypical) parameters correspond to embassies and president´s office floors where the density of occupants is especially low. These values will not be included in the occupant load factor calculation. Offices numbers 17 to 32 and 48 to 50 are clearly higher than NFPA value. On the other hand offices 2 to 16, 33 to 47, 51 to 54 are close to the 9.33 m2/person, most of these occupant load factors are larger than that value. These offices correspond to a bank, an insurance company and the high productivity company where the density of occupants is clearly higher than the other offices. 4.2 Occupant Load Factor Two different analyses were made for occupant load factor calculation: “Overall occupant load factor” and “Concentrated and Less Concentrated Occupant Load Factors”.
0
10
20
30
40
50
60
70
80
90
1 2 3 4 5 6 7 8 9 10 11 12 13 14 15 16 17 18 19 20 21 22 23 24 25 26 27 28 29 30 31 32 33 34 35 36 37 38 39 40 41 42 43 44 45 46 47 48 49 50 51 52 53 54 55
Occ
upan
t Loa
d Fa
ctor
[m2 /p
erso
n]
N Office
NFPA VALUE (9.33 m2/per)
PRESIDENT´S OFFICES AND EMBASSIES
HIGH PRODUCTIVITY – CONCENTRATED
HIGH PRODUCTIVITY -LOWER THAN NFPA VALUE
HEADQUARTERS –NON CONCENTRATED
PUBLIC ADMINISTRATION –NON CONCENTRATED
Evaluating Occupant Load Factors for Business Use Areas
13
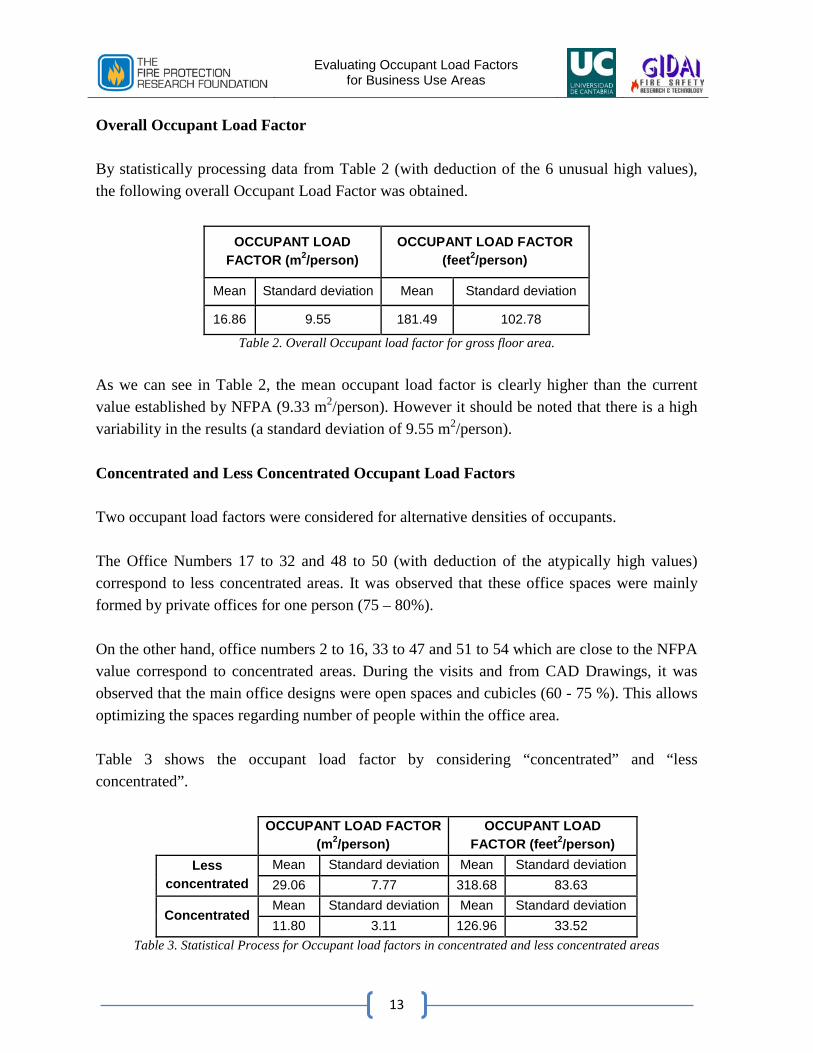
Overall Occupant Load Factor By statistically processing data from Table 2 (with deduction of the 6 unusual high values), the following overall Occupant Load Factor was obtained.
OCCUPANT LOAD FACTOR (m2/person)
OCCUPANT LOAD FACTOR (feet2/person)
Mean Standard deviation Mean Standard deviation
16.86 9.55 181.49 102.78
Table 2. Overall Occupant load factor for gross floor area. As we can see in Table 2, the mean occupant load factor is clearly higher than the current value established by NFPA (9.33 m2/person). However it should be noted that there is a high variability in the results (a standard deviation of 9.55 m2/person). Concentrated and Less Concentrated Occupant Load Factors Two occupant load factors were considered for alternative densities of occupants. The Office Numbers 17 to 32 and 48 to 50 (with deduction of the atypically high values) correspond to less concentrated areas. It was observed that these office spaces were mainly formed by private offices for one person (75 – 80%). On the other hand, office numbers 2 to 16, 33 to 47 and 51 to 54 which are close to the NFPA value correspond to concentrated areas. During the visits and from CAD Drawings, it was observed that the main office designs were open spaces and cubicles (60 - 75 %). This allows optimizing the spaces regarding number of people within the office area. Table 3 shows the occupant load factor by considering “concentrated” and “less concentrated”.
OCCUPANT LOAD FACTOR (m2/person)
OCCUPANT LOAD FACTOR (feet2/person)
Less concentrated
Mean Standard deviation Mean Standard deviation 29.06 7.77 318.68 83.63
Concentrated Mean Standard deviation Mean Standard deviation 11.80 3.11 126.96 33.52
Table 3. Statistical Process for Occupant load factors in concentrated and less concentrated areas
Evaluating Occupant Load Factors for Business Use Areas
14
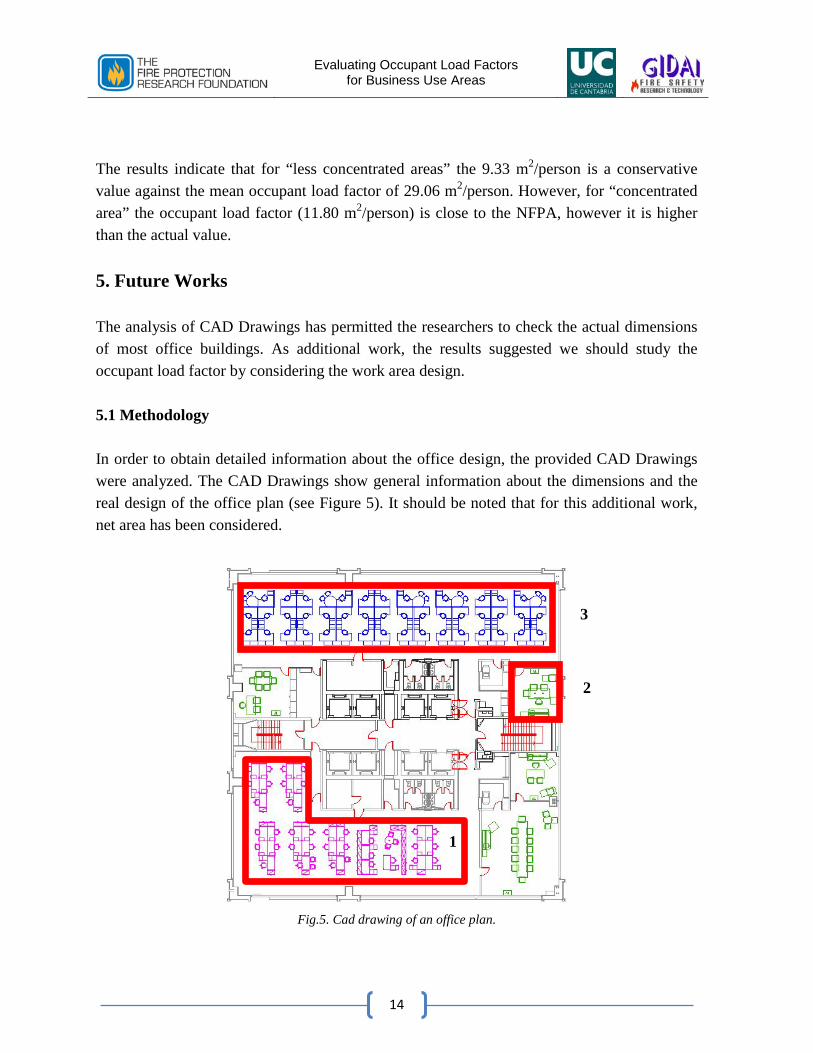
The results indicate that for “less concentrated areas” the 9.33 m2/person is a conservative value against the mean occupant load factor of 29.06 m2/person. However, for “concentrated area” the occupant load factor (11.80 m2/person) is close to the NFPA, however it is higher than the actual value. 5. Future Works The analysis of CAD Drawings has permitted the researchers to check the actual dimensions of most office buildings. As additional work, the results suggested we should study the occupant load factor by considering the work area design. 5.1 Methodology In order to obtain detailed information about the office design, the provided CAD Drawings were analyzed. The CAD Drawings show general information about the dimensions and the real design of the office plan (see Figure 5). It should be noted that for this additional work, net area has been considered.
Fig.5. Cad drawing of an office plan.
1
2
3
Evaluating Occupant Load Factors for Business Use Areas
15
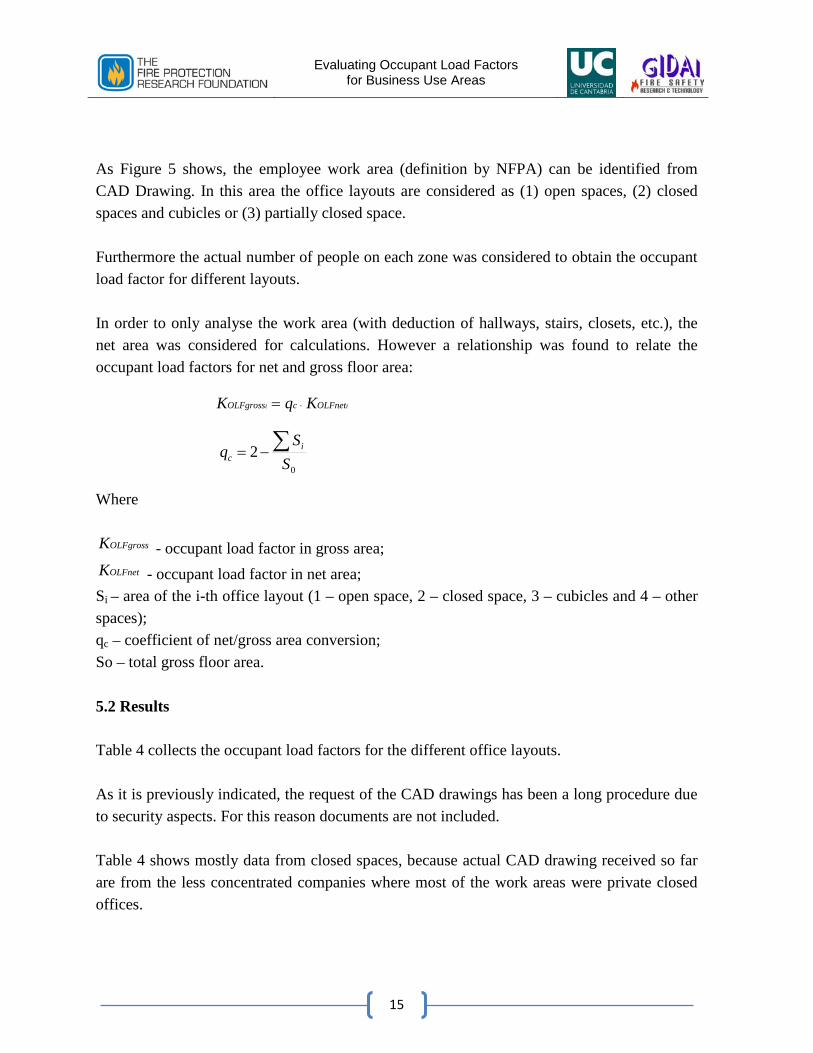
As Figure 5 shows, the employee work area (definition by NFPA) can be identified from CAD Drawing. In this area the office layouts are considered as (1) open spaces, (2) closed spaces and cubicles or (3) partially closed space. Furthermore the actual number of people on each zone was considered to obtain the occupant load factor for different layouts. In order to only analyse the work area (with deduction of hallways, stairs, closets, etc.), the net area was considered for calculations. However a relationship was found to relate the occupant load factors for net and gross floor area: Where
OLFgrossK - occupant load factor in gross area; OLFnetK - occupant load factor in net area;
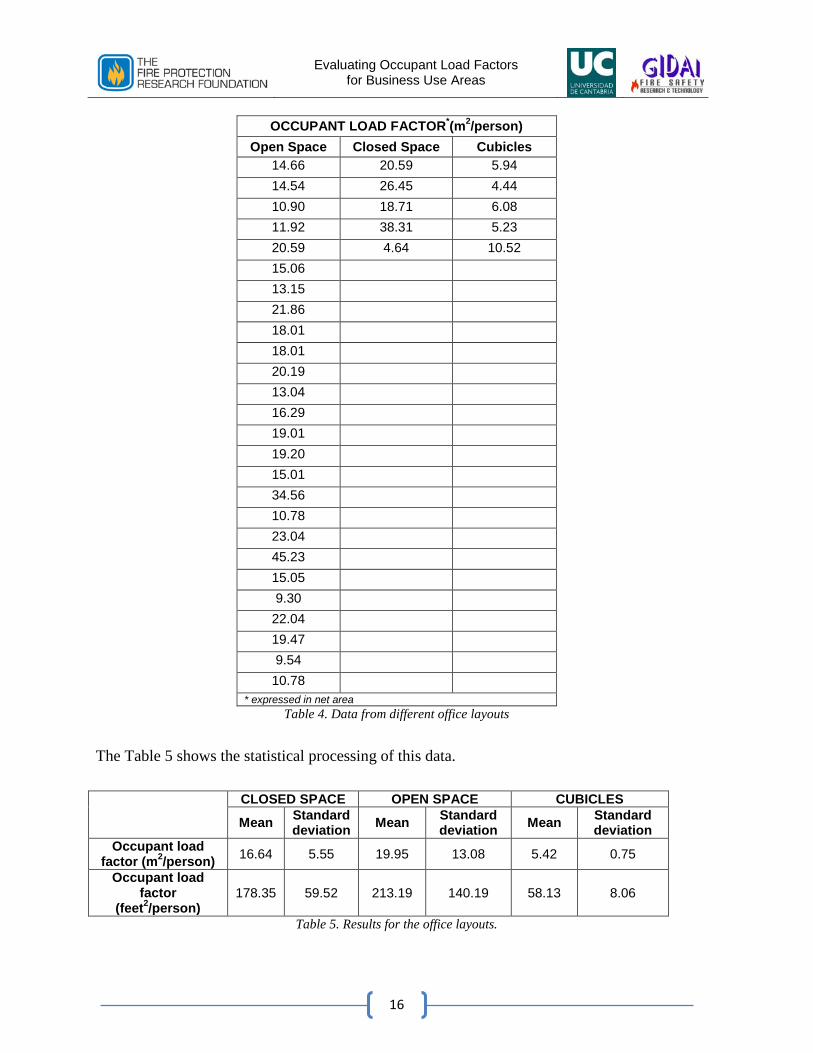
Si – area of the i-th office layout (1 – open space, 2 – closed space, 3 – cubicles and 4 – other spaces); qc – coefficient of net/gross area conversion; So – total gross floor area. 5.2 Results Table 4 collects the occupant load factors for the different office layouts. As it is previously indicated, the request of the CAD drawings has been a long procedure due to security aspects. For this reason documents are not included. Table 4 shows mostly data from closed spaces, because actual CAD drawing received so far are from the less concentrated companies where most of the work areas were private closed offices.
0
2S
Sq i
c∑−=
ii OLFnetcOLFgross KqK ⋅=
Evaluating Occupant Load Factors for Business Use Areas
16
OCCUPANT LOAD FACTOR*(m2/person) Open Space Closed Space Cubicles
14.66 20.59 5.94 14.54 26.45 4.44 10.90 18.71 6.08 11.92 38.31 5.23 20.59 4.64 10.52 15.06 13.15 21.86 18.01 18.01 20.19 13.04 16.29 19.01 19.20 15.01 34.56 10.78 23.04 45.23 15.05 9.30
22.04 19.47 9.54
10.78 * expressed in net area
Table 4. Data from different office layouts The Table 5 shows the statistical processing of this data.
CLOSED SPACE OPEN SPACE CUBICLES
Mean Standard deviation Mean Standard
deviation Mean Standard deviation
Occupant load factor (m2/person) 16.64 5.55 19.95 13.08 5.42 0.75
Occupant load factor
(feet2/person) 178.35 59.52 213.19 140.19 58.13 8.06
Table 5. Results for the office layouts.
Evaluating Occupant Load Factors for Business Use Areas
17
Results show that for closed (16.64 m2/person) and open (19.95 m2/person) spaces the occupant load factors are clearly higher than the NFPA value. However, in cubicles this value is lower and the density of occupants in this type of work areas is higher than the others. Conclusions A relevant amount of data has been collected from site surveys in several office floors in order to analyze the occupant load factor for business use. Different companies’ activities have been considered in order to study a wide range of businesses use and occupant load factors. The data processing shows that current occupant load factor is too conservative against the obtained mean value (16.86 m2/person). However the standard deviation (9.55 m2/person) shows a high variability in the results and it may be not appropriate to use this value for some business uses. The gathered data shows the necessity of considering two occupant load factors in order to accommodate concentrated and non concentrated areas. Results for “concentrated areas” (11.80 m2/person) are close to the NFPA value. However the value of 9.33 m2/person is clearly too restrictive for “non concentrated areas”, where the mean occupant load factor obtained was 29.06 m2/person. The dispersion of these occupant load factors (standard deviation) is lower than 30 %, thus it may be more suitable to employ multiple occupant load factors in order to accommodate concentrated and less concentrated areas. Additional work has been performed from the provided CAD drawings. A detailed analysis of the work areas allowed the calculation of the occupant load factor for different office layouts (open space, closed space and cubicles). For open and closed spaces, the occupant load factors are higher than the NFPA; however for cubicles, the obtained value is lower than 9.33 m2/person. This suggests that the design of the work area is related to the occupant load factor. It should be noted that more data is being receiving and it will be processed. This will permit a significant sample to be obtained and processed for this additional work.


![Advanced FBC 5th Ed. Building and Residential [Read-Only]...0.3 inch x occupant load for stairways 0.2 inch x occupant load for other egress 2013 FBCB 0.3 inch x occupant load for](https://img.dokumen.tips/doc/110x75/5fe8bb6771606627276e6a48/advanced-fbc-5th-ed-building-and-residential-read-only-03-inch-x-occupant.jpg)