Embed Size (px)
Citation preview

This article was downloaded by: [University of Stellenbosch]On: 15 May 2013, At: 22:36Publisher: RoutledgeInforma Ltd Registered in England and Wales Registered Number: 1072954 Registered office: Mortimer House,37-41 Mortimer Street, London W1T 3JH, UK
Building Research & InformationPublication details, including instructions for authors and subscription information:http://www.tandfonline.com/loi/rbri20
Evaluating design strategies, performanceand occupant satisfaction: a low carbon officerefurbishmentLeena E. Thomas aa School of Architecture, Faculty of Design Architecture and Building, University ofTechnology, Sydney, PO Box 123, Broadway, NSW, 2007, AustraliaPublished online: 05 Oct 2010.
To cite this article: Leena E. Thomas (2010): Evaluating design strategies, performance and occupant satisfaction: a lowcarbon office refurbishment, Building Research & Information, 38:6, 610-624
To link to this article: http://dx.doi.org/10.1080/09613218.2010.501654
PLEASE SCROLL DOWN FOR ARTICLE
Full terms and conditions of use: http://www.tandfonline.com/page/terms-and-conditions
This article may be used for research, teaching, and private study purposes. Any substantial or systematicreproduction, redistribution, reselling, loan, sub-licensing, systematic supply, or distribution in any form toanyone is expressly forbidden.
The publisher does not give any warranty express or implied or make any representation that the contentswill be complete or accurate or up to date. The accuracy of any instructions, formulae, and drug doses shouldbe independently verified with primary sources. The publisher shall not be liable for any loss, actions, claims,proceedings, demand, or costs or damages whatsoever or howsoever caused arising directly or indirectly inconnection with or arising out of the use of this material.

RESEARCH PAPER
Evaluating design strategies, performanceandoccupant satisfaction: a lowcarbon
o⁄ce refurbishment
Leena E.Thomas
School of Architecture,Faculty of Design Architecture andBuilding,University of Technology,Sydney,POBox123,BroadwayNSW2007, Australia
E-mail: [email protected]
Existing buildings present the best opportunity for reducing greenhouse gas emissions in developed economies, given that
only 2–3% of the building stock is newly built each year. Insights from a post-occupancy evaluation of a large-scale
refurbishment project of a head office building in Sydney, Australia, are presented to inform future refurbishment
strategies. The study evaluates occupant satisfaction and energy performance, and elicits influencing factors arising
from the design process and interventions, ongoing building management, and operational performance. Occupants
returned a high level of satisfaction across the range of environmental variables for overall comfort, temperature,
lighting, and air quality as well as perceived productivity and health. These outcomes highlight the importance of
improving indoor environmental quality for occupants particularly through increased fresh air, daylight, glare
control, access to views, and noise management. The positive results reinforce the value of an integrated and user-
responsive approach that was adopted for building design, development, and management. The reduction in
operational energy (in this project, coupled with carbon reduction) as a consequence of refurbishment and positive
user feedback demonstrates the potential to future-proof existing buildings in the context of climate change.
Keywords: adaptation, climate change, comfort, energy, indoor environmental quality, integrated design, occupants,
post-occupancy evaluation, refurbishment
Les batiments existants offrent la meilleure possibilite de reduction des emissions de gaz a effet de serre dans les
economies developpees, etant donne que les constructions neuves ne representent chaque annee que 2 a 3% du parc
bati. Les enseignements retires d’une evaluation apres occupation d’une operation de renovation a grande echelle
realisee dans l’immeuble d’un siege social de Sydney, en Australie, sont presentes afin d’inflechir les futures strategies
en matiere de renovation. L’etude evalue la satisfaction des occupants et les performances energetiques, et met au
jour les facteurs d’influence qui decoulent du processus de conception et des interventions realisees, de la gestion en
cours du batiment et des performances de fonctionnement. Les occupants ont exprime un degre de satisfaction eleve
sur l’ensemble des variables environnementales concernant le confort global, la temperature, l’eclairage et la qualite
de l’air, aussi bien que la productivite et la sante telles qu’ils les ont percues. Ces resultats mettent en evidence le fait
qu’il est important d’ameliorer la qualite environnementale interieure pour les occupants, tout particulierement en
apportant davantage d’air frais et de lumiere du jour, un plus grand controle de l’eblouissement, un acces accru a des
panoramas et une gestion renforcee du bruit. Ces resultats positifs renforcent l’utilite d’une approche integree et
sensible aux besoins des utilisateurs, telle qu’elle a ete adoptee pour concevoir, amenager et gerer ce batiment. La
reduction de l’energie de fonctionnement (dans cette operation, conjointement avec la reduction du carbone) en
consequence de la renovation et du feedback positif des utilisateurs demontre le potentiel de cette approche pour
permettre aux batiments existants de bien affronter l’avenir dans le contexte du changement climatique.
Mots cles: adaptation, changement climatique, confort, energie, qualite environnementale interieure, conception
integree, occupants, evaluation apres occupation, renovation
BUILDING RESEARCH & INFORMATION (2010) 38(6), 610–624
Building Research & Information ISSN 0961-3218 print ⁄ISSN 1466-4321 online # 2010 Taylor & Francishttp: ⁄ ⁄www.informaworld.com ⁄journalsDOI: 10.1080/09613218.2010.501654
Dow
nloa
ded
by [
Uni
vers
ity o
f St
elle
nbos
ch]
at 2
2:36
15
May
201
3

IntroductionThe increase in the development of green buildingsacross the world is a positive response to global con-cerns for mitigating carbon dioxide (CO2) emissionsand negative impacts on the environment. Althoughgreen building developments can reduce greenhousegas emissions by as much as 50–60%1 in comparisonwith existing buildings and set directions for futuredevelopment, their impact on overall emissions fromthe building sector remains limited. In some developedcountries such as Australia, the United Kingdom andthe United States, new buildings in a given year consti-tute only 2–3% of building stock, but it is existingbuildings (often built to less strenuous energy stan-dards) that account for the bulk of greenhouse gasemissions. Significantly, much of the commercialoffice stock developed in the last two decades of the20th century is characterized by an energy-intensive,climate-rejecting approach. The operation of thesebuildings relies on air-conditioning and artificial light-ing due to sealed windows, deep floor plates, ‘clean’unshaded facades, and the extensive use of glass.Research undertaken by Davis Langdon (2009) esti-mates that 81% of Australia’s existing commercialoffice stock is over ten years of age and in need ofrefurbishment. The recent global financial downturnhas dampened past tendencies simply to demolishand rebuild with little regard for the energy-intensivenature of building construction.
In this context, the questions surrounding the refurb-ishment of existing buildings are critical in determininghow to address the issue of the ageing building stockand seize the opportunities presented to future-proofthese buildings in the context of climate change.
This paper presents lessons for future buildings thatcan be learnt from a post-occupancy evaluation (PoE)undertaken by the author of a large-scale refurbish-ment project for the Head Office of Stockland PtyLtd in Sydney, Australia.
Research approachPost-occupancy evaluations of buildings are noted fortheir ability to provide vital feedback regarding abuilding’s performance in use (Building Research &Information, 2001). To address the emphasis onreporting on performance, rating tools (EPLabel,2
NABERS3) have been introduced which are designedto measure the actual environmental performance ofbuildings. However, the focus of the assessment hasoften been in terms of technological performance (onaspects such as energy and water efficiency), which dis-regards the experience of the building from the occu-pants’ perspective. Buildings that fail to deliver interms of indoor environmental quality have beennoted to affect occupants’ well-being and productivity
(Wyon, 2004; Vischer, 2007; Leaman et al., 2007).Subsequent measures needed to alleviate their discom-fort often result in great expense and a failure to reachefficiency targets. Further, as noted by a number ofresearchers including Chappells and Shove (2005)and Cole et al. (2008), the prevalent practice of mana-ging and assessing through a quantitative/technologi-cal focus without cognisance of the social/qualitativedimension of occupant needs leads to a ‘commitmentto an unsustainably standardised future’ (Chappellsand Shove, 2005, p. 39).
The focus of the research presented in this paper is thenexus between the design approach, designed attri-butes, and environmental consequences in buildings.The study elicits and evaluates energy performanceand occupant satisfaction with the working environ-ment with a view to identifying factors that influenceoccupant experience, in the context of design processand interventions, ongoing building management,and building environmental performance.
The study of the Stockland Head Office is noteworthyfor a number of reasons. The project has been cited fora number of awards, including the 2008 SustainabilityAward of the New South Wales (NSW) AustralianInstitute of Architecture and as the first project in Aus-tralia to achieve the highest 6 Star or World Leaderrating under Green Star – Office Interiors (GreenStar Rating Tools).4 The Green Star Rating focuseson the design potential of the building to deliver interms of environmental performance, and is similarin this respect to tools such as LEED5 in the US andBREEAM6 in the UK. Against this background, thestudy provides crucial information regarding actualperformance ‘in-use’ for the building. In addition, theStockland Head Office comprises the refurbishmentof an existing building from the 1980s and contraststhe approach of developing iconic green buildingswith external expression of their environmentalcontrol systems that is seen in a number of recent pro-jects worldwide. A study of such a development pro-vides insights into what can be achieved within theconstraints of the existing shell of a building in thecentral business district and elicits much needed infor-mation that can guide future green refurbishments.
The post-occupancy methodology adopted includedsite visits, interviews with key stakeholders (includingthe client Stockland Pty Ltd, architects BVN Architec-ture, environmental consultants Arup, the tenant, andbuilding managers at the Stockland Head Office) atthe start and end of the project, a survey of occupantsatisfaction, and a review of the project informationmade available including the independent post-occu-pancy energy rating detailed below.
Occupants were surveyed using the Building UseStudies (BUS)7 survey that has been used to evaluate
Evaluating design strategies, performance and occupant satisfaction
611
Dow
nloa
ded
by [
Uni
vers
ity o
f St
elle
nbos
ch]
at 2
2:36
15
May
201
3
over 350 buildings worldwide and over 75 buildings inAustralia. The BUS survey was originally developed forthe Office Environment Survey (Wilson and Hedge,1987), and adapted for the Post-occupancy Review ofBuildings and their Environment (Probe) project(1995–2002) in the UK.8 The workplace version ofthe survey was selected for its capacity to assess indi-vidual buildings against norms and best practice andto elicit feedback on a range of 63 variables encom-passing overall comfort, temperature, lighting, airmovement and quality, noise, as well as design,image, perceived productivity, and health and work-place needs.
Responses to the variables are sought on a seven-pointscale, with the exception of perceived productivity,which is rated on a nine-point scale. The survey incor-porates three types of scales:
. A-type, where better values are found towards the‘right-hand side’ of the scale, where 1 ¼ worst and7 ¼ best
. B-type, where better values are found towards thecentre of the scale, where 4 ¼ best and
. C-type, where better values are found towards the‘left-hand side’ of the scale, where 1 ¼ best and 7¼ worst
An analysis of survey responses for each variable yieldsa mean value. This may be simply assessed in relationto the selected scale, or compared with the meanvalue from the relevant BUS benchmark data settogether with its upper and lower 95% confidenceintervals.
Two BUS benchmark data sets are referred to in thispaper: Australian and International for 2008. The Aus-tralian benchmark data set comprises 55 Australianbuildings, and the International benchmark data setcomprises 65 buildings drawn from a cross-section ofcountries in America, Europe, Asia, and Australasia,all of which were surveyed before 2008, using theBUS methodology. In addition to office buildings,both data sets include workplaces in a range ofeducational and institutional buildings. The data setsrepresent buildings and tenancies that would performbetter than the norm (Leaman et al., 2007).Approximately 50% of the data sets compriserecently completed buildings designed with a greenor sustainable design intent, while several of theoccupant studies for the conventional buildings inthe data sets are prompted by owners and designers,partly to gauge the impact of positive interventions.Furthermore, it is worth noting that the mean valuesfor the International benchmark data set are generallybetter than mean values for the Australian benchmarkdata set for most variables.
Contrary to the use of indicators such as ‘sick days off’or the efficiency of ‘keyboard strokes’, the BUS surveyelicits occupants’ rating of their perceived productivityand health. This approach overcomes issues of widevariance that arise from the context-specific dependen-cies of today’s diverse workforce and has been arguedto provide an appropriate indicator which is consistentfor all respondents in a building and enables compari-son across buildings (Leaman and Bordass, 1999).
The BUS survey was first administered while theemployees were still at Stockland’s previous accommo-dation at Liverpool Street. A total of 167 employeescompleted the pre-occupancy survey, yielding a responserate of 30% of 540 employees in December 2006. Thesame survey was administered a second time to theemployees 15 months after relocating to the new Stock-land Head Office. This pre- and post-occupancy studyapproach enabled the building to be compared againstthe Australian and International benchmarks, as wellas their previous accommodation.
A total of 238 respondents completed the post-occu-pancy survey (Internet based), hosted in May 2008,yielding a response rate of 40%.9 Although surveyresponse rates as high as 90% can be achieved usinghand-delivered questionnaires, especially in smalltenancies, for large tenancies with over 500 employeessuch as Stockland Head Office the response ratesachieved are typical for Internet-based surveys. Moreimportantly, the survey samples were checked and con-sidered to be a good representation across departmentsand floors as well job description and grade. Inaddition, the ratio of female-to-male respondents inboth surveys was 57:43, which is not substantiallydifferent from the 51:49 ratio for the overall popu-lation employed at Stockland Head Office. A total of63% of respondents of the post-occupancy surveyidentified their previous workplace as LiverpoolStreet. A further 23% stated that that they worked inlocations other than Liverpool Street before movingto the new building, while 14% of respondents failedto specify their previous work location.
The operational energy performance and consequentCO2-equivalent (CO2e) emissions reported here arebased on the official ratings achieved under theNational Australian Built Environmental RatingScheme (NABERS).10
Under the NABERS Energy rating, the actual oper-ational performance of office buildings is benchmarkedby calculating the annual CO2e emissions per unit area(kg CO2e/m2/year) result based on one year’s utilitybills. This approach ensures that the CO2 impact ofdifferent fuel sources such as coal-fired electricity,diesel, natural gas, and any purchased ‘green power’generated from renewable resources is correctlyaccounted for.
Thomas
612
Dow
nloa
ded
by [
Uni
vers
ity o
f St
elle
nbos
ch]
at 2
2:36
15
May
201
3
Ratings are undertaken for tenancy (tenant light andpower), base building (base building air-conditioning,lifts, common area light and power, etc.), and wholebuilding (to include both tenant and base buildingenergy) situations. The ratings are based on the nor-malized CO2 emissions, which account for the specificgreenhouse coefficients for gas and electricity in thestate or territory where the building is located,climate (with Sydney as the reference), and hours ofoperation (Bannister, 2005). In addition to the normal-ized CO2 emissions, the actual energy consumption isreported in MJ/m2/year.
Design process and outcomeThe new corporate headquarters for Stockland, a largeproperty developer in Australia, was envisioned as ashowcase for the group’s office redevelopment capa-bility, while simultaneously creating an engagingworkplace for its employees and a benchmark for sus-tainable office design. The development of the projectwas characterized by strong client commitment forenvironmental design. Clear goals for environmentalperformance were articulated through design targetsfor the highest levels of rating currently achievablethrough the Green Star (as designed and built) andNABERS (monitored performance) protocols preva-lent in Australia.
A critical aspect of the project was the integrated multi-disciplinary approach adopted from the inception ofthe project, which has been noted (Cole et al., 2008;Thomas and Hall, 2004) as being crucial for thesuccess of implementing strategies for sustainability.This included selection of the design team of architects(Bligh Voller Neild) and environmental consultants(Arup) based on their ‘green’ credentials and experi-ence in delivering contemporary work environmentsand a strong focus on employee consultation facilitatedby a workplace consultancy group (DEGW) towardsdeveloping its functional design brief. It is importantto note that the design team worked in close colla-boration with the client group right from buildingselection, design, and documentation to buildingcommissioning.
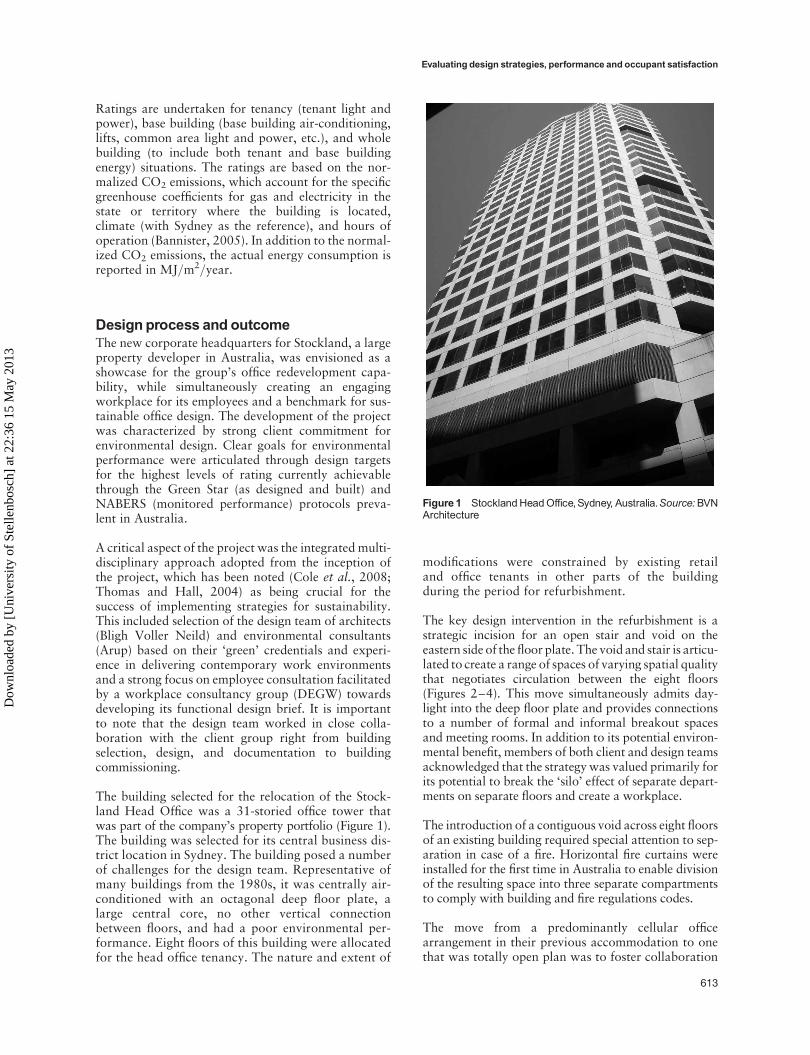
The building selected for the relocation of the Stock-land Head Office was a 31-storied office tower thatwas part of the company’s property portfolio (Figure 1).The building was selected for its central business dis-trict location in Sydney. The building posed a numberof challenges for the design team. Representative ofmany buildings from the 1980s, it was centrally air-conditioned with an octagonal deep floor plate, alarge central core, no other vertical connectionbetween floors, and had a poor environmental per-formance. Eight floors of this building were allocatedfor the head office tenancy. The nature and extent of
modifications were constrained by existing retailand office tenants in other parts of the buildingduring the period for refurbishment.
The key design intervention in the refurbishment is astrategic incision for an open stair and void on theeastern side of the floor plate. The void and stair is articu-lated to create a range of spaces of varying spatial qualitythat negotiates circulation between the eight floors(Figures 2–4). This move simultaneously admits day-light into the deep floor plate and provides connectionsto a number of formal and informal breakout spacesand meeting rooms. In addition to its potential environ-mental benefit, members of both client and design teamsacknowledged that the strategy was valued primarily forits potential to break the ‘silo’ effect of separate depart-ments on separate floors and create a workplace.
The introduction of a contiguous void across eight floorsof an existing building required special attention to sep-aration in case of a fire. Horizontal fire curtains wereinstalled for the first time in Australia to enable divisionof the resulting space into three separate compartmentsto comply with building and fire regulations codes.
The move from a predominantly cellular officearrangement in their previous accommodation to onethat was totally open plan was to foster collaboration
Figure 1 StocklandHeadO⁄ce,Sydney, Australia.Source: BVNArchitecture
Evaluating design strategies, performance and occupant satisfaction
613
Dow
nloa
ded
by [
Uni
vers
ity o
f St
elle
nbos
ch]
at 2
2:36
15
May
201
3

through increased personal interactions. This wascarefully supported during the design and relocationprocess by a number of change management andemployee consultation initiatives through joint effortsof the client and design teams. The integrated, user-responsive approach to design and development wascontinued through to the commissioning and operationstage. In addition to upgrading the Building Manage-ment System (BMS), a system of sub-metering, energymonitoring, and periodic review was implemented toensure the building performed to design targets anduser needs were satisfied.
Client and design team commitment to the environ-mental targets including a 6 Star Green Star – OfficeInteriors v1.1 Certified Rating played a crucial role inthe selection, cost–benefit assessment, and implemen-tation of design options. A total of 80% of potentialbuilding material waste (by weight) generated duringthe tenancy fit-out and refurbishment was recycled orreused. The redevelopment also incorporates a numberof initiatives to maximize the quality of the workenvironment and indoor environmental quality. Thesedesign strategies are discussed below in relation to theenergy performance outcomes and occupant feedback.
Users’perception of the buildingThe data from the BUS survey provide a number ofuseful insights about the building overall and all ofthe 63 individual variables.
The mean value from the survey responses for eachvariable is compared with the scale midpoint andmean value from the BUS benchmark data set togetherwith its upper and lower 95% confidence intervals, andthe scale midpoint. This creates the criteria for thevariables as depicted in Figures 5 and 10 as follows:
. squares represent mean values significantly betteror higher than both benchmark and scale midpoint(a good score)
. circles represent mean values that are not signifi-cantly different from benchmark and scale mid-point (a typical score)
. diamonds represent mean values significantlyworse or lower than benchmark and scale mid-point (a poor score)
The benchmarks and its upper and lower 95% con-fidence interval are represented by three short linesabove the slider scale of each variable. All variablesexcept Perceived Productivity use a 1–7 scale. Per-ceived Productivity is plotted on a –20% to+20% scale. Where mean values are quoted in sub-sequent sections, the standard deviation (SD) andpercentage of dissatisfied11 respondents are alsoreported.
As seen in Figure 5, Stockland Head Office has 11 ofthe 12 main study variables higher or better than the
Figure 2 Zoning in a typical £oor at StocklandHeadO⁄ce.Source: BVNArchitecture
Thomas
614
Dow
nloa
ded
by [
Uni
vers
ity o
f St
elle
nbos
ch]
at 2
2:36
15
May
201
3

Australian benchmark (squares). While the variable fornoise overall is no different from the benchmark(circle), none of the summary variables is worse thanthe benchmark. Details of specific variables withinthe main categories are discussed below.
An overall Summary Index provides an alternate wayof benchmarking building performance in relation toother buildings in the data set. It is derived as theaverage of the Comfort Index and the SatisfactionIndex, where the Comfort Index is the average of thez-scores of the variables for overall comfort, lighting,noise, temperature, and air quality, while the Satisfac-tion Index is the average of the z-scores for design,needs, health, and productivity.
Figures 6 and 7 indicate the Summary Index for build-ings in the Australian and International data sets,
respectively. As seen here, Stockland Head Office(denoted as ‘Stockland’) with a Summary Index of1.32 lies in the top decile of the Australian data set,and in the top quartile of the International data set,and rates significantly better than the previoustenancy at Liverpool Street (denoted as ‘157 Lvpl St’)where the Summary Index was –0.64.
The post-occupancy rating for the Stockland HeadOffice at the top end of the Australian and Inter-national data sets is significant given its size andcentral location within the city. As noted elsewhere(Leaman et al., 2007), most buildings at the top endof the Australian data set tend to be smaller buildingswith a limited number of occupants where carefullyintegrated designs are easier to realize. That studyalso noted that all buildings at the top end of thescale incorporate a number of well-liked features
Figure 3 Section through the void across the eight £oors at StocklandHeadO⁄ce.Source: BVNArchitecture
Evaluating design strategies, performance and occupant satisfaction
615
Dow
nloa
ded
by [
Uni
vers
ity o
f St
elle
nbos
ch]
at 2
2:36
15
May
201
3

which reinforce one another in a virtuous circle.This latter aspect was consistent for Stockland.With positive indices for Comfort (0.98) and Satis-faction (1.67) the tenancy was placed in the 90th
percentile for Comfort and 92nd percentile forSatisfaction in the Australian data set, and 75thfor Comfort and 90th for Satisfaction in the Inter-national benchmark.
Figure 4 View of the formal and informal breakout spaces adjoining the void at StocklandHeadO⁄ce
Figure 5 Summary chart for StocklandHeadO⁄ce ^ Australian benchmark.Source:# Building UseStudies 2008
Thomas
616
Dow
nloa
ded
by [
Uni
vers
ity o
f St
elle
nbos
ch]
at 2
2:36
15
May
201
3

Signi¢cant themes identi¢ed through post-occupancy evaluationIn the subsequent sections, the outcomes for the occu-pants are discussed in relation to relevant aspects ofdesign process, features and interventions, ongoingbuilding management, and building environmentalperformance. A number of interesting insights areapparent.
TemperatureThermal comfort is affected by ambient temperature,humidity, air speed, as well as level of activity andclothing. At the Stockland Head Office, which islocated in a temperate climate, the facilities andcommissioning team have been trialling the use of afloating set point. Based on an adaptive model ofcomfort, the use of the floating set point in sympathywith outdoor conditions has the capacity to reduceenergy used to condition ambient air while still main-taining comfort (McCartney and Nicol, 2002).According to in-house services and facilities person-nel, the set point at the Stockland Head Office wasallowed to vary between 218C and 238C and its
setting is determined by a function of outdoor temp-erature averaged over the preceding six days. It hasa deadband (neutral zone) of +1.58C. If significantcomplaints due to variability are made on a floorplate, then variable air volume (VAV) boxes areover-ridden to 22.58C set point. At the time of thesurvey, about 90% of the VAV boxes operated onthe floating set points on most floors.
The results from the survey provide some usefulinsights. As seen in Figure 5, users rated temperatureoverall in summer and winter above the Australianbenchmarks with mean scores of 4.90 (SD ¼ 1.69,19% dissatisfied) and 4.79 (SD ¼ 1.72, 22% dissatis-fied) on an A-type scale. These results suggest that thefloating set point does not appear to have any significantnegative impact on occupant ratings for satisfactionwith temperature overall in comparison with otherbuildings in the data set. Interestingly, the open-endedcomments indicated more concerns of feeling ‘toocold’ both in winter and in summer. This reflected thesurvey responses where 27% rated 6 or 7 comparedwith 1% rating 1 or 2 on a B-type scale (1 ¼ too hotand 7 ¼ too cold) for winter, and 16% rated 6 or 7compared with 4% rating 1 or 2 for summer. Anumber of employees reported using a coat or jumperto cope with feeling cold across the year, which is notunusual in our experience of many air-conditionedbuildings. In this instance, it appears that the perceptionof low temperatures is not greatly affected by draughtsas only 11% and 6% rated air conditions as ‘draughty’(scores of 6 or 7) in winter and summer, respectively,compared with 25% rating the air being ‘still’ (scoresof 1 or 2) across both seasons.
The sliding range of operational temperatures from19.5–22.58C to 21.5–24.58C as seen here does notpush the boundaries of temperature limits, especiallywith respect to the upper limit, to those seen inpassive buildings. Further investigation, including adetailed analysis of space and outdoor temperature,with concurrent thermal sensation surveys, wouldhave been needed to assess the range of acceptable temp-erature. However, the approach of a variable set pointin sympathy with outdoor conditions as adopted atStockland Head Office should be seen as a first step tobreaking the cycle of constant thermal environment inair-conditioned offices. This approach is particularlysignificant given the energy-saving potential from amodest 18C increase in thermostat setting (Wardet al., 2007; Hoyt et al., 2009) and studies that (Arenset al., 2010) show no perceptible benefits to comfortdespite the increased energy that is needed to providethe alternate standardized conditions.
Ventilation and air qualityThe tenancy integrates a high-efficiency variable airvolume air-conditioning system which aims to
Figure 6 Summary index ^ Australian data set
Figure 7 Summary index ^ International data set
Evaluating design strategies, performance and occupant satisfaction
617
Dow
nloa
ded
by [
Uni
vers
ity o
f St
elle
nbos
ch]
at 2
2:36
15
May
201
3

improve control of air distribution and increase therate at which fresh air is drawn into the space. By pro-viding fresh air at the rate of 15 L/s per person to theoffice workstations, the overall fresh air ventilationrates including the void within the building is one-and-a-half times the minimum requirement (7.5 L/sper person) of Australian Standard AS 1668.2-2002(Standards Australia 2002). In addition, all paints,carpets, and composite wood products in the tenancycomply with the benchmarks for low volatile organiccompound (VOC) content and low formaldehydeemission under the Green Star protocol.
Users rated the air overall above both Australian andInternational benchmarks with mean scores at 4.97(SD ¼ 1.5, 15% dissatisfied) in summer and 4.87 (SD¼ 1.3, 18% dissatisfied) in winter on an A-type scale(Figure 5). This is an improvement from the meanscores at 3.67 (SD ¼ 1.4, 43% dissatisfied) insummer and 3.92 (SD ¼ 1.5, 36% dissatisfied) inwinter seen in the previous accommodation at Liver-pool Street. In addition, the ratings for air freshnessand odourless air across both summer and winterplaced Stockland Head Office in the top 10% of Aus-tralian benchmark buildings, and top 15% of Inter-national benchmark for these variables in comparisonwith ratings in the bottom 30% for Liverpool Street.Clearly, these survey results indicate that the effortsto increase fresh air supply and ensure low VOCmaterial selection have improved occupant satisfactionin terms of overall quality, freshness, and odour.
Lighting and access to viewsA number of strategies were introduced to enhance andmanage daylight. Besides the strategic incision of thefloor plates to create a light well/void, as describedabove, the facade glazing to the void was retrofittedwith high-performance glazing (Tvis ¼ 0.6, SHGC ¼0.38, U ¼ 1.8 W/m2 K) to allow higher levels of day-light while continuing to manage heat gain.12 Theopen-plan office layout also ensures that 60% of work-stations have a direct line of sight to an externaloutlook, and 30% of the workstations were locatedin an area where the daylight factor was greater than2.5%. Energy-efficient triphosphor T5 lighting isinstalled within the tenancy. The system integratesreadily accessible switches and motion detectors toallow the turning off of lights in unoccupied zones.
The original design included provision for daylightlinking for 30 m2 of each of the perimeter zones witha single sensor covering four to five occupants.However, this was disabled during the first year ofoccupancy following complaints from users. It wouldappear that in this situation where a sensor coveredmore than one or two luminaires, there was aninability to cater for local variations – such asinstances where operation of the blinds by one
occupant modified the lighting conditions for theothers. As evident in Figure 2, a substantial area ofthe perimeter zones is devoted to casual meetingareas and meeting rooms. These smaller and flexiblespaces ensure a more equitable access to views anddaylight, beyond occupants seated close to the per-imeter. Electric lighting here can be manually con-trolled when daylight is adequate. In addition, thefluorescent luminaires across the workstations atStockhome are fitted with high-frequency ballasts.These serve to avoid the low-level flicker known tocause eye strain and fatigue (Wilkins, 1993).
The efficacy of the above efforts is borne out by thesurvey results. As seen in Figure 5, the buildingachieved better than the benchmark rating for lightingoverall (mean ¼ 5.66, SD ¼ 1.3, 5% dissatisfied, onan A-type scale). Users were largely satisfied with theadequacy of natural light (mean ¼ 4.32, SD ¼ 0.88,13% dissatisfied, B-type scale, where 1 ¼ too littleand 7 ¼ too much) and artificial light (mean ¼ 4.11,SD ¼ 0.67, 4% dissatisfied, B-type scale). The open-ended comments indicate that occupants were veryhappy with the open feel of the offices with goodaccess to natural light and views. Occupant feedbackalso represented a marked improvement from theirassessment of inadequate natural light (mean ¼ 3.02,SD ¼ 1.5, 44% dissatisfied, B-type scale) in their pre-vious accommodation at Liverpool Street.
While it was not possible to add external shadingdevices to the existing facade without substantialcosts and external building works outside the scopeof an internal refurbishment, glare to the workstationswas designed to be controlled via translucent blindsprovided to all windows. During the year, the facilitiesand commissioning team were proactive in under-standing user needs and constraints. In order to miti-gate glare from the morning sun, the translucentblinds on the east facade were drawn shut by cleanersthe night before. In addition, the western windowswere retrofitted with block-out blinds. On visiting thebuilding, it was possible to observe how users progress-ively drew the blinds down on the west. However,many of the blinds remained closed on the easternfacades even in the afternoons when the sunlight hadceased to fall on those windows. Although furtherinvestigation would be required to ascertain location-specific causes, this reinforces the general indifferenceon the part of occupants to change the status-quounless problems arise (Reinhart and Voss, 2003). Inthe survey, employees commented positively abouttheir ability to operate the installed blinds in order tomanage glare.
Noise, privacy and o⁄ce layoutThe development of green offices over the past decadehas coincided with a large cultural shift: moving from
Thomas
618
Dow
nloa
ded
by [
Uni
vers
ity o
f St
elle
nbos
ch]
at 2
2:36
15
May
201
3

individual offices to open plan. On the one hand, theseallow benefits of collaboration and proximity withwork groups, potential for wider access to daylightand views, and a sense of openness in the workspace.On the other hand, experience across offices showsan increase in concerns with noise from colleagues,unwanted interruptions, and loss of privacy. Whereasother building studies have encountered substantialdissatisfaction when users move from a closed officelayout to one that is more open plan in nature(Vischer, 2007; Thomas and Hall, 2004), it doesappear that the provision of alternate break-outspaces for meetings and quiet rooms has alleviatedconcerns for privacy and interruptions.
The BUS ratings for noise were no different to the Aus-tralian and International benchmarks. Noise overallwas rated at 4.29 (SD ¼ 1.6, 34% dissatisfied) on anA-type scale (Figure 5). Employees commented posi-tively to the manner in which the open plan facilitatedboth formal and informal collaboration. However,these views are tempered by concerns of noise fromneighbouring colleagues and unwanted interruptions,particularly affecting workstations close to the photo-copiers, kitchen areas, and tea-points. During oper-ation, there have been some efforts to manage theseissues through glass screens in some of the open stairareas and the introduction of acoustic treads tocentral stairs. Nevertheless, this experience reinforcesthe need for continued attention to cultural changeprocesses and protocols for office etiquette regardingtelephones and conversations around desks in offices.
Perceived healthThe Stockland Head Office was rated in the 90th per-centile (Figure 8) for perceived health amongst build-ings in the Australian benchmark data set with amean score of 4.51 (SD ¼ 1.4, 16% dissatisfied) onan A-type scale. A number of occupants commentedthat the fresh air, natural light, and high quality ofthe work environment contributed to their well-being, although there were also some perceptions ofillness spreading faster through open-plan offices.Occupants were also appreciative of plants in theoffice areas. As seen in Figure 8, the results are agreat improvement from the pre-occupancy resultsfor Stockland at 157 Liverpool Street, where perceivedhealth was rated significantly lower than both Austra-lian and International benchmarks and in the bottom18th and 12th percentile of Australian and Inter-national benchmark data sets, respectively.
Overall comfort and perceived productivityWhen asked to assess whether their productivityincreased or decreased as a result of the environmentalconditions of the building, the respondents returned anaverage perceived productivity rating of +7.21% on a
nine-point scale of ‘–40% or less’ to ‘ +40% or more’.This is a significant improvement from the mean ratingof –2.39% rating for their previous accommodation.
The strong results for perceived productivity at theStockland Head Office are accompanied by a high sat-isfaction rating for overall comfort (5.63, SD ¼ 1.1,5% dissatisfied) on an A-type scale. The strong corre-lations between perceived productivity and occupantresponses for Stockland Head Office are consistentwith previous research (Leaman et al., 2007) and canbe seen in the scatter plot shown in Figure 9, whichshows a strong and significant relationship (r ¼ 0.80)between variables for Overall Comfort and PerceivedProductivity. The proximity of Stockland HeadOffice to the line of best fit confirms that there are nohidden anomalies or unusual circumstances in theresults.
Personal control and speed of responseResearch has shown that perceived productivity issignificantly associated with perceptions of control in
Figure 8 Perceived heath ^ Australian data set
Figure 9 Perceived productivity and overall comfort ^Australian data set.# Building UseStudies 2008.
Evaluating design strategies, performance and occupant satisfaction
619
Dow
nloa
ded
by [
Uni
vers
ity o
f St
elle
nbos
ch]
at 2
2:36
15
May
201
3

buildings (Heerwagen, 2000). Perceptions of control areinfluenced by actual controls, well-integrated zones,users’ ability to fine-tune environmental conditions,and the speed of response to meeting users’ needs.
The BUS results reveal low levels of perceived controlthat are well below both Australian and Internationalbenchmarks (diamonds, as seen in Figure 10). Forexample, the rating for perceived cooling was 1.53(SD 1.0, 92% indicated 3 or less) on an A-type scale.However, the findings suggest this is not in itself amatter of concern. Firstly, it should be noted thatonly around 40% of respondents rated control asbeing important (Figure 11). Secondly, the StocklandHead Office had a lower percentage of staff (34% ofrespondents) requesting changes to heating, lighting,ventilation or air-conditioning when compared withtheir previous accommodation at 157 LiverpoolStreet (52% of respondents). The new tenancy alsoreturned better results for speed and effectiveness ofresponse with over 63% rating a score of 5 andabove for speed of response and 56% rating a scoreof 5 or above for effectiveness of response. Theseresults for Stockland Head Office corroborate experi-ence in other buildings (Vandenberg and Thomas,2010; Thomas and Baird, 2006; Leaman andBordass, 1999) that the strength of the relationshipbetween perceived control and productivity declinesas the buildings perform better. The positive resultsfor overall comfort and perceived productivity can beattributed to a proactive commitment to fine-tuningthe building, and the inherent user-responsive natureof facilities management.
EnergyA number of energy-efficiency strategies were imple-mented to reduce operational energy. The redevelopmentnature of the project in an existing shell with existing
tenants in other floors placed severe limitations onmajor modifications to the air-conditioning plant.The energy-saving measures and changes to the ‘base’building included installation of variable-speeddrives for ventilation and high-efficiency variable airvolume (VAV) boxes coupled with the floatingset-point trial, and the retrofitting of high-performanceglazing to the tenancy floors described above. Asdiscussed in the section on lighting, energy-efficientlighting is integrated with a control strategy to turn offlights in unoccupied zones to deliver some energysavings, although potential energy savings from daylightlinking to the perimeter zones of the floor have notbeen realized. Additionally, a control strategy to dimlights across all zones has been implemented to ensurespaces are not ‘over-lit’ and the illuminance atworkstations does not exceed 320 lux during the life ofthe lamp.
Floor-by-floor sub-metering and energy audits formedan integral part of ongoing monitoring and manage-ment of energy consumption. A significant aspect ofthe energy-management strategy was the proactiveinvolvement of occupants. These included monthlycompetitions between the eight office floors to switchcomputers off, and campaigns and signage to encou-rage users to power down the photocopiers and turnprinters off.
The results of the monitored performance reflect theefforts that have been made. The Stockland HeadOffice achieved its design target for the highest level(5 Star) of the NABERS Energy Office Tenancyrating with normalized CO2 emissions of 61 kgCO2e/m2/year for the period between 1 October2007 and 30 September 2008. The tenancy ratingincludes energy consumed for light and power, includ-ing air-conditioning of meeting rooms and tenant com-puter server rooms. The 5 Star rating included 187
Figure 10 Perceived control ^ Australian benchmark.V, Means signi¢cantly worse or lower than the benchmark and scale midpoint (apoor score).Source:# BuildingUse Studies 2008
Thomas
620
Dow
nloa
ded
by [
Uni
vers
ity o
f St
elle
nbos
ch]
at 2
2:36
15
May
201
3

MWh of accredited ‘green power’ generated fromrenewable resources for the tenancy’s electricityrequirements that was purchased during the period.The purchased ‘green power’ constitutes 18.75% ofthe tenancy’s actual electricity consumption of 356MJ/m2/year. With 2.5 Stars representing average per-formance under NABERS, the consumption at Stock-land is a 50% reduction on the industry average. ABase Building rating that covers central services andcommon areas of a building was also undertaken.The base building was rated at 4 Stars in 2007 (95 kgCO2e/m2/year with no green power included), whichrepresents a 35% reduction on the industry average.The actual energy consumption of the base building
is 401 MJ/m2/year, comprising 97% electricity and3% natural gas (Figure 12).
Commissioning of a planned tri-generation system hasrecently been completed. A total of 70% of the tenancypower needs and 30% of the total base building powerconsumption will be supplied through electricity gener-ated from an onsite gas turbine which emits lower CO2
emissions in comparison with coal-fired electricity.Additionally, the waste heat will be used for coolingvia an absorption chiller and to generate hot waterfor space heating. This is expected to reduce CO2 emis-sions by a further 20%; results following a year ofoperation are awaited.
While the carbon reduction in terms of operationalenergy as seen here is noteworthy, the predominantemphasis on this aspect in codes and guidelines hasmeant that, in practice, development decisions largelyignore the consequences of embodied carbon arising
Figure12 NormalizedCO2 emissions andNABERS Star Ratingachieved (location: Sydney): (a) tenancy (2007^2008); and (b)base building (2007)
Figure 11 Percentage of respondents rating control asimportant at StocklandHeadO⁄ce
Evaluating design strategies, performance and occupant satisfaction
621
Dow
nloa
ded
by [
Uni
vers
ity o
f St
elle
nbos
ch]
at 2
2:36
15
May
201
3

from the construction process. The cost of embodiedcarbon intensifies further where existing buildings aredemolished and rebuilt before their full design life isover. Although no assessments of embodied energysavings were undertaken as part of this study, thecarbon-reduction impact arising from refurbishmentin comparison with rebuilding is well accepted(Bullen, 2007; Ayaz and Yang, 2009). The refurbish-ment of an existing building as seen here, coupledwith the energy-saving measures described above,ensure a reduction in carbon over the life cycle of thebuilding.
ConclusionsThe evaluation of design strategies, building perform-ance, and user feedback of the Stockland Head Officein Sydney presented here provide a number of lessonsfor future redevelopment projects.
The 5 Star NABERS Energy Tenancy Rating at 61 kgCO2e/m2/year (356 MJ/m2/year; 99 kWh/m2/year)achieved within its first year of occupancy representsa 50% reduction in carbon emissions compared withthe industry average in Australia. The project demon-strates the potential for savings through efficient instal-lation and user-responsive management of lighting andoffice power. While the energy performance reportedhere has been assisted through purchase of greenpower to offset 18.75% of the tenancy’s total electri-city consumption in its first year, the recently commis-sioned tri-generation system is expected to account forthe same level of CO2 reduction on-site in subsequentyears.
The overall Summary Index for occupant satisfactionelicited using the Building Use Studies (BUS) surveyplaced the Stockland head office in the top decile ofthe Australian building data set and top quartile ofthe International data set. The positive survey resultsfor overall comfort, lighting, temperature, and air inconjunction with positive perceptions of health andproductivity corroborate other studies that emphasizethe importance of indoor environmental quality attri-butes in maintaining worker productivity (Wyon,2004; Vischer, 2007; Leaman et al., 2007). The posi-tive feedback from this study highlights the importanceof increased fresh air, daylight, access to views lowvolatile organic compound (VOC) finishes towardsimproving user experience of indoor environmentalquality. Although the experience in this studyremains inconclusive as to the best temperature rangefor floating set-points, the adoption of a variable set-points in sympathy with outdoor temperatures basedon the adaptive model is worthy of further investi-gation. The outcomes for glare and noise managementand daylight linking highlight the potential for a mis-match between design intent and user needs, and
emphasize the importance of quickly redressing pro-blems that occur.
This study confirms the value of user engagement in theongoing management of the building. This aspect wascrucial not only for the facilities personnel to under-stand user needs, but also to enable users to increasetheir understanding of the design intent of buildingand develop a sense of ‘ownership and pride in theirworkplace’ as well as ensuring that the tenancyreached its energy and carbon-reduction targetsthrough their participation.
While some of the success seen here must be attributedto the fact that this tenancy was ‘owner-occupied’, theoutcomes highlight the importance of collaborationbetween owner and occupier in the development andongoing management of buildings in order to realizeenvironmental goals. To this end, mechanisms suchas the Green Leases (Department of Environment andWater Resources (DEWR), 2007), where a tenantlease agreement includes clauses that align the interestsof the building owner/manager and tenants to improvethe environmental performance of the base buildingand occupied space, become more relevant.
From a design and development perspective, the out-comes from this study reinforce the importance ofclient commitment, the establishment of clear environ-mental goals, and an integrated design process thatincludes the owner, developer, design team, and usergroups (Thomas and Hall, 2004). As seen here, redeve-lopment projects require careful planning and stagingover an extended period, particularly where parts ofthe building remain occupied. Furthermore, partialrefurbishments of this nature place constraints on theextent of modifications that can be made to the build-ing structure, facade, and air-conditioning plant.Consequently, a holistic approach that integrates allaspects from the building fabric and plant to internalfit-out and occupation where environmental consider-ations and attributes are ‘designed-in’ at the inceptionof the design process becomes even more crucial for itssuccess. Of particular note is the value of strategicapproaches (such as the light well/internal street withadjoining breakout spaces seen here) that can simul-taneously address multiple objectives for functionality,aesthetics and environmental benefit, and thereby offervalue to the different stakeholders in a project to justifytheir inclusion.
The low-carbon refurbishment for Stockland HeadOffice in Sydney highlights the opportunities to adopta restorative approach (after Birkeland, 2008) forageing building stock. The positive occupant feedbackand energy performance seen in this study demonstratethat it is possible to remodel an existing building toreduce its carbon impact and secure a workplace thatenhances workplace quality.
Thomas
622
Dow
nloa
ded
by [
Uni
vers
ity o
f St
elle
nbos
ch]
at 2
2:36
15
May
201
3

Although there has been some attention to post-occu-pancy evaluations of new ‘green’ buildings, the appli-cation of post-occupancy evaluations to existingbuildings and refurbishments is vital in order tounderstand and apply lessons of what strategieswork well. The contextual analysis of the designprocess, designed attributes, and building manage-ment in tandem with environmental performancemetrics for energy and carbon and the assessment ofoccupant satisfaction allows for a deeper understand-ing of how sustainability can be better achieved infuture buildings. The emphasis on the carbon impactof operational energy in isolation has the potentialto skew development decisions. Further researchinto appropriate metrics and protocols for the assess-ment of embodied energy is needed to enable a bettercharacterization of carbon over the life cycle of thebuilding.
AcknowledgementsThis paper draws on findings from an independentpost-occupancy evaluation undertaken by the authorfor Stockland Pty Ltd, which included use of the BUSquestionnaire under licence. The author wishes toacknowledge the range of stakeholders for the StocklandHead Office project whose support and participationmade this study possible. The author thanks staff atStockland, in particular G. Johnson, D. Rooney,C. Hughes, J. Metske, and J. Zannino, for their generousassistance with the study over its two-year course.Thanks are also due to A. Galvin of BVN Architecture,and H. Schepers of Arup for providing insights into thebuilding’s design and functionality, and to A. Leaman ofBuilding Use Studies for his feedback and support duringthe project.
ReferencesArens, E., Humphreys, M., de Dear, R. and Zhang, H. (2010) Are
‘Class A’ temperature requirements realistic or desirable?Building and Environment, 45(1), 4–10.
Ayaz, E. and Yang, F. (2009) Zero carbon isn’t really zero: whyembodied carbon in materials can’t be ignored. DesignIntel-ligence, September (available at: http://www.di.net/articles/archive/zero_carbon/) (accessed on 8 February 2010).
Bannister, P. (2005) Australian Building Greenhouse Rating(ABGR) Methodology Description, Ref: XA-CR-05, Austra-lian Building Greenhouse Rating (ABGR), Department ofEnergy, Utilities and Sustainability, New South WalesGovernment, Sydney.
Birkeland, J. (2008) Positive Development from Vicious Circlesto Virtuous Cycles through Built Environment Design,Earthscan, London.
Building Research & Information (2001) Special Issue: ‘Post-occupancy Evaluation’. Building Research & Information,29(2), 79–174.
Bullen, P. (2007) Adaptive reuse and sustainability of commercialbuildings. Facilities, 25(1/2), 20–31.
Chappells, H. and Shove, E. (2005) Debating the future ofcomfort: environmental sustainability, energy consumption
and the indoor environment. Building Research & Infor-mation, 33(1), 32–40.
Cole, R.J., Robinson, J., Brown, Z. and O’Shea, M. (2008) Re-contextualizing the notion of comfort. Building Research& Information, 36(4), 323–336.
Davis Langdon (2009) Retrogreening Offices in Australia.Research Report, Davis Langdon (available at: http://www.davislangdon.com/ANZ/Research/Research-Finder/Technical-Reports/Retrogreening-Offices-in-Australia/) (accessed on 1February 2010).
Department of Environment and Water Resources (DEWR)(2007) Energy Efficiency in Government Operations(EEGO) Policy, 2nd edn, Commonwealth of Australia, Can-berra, ACT.
Heerwagen, J. (2000) Green buildings, organizational success,and occupant productivity. Building Research & Infor-mation, 28(5), 353–367.
Hoyt, T., Lee, K.H., Zhang, H., Arens, E. and Webster, T. (2009)Energy Savings from Extended Air Temperature Setpointsand Reductions in Room Air Mixing, Center for the BuiltEnvironment, University of California at Berkeley, Berkeley,CA (available at: http://escholarship.org/uc/item/28x9d7xj).
Leaman, A. and Bordass, W. (1999) Productivity in buildings: the‘killer’ variables. Building Research & Information, 27(1),4–19.
Leaman, A., Thomas, L.E. and Vandenberg, M. (2007) ‘Green’buildings: what Australian users are saying. EcoLibrium(R),6(10), 22–30.
McCartney, K.J. and Nicol, J.F. (2002) Developing an adaptivecontrol algorithm for Europe. Energy and Buildings, 34(6),623–635.
Reinhart, C.F. and Voss, K. (2003) Monitoring manual control ofelectric lighting and blinds. Lighting Research and Technol-ogy, 35(3), 243–258.
Standards Australia (2002) AS 1668.2-2002: The Use of Venti-lation and Air-conditioning in Buildings – VentilationDesign for Indoor Air Contaminant Control, StandardsAustralia International Ltd, Sydney.
Thomas, L. and Baird, G. (2006) Post-occupancy evaluation ofpassive downdraft evaporative cooling and air-conditionedbuildings at Torrent Research Centre, Ahmedabad, India,in S. Shannon, V. Soebarto and T. Williamson (eds): Pro-ceedings of the 40th Annual Conference of the ArchitecturalScience Association (ANZAScA) Adelaide, November 2006.Adelaide: The University of Adelaide and The ArchitecturalScience Association, pp. 97–104.
Thomas, L. and Hall, M.R. (2004) Implementing ESD in archi-tectural practice – an investigation of effective designstrategies and environmental outcomes, in M.H. deWit(ed.): Proceedings of the 21st PLEA (Passive and LowEnergy Architecture) Conference, Technische UniversiteitEindhoven, Eindhoven, the Netherlands, Vol. 1,pp. 415–420.
Vandenberg, M. and Thomas, L. (2010) 40 Albert Road, SouthMelbourne, Australia, in G. Baird (ed.): Sustainable Build-ings in Practice – What the Users Think, Routledge, Abing-don, pp. 223–232.
Vischer, J.C. (2007) The effects of the physical environment onjob performance: towards a theoretical model of workspacestress. Stress and Health, 23(3), 175–184.
Ward, J.K. and White, S.D. (2007) Smart thermostats trial. Part2, demand management, in: Proceedings of the AIRAHPre-Loved Buildings Conference: Continuing the Push, Bris-bane, 17 August 2007. Melbourne, Australian Institute ofRefrigeration Air Conditioning and Heating.
Wilkins, A.J. (1993) Health and efficiency in lighting practice.Energy, 18(2), 123–129.
Wilson, S. and Hedge, A. (1987) The Office Environment Survey:A Study of Building Sickness, Building Use Studies, London.
Wyon, D.P. (2004) The effects of indoor air quality on perform-ance and productivity. Indoor Air, 14(7), 92–101.
Evaluating design strategies, performance and occupant satisfaction
623
Dow
nloa
ded
by [
Uni
vers
ity o
f St
elle
nbos
ch]
at 2
2:36
15
May
201
3

Endnotes1In Australia, a building that achieves the top level of a 5 StarNABERS energy rating (see endnote 3) delivers 58% CO2
reductions in comparison with the industry average of 2.5 Stars.Further CO2 reductions are achievable for buildings that targetincremental improvements over this target and towards zero-carbon emission targets.
2EPLabel (available at: http://www.eplabel.org/) (accessed on 1February 2010).
3National Australian Building Environmental Rating Scheme(NABERS), NABERS Office (available at: http://www.nabers.com.au/office.aspx) (accessed on 1 February 2010).
4Green Star, Green Star Rating Tools (available at: http://www.gbca.org.au/green-star/rating-tools/green-star-rating-tools/953.htm) (accessed on 1 February 2010).
5LEED: The Leadership in Energy and Environmental Design GreenBuilding Rating System (available at: http://www.usgbc.org/DisplayPage.aspx?CategoryID=19) (accessed on 21 February 2010).
6Building Research Establishment Environmental AssessmentMethod (BREEAM) (available at: http://www.breeam.org/)(accessed on 5 February 2010).
7Building Use Studies (available at: http://www.usablebuildings.co.uk) (accessed on 12 February 2010).
8Twenty-three Probe study papers were published in Building Ser-vices Journal between September 1995 and October 2002.
9The response rate for the post-occupancy survey is based on thetotal number of respondents (n ¼ 238) as a percentage of staffpresent during the survey period (n ¼ 595). Of the 622 employ-ees, 27 were away on extended or annual leave and not includedin the count.
10Developed in 1998 as Australian Building Greenhouse Rating(ABGR), the NABERS energy rating system is arguably one ofthe first formal protocols for rating actual energy performanceand CO2-equivalent in the world. It is currently administeredby the New South Wales Department of Environment andClimate Change (DECC) on behalf of commonwealth, state,and territory governments. Although a voluntary system, it isnow quasi-mandatory. For example, the commonwealth andmany state governments mandate a minimum NABERS energyrating for buildings that are leased or owned by these agencies(Department of Environment and Water Resources(DEWR), 2007).
11Percentage dissatisfied as reported in this paper refers to thepercentage of respondents choosing the lower end of the scale.In A-type scales, where 1 is worst and 7 is best, percentagedissatisfied refers to the percentage of respondents choosing1, 2 or 3. For B-type scales, where 4 is best, percentage dissa-tisfied refers to the percentage of respondents choosing 1, 2, 6or 7. For C-type scales, where 1 is best and 7 is worst, percen-tage dissatisfied refers to percentage of respondents choosing 5,6 or 7.
12Tvis ¼ visible transmittance, SHGC ¼ Solar Heat Gain Coeffi-cient and U or U value ¼ overall thermal transmittance.
Thomas
624
Dow
nloa
ded
by [
Uni
vers
ity o
f St
elle
nbos
ch]
at 2
2:36
15
May
201
3