Embed Size (px)
Citation preview
Evaluating client capabilities and business opportunitiesMargaret Dewhurst and Tony Kellett
CHAPTER
6
The learning outcomes from this chapter are to:
n introduce a range of analysis techniques to review the business and itsenvironment;
n understand what is meant by and what is the basis for building a business’ssuccess (competitive advantage);
n illustrate how to use a range of techniques in order to identify strategic optionsfor the business;
n identify the qualitative and quantitative market research techniques that can aiddecision-making.
Learning outcomes
6.1 Preliminary analysis techniques
We need to start by asking why the business organisation or system exists. Whatis its mission or purpose and what are its objectives? We also need to establish howthis business system fits externally – not just in comparison with competitors butin the ‘bigger picture’. Two useful techniques to help set the scene are SWOT andSTEEPLE.
SWOT and STEEPLE
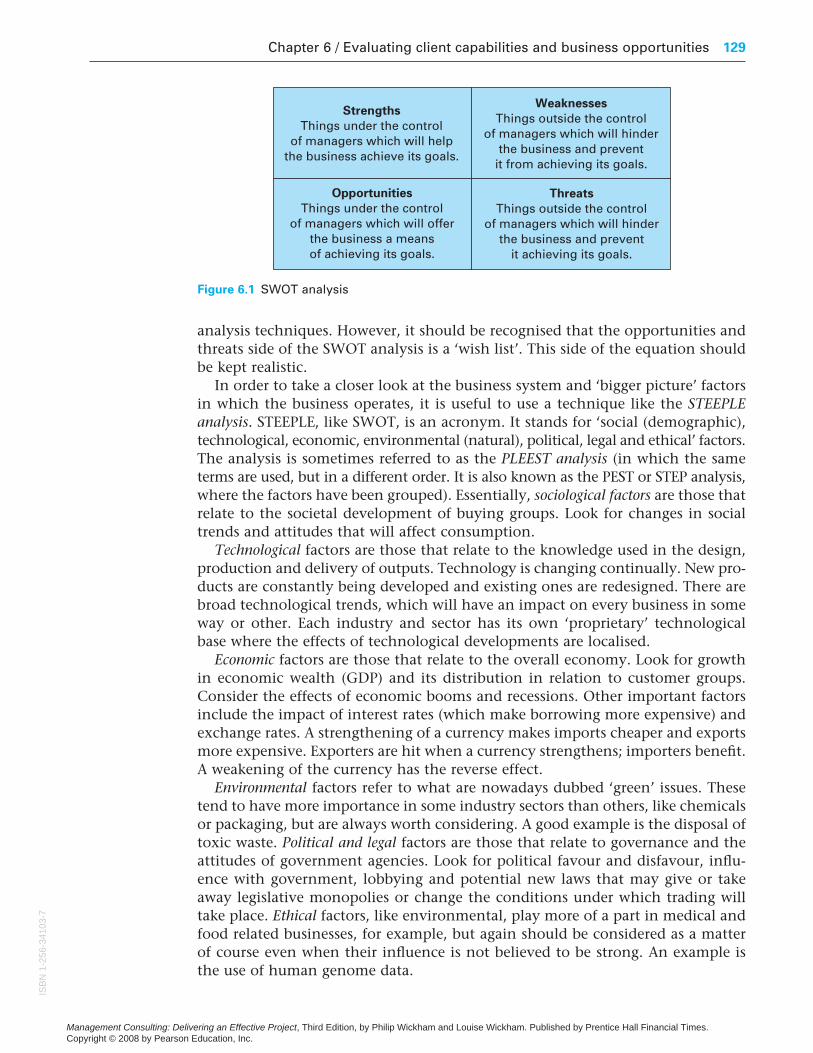
The SWOT analysis is a good, basic technique for getting the analysis started.SWOT is an acronym standing for ‘strengths, weaknesses, opportunities and threats’.The SWOT analysis provides the consultant with a concise and comprehensivesummary of a business. It offers an immediate and accessible insight into thecapabilities of the business and ways in which it might use them. Normally pre-sented as a four-box matrix, typically, a SWOT analysis will identify a broad-basedgroup of strengths and weaknesses coupled with a number of opportunities andthreats (Figure 6.1). The SWOT analysis can be generated through a brainstorm-ing session. It can also be used to keep a summary of features identified by other
ISB
N1-256-34103-7
Management Consulting: Delivering an Effective Project, Third Edition, by Philip Wickham and Louise Wickham. Published by Prentice Hall Financial Times. Copyright © 2008 by Pearson Education, Inc.
Chapter 6 / Evaluating client capabilities and business opportunities 129
analysis techniques. However, it should be recognised that the opportunities andthreats side of the SWOT analysis is a ‘wish list’. This side of the equation shouldbe kept realistic.
In order to take a closer look at the business system and ‘bigger picture’ factorsin which the business operates, it is useful to use a technique like the STEEPLEanalysis. STEEPLE, like SWOT, is an acronym. It stands for ‘social (demographic),technological, economic, environmental (natural), political, legal and ethical’ factors.The analysis is sometimes referred to as the PLEEST analysis (in which the sameterms are used, but in a different order. It is also known as the PEST or STEP analysis,where the factors have been grouped). Essentially, sociological factors are those thatrelate to the societal development of buying groups. Look for changes in socialtrends and attitudes that will affect consumption.
Technological factors are those that relate to the knowledge used in the design,production and delivery of outputs. Technology is changing continually. New pro-ducts are constantly being developed and existing ones are redesigned. There arebroad technological trends, which will have an impact on every business in someway or other. Each industry and sector has its own ‘proprietary’ technologicalbase where the effects of technological developments are localised.
Economic factors are those that relate to the overall economy. Look for growthin economic wealth (GDP) and its distribution in relation to customer groups.Consider the effects of economic booms and recessions. Other important factorsinclude the impact of interest rates (which make borrowing more expensive) andexchange rates. A strengthening of a currency makes imports cheaper and exportsmore expensive. Exporters are hit when a currency strengthens; importers benefit.A weakening of the currency has the reverse effect.
Environmental factors refer to what are nowadays dubbed ‘green’ issues. Thesetend to have more importance in some industry sectors than others, like chemicalsor packaging, but are always worth considering. A good example is the disposal oftoxic waste. Political and legal factors are those that relate to governance and theattitudes of government agencies. Look for political favour and disfavour, influ-ence with government, lobbying and potential new laws that may give or takeaway legislative monopolies or change the conditions under which trading willtake place. Ethical factors, like environmental, play more of a part in medical andfood related businesses, for example, but again should be considered as a matterof course even when their influence is not believed to be strong. An example isthe use of human genome data.
Figure 6.1 SWOT analysis
ISB
N1-
256-
3410
3-7
Management Consulting: Delivering an Effective Project, Third Edition, by Philip Wickham and Louise Wickham. Published by Prentice Hall Financial Times. Copyright © 2008 by Pearson Education, Inc.
130 Part 2 / Project evaluation and analysis
6.2 Strategic capabilities of businesses
There are a number of ways in which business strategy can be defined. At one level,a strategy is simply the consistency of the actions the business takes, the fact thatit sells a particular range of products to a definite customer group. In this respectall businesses have a strategy of sorts. At another level, a strategy is the way inwhich the business will compete and beat its competitors. It is the way in whichit develops an edge in the marketplace. Ultimately a strategy must dictate the way the business behaves, it must become a plan – a ‘recipe for action’ to succeedin the marketplace. A firm’s competitive advantage is the basis on which the per-formance of the business is built. A competitive advantage is something that:
n the firm possesses;
n creates value for its customers;
n in a way is unique; and
n competitors find it difficult to imitate.
A firm can be said to have competitive advantage when it is able to sustain profitsthat exceed the average for the industry. A good place to start the process of identify-ing the source of competitive advantage (if any) is by asking a few key questionsabout the reason for the business’s existence or the business idea. It is valuable todistil the responses to these questions to a key sentence or maximum two for eachquestion:
n What is the need or behaviour in the market that the type of product or servicethe firm is providing satisfies?
n What is the basic (existing) offer out there in the marketplace that satisfies thisneed?
n How does the firm’s offering differ or how is it special in a way that the customervalues?
Analysing the answers to these questions should provide a clear insight into whatthe source of competitive advantage is or might be: remember, it must meet thecriteria listed above.
Porter’s five forces
Michael Porter originally identified three basic types of competitive advantage,namely cost (lower cost advantage), differentiation (delivery of benefits that exceedthose of competing products) and focus (focusing on a particular buying group,segment or product line – servicing a market particularly well). These are knownas positional advantages. There is also a resource-based view that emphasises that a firm utilises its resources and capabilities to create advantage that results insuperior value chain creation (see later). This view suggests that a firm must haveresources and capabilities that are collectively superior to those of its competitors.Examples of the source of such resource-based advantage include: patents andtrademarks, proprietary know-how, installed customer base, reputation of the firmand brand equity. Together these resources and capabilities form the firm’s corecompetencies.
ISB
N1-256-34103-7
Management Consulting: Delivering an Effective Project, Third Edition, by Philip Wickham and Louise Wickham. Published by Prentice Hall Financial Times. Copyright © 2008 by Pearson Education, Inc.
Chapter 6 / Evaluating client capabilities and business opportunities 131
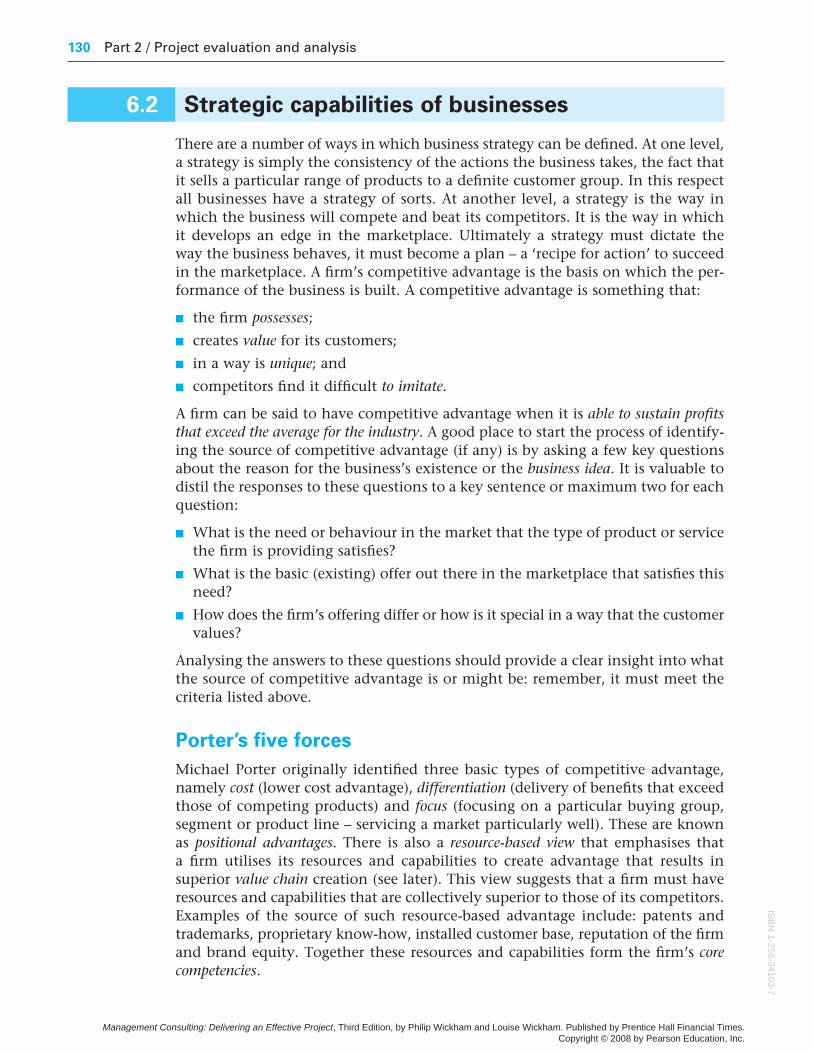
The model for industry analysis – Porter’s five forces – still offers a useful meansfor understanding the industry context in which a company operates and mayhelp suggest how to develop an edge over rivals (see Figure 6.2).
What this model offers is an insight into the drivers of competition:
n Intensity of rivalry among players: influenced by the number of firms, their marketshare and cost bases, switching costs (when a customer can freely move fromone product to another), levels of product differentiation and exit barriers (thecost of abandoning a product).
n Threat of substitutes: price changes in products in other industries affecting theindustry under scrutiny, substitution of one product by another in a differentindustry (one example is the advent of personal digital assistants supplantingdiaries and calculators).
n Buyer power: the impact customers have on an industry. Where there is onebuyer and many suppliers, the buyer has the real power, for example.
n Supplier power: the impact suppliers have on an industry. Where a supplierholds a company to ransom over a critical resource, the supplier exerts real control.
n Barriers to entry: the possibility that new firms may enter the industry also affectscompetition. There may be high barriers to entry if there are considerable costsassociated with entering a market or where the prices are too low to attract newentrants (a deterrent) or where there are patents in place. The government cancreate such barriers through regulation too.
Figure 6.2 Five forces
Source: Adapted with the permission of The Free Press, a Division of Simon & Schuster Adult PublishingGroup, from Competitive Strategy: Techniques for Analyzing Industries and Competitors by Michael E.Porter. Copyright © 1980, 1998 by The Free Press. All rights reserved.
ISB
N1-
256-
3410
3-7
Management Consulting: Delivering an Effective Project, Third Edition, by Philip Wickham and Louise Wickham. Published by Prentice Hall Financial Times. Copyright © 2008 by Pearson Education, Inc.
132 Part 2 / Project evaluation and analysis
The Delta model (and sixth force)
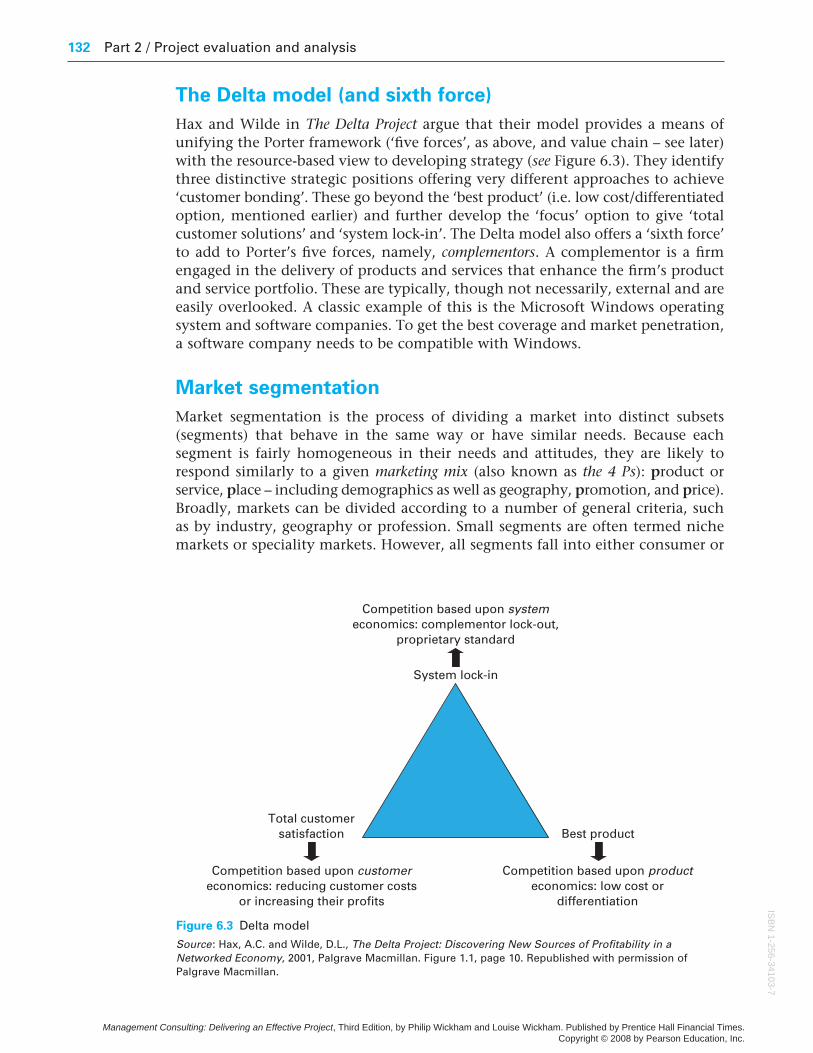
Hax and Wilde in The Delta Project argue that their model provides a means of unifying the Porter framework (‘five forces’, as above, and value chain – see later)with the resource-based view to developing strategy (see Figure 6.3). They identifythree distinctive strategic positions offering very different approaches to achieve‘customer bonding’. These go beyond the ‘best product’ (i.e. low cost/differentiatedoption, mentioned earlier) and further develop the ‘focus’ option to give ‘totalcustomer solutions’ and ‘system lock-in’. The Delta model also offers a ‘sixth force’to add to Porter’s five forces, namely, complementors. A complementor is a firmengaged in the delivery of products and services that enhance the firm’s productand service portfolio. These are typically, though not necessarily, external and areeasily overlooked. A classic example of this is the Microsoft Windows operatingsystem and software companies. To get the best coverage and market penetration,a software company needs to be compatible with Windows.
Market segmentation
Market segmentation is the process of dividing a market into distinct subsets (segments) that behave in the same way or have similar needs. Because each segment is fairly homogeneous in their needs and attitudes, they are likely torespond similarly to a given marketing mix (also known as the 4 Ps): product or service, place – including demographics as well as geography, promotion, and price).Broadly, markets can be divided according to a number of general criteria, such as by industry, geography or profession. Small segments are often termed nichemarkets or speciality markets. However, all segments fall into either consumer or
Figure 6.3 Delta model
Source: Hax, A.C. and Wilde, D.L., The Delta Project: Discovering New Sources of Profitability in aNetworked Economy, 2001, Palgrave Macmillan. Figure 1.1, page 10. Republished with permission ofPalgrave Macmillan.
ISB
N1-256-34103-7
Management Consulting: Delivering an Effective Project, Third Edition, by Philip Wickham and Louise Wickham. Published by Prentice Hall Financial Times. Copyright © 2008 by Pearson Education, Inc.
Chapter 6 / Evaluating client capabilities and business opportunities 133
industrial markets. Although it has similar objectives and it overlaps with consumermarkets in many ways, the process of industrial markets is quite different. Theoverall intent is to identify groups of similar customers and potential customers;to prioritise the groups to address; to understand their behaviour; and to respondwith appropriate marketing strategies that satisfy the different preferences of eachchosen segment.
Successful segmentation requires that segments be:
n Substantial – large and profitable enough.
n Accessible – can be reached efficiently.
n Different – will respond to a different marketing mix.
n Actionable – the firm must have a product for this segment.
n Measureable – the size and purchasing power of the segment can be measured.
There is another way of looking at segmentation – called defining by centre points.This technique looks at segments in a different way, taking an ideal customer as the centre of the hypothesised segment and envisaging segments like a swarm of bees or school of fish with an identifiable centre. The market strategy is thenfocused on that centre with communications and a range of products/servicesdedicated to addressing that ideal customer’s needs and wants, what is known asthe whole product.
6.3 Financial and business performance
The financial situation of a firm is fundamental. The health of a firm’s finances is not just an indication of how successful it has been in the past, it is also an indication of the resources it has available to reward its stakeholders and to investin new projects. In making an evaluation of a business, its performance and itspotential for the future the consultant must be cognisant of its financial situation.Finance and accounting are disciplines in their own right. All that is necessaryhere is to outline the principles of financial analysis and give a flavour of theapproach to analysis that is important to the consultant. Businesses are requiredby law to keep accurate records of their income and expenditure and to produceaccounts. The complexity of the accounts will depend on the business and its legalstatus. They are quite straightforward for a small sole trader; they are extensiveand complex for a publicly quoted multinational.
Whilst accounting practices vary between countries, the principles behind allcompany accounts are the same. There are three fundamental financial documents:the balance sheet, the profit and loss account and the cash flow statement.
The balance sheet
The balance sheet is a statement of what the firm owns (its assets) and what it owes (its liabilities). The balance sheet represents a snapshot in time. It is a state-ment of what is owned and owed at the time the balance sheet is produced.Accounts usually have two balance sheets (or the balance sheet quotes two
ISB
N1-
256-
3410
3-7
Management Consulting: Delivering an Effective Project, Third Edition, by Philip Wickham and Louise Wickham. Published by Prentice Hall Financial Times. Copyright © 2008 by Pearson Education, Inc.
134 Part 2 / Project evaluation and analysis
columns of figures), an opening set and a closing set. The closing set is for the date of the balance sheet, the opening set for an earlier point in time (usually one year before). Comparison between the two gives an indication of the changesin the firm’s assets and liabilities over the period. There are various sorts of assets. They are usually classified in terms of liquidity: that is, how easy it is to convert them to cash should the need arise. Tangible assets are things that have a physical form, such as buildings and machinery. These are normally consideredto be less liquid than any stock stored by the business. Stock is those things thatthe firm normally exists to trade in, or materials that can be converted into stock. The most liquid assets are cash and investments held by the business, aswell as any debts owed to the business. (Care needs to be taken in respect of ‘bad debt’ that cannot be called in.) Assets that could, in principle, be turned intocash within one year are called current assets. Current assets are normally taken to be cash, liquidisable investments, stock and outstanding debts owed to thecompany.
Intangible assets are things which do not have a physical form but which may, potentially, be sold. Important examples are brand names, copyrights andpatents. Liabilities are things to which the firm has access but which (technicallyat least) it owes to outside parties. Liabilities are of two sorts. Short-term liabilitiesare due for settlement within the normal accounting period, usually one year.Long-term liabilities are due for settlement after that. The key liabilities are debtsowed to creditors (suppliers, including employees), interest owed to those whohave lent to the company, outstanding tax owed to the government and dividendsdue to shareholders. As it is the shareholders who actually own a company, theyown the difference between its assets and its liabilities. This difference is includedin the balance sheet as shareholders’ funds. It is included as a liability so that thetwo halves of the balance sheet are equal – so that they actually balance.
The profit and loss account
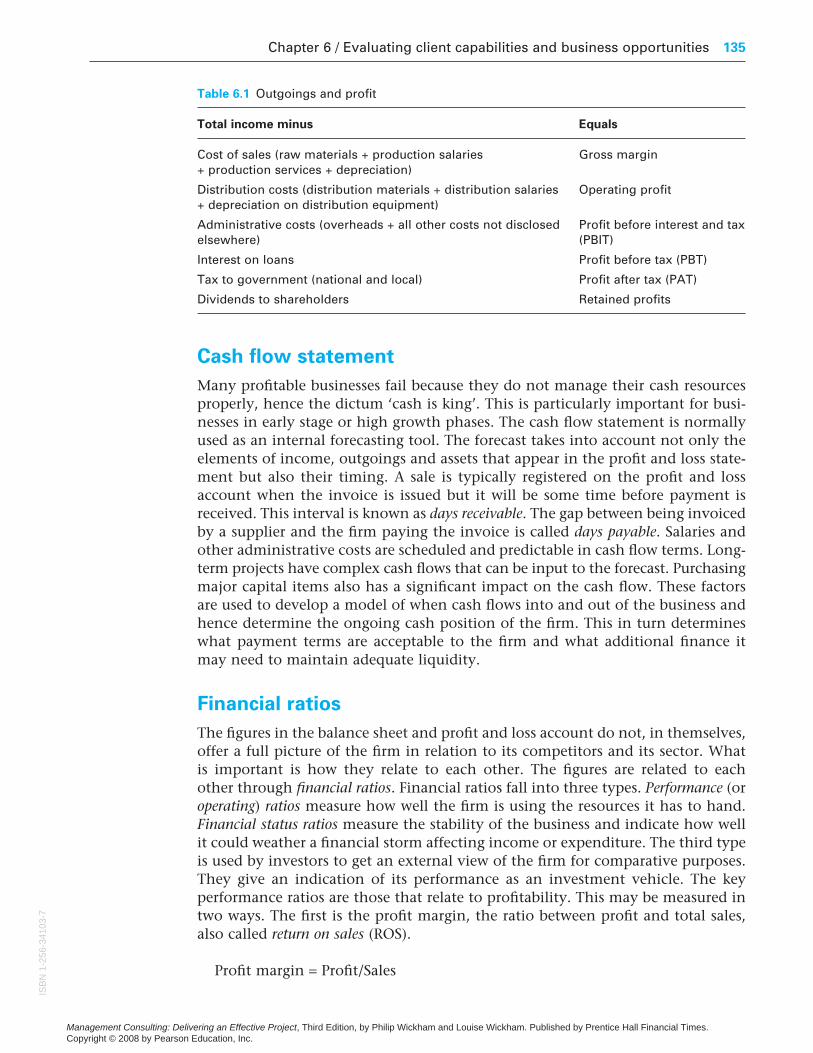
The profit and loss account is a statement of the trading activity of the business over a period, again usually one year. It relates to the balance between the income and outgoings of the business. Income is the revenue gained from normal tradingactivity, that is, sales. Exceptional income from sources that do not represent normal trading activity (for example, investments) will also be included but willbe indicated separately in the accounts. Outgoings are the expenditures on thosethings that are needed to keep the business running. Immediate costs are for rawmaterials, productive equipment and services and salaries of production staff.Together these immediate costs are known as the cost of sales. Costs for administra-tion and central staff are known as overheads. Other expenditure is on paying theinterest on loans, tax to governments and dividends to shareholders. The differencebetween income and expenditure is the profit generated by the business. Differenttypes of profit are quoted after the deduction of different types of outgoings.These are described in Table 6.1.
The different levels of expenditure included in the profit and loss account givean indication of the cost structure of the business. It is common, especially in theUS, to refer to earnings rather than profit. A common version of earnings used forcomparing different types of business is earnings before interest, tax, depreciationand amortisation (abbreviated to EBITDA).
ISB
N1-256-34103-7
Management Consulting: Delivering an Effective Project, Third Edition, by Philip Wickham and Louise Wickham. Published by Prentice Hall Financial Times. Copyright © 2008 by Pearson Education, Inc.
Chapter 6 / Evaluating client capabilities and business opportunities 135
Cash flow statement
Many profitable businesses fail because they do not manage their cash resourcesproperly, hence the dictum ‘cash is king’. This is particularly important for busi-nesses in early stage or high growth phases. The cash flow statement is normallyused as an internal forecasting tool. The forecast takes into account not only theelements of income, outgoings and assets that appear in the profit and loss state-ment but also their timing. A sale is typically registered on the profit and lossaccount when the invoice is issued but it will be some time before payment isreceived. This interval is known as days receivable. The gap between being invoicedby a supplier and the firm paying the invoice is called days payable. Salaries andother administrative costs are scheduled and predictable in cash flow terms. Long-term projects have complex cash flows that can be input to the forecast. Purchasingmajor capital items also has a significant impact on the cash flow. These factorsare used to develop a model of when cash flows into and out of the business andhence determine the ongoing cash position of the firm. This in turn determineswhat payment terms are acceptable to the firm and what additional finance itmay need to maintain adequate liquidity.
Financial ratios
The figures in the balance sheet and profit and loss account do not, in themselves,offer a full picture of the firm in relation to its competitors and its sector. What is important is how they relate to each other. The figures are related to each other through financial ratios. Financial ratios fall into three types. Performance (or operating) ratios measure how well the firm is using the resources it has to hand.Financial status ratios measure the stability of the business and indicate how wellit could weather a financial storm affecting income or expenditure. The third typeis used by investors to get an external view of the firm for comparative purposes.They give an indication of its performance as an investment vehicle. The key performance ratios are those that relate to profitability. This may be measured intwo ways. The first is the profit margin, the ratio between profit and total sales,also called return on sales (ROS).
Profit margin = Profit/Sales
Table 6.1 Outgoings and profit
Total income minus Equals
Cost of sales (raw materials + production salaries Gross margin+ production services + depreciation)
Distribution costs (distribution materials + distribution salaries Operating profit+ depreciation on distribution equipment)
Administrative costs (overheads + all other costs not disclosed Profit before interest and taxelsewhere) (PBIT)
Interest on loans Profit before tax (PBT)
Tax to government (national and local) Profit after tax (PAT)
Dividends to shareholders Retained profits
ISB
N1-
256-
3410
3-7
Management Consulting: Delivering an Effective Project, Third Edition, by Philip Wickham and Louise Wickham. Published by Prentice Hall Financial Times. Copyright © 2008 by Pearson Education, Inc.
136 Part 2 / Project evaluation and analysis
Different profit margins use different profit lines (such as operating, PBT, PAT, asoutlined in Table 6.1).
The most fundamental measure of performance is return on capital. Return oncapital employed (ROCE) gives an indication to managers of the profits they aregenerating for the money they are using. It is defined as:
ROCE = Operating profit/Capital employed
where capital employed is usually defined as total assets minus short-term liabilities.Return on equity (ROE) is of interest to investors. It indicates the way in which
an investment in the firm is generating a yield. It is defined as:
ROE = PAT/Shareholder funds
Two financial stability ratios are particularly important. The debt ratio measuresthe balance between equity capital provided by investors and loan capital pro-vided by lenders. This is defined as:
Debt ratio = (Long-term debt + Short-term debt)/Capital employed
This ratio is important because interest on debt must be paid, whatever the busi-ness’s performance. If the company has a high debt ratio, it may face cash flowproblems and pressure from its debt providers if profits are squeezed.
Interest cover is a measure of how much ‘room’ the profits give to pay off intereston loans. It is defined as:
Interest cover = Operating profit/Interest owed
Two ratios are used to measure the liquidity of the firm. Liquidity is the ability ofthe firm to pay off its debts at short notice. The current ratio measures the extentto which short-term or current assets can be used to pay off short-term liabilities.It is defined as:
Current ratio = Current assets/Current liabilities
The quick ratio is a much tougher test. It is a measure of a company’s ability to payoff its liabilities immediately. The liquid assets are cash, liquidisable investmentsand debt owed to the company (after allowing for bad debts). It is defined as:
Quick ratio = Liquid assets/Current liabilities
The third type of ratios give an indication of how well a firm’s stock (its shares) is performing as an investment opportunity. If a firm is publicly quoted then itsshares will be traded in a market which gives them a price. The price of shares forprivate companies is set by closed transactions.
Shareholders are rewarded in two ways. The first is by means of capital growth,the increase in the underlying value of the company’s share, which enables aprofit to be made when the shares are sold. The second is through income. This isthe flow of dividends paid out of company profits. Each share entitles its owner
ISB
N1-256-34103-7
Management Consulting: Delivering an Effective Project, Third Edition, by Philip Wickham and Louise Wickham. Published by Prentice Hall Financial Times. Copyright © 2008 by Pearson Education, Inc.
Chapter 6 / Evaluating client capabilities and business opportunities 137
to a particular cash dividend. One form of reward can be played off against theother. If the firm’s managers hold back profits (so do not pay dividends), they canuse the money to invest in the firm’s growth (so increasing share capital value).
The main metrics for investors are:
Earnings per share (EPS) = PAT/Number of shares issued
Price/earnings ratio (P/E) = Market price of share/EPS
Market capitalisation = Market value of shares × Number of shares
Dividend cover = EPS/Dividend per share
Dividend yield = Dividend per share/Market price per share
A P/E ratio is a kind of market rating. A high P/E ratio suggests that the marketplaces a high value on a firm even though its current earnings are relatively low.First, the firm may have quite low risks. Second, the market may expect the firm’searnings to grow in the future.
Care should be taken when using ratios. They give absolute indications of abusiness’s performance. They can be revealing. Yet they provide a full picture onlywhen they are compared with other ratios. This comparison may be historical, as a trend in the ratios of a particular firm over time, or cross-sectional, as a com-parison at a particular time of the ratios of a number of firms in the same orrelated sectors.
The Balanced Scorecard
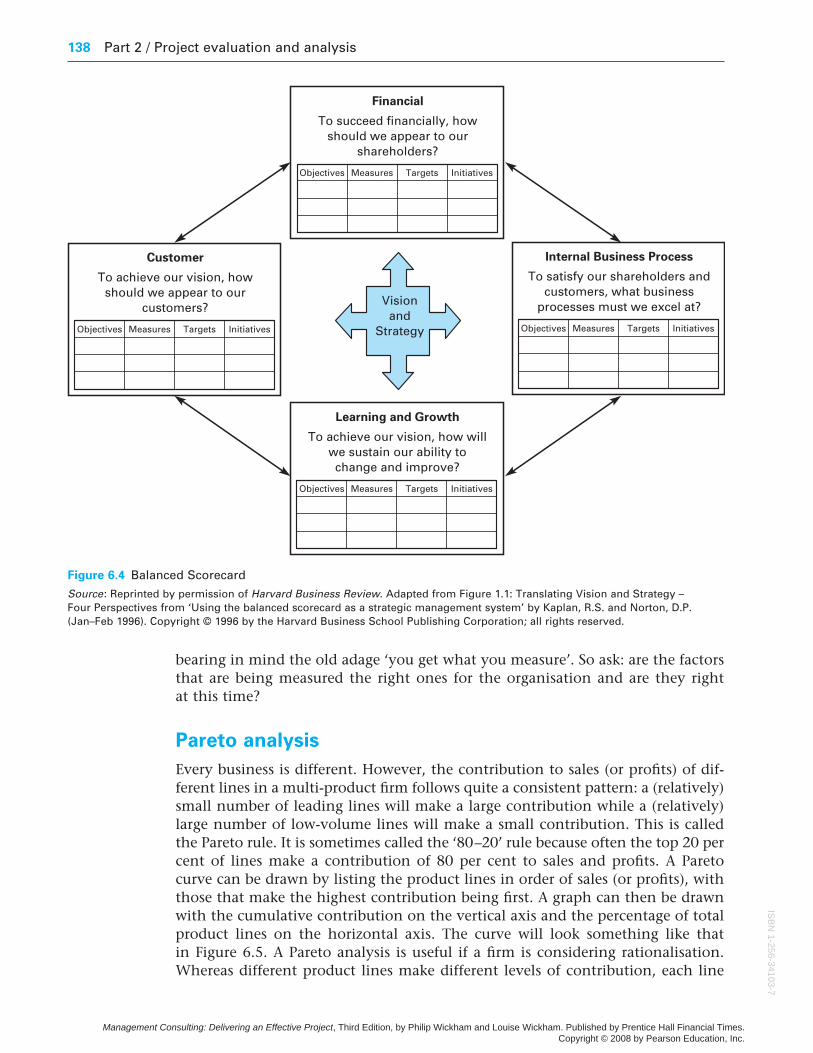
Traditionally, approaches to performance measurement have relied heavily onfinancial accounting measures. Motivated by the belief that this approach wasobsolete, a study sponsored in the early 1990s by the Nolan Norton Institute (partof KPMG) revealed that reliance on summary financial measures was hinderingorganisations’ ability to create future economic value. The outcome of this andsubsequent work is captured in the Balanced Scorecard (see Figure 6.4). The BalancedScorecard is a balanced set of measures and a management system that emphasisesthat financial and non-financial measures must be part of the information systemfor employees at all levels in the organisation. Front-line employees must under-stand the financial consequences of their actions, for example, it argues. Thescorecard is designed to translate a company or business unit’s mission into tangibleobjectives and measures. The ‘balance’ is between outcome or lagging measures(financial) and the drive for future performance or leading measures (driven bythe internal activities that give rise to the financial results). Most scorecards havefour ‘perspectives’ with typical generic measures like:
n Financial: return on investment and economic value-added.
n Customer: satisfaction, retention, market and account share.
n Internal: quality, response time, cost of new product introductions.
n Learning and growth: employee satisfaction and information system availability.
The ‘trick’ with the scorecard is to find and use the most appropriate measures for a firm or organisation for its specific objectives and with its mission in mind.When looking at a firm, it is worth considering what metrics are used and why,
ISB
N1-
256-
3410
3-7
Management Consulting: Delivering an Effective Project, Third Edition, by Philip Wickham and Louise Wickham. Published by Prentice Hall Financial Times. Copyright © 2008 by Pearson Education, Inc.
138 Part 2 / Project evaluation and analysis
bearing in mind the old adage ‘you get what you measure’. So ask: are the factorsthat are being measured the right ones for the organisation and are they right at this time?
Pareto analysis
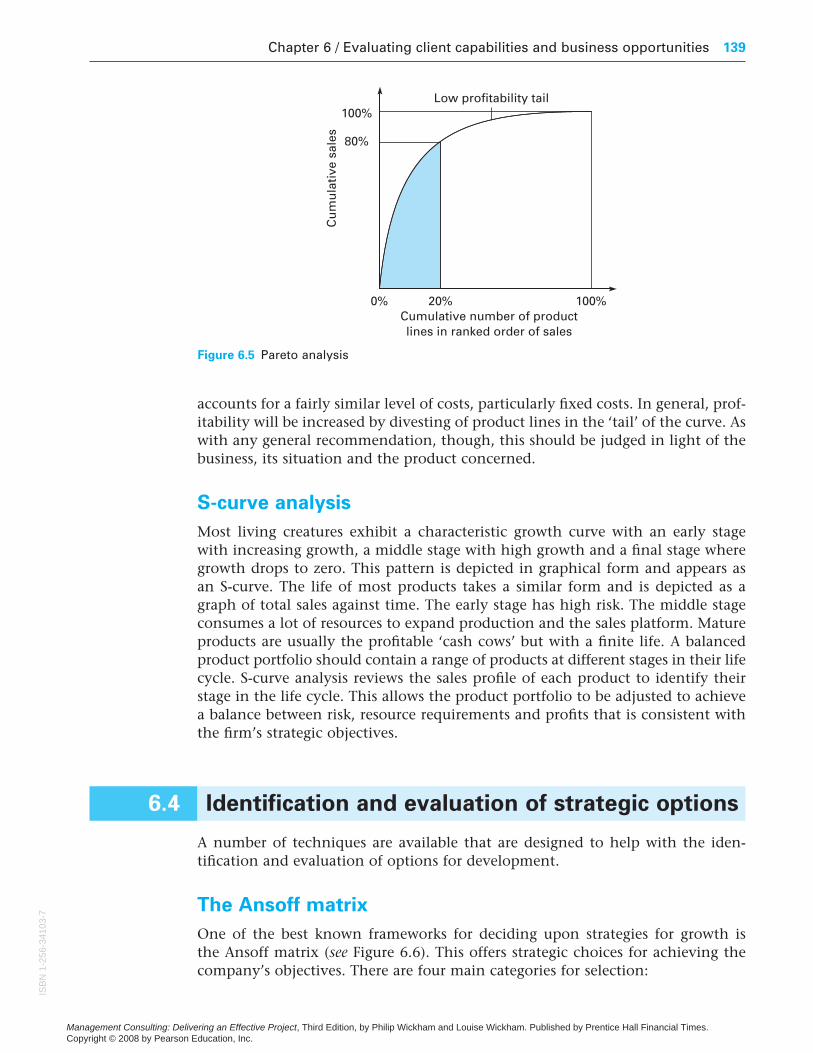
Every business is different. However, the contribution to sales (or profits) of dif-ferent lines in a multi-product firm follows quite a consistent pattern: a (relatively)small number of leading lines will make a large contribution while a (relatively)large number of low-volume lines will make a small contribution. This is calledthe Pareto rule. It is sometimes called the ‘80–20’ rule because often the top 20 percent of lines make a contribution of 80 per cent to sales and profits. A Pareto curve can be drawn by listing the product lines in order of sales (or profits), withthose that make the highest contribution being first. A graph can then be drawnwith the cumulative contribution on the vertical axis and the percentage of totalproduct lines on the horizontal axis. The curve will look something like that in Figure 6.5. A Pareto analysis is useful if a firm is considering rationalisation.Whereas different product lines make different levels of contribution, each line
Figure 6.4 Balanced Scorecard
Source: Reprinted by permission of Harvard Business Review. Adapted from Figure 1.1: Translating Vision and Strategy – Four Perspectives from ‘Using the balanced scorecard as a strategic management system’ by Kaplan, R.S. and Norton, D.P. (Jan–Feb 1996). Copyright © 1996 by the Harvard Business School Publishing Corporation; all rights reserved.
ISB
N1-256-34103-7
Management Consulting: Delivering an Effective Project, Third Edition, by Philip Wickham and Louise Wickham. Published by Prentice Hall Financial Times. Copyright © 2008 by Pearson Education, Inc.
Chapter 6 / Evaluating client capabilities and business opportunities 139
accounts for a fairly similar level of costs, particularly fixed costs. In general, prof-itability will be increased by divesting of product lines in the ‘tail’ of the curve. Aswith any general recommendation, though, this should be judged in light of thebusiness, its situation and the product concerned.
S-curve analysis
Most living creatures exhibit a characteristic growth curve with an early stagewith increasing growth, a middle stage with high growth and a final stage wheregrowth drops to zero. This pattern is depicted in graphical form and appears as an S-curve. The life of most products takes a similar form and is depicted as agraph of total sales against time. The early stage has high risk. The middle stageconsumes a lot of resources to expand production and the sales platform. Matureproducts are usually the profitable ‘cash cows’ but with a finite life. A balancedproduct portfolio should contain a range of products at different stages in their lifecycle. S-curve analysis reviews the sales profile of each product to identify theirstage in the life cycle. This allows the product portfolio to be adjusted to achievea balance between risk, resource requirements and profits that is consistent withthe firm’s strategic objectives.
6.4 Identification and evaluation of strategic options
A number of techniques are available that are designed to help with the iden-tification and evaluation of options for development.
The Ansoff matrix
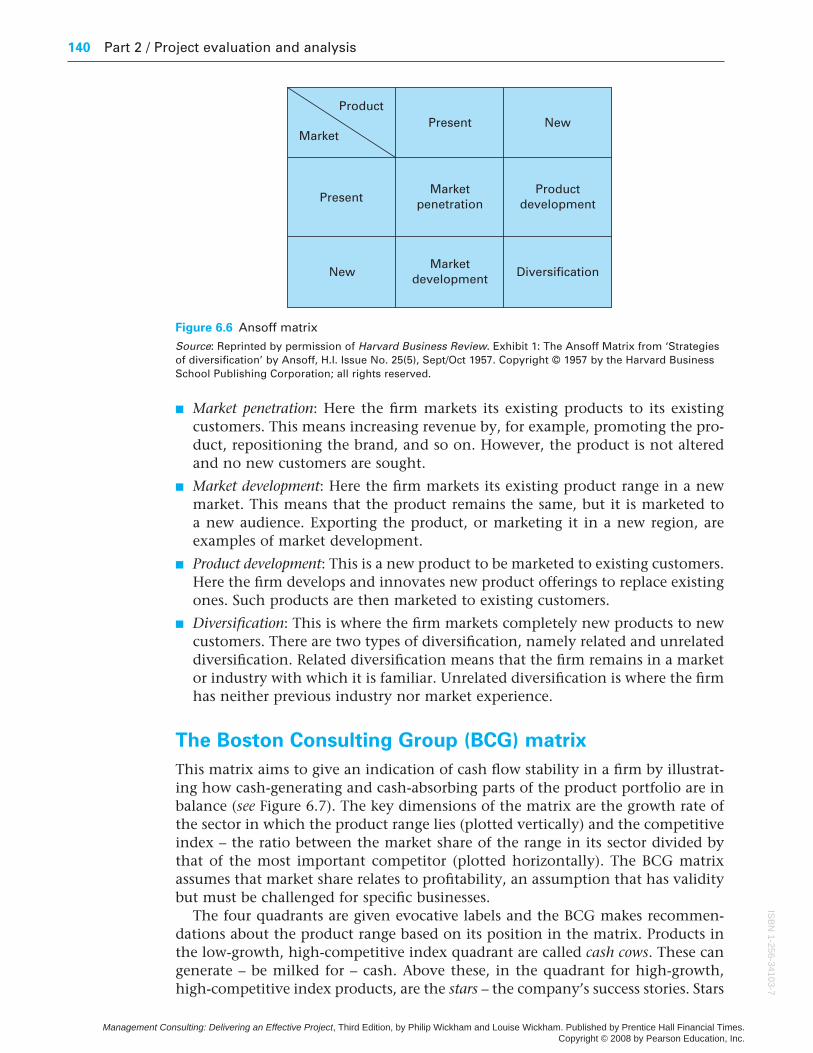
One of the best known frameworks for deciding upon strategies for growth is the Ansoff matrix (see Figure 6.6). This offers strategic choices for achieving thecompany’s objectives. There are four main categories for selection:
Figure 6.5 Pareto analysis
ISB
N1-
256-
3410
3-7
Management Consulting: Delivering an Effective Project, Third Edition, by Philip Wickham and Louise Wickham. Published by Prentice Hall Financial Times. Copyright © 2008 by Pearson Education, Inc.
140 Part 2 / Project evaluation and analysis
n Market penetration: Here the firm markets its existing products to its existingcustomers. This means increasing revenue by, for example, promoting the pro-duct, repositioning the brand, and so on. However, the product is not alteredand no new customers are sought.
n Market development: Here the firm markets its existing product range in a newmarket. This means that the product remains the same, but it is marketed to a new audience. Exporting the product, or marketing it in a new region, areexamples of market development.
n Product development: This is a new product to be marketed to existing customers.Here the firm develops and innovates new product offerings to replace existingones. Such products are then marketed to existing customers.
n Diversification: This is where the firm markets completely new products to newcustomers. There are two types of diversification, namely related and unrelateddiversification. Related diversification means that the firm remains in a marketor industry with which it is familiar. Unrelated diversification is where the firmhas neither previous industry nor market experience.
The Boston Consulting Group (BCG) matrix
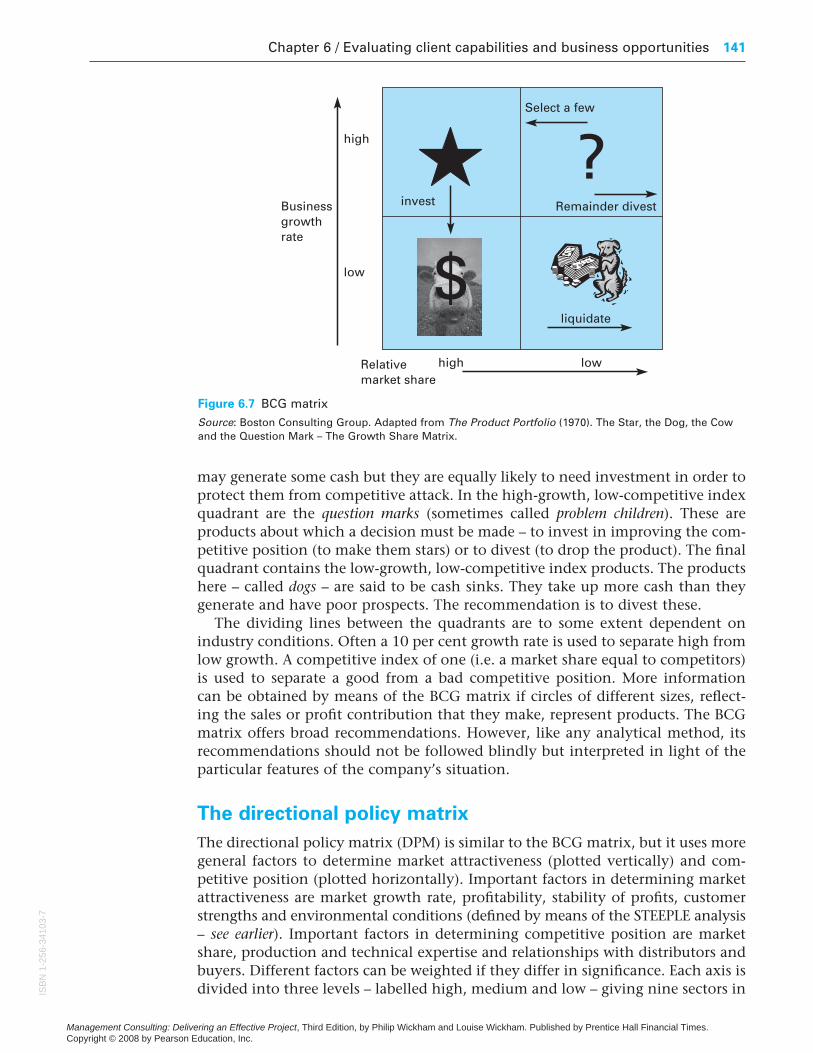
This matrix aims to give an indication of cash flow stability in a firm by illustrat-ing how cash-generating and cash-absorbing parts of the product portfolio are inbalance (see Figure 6.7). The key dimensions of the matrix are the growth rate ofthe sector in which the product range lies (plotted vertically) and the competitiveindex – the ratio between the market share of the range in its sector divided bythat of the most important competitor (plotted horizontally). The BCG matrixassumes that market share relates to profitability, an assumption that has validitybut must be challenged for specific businesses.
The four quadrants are given evocative labels and the BCG makes recommen-dations about the product range based on its position in the matrix. Products in the low-growth, high-competitive index quadrant are called cash cows. These cangenerate – be milked for – cash. Above these, in the quadrant for high-growth,high-competitive index products, are the stars – the company’s success stories. Stars
Figure 6.6 Ansoff matrix
Source: Reprinted by permission of Harvard Business Review. Exhibit 1: The Ansoff Matrix from ‘Strategiesof diversification’ by Ansoff, H.I. Issue No. 25(5), Sept/Oct 1957. Copyright © 1957 by the Harvard BusinessSchool Publishing Corporation; all rights reserved.
ISB
N1-256-34103-7
Management Consulting: Delivering an Effective Project, Third Edition, by Philip Wickham and Louise Wickham. Published by Prentice Hall Financial Times. Copyright © 2008 by Pearson Education, Inc.
Chapter 6 / Evaluating client capabilities and business opportunities 141
may generate some cash but they are equally likely to need investment in order toprotect them from competitive attack. In the high-growth, low-competitive indexquadrant are the question marks (sometimes called problem children). These areproducts about which a decision must be made – to invest in improving the com-petitive position (to make them stars) or to divest (to drop the product). The finalquadrant contains the low-growth, low-competitive index products. The productshere – called dogs – are said to be cash sinks. They take up more cash than theygenerate and have poor prospects. The recommendation is to divest these.
The dividing lines between the quadrants are to some extent dependent onindustry conditions. Often a 10 per cent growth rate is used to separate high fromlow growth. A competitive index of one (i.e. a market share equal to competitors)is used to separate a good from a bad competitive position. More information can be obtained by means of the BCG matrix if circles of different sizes, reflect-ing the sales or profit contribution that they make, represent products. The BCGmatrix offers broad recommendations. However, like any analytical method, itsrecommendations should not be followed blindly but interpreted in light of theparticular features of the company’s situation.
The directional policy matrix
The directional policy matrix (DPM) is similar to the BCG matrix, but it uses moregeneral factors to determine market attractiveness (plotted vertically) and com-petitive position (plotted horizontally). Important factors in determining marketattractiveness are market growth rate, profitability, stability of profits, customerstrengths and environmental conditions (defined by means of the STEEPLE analysis– see earlier). Important factors in determining competitive position are marketshare, production and technical expertise and relationships with distributors andbuyers. Different factors can be weighted if they differ in significance. Each axis isdivided into three levels – labelled high, medium and low – giving nine sectors in
Figure 6.7 BCG matrix
Source: Boston Consulting Group. Adapted from The Product Portfolio (1970). The Star, the Dog, the Cowand the Question Mark – The Growth Share Matrix.
ISB
N1-
256-
3410
3-7
Management Consulting: Delivering an Effective Project, Third Edition, by Philip Wickham and Louise Wickham. Published by Prentice Hall Financial Times. Copyright © 2008 by Pearson Education, Inc.
142 Part 2 / Project evaluation and analysis
total. The DPM enables recommendations to be made on investment and divest-ment on the basis of the position of the product in the matrix. As with the BCGmatrix, the recommendations should not be followed blindly but used to provideinsights in the light of the context of the business.
Value chain
Another very useful concept is that of the value chain (a term coined originally byMichael Porter). The value chain analysis describes the activities the organisationperforms and links them to the organisation’s competitive position. Value chainanalysis describes the activities within and around an organisation and relatesthem to an analysis of the competitive strength of the organisation. It evaluateswhich value each particular activity adds to the organisation’s products or services.This idea was built upon the insight that an organisation is more than a randomcompilation of machinery, equipment, people and money. Only if these thingsare arranged into systems will it become possible to produce something for whichcustomers are willing to pay a price. Porter argues that the ability to perform par-ticular activities and to manage the linkages between these activities is a source ofcompetitive advantage.
Porter distinguishes between primary activities and support activities. Primaryactivities are directly concerned with the creation or delivery of a product or service.They can be grouped into five main areas: inbound logistics, operations, outboundlogistics, marketing and sales, and service. Each of these primary activities is linkedto support activities that help to improve their effectiveness or efficiency. Thereare four main areas of support activities: procurement, technology development(including R&D), human resource management, and infrastructure (systems forplanning, finance, quality, information management etc.). In most industries, it is rather unusual that a single company performs all activities from productdesign, production of components and final assembly to delivery to the final userby itself. Most often, organisations are elements of a value system or supply chain.Hence, value chain analysis should cover the whole value system in which theorganisation operates.
A typical value chain analysis can be performed in the following steps:
n Analysis of own value chain – which costs are related to every single activity?
n Analysis of customers’ value chains – how does our product fit into their valuechain?
n Identification of potential cost advantages in comparison with competitors.
n Identification of potential value added for the customer – how can a product addvalue to the customer’s value chain (e.g. lower costs or higher performance)?Where does the customer see such potential?
6.5 Planning for the future
Rapid change, new technology and increased competition are some of the factorsmaking for unprecedented uncertainty in today’s markets. Planning for the futurehas never been so difficult. One well-documented and well-established approach
ISB
N1-256-34103-7
Management Consulting: Delivering an Effective Project, Third Edition, by Philip Wickham and Louise Wickham. Published by Prentice Hall Financial Times. Copyright © 2008 by Pearson Education, Inc.
Chapter 6 / Evaluating client capabilities and business opportunities 143
to planning for the future is that of scenario planning. A scenario is a story. It is atool for ordering perceptions about alternative future environments in whichtoday’s decisions may play out, described as ‘an outline of future developmentwhich shows the operation of causes’ by the Chambers English Dictionary. Scenarioplanning is an ‘outside-in’ approach to strategic management. A scenario describesa possible future business environment but is not a prediction. It explores theextremes that challenge the existing business model.
Creating a scenario
A scenario should be engaging, interesting, challenging and credible, as well aslogically consistent with the known facts. It is useful to create a set of scenariosdescribing a range of possible futures that are ideally mutually exclusive and collectively exhaustive – no more than four scenarios is the norm. Scenarios can be presented in many different forms, such as in a script or a timeline, or withina discussion. The descriptive scenarios need to be supported by some numericalanalysis, which should test the credibility of each scenario, explore the magnitudeof changes in the environment and evaluate the impact of those changes.
Using scenarios for business planning
The scenarios are then used to challenge existing business models and stimulatenew ideas. They form the basis of a strategic debate that is radically different tothe traditional business planning cycle. Scenario planning creates a flexible planfor the business that is composed of a variety of options. The business moves forward by shifting its weight between these options. This enables the business toadapt its plans to the evolving environment.
Evaluating future plans
The evaluation of future investments, for example new product developments or capital investments, requires financial analysis to review the expected risk andreturns. The core issue is how to compare a real cash outlay today with a potentialreturn in the future. The common method for addressing this problem is to applya discount rate to the future returns using a discounted cash flow (DCF) model.For example, it is proposed that a £100 investment today will produce a return of£150 in the future. A discount factor of 20 per cent per annum is used. If the £150is returned in one year, the DCF is £150 × 80% = £120 and a gain of £20 is pre-dicted. If the £150 is returned in two years, the DCF is £150 × 80% × 80% = £96and a loss of £4 is made.
DCF models are summarised in one of two forms. Net present value (NPV) usesan agreed discount rate. It gives the total of the discounted cash values through-out the life of the investment, as per the gain and loss example given above. Thediscount rate is chosen to reflect the level of risk in the project. A low rate wouldbe appropriate for buying equipment to build a standard product but a high rate would be appropriate for developing a product using new technology. NPVgives an absolute indication of the potential return on an investment. Internalrate of return (IRR) works in a slightly different way. The discount rate is variedto achieve an NPV of zero. The rate that achieves this is the IRR. If a bank account
ISB
N1-
256-
3410
3-7
Management Consulting: Delivering an Effective Project, Third Edition, by Philip Wickham and Louise Wickham. Published by Prentice Hall Financial Times. Copyright © 2008 by Pearson Education, Inc.
144 Part 2 / Project evaluation and analysis
had the IRR as its interest rate then it would be able to generate the same cashflow as the project. IRR is a relative indication of the potential return. It can becompared with the perceived level of risk in the investment to decide whether theinvestment is justified. All DCF models carry a high level of risk and their resultsshould be interpreted with caution.
6.6 Opportunity, innovation and information
As mentioned in Chapter 2, marketing research is the process through whichmanagers discover the nature of the competitive environment in which they areoperating. Managers make decisions about the direction in which their organis-ations are to move. Those decisions relate to the selection of strategic options, theimplementation of plans and the allocation of resources. If those decisions are to be the right ones they must be informed. If the decisions are to be good ones,managers need information. Market research is a discipline that has developed a number of very powerful techniques for evaluating the market context of a business. This gives managers clear insights into the dynamics of the markets inwhich they operate and the behaviour of the customers they serve. These insightsunderpin effective decision-making.
Market research falls into two types. Qualitative research aims to answer questionsabout individual attitudes and orientations. It answers the ‘who?’ ‘why?’ and‘what?’ questions. Quantitative research aims to answer questions about collectionsof individuals. It answers the ‘how much?’ and ‘how many?’ questions. The twoforms of research work together. In combination they can provide a picture of themarket in which the firm operates and flesh out the details of a market opportunity.Qualitative methods define the nature of the opportunity. Quantitative methodsgive an indication of its worth. Market research calls on a variety of sophisticatedtechniques. It is a specialist area, of which few managers have the relevant know-ledge. Supporting managers in developing an insight into market opportunities issomething which consultants are often called on to do.
Market research can be expensive. It is an investment in the business. Like anyinvestment it should be undertaken only if the returns are appropriate. Managersmust consider the nature of the decisions they are facing, the value of the resourcesinvolved and the risks to which they will be exposed and then decide what it will be worth to invest in information that will improve those decisions. A salesrepresentative visiting a prospective customer may dedicate an hour or so research-ing the company by reading the annual report and a few newspaper articles. Abusiness making a major launch of a new consumer brand may spend millions inanalysing market potential, customer buying behaviour and perhaps advertisingeffectiveness. A firm aiming to buy another will undertake an extensive programmeof evaluation – called due diligence – involving commercial, finance and legal spe-cialists in order to be sure of the other company’s fitness and potential.
When the level of expenditure available for market research has been decided,it is important that that investment is used wisely. The objectives of the researchmust be clear. The questions it aims to answer must be made explicit, the righttechniques for answering those questions must be selected, and the appropriategroups of customers must be selected for investigation. Consultants may or may not
ISB
N1-256-34103-7
Management Consulting: Delivering an Effective Project, Third Edition, by Philip Wickham and Louise Wickham. Published by Prentice Hall Financial Times. Copyright © 2008 by Pearson Education, Inc.
Chapter 6 / Evaluating client capabilities and business opportunities 145
themselves be conversant with the details of various market research techniques,though it is certainly useful for them to be able to undertake some of the morestraightforward methods. What they must be able to do, however, is recognisehow market research can illuminate a management issue and be used to supportbetter decision-making. They must be able to help managers formulate their problems so that a cost-effective, informative marketing research exercise can bedevised. The following is intended merely as an overview of market research tech-niques: an indication of the approaches available. It is recommended that shouldstudents be called upon to implement an extensive market research programme,they consult a specialist market research text.
Secondary research
Secondary research uses already published information (as opposed to primaryresearch which is original material gathered directly for the task in hand). Theamount of information in the world relevant to business is vast and it is growing.Already published information, because it has not been undertaken specificallyfor the purpose, varies enormously in its relevance. But it is of low cost and it can be very informative. It should always be the first source consulted by theresearcher. Some of the most valuable sources are as follows.
The Internet
The first port of call is the Internet. In addition to individual company websitesand sectoral reports, there are a number of good sources of business informationthat are either free or available by subscription. Examples include:
ft.com – general business information;
hoovers.com – worldwide company information, concentrating on larger organisations;
reuters.com – the well-known news service;
dnb.com – information on every registered company worldwide;
hemscott.net – information on UK publicly quoted companies.
Market sector reports
A number of companies routinely publish reports on market sectors. Mintel andKeynote in the UK cover important areas of consumer spending. Euromonitor and Datamonitor look at developments in European and worldwide markets. Inaddition there are a number of ad hoc reports on specific sectors. Many of theseare held by the British Library and can be accessed through listings in a good business library.
Company annual reports and websites
Company annual reports and reviews serve a specific and legally defined func-tion, primarily for publicly quoted companies. They must inform investors of the financial state of the business through the balance sheet and profit and lossaccount. However, most annual reports go beyond just fulfilling this basic function.
ISB
N1-
256-
3410
3-7
Management Consulting: Delivering an Effective Project, Third Edition, by Philip Wickham and Louise Wickham. Published by Prentice Hall Financial Times. Copyright © 2008 by Pearson Education, Inc.
146 Part 2 / Project evaluation and analysis
They are exercises in public relations, promoting the company as a whole to allits stakeholders. The chairman’s statement gives an indication of the prospects for the sector. In these company documents and especially on the website theremay be information on political, technological and social developments in thebusiness’s spheres of operation. They may also provide an insight into those areaswhere the business is investing in the future. Much information relevant to asmall business client will be gleaned through a detailed and insightful reading ofthe information sources of some of the large players in its sector.
Newspaper articles
Quality newspapers regularly feature articles that are of relevance to a consult-ing project. The Financial Times not only covers ongoing events in the world ofbusiness, but it also includes regular surveys dedicated to specific business areas,topical issues and geographic regions. The Economist (a weekly newspaper with a magazine format) provides a good, succinct and accessible guide to what isgoing on in the world of international politics, finance and business. This also hasregular business and geographical surveys. Profiles of publicly traded companiescan be found in the Investors Chronicle along with commentary on general develop-ments in the world’s stock markets. Most consultants read these publications regularly. Many keep a cuttings file on topics of interest. Business libraries keepback copies and have key word indexes.
6.7 Qualitative methods for evaluating opportunities
Markets are made up of individual decision-makers. The dynamics of a marketmust be understood in terms of both the influences on individual decision-making and the way individuals aggregate to generate overall demand. A numberof techniques are available to explore the nature of individual needs, buying andproduct selection.
Depth interviews
Depth interviews are one-to-one interviews in which the investigator gets thepotential customer to explain how he or she makes buying decisions. The interviewmay be partially structured but the investigator will keep open the option of explor-ing interesting avenues as they are revealed. Examples of products and other stimulus materials might be used to encourage the discussion. This is usually doneface to face but occasionally is conducted by telephone, although the latter methodis limiting in terms of the time and the type of questions that can be asked.
Focus group discussions
Focus group discussions involve a small group of potential customers (usuallyabout four to seven people) who are invited to explore their views on a productcategory. The session will usually last between two and three hours. A facilitator
ISB
N1-256-34103-7
Management Consulting: Delivering an Effective Project, Third Edition, by Philip Wickham and Louise Wickham. Published by Prentice Hall Financial Times. Copyright © 2008 by Pearson Education, Inc.
Chapter 6 / Evaluating client capabilities and business opportunities 147
who will be responsible for interpreting the findings afterwards leads the discussion.Again, product examples and stimulus materials may be used.
Product placements
With product placement the customer is exposed to the product in a normalusage situation before being questioned via one of the above techniques. Thistechnique can give an insightful picture of the customer’s reaction to the producton which to base further development and promotion. It does, however, demandthat a product, or a prototype, be available. This can prove to be expensive andmay present security issues if the product is in a development stage. Each of thesetechniques has its strengths and weaknesses. They may be used in combinationto give a full picture of the buying behaviour of potential customers. Often a smallnumber of flexible but relatively expensive techniques (e.g. depth interviews,focus groups) will be used to establish broad issues which can then be explored inmore depth using quantitative methods as described below.
6.8 Quantitative methods for evaluating opportunities
Once the character of the individual buying process has been established, the researcher must move on and establish how buyers as a group present an opportunity to a particular business. This calls for quantitative techniques: themost important are as follows.
Postal or email surveys
A representative sample of customers is mailed or emailed a questionnaire. Thiswill include questions relating to what products they buy, from what suppliers,how often they buy, how much they use and how frequently they use them. Thisis often the cheapest cost in total, but as response rates are often low, it might notbe the most cost effective in the long run.
Omnibus surveys
In omnibus surveys, a representative sample is asked similar questions to thoseused in the postal survey. As speed is of the essence, the telephone is the usualmeans of communication, although increasingly electronic means are used ifappropriate to the target audience. There may be more potential to open up newlines of enquiry here than in the postal survey. However, consumers may nothave time to reflect on their consumption (as they will have with a postal survey)and a follow-up call may be needed.
In-hall or on-street testing
This is a familiar method, whereby respondents are recruited on the street andinterviewed directly or are asked to attend a short session in a local building. Despite
ISB
N1-
256-
3410
3-7
Management Consulting: Delivering an Effective Project, Third Edition, by Philip Wickham and Louise Wickham. Published by Prentice Hall Financial Times. Copyright © 2008 by Pearson Education, Inc.
148 Part 2 / Project evaluation and analysis
costing more than postal or telephone surveys, you do have the advantage of beingable to ask different questions as respondents can see the new product or otherstimulus material. This technique is used for consumer products in particular.
Distributor or retail audits
Distributor or retail audits are a particularly important source of information onmarkets, their structure, size and growth. The technique used requires a representa-tive sample of distributors (who may be wholesalers or retailers) to keep a recordof their purchases and sales. This information, which can nowadays be kept electronically, can be supplemented by direct outlet audits. A distributor auditallows a market to be broken down in a number of ways. The overall market can berepresented as the product of rate of sale (the number of units a typical distributorsells) and distribution (the proportion of distributors selling the stock). Otherinformation includes stock holding (the amount of a product a typical distributorholds) and forward stocking (the amount on display to the buyer). Information ofthis type allows the business to make subtle decisions about its distribution strategyand how to manage its relationship with distributors. A meaningful distributoraudit is likely to be time consuming and expensive. A number of companies offerstore audits on a commercial basis, the leading two being A.C. Nielsen andInformation Resources.
Team
discussion
points
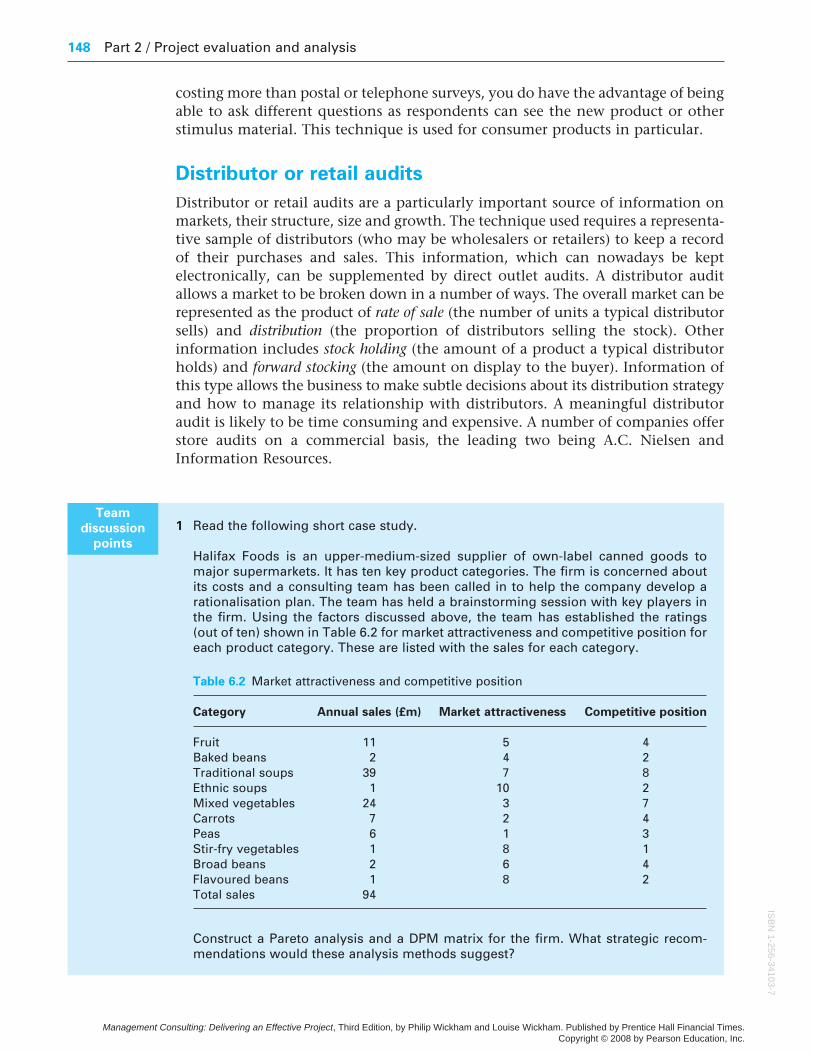
1 Read the following short case study.
Halifax Foods is an upper-medium-sized supplier of own-label canned goods tomajor supermarkets. It has ten key product categories. The firm is concerned aboutits costs and a consulting team has been called in to help the company develop arationalisation plan. The team has held a brainstorming session with key players inthe firm. Using the factors discussed above, the team has established the ratings(out of ten) shown in Table 6.2 for market attractiveness and competitive position foreach product category. These are listed with the sales for each category.
Table 6.2 Market attractiveness and competitive position
Category Annual sales (£m) Market attractiveness Competitive position
Fruit 11 5 4Baked beans 2 4 2Traditional soups 39 7 8Ethnic soups 1 10 2Mixed vegetables 24 3 7Carrots 7 2 4Peas 6 1 3Stir-fry vegetables 1 8 1Broad beans 2 6 4Flavoured beans 1 8 2Total sales 94
Construct a Pareto analysis and a DPM matrix for the firm. What strategic recom-mendations would these analysis methods suggest?
ISB
N1-256-34103-7
Management Consulting: Delivering an Effective Project, Third Edition, by Philip Wickham and Louise Wickham. Published by Prentice Hall Financial Times. Copyright © 2008 by Pearson Education, Inc.
Chapter 6 / Evaluating client capabilities and business opportunities 149
u Summary of key ideas
A number of techniques are available to the consultant to aid analysis of a businessand its environment. An evaluation might include the following:
n A simple summary of the business’s capabilities and the environment in whichit operates.
n A review of the business’s source of competitive advantage and the environmentin which it operates.
n An evaluation of the firm’s performance and product performance.
n Identification and evaluation of strategic options.
n Planning for the future.
n An assessment of markets and their segmentation.
n The use of market research techniques both qualitative and quantitative.
Key reading
Coyle, G. (2004) Practical Strategy: Structured Tools and Techniques. Harlow, Essex: FTPrentice Hall.
Housden, M. (2006) Marketing Research and Information (CIM Coursebook 06/07). Oxford:Butterworth-Heineman.
Further reading
Ansoff, I.H. (1957) ‘Strategies of diversification’, Harvard Business Review, September–October, 25 (5).
Bryman, A. and Bell, E. (2003) Business Research Methods. Oxford: Oxford University Press.Hax, A.C. and Wilde, D.L. (2001) The Delta Project: Discovering New Sources of Profitabil-
ity in a Networked Economy. Basingstoke, Hampshire: Palgrave Macmillan.Heijden, K. van der (2004) Scenarios: The Art of Strategic Conversation. Chichester, West
Sussex: John Wiley & Sons.Kaplan, R.S. and Norton, D.P. (1996) The Balanced Scorecard: Translating Strategy into
Action. Boston, MA: Harvard Business School Press.Kaplan, R.S. and Norton, D.P. (1996) ‘Using the balanced scorecard as a strategic man-
agement system’, Harvard Business Review, January–February, 75–85.Porter, M.E. (2004) Competitive Strategy – Techniques for Analyzing Industries and Com-
petitors. New York: Free Press.
2 Consider the decision you made to undertake your course in management consult-ing. What market research methods would you adopt to evaluate the interests ofyour colleagues in such a course within your institution? How would you measurethe overall demand for such a course? How would you investigate ways in which thecourse might be modified to make it more attractive in the future?
Discuss your ideas in a group.
ISB
N1-
256-
3410
3-7
Management Consulting: Delivering an Effective Project, Third Edition, by Philip Wickham and Louise Wickham. Published by Prentice Hall Financial Times. Copyright © 2008 by Pearson Education, Inc.
150 Part 2 / Project evaluation and analysis
Porter, M.E. (2004) Competitive Advantage – Creating and Sustaining Superior Performance.New York: Free Press.
Wilson, A. (2006) Marketing Research: An Integrated Approach. Harlow, Essex: FT PrenticeHall.
DQS is a large Asian display manufacturer that has astrong position in the declining market for cathoderay tubes (CRT) for televisions. It has developed agood position in supplying LCD panels, up to 21 inchdiagonal, for use in laptop computers and computermonitors. The majority of their sales are to EuropeanOriginal Equipment Manufacturers (OEM) for build-ing into complete products. A small proportion ofoutput is sold as finished products using the company’sown brand names.
The company’s CEO, John Shih, sees the future forthe company’s television business as being in largeflat-panel products of at least 40 inch diagonal. Hehas a dilemma because the established technology in the large flat TV sector is plasma display panelsalthough LCD TVs are starting to make inroads. Theinvestment in building a new production line forlarge panels of any type is several billion pounds. Hecan only afford one and the choice has to be right.
John has worked in the US and has used con-sultants before. He calls you and asks you to look atthe following questions:
n What is the consumer perspective on the twoalternative technical solutions?
Case exercise
DQS
n What is the market size and expected growth?
n What are the market drivers?
n What sizes of TV should DQS build?
n What performance is required?
n What is a reasonable target market share and howdoes this split between own-brand and OEM?
n What price does DQS need to sell at to establish asustainable competitive position?
n Can DQS achieve a return on investment that isacceptable to its board and investors?
Q1 What analysis techniques would you useand why?
Q2 What would a SWOT analysis covering DQS’sentry into the large flat panel televisionmarket tell John?
Q3 What market research material would berequired to support the choice of technologyand define the product specification?
ISB
N1-256-34103-7
Management Consulting: Delivering an Effective Project, Third Edition, by Philip Wickham and Louise Wickham. Published by Prentice Hall Financial Times. Copyright © 2008 by Pearson Education, Inc.