Embed Size (px)
Citation preview
European UnionEuropean Union&&
EnvironmentEnvironment

IntroductionIntroduction
Optimistic OutlookOptimistic Outlook -> Emissions of toxic substances -> Emissions of toxic substances
declineddeclined -> Dangerous pesticides and -> Dangerous pesticides and
chemicals – banned or restrictedchemicals – banned or restricted -> Rates of recycling are up-> Rates of recycling are up -> Environment in EU - protection-> Environment in EU - protection
Only a few problems solvedOnly a few problems solved -> Problems of the future – much -> Problems of the future – much
harder comprehended and brought harder comprehended and brought under controlunder control
-> Individuals – do not understand -> Individuals – do not understand the consequences of their actionsthe consequences of their actions

Protecting the WaterProtecting the Water
UE Goal – cleaning all waters by theUE Goal – cleaning all waters by the
end of 2010end of 2010
7000 million 7000 million € - regions with less € - regions with less
than 75% average incomethan 75% average income
Portugal – from 60% (1995) to 95% Portugal – from 60% (1995) to 95%
(2005)(2005)
Ireland – from 20% (1990) to 80% Ireland – from 20% (1990) to 80%
(2005)(2005)

Protection of the LifeProtection of the Life
-> Industrial Development – threat-> Industrial Development – threat
-> Biodiversity - decrease-> Biodiversity - decrease
-> Natura 2000 program – completed -> Natura 2000 program – completed in 2005 in 2005
-> Protection vs Development-> Protection vs Development
-> EU supports environmental -> EU supports environmental projects -> 60 million projects -> 60 million € - elephant € - elephant and jungle conservationand jungle conservation

Protection of other areasProtection of other areas
Protection of ForestsProtection of Forests ->-> 127,8 million ha in EU 127,8 million ha in EU
->-> Increase of 10% from 1960 to Increase of 10% from 1960 to 19901990
->-> 1995 – 2000 – 650.000 ha 1995 – 2000 – 650.000 ha createdcreated
->-> 130.000 ha – rehabilitated 130.000 ha – rehabilitated
-> 50 million -> 50 million € - tropical forests€ - tropical forests
Protection of AirProtection of Air -> Problems : depletion of -> Problems : depletion of
stratospheric Ostratospheric O33, controlling , controlling acidification and climate change. acidification and climate change.
-> Greenhouse gas effect -> -> Greenhouse gas effect -> attempted to be reduce every yearattempted to be reduce every year
-> 60% areas from EU – suffer from -> 60% areas from EU – suffer from acidificationacidification
-> Balance between rail, road, air -> Balance between rail, road, air and shipping.and shipping.
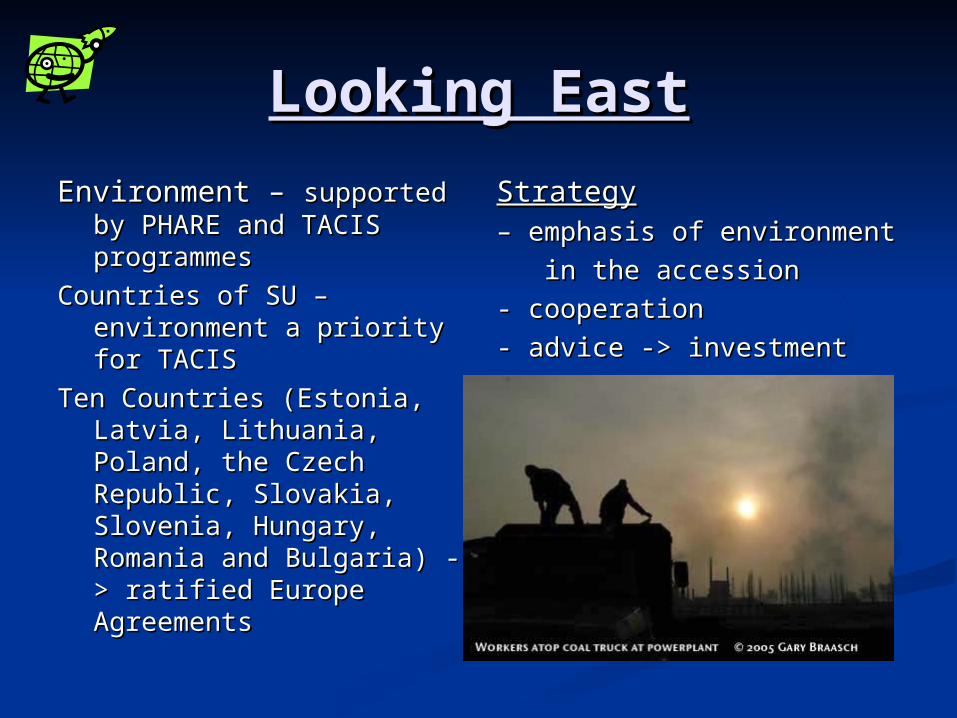
Looking EastLooking East
Environment – Environment – supported by supported by PHARE and TACIS programmesPHARE and TACIS programmes
Countries of SU – environment a Countries of SU – environment a priority for TACISpriority for TACIS
Ten Countries (Estonia, Latvia, Ten Countries (Estonia, Latvia, Lithuania, Poland, the Czech Lithuania, Poland, the Czech Republic, Slovakia, Slovenia, Republic, Slovakia, Slovenia, Hungary, Romania and Bulgaria) Hungary, Romania and Bulgaria) -> ratified Europe Agreements-> ratified Europe Agreements
StrategyStrategy – – emphasis of environment emphasis of environment
in the accessionin the accession
- cooperation- cooperation
- advice -> investment- advice -> investment

Then and NowThen and Now While the effect of human While the effect of human
activity on the global climate activity on the global climate is hotly debated, physical is hotly debated, physical signs of environmental signs of environmental change are all around us. change are all around us.
Some scientists say an Some scientists say an increase in the rate of increase in the rate of melting of the world's melting of the world's glaciers is evidence of global glaciers is evidence of global warming. warming.
Argentina's Upsala Glacier Argentina's Upsala Glacier was once the biggest in South was once the biggest in South America, but it is now America, but it is now disappearing at a rate of 200 disappearing at a rate of 200 meters per year. meters per year.
Other scientists say its Other scientists say its reduction is due to reduction is due to complicated shifts in glacial complicated shifts in glacial dynamics and local geology.dynamics and local geology.

Then and NowThen and Now Rising tidesRising tides Some scientists predict Some scientists predict
that a warmer climate will that a warmer climate will trigger more violent trigger more violent storms, which will cause storms, which will cause increased rates of coastal increased rates of coastal erosion. erosion.
This is a section of This is a section of shoreline at Cape Hatteras shoreline at Cape Hatteras in North Carolina in the in North Carolina in the USA, pictured in 1999 and USA, pictured in 1999 and 2004. The southern United 2004. The southern United States and Caribbean States and Caribbean region were battered by a region were battered by a series of powerful series of powerful hurricanes last year. hurricanes last year.
Rising sea levels are also Rising sea levels are also expected to speed up expected to speed up coastal erosion.coastal erosion.

Then and NowThen and Now Vanishing islandsVanishing islands Other parts of the world Other parts of the world
could face even more could face even more drastic change. drastic change.
The Intergovernmental The Intergovernmental Panel on Climate Change Panel on Climate Change (IPCC), a consortium of (IPCC), a consortium of several thousand several thousand independent scientists, independent scientists, predicts that sea levels predicts that sea levels could rise by between 9 could rise by between 9 and 88cm in the next and 88cm in the next century. century.
This would threaten low-This would threaten low-lying islands such as lying islands such as Tuvalu in the Pacific. Tuvalu in the Pacific. These images, taken on These images, taken on the same day this year, the same day this year, show the effects of a show the effects of a higher than usual tide.higher than usual tide.

Then and NowThen and Now No snowNo snow As the climate As the climate
warms up, warms up, mountainous mountainous regions may regions may experience lower experience lower levels of snowfall. levels of snowfall.
This image shows This image shows Mount Hood in Mount Hood in Oregon at the same Oregon at the same time in late time in late summer in 1985 summer in 1985 and 2002and 2002

Then and NowThen and Now More pestsMore pests Tree-eating wood Tree-eating wood
beetles are likely to beetles are likely to benefit from a benefit from a warmer climate and warmer climate and reproduce in ever-reproduce in ever-increasing increasing numbers. numbers.
These images show These images show damage to White damage to White Spruce trees in Spruce trees in Alaska caused by Alaska caused by the pests.the pests.
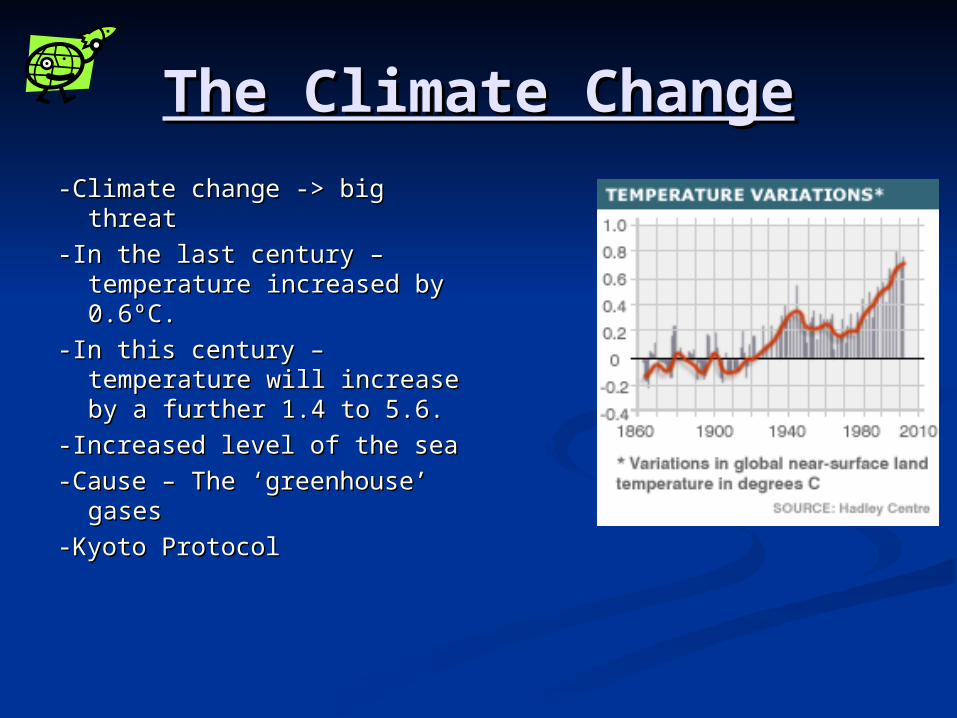
The Climate ChangeThe Climate Change
-Climate change -> big threat-Climate change -> big threat
-In the last century – temperature -In the last century – temperature increased by 0.6increased by 0.6ºC.ºC.
-In this century – temperature will -In this century – temperature will increase by a further 1.4 to 5.6.increase by a further 1.4 to 5.6.
-Increased level of the sea-Increased level of the sea
-Cause – The ‘greenhouse’ gases-Cause – The ‘greenhouse’ gases
-Kyoto Protocol-Kyoto Protocol

The Ozone HoleThe Ozone Hole
1985 – 1985 – A thinning of the ozone layer A thinning of the ozone layer is discovered: “the Ois discovered: “the O33 Hole” Hole”
Cause – CFCs used as aerosol Cause – CFCs used as aerosol propellants and refrigerantspropellants and refrigerants
Ozone destruction – Greater at the Ozone destruction – Greater at the polespoles
1996 – Scandinavia, Greenland and 1996 – Scandinavia, Greenland and Siberia -> 45% depletionSiberia -> 45% depletion
1997 – Antarctic hole – 24 Km1997 – Antarctic hole – 24 Km

The Ozone LayerThe Ozone Layer
OO33 – small concentration into – small concentration into atmosphereatmosphere
90% - in Stratosphere – layer 90% - in Stratosphere – layer between 10 km and 50 kmbetween 10 km and 50 km
The layer – filters sun ultravioletThe layer – filters sun ultraviolet
Threat – aerosols, volcanic eruptions Threat – aerosols, volcanic eruptions etc.etc.