Embed Size (px)
Citation preview
1
ETHIOPIAN AGRICULTURE: MACRO AND MICRO PERSPECTIVE
For Afrint
Macro Study
July 2003 Addis Ababa
2
Contents I. MACRO PERSPECTIVE 1.1 Preconditions (for intensification)
1.1.1 Food Situation 1.1.2 Agro-ecological and demographic preconditions 1.1.3 Structures and institutions a) Structure and performance of the economy
b) Agrarian structure (farm size, cash crops/ food crops) c) Land tenure systems d) Transport and other economic infrastructure e) Availability of agricultural credit system
1.1.4 Political preconditions a) Government Freedom/ Ability to Direct Agr. Development b) Role of Donors and Multilateral Organizations in Agr. c) Role of trade regimes
Pre-SAP period Post-1991 trade regime (SAP period) Post-SAP period
d) Role of nationalism and other ideological factors 1.1.5 Community Organizations and Institutions
a) Interest groups b) Cooperatives c) Indigenous organizations and self-help groups d) Development Associations e) Advocacy groups f) Women in Development
1.2 Actors
1.2.1 The state a) The strategy and approach b) Government Policy towards the Private Sector c) Government Attitude and Policies towards NGOs and CBOs
1.2.2 Market/ private sector 1.2.3 Farmers
1.3 Effects
1.3.1 Intensification 1.3.2 National Level Effects (of intensification)
a) Aggregate productivity (yields) b) Aggregate changes in cropping patterns
3
c) Trends in aggregate use of high-yielding inputs Improved seeds Fertilizers National food self-sufficiency
1.4 Conclusions
4
I. MACRO REPORT 1.1 Preconditions (for intensification) 1.1.1 Food Situation Agricultural growth rates are inadequate when compared to the 3% population growth. Production levels have continued to fluctuate with the rainfall patterns and over 10 million people required emergency food aid as a result of a bad weather in 1999/00 (Table 1). The proportion of people affected averaged 10.3 percent per annum between 1980/81 and 2000/01. In 2002/3, the situation got worst as nearly 15 million or 22% of the total population required food assistance to survive. Good weather conditions create problem of a different nature in Ethiopia: a fall in grain prices and lower income for surplus producers. For instance, the weather in 2001 and part of 2002 was relatively good and the challenge was how to deal with declining grain prices.1 The contribution of new agricultural technology is also heavily dependent on weather in Ethiopia. Farmers in many marginal and drought prone areas have not found fertilizer and improved seeds profitable because of low yield response and occasional crop failure. The challenge for the country is how to ensure a sustainable increase in income and overcome the threat of famine and starvation.
1 It should be noted that a similar good weather in the last two years has also resulted bumper harvest in neighboring countries such as Kenya and Uganda. Uganda managed to produce surplus without any significant increase in the use of fertilizer as in Ethiopia.
5
Table 1: Drought/disaster affected population
Year
Disaster/drought affected population (million)
Proportion affected (%)
1980/81 2.82 7.7 1981/82 3.70 9.8 1982/83 3.30 8.5 1983/84 4.21 10.5 1984/85 6.99 17.0 1985/86 6.14 14.5 1986/87 2.53 5.8 1987/88 4.16 9.3 1988/89 5.35 11.6 1989/90 3.21 6.8 1990/91 7.22 14.8 1991/92 7.85 15.6 1992/93 4.97 9.6 1993/94 6.70 12.6 1994/95 3.99 7.3 1995/96 2.78 4.9 1996/97 3.36 5.8 1997/98 4.10 6.8 1998/99 7.19 11.7 1999/00 10.56 16.6 2000/01 6.24 9.6 Average 5.37 10.3 2002/03 14.7 22.0 1.1.2 Agro-ecological and demographic preconditions Ethiopia has traditionally been characterized by two major agro-ecological zones – the highlands and the lowlands. The highlands area areas above 1500 meters above sea level (masl) and constitute about 35-40% of the land area, while the lowlands are areas below 1500 masl and account for up to 60% of the total land area. Ethiopian agro-ecological conditions are commonly classified into three categories, namely dega (highland), weyna dega (mid-altitude) and kolla (lowland). Dega zones refer to highland areas with an altitude of over 2300 meters while weyan dega represents mid-highlands with an altitude of 1500 to 2300 masl. Areas lying below 1500 masl are known as kolla. A more detailed classification based on altitude, temperature and moisture regimes includes 18 major agro-ecological zones. The Ethiopian highlands, along with the highlands of East Africa, have been endowed with a combination of moderate temperatures, adequate rainfall and productive soils. As a
6
result, the area has a long history of human habitation and supports some of the highest rural population densities in Africa. Oxen cultivation in the highlands of Ethiopia is believed to have started several centuries ago. The highland mixed farming system of Ethiopia is dominated by the production of cereals, mainly teff, wheat, barley, sorghum, maize and millet. Livestock production is extremely important as source of draught power, food (animal products) and investment (wealth) to highland farmers. The Ethiopian population is estimated at 67 million in 2002. With an average growth rate of about 3%, the population is expected to reach 101.4 million by the year 2018. About 85% of the population lived in rural areas in 2002. Although urbanization levels and trends show steady increase, even by 2018, the vast majority of Ethiopia’s population (84.8 million or 84%) will still be living in rural areas.2 Rapid population growth has also brought several changes in the traditional cereal farming systems: (1) cultivation has been pushed to more marginal and fragile lowlands as well as steep slopes previously used as pasture and forest land; (2) farm holdings have become smaller and fragmented, reducing farmers' ability to practice crop rotation and fallowing; (3) as crop residues became major animal feed and animal manure important sources fuel, many farmers have resorted to chemical fertilizer to counter the problem of declining fertility; (4) degraded steep slopes are grazed continuously and are not allowed to generate; and (5) the productivity and number of animals kept by each household declined mainly because of feed shortages. Ethiopia is believed to have a huge water potential: the annual run-off and ground water is estimated at 122 and 2.6 billion cubic meters, respectively. It is estimated that 3.5 million hectares of land is potentially irrigable. Nevertheless, despite the potential and recurrent drought, the maximum area quoted to be currently under irrigation is estimated at only 160,000 hectares or less than 5 percent of the potential.3 Most of the irrigated land is limited to the Awash Valley where state-owned farms produce sugar cane, fruits and cotton. Irrigated land under the peasant sector is only about 81,690 hectares (about 51% of the total) (see Table 9). It requires a huge investment to tap the water resources of the country to develop the sparsely populated lowland areas, currently inhabited by pastoralists. Such areas currently include about 5 million people that are chronically food insecure. 1.1.3 Structures and institutions a) Structure and performance of the economy Agriculture is the single most important sector of the economy. It accounts for 45 percent of the GDP (1900/01), employs 85 percent of the labor force, generates over 90 percent of the foreign exchange earnings, and supplies the bulk of the raw material inputs to the industrial sector. In 2000/01, the industrial sector accounted for 11 percent of the
2 CSA. 1999. The 1994 Population and Housing Census of Ethiopia: Results at Country Level, Addis Ababa. 3 MOFED. Ethiopia: Sustainable Development and Poverty Reduction Program, July 2002, Addis Ababa.
7
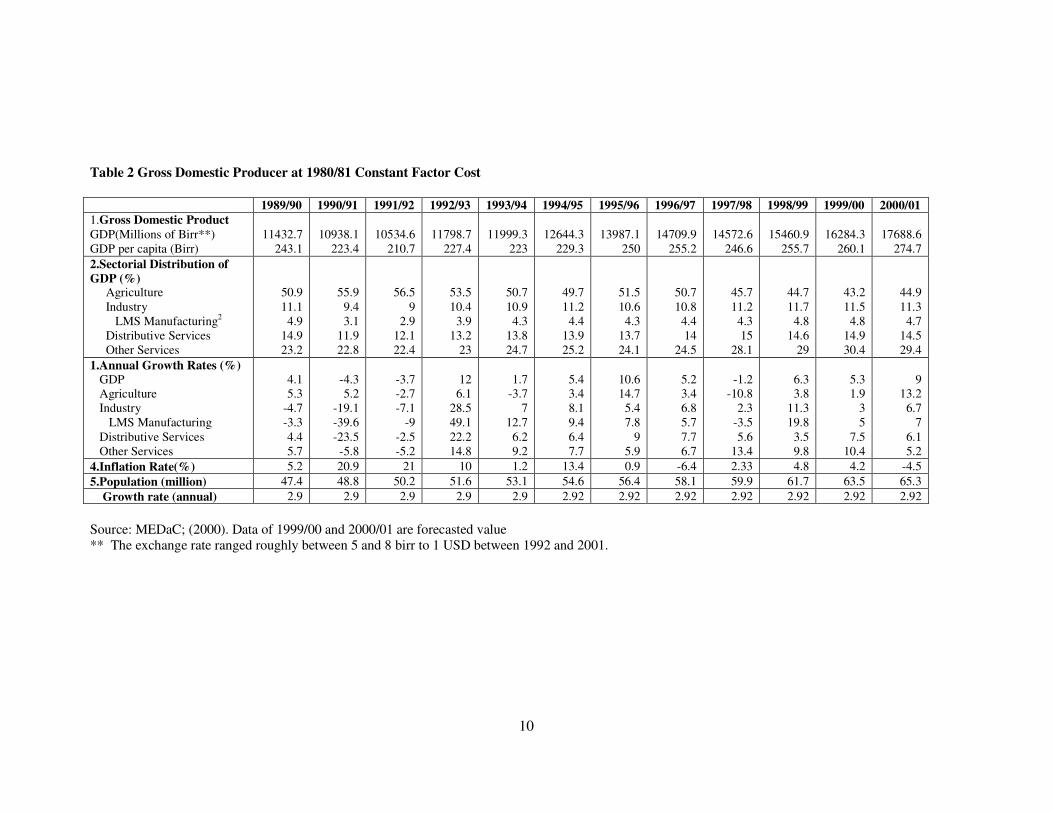
GDP, compared to the service sector that constituted about 44 percent of the GDP. Large and medium scale manufacturing, mainly concentrated around the capital city, accounted for less than 5 percent of the GDP (Table 2). Mining has not been of a major importance to the Ethiopian economy. But several foreign mining companies have been awarded concessions to prospect for gold and other precious metals since 1996. Gold reserves are estimated at about 60 to 200 tonnes. Studies have also indicated that the country has substantial reserves of coal, iron ore, tantalum, bicarbonate and potassium, although a number of significant deposits are in inaccessible locations. Limestone, clay and marble are produced in large quantities, and the output of non-metallic minerals has been boosted by the upsurge in construction activity since 1991.4 The Ethiopian economy performed very badly in the 1980s as a result of the restrictive government policies. Annual GDP growth rate averaged only 1.1 percent between and 1981/82 and 1990/91. Growth rate of GDP and agricultural output declined by 10 and 21 percent, respectively, during the disastrous drought of 1984/85. The reform programs of the early 1990s contributed to improved performance of the economy (Table 2). Real GDP grew on average by nearly 6 percent between 1992/93 and 2000/01. The growth rate was 12 percent in 1992/93 mainly due to the strong recovery from a very low base or a negative growth rates (-3.7%) the pervious year. A growth rate of 10.6 and 9 percent was recorded in 1995/96 and 2000/01, respectively, largely as a result of the good weather conditions and bumper harvest. On the other hand, growth rate slipped to -1.2 percent in 1997/98 because of the unfavorable weather that reduced agricultural output by about 11 percent. On average, agricultural GDP grew by 3.6 percent per annum between 1992/93 and 2000/01. But production declined sharply in the subsequent two years, growing by -3.1 and -12.2 percent in 2001/02 and 1002/03, respectively5. Growth rates of agricultural production were negative in four of the 11 years between 1992/93 and 2002/3 or in five of the 14 years between 1989/90 and 2002/03. In other words, one in every three years is affected by drought. Although policy changes have influenced performance, rainfall conditions remain the major factor influencing agricultural production. Although increased use of fertilizer has raised output in areas with relatively more productive growing conditions, productivity has declined in less productive areas, in large part due to increased population density and environmental degradation. 6 Gross domestic saving ratios reached a high of 13 percent per annum during the imperial period (prior to 1974) only to reduce to an average of 7.2 percent under the military government (1947-71). The ratio further declined during the post 1991 period, averaging only about 6.5 percent between 1991/92 and 1997/98. Owing to large drop in public
4 The Economist Intelligence Unit, 2001. 5 World Bank, Memorandum of the President of the International Development Association to the Executive Directors on a Country Assistance Strategy for the Federal Democratic Republic of Ethiopia, March 24, 2003. 6 World Bank, Ibid.
8
savings, gross domestic saving went down to negative 2.1 percent in 1999/00. The border conflict with Eritrea during the period 1999/00 and 2000/01 seriously affected domestic savings, particularly public saving.7 Gross fixed capital formation as percent of GDP registered a significant increase after the 1991/92 reform: the investment ratio averaged 15.2 percent during the period 1991/92 to 1997/98.8 Nonetheless, the ratio of investment for Ethiopia is far below the average for developing countries, estimated at 25.7 percent in 1998/99. Moreover, gross domestic investment in percent of GDP in Ethiopia declined to 13.3 percent in 1999/00.9 The widening resource gap also required substantial external sources. For instance, gross domestic savings were able to finance only 34 percent of the gross domestic capital formation in 1997/98.10 Total external debt stock (excluding ruble denominated debt to Russia) increased from 31.6 billion birr in 1998/99 to birr 44.6 billion in 1999/00, implying an increase in the external indebtedness of the country by 41.4 percent. Because of the unsustainable level of external debt, Ethiopia has been put in the list of heavily indebted poor countries and is expected to benefit from the HIPC initiative of the World Bank and IMF. The country's external debt to GDP stood at 86.5 percent in 1999/00.11 The structure of the external sector did not show any marked change over the last two or three decades. Ethiopia's export sector is highly dependent on a few agricultural commodities such as coffee, hides and skins, pulses and oilseeds, and chat. Coffee alone accounts for more than 60% of foreign-exchange earnings. The dependence on coffee has become even more dominant in recent years, rendering the country's external sector more susceptible to adverse shocks that affect production and world price developments. Receipts from coffee has declined sharply in recent years due to the collapse of prices in the international market. As a result, the trade gap is thought to have widened to unprecedented levels in the last two years. Inflation in Ethiopia has never been a serious and persistent threat to saving, investment or purchasing power of consumers. In the 1980s, for instance, the highest rate of inflation recorded was 18.5 during the drought year of 1984/85. Inflation rates were not out of control (not exceeding 21%) even in the last years of the military government (e.g. 1990/91 and 1991/92) when most parts of the country were affected social upheavals. Inflation rates went down considerably under the Transitional and Federal Government. Throughout the period since 1992/93, prices increased by less than 5 percent, except in the drought year 1994/95 that witnessed a 13 percent inflation rate. A negative 4.5 percent was also registered in 2000/01. The predominance of the subsistence economy or
7 National Bank of Ethiopia, Annual Report, 1999/00, Addis Ababa Ethiopia. 8 Befekadu Degefe and Berhanu Nega, Annual Report on the Ethiopian Economy, Volume I, 1999/2000, The Ethiopian Economic Association, 1999/00. 9 National Bank of Ethiopia, Annual Report, 1999/00, Addis Ababa Ethiopia. 10 MEDaC, Survey of the Ethiopian Economy: Review of Post-Reform Developments (1992/93 - 1997/98), Addis Ababa, September 1999. 11 National Bank of Ethiopia, Annual Report, 1999/00, Addis Ababa Ethiopia.
9
the low degree monetization, and sound macroeconomic policies and management are believed to have eased the pressure on prices in Ethiopia.12
12 MEDaC, Survey of the Ethiopian Economy: Review of Post-Reform Developments (1992/93 - 1997/98), Addis Ababa, September 1999.
10
Table 2 Gross Domestic Producer at 1980/81 Constant Factor Cost
1989/90 1990/91 1991/92 1992/93 1993/94 1994/95 1995/96 1996/97 1997/98 1998/99 1999/00 2000/01 1.Gross Domestic Product GDP(Millions of Birr**) GDP per capita (Birr)
11432.7 243.1
10938.1 223.4
10534.6 210.7
11798.7 227.4
11999.3
223
12644.3 229.3
13987.1
250
14709.9 255.2
14572.6 246.6
15460.9 255.7
16284.3 260.1
17688.6 274.7
2.Sectorial Distribution of GDP (%) Agriculture Industry LMS Manufacturing2
Distributive Services Other Services
50.9 11.1 4.9
14.9 23.2
55.9 9.4 3.1
11.9 22.8
56.5 9
2.9 12.1 22.4
53.5 10.4
3.9 13.2
23
50.7 10.9 4.3
13.8 24.7
49.7 11.2
4.4 13.9 25.2
51.5 10.6 4.3
13.7 24.1
50.7 10.8
4.4 14
24.5
45.7 11.2 4.3 15
28.1
44.7 11.7
4.8 14.6
29
43.2 11.5 4.8
14.9 30.4
44.9 11.3
4.7 14.5 29.4
1.Annual Growth Rates (%) GDP Agriculture Industry LMS Manufacturing Distributive Services Other Services
4.1 5.3
-4.7 -3.3 4.4 5.7
-4.3 5.2
-19.1 -39.6 -23.5 -5.8
-3.7 -2.7 -7.1
-9 -2.5 -5.2
12 6.1
28.5 49.1 22.2 14.8
1.7
-3.7 7
12.7 6.2 9.2
5.4 3.4 8.1 9.4 6.4 7.7
10.6 14.7 5.4 7.8
9 5.9
5.2 3.4 6.8 5.7 7.7 6.7
-1.2
-10.8 2.3
-3.5 5.6
13.4
6.3 3.8
11.3 19.8
3.5 9.8
5.3 1.9
3 5
7.5 10.4
9
13.2 6.7
7 6.1 5.2
4.Inflation Rate(%) 5.2 20.9 21 10 1.2 13.4 0.9 -6.4 2.33 4.8 4.2 -4.5 5.Population (million) 47.4 48.8 50.2 51.6 53.1 54.6 56.4 58.1 59.9 61.7 63.5 65.3 Growth rate (annual) 2.9 2.9 2.9 2.9 2.9 2.92 2.92 2.92 2.92 2.92 2.92 2.92 Source: MEDaC; (2000). Data of 1999/00 and 2000/01 are forecasted value ** The exchange rate ranged roughly between 5 and 8 birr to 1 USD between 1992 and 2001.
11
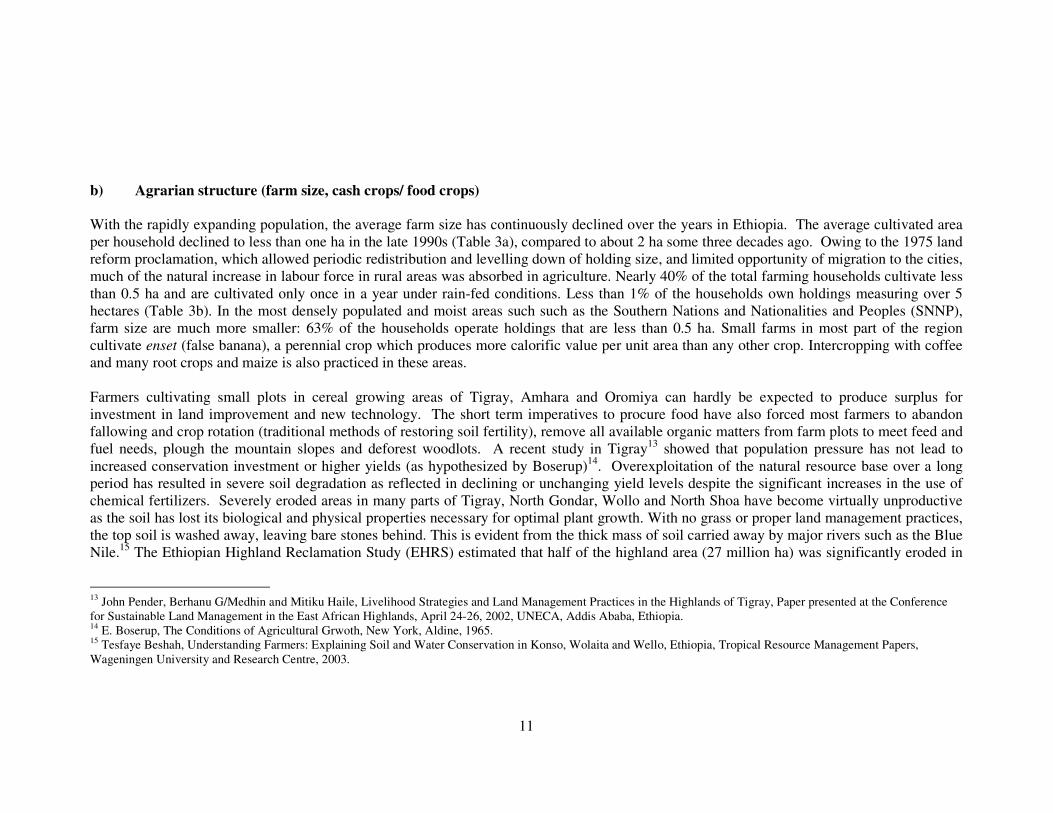
b) Agrarian structure (farm size, cash crops/ food crops) With the rapidly expanding population, the average farm size has continuously declined over the years in Ethiopia. The average cultivated area per household declined to less than one ha in the late 1990s (Table 3a), compared to about 2 ha some three decades ago. Owing to the 1975 land reform proclamation, which allowed periodic redistribution and levelling down of holding size, and limited opportunity of migration to the cities, much of the natural increase in labour force in rural areas was absorbed in agriculture. Nearly 40% of the total farming households cultivate less than 0.5 ha and are cultivated only once in a year under rain-fed conditions. Less than 1% of the households own holdings measuring over 5 hectares (Table 3b). In the most densely populated and moist areas such such as the Southern Nations and Nationalities and Peoples (SNNP), farm size are much more smaller: 63% of the households operate holdings that are less than 0.5 ha. Small farms in most part of the region cultivate enset (false banana), a perennial crop which produces more calorific value per unit area than any other crop. Intercropping with coffee and many root crops and maize is also practiced in these areas. Farmers cultivating small plots in cereal growing areas of Tigray, Amhara and Oromiya can hardly be expected to produce surplus for investment in land improvement and new technology. The short term imperatives to procure food have also forced most farmers to abandon fallowing and crop rotation (traditional methods of restoring soil fertility), remove all available organic matters from farm plots to meet feed and fuel needs, plough the mountain slopes and deforest woodlots. A recent study in Tigray13 showed that population pressure has not lead to increased conservation investment or higher yields (as hypothesized by Boserup)14. Overexploitation of the natural resource base over a long period has resulted in severe soil degradation as reflected in declining or unchanging yield levels despite the significant increases in the use of chemical fertilizers. Severely eroded areas in many parts of Tigray, North Gondar, Wollo and North Shoa have become virtually unproductive as the soil has lost its biological and physical properties necessary for optimal plant growth. With no grass or proper land management practices, the top soil is washed away, leaving bare stones behind. This is evident from the thick mass of soil carried away by major rivers such as the Blue Nile.15 The Ethiopian Highland Reclamation Study (EHRS) estimated that half of the highland area (27 million ha) was significantly eroded in
13 John Pender, Berhanu G/Medhin and Mitiku Haile, Livelihood Strategies and Land Management Practices in the Highlands of Tigray, Paper presented at the Conference for Sustainable Land Management in the East African Highlands, April 24-26, 2002, UNECA, Addis Ababa, Ethiopia. 14 E. Boserup, The Conditions of Agricultural Grwoth, New York, Aldine, 1965. 15 Tesfaye Beshah, Understanding Farmers: Explaining Soil and Water Conservation in Konso, Wolaita and Wello, Ethiopia, Tropical Resource Management Papers, Wageningen University and Research Centre, 2003.
12
the
late
198
0s16
. Acc
ordi
ng to
a r
ecen
t Wor
ld B
ank
publ
icat
ion,
70%
of
the
high
land
are
as a
re d
egra
ded
to th
e po
int w
here
live
lihoo
ds a
re n
o lo
nger
sus
tain
able
.17 S
ome
stud
ies
have
est
imat
ed t
he r
ate
of s
oil
loss
to
be l
ower
, bu
t th
ere
is a
gen
eral
und
erst
andi
ng t
hat
soil
eros
ion
is a
se
riou
s th
reat
and
the
pre
sent
cro
plan
d co
uld
be l
ost
with
in t
hree
or
five
gen
erat
ions
.18 O
ther
stu
dies
hav
e fo
und
that
nut
rien
t lo
ses
due
to
rem
oval
of
dung
(fo
r us
e as
ene
rgy
sour
ce)
and
crop
res
idue
s fr
om c
ropl
and
(for
use
as
cattl
e fe
ed)
are
muc
h m
ore
impo
rtan
t tha
n lo
ses
due
to
soil
eros
ion.
19
16 C
onst
able
, M. E
thio
pian
Hig
hlan
d R
ecla
mat
ion
Stud
y (S
umm
ary)
, Lan
d U
se P
lann
ing
and
Reg
ulat
ory
Dep
artm
ent,
Min
istr
y of
Agr
icul
ture
and
FA
O. W
orki
ng P
aper
24,
A
ddis
Aba
ba, 1
985.
17
Wor
ld B
ank,
Mem
oran
dum
of t
he P
resi
dent
of t
he In
tern
atio
nal D
evel
opm
ent A
ssoc
iatio
n to
the
Exe
cutiv
e D
irec
tors
on
a C
ount
ry A
ssis
tanc
e St
rate
gy f
or th
e Fe
dera
l D
emoc
ratic
Rep
ublic
of E
thio
pia,
Mar
ch 2
4, 2
003.
18
For
inst
ance
, Hur
ni e
stim
ated
the
rate
of s
oil l
oss
to b
e m
uch
low
er th
an th
e es
timat
es b
y EH
RS,
but
con
clud
ed th
at e
ven
at th
is lo
wer
rate
of e
rosi
on, t
he to
tal s
oil o
f the
pr
esen
t cro
plan
d w
ill b
e re
mov
ed w
ithin
100
-150
yea
rs. H
urni
, H. L
and
Deg
rada
tion,
Fam
ine
and
Res
ourc
e Sc
enar
ios
in E
thio
pia:
in P
imen
tal,
D. (
ed),
Wor
ld S
oil E
rosi
on
and
Con
serv
atio
n, C
ambr
idge
Uni
vers
ity P
ress
, 199
3.
19 S
utcl
iffe
, J.P
. 199
3. ‘E
cono
mic
ass
essm
ent o
f the
land
deg
rada
tion
in th
e E
thio
pian
hig
hlan
ds: A
cas
e st
udy’
Add
is A
baba
: Nat
iona
l Con
serv
atio
n St
rate
gy S
ecre
tari
at,
Min
istr
y of
Pla
nnin
g an
d E
cono
mic
Dev
elop
men
t, D
ecem
ber,
mem
o.
13
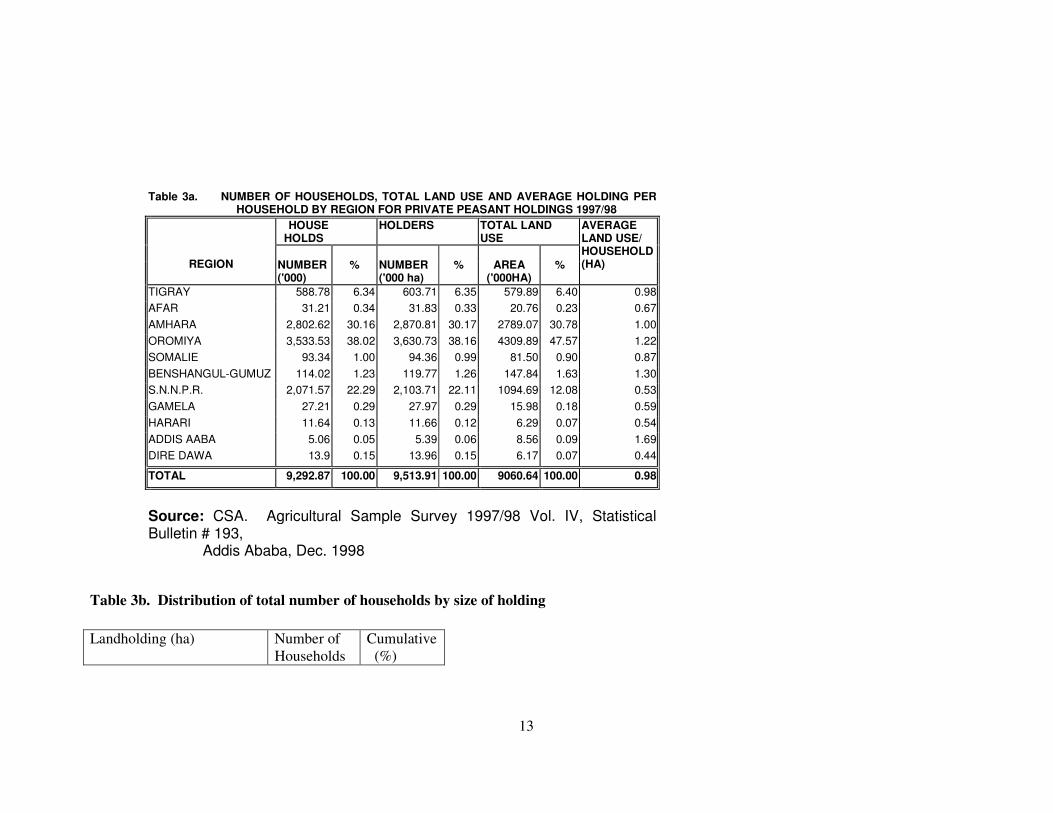
Table 3a. NUMBER OF HOUSEHOLDS, TOTAL LAND USE AND AVERAGE HOLDING PER
HOUSEHOLD BY REGION FOR PRIVATE PEASANT HOLDINGS 1997/98 HOUSE HOLDS
HOLDERS TOTAL LAND USE
REGION NUMBER ('000)
%
NUMBER ('000 ha)
%
AREA
('000HA)
%
AVERAGE LAND USE/ HOUSEHOLD(HA)
TIGRAY 588.78 6.34 603.71 6.35 579.89 6.40 0.98 AFAR 31.21 0.34 31.83 0.33 20.76 0.23 0.67 AMHARA 2,802.62 30.16 2,870.81 30.17 2789.07 30.78 1.00 OROMIYA 3,533.53 38.02 3,630.73 38.16 4309.89 47.57 1.22 SOMALIE 93.34 1.00 94.36 0.99 81.50 0.90 0.87 BENSHANGUL-GUMUZ 114.02 1.23 119.77 1.26 147.84 1.63 1.30 S.N.N.P.R. 2,071.57 22.29 2,103.71 22.11 1094.69 12.08 0.53 GAMELA 27.21 0.29 27.97 0.29 15.98 0.18 0.59 HARARI 11.64 0.13 11.66 0.12 6.29 0.07 0.54 ADDIS AABA 5.06 0.05 5.39 0.06 8.56 0.09 1.69 DIRE DAWA 13.9 0.15 13.96 0.15 6.17 0.07 0.44
TOTAL 9,292.87 100.00 9,513.91 100.00 9060.64 100.00 0.98
Source: CSA. Agricultural Sample Survey 1997/98 Vol. IV, Statistical Bulletin # 193,
Addis Ababa, Dec. 1998
Table 3b. Distribution of total number of households by size of holding Landholding (ha) Number of
Households Cumulative (%)
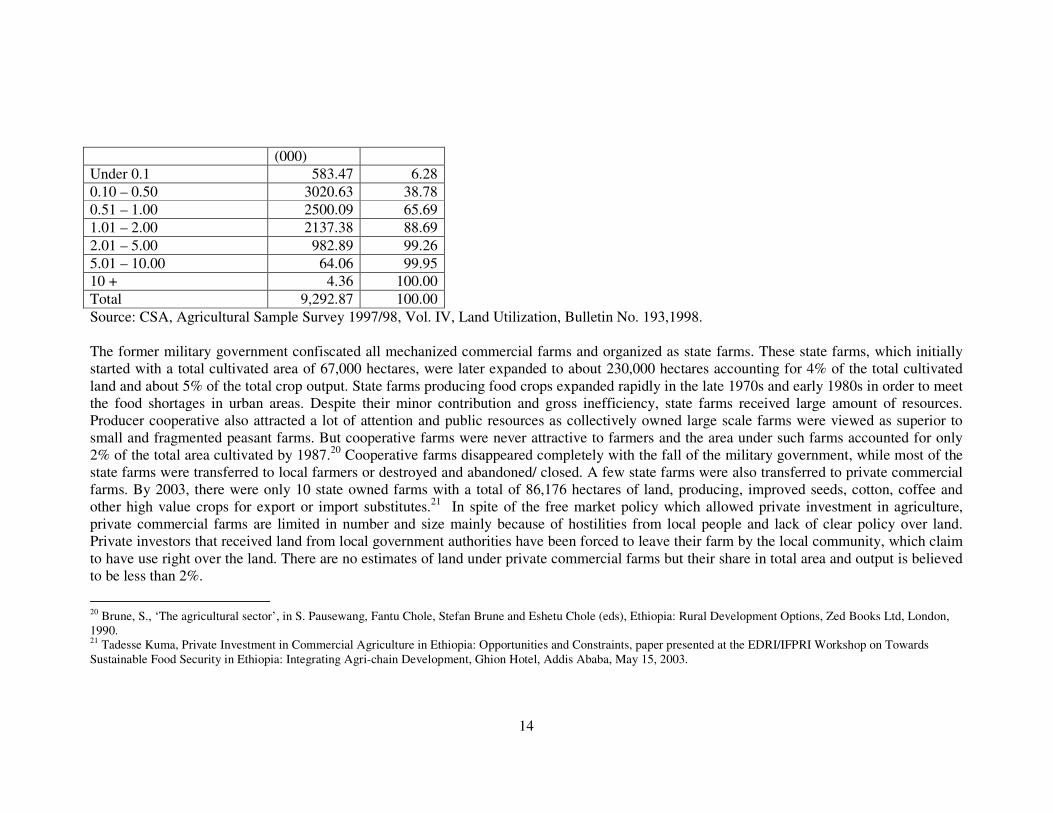
14
(000) Under 0.1 583.47 6.28 0.10 – 0.50 3020.63 38.78 0.51 – 1.00 2500.09 65.69 1.01 – 2.00 2137.38 88.69 2.01 – 5.00 982.89 99.26 5.01 – 10.00 64.06 99.95 10 + 4.36 100.00 Total 9,292.87 100.00 Source: CSA, Agricultural Sample Survey 1997/98, Vol. IV, Land Utilization, Bulletin No. 193,1998. The former military government confiscated all mechanized commercial farms and organized as state farms. These state farms, which initially started with a total cultivated area of 67,000 hectares, were later expanded to about 230,000 hectares accounting for 4% of the total cultivated land and about 5% of the total crop output. State farms producing food crops expanded rapidly in the late 1970s and early 1980s in order to meet the food shortages in urban areas. Despite their minor contribution and gross inefficiency, state farms received large amount of resources. Producer cooperative also attracted a lot of attention and public resources as collectively owned large scale farms were viewed as superior to small and fragmented peasant farms. But cooperative farms were never attractive to farmers and the area under such farms accounted for only 2% of the total area cultivated by 1987.20 Cooperative farms disappeared completely with the fall of the military government, while most of the state farms were transferred to local farmers or destroyed and abandoned/ closed. A few state farms were also transferred to private commercial farms. By 2003, there were only 10 state owned farms with a total of 86,176 hectares of land, producing, improved seeds, cotton, coffee and other high value crops for export or import substitutes.21 In spite of the free market policy which allowed private investment in agriculture, private commercial farms are limited in number and size mainly because of hostilities from local people and lack of clear policy over land. Private investors that received land from local government authorities have been forced to leave their farm by the local community, which claim to have use right over the land. There are no estimates of land under private commercial farms but their share in total area and output is believed to be less than 2%.
20 Brune, S., ‘The agricultural sector’, in S. Pausewang, Fantu Chole, Stefan Brune and Eshetu Chole (eds), Ethiopia: Rural Development Options, Zed Books Ltd, London, 1990. 21 Tadesse Kuma, Private Investment in Commercial Agriculture in Ethiopia: Opportunities and Constraints, paper presented at the EDRI/IFPRI Workshop on Towards Sustainable Food Security in Ethiopia: Integrating Agri-chain Development, Ghion Hotel, Addis Ababa, May 15, 2003.
15
Ethiopia is endowed with a large livestock population. Livestock is considered as a security, investment and additional income for farmers in Ethiopia. According to the estimates made by the Ministry of Economic Development and Cooperation in 1997, there are about 33 million cattle, 30 million sheep, 21 million goats, 1million camels, 7 million equine, 52 million poultry and 10 million bee colonies. Almost 80% of the cattle, 75% of sheep, and 27 % of goats are found in the highlands, while the rest (20% of the cattle, 25% of sheep, 73% of the goats and 100% of camels) are located in the lowlands22. The output of livestock sub-sector can be divided into two parts: food and non-food items. Food sources of livestock products include meat and meat products, milk and milk products, eggs, honey and fish among other things. Non-food output includes draft power, wool, hides and skins, bee-wax, manures, and transport services. In the smallholder peasants mixed farming systems, 26% of the livestock output is used as food. In the pastoral systems this proportion increases to 61%. Despite its large size, the livestock sub-sector remains undeveloped in Ethiopia. The main constraints include inadequate feed and nutrition, widespread diseases and poor animal health, and poor genetic structure. High population growth and increasing density are causing the shortage of natural grazing land. Inadequate capital and recurrent budget allocations to the livestock sector have also contributed to the low productivity of the sub-sector. c) Land tenure systems One of the major factors exacerbating the problems of diminishing farm size and environmental degradation is the land tenure system. The decision of the EPRDF23-led government to uphold public ownership of land of the 1975 rural land legislation is based on the need to ensure free access to all those who want to cultivate the land personally and remove the risk of widespread landlessness in the rural areas. According to the 2001 Rural Development Policies, Strategies and Tactics, public ownership of land is necessary in order to initiate land redistribution as deemed necessary by the government. This, however, would mean that tenure insecurity would continue to deprive farmers the necessary incentive to invest in land. Moreover, ADLI is implemented under policy environment that favours further absorption of additional labor force (which is growing at nearly 3% per annum) into agriculture and hence further levelling down of farm size. Since opportunities for bringing new land into cultivation is limited, access to land is secured through sharing existing cultivable land. Grown up or adult children often stay with their family until they get land of their own through inheritance or reallocation by local officials or get rented/sharecropped land (see micro report). Farm
22 MEDaC, Survey of the Ethiopian Economy: Review of Post-Reform Developments (1992/93 - 1997/98), Addis Ababa, September 1999. 23 Ethiopian People’s Revolutionary Democratic Front
16
size diminishes as land is inherited by several children or redistributed by officials24. At the same time, yield levels have not increased in most cases due to declining soil fertility and lack of technological breakthroughs and limited effort to use surplus labor to intensify production (see also micro report), limited . Dependence on erratic rainfall has also made it impossible to increase yield on a sustainable basis. Labor productivity and income are not expected to show significant improvement under such conditions. Even where some increase in yield is observed, the rate of increase is likely be offset by a decline in farm size with negative consequences for income. Subsistence production is bound to be reinforced with market production taking a marginal role for most farmers. Small holder farmers in Ethiopia produce for direct household consumption. The proportion of food grain marketed is relatively small: only about 16.3% of maize, 15.4% of wheat 28.0% of teff, 12.7% of barley, 12.8% of sorghum 18.9% of millet, 29.8% of pulses and 40% of oil seeds were reported to be marketed by small farmers in 1996.25 Hence, the potential of the peasant sector to induce backward and forward linkages with the industrial sector would remain weak and inadequate. A recent study has also called for ending future land redistribution in order to encourage investments in land improvements.26 It appears that the land policy needs to be reconsidered (to encourage investment on land), superior new technologies developed, and pressure on land needs to be eased through non-farm employment opportunities if ADLI is to have the desired effect of long-term sustainable and dynamic economic growth with favorable impact on income and poverty. d) Transport and other economic infrastructure Data obtained from the Ethiopian Roads Authority showed that during pre-reform period (in 1989), classified road network in Ethiopia was 18,611 km, out of which 5,232 km (28%) was rural road. After reform (between 1992 and 2001), the total road network increased rapidly and reached 32,281 km in 2001 (this includes 14,480 km rural road (45%)).
Although the road network has shown an increasing trend, the progress so far is still far below the need compared to the large land area and population of the country. Network distribution per thousand sq. km and per million people is only 26 km and 590 km, respectively. (KUAWAB, 2001) This makes the country one of the least accessible in Sub-Sahara Africa. An estimated 75% of farms are more than a half-day
24 Land redistribution was carried in Yetmen and most other parts of the Amhara region in 1996. Households whose members had some association (eg. served as member of a committee) with the Imperial or the Military government lost all their land in excess of 1 ha to landless members of the community. 25 Wolday Amha, Agricultural input and output marketing in remote areas: Ethiopia, A study submitted to the Policy Analysis Unit in Harare, FAO, 2001. 26 Samuel Benin, Policies affecting land management, input use and productivity: Land redistribution and tenure in the highlands of Amhara region, paper presented at the Conference for Sustainable Land Management in the East African Highlands, April 24-26, 2002, UNECA, Addis Ababa, Ethiopia.
17
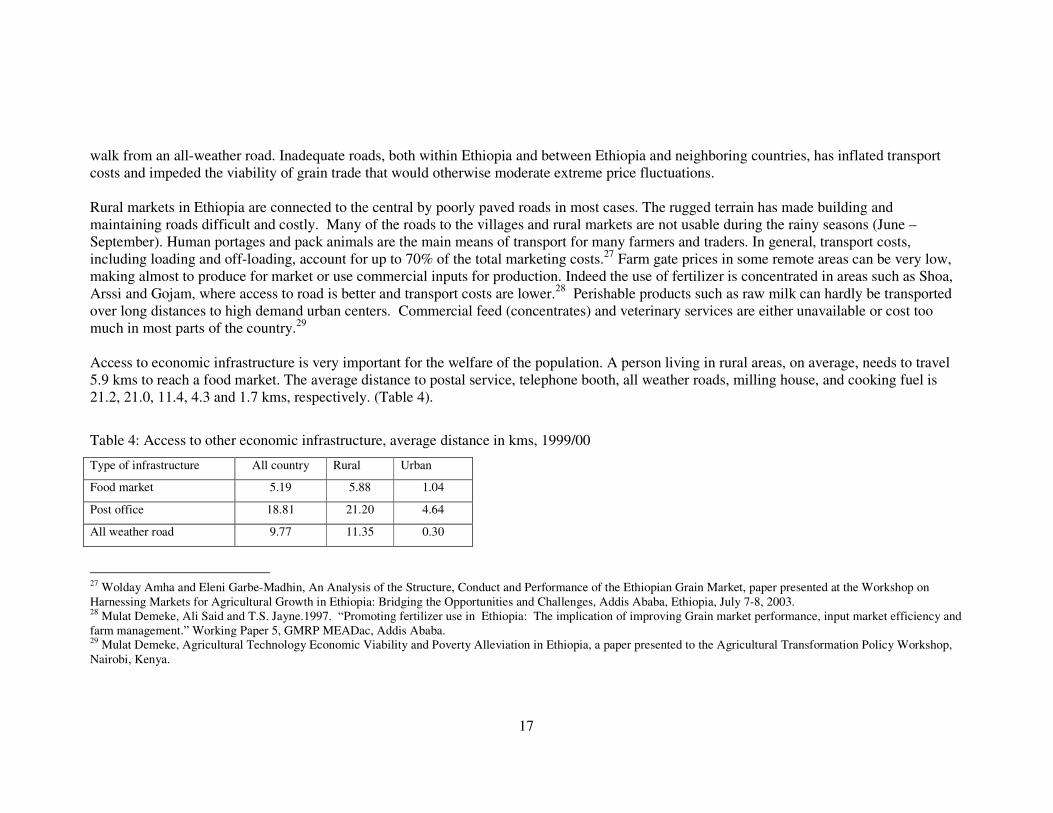
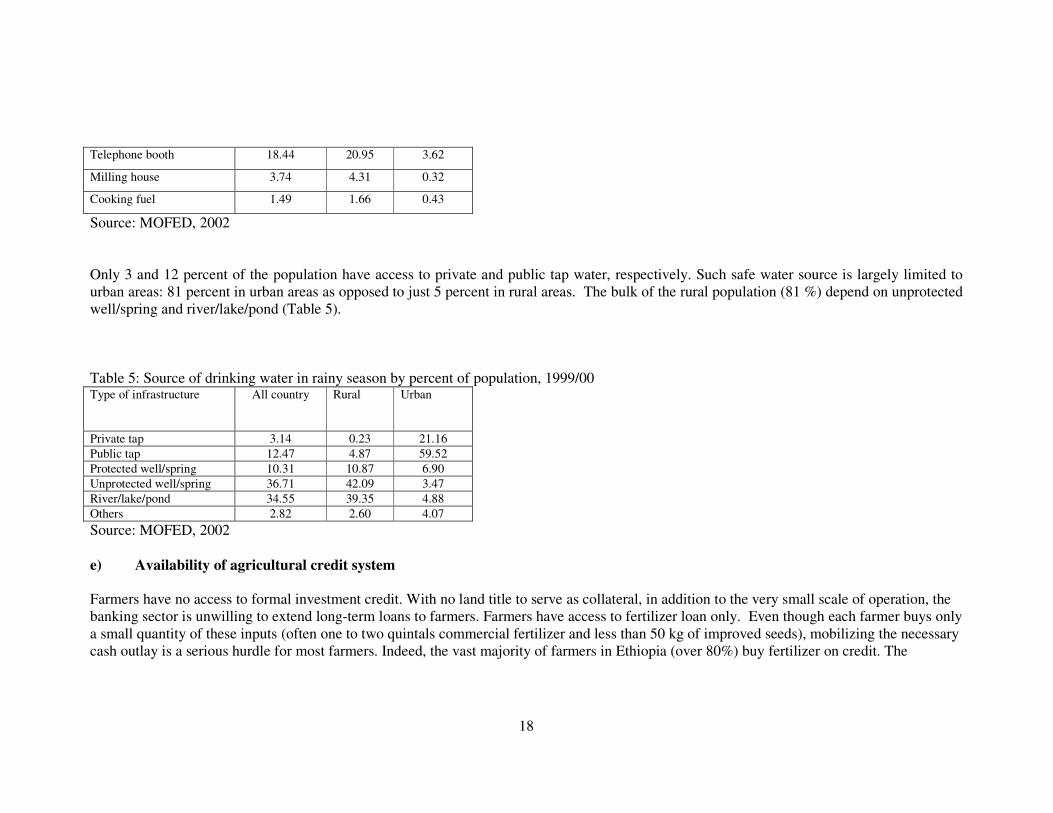
walk from an all-weather road. Inadequate roads, both within Ethiopia and between Ethiopia and neighboring countries, has inflated transport costs and impeded the viability of grain trade that would otherwise moderate extreme price fluctuations. Rural markets in Ethiopia are connected to the central by poorly paved roads in most cases. The rugged terrain has made building and maintaining roads difficult and costly. Many of the roads to the villages and rural markets are not usable during the rainy seasons (June – September). Human portages and pack animals are the main means of transport for many farmers and traders. In general, transport costs, including loading and off-loading, account for up to 70% of the total marketing costs.27 Farm gate prices in some remote areas can be very low, making almost to produce for market or use commercial inputs for production. Indeed the use of fertilizer is concentrated in areas such as Shoa, Arssi and Gojam, where access to road is better and transport costs are lower.28 Perishable products such as raw milk can hardly be transported over long distances to high demand urban centers. Commercial feed (concentrates) and veterinary services are either unavailable or cost too much in most parts of the country.29 Access to economic infrastructure is very important for the welfare of the population. A person living in rural areas, on average, needs to travel 5.9 kms to reach a food market. The average distance to postal service, telephone booth, all weather roads, milling house, and cooking fuel is 21.2, 21.0, 11.4, 4.3 and 1.7 kms, respectively. (Table 4).
Table 4: Access to other economic infrastructure, average distance in kms, 1999/00
Type of infrastructure All country Rural Urban
Food market 5.19 5.88 1.04
Post office 18.81 21.20 4.64
All weather road 9.77 11.35 0.30
27 Wolday Amha and Eleni Garbe-Madhin, An Analysis of the Structure, Conduct and Performance of the Ethiopian Grain Market, paper presented at the Workshop on Harnessing Markets for Agricultural Growth in Ethiopia: Bridging the Opportunities and Challenges, Addis Ababa, Ethiopia, July 7-8, 2003. 28 Mulat Demeke, Ali Said and T.S. Jayne.1997. “Promoting fertilizer use in Ethiopia: The implication of improving Grain market performance, input market efficiency and farm management.” Working Paper 5, GMRP MEADac, Addis Ababa. 29 Mulat Demeke, Agricultural Technology Economic Viability and Poverty Alleviation in Ethiopia, a paper presented to the Agricultural Transformation Policy Workshop, Nairobi, Kenya.
18
Telephone booth 18.44 20.95 3.62
Milling house 3.74 4.31 0.32
Cooking fuel 1.49 1.66 0.43
Source: MOFED, 2002 Only 3 and 12 percent of the population have access to private and public tap water, respectively. Such safe water source is largely limited to urban areas: 81 percent in urban areas as opposed to just 5 percent in rural areas. The bulk of the rural population (81 %) depend on unprotected well/spring and river/lake/pond (Table 5). Table 5: Source of drinking water in rainy season by percent of population, 1999/00 Type of infrastructure All country Rural Urban
Private tap 3.14 0.23 21.16 Public tap 12.47 4.87 59.52 Protected well/spring 10.31 10.87 6.90 Unprotected well/spring 36.71 42.09 3.47 River/lake/pond 34.55 39.35 4.88 Others 2.82 2.60 4.07 Source: MOFED, 2002 e) Availability of agricultural credit system Farmers have no access to formal investment credit. With no land title to serve as collateral, in addition to the very small scale of operation, the banking sector is unwilling to extend long-term loans to farmers. Farmers have access to fertilizer loan only. Even though each farmer buys only a small quantity of these inputs (often one to two quintals commercial fertilizer and less than 50 kg of improved seeds), mobilizing the necessary cash outlay is a serious hurdle for most farmers. Indeed, the vast majority of farmers in Ethiopia (over 80%) buy fertilizer on credit. The
19
government strongly believes that fertilizer consumption and, thereby food production, would sharply decline unless farmers have access to credit. A similar view is expressed by many farmers who claim that they are short of cash to buy fertilizer after paying last year’s loans. Short-term fertilizer loans were made available through the government owned Development Bank of Ethiopia (DBE) until 1992. DBE sharply reduced its supply of fertilizer loans in the early 1990s as it faced widespread default. In 1994, the Commercial Bank of Ethiopia (CBE) became involved in the extension of fertilizer credit, but the same problem of enforcing repayment required a different approach. Since 1996, the responsibility of credit disbursement and collection has been transferred from the banks to the regional governments in the major fertilizer consuming regions. The regional governments estimate their fertilizer credit requirements and sign a loan agreement with the CBE. The money is then advanced through service cooperatives and farmer groups for payment to suppliers of fertilizer. A commonly applied administrative measure to enforce repayment is to require all members of a service cooperative or farmer group repay all previous loans before a new loan for the current season is approved. Fertilizer sales are suspended by local government officials even when the number of defaulters is small and when the reasons for default are legitimate (e.g. crop failure). Delays in fertilizer sales often result in delays of planting time. Credit allocation and collection procedures are based on ad-hoc and bureaucratic arrangements. It has been alleged by fertilizer dealers that this situation has allowed some local government authorities to direct input credit sales in favour of companies with affiliation to regional governments. In fact, all private importers and distributors withdrew from the fertilizer by 2001/02, citing lack of level playground as a major problem. The probability of loan default is very high because the loans are not secured against any asset or other means of enforcing repayment. The regional governments have been forced to allocate a substantial sum of money from their capital budgets for settling arrears. A transition to a more institutional system of credit administration has yet to be worked out. The time of loan repayment arrangement is also another problem area. Farmers are forced to pay their fertilizer loans immediately after harvest. Grain prices drop to very low levels since the grain market is congested by the oversupply immediately after harvest. The interest of farmers who are willing to incur additional costs by delaying crop sales cannot be accommodated under the existing arrangements. 1.1.4 Political preconditions a) Government Freedom/ Ability to Direct Agricultural Development
20
Sweeping political changes occurred in Ethiopia in 1974 when a group of military officers overthrew Emperor Haile Selassie. In a radical departure from the Kingdom’s market policy, the military rulers declared socialism as the official economic nd social policy. All but the smallest business and industries were nationalized. All land and agricultural and agricultural enterprises were brought under public ownership. A communist party under the name of Workers’ Party of Ethiopia (WPE) was inaugurated in 1985 and its members were given prominent positions in institutions at every level of the administration. Over 50 percent of the budget was used to finance the war against the opposition forces. One of the most radical steps taken in agriculture was the 1975 Rural Land Proclamation which outlawed all private ownership of land by individuals and organizations. The transfer of land by sale, lease or mortgage was declared illegal and anyone willing to farm was to be given land. The use of hired labor was disallowed and the maximum plot allocated to each farming household was set at 10 hectares. Most of the privately owned commercial farms were converted into state farms. Being capital-intensive large-scale operations, the state farms were expected to produce food for the urban population and cash crops for export (eg. sugar, coffee and cotton) and local industries. A number of parastatals and public agencies responsible for agricultural research, provision of credit, supply of agricultural inputs and marketing agricultural products were created to mange agricultural activities. In an attempt to transform the rural economy into a socialist mode of production and exchange, the former Government also initiated the formation of Producers Cooperatives based on the principle of collective ownership of all means of production and sharing of output based on labor contributions. In 1984, a Ten Year Perspective Plan was drawn to bring half of all farmland under collective farming by 1994. The bulk of the government expenditure in agriculture was directed to the collective and state farms under the Military government, although their share in the total output never exceeded 10 percent.30 The overthrow of the Marxist Government in May 1991 by the forces of the Ethiopian People’s Revolutionary Democratic Front (EPRDF) brought an end to the civil war and changed the socialist policy in agriculture. Smallholders were given the top priority and the remaining few state farms and parastatals were required to operate on their own without government subsidy. Political restructuring also gave rise to decentralization and a federal system of governance, which is built along ethnically based regions. Adopted in December 1994, the Ethiopian Constitution created a four-tier system of government in Ethiopia: the Federal Government, Regional Governments, Zonal and Wroeda (district) administrations. At the regional level, the country is divided into nine states and two special city administrations (Addis Ababa and Dire Dawa). These are further divided into zones (66), which are divided into woredas (550) and special woredas (6). Woredas have become the key units of local government and are further subdivided into kebeles (villages) to facilitate government administration and project implementation.
30 See for instance, Brune, S. 1990.‘The Agricultural Sector: Structure, Performance and Issues (1974-1988)’, in S. Pausewang, Fantu Cheru, S. Brune and Eshetu Chole (eds). Ethiopia: Rural Development Options, Zed Books Ltd., London and New Jersey.
21
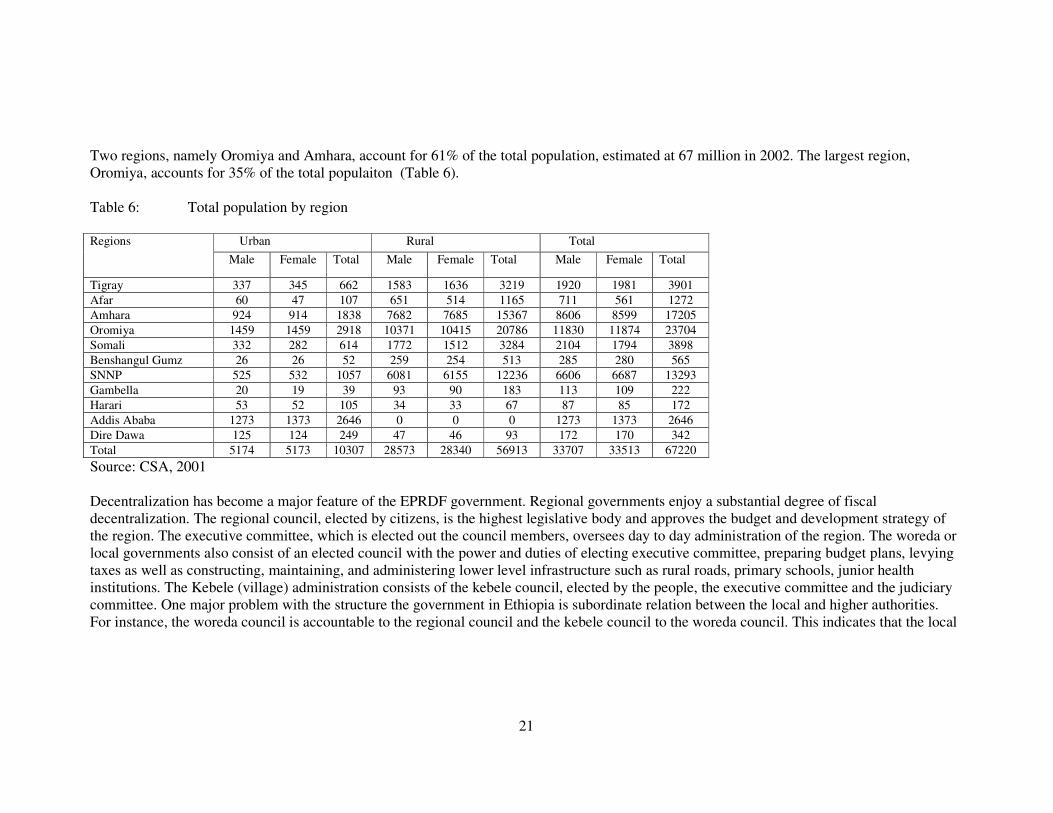
Two regions, namely Oromiya and Amhara, account for 61% of the total population, estimated at 67 million in 2002. The largest region, Oromiya, accounts for 35% of the total populaiton (Table 6). Table 6: Total population by region
Urban Rural Total Regions Male Female Total Male Female Total Male Female Total
Tigray 337 345 662 1583 1636 3219 1920 1981 3901 Afar 60 47 107 651 514 1165 711 561 1272 Amhara 924 914 1838 7682 7685 15367 8606 8599 17205 Oromiya 1459 1459 2918 10371 10415 20786 11830 11874 23704 Somali 332 282 614 1772 1512 3284 2104 1794 3898 Benshangul Gumz 26 26 52 259 254 513 285 280 565 SNNP 525 532 1057 6081 6155 12236 6606 6687 13293 Gambella 20 19 39 93 90 183 113 109 222 Harari 53 52 105 34 33 67 87 85 172 Addis Ababa 1273 1373 2646 0 0 0 1273 1373 2646 Dire Dawa 125 124 249 47 46 93 172 170 342 Total 5174 5173 10307 28573 28340 56913 33707 33513 67220 Source: CSA, 2001 Decentralization has become a major feature of the EPRDF government. Regional governments enjoy a substantial degree of fiscal decentralization. The regional council, elected by citizens, is the highest legislative body and approves the budget and development strategy of the region. The executive committee, which is elected out the council members, oversees day to day administration of the region. The woreda or local governments also consist of an elected council with the power and duties of electing executive committee, preparing budget plans, levying taxes as well as constructing, maintaining, and administering lower level infrastructure such as rural roads, primary schools, junior health institutions. The Kebele (village) administration consists of the kebele council, elected by the people, the executive committee and the judiciary committee. One major problem with the structure the government in Ethiopia is subordinate relation between the local and higher authorities. For instance, the woreda council is accountable to the regional council and the kebele council to the woreda council. This indicates that the local
22
government is fully autonomous. Though the local governments are popularly elected, devolution of power and resources from the central and intermediary (regional) level to the local units of government has not been a major feature of the decentralization process in Ethiopia.31 The 1995 Constitution legislates that the people have the right to full consultation and to the expression of views in the planning and implementation of economic and environmental projects. There are also councils at every level for participation by representation. However, community or popular participation has not been realized due to the absence or weakness of grassroots organizations and lack of an enabling environment. This is more clearly observed in the case of agricultural projects that are designed and implemented by government officials with little or no real participation of farmers. There are no independent grassroots organizations to ensure local participation and influence public policies and investment in agriculture. b) Role of Donors and Multilateral Organizations in Agriculture One common feature of all development activities in agriculture is dependence on donors for funding and technical assistance. The agricultural development projects implemented under the Imperial and the Military governments were mainly financed by donors. Financial and technical support from the Swedish International Development Authority (SIDA), International Development Association (IDA) of the World Bank and the USAID played a major part in the establishment and operation of the agricultural projects such as the Chilalo Agricultural Development Unit, CADU (later renamed Arssi Rural Development Unit, ARDU) and the Minimum Package Project of the late 1960s and early 1970s. The project under the name of Peasant Agricultural Development Program (PADEP), launched in the early 1980s with the aim of increasing food production and promoting service and producers cooperatives, was mainly financed by the World Bank, the International Fund for Agricultural Development (IFAD), SIDA and the Italian government. Within the framework of Agricultural Development Led Industrialization (ADLI), a new system of agricultural extension, known as the Participatory Demonstration and Training Extension System (PADETES), was launched in 1994/95 by the Federal Government. There are no donors financing PADETES, but the main source of foreign exchange for importing fertilizers, the main component of the package supplied to farmers, has come from IDA credit and grants from various bilateral donors. Over the last three years (1999 – 2001), fertilizer import has increasingly become dependent on loans, which accounted for 75 to 85% of the total import. The remaining balance was financed through bilateral donors that offer assistance on year to year basis. There was no foreign exchange
31 Tegegne Gebre Egziabher. 2001. Institutional Setting for Local Development Planning in Ethiopia: An Assessment and Evidences from the Amhara Region, Institute of Developing Economies, Japan External Trade Organization, No. 357.
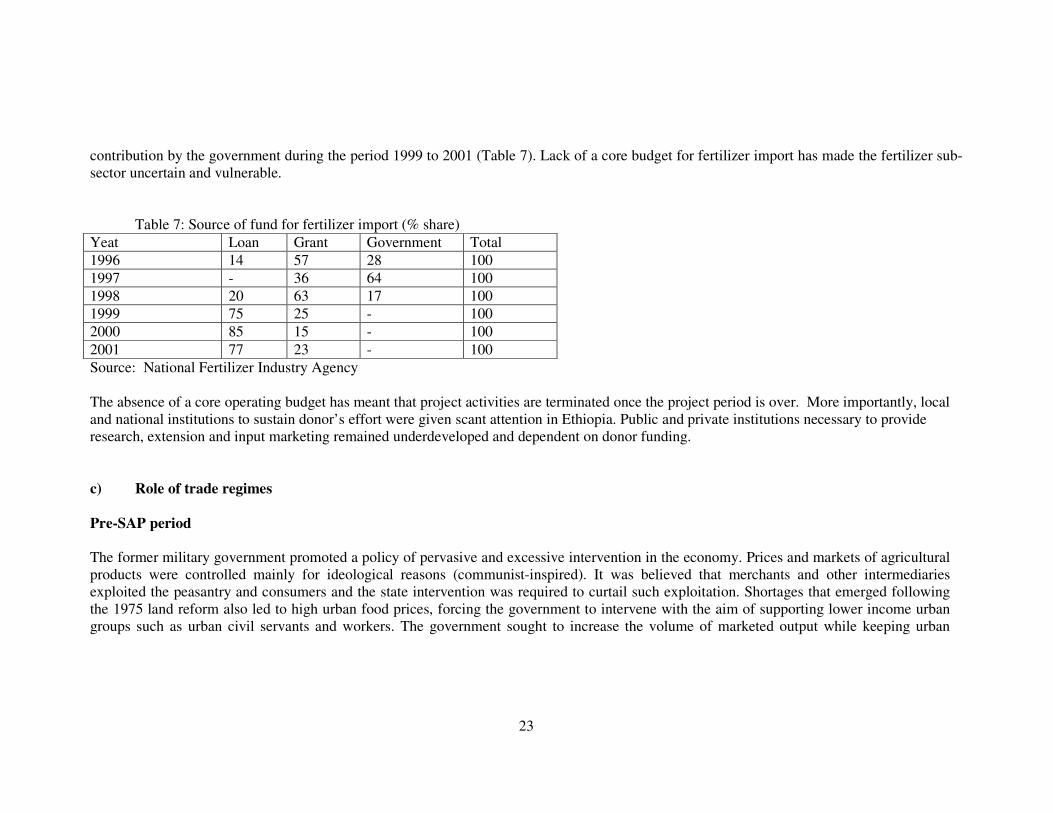
23
contribution by the government during the period 1999 to 2001 (Table 7). Lack of a core budget for fertilizer import has made the fertilizer sub-sector uncertain and vulnerable. Table 7: Source of fund for fertilizer import (% share) Yeat Loan Grant Government Total 1996 14 57 28 100 1997 - 36 64 100 1998 20 63 17 100 1999 75 25 - 100 2000 85 15 - 100 2001 77 23 - 100 Source: National Fertilizer Industry Agency The absence of a core operating budget has meant that project activities are terminated once the project period is over. More importantly, local and national institutions to sustain donor’s effort were given scant attention in Ethiopia. Public and private institutions necessary to provide research, extension and input marketing remained underdeveloped and dependent on donor funding. c) Role of trade regimes Pre-SAP period The former military government promoted a policy of pervasive and excessive intervention in the economy. Prices and markets of agricultural products were controlled mainly for ideological reasons (communist-inspired). It was believed that merchants and other intermediaries exploited the peasantry and consumers and the state intervention was required to curtail such exploitation. Shortages that emerged following the 1975 land reform also led to high urban food prices, forcing the government to intervene with the aim of supporting lower income urban groups such as urban civil servants and workers. The government sought to increase the volume of marketed output while keeping urban

24
prices low through establishing state farms and imposing forced delivery of cereals by farmers to a parastatal grain-marketing agency known as Agricultural Marketing Corporation (AMC). Administrative controls were also extended to the exchange rates under the former government. The official exchange rate of the Ethiopian Birr was kept fixed at Birr 2.07 to the US dollar between February 1973 and October 1992. This gave rise to a growing illicit market for foreign exchange and a parallel exchange rate that was two to three times the official rate.32 The overvaluation of the Birr had serious repercussions on the economy. Domestic consumers and industries competed for exportable products by paying more attractive prices. The government responded by restricting the domestic trade of exportables like coffee. Private sector participation was restricted and the procurement and exportation of a large proportion of export commodities was handled by state trading enterprises. However, the overvaluation and mismanagement resulted in considerable losses and the authorities resorted to subsidizing the loss of state enterprises. Exports of coffee, livestock, oilseeds and pulses, leather, fruits and vegetables, textiles and clothing had all received export subsidies, which in the year 1982/83 to 1989/90 amounted to Birr 71 million out of which Birr 34 million was paid to subsidizing coffee farmers.33 Reduced profitability of legal exports had also contributed to the expansion of illegal export. The illegal export trade involved coffee, gold, livestock, fruits, vegetables and chat. It was estimated that about 225,000 heads of cattle, 750,000 goats and sheep and 100,000 camels were illegally exported annually by traders and pastoralists to Djibouti, Somalia, Kenya and Sudan. Moreover, about 8,000 kg of chat per day was exported illegally to Djibouti and Somalia. Although there are no reliable estimates of smuggled exports, some sources believe that coffee and livestock alone amount to Birr 258 million (US$ 125 million) per annum. This was about 45 percent of the official exports in 1990/9134. Foreign exchange rationing became the order of the day as the supply of foreign exchange fell short of the demand at the overvalued official exchange rate. The government relied heavily on import restrictions like quotas, surcharges on imports and exchange control, instead of adjusting the overvalued exchange rate. In fact, the government never considered the exchange rate as a major instrument for economic
32 Sintayehu W/ Michael. 1996. The effect of devaluation on major macroeconomic variables (The Ethiopian case), Addis Ababa University, Department of Economics, M.Sc thesis (unpublished). 33 Gashaw Dagnew. 1992. ‘Exchange Rate Policy in Ethiopia: An Agenda for Action’ Ethiopian Journal of Economics, Vol 1, No 1 (pp 71-98). 34 Gashaw Dagnew. 1992, op cit.
25
management. This had led the private sector to undercut the system by over-invoicing imports, under-invoicing exports and by resorting to illegal imports. Private capital in export and import sectors was replaced by state-owned export and import enterprises. The regime tried to diversify trade by encouraging state-trading enterprises within the framework of centrally planned system of economic management. In addition, export production was discriminated against through direct taxes, price controls and the monopolistic power given to public marketing enterprises. For instance, the state had monopolistic power in coffee distribution for domestic markets and accounted for over 80 percent of sun dried coffee exports. Administrative control of markets and Overvaluation of the local currency reduced the incentive of farmers to produce. Officially fixed prices fell below cost of production, preventing producers of food grain from fertilizer and improved seeds to expand production. Peasants were obliged to dispose of their produce at very low prices to fulfill various obligations. The policy of extracting surplus from agriculture left farmers with little or no investment resources35. Many farmers had to sell their assets to meet the grain quota. Coffee producers were seriously affected not only by the overvaluation but also by the high taxes imposed on coffee. Coffee exports were subjected to payment of export duties, a surtax and cess.36 Farmers had to cut their coffee trees in order to plant maize and other food crops to meet their subsistence needs. Post-1991 trade regime (SAP period) An economic reform program was initiated in 1991, which took the form of Structural Adjustment Program (SAP) under the auspices of the World Bank and IMF. As part of the concerted effort to liberalize the trade sector, a series of trade-related measures have been introduced. Among the major reform measures are reorganization of wholesale trading corporations and other public enterprises with a wide managerial autonomy, privatization of all state owned retail trade shops and stores, elimination of price controls of all products except prices of petroleum and petroleum products, and abolition of administrative and bureaucratic bottlenecks associated with the registration and issuance of trade license with a view to drastically simplify the provision of export and import trade licenses. All restrictions on grain marketing by private traders were removed.
35 See also Befekadu Degefe and Tesfaye Tafesse, ‘The Marketing and Pricing of Agricultural Products in Ethiopia’ in S. Pausewang, Fantu Chole, Stefan Brune and Eshetu Chole (eds), Ethiopia: Rural Development Options, Zed Books Ltd, London, 1990. 36 Eshetu Chole, ‘Agricultural Surplus Extraction: The Ethiopian Experience’, in in S. Pausewang, Fantu Chole, Stefan Brune and Eshetu Chole (eds), Ethiopia: Rural Development Options, Zed Books Ltd, London, 1990.
26
Another crucial reform measure was the devaluation of the national currency (the Birr) in 1992. The devaluation of September 1992 resulted in an exchange rate of Birr 5 for a US dollar, i.e. the Birr was devalued by about 58.6 percent. The administrative foreign exchange allocation was also replaced by an auction system. Since May 1993, the National Bank of Ethiopia has made foreign exchange available to licensed importers through a bi-weekly auction. The frequency of the auction has increased to weekly appearance. According to the Foreign Exchange Auction Regulation, holders of valid import licenses, public industries, enterprises and organizations as well as commercial banks are eligible for the auction. The commercial banks can now engage in retail trading of foreign exchange obtained through participation in the auction held by the National Bank. The exchange rate of the national currency against the US Dollar is thus determined by the daily auction undertaken between the commercial banks in order to encourage production for exports as well as properly manage the extent of imports. This system is considered as a transition from a fixed to a free-floating exchange rate system.
The depreciation of the real exchange rate is expected to encourage exports by raising payment for exports in terms of the national currency. It is also expected to discourage imports by keeping the payments for imports higher. While exerting a positive impact on the balance of payments by stimulating exports and restraining imports, devaluation also influences the cost of living, the government budget and production. Increasing prices of essential import goods, such as fertilizer, fuel and certain basic consumer goods consequent upon the devaluation may put extra cost on the economy. All taxes and subsidies on exports are eliminated and state exporting enterprises are required to participate competitively. In this connection, the monopoly position of the Ethiopian Coffee Marketing Corporation (ECMC) has ended as private exporters were allowed to operate alongside the ECMC. The number of coffee exporters as well as private traders and transporters has increased, providing the basis for greater competition in the various stages of the coffee marketing process. Trade support institutions have also been established as part of the reform measures. In order to alleviate problems faced in information about international markets, the Ethiopian Export Promotion Agency has been established. The Agency renders different professional supports, such as training and information services to exporters, conducts studies on exportable products, disseminate and provide trade information to exporters and foreign importers. It links Ethiopian exporters with foreign importers by undertaking promotional activities using modern communication techniques. In recognition of the importance of live animals, animal products and by-products, the government has established the Livestock Marketing Authority with the objective of promoting and expanding the domestic and export markets. The other important reform measure related to the
27
livestock sub-sector is the establishment of the Leather and Leather Products Technology Institute with the objective of producing trained manpower for the sub-sector. Substantial liberalization of the exchange and trade system has already been undertaken, driven by the aim of integrating to the global and regional markets. Import tariffs have been reduced from the maximum rate of 230% to 40%. The current tariff rate ranges from 0 to 40%. There are seven brackets for customs duty rates, namely 0, 5, 10, 15, 20, 30 and 40. It should be noted that the average highest tariff rate in least-developed countries is 30% and most of them have applied a value added tax (VAT) ranging from 12 to 17%. The SAP reforms in the 1990s moved beyond stabilization to structural reforms, focusing on the agricultural sector. Aggressive efforts were made to increase the use fertilizer and agricultural growth rates did improve. However, the terms of trade for grain producers worsened with increase in fertilizer prices (due to devaluation and removal of subsidies) but declining grain prices. For instance, maize producers had to sell 123 kg of maize to buy 100 kg of DAP (Diamonium Phosphate) fertilizer in 1992. By 2001, farmers were forced to 820 kg of maize the same amount of DAP.37 Output marketing in Ethiopia suffers from a number of constraints, including inadequate transport network, limited number of large-interregnal traders with adequate storage and working capital, high handling costs, inadequate market information system, weak bargaining power, and underdeveloped processing industrial sector. Coffee producers benefited following the reforms and devaluation measures of the government. But the general market environment has changed radically in the late 1990s with large increase in Brazilian and Vietnamese export. A global oversupply has depressed prices, estimated to be the lowest in real terms for over 50 years. This has brought a sharp increase in rural poverty.38 Drought and the border conflict with Eritrea have also exacted a heavy economic toll during the SAP period. Drought in 1993/94, 1997/98 and 1999/00 reduced output sharply. The outbreak border conflict with Eritrea in May 1998 reduced donor support and undermined investor confidence, but more importantly, increased defence expenditure.39 The government resumed its economic reform after the war and sought assistance from donors, but the severe drought in 2002/03 constrained the recovery.
37 Development Studies Associates, Fertilizer Marketing and Credit, National Fertilizer Industry Agency, Consultancy Report, December 2001 38 J. Schluter, A Study of the Coffee Market and Proposal for a Forward Auction and Coffee Exchange, for IFPRI/ IFAD Project, paper presented at the Workshop on Harnessing Markets for Agricultural Growth in Ethiopia: Bridging the Opportunities and Challenges, 7-8 July, 2003, ILRI, Addis Ababa. 39 Defence expenditure shot up to 13.2 percent in 2000, resulting in sharp cuts in capital expenditure. See for instance, World Bank, Memorandum of the President of the International Development Association to the Executive Directors on a country Assistance Strategy for the Federal Democratic Republic of Ethiopia, March 24, 2003.
28
Post-SAP period In July 2002, the Government finalized its Sustainable Development and Poverty Reduction Program (SDPRP). The SDPRP included a broad range of institutional and structural reforms to accelerate the pace of growth, to distribute the gains to poor people. Apart from the drought, the HIV/AIDS pandemic poses a threat to poverty reduction. Success in the post-SAP period is also made very difficult owing to the failure to find a lasting solution environmental degradation.
d) Role of nationalism and other ideological factors The Imperial government of Emperor Haile Sellassie was concerned with the consolidation of power at both the central and provincial levels. But the Emperor had the final power on important legal and administrative issues. The ideology behind this absolute power is the traditional belief in the ‘Divine Rule’ of Kings. A systematic campaign fostered cult of personality that elevated the Emperor to superhuman heights. Only the wealthy feudal lords had influence in the Kingdom, despite the drive towards instituting a modern civil service. Haile Sellasie’s political vision was the creation of a semi-modern centralized state. Modern institutions of the western style were grafted on a traditional system of rule. District administrators (appointed by the government) were assisted by traditional chiefs. Attempts were made to develop modernize agriculture through assisting large landowners to develop into commercial farmers, leading to eviction and uncertain conditions for tenants. Limited public resources for development of smallholder agriculture, together with lack of participatory system of governance, contributed to the weak rural sector that culminated in the 1973/74 famine. The King was finally accused of policies that favored only the few wealthy aristocrat and extravagant expenditure on his birthday celebration when thousands of people were dying of famine in Wollo. Support for the King and its government was declined sharply among the progressive groups, especially the educated and students who wanted a more rapid and pro-poor growth in rural areas. One of the most popular slogans used in the campaign against the Kingdom was ‘Land to the tiller’. Failure to win the trust of the intellectuals, together with the emergence of underground opposition movements, meant that the government was unable to rally the public behind its leadership or foster a s strong sense of nationalism for development. The famous Ethiopian historian, Bahru40 wrote:
… the regime had two cardinal failings. These were its failure to liberalize administration and to exert even the minimum effort to initiate land reform. It was unable to guarantee democratic rights or tolerate a genuinely legislative parliament and a prime minister who
40 Bahru Zewdie, ‘What did we drea? What did we achieve? And where are we heading?’ Economic Focus, Vol. 5, No. 3, June 2003.
29
could form and lead his cabinet. In short, it was unable to introduce constitutional monarchy of the British or Scandinavian model, it passed away unable even to regulate tenancy, let alone entertain fundamental land reform.
It was mainly this undemocratic nature of the regime that triggered a revolution that resulted in coup d'état in 1974 by a group of military officers, later named as the Derge. The 1974 Revolution ended any reference to divinity in relation to government. The 1975 Land Reform Proclamation ended private ownership and allowed resident farmers only usufruct right over the land they cultivate. But the decree to satisfy the popular demand was quickly followed by a communism-inspired political and economic restructuring. Small farmers were forced to supply the fruits of their labor to an encompassing and insatiable state, instead of the feudal lords. The Ethiopian revolution had been linked to the personality of Mengistu Haile Mariam who assumed absolute power through systematic execution of all his opponents. Thousands of the regime’s opponents were brutally murdered on the streets through a campaign known as Red Terror.41 Government officials were given the power to suppress any resistance in the name of a Marxist-Leninist ideology and a party, later named as the Workers’ Party of Ethiopia. The dictatorship forced most of the educated people to flee for their life as refugees in America and Europe. All forms of independent associations and collective efforts ceased to exist and the best survival strategy became passive compliance with the unpopular policies of the Government. Different types of rural institutions such as service cooperatives, collective producers, peasant associations, women and youth associations were created with the main goal of controlling and extracting the surplus generated by the peasant community. Private incentives and initiatives were stifled with serious consequences for the economy in general and agriculture in particular. The economy collapsed completely when the country faced a catastrophic famine that resulted in the death of about 1 million people in 1984/85. Communist policies failed to generate economic growth. Recovery was sought through increased use of modern inputs and resettlement of people affected by drought. However, the massive program of resettling farmers in more moist areas was carried without adequate planning and against the will of the settlers and without the consent of the community in the receiving areas. Armed resistance intensified and rebels fighting for cessation in Eritrea made considerable advances in the late 1990s. Farmers in rebel areas fought against the government. Because of the oppressive political and economic environment, there was very little consensus, unity or strong nationalism behind the actions of the government. By the early 1990s, government priorities shifted from food security and development to unsuccessful fight for survival. With the fall of the Derge in May 1991, the Transitional Government of Ethiopia took over and declared a multi-party democracy, decentralization and liberalization. The right to form political parties and the right of nationalities to administer their own affairs was recognized. The political system was reorganized as a Federal Government with nine self-governing ethno-linguistic regional states and two autonomous city administrations. The constitution recognizes ‘self-determination including cessation’ for regions organized along language and cultural lines. 41 Bahru Zewde. 2002. A History of Modern Ethiopia: 1855 – 1991, Second Edition. Addis Ababa University Press, Addis Ababa.
30
With its origin in regional and ethnic-based movement and promise to fight Amhara-dominated central government, the government seems to have no choice but grant local and regional independence. To some the government policy is viewed as an attempt to address the ethnic divisions that have bedeviled Ethiopia for much of its history. For others, including many political groups, ethnically and regionally based representation is emphasized, thus risking the danger of encouraging differences and of excluding other bases for political formation and action from the legitimate stage of national politics. Ethnicization is viewed not only as undemocratic but also as a major impediment to mobility of labor and capital. It is also argued that Ethiopia is coalesced historically as a multiethnic nation. According to this vision, there was always substantial blurring of the lines between different ethnic groups, including intermarriage and participation of non-Amhara groups in the Amhara-dominated governments. Views about democratic governance are also polarized. Opposition parties operate in the capital city and a few other major towns only, with almost no presence in rural areas. Over 95% of the seats in the parliament are controlled by the ruling party, Ethiopian Peoples Revolutionary Democratic Forces (EPRDF). The war with Eritrea and continued armed insurgency by the Oromo Liberation Front and the Ogaden Liberation Front has further complicated the tension between nationalism and federalism. Although markets were liberalized and many state enterprises were privatized, the peasant has been denied legal ownership of his land. By retaining the same policy of public ownership of land, tenure insecurity was allowed to continue with negative implications for conservation and investment on land. The slow process of democratization and the sense domination by the ruling party, together with the ethnic politics, have not produced a unifying national policy and ideal. Many government offices are staffed by loyalists and non-professionals. Indeed, the absence of a unifying vision has created a major rift among competing intellectuals and politicians of the country. One of the major outcomes of such polarized vision has been the growing tendency (among the best educated people of the country) to leave the country. The cost of massive brain drain is clearly manifested in weak human capacity at every level of government bureaucracy. Failure to reverse the worsening problem of food security could also be linked to inadequate capacity in formulating an effective strategy. The challenge now is to find a unifying national ideal after the monarch and later Marxism ideas that cut across ethnicity failed to survive.42 1.1.5 Community Organizations and Institutions
42 William Easterly. 2002. Growth in Ethiopia: Retrospect and Prospect, Center for Global Development Institute for International Economics, April (unpublished memo).
31
Community organizations and institutions are vital in promoting people’s participation for provision of services and resources for human development, improving resource allocation and for ensuring effective public service delivery. Grassroots institutions have proved to be the most effective partners in the fight against poverty. Grassroots organizations in Ethiopia can be grouped into five categories. These are: i) interest group institutions which refer to associations and unions; ii) cooperative movements; iii) indigenous organizations and self-help groups which refer to traditional solidarity groups and saving and credit groups; iv) development associations are community or region based associations that are organized to undertake development activities in their respective communities; and v) advocacy groups which consist of institutions committed to protection of civil rights, the environment, wildlife, etc. a) Interest groups Peasant associations (PAs) are by far the most important and widespread forms of peasant/farmers organizations in the countryside. They were introduced by the former Military government as part of the 1975 rural land reform. PAs were established primarily to distribute land and they were very effective in mobilizing peasant support for the land reform proclamation. Subsequent legislations expanded the powers and functions of PAs to include self-administration, protection of public property, rendering judicial services, building schools and clinics, establishing cooperatives. Each PA was organized on an area of about 800 hectares and included about 300 household members residing permanently within the specified boundaries. By 1989/90, there were 23,506 PAs and 7,049,209 members. At the beginning, PAs operated independently with democratically elected leaders. The freedom and independence gradually faded away as government authorities took control of the PAs and made them part of the administrative and bureaucracy and political party manipulations. Elections for leadership were carefully controlled and candidates were often hand-picked. The most important consideration for election became party affiliation and leaders were made accountable to the political cadres rather than the electorate.43 PAs lost their popular support with their involvement of PAs in the implementation of unpopular policies such as delivery of grain quota to the parastatal Agricultural Marketing Corporation, resettlement and villagization, and collection of various contributions and taxes.
43 Yigremew Adal. 2000. ‘Necessity and Neglect: Local Organizations and Rural Development in Ethiopia’, in Alemu Mekonnen and Dejene Aredo (eds), Institutions, Resources and Development in Ethiopia, Proceedings of the Ninth Annual Conference on the Ethiopian Economy, Oct. 8-9, 1999, Addis Ababa, Ethiopia.
32
Peasant associations have continued to serve as the lowest administrative unit and focal point for delivering public services since 1991. Constitutionally, woredas (districts) are the lowest level of elected, full-time government (covering roughly 100,000) people) are the most important unit of sub-national government. But communities within each woreda organize themselves into peasant associations and urban resident associations to enhance grassroots participation in the formulation and administration of policy decisions. Each association has a development committee headed by the association’s chairperson. But there is no clear understanding of their role and function in relation to the woreda council. Shortage of fund and lack of capacity have made many PAs dysfunctional.44 Under the newly re-organized system, a PA or a kebele administration could consist of up to 1000 households (two or three PAs have been merged to form one large PA). Farmers, women and youth in rural areas have never been able to organize their own independent association to protect to protect their rights and interests. Trade, teachers and student unions as well as business associations in urban came into being and operated under a generally unfavorable political environment where independent associations and organizations outside the tutelage and control of the state were viewed with suspicion. The Military government violently smashed any attempt of the unions to maintain independence. It purged their leaders in the late 1970s and replaced them with those that were zealous supporters of the government and its ideology.45 It also created national associations such as the Revolutionary Ethiopia Farmers Association (REFA), Revolutionary Ethiopia Youth Association (REYA), and Revolutionary Ethiopia Women’s Association (REWA) to serve as an instrument for its policy of control and suppression. The present government came to power in 1991 with a promise of democratic freedom and multi-party politics. Nonetheless, it has been equally unwilling to tolerate independent unions or associations. According to Dessalegn46, ‘its favored tactic since the early 1990s has been to force a split in trade unions considered hostile to its policies and then give its support in favor of leaders friendly to it. On occasion, independent minded leaders have been harassed, thrown in jail on trumped up charges, or forced to flee the country’. One of the major reasons for lack of sustained development in Ethiopia is lack of adequate mechanism to articulate the interest of peasants and ensure their active participation in planning and execution of development projects. Independent farmers’ unions, interest groups, union of wageworkers and associations/network of craft workers have never been part of the rural life. In the absence of civic organisations to protect
44 Meheret Aynew. 2002. Decentralization in Ethiopia: Two case studies on devolution of power and responsibilities of local government authorities, in Bahru Zewde and S. Pausewang (eds), Ethiopia: the Challenge of Democracy from below, Stockholm, Sweden. 45 See for instance, Taketel Abebe. 2000. ‘Civil Society: Some Theoretical and Conceptual Issues’ in Alemu Mekonnen and Dejene Aredo (eds), op cit.; Dessalegn Rahmato. 2002. ‘Civil Society Organizations in Ethiopia’ in Bahru Zewde and S. Pausewang (eds), op cit. 46 Dessalegn Rahmato. 2002. ‘Civil Society Organizations in Ethiopia’ in Bahru Zewde and S. Pausewang (eds), op cit.
33
their interest, interactions with public officials have placed a large burden on poor people. They are unable to take advantage of new economic opportunities or engage in activities outside their immediate zone of security, i.e. subsistence farming47. b) Cooperatives Cooperative movements in Ethiopia started in the late 1960s with the launching of the comprehensive agricultural development projects such as the Chilalo Agricultural Development Unit (CADU). However, a nation-wide large scale movement service cooperates started only after the 1975 land reform and the formation of Peasant Associations (PAs). A service cooperative was formed as a joint association of two or more PAs to buy and sell consumer goods and farm inputs to members. By 1990, there were 3,233 service cooperatives with 3,571,738 members and about 210.7 million birr capital (USD 1 = Birr 2.07 in 1990).48 The services provided included input and output marketing, distribution of basic goods and development of infrastructure. However, the cooperatives failed to survive the collapse of the Military government: they were largely viewed as the creation of the Government with no genuine and voluntary participation by the farmers themselves. There was no direct participation by farmers and the cooperatives were managed by individuals with close association with the ruling party. The service cooperatives served as an instrument to impose and collect grain quota from farmers for the government. The present Government, which was not very sympathetic to cooperatives initiated by the former government, issued a proclamation in 1995 to reactivate cooperative movement in the country. Member-led co-operatives are thought to be necessary to reduce transaction costs and enhance the bargaining position small farmer. A new proclamation was issued in 1998 to provide a better policy framework to set up cooperatives based on an individual membership and voluntary basis. Members buy shares to become members and receive dividends at the end of the year depending on their contributions (value of their shares) and profit earned. The Cooperative Promotion Office has been established in every woreda (district) to provide technical assistance. Cooperative societies now provide a wide range of services, including the supply of inputs, output marketing and distribute consumer goods. But bad experiences in the past, insufficient capital, lack of managerial skills and inadequate support from cooperative promotion bureaus/offices have not helped the cooperative movement.49
47 Mulat Demeke. 2001. Off-farm income generation opportunities in Ethiopia: with particular reference to food-insecure woredas, Department of Economics, Addis Ababa University, unpublished report. 48 Yigremew Adal. 2000. ‘Necessity and Neglect: Local Organizations and Rural Development’ in Alemu Mekonnen and Dejene Aredo (eds), Institutions, Resources and Development in Ethiopia, Proceedings of the Ninth Annual Conference on the Ethiopian Economy, Oct. 8-9, 1999, Addis Ababa, Ethiopia. 49 Dessalegn Rahmato. 2002. ‘Civil Society Organizations in Ethiopia’ in Bahru Zewde and S. Pausewang (eds), op cit.
34
c) Indigenous organizations and self-help groups There are different types of indigenous rural organizations in Ethiopia. Some are socio-religious and self-help groups established with the aim of providing financial and labor assistance to members facing socio-economic problems such as the death of a family member or a relative. For instance, iddir has become a popular burial association in both rural and urban areas. Other indigenous institutions are formed on a temporary basis to exchange labor during peak seasons. Community-based organizations in Ethiopia have served as sources of social cohesion and solidarity. They set norm which can easily lend itself to conflict resolution and foster cooperation. There are also traditional saving and credit association known as iqub. Each members regularly contributes a specified sum of money and the collected sum is given to one of the members in each round. Despite their potential, indigenous organizations and self-help groups have rarely been involved in local development and government led development initiatives. The institutions are sometimes viewed as a threat to formal associations and cooperatives organized by the government.50 There has never been any deliberate effort to strengthen the community based organizations.51 Policies in agriculture are formulated and implemented with no real participation of the real stakeholders. d) Development Associations Development associations are of two types: those that are closely related to the ruling party and those that operate independently. The former are established recently and region-based organizations. The oldest of these is the Tigray Development Association (TDA) originally established during the civil war with the objective of development and rehabilitation activities. The rest have come into being after 1991 and at present the major ones, in addition to TDA, are the Amhara Development Association (ADA), the Oromo Development Association (ODA) and the Southern Ethiopia Peoples Development Association (SEPDA). In most cases, the initiation to establish the associations has come from government or party officials. They are supported as a means of enhancing public participation in government development programs. Funds are drawn from member contributions and various fund raising campaigns conducted at national, regional and local levels. Financial assistance is also obtained from government and international donors. The main task performed by these associations has been the provision of social and
50 Tegegne Gebre Egziabher. 2001. Institutional Setting for Local Development Planning in Ethiopia: An Assessment and Evidences from the Amhara Region, Institute of Developing Economies, Japan External Trade Organization, No. 357. 51 Yigremew Adal. 2000. ‘Necessity and Neglect: Local Organizations and Rural Development in Ethiopia’, in Alemu Mekonnen and Dejene Aredo (eds), Institutions, Resources and Development in Ethiopia, Proceedings of the Ninth Annual Conference on the Ethiopian Economy, Oct. 8-9, 1999, Addis Ababa, Ethiopia.

35
physical and infrastructure such as schools, clinics, rural water supply, roads, bridges, etc. The organizational structure, which closely follows the government structure, is less flexible and the leadership is closely associated with the government.52 In spite of the positive contributions, there is a widespread perception that the associations are essentially state-controlled and, in some cases, prone to nepotism and corruption. The number of development associations operating independently is very limited. The best known example is the Guraghe Road Construction Association that was able to mobilize members of the Guraghe ethnic group for the construction of major road systems in the 1960s and 1970s. A few other associations were established by people residing in Addis Ababa and other major towns to support and finance road construction in the rural villages they have originally come from. The government lust for controlling and regulating independent activities has discouraged the emergence and expansion of such associations53. e) Advocacy groups Advocacy organizations were unthinkable under the former government as it never tolerated voluntary organizations. At the end of 1999, there were about a dozen rights-based advocacy groups in the country, mainly based in the capital Addis Ababa. But many of these were small, with little or no experience in effective advocacy. Critical social and economic issues such as the massive environmental degradation posing a major threat to the country’s development and the extreme poverty have yet to attract institutional advocates. The two most prominent advocacy organizations are the Ethiopian Human Rights Council (EHRCO) and the Ethiopian Women Lawyers Association (EWLA). EWLA attempts to defend women’s right through the legal system and provides legal aid to women, while EHRCO monitors human rights violations and disseminates its findings to the public through periodic reports. Both are membership organizations committed to promoting the rule of law. But the size and organizational strength of these institutions is very small, with limited presence in countryside where the bulk of the population resides.54 f) Women in Development
52 Tegegne Gebre Egziabher. Op cit. 53 Kassahun Berhanu. 2002. ‘The Role of NGOs in Promoting Democratic Values: the Ethiopian Experience’ in Bahru Zewde and S. Pausewang (eds), Ethiopia: the Challenge of Democracy from Below, Stockholm, Sweden. 54 Dessalegn Rahmato. 2002. ‘Civil Society Organizations in Ethiopia’ in Bahru Zewde and S. Pausewang (eds), op cit.
36
Women are responsible for all household chores in Ethiopia. Fetching water, colleting firewood, milling and processing grain, and cooking food take most of women’s time in rural areas. Together with the task of assisting in farm work and livestock tending, rural women work 15-18 hours a day. Women have little time to access training or skill-enhancement opportunities. Being more disadvantaged in access to economic resources and subject to greater cultural taboos and restrictions, women disproportionately bear the burden of poverty. Conditions are particularly worse for female-headed households, which account for 21.3% of the total households in rural areas.55 Widowed or divorced women in rural areas face the extra burden of managing the farm while undertaking all household chores. The condition of Ethiopian women particularly bad before 1974. They were subjected to all kinds of injustice: they were not allowed to participate in decision-making in any affairs of the state, and suffered from societal-based male domination. The 1955 constitution of the Imperial government reaffirmed the status of women as second-class citizens. Traditional practices also restricted women from attending school and they were confined to kitchen work. There were no women associations for the protection of women’s interest. The Military government that overthrew the Imperial government in 1974 suspended the 1955 constitution and declared the National Democratic Revolution (NDR) program. The program put women on the agenda and stated that ‘there shall not be any discrimination among religion and sexes. No citizen shall be accorded special privileges in his/her political, economic and social undertaking on the basis of religion and sex’. The Revolutionary Ethiopia Women’s Association (REWA) was established by Proclamation No. 188/1980 on July 17, 1980, to voice the interests and needs of females in all spheres of their lives. In 1987, the Military government declared the Constitution of the Peoples Democratic Republic of Ethiopia (PDRE) which reiterated the equality of men and women. The state committed itself to provide women with special support so that they may participate in political, economic, social and cultural affairs on an equal basis with men. Women were able to go to meetings, speak in public, cast their votes and be elected. However, these rights were only on paper, since the then ruling party manipulated all votes and determined which person would occupy which public office.56
55 CSA and ORC Macro, Ethiopia: Demographic and Health Survey 2000, May 2001. 56 See for instance, Befakdu Zeleke. 2001. ‘Promoting Women’s Participation in Public Policy Development in Ethiopia’, in Berhanu Mengustu and E. Vogel (eds.), International Conference on Public Management, Policy and Development, Proceedings on Governance and Sustainable Development: Promoting Collaborative Partnership, Addis Ababa, Ethiopia. See also Meseret Argaw. 2001. Empowerment of Women in Public Policy Making’ in Berhanu Mengustu and E. Vogel (eds), Ibid.
37
Women’s representation at local level in rural areas under the socialist government was achieved through women’s associations that were established as wings of the peasant associations. But these were viewed as tools for levying large fees for which members did not receive adequate benefits, hence women’s associations fell into disrepute and collapsed following the overthrow of the government in May 1991.57 Soon after the downfall of the Military government, the Transitional Government of Ethiopia committed itself to equitable socio-economic development of women by announcing the National Policy on Women in 1993. The policy aims to encourage the equitable participation of women in the political, social, and economic life of the country and outlines the government’s strategy for addressing existing economic and social constraints. It also aims to institutionalize the political, economic and social rights of women by creating appropriate structure in government offices and institutions so that public policies and interventions are gender-sensitive and can ensure equitable development for all Ethiopians. The 1995 Constitution of the Federal Democratic Republic of Ethiopia (FDRE) has tried to include women as an integral part of the body politic. Article 35 of the Constitution stated that ‘Women shall, in the enjoyment of rights and protections provided for by this Constitution, have equal rights with men’. Women are accorded equality in acquisition and management of property, including land, and equal participation in policy decision-making. The Women’s Affairs section of the Prime Minister Office was made responsible for the coordination, facilitation and monitoring of women’s activities at the national level. In accordance with the policy of decentralization, the regions have established Women’s Affairs Bureaus, placed in the Regional President’s Office, and a focal point in some of the zonal offices. Despite the commitment to equitable public policy, interventions aimed at improving the conditions of women largely consist of ad hoc and unconnected self-standing projects, with standard processes for the delivery of services. The lack of institutional capacity at all levels, particularly at the woreda (district) and kebele (village) levels, poses one of the biggest challenges to the effective implementation of women’s policy. Formal institutions like cooperatives and kebele associations are the major vehicles for delivering development assistance (such as extension services, distribution of seeds and fertilizers, credit, and training), but women (with the exception of those heading households – female heads) do not participate in such institutions. Women participate in grassroots and indigenous entities, like idirs, iqubs and other interest groups, but these are rarely involved in the delivery of assistance.58
57 Women’s Affairs Office and The World Bank. 1998. Implementing the Ethiopian National Policy for Women: Institutional and Regulatory Issues, Washington D C. 58 Women’s Affairs Office and The World Bank. 1998. Implementing the Ethiopian National Policy for Women: Institutional and Regulatory Issues, Washington D C.
38
Formal legislative provisions are intended to allocate economic resources equitably within the household. However, customary laws and practices are patriarchal and significantly constrain women’s access to resources both within and outside the home. For instance, land is managed and administered at the kebele level by local officials that operate with traditional gender biases, in spite of the regulations that are gender-sensitive. The problem is compounded by the absence of women’s grassroots groups, due to both past experience under the former regime and cultural factors. Women have no organization to build consensus against customary practices that restrict women’s access to economic resources. The only exception is the Tigray Women’s Association which was established during the civil war as a voluntary association with the objective of attaining political, social and economic development of women. The Association had 420,000 members in the region by the year 2000. Although the leaders are often senior officials the ruling party, the Association has been actively involved in political, social and economic programs affecting women in the region. High rate of illiteracy is among the factors that prevented participation of women in development activities and allowed the continuation of patriarchal practices and domination by men. About 80 percent of the adult women in the country are illiterate, compared to 60 percent illiteracy rate among men. Illiteracy among rural women is as high as 89 percent, making it almost impossible to use literacy as vehicle to change old traditions and deliver public services.59 Women in rural areas have also suffered as a result of limited access to public services. Schools and health services are inaccessible in most parts of the rural areas, and this has more severely affected women than men: school enrolment among females has remained lower and child and maternal mortality higher. The majority of rural women have no access to safe water and fetching water consumes much of their daily labor time. With no access to electricity or other modern energy sources, rural women spent a significant part of their time on fuel wood collection. 1.2 Actors 1.2.1 The state 59 Ministry of Finance and Economic Development. 2002. Ethiopia: Sustainable Development and Poverty Reduction Program. Addis Ababa, Ethiopia.
39
a) The strategy and approach Because of its dominance as a source of livelihood for the population, policy makers have focused on agricultural development since the early 1980s. In 1984, the former military government issued the Ten-Year Perspective Plan that called for rapid growth in agriculture and envisaged the allocation of 22.5 percent of total investment to agriculture. It was stated that self-sufficiency in food supply and the holding of three month stock of food reserves will be attained within the first three years of the Plan period. According to the Plan, smallholder farming cannot be a viable undertaking and the organization of farmers into producer cooperatives was expected to facilitate the gradual introduction of large-scale farming and mechanized agriculture.60 The performance of agriculture remained poor as public investment in the sector was channeled to the inefficient producer cooperatives and state farms. Preferential treatment in the form of subsidies for inputs and higher price for grain delivered to the marketing parsatatal absorbed a lot of resources. Military expenditure to fight rebels in different parts of the country took its toll and investment in agriculture declined sharply in the late 1980s. Above all, the policy of extracting surplus through forcing farmers to deliver grain at low prices to the government parastatal more than offset whatever was invested in agriculture (see also section 2.2.2). It is believed that a large scale decapitalization and dis-investment on the farm took place under the military government. The problem was compounded by lack of tenure security and risk of losing land to collective farms. The economic strategy of the EPRDF government has also accorded top priority to agriculture. The Agricultural Development Led Industrialization (ADLI) is seen as a long-term strategy and agriculture is to play a leading role in the growth of the economy. Technological progress has been considered as the primary tool to sustain high growth rates and commercialization of agriculture. Indeed, the Federal government has launched the so called Participatory Agricultural Demonstration and Extension System (PADETES). Farmers who participant in the program are expected to allocate 0.25 to 0.50 ha of land for the demonstration and pay a 25 – 50 percent down payment on the input package (mainly fertilizer and improved seeds) at the time of planting with the balance due after harvest. The system is implemented though the woreda agricultural offices and government paid development agents who select participating farmers and provide them with package of inputs. Woreda and Kebele administration officials play a vital role in the coordination and implementation of the development intervention. The farmers have very little influence in the way PADETES is organized or the package is designed. Each year, the Federal government (through the Ministry of Agriculture) sets the maximum number of farmers that need to participate in the extension system. Using the plan figures, each
60 Dejene Aredo. 1990. ‘The evolution of rural development policies’ in S. Pausewang et al. (eds), Ethiopia: Rural Development Options, Zed Books Ltd, London and New Jersey.
40
region then sets its own targets and the breakdowns to the zones. The zonal agricultural department (of each zone) then works out the number of farmers that each woreda needs to cover in its extension activities. Finally, the woreda office of agriculture is responsible for selecting the desired number of participants in each kebele and implementing the extension program. Owing to the high priority accorded to the program and the strong backing from the administrative system, the number of extension participant rapidly expanded from 32,047 in 1995 to over 4 million in 2001 (Table 8). Over 15,000 extension workers are believed to have participated in the program. The impact and sustainability of PADETES has come under question because of the top-down approach. The campaign to expand extension coverage has disregarded location-specific problems and forced farmers to apply blanket recommendations. Even the rates of fertilizer application showed little variation across the different agro-ecological zones. Under the new extension approach, a development is responsible for introducing some seven or more different packages to farmers under his domain.61 Every year, he/she receives instructions on the number of farmers that need to participate in the demonstration program. Accordingly, an agent could be required to work with over 200 farmers.62 In addition, disbursement and collection of input loans is largely handled by the agents. Development workers are required to bear out heavy work load. The problem is compounded by lack of resources and means of transport to move from one household plot to the next. The perception that the role of agents is to facilitate input distribution has undermined the main purpose of agricultural extension, i.e. assist in knowledge transfer mainly through the process of diffusion. Lack of properly defined, institutionalised research-extension-farmer linkage, output marketing problems, weak input distribution system and lack of sound credit system have also contributed to the weakness of technology transfer in Ethiopia.63
61 There are packages for crop production (mainly wheat package), soil and water conservation, forestry, agroforestry, livestock, forage and horticultural crops. 62 An extension agent contacted around Kulumsa Research Center worked with 227 participant farmers. He was assisted by 45 model farmers (farmers who previously participated) and three high school students. No payment or compensation was made to the farmers nor to the students. The students provided free service in return for support letters that would help them find employment or join training institutions. 63 J. Howard, V. Kelly, J. Stepanek, E. W. Crawford, M. Demeke, and M. Maredia, Green Revolution Technology Takes Root in Africa: the promise and Challenge of the Ministry of Agriculture /SG 2000 Experiment with Improved Cereals Technology in Ethiopia, MSU International Development Working Paper No. 76, 1999.
41
Table 8: National Extension Intervention Program Achievements – number of participants Type of package 1995 1996 1997 1998 1999 2000 2001
Food crops 32,042 350,000 584,343 2,122,025 2,803,788 2,986,389 2,616,617
High value crops 22,503 275,156 390,242 386,946 441,221
Livestock 25,111 45,064 66,812 77,071 88,800
Natural resource 128,110 544,087 545,843 341,518 909,491
Post harvest tech. 141 216 973 1,240 1,734
Total 32,047 350,000 756,608 2,986,548 3,807,658 3,793,164 4,057,863
Source: Ministry of Agriculture Investment on extension and fertilizer has expanded considerably in recent years. However, inadequate research capacity and lack of location-specific research results have limited the contribution of new technology. Good quality improved seeds are largely unavailable for most crops. The only exception is hybrid maize variety, which is available in some high potential areas.64 The system of seed multiplication is weak and dominated by a single parastatal, the Ethiopian Seed Enterprise. Fertilizer distribution is characterized by high cost of importation, marketing and transportation. It is also dependent on costly government-administered credit system.65 The use of fertilizer alone without complementary inputs such as improved seeds and chemicals (see Table 9 and the section on intensification below), have become unprofitable for many farmers in Ethiopia.66
64 Mulat Demeke, A��������������� � ���� � ���������������� ������������ ������� ��� Presented to the Agricultural Transformation Policy Workshop, Nairobi, Kenya, 27-30 June 1999 65 KUAWAB, Fertilizer Supply Chain Management, for NFIA, January 2002. 66 Mulat Demeke. 2003. ‘The profitability of crop production technologies in selected sites: Implications for poverty alleviation in Ethiopia’, in Mulat Demeke et al (eds.), Technological Progress in Ethiopian Agriculture, Proceedings of the National Workshop on Technological Progress in Ethiopian Agriculture, Nov. 29-30, 2001, Addis Ababa, Ethiopia.
42
As shown in Annex I, the share of agriculture in the total recurrent and capital expenditure is about 10% for most of the years since the early 1990s. The proportion has also declined due to war (military conflict with Eritrea). b) Government Policy towards the Private Sector A number of reform measures have been introduced since 1992/93 to shift the policy regime of the 1980s that restricted the activities of the private sector. Markets have been liberalized and prices have been deregulated to allow competitive private sector participation. The sectors in which the private sector can engage have been progressively expanded. Only telecommunication and electricity and water supply are fully or partially reserved for the government at present. Low inflation, low interest rates and realistic exchange rate, continuing trade reforms and relatively decreasing role for the state through privatization and deregulation have improved the investment climate for the private sector. An Investment Code has been issued to provide incentives and enhance the investment climate. A one-stop arrangement has also been put in place to reduce the cost of doing business and expedite implementation of investment projects. The minimum threshold for foreign direct investment (FDI) has been reduced to US$ 100,000 for wholly foreign-owned ventures, to US$ 60,000 for joint ventures, to US$ 25,000 for joint investment in the areas of engineering, architectural, accounting and audit services, project studies or consultancy, and no minimum investment requirement for those exporting at least 75% of output. The maximum tax rate has fallen from 40% to 35% for individuals and single proprietor businesses, from 35% to 30% for companies.67 Although the response of the private sector to the new policy regime has been generally encouraging, the rate of private investment is inadequate compared to the needs of the country. Investment is largely concentrated in a few service sectors such as trade and hotels, with relatively limited activities in agriculture and manufacturing. Access to land has remained a significant impediment as land is publicly owned and the government is only supplier. The processes and procedures involved in the identification and delivery of land has remained bureaucratic and the lease rates have been very high in many instances. Inadequate access to infrastructure services, transport (roads, air and rail), telecommunications and postal services, energy and water has constrained private investment. Despite the liberalization of the financial sector for domestic investors, loans and advances are not available to many investors because of the heavy collateral requirement and low level of credit information and limited capacity of private with regard to credit and financial analysis. Moreover, lending facilities to small and medium enterprises, which make up the bulk of both urban and rural enterprises, are non-existent. Micro-finance institutions can only meet the working capital needs of micro-enterprises. Although the government has established several service-rendering and regulatory institutions (eg., Ethiopian Investment Authority, 67 Ministry of Finance and Economic Development. 2002. Ethiopia: Sustainable Development and Poverty Reduction Program, Addis Ababa, Ethiopia.
43
Ethiopian Privatization Agency, Coffee and Tea Authority, the Federal Micro and Small Enterprise Development Agency, etc) to promote the private sector, most of the agencies have limited capacity to make a difference. Institutional mechanisms and forums for public-private consultative meetings have yet to be put in place. c) Government Attitude and Policies towards NGOs and CBOs Community based organizations (CBOs) have a long history in Ethiopia. The practices of charity and mutual self-help are deeply rooted in tradition and religious teachings. Traditional CBOs have managed to survive the effects of modernisations and continue to exist along with modern government and non-government institutions. By contrast, Non-Governmental Organizations (NGOs) are relatively a recent phenomenon in Ethiopia. The Great Famines of 1973/74 and 1984/85 promoted the establishment of several NGOs which often depend on donors for the bulk of financial and material resources necessary to undertake their activities. The legal basis for the operation of NGOs is found in the Ethiopian Civil Code promulgated in 1960. According to the Code, registrations for associations are incorporated into the ‘Internal Security Act’ issue by the Ministry of the Interior. It appears that security was accorded primacy over and above other considerations. The registration is now handled by the Ministry of Justice in collaboration with the Disaster Prevention and Preparedness Commission. Bureaucratic delays and hurdles experienced by NGOs applying for official recognition suggest that the Government attitude has not been very positive.68 However, a new program of capacity building in all major areas have been recently developed, and civil societies, NGOs and CBOs are targeted as one of the 14 program areas. The Government intends to create the necessary institutional and capacity for effective participation of civil societies and NGOs in poverty reduction and democratization process.69 1.2.2 Market/ private sector Generally, the hostile attitude of the Dergue regime towards the private sector was a major obstacle to private sector participation in investment and development. The participation of private traders in the grain market was deliberately suppressed. The bulk of grains produced
68 Kassahun Berhanu. 2002. ‘The Role of NGOs in Promoting Democratic Values: the Ethiopian Experience’ in Bahru Zewde and S. Pausewang (eds), Ethiopia: the Challenge of Democracy from Below, Stockholm, Sweden. 69 Ministry of Finance and Economic Development. 2002. Ethiopia: Sustainable Development and Poverty Reduction Program. Addis Ababa, Ethiopia.
44
were sold to public marketing enterprises such as the Agricultural Marketing Corporation (AMC) and the Ethiopian Oilseeds and Pulses Export Corporation (EOPEC) through quota systems. Licensed grain traders had to supply a minimum of 30 percent of their purchases in 1979/80, which was then raised to 50 percent in 1980/81. Traders were heavily taxed when trying to move grain around the country as they were required to sell their quota to the AMC at fixed prices below market prices to receive permits to transport grain from one region to another. Farmers were required to hand over a portion of their produce, referred to as a quota, to the AMC at fixed prices. Between 1980 and 1990, farmers had been required to deliver between 50 and 100 percent of their marketed surplus to the AMC. The prices paid by the AMC served as implicit tax on the farmers. By holding prices down and introducing pan-territorial pricing policy, the former government shifted the terms of trade against agriculture. All the measures aimed at stifling the private sector were further supported by a progressive business tax; the marginal tax rates for unincorporated business incomes and profits were 82% in industry and 89% in agriculture, and were applicable to annual incomes above Birr 36000. Moreover, while private importers were driven out of business in favour of state trading enterprises, exporters were prohibited from exporting traditional export commodities. Private sector participation in the economy was also heavily discouraged through restrictive foreign exchange licensing system for private use, 100 percent surrendering of foreign exchange obtained by Ethiopians and foreigners in private business, and very high import tariff that reached as high as 230 percent. Economic reform has brought a significant change in the area of marketing and pricing agricultural products. The requirement that farmers should deliver a predetermined quantity of grain to the parastatal Agricultural Marketing Corporation (AMC) at a fixed price has been removed. This has forced the AMC to operate competitively in the grain market and it has been renamed as the Ethiopian Grain Trade Enterprise (EGTE). State monopoly over wholesale grain trade was thus abolished and private business was allowed to operate on a competitive basis. These measures granted producers the right to sell their produce freely at prevailing prices at any market. In spite of the various policy measures, agricultural markets in Ethiopia are still underdeveloped. Inefficient output markets have resulted in low and variable prices thereby reducing the profitability of new technologies in agriculture. Grain marketing, even under a liberalized environment, suffers from a number of constraints, including inadequate transport network and high transport tariff, limited number of large-interregional
45
traders with adequate storage and working capital, high handling costs, inadequate market information system, weak bargaining power, underdeveloped processing industrial sector, lack of financial credit, absence of control on un-licensed traders70. Small traders have limited capacity of handling large quantities for longer duration. Hence, the volume of grain marketed falls sharply in years of poor harvest and prices rise considerably. Grain prices, on the other hand, are seriously depressed in good years and immediately after harvest. This was particularly true during the favorable years of 2000 and 2001 when grain prices fell sharply. Handling and transport costs are also high due to the small quantities that farmers bring to market places (often small bags carried on head or on the back of pack animals) and the absence of grading and standards. Grain has to be un-bagged and re-bagged each time it changes hands, partly to inspect quality. With a large number of small traders in the market, it is difficult for the Ethiopian Standards Committee to effectively inspect weighing scales or the bureaus of trade to monitor trading activities. Traders in many village markets use containers of different sizes, not proper weighing scales71. A good part of the margin that goes to traders comes from the inappropriate measuring instruments (under-weighing), not just price differentials. Unfair trading practices, combined with lack of accurate and timely market information and high rate of illiteracy among farmers, have widened the gap between the price paid by consumers and the price received by farmers. Since there are a limited number of cooperatives or marketing societies, the bargaining power of farmers is weak relative to traders.72 Storage problems coupled with the need to repay loans and meet other financial obligations (e.g. taxes) compel farmers to sell maize immediately after harvest. It is estimated that about 79% of farmers’ annual grain sales occur immediately after the harvest season (January to March). As a result, prices drop when most farmers are selling and rise later during the year when many poorer farmers run out of stock and start buying from the market. 1.2.3 Farmers Historically, rural producers settled along the highland plateau, where the soil was more fertile and the weather is more favorable to humans and animals. They rotated cereals and legumes on their fields and practiced fallowing to restore fertility. During World War II and continuing until
70 Gebremeskel Dessalegn, T.S. Jayne and J.D. Shaffer. 1998. Market Structure, Conduct and Performance: Constraints on Performance of Grain Markets. Working Paper No. 8, GMRP, MEDaC. 71 Wolday Amha. 1999b. IGAD Grain Marketing Training Program: Country Report: Ethiopia. Consulancy Report for IGAD, Addis Ababa, June 1999. 72 Cooperative movement in Ethiopia has not recovered from the disastrous experience under the former socialist government.
46
around 1947, Ethiopia was a major supplier of wheat to the Near East. No fertilizer, improved seeds or farm machinery was used to produce surplus for export in these early years. Some farmers were able to produce surplus that could last them for over two or more seasons using only traditional technologies. Shortfalls in production due to drought were less frequent and coping mechanisms were more sound. The soil was more fertile and the vegetation was greener and many farmers used to cultivate in both highland and lowland areas to minimize the risk of crop failure. In addition, livestock husbandry provided significant supplementary income. But rapid population growth has in recent decades, combined with lack of agricultural development, brought far-reaching changes in the natural resource base and food security situation of the country: (1) Ethiopia's steep and rugged topography, combined with intensive use of land and some unsustainable farming practices, has contributed to high degree of land degradation (an estimated 50% of all crop land is reported to face serious soil degradation and erosion, according to the Ethiopian Highland Reclamation Study)73; and (2) one major famine after another has shattered the hope of ensuring food security and the number of people dependent on food aid has been increasing (on average, some 6.6 million people were affected each year between 1991/92 and 2002/03, compared to 4.5 million between 1980/81 and 1990/91). The current famine has affected the largest proportion of the population (22%), despite a very intensive extension program of the Government. There is no doubt that agricultural development efforts have so far failed to reverse the worsening poverty situation. 1.3 Effects 1.3.1 Intensification The vast majority of farmers in Ethiopia do not use improved seeds, chemical fertilizers, pesticides or irrigation. Only 5.4% of the cereal area was covered with improved seeds in 2000/01. The corresponding proportion was 0.1% for pulses and 0% for oilseeds. About 8% of the coffee area was planted with improved seedlings over the same period. About 43% of the cereal area received organic and chemical fertilizer, compared to 14% in the case of pulses and 7% with regard to oilseeds. Only 13% of the cereal area was treated with pesticides in 2000/01. In spite of the recurrent drought, only 0.8% of the total cultivated area (in the peasant sector) was irrigated in 2000/01 (Table 8).
73 Loss of arable land due to soil erosion is a widespread phenomenon in the highlands of Ethiopia, which account for about 45% of the country’s total land area. It has been estimated that soil losses of and exceeding 200t/ha per year occur on steep slopes. See for instance, R. Kappel, Economic analysis of soil conservation in Ethiopia: issues and research perspectives, University of Berne, Berne, Switzerland, in association with the Ministry of Agriculture, Addis Ababa, Ethiopia.
47
Use of modern inputs varies significantly among the different cereal crops. For instance, about 20% of the maize area is covered with improved seeds, compared to less than 1% in the case of teff, sorghum and millet. The use of organic and chemical fertilizer is relatively higher for wheat (66%), teff (53%) and maize 49%) than for sorghum (9%), barley (36%) or millet (41%). Pesticide application is also higher in the case of wheat (35%) and teff (20%) (Table 9). Technology application in Ethiopia is characterized by incomplete package in which fertilizer is used with no improved seeds and pesticide. Despite the new extension campaign (discussed above), farmers do not have access to a complete and more productive package of inputs. There is also no irrigation to mitigate the effect of drought or erratic rainfall. Hence, the impact of new technology on yield and income has remained low in Ethiopia
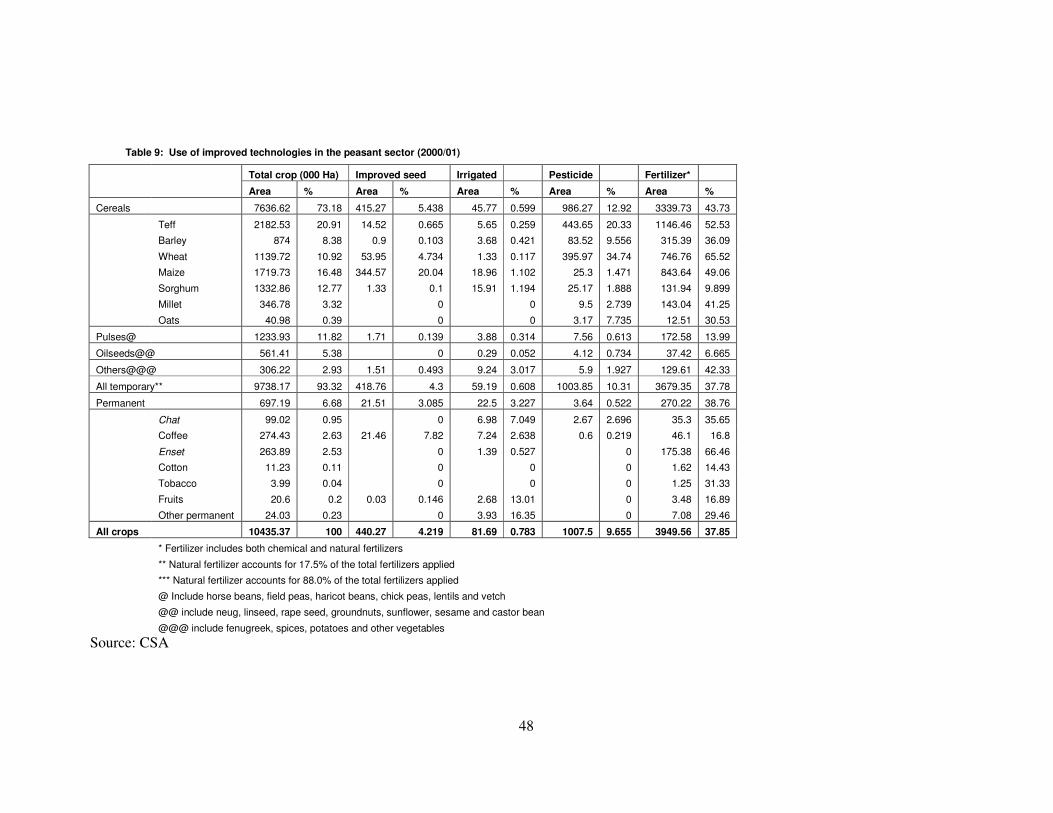
48
Table 9: Use of improved technologies in the peasant sector (2000/01)
Total crop (000 Ha) Improved seed Irrigated Pesticide Fertilizer*
Area % Area % Area % Area % Area %
Cereals 7636.62 73.18 415.27 5.438 45.77 0.599 986.27 12.92 3339.73 43.73
Teff 2182.53 20.91 14.52 0.665 5.65 0.259 443.65 20.33 1146.46 52.53
Barley 874 8.38 0.9 0.103 3.68 0.421 83.52 9.556 315.39 36.09
Wheat 1139.72 10.92 53.95 4.734 1.33 0.117 395.97 34.74 746.76 65.52
Maize 1719.73 16.48 344.57 20.04 18.96 1.102 25.3 1.471 843.64 49.06
Sorghum 1332.86 12.77 1.33 0.1 15.91 1.194 25.17 1.888 131.94 9.899
Millet 346.78 3.32 0 0 9.5 2.739 143.04 41.25
Oats 40.98 0.39 0 0 3.17 7.735 12.51 30.53
Pulses@ 1233.93 11.82 1.71 0.139 3.88 0.314 7.56 0.613 172.58 13.99
Oilseeds@@ 561.41 5.38 0 0.29 0.052 4.12 0.734 37.42 6.665
Others@@@ 306.22 2.93 1.51 0.493 9.24 3.017 5.9 1.927 129.61 42.33
All temporary** 9738.17 93.32 418.76 4.3 59.19 0.608 1003.85 10.31 3679.35 37.78
Permanent 697.19 6.68 21.51 3.085 22.5 3.227 3.64 0.522 270.22 38.76
Chat 99.02 0.95 0 6.98 7.049 2.67 2.696 35.3 35.65
Coffee 274.43 2.63 21.46 7.82 7.24 2.638 0.6 0.219 46.1 16.8
Enset 263.89 2.53 0 1.39 0.527 0 175.38 66.46
Cotton 11.23 0.11 0 0 0 1.62 14.43
Tobacco 3.99 0.04 0 0 0 1.25 31.33
Fruits 20.6 0.2 0.03 0.146 2.68 13.01 0 3.48 16.89
Other permanent 24.03 0.23 0 3.93 16.35 0 7.08 29.46
All crops 10435.37 100 440.27 4.219 81.69 0.783 1007.5 9.655 3949.56 37.85
* Fertilizer includes both chemical and natural fertilizers
** Natural fertilizer accounts for 17.5% of the total fertilizers applied
*** Natural fertilizer accounts for 88.0% of the total fertilizers applied
@ Include horse beans, field peas, haricot beans, chick peas, lentils and vetch
@@ include neug, linseed, rape seed, groundnuts, sunflower, sesame and castor bean
@@@ include fenugreek, spices, potatoes and other vegetables
Source: CSA
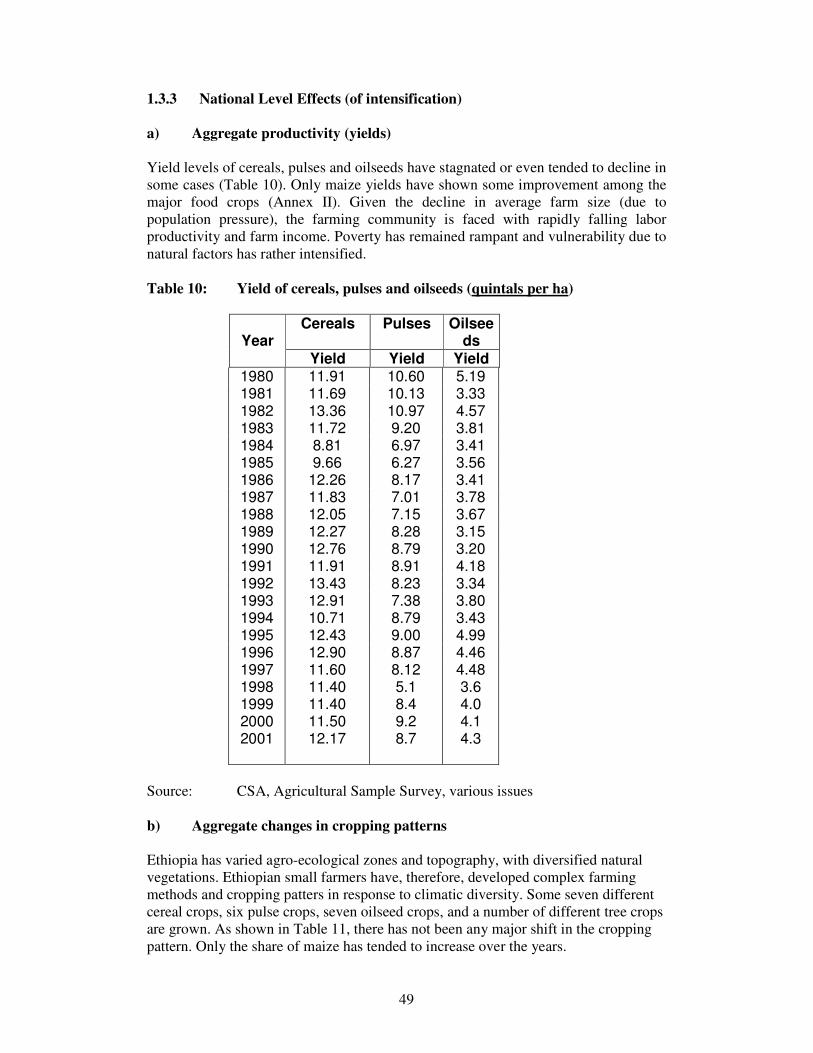
49
1.3.3 National Level Effects (of intensification) a) Aggregate productivity (yields) Yield levels of cereals, pulses and oilseeds have stagnated or even tended to decline in some cases (Table 10). Only maize yields have shown some improvement among the major food crops (Annex II). Given the decline in average farm size (due to population pressure), the farming community is faced with rapidly falling labor productivity and farm income. Poverty has remained rampant and vulnerability due to natural factors has rather intensified. Table 10: Yield of cereals, pulses and oilseeds (quintals per ha)
Cereals Pulses Oilseeds
Year
Yield Yield Yield 1980 11.91 10.60 5.19 1981 11.69 10.13 3.33 1982 13.36 10.97 4.57 1983 11.72 9.20 3.81 1984 8.81 6.97 3.41 1985 9.66 6.27 3.56 1986 12.26 8.17 3.41 1987 11.83 7.01 3.78 1988 12.05 7.15 3.67 1989 12.27 8.28 3.15 1990 12.76 8.79 3.20 1991 11.91 8.91 4.18 1992 13.43 8.23 3.34 1993 12.91 7.38 3.80 1994 10.71 8.79 3.43 1995 12.43 9.00 4.99 1996 12.90 8.87 4.46 1997 1998 1999 2000 2001
11.60 11.40 11.40 11.50 12.17
8.12 5.1 8.4 9.2 8.7
4.48 3.6 4.0 4.1 4.3
Source: CSA, Agricultural Sample Survey, various issues b) Aggregate changes in cropping patterns Ethiopia has varied agro-ecological zones and topography, with diversified natural vegetations. Ethiopian small farmers have, therefore, developed complex farming methods and cropping patters in response to climatic diversity. Some seven different cereal crops, six pulse crops, seven oilseed crops, and a number of different tree crops are grown. As shown in Table 11, there has not been any major shift in the cropping pattern. Only the share of maize has tended to increase over the years.
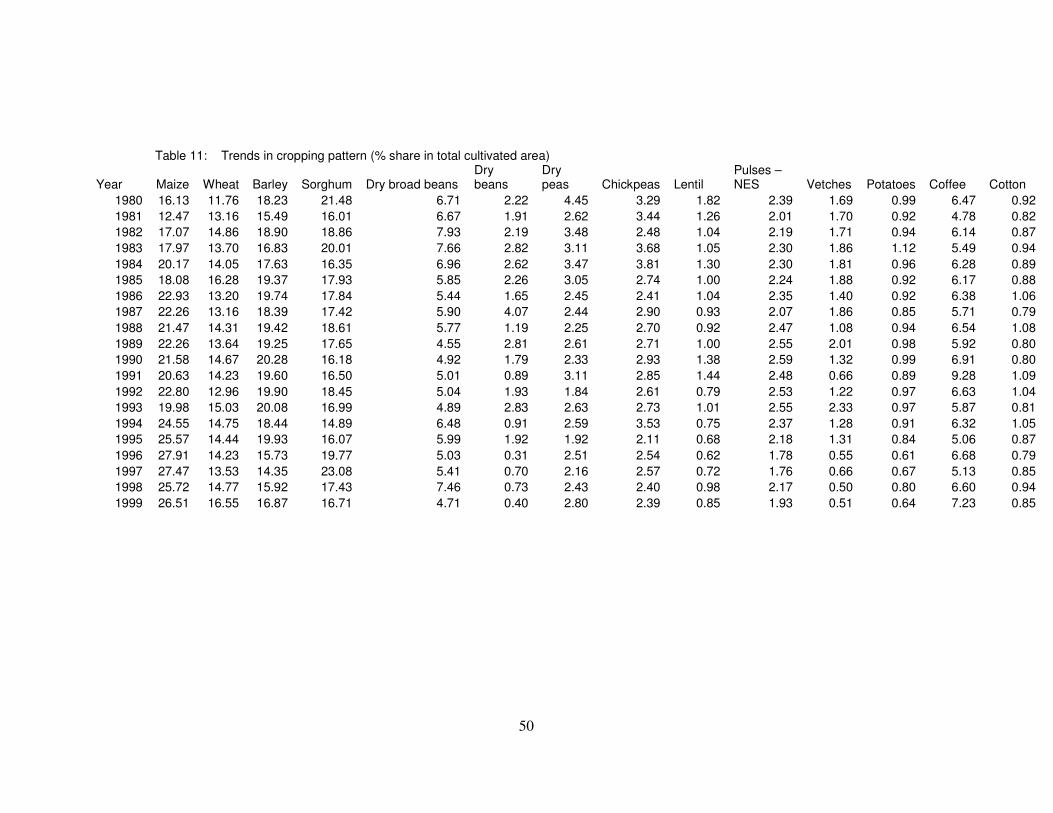
50
Table 11: Trends in cropping pattern (% share in total cultivated area) Year Maize Wheat Barley Sorghum Dry broad beans
Dry beans
Dry peas Chickpeas Lentil
Pulses –NES Vetches Potatoes Coffee Cotton
1980 16.13 11.76 18.23 21.48 6.71 2.22 4.45 3.29 1.82 2.39 1.69 0.99 6.47 0.92 1981 12.47 13.16 15.49 16.01 6.67 1.91 2.62 3.44 1.26 2.01 1.70 0.92 4.78 0.82 1982 17.07 14.86 18.90 18.86 7.93 2.19 3.48 2.48 1.04 2.19 1.71 0.94 6.14 0.87 1983 17.97 13.70 16.83 20.01 7.66 2.82 3.11 3.68 1.05 2.30 1.86 1.12 5.49 0.94 1984 20.17 14.05 17.63 16.35 6.96 2.62 3.47 3.81 1.30 2.30 1.81 0.96 6.28 0.89 1985 18.08 16.28 19.37 17.93 5.85 2.26 3.05 2.74 1.00 2.24 1.88 0.92 6.17 0.88 1986 22.93 13.20 19.74 17.84 5.44 1.65 2.45 2.41 1.04 2.35 1.40 0.92 6.38 1.06 1987 22.26 13.16 18.39 17.42 5.90 4.07 2.44 2.90 0.93 2.07 1.86 0.85 5.71 0.79 1988 21.47 14.31 19.42 18.61 5.77 1.19 2.25 2.70 0.92 2.47 1.08 0.94 6.54 1.08 1989 22.26 13.64 19.25 17.65 4.55 2.81 2.61 2.71 1.00 2.55 2.01 0.98 5.92 0.80 1990 21.58 14.67 20.28 16.18 4.92 1.79 2.33 2.93 1.38 2.59 1.32 0.99 6.91 0.80 1991 20.63 14.23 19.60 16.50 5.01 0.89 3.11 2.85 1.44 2.48 0.66 0.89 9.28 1.09 1992 22.80 12.96 19.90 18.45 5.04 1.93 1.84 2.61 0.79 2.53 1.22 0.97 6.63 1.04 1993 19.98 15.03 20.08 16.99 4.89 2.83 2.63 2.73 1.01 2.55 2.33 0.97 5.87 0.81 1994 24.55 14.75 18.44 14.89 6.48 0.91 2.59 3.53 0.75 2.37 1.28 0.91 6.32 1.05 1995 25.57 14.44 19.93 16.07 5.99 1.92 1.92 2.11 0.68 2.18 1.31 0.84 5.06 0.87 1996 27.91 14.23 15.73 19.77 5.03 0.31 2.51 2.54 0.62 1.78 0.55 0.61 6.68 0.79 1997 27.47 13.53 14.35 23.08 5.41 0.70 2.16 2.57 0.72 1.76 0.66 0.67 5.13 0.85 1998 25.72 14.77 15.92 17.43 7.46 0.73 2.43 2.40 0.98 2.17 0.50 0.80 6.60 0.94 1999 26.51 16.55 16.87 16.71 4.71 0.40 2.80 2.39 0.85 1.93 0.51 0.64 7.23 0.85

51
c) Trends in aggregate use of high-yielding inputs
Improved seeds Between 1992 and 2000, the average annual seed production by ESE was lower compared to the pre reform period. In other words, seed production by ESE decreased by 35% after liberalization (Table 12). State and collective farms depended on improved seeds and they were the major clients the ESE prior to the reform. It should be noted that although total sales of improved seed has shown a falling trend, after liberalization, the share of small holder farmers from the total Improved seed consumption/sales has increased from its level of 25% in 1980 to 87% in 2000. Small producers tend to buy improved seeds (especially non-hybrid seeds) once and recycle them for several years to reduce their seed cost. The Enterprise often finds itself with a large stock of unsold stock, thereby reducing its production in the next season.74 The quality of improved seeds in Ethiopia is low due to low genetic quality, limited genetic potential and/or long period of repeated use, seed production under rainfed conditions and inadequate storage facilities. For instance, about 10% of the demonstration plots in two regions (Oromia and SNNP) which were planted with hybrid maize seeds faced germination problems during the 1998/99 cropping season. Similar problems were reported for wheat in all areas where the seed was distributed. Unexpected rains at harvesting period affected the quality of the seeds.75
74 Afri-Tech Consult. 1998. Seed Marketing Study, Volume I, Main Report. National Seed Industry Agency, Addis Ababa, Ethiopia. 75 Mulat Demeke, Agricultural technology, economic viability and poverty alleviation in Ethiopia, Paper Presented to the Agricultural Transformation Policy Workshop, Nairobi, Kenya, 27-30 June 1999
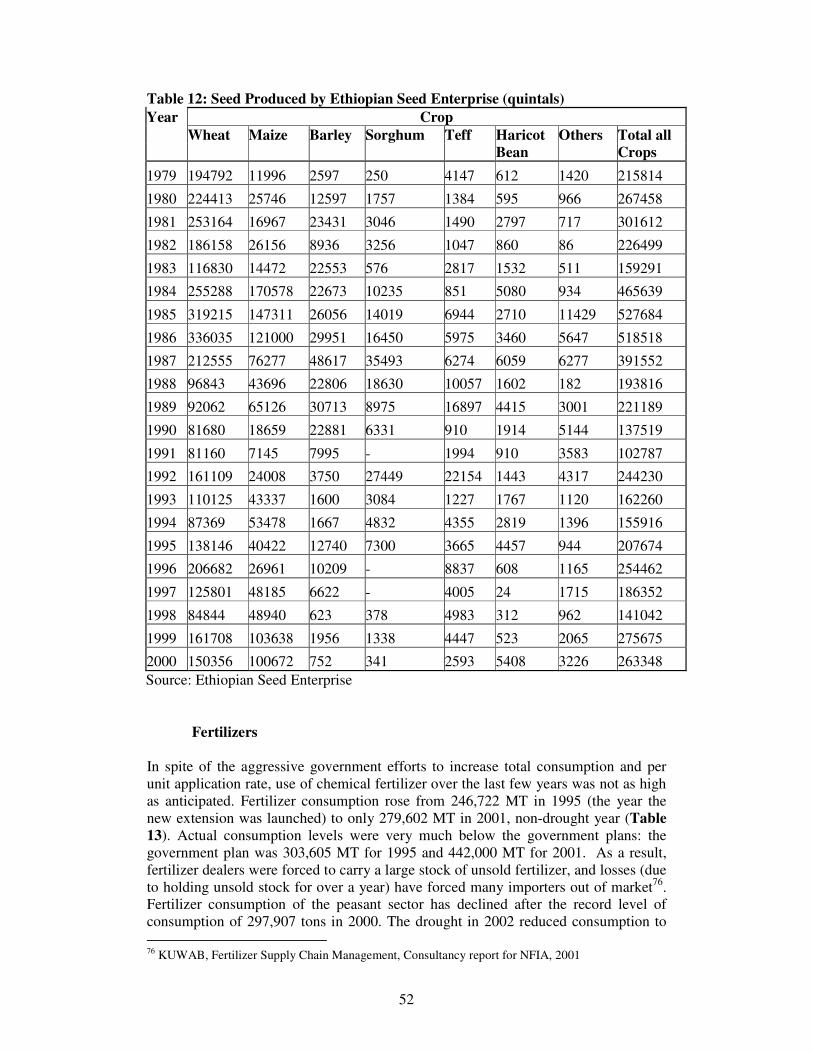
52
Table 12: Seed Produced by Ethiopian Seed Enterprise (quintals) Year Crop Wheat Maize Barley Sorghum Teff Haricot Others Total all Bean Crops 1979 194792 11996 2597 250 4147 612 1420 215814
1980 224413 25746 12597 1757 1384 595 966 267458
1981 253164 16967 23431 3046 1490 2797 717 301612
1982 186158 26156 8936 3256 1047 860 86 226499
1983 116830 14472 22553 576 2817 1532 511 159291
1984 255288 170578 22673 10235 851 5080 934 465639
1985 319215 147311 26056 14019 6944 2710 11429 527684
1986 336035 121000 29951 16450 5975 3460 5647 518518
1987 212555 76277 48617 35493 6274 6059 6277 391552
1988 96843 43696 22806 18630 10057 1602 182 193816
1989 92062 65126 30713 8975 16897 4415 3001 221189
1990 81680 18659 22881 6331 910 1914 5144 137519
1991 81160 7145 7995 - 1994 910 3583 102787
1992 161109 24008 3750 27449 22154 1443 4317 244230
1993 110125 43337 1600 3084 1227 1767 1120 162260
1994 87369 53478 1667 4832 4355 2819 1396 155916
1995 138146 40422 12740 7300 3665 4457 944 207674
1996 206682 26961 10209 - 8837 608 1165 254462
1997 125801 48185 6622 - 4005 24 1715 186352
1998 84844 48940 623 378 4983 312 962 141042
1999 161708 103638 1956 1338 4447 523 2065 275675
2000 150356 100672 752 341 2593 5408 3226 263348 Source: Ethiopian Seed Enterprise
Fertilizers In spite of the aggressive government efforts to increase total consumption and per unit application rate, use of chemical fertilizer over the last few years was not as high as anticipated. Fertilizer consumption rose from 246,722 MT in 1995 (the year the new extension was launched) to only 279,602 MT in 2001, non-drought year (Table 13). Actual consumption levels were very much below the government plans: the government plan was 303,605 MT for 1995 and 442,000 MT for 2001. As a result, fertilizer dealers were forced to carry a large stock of unsold fertilizer, and losses (due to holding unsold stock for over a year) have forced many importers out of market76. Fertilizer consumption of the peasant sector has declined after the record level of consumption of 297,907 tons in 2000. The drought in 2002 reduced consumption to 76 KUWAB, Fertilizer Supply Chain Management, Consultancy report for NFIA, 2001
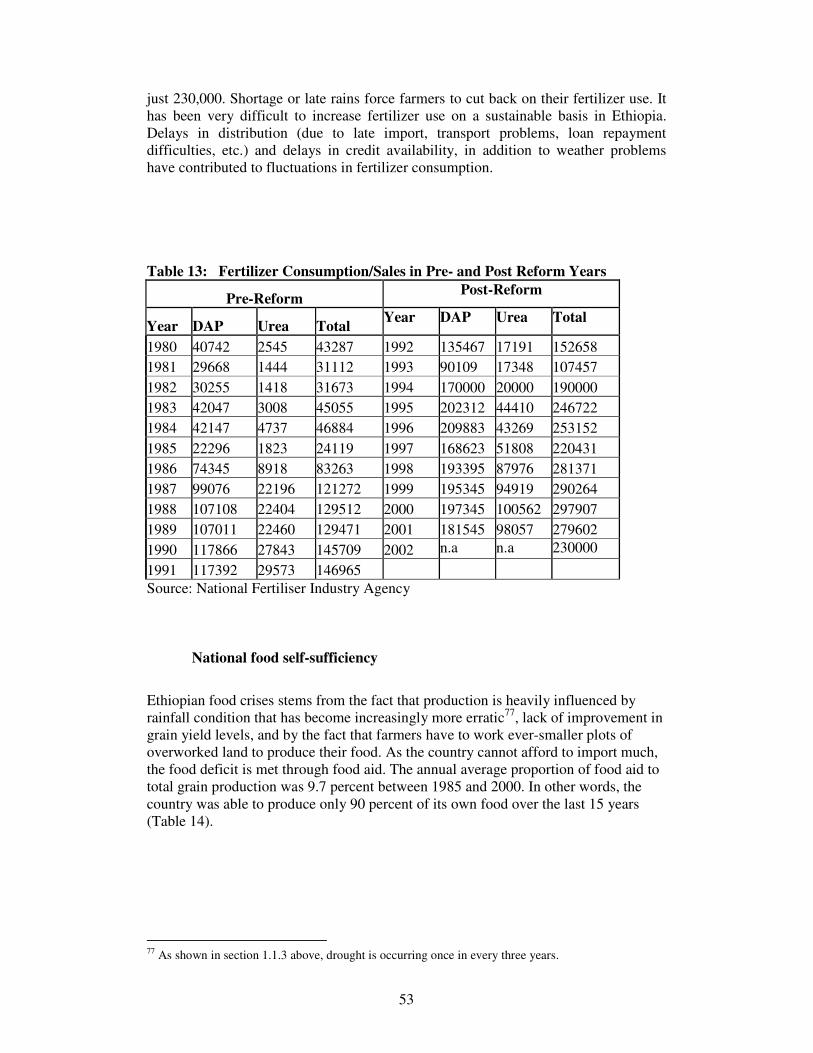
53
just 230,000. Shortage or late rains force farmers to cut back on their fertilizer use. It has been very difficult to increase fertilizer use on a sustainable basis in Ethiopia. Delays in distribution (due to late import, transport problems, loan repayment difficulties, etc.) and delays in credit availability, in addition to weather problems have contributed to fluctuations in fertilizer consumption.
Table 13: Fertilizer Consumption/Sales in Pre- and Post Reform Years
Pre-Reform Post-Reform
Year DAP Urea Total Year DAP Urea Total
1980 40742 2545 43287 1992 135467 17191 152658 1981 29668 1444 31112 1993 90109 17348 107457 1982 30255 1418 31673 1994 170000 20000 190000 1983 42047 3008 45055 1995 202312 44410 246722 1984 42147 4737 46884 1996 209883 43269 253152 1985 22296 1823 24119 1997 168623 51808 220431 1986 74345 8918 83263 1998 193395 87976 281371 1987 99076 22196 121272 1999 195345 94919 290264 1988 107108 22404 129512 2000 197345 100562 297907 1989 107011 22460 129471 2001 181545 98057 279602 1990 117866 27843 145709 2002 n.a n.a 230000
1991 117392 29573 146965 Source: National Fertiliser Industry Agency
National food self-sufficiency
Ethiopian food crises stems from the fact that production is heavily influenced by rainfall condition that has become increasingly more erratic77, lack of improvement in grain yield levels, and by the fact that farmers have to work ever-smaller plots of overworked land to produce their food. As the country cannot afford to import much, the food deficit is met through food aid. The annual average proportion of food aid to total grain production was 9.7 percent between 1985 and 2000. In other words, the country was able to produce only 90 percent of its own food over the last 15 years (Table 14).
77 As shown in section 1.1.3 above, drought is occurring once in every three years.
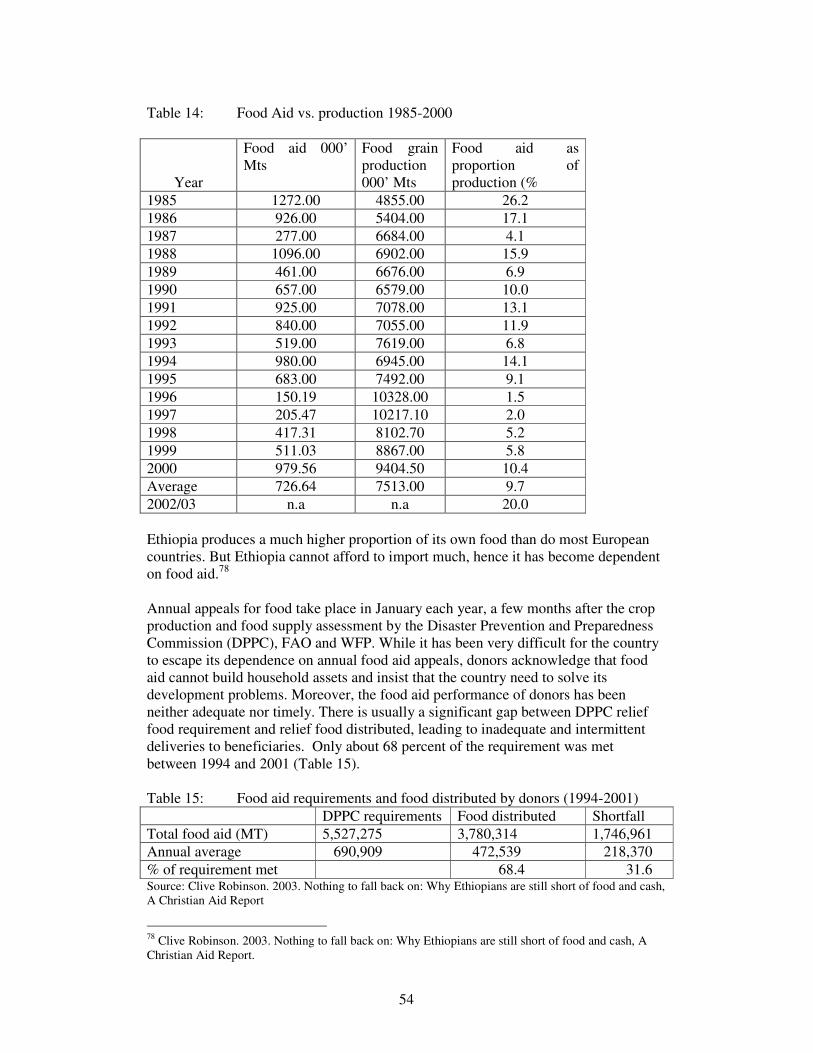
54
Table 14: Food Aid vs. production 1985-2000
Year
Food aid 000’ Mts
Food grain production 000’ Mts
Food aid as proportion of production (%
1985 1272.00 4855.00 26.2 1986 926.00 5404.00 17.1 1987 277.00 6684.00 4.1 1988 1096.00 6902.00 15.9 1989 461.00 6676.00 6.9 1990 657.00 6579.00 10.0 1991 925.00 7078.00 13.1 1992 840.00 7055.00 11.9 1993 519.00 7619.00 6.8 1994 980.00 6945.00 14.1 1995 683.00 7492.00 9.1 1996 150.19 10328.00 1.5 1997 205.47 10217.10 2.0 1998 417.31 8102.70 5.2 1999 511.03 8867.00 5.8 2000 979.56 9404.50 10.4 Average 726.64 7513.00 9.7 2002/03 n.a n.a 20.0 Ethiopia produces a much higher proportion of its own food than do most European countries. But Ethiopia cannot afford to import much, hence it has become dependent on food aid.78 Annual appeals for food take place in January each year, a few months after the crop production and food supply assessment by the Disaster Prevention and Preparedness Commission (DPPC), FAO and WFP. While it has been very difficult for the country to escape its dependence on annual food aid appeals, donors acknowledge that food aid cannot build household assets and insist that the country need to solve its development problems. Moreover, the food aid performance of donors has been neither adequate nor timely. There is usually a significant gap between DPPC relief food requirement and relief food distributed, leading to inadequate and intermittent deliveries to beneficiaries. Only about 68 percent of the requirement was met between 1994 and 2001 (Table 15). Table 15: Food aid requirements and food distributed by donors (1994-2001) DPPC requirements Food distributed Shortfall Total food aid (MT) 5,527,275 3,780,314 1,746,961 Annual average 690,909 472,539 218,370 % of requirement met 68.4 31.6 Source: Clive Robinson. 2003. Nothing to fall back on: Why Ethiopians are still short of food and cash, A Christian Aid Report
78 Clive Robinson. 2003. Nothing to fall back on: Why Ethiopians are still short of food and cash, A Christian Aid Report.
55
Food insecurity is one of the defining features of rural poverty. An estimated 52% of the rural population is food insecure with an average consumption of approximately 1,7770 Kcal per capita, 16% below the minimum level accepted by the government. According to the 2000 Human Development Report of UNDP, the average intake was only 1,858, some 12% fewer calories than the minimum target set by the government (2100 Kcal per day). Achieving the FAO/WHO recommended per capita calorie intake of 2,000 Kcal per person per day entails a 6.5% increase in total food production. 79 The key challenge is how to ensure sustainable increase in the face of drought that is becoming more frequent. 1.4 Conclusions The way out of Ethiopia’s predicament has been made more difficult by the failure to act comprehensively and decisively. A strategy aimed at breaking the cycle of poverty and famine cannot escape the fact that food production is constrained both by complex supply as well as demand factors. As demonstrated by past efforts, a solution to only one of side of the problem would remain too little and ineffective. The supply constraint is aggravated by extreme degradation which is mainly caused by population pressure and inappropriate cultural practices. Hence, it is imperative to reduce the pressure on land through enhancing out-migration, especially in areas most densely and heavily degraded, and ensuring tenure security. For some of the most degraded areas, only long-term rehabilitation effort that does not include extensive cereal production system could be considered to avoid further escalation of the problem. Improved livestock husbandry based on zero grazing and tree crops (producing forage, timber and fruits) could be given priority. Agricultural production in relatively high potential areas needs to be intensified using a more effective package of inputs (fertilizer, improved seeds and chemicals to control pests) and sustainable farming practices that includes organic matter and crop rotation to improve soil fertility. It is important to note that farms that are too small have limited capacity to undertake sustainable farming since they are too poor and subsistence-oriented to undertake long-term investment80. Land policy that encourages land rentals and transfers to the hands of more productive farmers is necessary in order to pave the way for market production and long-term investment on the land. Individual farmers, the community and the government should also invest in irrigation as part of the intensification and the need to produce two or three harvests per year. A sustainable and rapid increase in agricultural production (to exceed the rate of population growth by a reasonable margin) would definitely entail a substantial investment in research (to generate new technology), transport and communication infrastructure, rehabilitation and conservation, irrigation and water control, human
79 Clive Robinson. 2003. Nothing to fall back on: Why Ethiopians are still short of food and cash, A Christian Aid Report. 80 Mulat Demeke and Bekele Hunde, Population pressure and intensification of agricultural production in ethiopia: an enquiry into sustainability of farming practices, paper presented at the First International Conference on the Ethiopian Economy, January 3-5, 2003, Addis Ababa.
56
resources, etc. Only a Big Bang approach could reverse the downward trend and save rural areas from plunging further into famine and misery. Unlike many other countries, Ethiopian agriculture needs an injection of a sizeable dose of external capital to avoid Malthusian or poverty trap and increase production and productivity on a sustainable basis. Previous experience has shown that smaller investment levels that cannot produce significant results (to outweigh population growth and environmental degradation) have failed to overcome the vicious circle. Empirical studies suggest that a high level of development requires good institutions, high literacy, high openness to trade, and a high degree of structural transformation (the degree to which output shifts out of subsistence production into higher productivity modern sector activities, proxied by urbanization ratio)81. Good institutions do not make individuals feel that others are responsible for their life. The system of governance should foster self-help collective initiative that will enhance the capacity to mobilize labor and other resources for a common development goal and influence government policies and public administration. The modern attitude that the individual, either alone or in concert with others, should take actions to improve his/her own condition should be nurtured. The system of governance should appreciate the importance of ensuring public participation in planning, monitoring and evaluation of projects. Too many religious holidays and elaborate social ceremonies such as funerals and wedding are not consistent with the need to intensify labor use and accelerate investment on small farms. It should be noted that a nationwide self-help and cooperative movements have been instrumental in transforming agriculture in China, South Korea, Taiwan and many other Asian countries. A greater sense of participation in the development process, bottom-up or planning from below and fundamental social changes were achieved through genuine grass-roots organizations. Small groups help poor farmers become more self-reliant and can be linked up into a network of self-sustaining rural organizations. For instance, a cooperative movement known as 'movement for spiritual revolution' or Saemaul Undong in South Korea adopted code banning gambling and superstition, closing village drinking houses and restricting elaborate social ceremonies. One of the major achievements was a fourfold increase in rural savings resulting from these prohibitions82. Finally, there is a general consensus that the formation of human capital is central to the development of poor countries. Future economic growth cannot depend on natural agricultural resources, which are being depleted and are subject to long-run price declines. Today’s information-based economy require properly educated and trained workforce to take advantage of economic opportunities within and outside agriculture.
81 W. Easterly, Growth in Ethiopia: Retrospect and Prospect, Centre for Global Development Institute for International Economics, April 2002. 82 Douglas, M. 1983. 'The Korean Saemaul Undong: accelerated rural development in an open economy' in David A.M. Lea and D.P. Chaudhri (eds), Rural Development and the State, Methuen, London and New York.
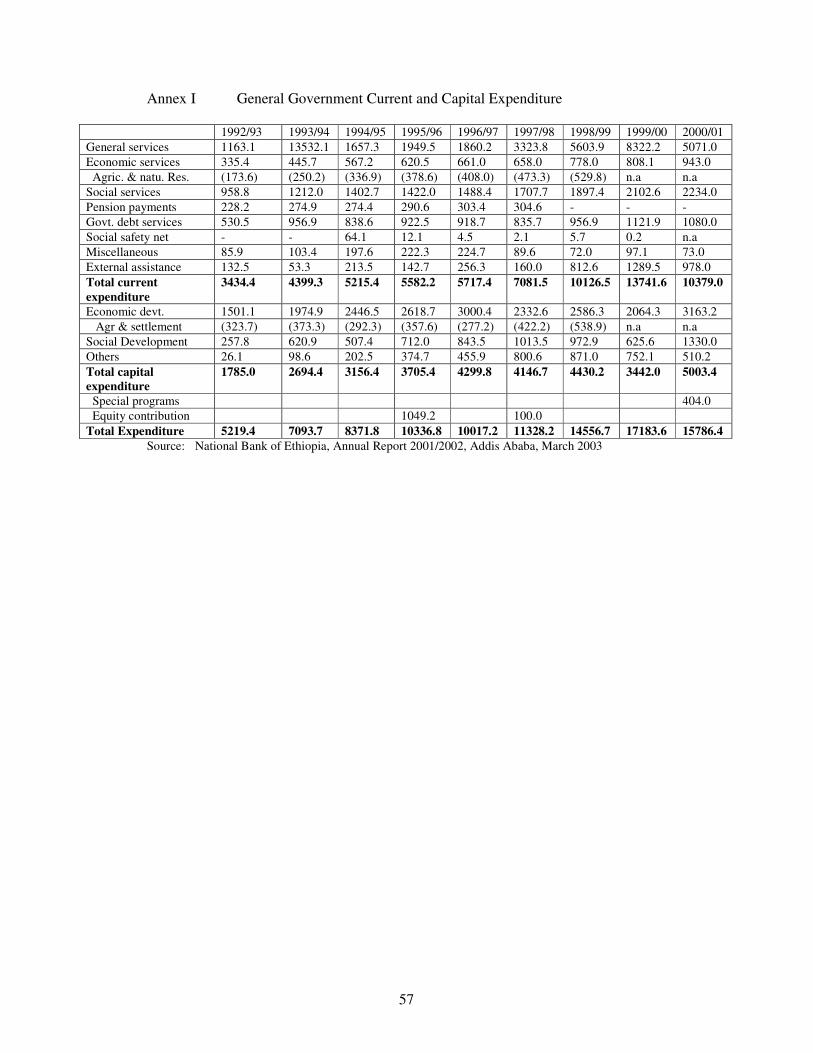
57
Annex I General Government Current and Capital Expenditure
1992/93 1993/94 1994/95 1995/96 1996/97 1997/98 1998/99 1999/00 2000/01 General services 1163.1 13532.1 1657.3 1949.5 1860.2 3323.8 5603.9 8322.2 5071.0 Economic services 335.4 445.7 567.2 620.5 661.0 658.0 778.0 808.1 943.0 Agric. & natu. Res. (173.6) (250.2) (336.9) (378.6) (408.0) (473.3) (529.8) n.a n.a Social services 958.8 1212.0 1402.7 1422.0 1488.4 1707.7 1897.4 2102.6 2234.0 Pension payments 228.2 274.9 274.4 290.6 303.4 304.6 - - - Govt. debt services 530.5 956.9 838.6 922.5 918.7 835.7 956.9 1121.9 1080.0 Social safety net - - 64.1 12.1 4.5 2.1 5.7 0.2 n.a Miscellaneous 85.9 103.4 197.6 222.3 224.7 89.6 72.0 97.1 73.0 External assistance 132.5 53.3 213.5 142.7 256.3 160.0 812.6 1289.5 978.0 Total current expenditure
3434.4 4399.3 5215.4 5582.2 5717.4 7081.5 10126.5 13741.6 10379.0
Economic devt. 1501.1 1974.9 2446.5 2618.7 3000.4 2332.6 2586.3 2064.3 3163.2 Agr & settlement (323.7) (373.3) (292.3) (357.6) (277.2) (422.2) (538.9) n.a n.a Social Development 257.8 620.9 507.4 712.0 843.5 1013.5 972.9 625.6 1330.0 Others 26.1 98.6 202.5 374.7 455.9 800.6 871.0 752.1 510.2 Total capital expenditure
1785.0 2694.4 3156.4 3705.4 4299.8 4146.7 4430.2 3442.0 5003.4
Special programs 404.0 Equity contribution 1049.2 100.0 Total Expenditure 5219.4 7093.7 8371.8 10336.8 10017.2 11328.2 14556.7 17183.6 15786.4
Source: National Bank of Ethiopia, Annual Report 2001/2002, Addis Ababa, March 2003
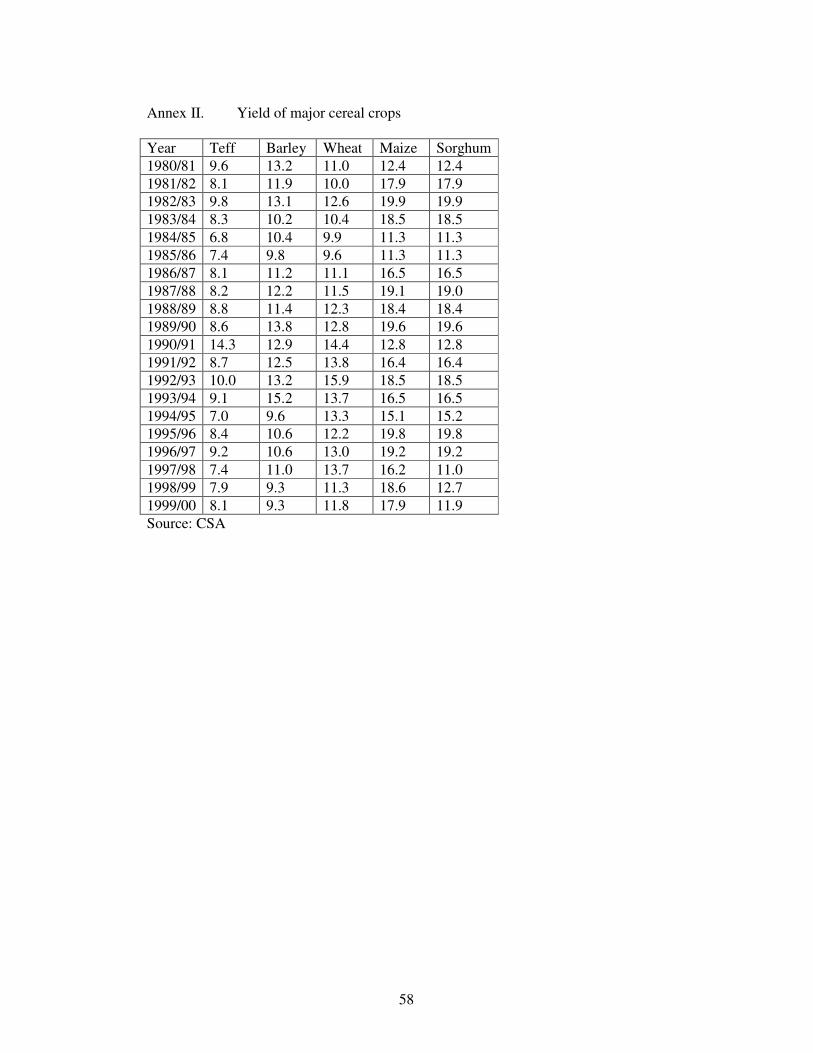
58
Annex II. Yield of major cereal crops Year Teff Barley Wheat Maize Sorghum 1980/81 9.6 13.2 11.0 12.4 12.4 1981/82 8.1 11.9 10.0 17.9 17.9 1982/83 9.8 13.1 12.6 19.9 19.9 1983/84 8.3 10.2 10.4 18.5 18.5 1984/85 6.8 10.4 9.9 11.3 11.3 1985/86 7.4 9.8 9.6 11.3 11.3 1986/87 8.1 11.2 11.1 16.5 16.5 1987/88 8.2 12.2 11.5 19.1 19.0 1988/89 8.8 11.4 12.3 18.4 18.4 1989/90 8.6 13.8 12.8 19.6 19.6 1990/91 14.3 12.9 14.4 12.8 12.8 1991/92 8.7 12.5 13.8 16.4 16.4 1992/93 10.0 13.2 15.9 18.5 18.5 1993/94 9.1 15.2 13.7 16.5 16.5 1994/95 7.0 9.6 13.3 15.1 15.2 1995/96 8.4 10.6 12.2 19.8 19.8 1996/97 9.2 10.6 13.0 19.2 19.2 1997/98 7.4 11.0 13.7 16.2 11.0 1998/99 7.9 9.3 11.3 18.6 12.7 1999/00 8.1 9.3 11.8 17.9 11.9 Source: CSA