Embed Size (px)
Citation preview
Envelope Tracking
for TD-LTE terminals
White Paper
Nujira Ltd
February 2014
TD-LTE pushes TX
bandwidth up by 5x and
doubles peak power
consumption. ET restores
the balance, making TD-LTE
more energy efficient than
FD-LTE, not less.
17 February 2014 www.nujira.com 1
Executive Summary
More than 60 operators have committed
to deploy TD-LTE networks, with high
profile deployments in China, the US and
India, and all major device OEMs have
commercially launched TD-LTE
compatible devices. A recent market
report forecasts TD-LTE subscriptions
will reach nearly 1 billion by 2020, with
TD-LTE device shipments expected to
pass 100 million units in 2014 alone.
Most operators, including China Mobile,
are expected to deploy TD-LTE with an
asymmetric timeslot allocation of 4:1
(download:upload) to reflect aggregate
data traffic across the network. For
handset OEMs and chipset vendors, this
presents a significant challenge, as
handsets are only able to transmit for a
fifth of the time.
For a given data throughput, the
transmit bandwidth and power has to be
five times higher than FD-LTE,
increasing transmit power by 7dB. The
effect of this is to double the
instantaneous current consumed by the
RF PA during transmit bursts.
Nujira’s analysis of TD-LTE network drive
test statistics shows that 50% of the PA
energy consumption is at high
power/high bandwidth.
ET is crucial for reducing the peak power
consumption, so the most significant
power savings from ET can only be
achieved by solutions that can support
these higher bandwidths in ET mode.
Lower performance ET solutions have to
fall back to Average Power Tracking
(APT) mode at high bandwidths,
eliminating the performance advantage
of ET and complicating the software
development for chipset vendors.
Nujira, the world leader in Envelope
Tracking, has characterized several ET
PAs with 20 MHz TD-LTE waveforms,
using Nujira’s Coolteq.L ETIC, the
world’s highest performance ET solution.
Nujira’s fast switching ETIC is able to
rapidly transition between a low power
standby mode in the downlink (RX)
slots, and full power ET mode for the
uplink (TX) slots, maximizing the energy
savings in TD-LTE mode.
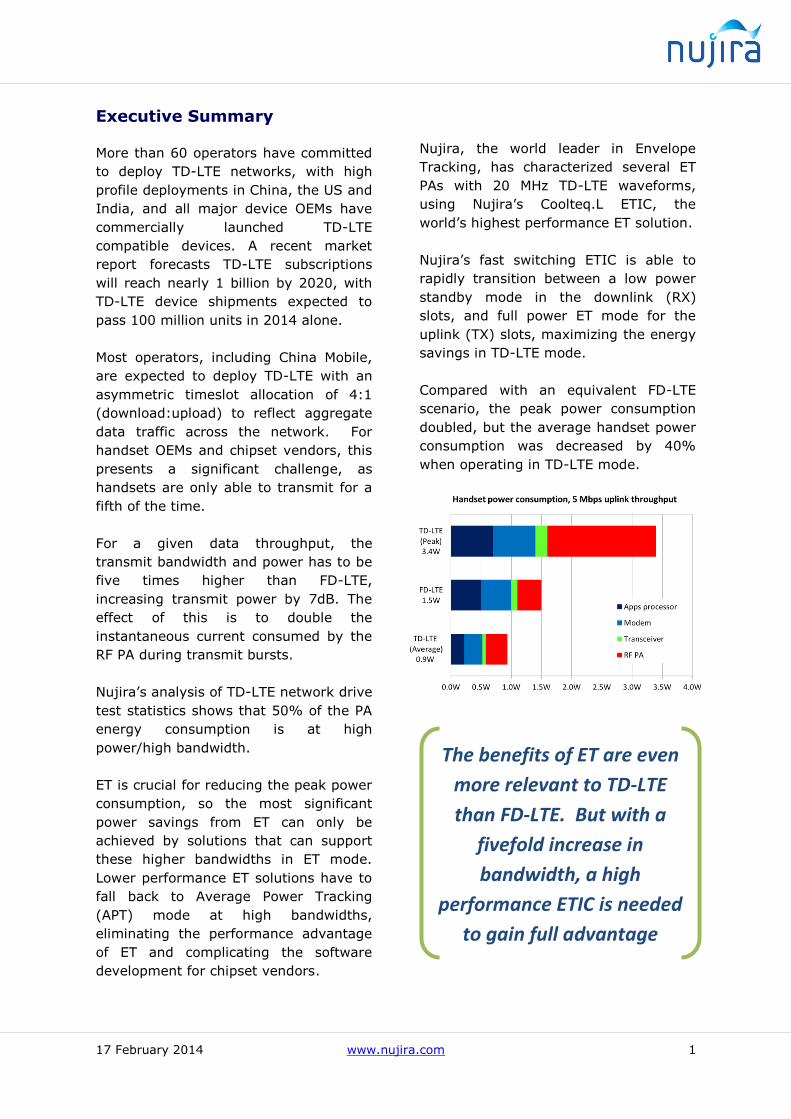
Compared with an equivalent FD-LTE
scenario, the peak power consumption
doubled, but the average handset power
consumption was decreased by 40%
when operating in TD-LTE mode.
The benefits of ET are even
more relevant to TD-LTE
than FD-LTE. But with a
fivefold increase in
bandwidth, a high
performance ETIC is needed
to gain full advantage
17 February 2014 www.nujira.com 2
What is Envelope Tracking?
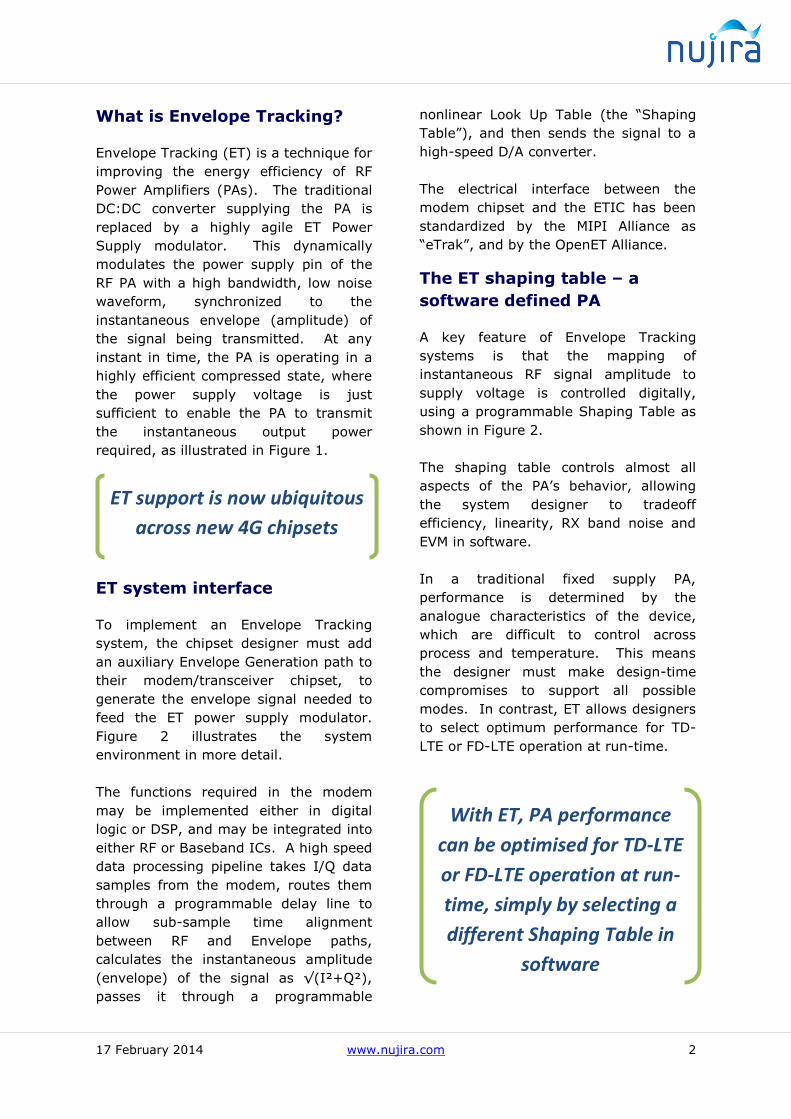
Envelope Tracking (ET) is a technique for
improving the energy efficiency of RF
Power Amplifiers (PAs). The traditional
DC:DC converter supplying the PA is
replaced by a highly agile ET Power
Supply modulator. This dynamically
modulates the power supply pin of the
RF PA with a high bandwidth, low noise
waveform, synchronized to the
instantaneous envelope (amplitude) of
the signal being transmitted. At any
instant in time, the PA is operating in a
highly efficient compressed state, where
the power supply voltage is just
sufficient to enable the PA to transmit
the instantaneous output power
required, as illustrated in Figure 1.
ET system interface
To implement an Envelope Tracking
system, the chipset designer must add
an auxiliary Envelope Generation path to
their modem/transceiver chipset, to
generate the envelope signal needed to
feed the ET power supply modulator.
Figure 2 illustrates the system
environment in more detail.
The functions required in the modem
may be implemented either in digital
logic or DSP, and may be integrated into
either RF or Baseband ICs. A high speed
data processing pipeline takes I/Q data
samples from the modem, routes them
through a programmable delay line to
allow sub-sample time alignment
between RF and Envelope paths,
calculates the instantaneous amplitude
(envelope) of the signal as √(I²+Q²),
passes it through a programmable
nonlinear Look Up Table (the “Shaping
Table”), and then sends the signal to a
high-speed D/A converter.
The electrical interface between the
modem chipset and the ETIC has been
standardized by the MIPI Alliance as
“eTrak”, and by the OpenET Alliance.
The ET shaping table – a
software defined PA
A key feature of Envelope Tracking
systems is that the mapping of
instantaneous RF signal amplitude to
supply voltage is controlled digitally,
using a programmable Shaping Table as
shown in Figure 2.
The shaping table controls almost all
aspects of the PA’s behavior, allowing
the system designer to tradeoff
efficiency, linearity, RX band noise and
EVM in software.
In a traditional fixed supply PA,
performance is determined by the
analogue characteristics of the device,
which are difficult to control across
process and temperature. This means
the designer must make design-time
compromises to support all possible
modes. In contrast, ET allows designers
to select optimum performance for TD-
LTE or FD-LTE operation at run-time.
ET support is now ubiquitous
across new 4G chipsets
With ET, PA performance
can be optimised for TD-LTE
or FD-LTE operation at run-
time, simply by selecting a
different Shaping Table in
software
17 February 2014 www.nujira.com 3
FD-LTE transceivers suffer from potential
desensitisation of the receiver due to leakage
of out-of-band noise from the PA, via the
duplex filter. This requires an ET shaping
table which compromises on efficiency in
order to minimise the noise in the RX band.
For most FD-LTE bands, it is noise in the RX
band, rather than ACLR or EVM, which limits
the performance of the PA.
In TD-LTE operation, where the TX and RX
paths are not operated simultaneously, a
different shaping table can be loaded which
operates the PA deeper into compression,
enabling greater energy efficiency, while
complying with ACLR and EVM requirements.
Switching between shaping tables can take
place in a few microseconds, making it
possible to handover between TD-LTE and FD-
LTE bands using the same PA chain.
Figure 2 - Envelope Tracking signal processing chain (courtesy of OpenET Alliance)
Figure 1 - Envelope Tracking PA Operation
17 February 2014 www.nujira.com 4
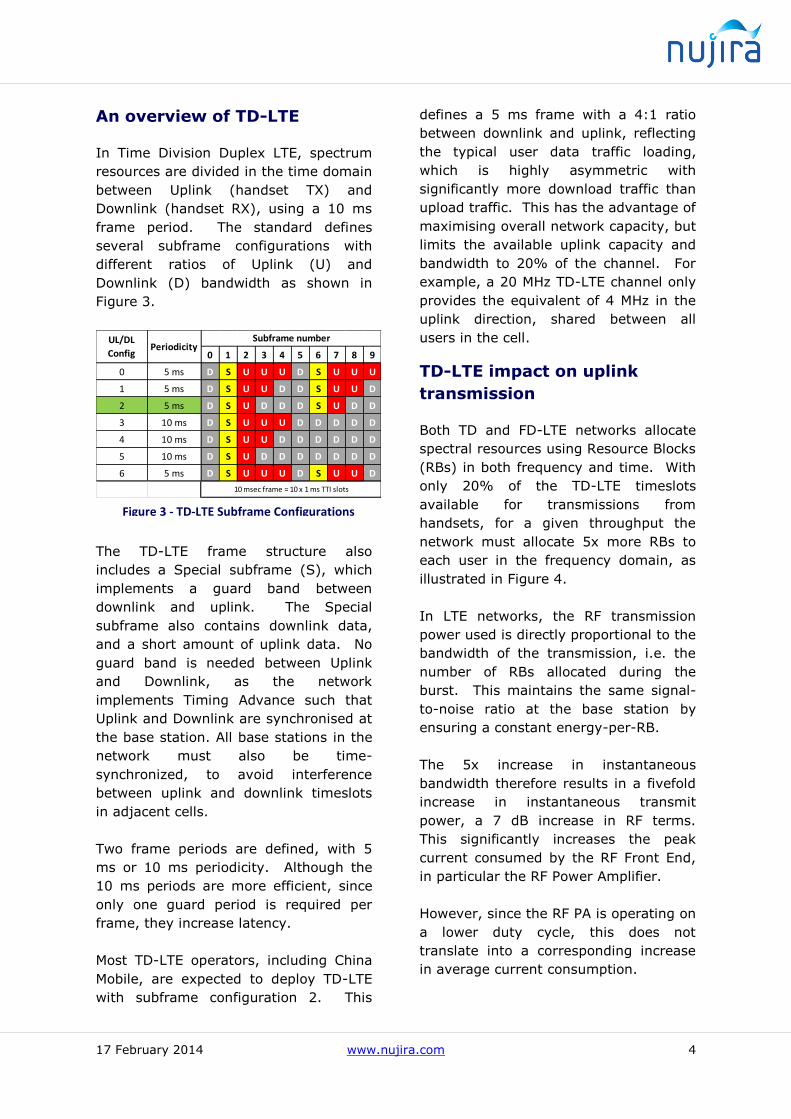
An overview of TD-LTE
In Time Division Duplex LTE, spectrum
resources are divided in the time domain
between Uplink (handset TX) and
Downlink (handset RX), using a 10 ms
frame period. The standard defines
several subframe configurations with
different ratios of Uplink (U) and
Downlink (D) bandwidth as shown in
Figure 3.
The TD-LTE frame structure also
includes a Special subframe (S), which
implements a guard band between
downlink and uplink. The Special
subframe also contains downlink data,
and a short amount of uplink data. No
guard band is needed between Uplink
and Downlink, as the network
implements Timing Advance such that
Uplink and Downlink are synchronised at
the base station. All base stations in the
network must also be time-
synchronized, to avoid interference
between uplink and downlink timeslots
in adjacent cells.
Two frame periods are defined, with 5
ms or 10 ms periodicity. Although the
10 ms periods are more efficient, since
only one guard period is required per
frame, they increase latency.
Most TD-LTE operators, including China
Mobile, are expected to deploy TD-LTE
with subframe configuration 2. This
defines a 5 ms frame with a 4:1 ratio
between downlink and uplink, reflecting
the typical user data traffic loading,
which is highly asymmetric with
significantly more download traffic than
upload traffic. This has the advantage of
maximising overall network capacity, but
limits the available uplink capacity and
bandwidth to 20% of the channel. For
example, a 20 MHz TD-LTE channel only
provides the equivalent of 4 MHz in the
uplink direction, shared between all
users in the cell.
TD-LTE impact on uplink
transmission
Both TD and FD-LTE networks allocate
spectral resources using Resource Blocks
(RBs) in both frequency and time. With
only 20% of the TD-LTE timeslots
available for transmissions from
handsets, for a given throughput the
network must allocate 5x more RBs to
each user in the frequency domain, as
illustrated in Figure 4.
In LTE networks, the RF transmission
power used is directly proportional to the
bandwidth of the transmission, i.e. the
number of RBs allocated during the
burst. This maintains the same signal-
to-noise ratio at the base station by
ensuring a constant energy-per-RB.
The 5x increase in instantaneous
bandwidth therefore results in a fivefold
increase in instantaneous transmit
power, a 7 dB increase in RF terms.
This significantly increases the peak
current consumed by the RF Front End,
in particular the RF Power Amplifier.
However, since the RF PA is operating on
a lower duty cycle, this does not
translate into a corresponding increase
in average current consumption.
0 1 2 3 4 5 6 7 8 9
0 5 ms D S U U U D S U U U
1 5 ms D S U U D D S U U D
2 5 ms D S U D D D S U D D
3 10 ms D S U U U D D D D D
4 10 ms D S U U D D D D D D
5 10 ms D S U D D D D D D D
6 5 ms D S U U U D S U U D
Subframe numberUL/DL
ConfigPeriodicity
10 msec frame = 10 x 1 ms TTI slots
Figure 3 - TD-LTE Subframe Configurations

17 February 2014 www.nujira.com 5
Handset TX power comparison
To quantify the handset power
consumption between FD-LTE and TD-
LTE networks, we assumed a scenario
with a constant 5 mbps uplink
throughput. With a QPSK transmission,
this corresponds to 15RBs in the FD-LTE
case. We modelled the uplink
transmission power for the FD-LTE
scenario at 16 dBm average power level.
In the TD-LTE scenario, 75RBs were
allocated on 20% of the timeslots. The
5x bandwidth increase gave a
corresponding 7 dB increase in transmit
power, from 16 dBm to 23 dBm.
In the most common 4:1
configuration, TD-LTE
terminals must transmit 5x
the bandwidth at 7 dB more
power to achieve the
equivalent FD-LTE uplink
throughput
RX
RX
RX
RX
RX
RX
RX
RX
RX
TX
TX
TX
TX
TX
TX
TX
TX
TX
TX
RX RX RX RX TX RX RX RX RX TX RX RX RX RX TX RX RX RX RX TX
FD-LTE TD-LTEUE 1 uplink UE 2 uplink UE3 uplink UE 4 uplink UE5 uplink UE6 uplink Downlink RBs
Freq
uen
cy /
Ban
dw
idth
TimeTime
Figure 4 - Comparison of FD-LTE and TD-LTE (type 2) uplink traffic
Figure 5 – Uplink bandwidth and TX power level assumptions for 5 Mbps throughput
17 February 2014 www.nujira.com 6
TD-LTE drive test statistics
To validate the theory that TD-LTE
pushes up the instantaneous transmit
power and bandwidth simultaneously,
we analysed drive test data from a 20
MHz TD-LTE network operator, operating
over a range of signal strength
conditions during both uplink and
downlink throughput tests. A non-ET
terminal was used, based on a
Qualcomm chipset.
The raw data was then grouped into
signal strength ‘bins’ based on the RSRP,
the Reference Signal Received Power
measured by the handset, which is a
good indicator of signal strength.
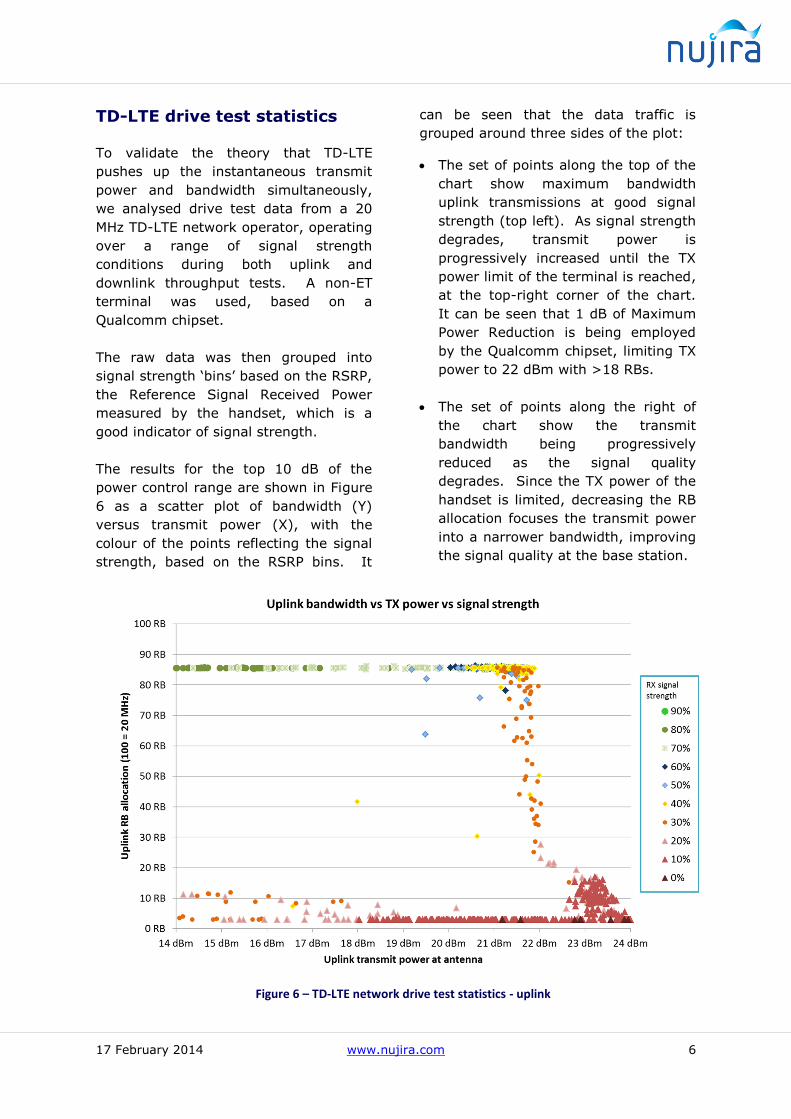
The results for the top 10 dB of the
power control range are shown in Figure
6 as a scatter plot of bandwidth (Y)
versus transmit power (X), with the
colour of the points reflecting the signal
strength, based on the RSRP bins. It
can be seen that the data traffic is
grouped around three sides of the plot:
The set of points along the top of the
chart show maximum bandwidth
uplink transmissions at good signal
strength (top left). As signal strength
degrades, transmit power is
progressively increased until the TX
power limit of the terminal is reached,
at the top-right corner of the chart.
It can be seen that 1 dB of Maximum
Power Reduction is being employed
by the Qualcomm chipset, limiting TX
power to 22 dBm with >18 RBs.
The set of points along the right of
the chart show the transmit
bandwidth being progressively
reduced as the signal quality
degrades. Since the TX power of the
handset is limited, decreasing the RB
allocation focuses the transmit power
into a narrower bandwidth, improving
the signal quality at the base station.
Figure 6 – TD-LTE network drive test statistics - uplink
17 February 2014 www.nujira.com 7
Finally, the set of points along the
bottom of the graph show low
bandwidth transmissions at a variety
of power levels. The low bandwidth
transmissions with good signal quality
(bottom left) are generally packet
acknowledgements for downlink
traffic.
The data shows that in this network, the
scheduler chose to allocate high
bandwidth data bursts wherever
possible, until the transmit power
limitations of the handset forced the
bandwidth to be reduced. It should of
course be noted that this is a single
network drive test on a lightly loaded
network, but we believe that the
principles remain valid across TD-LTE
networks.
TD-LTE PA energy
consumption statistics
Analysing uplink power control statistics
without considering the PA energy
consumption can give misleading
conclusions. Since transmit power is
almost always expressed on a
logarithmic scale, the PA consumes
much more energy at high RF power
levels. Based on the statistical
distribution across bandwidth and
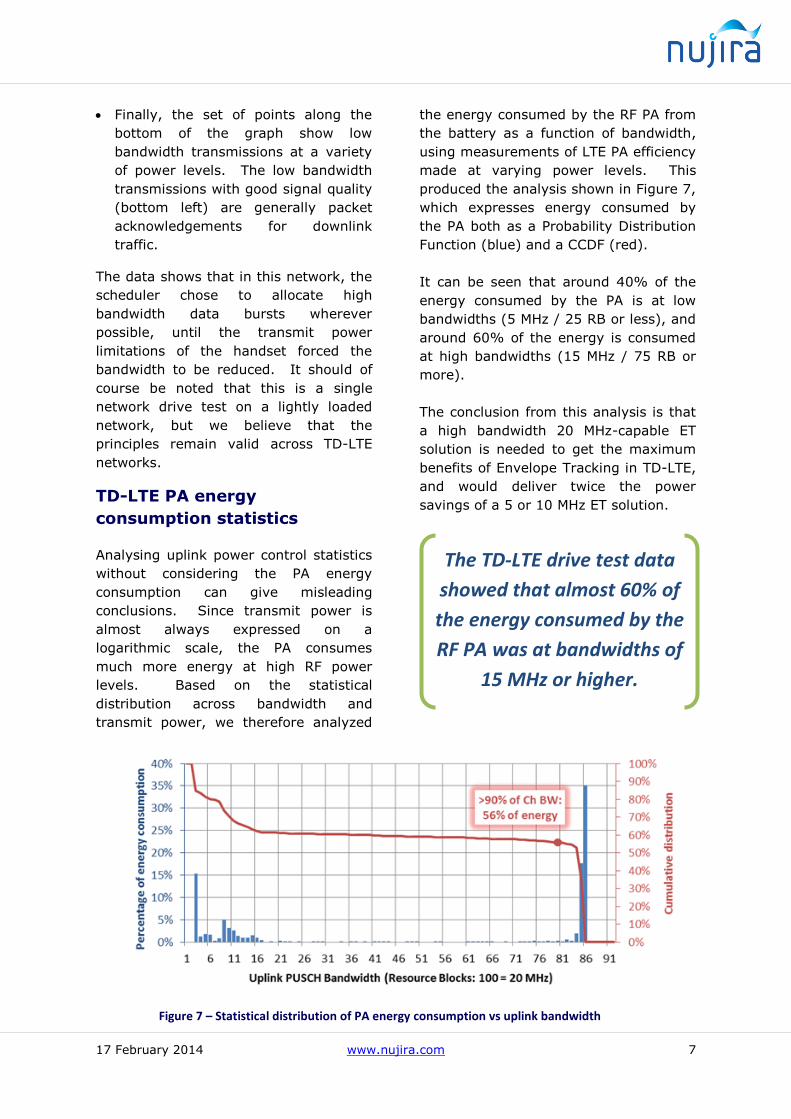
transmit power, we therefore analyzed
the energy consumed by the RF PA from
the battery as a function of bandwidth,
using measurements of LTE PA efficiency
made at varying power levels. This
produced the analysis shown in Figure 7,
which expresses energy consumed by
the PA both as a Probability Distribution
Function (blue) and a CCDF (red).
It can be seen that around 40% of the
energy consumed by the PA is at low
bandwidths (5 MHz / 25 RB or less), and
around 60% of the energy is consumed
at high bandwidths (15 MHz / 75 RB or
more).
The conclusion from this analysis is that
a high bandwidth 20 MHz-capable ET
solution is needed to get the maximum
benefits of Envelope Tracking in TD-LTE,
and would deliver twice the power
savings of a 5 or 10 MHz ET solution.
The TD-LTE drive test data
showed that almost 60% of
the energy consumed by the
RF PA was at bandwidths of
15 MHz or higher.
Figure 7 – Statistical distribution of PA energy consumption vs uplink bandwidth

17 February 2014 www.nujira.com 8
Modelling handset energy
consumption
Based on the 5 Mbps uplink throughput
scenario described earlier, we then
modelled the overall handset power
consumption, broken down into 4
subsystems:
Application Processor – assumed to
be generating the data traffic;
Modem – running LTE protocol
software and digital baseband
functions;
Transceiver – RF upconversion /
downconversion;
RF Power Amplifier – transmitting
the required signal.
The Application Processor, Modem and
Transceiver power consumption were
estimated, based on industry
benchmarks. The RF Power Amplifier
power consumption was measured,
using Nujira’s ET Surface Explorer ETPA
characterization system, configured with
representative LTE waveforms at the two
different power levels.
In the “bursty” TD-LTE case, the power
consumption estimates for the AP,
Modem and Transceiver power
consumption were modelled to increase
during the uplink (TX) slots, to take into
account the increased instantaneous
data rate relative to the FD-LTE
scenario.
During the TD-LTE downlink (RX) slots,
the Modem and AP power consumption
estimates were reduced, rather than
zeroed, to take into account the
background tasks of application-layer &
MAC-layer buffering of the traffic.
The RF PA power consumption was
measured assuming a 4 dB front-end
loss, at 16 dBm and 23 dBm antenna
power.
As shown in Figure 8, the peak power
consumption during TD-LTE uplink
bursts was around 2x the FD-LTE
consumption, but the average power
consumption across the whole frame
was reduced from 1500 mW to 880 mW,
a saving of around 40%.
This reduction was due partly to the
increased energy efficiency of the RF PA
when operating at high power, and
partly due to the reduction in overhead
from the LTE modem and application
processor, which can be shut down
during the RX slots instead of having to
operate continuously at lower
bandwidths.
This saving in average power
consumption also translates into a
thermal benefit, due to the
corresponding reduction in waste heat
generated by the components.
Figure 8 – Handset energy consumption model, FD-LTE vs TD-LTE
17 February 2014 www.nujira.com 9
ET measurements with TD-LTE
waveforms
To use Envelope Tracking with a TD-LTE
system imposes several challenging
requirements on the ETIC
implementation:
Fast transitions from Active ET to
standby mode and vice-versa;
Low power consumption in standby
mode during the RX timeslots;
High ET-mode bandwidth, due to the
limited duty cycle available for
uplink transmissions;
High efficiency at high ET
bandwidths, needed to maximize the
power savings from ET;
High output power, due to the
statistical increase in TX power and
the desire to avoid Maximum Power
Reduction waivers.
Nujira’s NCT-L1300 ETIC meets all these
requirements, and can operate in ET
mode at the full 20 MHz bandwidth
required for TD-LTE, typically delivering
in excess of 28 dBm at the PA output.
Measuring ET solutions in TD-LTE
scenarios is more complicated than FD-
LTE measurements, due to the need to
generate time-aligned MIPI RF Front End
(RFFE) control sequences to change the
operating mode of ETIC and RFPA
synchronously with the burst structure of
the RF and Envelope waveforms.
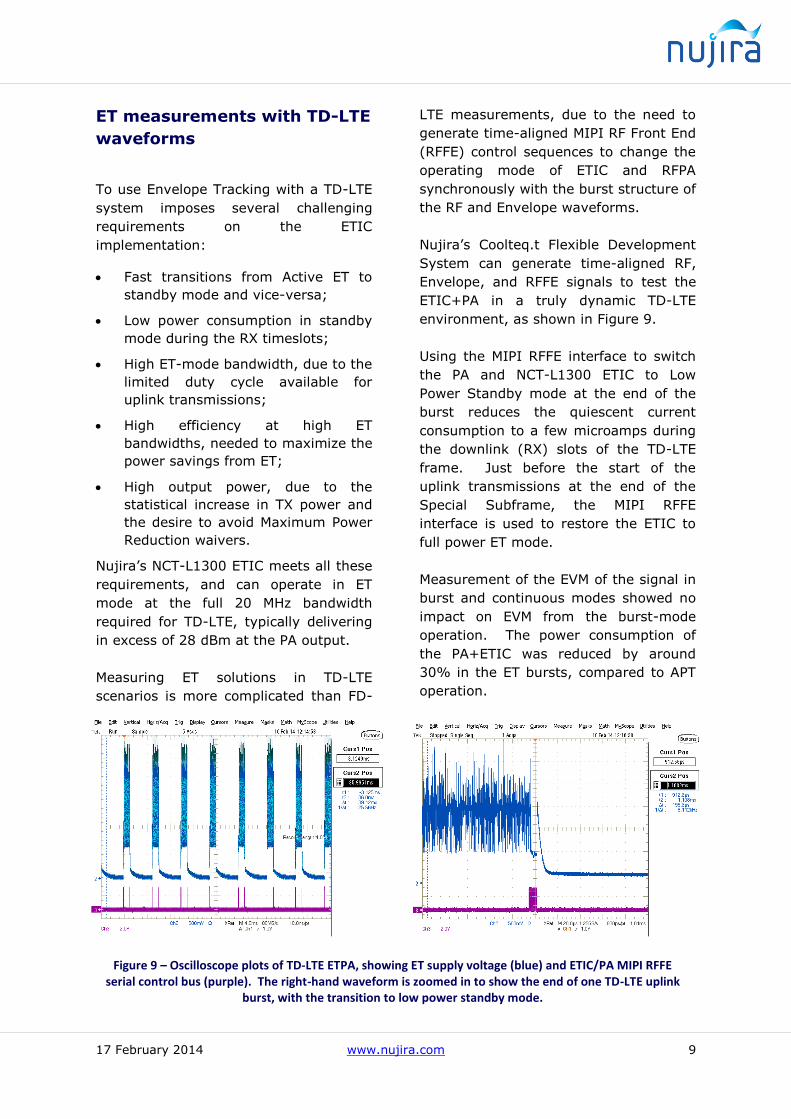
Nujira’s Coolteq.t Flexible Development
System can generate time-aligned RF,
Envelope, and RFFE signals to test the
ETIC+PA in a truly dynamic TD-LTE
environment, as shown in Figure 9.
Using the MIPI RFFE interface to switch
the PA and NCT-L1300 ETIC to Low
Power Standby mode at the end of the
burst reduces the quiescent current
consumption to a few microamps during
the downlink (RX) slots of the TD-LTE
frame. Just before the start of the
uplink transmissions at the end of the
Special Subframe, the MIPI RFFE
interface is used to restore the ETIC to
full power ET mode.
Measurement of the EVM of the signal in
burst and continuous modes showed no
impact on EVM from the burst-mode
operation. The power consumption of
the PA+ETIC was reduced by around
30% in the ET bursts, compared to APT
operation.
Figure 9 – Oscilloscope plots of TD-LTE ETPA, showing ET supply voltage (blue) and ETIC/PA MIPI RFFE serial control bus (purple). The right-hand waveform is zoomed in to show the end of one TD-LTE uplink
burst, with the transition to low power standby mode.
17 February 2014 www.nujira.com 10
Conclusions
With TD-LTE networks being deployed in
an asymmetric configuration for
improved network efficiency, uplink
capacity and throughput are getting
squeezed in comparison to FD-LTE
networks, compromising the user
experience for data uploads.
The most commonly deployed TD-LTE
networks will tend to push up
instantaneous transmit power by 7 dB,
and transmit bandwidth by a factor of 5
compared to FD-LTE networks.
The corresponding increase in peak
current consumption, which can be
double that of FD-LTE, makes the case
for adding Envelope Tracking even more
compelling, with ET typically reducing
the peak current consumption of the RF
PA by 30%.
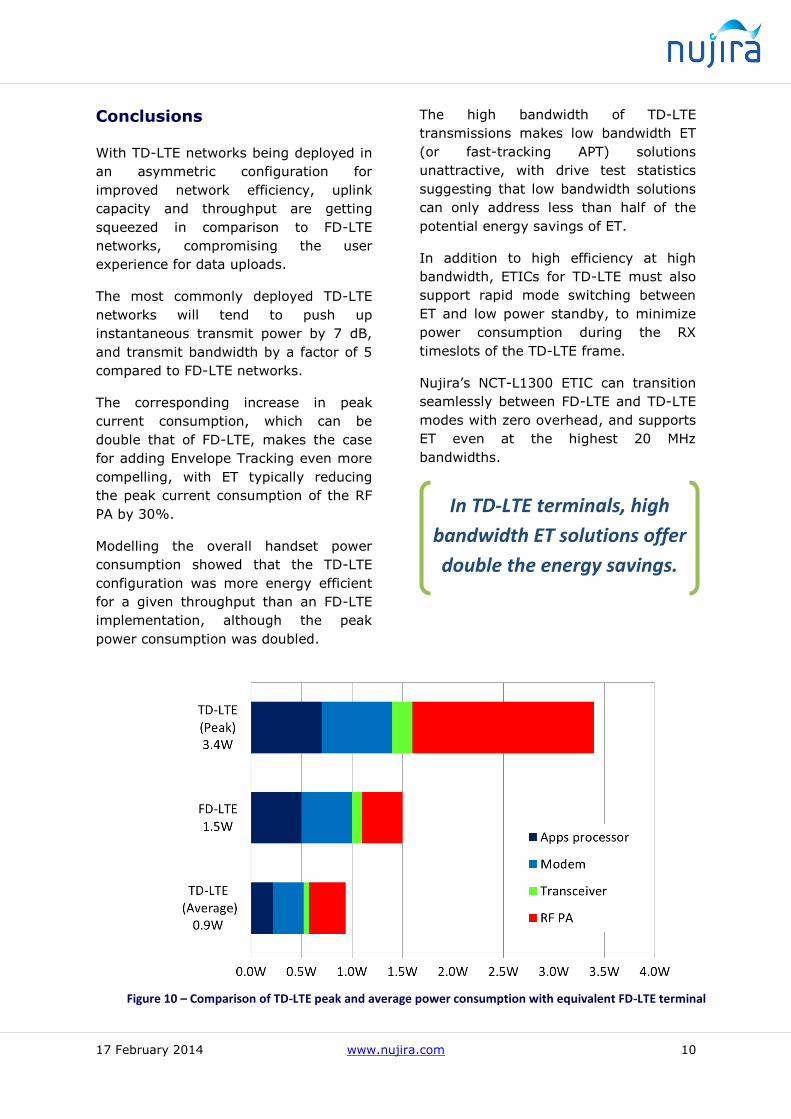
Modelling the overall handset power
consumption showed that the TD-LTE
configuration was more energy efficient
for a given throughput than an FD-LTE
implementation, although the peak
power consumption was doubled.
The high bandwidth of TD-LTE
transmissions makes low bandwidth ET
(or fast-tracking APT) solutions
unattractive, with drive test statistics
suggesting that low bandwidth solutions
can only address less than half of the
potential energy savings of ET.
In addition to high efficiency at high
bandwidth, ETICs for TD-LTE must also
support rapid mode switching between
ET and low power standby, to minimize
power consumption during the RX
timeslots of the TD-LTE frame.
Nujira’s NCT-L1300 ETIC can transition
seamlessly between FD-LTE and TD-LTE
modes with zero overhead, and supports
ET even at the highest 20 MHz
bandwidths.
In TD-LTE terminals, high
bandwidth ET solutions offer
double the energy savings.
Figure 10 – Comparison of TD-LTE peak and average power consumption with equivalent FD-LTE terminal