Embed Size (px)
Citation preview
N A S A TECHNICAL. JiHP̂ Ki NASA TM X-2091MEMORANDUM
CDCM
as
C4'
ESTIMATED AERODYNAMICS OF ALL-BODY
HYPERSONIC AIRCRAFT CONFIGURATIONS
by Lams J. Williams
Office of Advanced Research and Technology *
Mission Analysis Division
Moffett Field, Calif. 94035
NATIONAL AERONAUTICS AND SPACE ADMINISTRATION . WASHINGTON, D. C. - MARCH 1971
https://ntrs.nasa.gov/search.jsp?R=19710010231 2018-07-27T21:36:33+00:00Z
1. Report No.
NASA TM X-2091
4. Title and Subtitle
ESTIMATED AERODYNAMICS OFAIRCRAFT CONFIGURATIONS
2. Government Accession No.
All ROHY HVPPR^OMIP
7. Author(s)
Louis J. Williams
9. Performing Organization Name and Address
Office of Advanced Research and TechnologyMission Analysis DivisionMoffett Field, Calif. 94035
12. Sponsoring Agency Name and Address
National Aeronautics and Space AdministrationWashington, D. C. 20546
3.
5.
6.
8.
10.
11.
13.
14.
Recipient's Catalog No.
Report DateMarch 1971
Performing Organization Code
Performing Organization Report No.
A-3637
Work Unit No.
789-50-01-01-15
Contract or Grant No.
Type of Report and Period Covered
Technical Memorandum
Sponsoring Agency Code
15. Supplementary Notes
16. Abstract
The results of analyses for estimating the aerodynamics of a representative family of all-bodyhypersonic aircraft configurations are presented. The configuration body shape is a delta planformwith an elliptical cone forebody and an elliptical cross-section afterbody. Semiempirical andtheoretical predictions of the aerodynamic characteristics of the forebody are compared withavailable experimental data to show the reliability of the basic methods.
Results are presented for aerodynamic performance, surface temperatures, and staticlongitudinal and directional stability. Aerodynamic perf&rmance of the all-body configurations ispresented in the form of th'e'effe'ct'pn co.mplete configuration maximum lift-to-drag ratio of Machnumber, configuration geometry, and maximum allowable leading-edge temperature. Variations inthe basic all-body shape were investigated using three independent;',-shape: parameters; bodyleading-edge sweep, position of breakpoint between forebody and afterbody', and ratio of maximumcross section to body planform area. The third shape parameter had the strongest influence on theaerodynamic performance.
Studies of the radiation equilibrium surface temperature show that the temperatures on thelower surface resulting from the inherent low lift loading of the all-body configuration are less thanwould be expected for higher lift-loading configurations. A brief analysis of vehicle stability andcontrol showed that using a canard for trim instead of horizontal fins reduced trim drag penalties.
17. Key Words (Suggested by Author(s))
AerodynamicsAll-Body Hypersonic Aircraft
19. Security Classif. (of this report)
Unclassified
18. Distribution Statement
Unclassified— Unlimited
20. Security Classif. (of this page) 21. No. of Pages 22. Price"
Unclassified 37 $3.00
For sale by the National Technical Information Service, Springfield, Virginia 22151

SYMBOLS
a speed of sound, ft/sec
ao speed of sound at sea level, ft/sec
n
u major/minor axis ratio of fore body elliptical cross sections
span2
AR aspect ratio,plan area
bpiN fin span, ft
Cj coefficient multiplying sin a in CL expression
C2 coefficient multiplying sin2 a in CL expression
C£)RR bluntness drag coefficient for body (nose)
Crjop bluntness drag coefficient for fins (leading edges)
CDFR friction drag coefficient for body
C-DpF friction drag coefficient for fins
CD- induced drag coefficient
Cn zero-lift drag coefficient
C-DOR zero-lift drag coefficient for body
C-DOF zero-lift drag coefficient for fins
CD D pressure drag coefficient for body
CD p pressure drag coefficient for fins
CDY drag coefficient of type X
CDY drag coefficient of ty pe X for fins
lift coefficient
c,
cp
P? D
CPBASE
e
h
KM
moment coefficient about body center of gravity
pressure coefficient
two-dimensional truncated base pressure coefficient
pressure coefficient on configuration afterbody
base of natural logarithms
altitude, ft
Mach number coefficient for Crj. equation
body length, ft
forebody length, ft
MAX
_LS
M
(MAC)pIN
MCRIT
liftmaximum ratio
drag
planform lift loading, lb/ft2
Mach number
mean aerodynamic chord of body, ft
mean aerodynamic chord of fin, ft
critical Mach number for Mach cone intersection with forebody surface
i.o
MMAX
M0
MSA
Mach number for maximum nose and fin leading-edge radiation equilibriumtemperature
free-stream Mach number
Mach number for shock attachment to leading edge
IV
q
Re
rLEFIN
rNOSE
S
STT
SCA
SFIN
SHT
SREF
SVT
SWET
(SWET)F]
(-1\C/BODY
V/FIN
ILE
w,GTO
ya
dynamic pressure, lb/ft2
Reynolds number
fin leading-edge radius, ft
nose radius, ft
plan form area, ft2
maximum cross-sectional area, ft2
canard planform area, ft2
fin planform area, ft2
total horizontal fin planform area, ft2
reference area used in aerodynamic coefficients (body planform area), ft2
total vertical fin profile area, ft2
wetted surface area, ft2
wetted surface area of fin, ft2
thickness ratio of body
thickness ratio of fin
leading-edge radiation equilibrium temperature, °R
gross takeoff weight, lb
length of boundary-layer run used in Re, ft
semispan station (length from centerline/semispan)
angle of attack, deg
0 compressibility factor (|M2 — I I ) 1 ' 2
7 ratio of specific heats
5 deflection angle, deg
canard deflection angle with respect to body (positive = leading edge up), deg
horizontal fin deflection angle with respect to body (positive = leading edge up),deg
e emissivity
eSKIN surface emissivity
0g included angle of body, deg
X fin taper ratio
A leading-edge sweep angle, measured from axis perpendicular to body centerline, deg
fin leading-edge sweep angle, deg
free-stream coefficient of viscosity, Ib sec/ft2
density, slugs/ft3
gross body density (gross takeoff weight/theoretical body volume), lb/ft3
free-stream air density, slugs/ft3
sea-level air density, slugs/ft3
3Qn/-ip— partial derivative of Cmrr with respect to a, 1 /deg
VI
ESTIMATED AERODYNAMICS OF ALL-BODY HYPERSONIC
AIRCRAFT CONFIGURATIONS
Louis J. Williams
Office of Advanced Research and TechnologyMission Analysis Division
Moffett Field, California 94035
SUMMARY
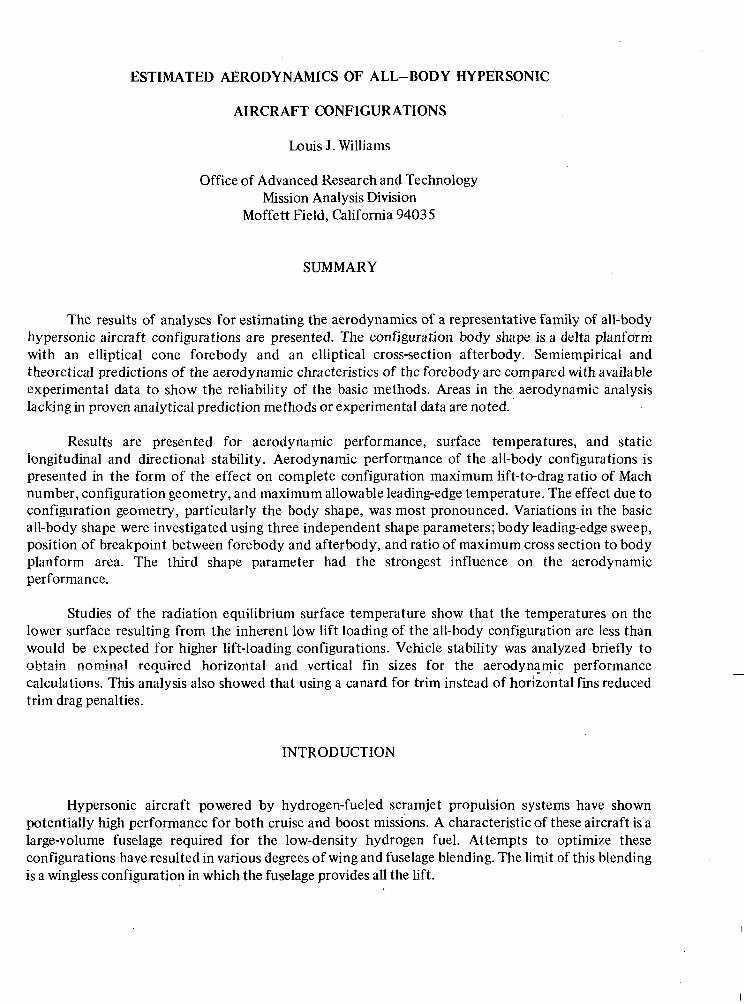
The results of analyses for estimating the aerodynamics of a representative family of all-bodyhypersonic aircraft configurations are presented. The configuration body shape is a delta planformwith an elliptical cone forebody and an elliptical cross-section afterbody. Semiempirical andtheoretical predictions of the aerodynamic chracteristics of the forebody are compared with availableexperimental data to show the reliability of the basic methods. Areas in the aerodynamic analysislacking in proven analytical prediction methods or experimental data are noted.
Results are presented for aerodynamic performance, surface temperatures, and staticlongitudinal and directional stability. Aerodynamic performance of the all-body configurations ispresented in the form of the effect on complete configuration maximum lift-to-drag ratio of Machnumber, configuration geometry, and maximum allowable leading-edge temperature. The effect due toconfiguration geometry, particularly the body shape, was most pronounced. Variations in the basicall-body shape were investigated using three independent shape parameters; body leading-edge sweep,position of breakpoint between forebody and afterbody, and ratio of maximum cross section to bodyplanform area. The third shape parameter had the strongest influence on the aerodynamicperformance.
Studies of the radiation equilibrium surface temperature show that the temperatures on thelower surface resulting from the inherent low lift loading of the all-body configuration are less thanwould be expected for higher lift-loading configurations. Vehicle stability was analyzed briefly toobtain nominal required horizontal and vertical fin sizes for the aerodynamic performancecalculations. This analysis also showed that using a canard for trim instead of horizontal fins reducedtrim drag penalties.
INTRODUCTION
Hypersonic aircraft powered by hydrogen-fueled scramjet propulsion systems have shownpotentially high performance for both cruise and boost missions. A characteristic of these aircraft is alarge-volume fuselage required for the low-density hydrogen fuel. Attempts to optimize theseconfigurations have resulted in various degrees of wing and fuselage blending. The limit of this blendingis a wingless configuration in which the fuselage provides all the lift.
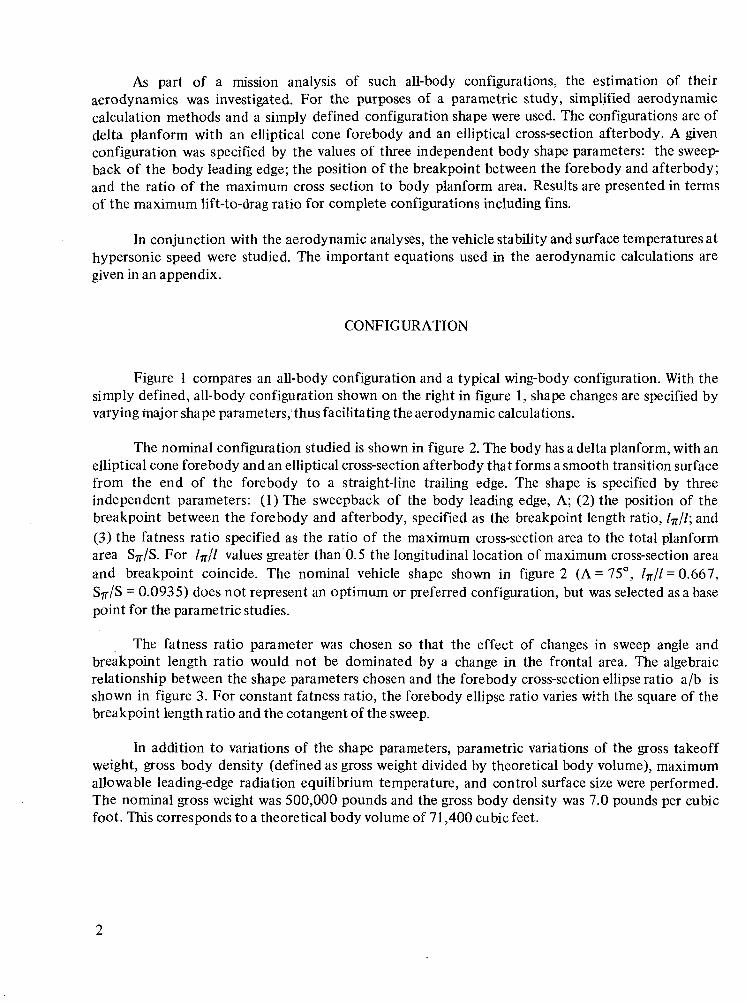
As part of a mission analysis of such all-body configurations, the estimation of theiraerodynamics was investigated. For the purposes of a parametric study, simplified aerodynamiccalculation methods and a simply defined configuration shape were used. The configurations are ofdelta planform with an elliptical cone forebody and an elliptical cross-section afterbody. A givenconfiguration was specified by the values of three independent body shape parameters: the sweep-back of the body leading edge; the position of the breakpoint between the forebody and afterbody;and the ratio of the maximum cross section to body planform area. Results are presented in termsof the maximum lift-to-drag ratio for complete configurations including fins.
In conjunction with the aerodynamic analyses, the vehicle stability and surface temperatures athypersonic speed were studied. The important equations used in the aerodynamic calculations aregiven in an appendix.
CONFIGURATION
Figure 1 compares an all-body configuration and a typical wing-body configuration. With thesimply defined, all-body configuration shown on the right in figure 1, shape changes are specified byvarying major shape parameters,1 thus facilitating the aerodynamic calculations.
The nominal configuration studied is shown in figure 2. The body has a delta planform, with anelliptical cone forebody and an elliptical cross-section afterbody that forms a smooth transition surfacefrom the end of the forebody to a straight-line trailing edge. The shape is specified by threeindependent parameters: (1) The sweepback of the body leading edge, A; (2) the position of thebreakpoint between the forebody and afterbody, specified as the breakpoint length ratio, 1-̂ /1; and(3) the fatness ratio specified as the ratio of the maximum cross-section area to the total planformarea S^/S. For l^jl values greater than 0.5 the longitudinal location of maximum cross-section areaand breakpoint coincide. The nominal vehicle shape shown in figure 2 (A =75°, 1^/1-0.661,STT/S = 0.0935) does not represent an optimum or preferred configuration, but was selected as a basepoint for the parametric studies.
The fatness ratio parameter was chosen so that the effect of changes in sweep angle andbreakpoint length ratio would not be dominated by a change in the frontal area. The algebraicrelationship between the shape parameters chosen and the forebody cross-section ellipse ratio a/b isshown in figure 3. For constant fatness ratio, the forebody ellipse ratio varies with the square of thebreakpoint length ratio and the cotangent of the sweep.
In addition to variations of the shape parameters, parametric variations of the gross takeoffweight, gross body density (defined as gross weight divided by theoretical body volume), maximumallowable leading-edge radiation equilibrium temperature, and control surface size were performed.The nominal gross weight was 500,000 pounds and the gross body density was 7.0 pounds per cubicfoot. This corresponds to a theoretical body volume of 71,400 cubic feet.
METHODS OF ESTIMATING AERODYNAMICS
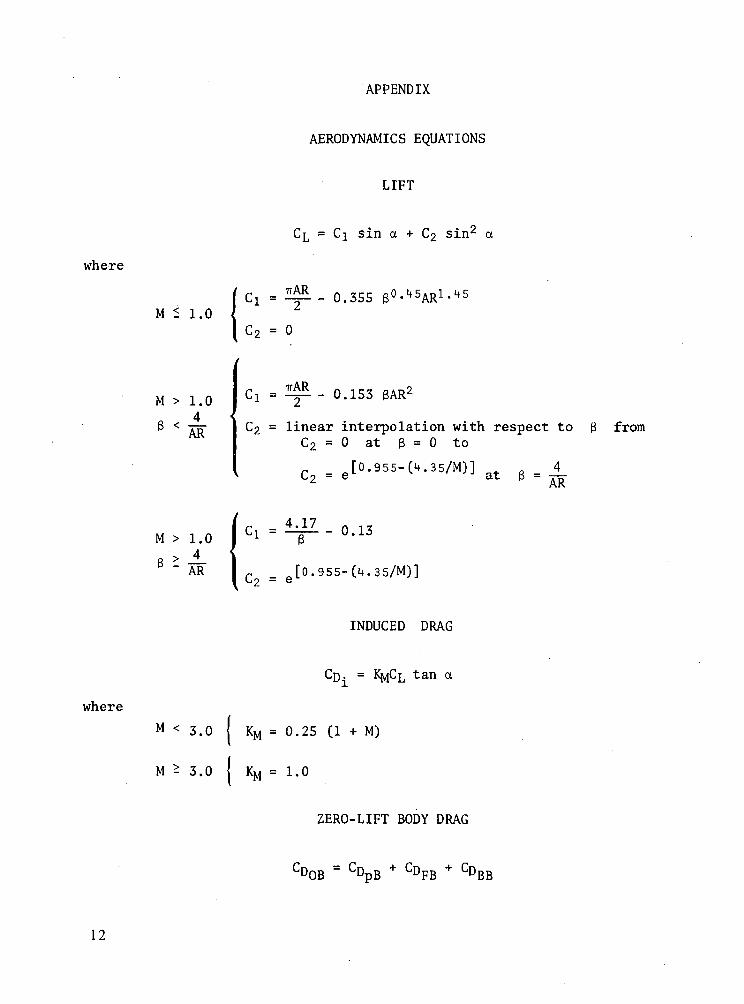
lift
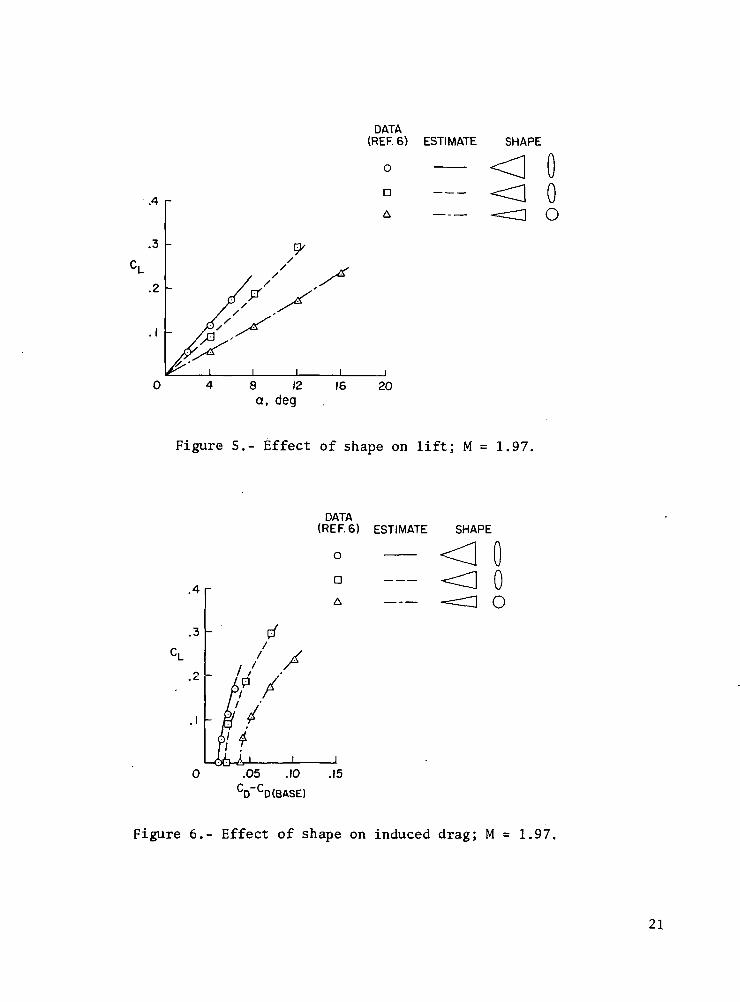
The basic configuration aerodynamics were calculated using a computer program whichincorporated the equations outlined in the appendix. The lift (and induced drag) equations for thebasic body were estimated by means of nonlinear relations similar to those used in reference 1 for adelta wing. These equations were developed by curve fitting data for low aspect ratio wings fromreferences 2, 3, and 4 and applying Gothert's rule or shock-expansion theory, where applicable. Thecoefficients used in these equations were modified to account for the rounded leading edge of theall-body configuration, which causes linear subsonic variation of the elliptic-cone lift coefficient asopposed to the significant nonlinear variation present for the sharp leading edge of a delta wing. Thiscomparison is shown in figure 4 for a Mach number of 0.6; the effect of Mach number on the estimatedelliptic cone lift coefficient is also shown. These curves agreed well with experimental data fromreference 5. Figure 5 shows the effect of shape on the estimated lift coefficient; also shown areexperimental data from reference 6 which show agreement. At present, experimental data are availableonly for the elliptical cone forebody. The estimation equations used depend only on planform shape,but agree well with thick or thin elliptical cone shapes. Therefore, the effect of the body thicknessdistribution of the all-body configuration on the lift curve is neglected.
Induced Drag
The induced drag relation used the equation for the sharp leading-edge delta wing modified by acoefficient to account for the rounded leading edge of the elliptic cone, which resulted in lea ding-edgesuction subsonically. The effect of shape on the induced drag and a comparison with experimental dataare given in figure 6. The effect of Mach number on the induced drag is shown in figure 7. These curvescorrelated well with experimental data.
Zero- Lift Body Drag
The zero-lift drag coefficient Cj)m of the basic body was obtained by adding the pressure (or
wave), skin friction, and nose bluntness drag components. The Mach number range determined themethod used to calculate each of these components.
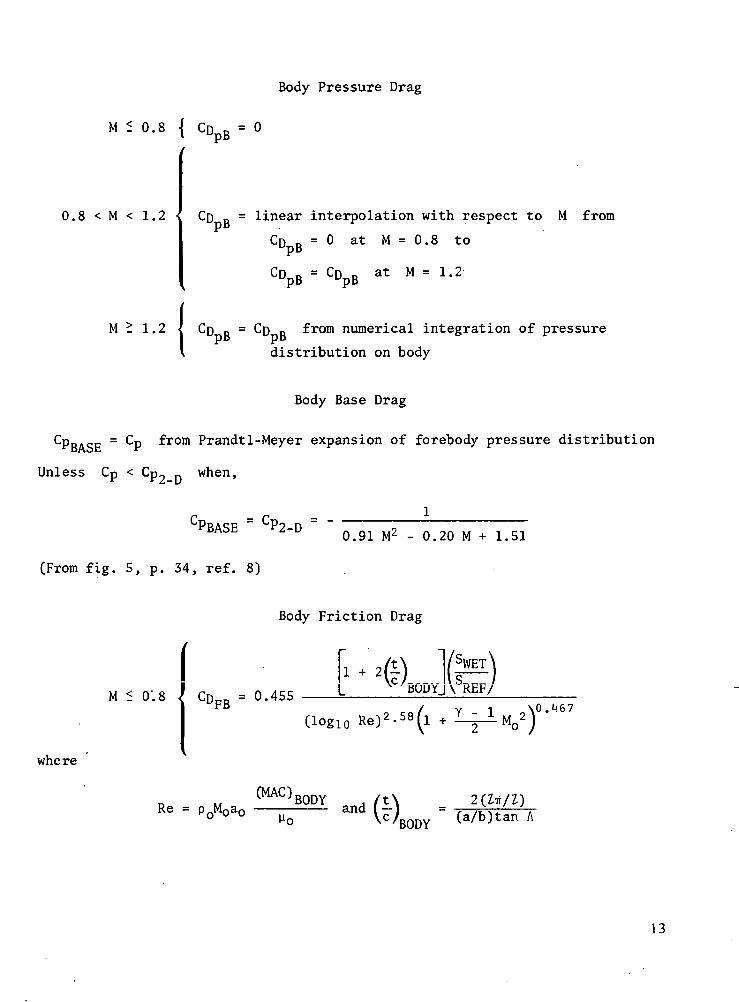
Body pressure drag— Subsonically (M<0.8), the pressure drag was assumed zero; normallythis term would be small and the hypersonic vehicle mission performance is relatively insensitive tosubsonic drag because of small loiter time subsonically. Transonically (0.8 < M < 1.2), the pressuredrag was assumed to vary linearly with Mach number.
Supersonically (1.2 < M < M^j^jj), the wave drag was obtained by numerical integration of
the body pressure distribution. For M < MQ^J j (the critical Mach number for the intersection of
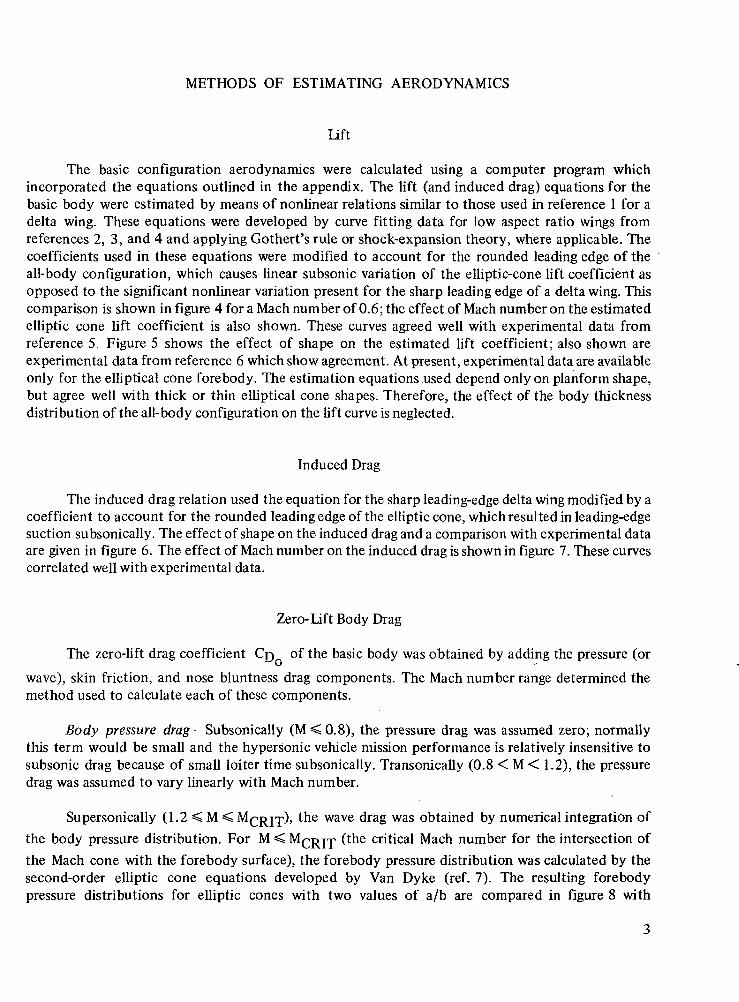
the Mach cone with the forebody surface), the forebody pressure distribution was calculated by thesecond-order elliptic cone equations developed by Van Dyke (ref. 7). The resulting forebodypressure distributions for elliptic cones with two values of a/b are compared in figure 8 with
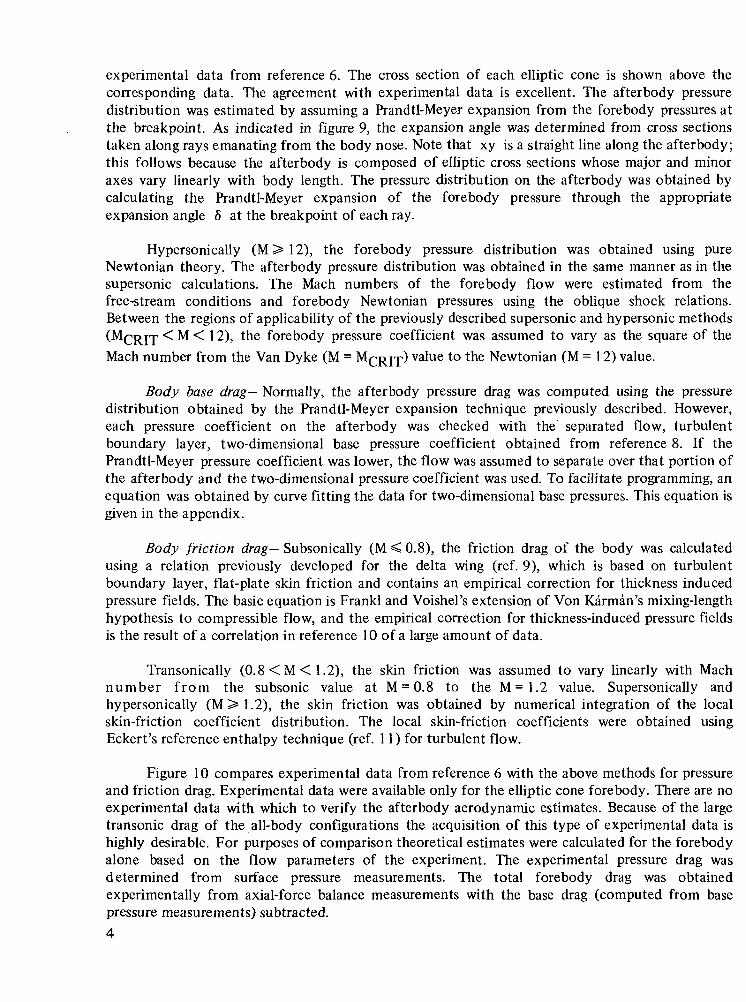
experimental data from reference 6. The cross section of each elliptic cone is shown above thecorresponding data. The agreement with experimental data is excellent. The afterbody pressuredistribution was estimated by assuming a Prandtl-Meyer expansion from the forebody pressures atthe breakpoint. As indicated in figure 9, the expansion angle was determined from cross sectionstaken along rays emanating from the body nose. Note that xy is a straight line along the afterbody;this follows because the afterbody is composed of elliptic cross sections whose major and minoraxes vary linearly with body length. The pressure distribution on the afterbody was obtained bycalculating the Prandtl-Meyer expansion of the forebody pressure through the appropriateexpansion angle 5 at the breakpoint of each ray.
Hypersonically (M > 1 2), the forebody pressure distribution was obtained using pureNewtonian theory. The afterbody pressure distribution was obtained in the same manner as in thesupersonic calculations. The Mach numbers of the forebody flow were estimated from thefree-stream conditions and forebody Newtonian pressures using the oblique shock relations.Between the regions of applicability of the previously described supersonic and hypersonic methods^CRIT < M < 1 2), the forebody pressure coefficient was assumed to vary as the square of theMach number from the Van Dyke (M = M^RJ-T;) value to the Newtonian (M = 1 2) value.
Body base drag— Normally, the afterbody pressure drag was computed using the pressuredistribution obtained by the Prandtl-Meyer expansion technique previously described. However,each pressure coefficient on the afterbody was checked with the separated flow, turbulentboundary layer, two-dimensional base pressure coefficient obtained from reference 8. If thePrandtl-Meyer pressure coefficient was lower, the flow was assumed to separate over that portion ofthe afterbody and the two-dimensional pressure coefficient was used. To facilitate programming, anequation was obtained by curve fitting the data for two-dimensional base pressures. This equation isgiven in the appendix.
Body friction drag— Subsonically (M<0.8), the friction drag of the body was calculatedusing a relation previously developed for the delta wing (ref. 9), which is based on turbulentboundary layer, flat-plate skin friction and contains an empirical correction for thickness inducedpressure fields. The basic equation is Frankl and Voishel's extension of Von Karman's mixing-lengthhypothesis to compressible flow, and the empirical correction for thickness-induced pressure fieldsis the result of a correlation in reference 10 of a large amount of data.
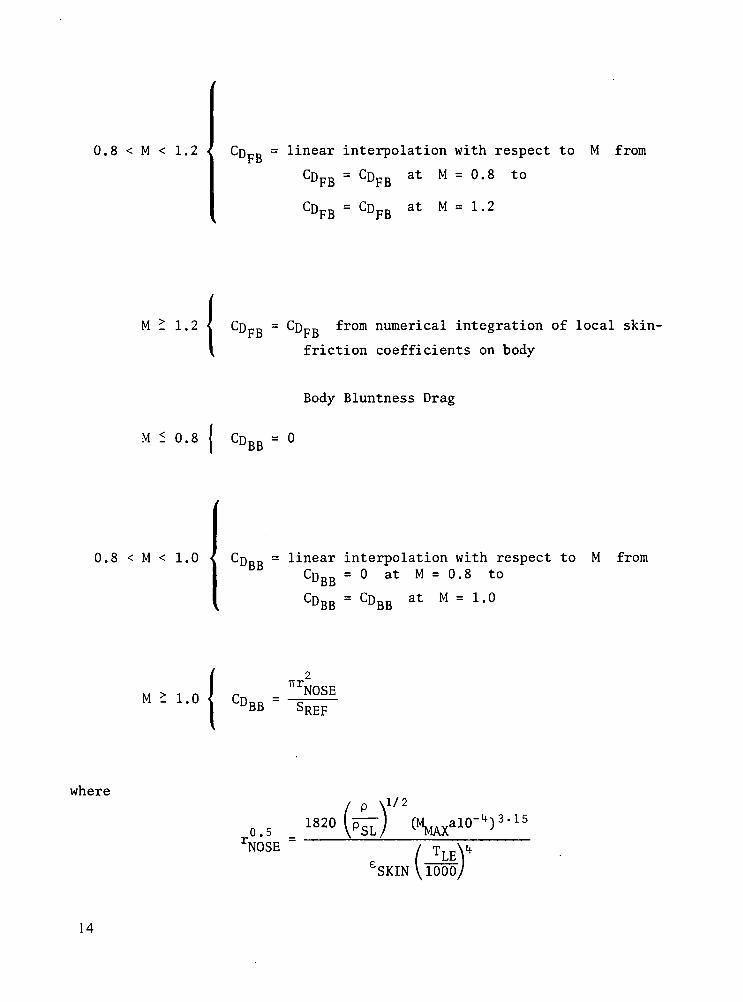
Transonically (0.8<M<1.2), the skin friction was assumed to vary linearly with Machnumber f rom the subsonic value at M = 0.8 to the M = 1 . 2 value. Supersonically andhypersonically (M > 1.2), the skin friction was obtained by numerical integration of the localskin-friction coefficient distribution. The local skin- friction coefficients were obtained usingEckert's reference enthalpy technique (ref. 11) for turbulent flow.
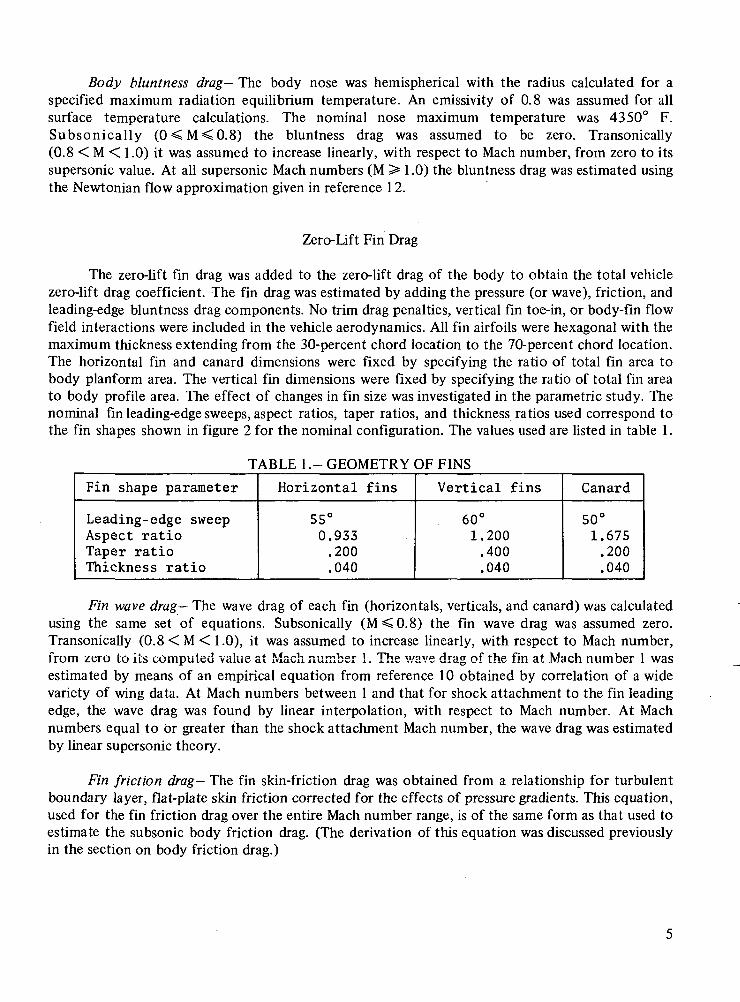
Figure 10 compares experimental data from reference 6 with the above methods for pressureand friction drag. Experimental data were available only for the elliptic cone forebody. There are noexperimental data with which to verify the afterbody aerodynamic estimates. Because of the largetransonic drag of the all-body configurations the acquisition of this type of experimental data ishighly desirable. For purposes of comparison theoretical estimates were calculated for the forebodyalone based on the flow parameters of the experiment. The experimental pressure drag wasdetermined from surface pressure measurements. The total forebody drag was obtainedexperimentally from axial-force balance measurements with the base drag (computed from basepressure measurements) subtracted.4
Body bluntness drag— The body nose was hemispherical with the radius calculated for aspecified maximum radiation equilibrium temperature. An emissivity of 0.8 was assumed for allsurface temperature calculations. The nominal nose maximum temperature was 4350° F.Subsonically (0<M<0.8) the bluntness drag was assumed to be zero. Transonically(0.8 < M < 1.0) it was assumed to increase linearly, with respect to Mach number, from zero to itssupersonic value. At all supersonic Mach numbers (M > 1.0) the bluntness drag was estimated usingthe Newtonian flow approximation given in reference 12.
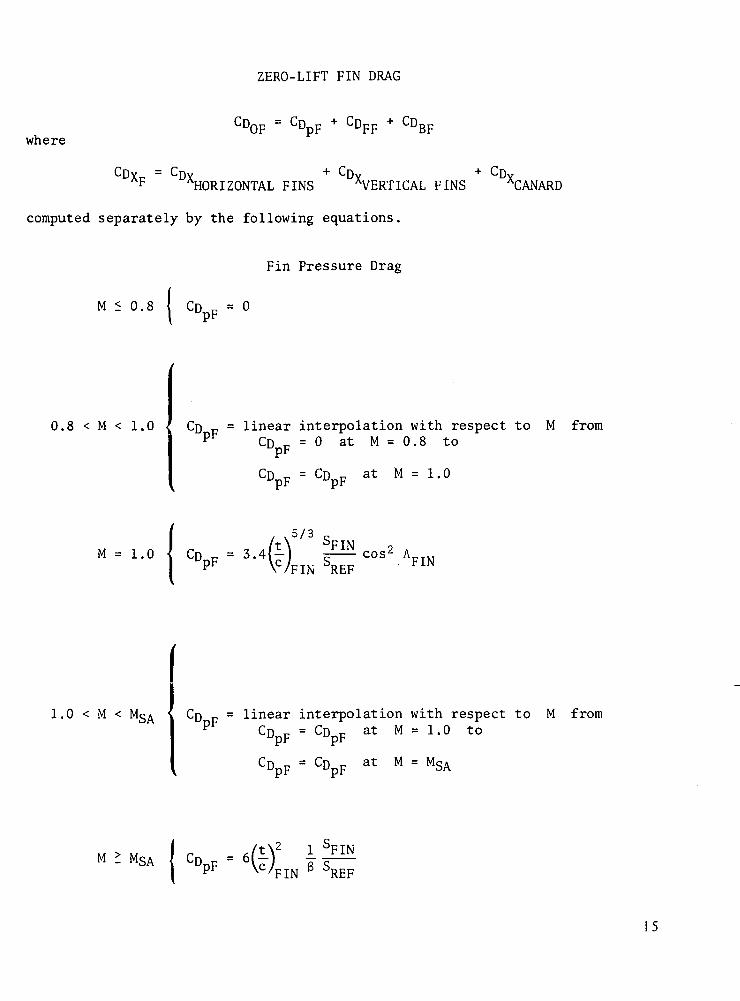
Zero-Lift Fin Drag
The zero-lift fin drag was added to the zero-lift drag of the body to obtain the total vehiclezero-lift drag coefficient. The fin drag was estimated by adding the pressure (or wave), friction, andleading-edge bluntness drag components. No trim drag penalties, vertical fin toe-in, or body-fin flowfield interactions were included in the vehicle aerodynamics. All fin airfoils were hexagonal with themaximum thickness extending from the 30-percent chord location to the 70-percent chord location.The horizontal fin and canard dimensions were fixed by specifying the ratio of total fin area tobody planform area. The vertical fin dimensions were fixed by specifying the ratio of total fin areato body profile area. The effect of changes in fin size was investigated in the parametric study. Thenominal fin leading-edge sweeps, aspect ratios, taper ratios, and thickness ratios used correspond tothe fin shapes shown in figure 2 for the nominal configuration. The values used are listed in table 1.
TABLE 1.- GEOMETRY OF FINS
Fin shape parameter
Leading- edge sweepAspect ratioTaper ratioThickness ratio
Horizontal fins
55°0.933.200.040
Vertical fins
. 60°1.200.400.040
Canard
50°1.675.200.040
Fin wave drag— The wave drag of each fin (horizontals, verticals, and canard) was calculatedusing the same set of equations. Subsonically (M<0.8) the fin wave drag was assumed zero.Transonically (0.8 < M < 1.0), it was assumed to increase linearly, with respect to Mach number,from zero to its computed value at Mach number 1. The v/ave drag of the fin at Mach number 1 wasestimated by means of an empirical equation from reference 10 obtained by correlation of a widevariety of wing data. At Mach numbers between 1 and that for shock attachment to the fin leadingedge, the wave drag was found by linear interpolation, with respect to Mach number. At Machnumbers equal to or greater than the shock attachment Mach number, the wave drag was estimatedby linear supersonic theory.
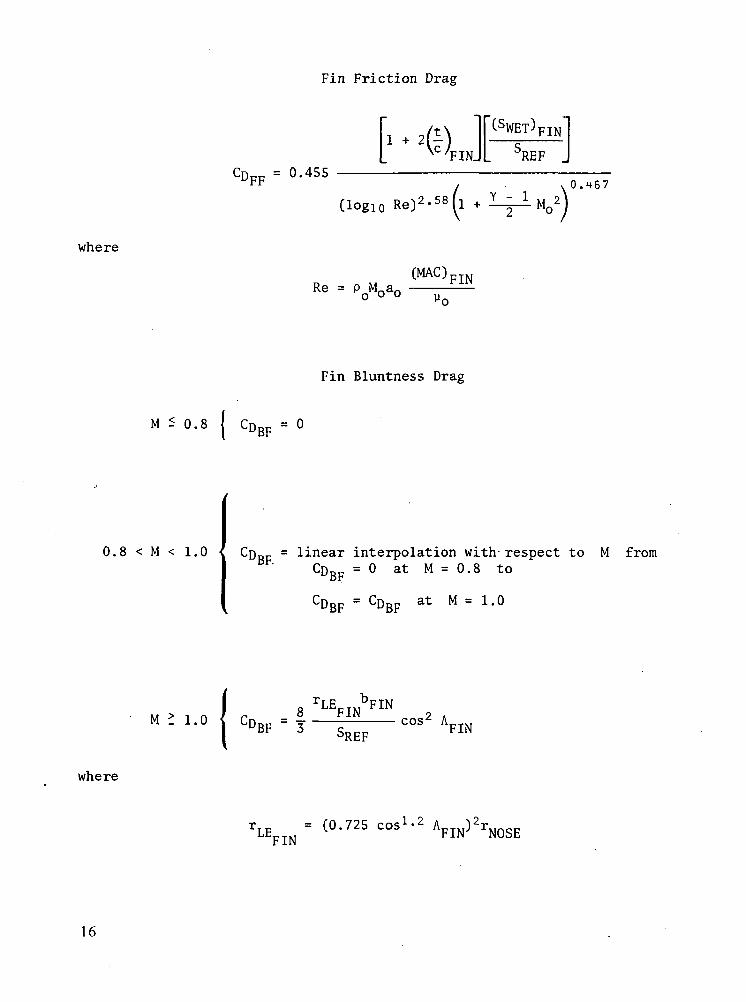
Fin friction drag— The fin skin-friction drag was obtained from a relationship for turbulentboundary layer, flat-plate skin friction corrected for the effects of pressure gradients. This equation,used for the fin friction drag over the entire Mach number range, is of the same form as that used toestimate the subsonic body friction drag. (The derivation of this equation was discussed previouslyin the section on body friction drag.)
Fin bluntness drag— The fin leading edges were cylindrical with the radius calculated for anominal radiation equilibrium temperature of 4350° R at the specified leading-edge sweep.Subsonically (0<M<0.8), the bluntness drag was assumed to be zero. Transonically(0.8 < M < 1,0), it was assumed to increase linearly, with respect to Mach number, from zero to itssupersonic value. At all Mach numbers greater than or equal to 1, the bluntness drag was estimatedfrom the Newtonian flow approximation (ref. 12).
Zero-Lift Drag Breakdown
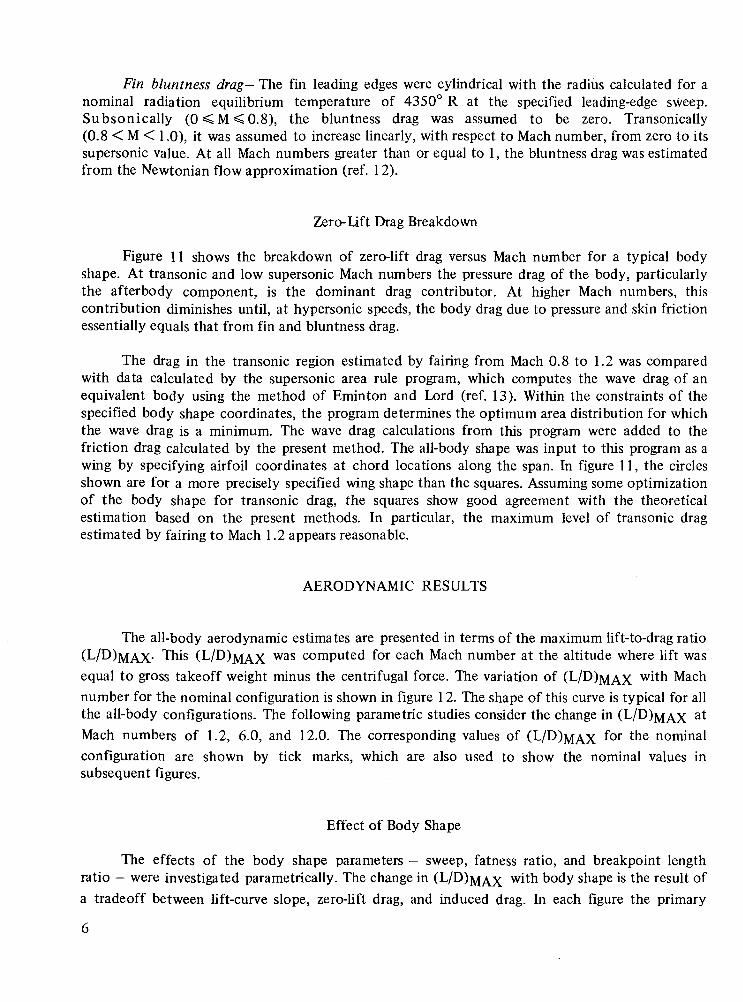
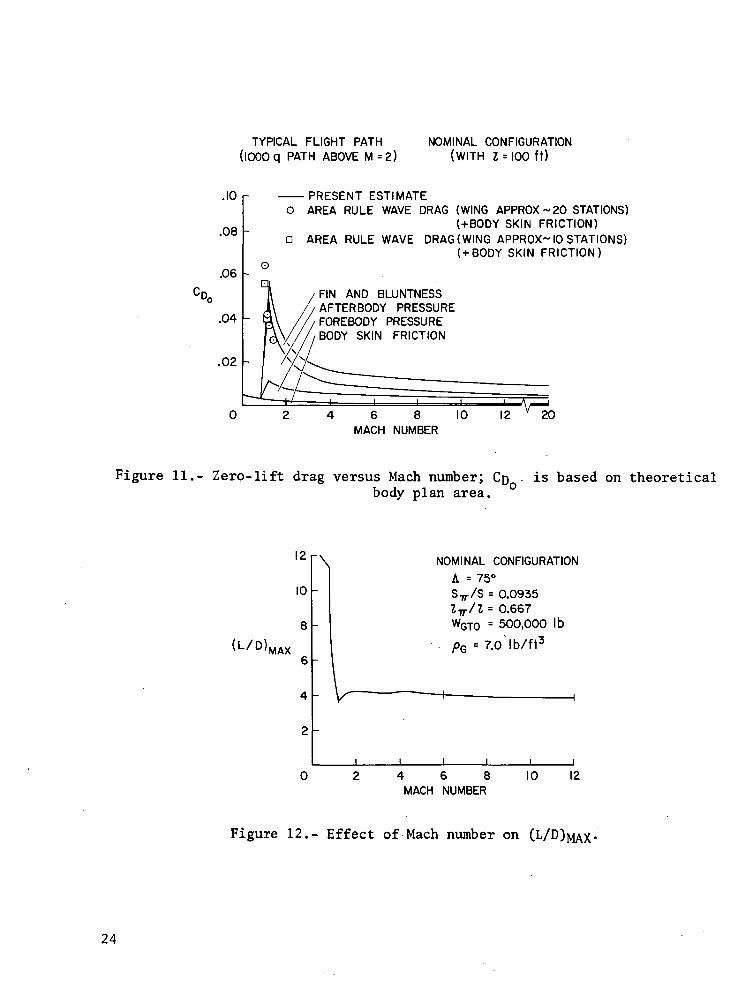
Figure 11 shows the breakdown of zero-lift drag versus Mach number for a typical bodyshape. At transonic and low supersonic Mach numbers the pressure drag of the body, particularlythe afterbody component, is the dominant drag contributor. At higher Mach numbers, thiscontribution diminishes until, at hypersonic speeds, the body drag due to pressure and skin frictionessentially equals that from fin and bluntness drag.
The drag in the transonic region estimated by fairing from Mach 0.8 to 1.2 was comparedwith data calculated by the supersonic area rule program, which computes the wave drag of anequivalent body using the method of Eminton and Lord (ref. 13). Within the constraints of thespecified body shape coordinates, the program determines the optimum area distribution for whichthe wave drag is a minimum. The wave drag calculations from this program were added to thefriction drag calculated by the present method. The all-body shape was input to this program as awing by specifying airfoil coordinates at chord locations along the span. In figure 11, the circlesshown are for a more precisely specified wing shape than the squares. Assuming some optimizationof the body shape for transonic drag, the squares show good agreement with the theoreticalestimation based on the present methods. In particular, the maximum level of transonic dragestimated by fairing to Mach 1.2 appears reasonable.
AERODYNAMIC RESULTS
The all-body aerodynamic estimates are presented in terms of the maximum lift-to-drag ratio(L/D)MAX- This (L/D)MAX was computed for each Mach number at the altitude where lift wasequal to gross takeoff weight minus the centrifugal force. The variation of (L/D)]y[AX with Machnumber for the nominal configuration is shown in figure 12. The shape of this curve is typical for allthe all-body configurations. The following parametric studies consider the change in (L/D)]yj^x at
Mach numbers of 1.2, 6.0, and 12.0. The corresponding values of (L/D)]y[^x f°r the nominalconfiguration are shown by tick marks, which are also used to show the nominal values insubsequent figures.
Effect of Body Shape
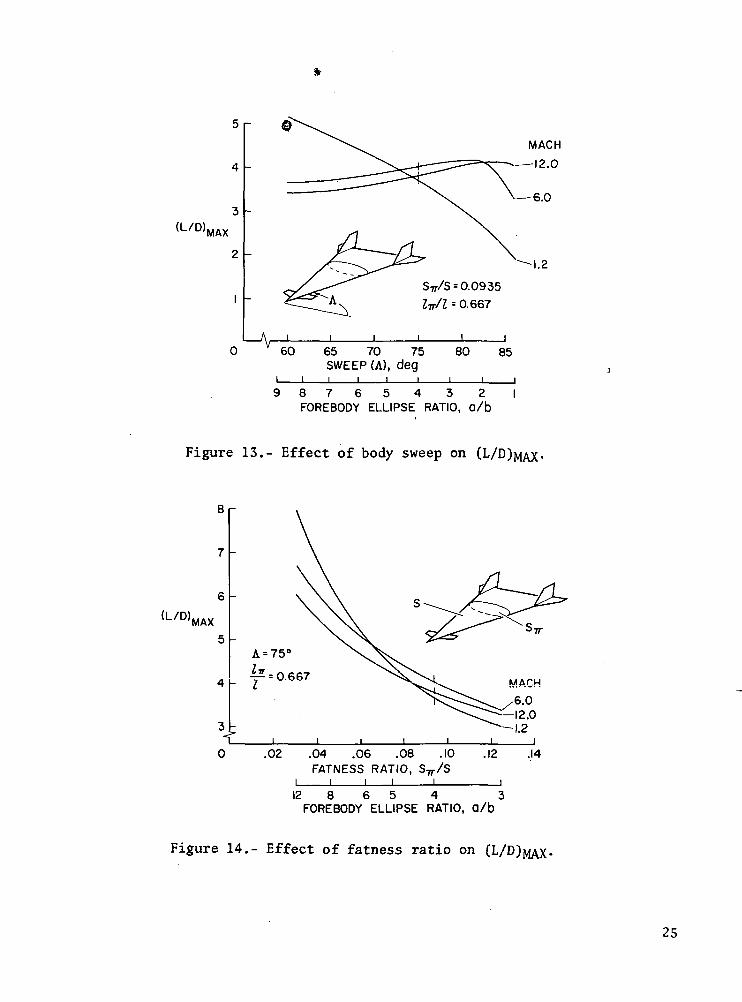
The effects of the body shape parameters — sweep, fatness ratio, and breakpoint lengthratio — were investigated parametrically. The change in (L/D)jy[AX with body shape is the result ofa tradeoff between lift-curve slope, zero-lift drag, and induced drag. In each figure the primary
factor causing the change in (L/D>MAX will be explained. As an aid to visualizing the changes in
body shape that result from changes in each parameter, the corresponding forebody ellipse ratio willalso be noted.
The effect of body leading-edge sweep is shown in figure 13. In the transonic region at aMach number of 1.2 the (L/D)j^AX decreases with increasing sweep primarily because of thedecreasing lift-curve slope. At a Mach number of 6.0 the (L/D)]yiAX increases with increasing sweepbecause of the decreasing forebody wave drag. However, at the higher sweeps (A>83°) thedecrease in wave drag is less significant, and the (L/D)j^ AX fa^s °^ because of the more dominantdecrease in lift-curve slope. At a Mach number of 12.0 the (L/D)MAX increases with increasingsweep due to the decreasing forebody wave drag.
Figure 14 shows the effect of fatness ratio. The fatness ratio, ratio of the maximum bodycross-section area to planform area, translates directly into the ratio of drag-producing frontal areato lift-producing planform area. Hence, for all Mach numbers, increasing fatness ratio results inincreasing zero-lift drag and drastically decreasing (L/D)MAX-
The effect of breakpoint length ratio is shown in figure 15. For all Mach numbers, increasingthe breakpoint length ratio results in decreasing forebody wave drag and increasing afterbodypressure drag. Because the afterbody pressure drag is a larger percentage of the overall drag at thelower Mach numbers, the increase in (L/D)j^AX with increasing breakpoint length ratio is not asrapid as for the higher Mach numbers.
Effect of Vehicle Size
The effect of vehicle takeoff weight is shown in figure 16 for the nominal configurationgeometry with a fixed gross body density of 7 pounds per cubic foot. For reference, thecorresponding vehicle length is also shown. The (L/D)MAX increases with increasing gross takeoffweight because the skin-friction drag coefficient decreases with increasing Reynolds number. Thechange is less significant at the lower Mach numbers where the skin friction is a smaller percentageof the overall drag. The effect of size is also strongest for small vehicles (less than 500,000 poundsgross takeoff weight) where the assumption of completely turbulent skin friction (which penalizesthe smaller vehicle) is less reasonable. This consideration would be of importance only for researchvehicles.
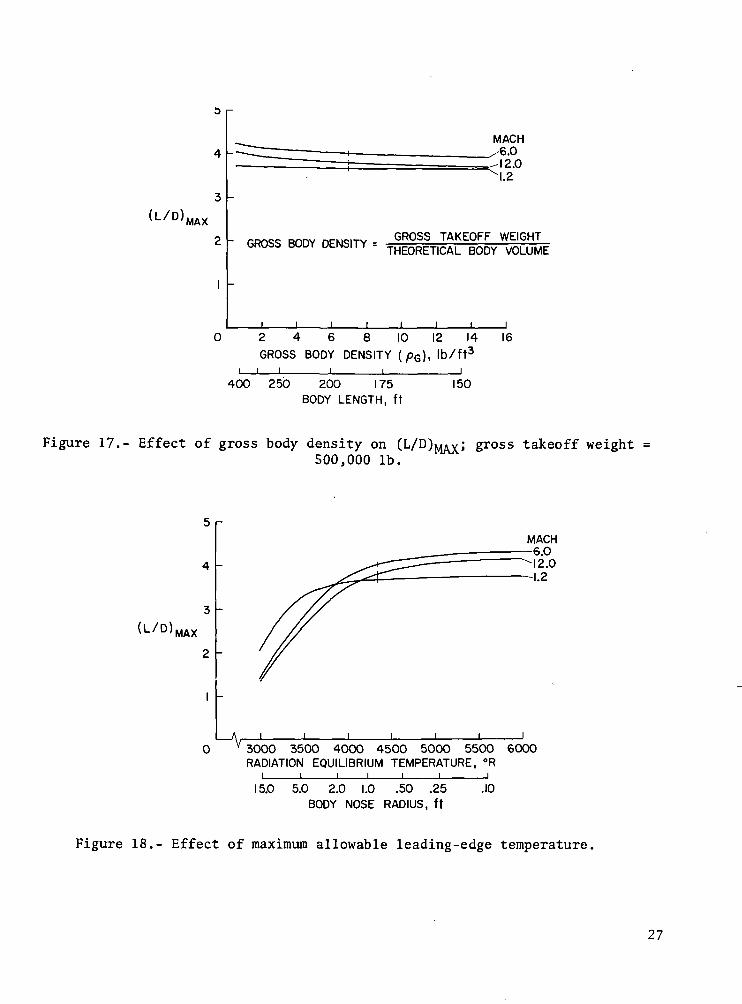
The effect of gross body density for the nominal vehicle at the fixed nominal gross takeoffweight of 500,000 pounds is shown in figure 17. Again, the corresponding vehicle length is shownfor reference. The (L/D)MAX decreases slightly with increasing body density because theskin-friction drag coefficient increases with decreasing Reynolds number. Unique to the all-bodyconfiguration is the interdependence of gross takeoff weight, gross body density, and planform liftloading (or wing loading). Hence, for a given gross body density and body shape, the wing loadingwill change with changes in gross takeoff weight.
Effect of Maximum Allowable Temperature
The effect of maximum allowable leading edge and nose radiation equilibrium temperature isshown in figure 18. The temperature shown is the specified maximum temperature for sizing thebody nose, horizontal fin leading edge, vertical fin leading edge, and canard leading-edge radii. Forreference, the corresponding nose radius is also shown. The increase in (L/E))MAX with increasingallowable temperature is the result of decreasing bluntness drag (radius). The bluntness drag is amore significant proportion of the overall drag at the higher Mach numbers.
Effect of Fin Sizes
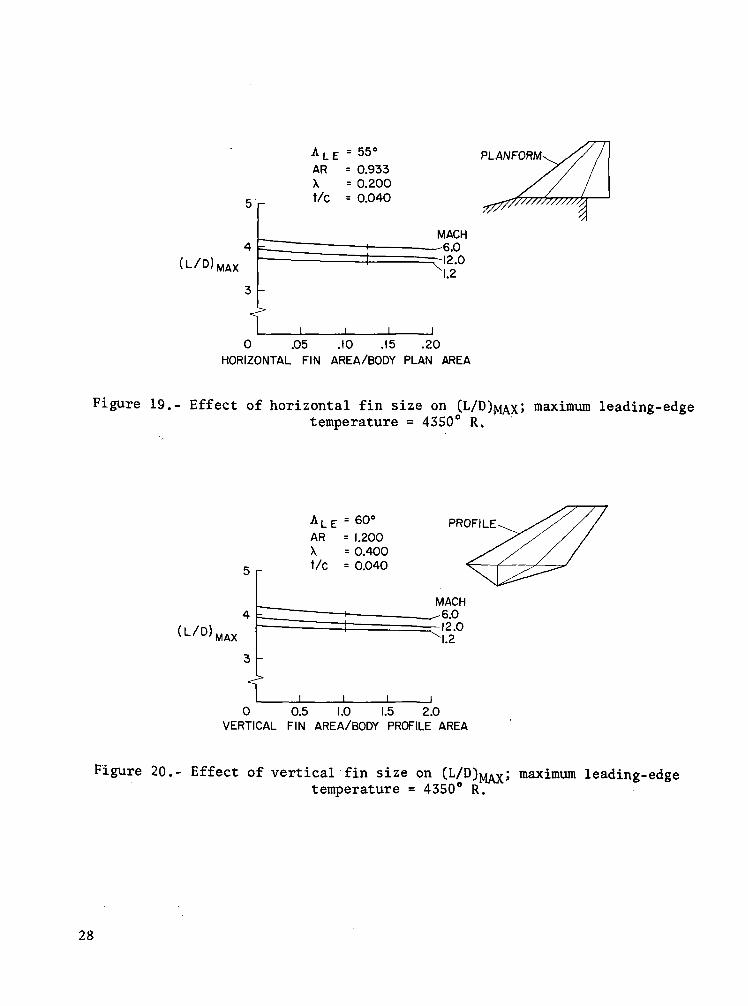
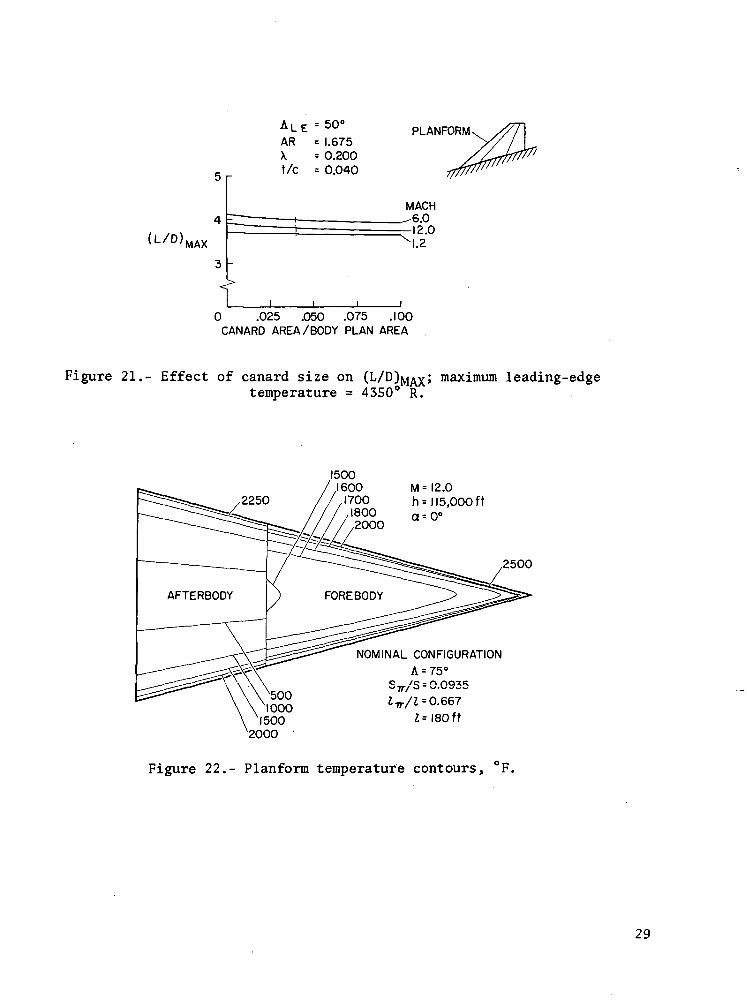
The nominal sizes for the horizontal fins, vertical fins, and canard were estimated to provideadequate stability and control as discussed in a later section. As mentioned previously, only thezero-lift drag (wave, friction, and bluntness) of the fins was included in the (L/D)jyjy\x calculations.No trim drag or vertical fin toe-in penalties were included. The effect of horizontal fin, vertical fin,and canard size on configuration (L/D)^AX *s shown in figures 19 to 21, respectively. The finplanform and shape parameters are included on each figure for reference. Each figure shows the lossin (L/D)fyiAX incurred for larger fin sizes.
SURFACE TEMPERATURES
A brief analysis of the vehicle surface radiation equilibrium temperatures was performed inconjunction with the study of configuration aerodynamics. The surface temperature distribution, atzero angle of attack, and the effects of Mach number, lift loading, and altitude on the surfacetemperature were investigated.
Surface Temperature Distribution
The surface radiation equilibrium temperature distribution was calculated at zero angle ofattack only using the pressure distribution obtained for the zero-lift drag computation. Thetemperatures were estimated using Eckert's reference enthalpy technique for a turbulent boundarylayer. The planform temperature contours for a typical configuration are shown in figure 22. Thecase shown is for a Mach number of 12 and an altitude of 115,000 feet. The configuration shapeparameters and length are shown for reference.
Surface Temperature Variations
The effect of planform lift loading on surface radiation equilibrium temperature wasestimated from calculations for a wedge with the same included angle as the forebody at thecenterline of the all-body configuration. The upper and lower surface temperatures were calculatedfor the wedge angle of attack that resulted in the same planform lift loading as the all-bodyconfiguration. These temperatures were estimated using the reference enthalpy method and are
8
assumed to represent the average spanwise temperature of the configuration. The planform liftloading of the configuration and the wedge were matched using computed values of surfacepressures. The pressure on the wedge lower surface was computed by Newtonian theory and thecorresponding Mach number was obtained by the oblique shock relations. The pressure on thewedge upper surface was computed using Newtonian theory when inclined toward the flow or aPrandtl-Meyer expansion when inclined away from the flow.
The upper and lower surface radiation equilibrium temperatures 25 feet aft of the wedgeleading edge are shown versus Mach number in figure 23. The curves represent conditions for thenominal vehicle, which has a forebody wedge included angle of 7.65°. Curves are shown for severalvalues of lift loading computed at a constant dynamic pressure of 1000 lb/ft2. A typical value of liftloading is 30 lb/ft2, corresponding to the nominal configuration in cruise. The reduction in lowersurface temperature achieved by lower lift loadings is accompanied by a corresponding increase inupper surface temperature. Figure 24 shows the effects of cruise altitude and lift loading for aconstant Mach number. Lift loading, rather than angle of attack, is used as a parameter becauseequilibrium cruise flight requires a given value of lift loading, which, to a first order, is independentof cruise altitude; whereas the angle of attack for equilibrium cruise flight varies widely with cruisealtitude. The trends in the figure, however, can best be understood as the result of a tradeoffbetween altitude and angle of attack. For a fixed angle of attack increasing altitude causesdecreasing surface temperature. This effect is most apparent for a lift loading of zero, where thelower surface angle to the free stream remains at 3.83°. For a fixed altitude, increasing angle ofattack (or, equivalently, increasing the lift loading) causes increasing surface temperature. Thiseffect is also shown in the figure for any of the constant altitude lines. At the lower altitudes, theangle of attack required to produce a lift loading of 40 lb/ft2 is smaller (less than 1° at 80,000 ft)than at the higher altitudes (almost 15° at 160,000ft). Hence, the effect of changes in the liftloading on surface temperature is greater at the higher altitudes. It is also significant that at thehigher values of lift loading and altitude the lower surface temperature is virtually insensitive toaltitude changes. At these conditions the upper surface pressure is essentially a vacuum and thelower surface pressure is approximately equal to the lift loading regardless of altitude. Since, at aconstant flight Mach number, the heat-transfer rate to the lower surface is primarily a function ofthe lower surface pressure, the result is a nearly constant lower surface temperature independent ofcruise altitude.
The foregoing discussion is based on the assumption that the wedge temperatures computedby the lift-loading analogy are representative of the average spanwise distribution of the all-bodysurface temperatures.
STABILITY
A preliminary stability analysis was performed to estimate the static longitudinal anddirectional stability at hypersonic speed. The moment coefficients were referenced about the bodycenter of gravity with the body mean aerodynamic chord as the reference length. The bodycenter-of-gravity location was determined by assuming constant body density. This appears to be agood assumption for a hydrogen-fueled vehicle since the gross density of the hydrogen tankage andthe passenger compartment are both about 5 lb/ft3. During a mission it may be advantageous tosequence the fuel tank usage to obtain the best center-of-gravity location corresponding to flight
conditions. The body lift and drag were calculated using the methods previously described and wereassumed to act through the planform center of area. The accuracy of this assumption depends onthe configuration and flight conditions. For a thick (low a/b ratio) configuration at low angles ofattack, the forebody may provide most of the aerodynamic forces, and hence, the center of pressuremay act closer to the forebody planform center of area. Because of the lack of experimental oranalytical data this effect was neglected for the present study. The lift and drag of the fins wereestimated by Newtonian theory neglecting any effects of the body flow field (i.e., no interferenceforces were considered).
Longitudinal Stability
The longitudinal stability for the nominal configuration at a Mach number of 12 is shown infigure 25. The increase in stability due to the horizontal fins and canard is shown. Nominally, thecanard was designed as a floating canard (the angle of attack of the canard remained fixed withrespect to the free stream for all configuration angles of attack). The decrease in stability thatresults from a fixed canard is also shown. These data show that the configuration would maintainpositive stability if the canard were to become locked.
Control Effectiveness
The control power of the horizontal fins is shown in figure 26 for the nominal horizontal finsize, which is 12.5 percent of the body plan area. Because of the relatively short moment armbetween the horizontal fin location and the configuration center of gravity, the horizontal fineffectiveness for trim is impaired. The canard location is slightly more advantageous. Figure 27shows the control power of the floating canard for the nominal canard size, corresponding to4 percent of the body plan area. The floating canard possesses the ability to trim the configurationat the desired angle of attack while adding a positive lift increment to the configurationaerodynamics. The nominal configuration can be trimmed at (L/D)]yiAX with the floating canard at15.6° angle of attack with respect to the free stream. To trim with the horizontal fins requires—9.5° fin angle of attack with respect to the free stream (5j^j = — 18.5°). The use of the canard fortrim results in a 0.37 percent decrease in untrimmed (L/D)MAX at cruise as compared to a13.25 percent decrease when the horizontal fins are used.
Effect of Body Shape
Under the assumption of constant body density the body center-of-gravity location dependson the configuration breakpoint-length ratio and is independent on the sweep and fatness ratios.The center of gravity moves rearward with increasing breakpoint-length ratio. The effect of thisshift in center-of-gravity location on the basic body longitudinal stability at hypersonic speeds isshown in figure 28. At the higher values of breakpoint-length ratio the center of gravity is behindthe aerodynamic center (assumed at the planform center of area) and the basic body is unstable.The rearward center-of-gravity shift also results in a shorter moment arm for control with thehorizontal fins. Therefore, configurations with higher values of breakpoint-length ratio may require
10
larger horizontal fins to provide adequate longitudinal stability and control. However, engine forces,flow-field effects, and the actual location of the body center of pressure must be considered in acomplete stability analysis.
Directional Stability
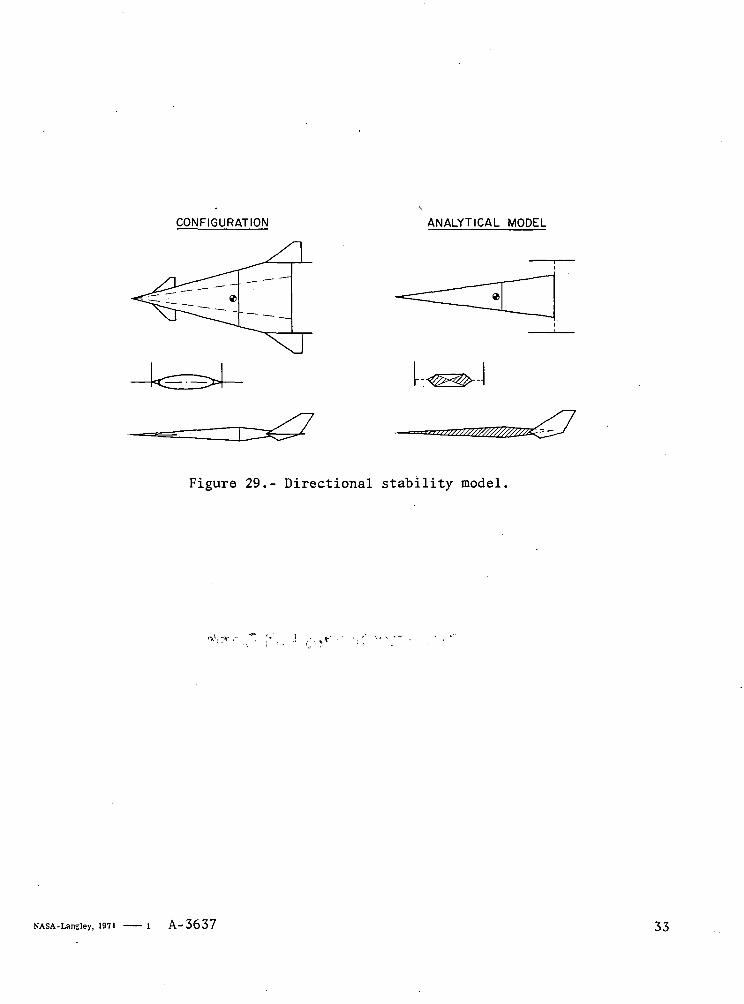
A preliminary directional stability analysis was performed for hypersonic speeds to estimatethe required vertical fin size. To approximate the body contribution a representative analyticalmodel, as shown in figure 29, was used. This model has a flat-sided body with one-half the includedplanform angle of the original configuration as shown by the dashed lines in the figure. (Note thatthis corresponds to a new body sweep angle equal to 45° plus one-half the original sweep.) The flatsided area of the model is equal to the cross-section area obtained by cutting the original body inthe vertical plane at the new body sweep angle. Body side forces and vertical fin forces on themodel were estimated by simple Newtonian theory. The computations indicated that the nominalconfiguration (with the nominal vertical fin size) was directionally stable hypersonically for avertical fin flare of 5° included angle. This vertical fin flare results in a negligible (less than0.5 percent) decrease in the configuration (L/D)j^AX at Mach 12. Directional stability, for thenominal configuration, can also be obtained by a vertical fin toe-in of 5°; however, this results in alarger (approximately 1 percent) decrease in configuration (L/D)jyjAX a* a Mach number of 12.
CONCLUDING REMARKS
The results of semiempirical and theoretical predictions of the aerodynamic characteristics ofthe forebody of all-body configurations have been compared with available experimental data. Thegood agreement obtained lends credence to the application of the basic analysis techniques to theentire all-body configuration. The degree to which these estimates represent the physical facts mustawait experimental data on the configurations studied. Such data will also be helpful in providingimprovements in semiempirical and, perhaps, analytical prediction methods. Additionalconfiguration studies are required with different geometric shapes to analyze the effect of therounded leading edge and the forebody-afterbody ridge line of the present configuration family.Several critical problem areas requiring improved analytical techniques or experimental data includethe pressure distribution at angle of attack, the high transonic drag, and the flow interaction effectson stability.
National Aeronautics and Space AdministrationMoffett Field, California, 94035, April 23,1970
11
where
M < 1.0
APPENDIX
AERODYNAMICS EQUATIONS
LIFT
sin a + € sin2 a
Cl = - 0.355
Co = 0
M > 1.0irAR - 0.153 BAR2
C2 = linear interpolation with respect to 3 fromC2 = 0 at 3=0 to
Co = e[0.955-O.35/M)] at _ _AR
M > 1.0
6 > ±6 - AR
- 0.13
, _ Ft).955-0*.35/M)],2 - e
INDUCED DRAG
where
CDi = %CL tan a
M < 3.0 j KM = 0.25 (1 + M)
M * 3.0 j KM = 1.0
ZERO-LIFT BODY DRAG
CDOB = CDPB + CDFB + CDBB
12
Body Pressure Drag
M < 0.8 { CDpB = 0
0.8 < M < 1.2 CD R = linear interpolation with respect to M fromJpBCn „ = 0 at M = 0.8 toPB
CDpB M = l'
M ̂ 1.2 | CDR = CDR from numerical integration of pressure
I distribution on body
Body Base Drag
CpRAep = Cp from Prandtl-Meyer expansion of forebody pressure distribution
Unless Cp < Cp2 when,
1CPBASE " C?2-D 0.91 M2 - 0.20 M + 1.51
(From fig. 5, p. 34, ref. 8)
Body Friction Drag
M < 0'.8 i
where
fn - 0 455
1 4- ?l 1
*C/BODY.FB
(logio Re)2-5 8(l 4
/SWET\
\SREF/
Y i \ 0 . ^4 6 7- J- M 2 12 * *o y
Re = P0M0a0(MAC)BODY and (I)BODY 2(.ZTt/Z)
i A
13
0.8 < M < 1.2 CD_R = linear interpolation with respect to M from
CDFB = cDpB at M = o.s to
CDFB = CDFB at M = 1.2
M * 1.2 { CD™ = CD™ from numerical integration of local skin-1 re rt>
friction coefficients on body
Body Bluntness Drag
M < 0.8 CDBB = o
0.8 < M < 1.0 I RRCDRR = linear interpolation with respect to M fromCDBB =0 at M = 0.8 to
CDRR = CDRR at M = 1.0L>D DP
M > 1.0irr.
CD NOSEBB SREF
where
,0.5NOSE
1820 ±-\1/2
-4-.3.15'"MAX810"''"
(.'SKIN \1000
14
ZERO-LIFT FIN DRAG
whereF
CDXc = CDXF HORIZONTAL FINS
CDBF
VERTICAL FINS
computed separately by the following equations.
CANARD
Fin Pressure Drag
M < 0.8 { CD F = 0
0.8 < M < 1.0 CD p = linear interpolation with respect to M fromp CD p = 0 at M = 0.8 to
CDpF = C°pF at M = 1'°
M = 1.0 CD = 3.4 -, cupF \c/T,TV. S
5/3FIN
cosz AFIN REF
FIN
1.0 < M < MSA • CD p = linear interpolation with respect to M fromP CDpp = CDpF at M = 1.0 to
CDpp at M = MSA
> MSA CD!_ aFIN
FIN e SREF
15
Fin Friction Drag
where
1 + 2 -REF .
CDpF = 0.455
(loglo R e )2 - l2-58 (l
0.467
(MAC)Re = P Mna,o ° ° y,
FIN
Fin Bluntness Drag
M < 0.8 j CDBF = o
0.8 < M < 1.0 JBF.CDRC = linear interpolation with respect to M fromCnDr, = 0 at M = 0.8 to
Df
CDBF = CDBF at M = i.o
FIN
where
rr 725 cos1-2-'^ cos NOSE
16
REFERENCES
1. Gregory, Thomas J.; Petersen, Richard H.; and Wyss, John A.: Performance Tradeoffs andResearch Problems for Hypersonic Transports. J. Aircraft, vol. 2,1965, pp. 266—271.
2. DeYoung, John; and Harper, Charles W.: Theoretical Symmetric Span Loading at SubsonicSpeeds for Wings Having Arbitrary Plan Form. NACA Rep. 921, 1948.
3. Lawrence, H. R.: The Lift Distribution on Low Aspect Ratio Wings at Subsonic Speeds.J. Aero. Sci., vol. 18, no. 10, Oct. 1951, pp. 683-695.
4. Puckett, A. E.; and Steward, H. J.: Aerodynamic Performance of Delta Wings at SupersonicSpeeds. J. Aero. Sci., vol. 14, no. 10, Oct. 1947, pp. 567-578.
5. McDevitt John B.; Rakich, John V.: irFlieSA'ero'd.ynamic Characteristics .of, .Several Thick DeltaWings at Mach Numbers to 6 and Angles of Attack to 50. NASA TM XM 62,1960.
6. Jorgensen, Leland H.: Elliptic Cones Alone and With Wings at Supersonic Speeds. NACARep. 1376, 1958.
7. Van Dyke, Milton D.: The Slender Elliptic Cone as a Model for Nonlinear Supersonic FlowTheory. J. Fluid Mech., vol. 1, May 1956, pp. 1—15.
8. Love, Eugene S.: Base Pressure at Supersonic Speeds on Two-Dimensional Airfoils and onBodies of Revolution With and Without Fins Having Turbulent Boundary Layers. NACATN3819, 1957.
9. Shapiro, Asher: The Dynamics and Thermodynamics of Compressible Fluid Flow. The RonaldPress Co., N. Y., 1954.
10. Koelle, Heinz Hermann: Handbook of Astronautical Engineering. McGraw-Hill Book Co.,Inc., 1961.
11. Eckert, Ersnt R. G.: Survey of Heat Transfer at High Speeds. ARL Rep. 189, Aeronaut. Res.Lab., Office of Aerosp. Res., Wright—Patterson Air Force Base, Ohio, Dec. 1961.
12. Truitt, Robert Wesley: Hypersonic Aerodynamics. The Ronald Press Co., N. Y., 1959.
13. Eminton, E.; and Lord, W. T.: Note on the Numerical Evaluation of the Wave Drag of SmoothSlender Bodies Using Optimum Area Distributions for Minimum Wave Drag. J. Roy. Aero.Sco., Jan. 1956, pp. 61-63.
17
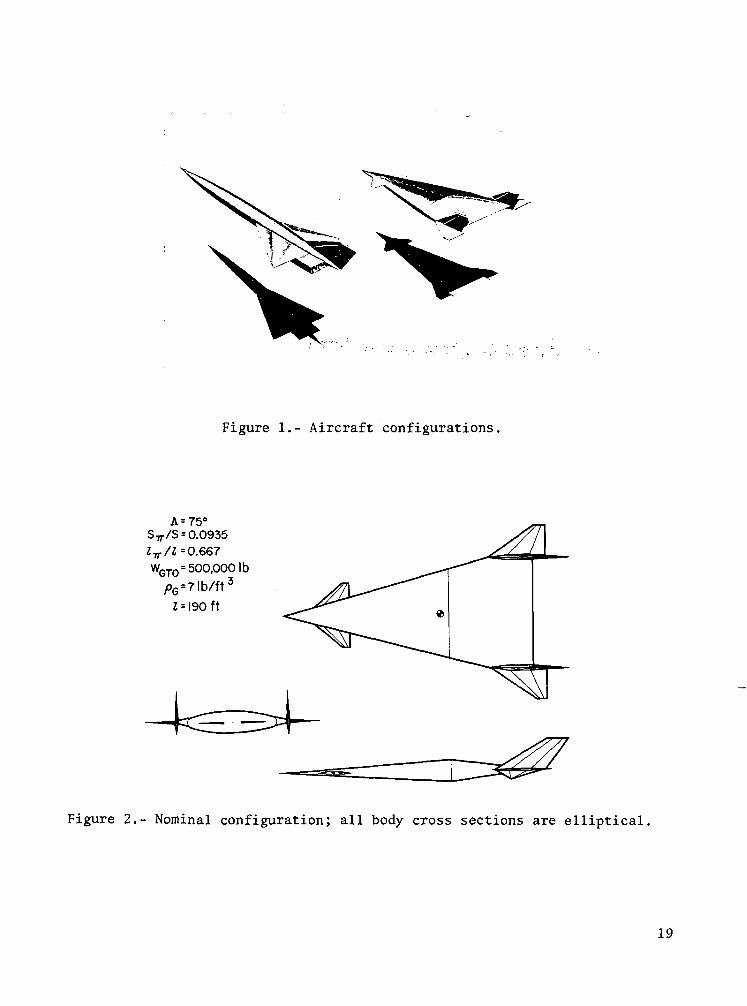
Figure 1.- Aircraft configurations,
A= 75°5^/5 = 0.09352^/2=0.667WGTO=500,0001 b
Figure 2.- Nominal configuration; all body cross sections are elliptical.
19
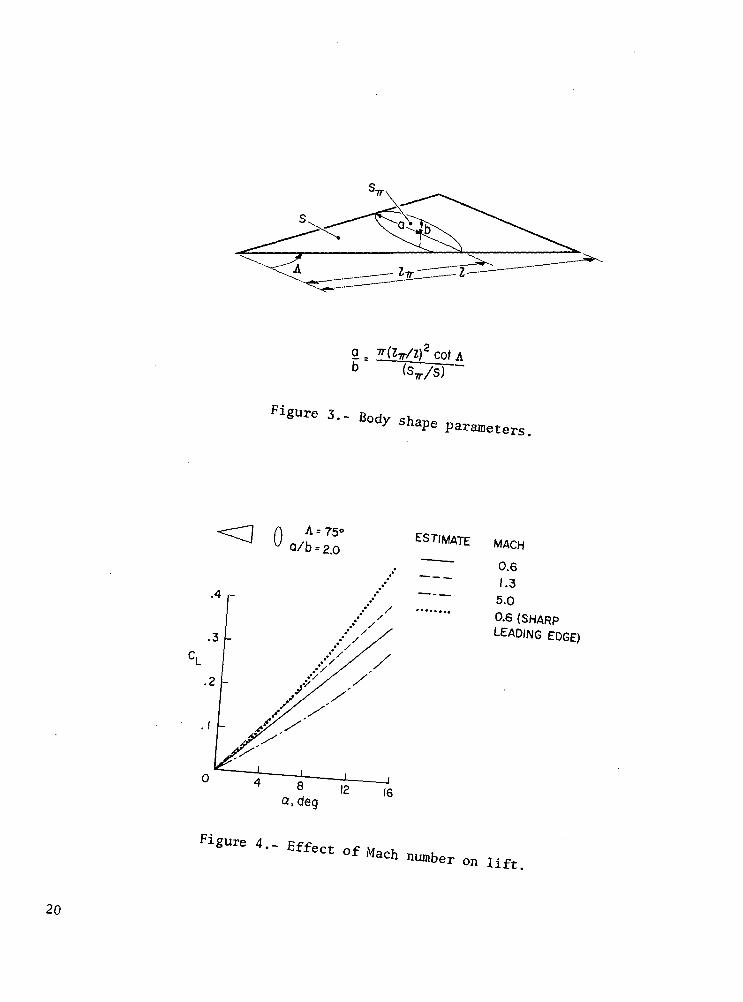
Figure 3.-Body shape parameters
A=75° ESTIMATE MACH
0.61.35.00-6 (SHARP
LEADING EDGE)
lift.
20
DATA(REF. 6) ESTIMATE SHAPE
.4
.3
.2
o
D
A
j I I i
8 12 16a, deg
20
0oo
Figure 5.- Effect of shape on lift; M = 1.97.
DATA(REF. 6) ESTIMATE
O
D
SHAPE
0oo
Figure 6.- Effect of shape on induced drag; M = 1.97.
21

<] 0A =75°
d/b = 2.0
ESTIMATE MACH
0.61.35.0
.4
.3
.2
.05 .10 .15CD~CD(BASE)
Figure 7.- Effect of Mach number on induced drag.
O DATA (REF.6)THEORY (VAN DYKE)
Cp
.16
.12
.08
.04
CROSS SECTION
d/b = 6, A = 7I.6
_GL-00.
CROSS SECTION
= 3, A=76.7°
.25 .50 .75 1.0 0 .25 .50 .75y/a, SEMISPAN STATION
1.0
Figure 8.- Forebody pressure distribution; M = 1.97, a = Oe
22

^
SECTION A-A
^8, DEFLECTION ANGLE^%/ (EXPANSION)
Figure 9.- Afterbody-pressure-calculation geometry.
.12
.10
.08
.06
.04
.02
O DATA (REF.6)
ESTIMATE
M=l,97REYNOLDS NUMBER = 8 x I06
ALTITUDE = 13,000 ft
A = TAN'1 [7.34(a/b)~'/2]
FOREBODY PRESSURE DRAG
TURBULENT SKIN FRICTION DRAGi i i i i iI 2 3 4 5
ELLIPSE AXIS RATIO (a/b)
Figure 10.- Comparison of forebody zero-lift drag with experiment; no base dragis included; CD is based on cross-section area.
23
TYPICAL FLIGHT PATH NOMINAL CONFIGURATION(1000 q PATH ABOVE M = 2) (WITH Z = 100 ft)
.10
.08
.06
.04
.02
0
PRESENT ESTIMATEO AREA RULE WAVE DRAG (WING APPROX~20 STATIONS)
(+BODY SKIN FRICTION)n AREA RULE WAVE DRAG(WING APPROX-10 STATIONS)
(+BODY SKIN FRICTION)
FIN AND BLUNTNESSAFTERBODY PRESSUREFOREBODY PRESSUREBODY SKIN FRICTION
4 6 8 10MACH NUMBER
Figure 11.- Zero-lift drag versus Mach number; CD . is based on theoreticalbody plan area.
(L/D) MAX
12
10
8
6
4
2
0
\ NOMINAL CONFIGURATION
A = 75°STT-/S =ITT/I-WGTO =
0.09350.667500,000 Ib
. PQ = 7.0'lb/ft3
•[y '
1 1 1 1
2 4 6 8
i
10
— i
i12
MACH NUMBER
Figure 12.- Effect of Mach number on CL/D)MAX-
24
(L/D) MAX
= 0.0935
ITT/I = 0.667
60 65 70 75SWEEP (A), deg
80 85
i i i
1.2
9 8 7 6 5 4 3 2 1FOREBODY ELLIPSE RATIO, Q/b
Figure 13.- Effect of body sweep on (L/D)MAX-
8r
(L/D) MAX
A = 75°
f'=° 667
.02 .04 .06 .08 .10 .12FATNESS RATIO, S-^/S
I | i i i |12 8 6 5 4 3
FOREBODY ELLIPSE RATIO, d/b
.14
Figure 14.- Effect of fatness ratio on (L/D)MAX-
25

(L/D)MAX A =75°
if =0.0935O
.4 .5 .6 .7 .8 .9
BREAKPOINT LENGTH RATIO, l^/l
2 3 4 5 6 7FOREBODY ELLIPSE RATIO, d/b
Figure 15.- Effect of breakpoint length ratio on (L/D)MAX-
(L/D) MAX
0 400 800 1200 1600GROSS TAKEOFF WEIGHT (WGTO), 1000 Ib
i i i100 150 175 200 225 250
BODY LENGTH, ft275
Figure 16.- Effect of gross takeoff weight on (L/D)MAX; gross body density7.0 lb/ft3.
26
(L/D) MAX
- GROSS BODY DENSITY =GROSS TAKEOFF WEIGHT
THEORETICAL BODY VOLUME
2 4 6 8 1 0 1 2 1 4
GROSS BODY DENSITY (pG), Ib/ft3
I16
i i i400 250 200 175
BODY LENGTH, ft150
Figure 17.- Effect of gross body density on (L/D)MAX> gross takeoff weight500,000 Ib.
(L/D) MAX
A I I I | | | |
0 V 3000 3500 4000 4500 5000 5500 6000RADIATION EQUILIBRIUM TEMPERATURE, °R
15.0 5.0 2.0 1.0 .50 .25BODY NOSE RADIUS, ft
.10
Figure 18.- Effect of maximum allowable leading-edge temperature.
27
5 r
(L/D) MAX
t
A L E -55«AR = 0.933X = 0.200t/C = 0.040
0 .05HORIZONTAL FIN
PLANFORM
.10 .15 .20AREA/BODY PLAN AREA
Figure 19.- Effect of horizontal fin size on (L/D)MAXJ maximum leading-edgetemperature = 4350° R.
5 r
(L/D) MAX
i
ALE = 60°AR = 1.200X = 0.400t/C = 0.040
PROFILE
0 0.5 1.0 1.5 2.0VERTICAL FIN AREA/BODY PROFILE AREA
Figure 20.- Effect of vertical fin size ontemperature = 4350° R.
maximum leading-edge
28
5r
4 _
(L/D)
A L EARXt/C
EZTT i—
= 50°= 1.675= 0.200= 0.040
pLAr
MACH^-6.0
12.0MAX
3 -
0 .025 .050 .075 .100CANARD AREA/BODY PLAN AREA
Figure 21.- Effect of canard size ontemperature = 4350° R.
maximum leading-edge
15001600
170018002000
M=I2.0h= 115,000 ft0=0°
2500
X500NIOOO
XI500X2000
NOMINAL CONFIGURATION
A = 75°= 0.0935= 0.667
£=180 ft
Figure 22.- Planform temperature contours, °F.
29

2800
2400
'. 2000LJOL
QLLJQ.
1600
1200
800
400
LOWER SURFACE
UPPER SURFACE
Ta
40
q = 1000 Ib/ft2
e = 0.8TURBULENT BOUNDARY LAYERWEDGE, 8B = 7.65°
10 12 14 16MACH NUMBER
18 20 22 24
Figure 23.- Surface radiation equilibrium temperature; 25 feet aft of leadingedge.
2800
2400
2000
1600
1200
800
f
ALTITUDE, 1000 ft
M = 12.0X = 25 ft€ = 0.8TURBULENT BOUNDARY LAYERWEDGE, 0B = 7.65°
10 20 30 40
LIFT LOADING (L/S), Ib/fr
Figure 24.- Effect of altitude and lift loading on lower surface temperature.
30

.01 r T
-.02 -
-.03 -
-.04 -
.05 L
-5 0
BASIC BODY+ HORIZONTAL FINS
+ FLOATING CANARD3CA = -a
i10
a, deg
i15
M = I2ALTITUDE = I40.0OO ftNOMINAL CONFIGURATION
i20
BASIC BODY
BASIC BODY+ HORIZONTAL FINS
SHT=O°+FIXED CANARD
i25
Figure 25.- Longitudinal stability.
'MAXM = I2ALTITUDE = 140,000 ftNOMINAL CONFIGURATION
(FLOATING CANARD)
Figure 26.- Horizontal fin control power.
31

"CG
-.01 -
-.02-
-.03-
-.04 -
.05 L
-5
M = I2ALTITUDE = 140,000 ftNOMINAL CONFIGURATION
(FLOATING HORIZONTAL FINS)
I I I I10 15 20 25
a.deg
Figure 27.- Floating canard control power.
.002
.001
~^T-\ >"CG
-.001
-.002
-.003
M=I2ALTITUDE = 119,200 fta = 10°
A = 75°STT/S = 0.0935WGTO = 500,000 Ib
.4 .7 .8 .9
BREAKPOINT LENGTH RATIO,
Figure 28.- tffect of body shape on stability.
32
CONFIGURATION ANALYTICAL MODEL
I I
Figure 29.- Directional stability model.
\-Langley, 1971 1 A-3637 33
NATIONAL AERONAiifics ANB SPACE ADMINISTRATIONWASHINGTON, IXC 20546
OFFICIAL BUSINESS FIRST CLASS MAIL
POSTAGE AND PEES RAINATIONAL AERONAUTICS
SPACE ADM!NISTRATK»
JPOSTMASTER: If UnddiveraMe (Section 1Postal Manual > Do Not Re? - • • I
•:'*
f*Ihe aetowutiml ta$ sp$ee aGtwittes of;tbe United States $kall beconducted so as to contribute . , . to the expansion of human knowl-edge of'phenomena in^the atmosphere and *:fpace. The Administrationshall provide for the widest practicable and appropriate dmemmatioaof infomnation cornering Ms aetfaitien and the remits thereof," 4
—^NA-f ONAJ. AERONAUTICS AND SPACE ACT OF 1958
SOB]>raFlC f EGHNICAL
TECHNICAL R1PORTS: Scientific arad .technical information considered important,complete, and a lasting contribution to existingknowledge.
TECHNICAL NOTES: Information less broadin scope but nevertheless of importance as acontribution, to existing knowledge.
TECHNICAL MEMORANDUMS:Information receiving limited distributionbecause of preliminary data, security classifica-tion, or other reasons.
CONTRACTOR REPORTS: Scientific andtechnical information generated under a NASAcontract or grant and considered an importantcontribution to existing knowledge.
TECHNICAL TRANSLATIONS: tofommtiottpublished in a foreign language consideredto merit NASA distribution in English. *
SPECIAL PUBLICATIONS: Informationderived from or of value to NASA activities.Publications include conference procecuJitigi,monographs, data compilations, handbookf,sourcebooks, and special bibliographies.
TECHNOLOGY UTILIZATIONPUBLICATIONS: Information on technologyused by NASA that may be of particularinterest in commercial and other no«*aerospaceapplications. Publications include Tech Briefs,Technology Utilization Reports and
Technology Surveys.
Details on the availability of these publications may fee obtained from:
SCIENTIFIC AND TECHNICAL INFORMATION OFFICE
NATIONAL AERONAUTICS AND SPACE ADMINISTRATIONWashington, D.C. 20546