Embed Size (px)
Citation preview

Esri UC 2014 | Technical Workshop |
Python – Raster AnalysisKevin M. Johnston
Ryan DeBruyn

Esri UC 2014 | Technical Workshop |
• Managing rasters and performing analysis with Map Algebra
• How to access the analysis capability - Demonstration
• Complex expressions and optimization - Demonstration
• Additional modeling capability: classes - Demonstration
• Full modeling control: NumPy arrays - Demonstration
Outline
: Python - Raster Analysis

Esri UC 2014 | Technical Workshop |
A complex model
: Python - Raster Analysis
Emerald Ash Borer
Originated in Michigan
Infest ash trees
100% kill
Coming to Vermont

Esri UC 2014 | Technical Workshop |
• Movement by flight- 20 km per year- Vegetation type and ash density (suitability surface)
• Movement by hitchhiking- Roads- Camp sites- Mills- Population- Current location of the - borer (suitability surface)
• Random movement
The Ash Borer model
: Python - Raster Analysis

Esri UC 2014 | Technical Workshop |
• Complex
• Multiple input types - Need to work with rasters along with features and tables
• Scenarios• Repeat analysis by using different parameter values
• Dynamic - Time is explicit, need to run sections multiple times
• Enhanced capabilities - Need to take advantage of 3rd party Python packages
• Reusable - Repeat the workflow with the same or different set of data
• Performance and optimization
Typical problem just like yours: The Characteristics
: Python - Raster Analysis
Ideal for Map Algebra and Python scripting

Esri UC 2014 | Technical Workshop |
• Prepare the data
• An iterative model – based on a year
• Three sub models run individually each iteration and the
results are combined
- Movement by flight (run 3 different seasons)
- Movement by hitchhiking (run once)
- Random movement (run once)
The Ash Borer model
: Python - Raster Analysis

Esri UC 2014 | Technical Workshop |
• To prepare and manage raster data - Displaying
- Adding, copying, deleting, etc.
- Mosaic, Clip, etc.
- Raster object
- NumPy, ApplyEnvironment, etc.
• To perform analysis- Spatial Analyst
- Map Algebra
Raster analysis – Preparing the data
: Python - Raster Analysis

Esri UC 2014 | Technical Workshop |
• Simple and powerful algebra to execute Spatial Analyst tools, operators, and functions to perform geographic analysis
• The strength is in creating complex expressions
• Available through Spatial Analyst module
• Integrated in Python (all modules available)
What is Map Algebra
: Python - Raster Analysis
Esri UC 2014 | Technical Workshop |
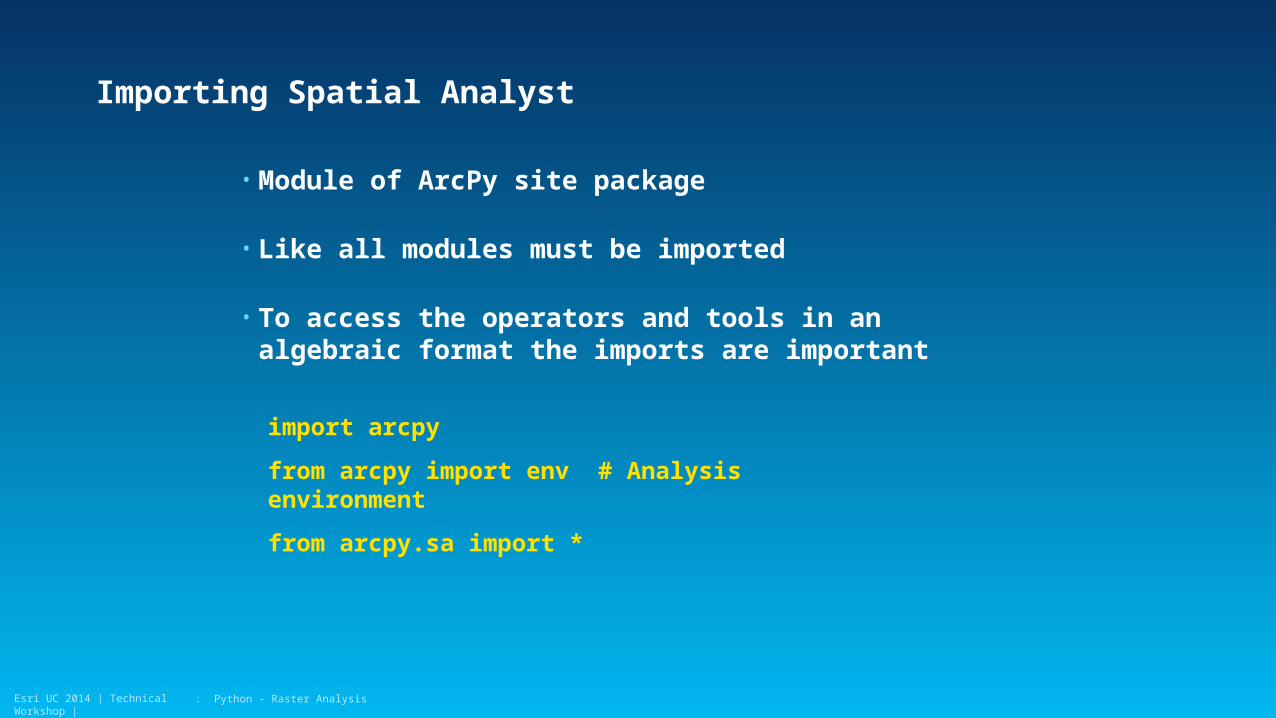
• Module of ArcPy site package
• Like all modules must be imported
• To access the operators and tools in an algebraic format the imports are important
Importing Spatial Analyst
: Python - Raster Analysis
import arcpy
from arcpy import env # Analysis environment
from arcpy.sa import *

Esri UC 2014 | Technical Workshop |
• Map Algebra available through an algebraic format
• Simplest form: output raster is specified to the left of an equal sign and the tool and its parameters on the right
• Comprised of:- Input data - Operators- Tools - Parameters- Output
General syntax
: Python - Raster Analysis
from arcpy.sa import *
outRas = Slope(indem)

Esri UC 2014 | Technical Workshop |
• Rasters
• Features
• Numbers and text
• Objects
• Constants
• Variables
Input for analysis
: Python - Raster Analysis
outRas = Slope(inRaster)
Tip: It is good practice to set the input to a variable and use the variable in the expression. Dataset names are quoted.
inRaster1 = "C:/Data/elevation“
outRas = Slope(inRaster1)

Esri UC 2014 | Technical Workshop |
• Symbols for mathematical operations
• Many operators in both Python and Spatial Analyst
• Creating a raster object (Raster class constructor - casting) indicates operator should be applied to rasters
Map Algebra operators
: Python - Raster Analysis
elevMeters = Raster("C:\data\elevation") * 0.3048 outSlope = Slope(elevMeters)
outRas = inRaster1 + inRaster2

Esri UC 2014 | Technical Workshop |
• All Spatial Analyst tools are available (e.g., Sin, Slope, Reclassify, etc.)
• Can use any Geoprocessing tools
Map Algebra tools
: Python - Raster Analysis
outRas = Aspect(inRaster)
Tip: Tool names are case sensitive

Esri UC 2014 | Technical Workshop |
Tool parameters
• Defines how the tool is to be executed
• Each tool has its own unique set of parameters
• Some are required, others are optional
• Numbers, strings, and objects (classes)
Slope(in_raster, {output_measurement}, {z_factor})
outRas = Slope(inRaster, “DEGREE”, 0.3048)
outRas = Slope(inRaster, “”, 0.3048)
outRas = Slope(inRaster)
Tip: Keywords are in quotes
11 22 33 11
OOOO
22
33
: Python - Raster Analysis

Esri UC 2014 | Technical Workshop |
• Stores the results as a Raster object
• Object with methods and properties
• In scripting the output is temporary
• Associated data will be deleted if not explicitly saved
Map Algebra output
: Python - Raster Analysis

Esri UC 2014 | Technical Workshop |
• Raster Calculator- Spatial Analyst tool
- Easy to use calculator interface
- Stand alone or in ModelBuilder
• Python window- Single expression or simple exploratory models
• Scripting- Complex models
- Line completion and colors
Access to Map Algebra
: Python - Raster Analysis

Esri UC 2014 | Technical Workshop |
• Prepare the data
• An iterative model – based on a year
• Three sub models run individually each iteration and the
results are combined
- Movement by flight (run 3 different seasons)
- Movement by hitchhiking (run once)
- Random movement (run once)
The Ash Borer model
: Python - Raster Analysis

Esri UC 2014 | Technical Workshop |
Raster management tools
Raster Calculator
Python window
ModelBuilder
Simple expressions
Demo 1: Data management and
accessing the capability

Esri UC 2014 | Technical Workshop |
• Managing rasters and performing analysis with Map Algebra
• How to access the analysis capability - Demonstration
• Complex expressions and optimization - Demonstration
• Additional modeling capability: classes - Demonstration
• Full modeling control: NumPy arrays - Demonstration
Outline
: Python - Raster Analysis

Esri UC 2014 | Technical Workshop |
• Multiple operators and tools can be implemented in a single expression
• Output from one expression can be input to a subsequent expression
Complex expressions
: Python - Raster Analysis
inRaster = ExtractByAttributes(inElevation, "Value > 1000")
out = Con(IsNull(inRaster), 0, inRaster)

Esri UC 2014 | Technical Workshop |
• A variable with a pointer to a dataset
• Output from a Map Algebra expression or from an existing dataset
• The associated dataset is temporary (from Map Algebra expression) - has a save method
• A series of properties describing the associated dataset- Description of raster (e.g., number of rows)
- Description of the values (e.g., mean)
More on the raster object
: Python - Raster Analysis
outRas = Slope(inRaster)
outRas.save("sloperaster")

Esri UC 2014 | Technical Workshop |
• A series of local tools (Abs, Sin, CellStatistics, etc.) and operators can be optimized
• When entered into a single expression each tool and operator is processed on a per cell basis
Optimization
: Python - Raster Analysis

Esri UC 2014 | Technical Workshop |
• Prepare the data
• An iterative model – based on a year
• Three sub models run individually each iteration and the
results are combined
- Movement by flight (run 3 different seasons)
- Movement by hitchhiking (run once)
- Random movement (run once)
The Ash Borer model
: Python - Raster Analysis

Esri UC 2014 | Technical Workshop |
• Hitchhike on cars and logging trucks
• Most likely spread around- Roads
- Populated areas (towns and camp areas)
- Commercial area (mills)
• Have a susceptible surface- Vegetation types and density of ash
• Nonlinear decay
• Random points and check susceptibility
Movement by hitchhiking
: Python - Raster Analysis

Esri UC 2014 | Technical Workshop |
Roads, Campsites, Mills, Population,and current location (suitability)
Complex expressions
Raster object
Optimization
Demo 2: Movement by
hitchhiking

Esri UC 2014 | Technical Workshop |
• Managing rasters and performing analysis with Map Algebra
• How to access the analysis capability - Demonstration
• Complex expressions and optimization - Demonstration
• Additional modeling capability: classes - Demonstration
• Full modeling control: NumPy arrays - Demonstration
Outline
: Python - Raster Analysis

Esri UC 2014 | Technical Workshop |
• Objects that are used as parameters to tools- Varying number of arguments depending on the parameter
choice (neighborhood type)
- The number of entries can vary depending on situation (remap table)
• More flexible
• Query the individual arguments
Classes
: Python - Raster Analysis

Esri UC 2014 | Technical Workshop |
• General
- Fuzzy - Time - Horizontal Factor - Vertical Factor- KrigingModel - Radius - Neighborhood - Transformation functions
• Composed of lists
- Reclass - Weighted reclass tables - Topo
Classes - Categories
: Python - Raster Analysis

Esri UC 2014 | Technical Workshop |
• Creating
• Querying
• Changing arguments
General classes – Capability
: Python - Raster Analysis
neigh = NbrCircle(4, "MAP")
radius = neigh.radius
neigh.radius = 6

Esri UC 2014 | Technical Workshop |
• Topo
• Reclassify
• Weighted Overlay
Classes composed of lists
: Python - Raster Analysis
inContours = TopoContour([['contours.shp', 'spot_meter']])
remap = RemapValue([["Brush/transitional", 0], ["Water", 1],["Barren land", 2]])
myWOTable = WOTable([[inRaster1, 50, "VALUE", remapsnow], [inRaster2, 20, "VALUE", remapland],
[inRaster3, 30, "VALUE", remapsoil] ], [1, 9, 1])

Esri UC 2014 | Technical Workshop |
• Feature data is required for some Spatial Analyst Map Algebra
- IDW, Kriging, etc.
• Geoprocessing tools that operate on feature data can be used in an expression
- Buffer, Select, etc.
Vector integration
: Python - Raster Analysis
dist = EucDistance(arcpy.Select_analysis("schools", "#", "Pop>2000"))

Esri UC 2014 | Technical Workshop |
• Prepare the data
• An iterative model – based on a year
• Three sub models run individually each iteration and the
results are combined
- Movement by flight (run 3 different seasons)
- Movement by hitchhiking (run once)
- Random movement (run once)
The Ash Borer model
: Python - Raster Analysis

Esri UC 2014 | Technical Workshop |
• Fly from existing locations - 20 km per year
• Based on iterative time steps- Spring, summer, fall, and winter
• Time of year determines how far it can move in a time step
• Suitability surface based on vegetation type and ash density
• Iterative movement logic - “Is there a borer in my neighborhood”
- “Will I accept it” – suitability surface
Movement by flight
: Python - Raster Analysis

Esri UC 2014 | Technical Workshop |
20 km per year
Vegetation type/ash density (suitability)
Classes
Using variables
Vector integration
Demo 3: Movement by flight

Esri UC 2014 | Technical Workshop |
• Managing rasters and performing analysis with Map Algebra
• How to access the analysis capability - Demonstration
• Complex expressions and optimization - Demonstration
• Additional modeling capability: classes - Demonstration
• Full modeling control: NumPy arrays - Demonstration
Outline
: Python - Raster Analysis
Esri UC 2014 | Technical Workshop |
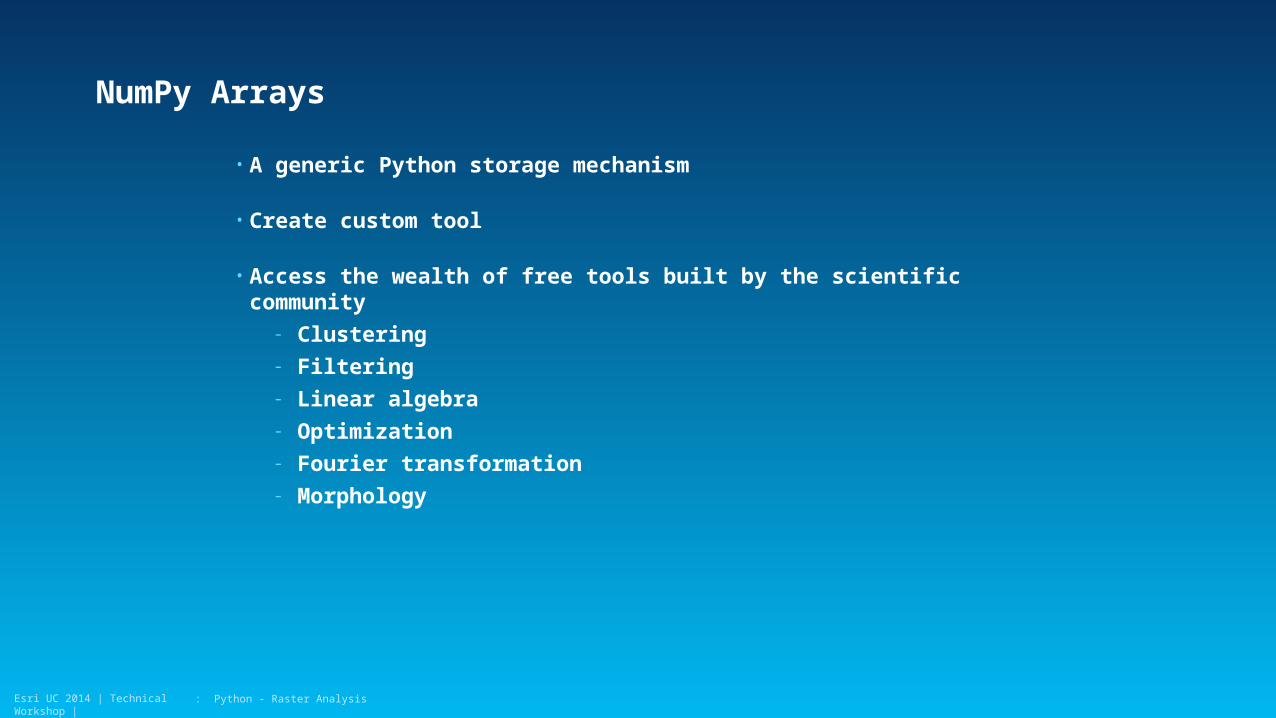
• A generic Python storage mechanism
• Create custom tool
• Access the wealth of free tools built by the scientific community - Clustering- Filtering- Linear algebra- Optimization- Fourier transformation- Morphology
NumPy Arrays
: Python - Raster Analysis

Esri UC 2014 | Technical Workshop |
• Two tools- RasterToNumPyArray
- NumPyArrayToRaster
NumPy Arrays
: Python - Raster Analysis
1
2 4
3
4
3
1
2 4
3
4
3
NumPy Array
Raster

Esri UC 2014 | Technical Workshop |
• Prepare the data
• An iterative model – based on a year
• Three sub models run individually each iteration and the
results are combined
- Movement by flight (run 3 different seasons)
- Movement by hitchhiking (run once)
- Random movement (run once)
The Ash Borer model
: Python - Raster Analysis

Esri UC 2014 | Technical Workshop |
• Some of the movement cannot be described deterministically
• Nonlinear decay from known locations
• Specific decay function not available in ArcGIS
• NumPy array- Export raster
- Apply function
- Import NumPy array back into a raster
• Return to ash borer model and integrate three movement sub models
Random movement
: Python - Raster Analysis

Esri UC 2014 | Technical Workshop |
Random movement based on
nonlinear decay from existing locations
Custom function
NumPy array
Demo 4: The random
movement

Esri UC 2014 | Technical Workshop |
Summary
• When the problem becomes more complex you may need additional capability provided by Map Algebra
• Map Algebra powerful, flexible, easy to use, and integrated into Python
• Accessed through: Raster Calculator, Python window, ModelBuilder (through Raster Calculator), and scripting
• Raster object and classes
• Create models that can better capture interaction of phenomena
• Demos are available online at https://github.com/ryandebruyn/Working_with_raster_data_using_arcpy.git

Esri UC 2014 | Technical Workshop |
Thank you…
• Please fill out the session survey:
First Offering ID: 244/1191
Second Offering ID: 244/1411
Online – www.esri.com/ucsessionsurveys
Paper – pick up and put in drop box
: Python - Raster Analysis

Esri UC 2014 | Technical Workshop | : Python - Raster Analysis