Embed Size (px)
Citation preview

Canadian Public Policy
Equity in Pharmaceutical Utilization in Ontario: A Cross-Section and Over Time AnalysisAuthor(s): Hai ZhongSource: Canadian Public Policy / Analyse de Politiques, Vol. 33, No. 4 (Dec., 2007), pp. 487-507Published by: University of Toronto Press on behalf of Canadian Public PolicyStable URL: http://www.jstor.org/stable/30032553 .
Accessed: 16/06/2014 14:24
Your use of the JSTOR archive indicates your acceptance of the Terms & Conditions of Use, available at .http://www.jstor.org/page/info/about/policies/terms.jsp
.JSTOR is a not-for-profit service that helps scholars, researchers, and students discover, use, and build upon a wide range ofcontent in a trusted digital archive. We use information technology and tools to increase productivity and facilitate new formsof scholarship. For more information about JSTOR, please contact [email protected].
.
University of Toronto Press and Canadian Public Policy are collaborating with JSTOR to digitize, preserveand extend access to Canadian Public Policy / Analyse de Politiques.
http://www.jstor.org
This content downloaded from 185.44.78.113 on Mon, 16 Jun 2014 14:24:50 PMAll use subject to JSTOR Terms and Conditions

Equity in Pharmaceutical Utilization
in Ontario: A Cross-Section and
Over Time Analysis
HAl ZHONG Economic Policy Research Institute Department of Economics and Department of Political Science University of Western Ontario, London and China Academy of Public Finance and Public Policy Central University of Finance and Economics Beijing, China
Cette etude se penche sur l'in6galit6 et l'iniquit6 que l'on peut observer dans l'utilisation de m6dicaments en Ontario. Premierement, j'analyse cette in6galit6 et cette iniquit6 en comparant deux groupes, les personnes ag6es et le reste de la population ontarienne, i trois moments : en 1990, en 1996-1997 et en 2000-2001. Pendant toute cette p6riode, les personnes Ag6es 6taient couvertes par le Programme de m6dicaments de l'Ontario (ODB), finance par le gouvernement; mais ce n'6tait pas le cas du reste de la population. Deuxiemement, j'analyse les variations dans le temps de l'in6galit6 et l'iniquit6 que l'on peut observer dans chaque groupe. ltant donn6 que, durant la periode 6tudiee, des changements, dont le partage des frais, ont 6t6 apport6s au Programme, nous pouvons d6terminer l'influence de ceux-ci sur l'6galit6 et l'6quit6 des politiques de couverture en matiere de m6dicaments.
Mots cles : iniquit6, in6galit6, m6dicaments, indice de concentration, Ontario
This study investigates inequality and inequity in pharmaceutical utilization in Ontario. First, I compare inequality and inequity in drug use between the senior and non-senior population of Ontario at three points in time: 1990, 1996/97, and 2000/01. During this period, all seniors were universally covered by the publicly financed Ontario Drug Benefit (ODB) program. This was not the case for the non-senior population. Second, I examine the changes in inequality and inequity for both population groups at each of the three time points. Cost-sharing and other changes were introduced into the ODB in this period, which allows us to identify the influence on equity of changes in drug coverage policies.
Keywords: inequity, inequality, pharmaceuticals, concentration index, Ontario
CANADIAN PUBLIC POLICY - ANALYSE DE POLITIQUES, VOL. XXXIII, NO. 4 2007
This content downloaded from 185.44.78.113 on Mon, 16 Jun 2014 14:24:50 PMAll use subject to JSTOR Terms and Conditions

488 Hai Zhong
INTRODUCTION
Most developed countries regard equity in health care access as a crucial element of
health system performance. Canada has achieved universal, first-dollar coverage' for its population for a comprehensive package of medically neces- sary physician and hospital services. However, even under public and universal coverage, the patterns of equity in the utilization of these services vary. For general practitioner and hospital services, most studies have found little or no evidence of inequity in access; variations in utilization occur mainly ac- cording to need (Eyles, Birch, and Newbold 1995; Newbold, Eyles, and Birch 1995; Van Doorslaer and Wagstaff 1992; Van Doorslaer, Koolman, and Puffer 2002; Van Doorslaer, Masseria, and OECD Health Equity Research Group 2004). For specialist services, however, a number of studies have found evidence of inequity in access; variations in utiliza- tion reflect the strong influence of non-need factors such as income and education (Alter et al. 1999; Van Doorslaer et al. 2002; Van Doorslaer et al. 2004).
Pharmaceutical insurance in out-of-hospital set- tings is neither universal nor comprehensive within the public health insurance system in Canada. Cur- rently, coverage for prescription drugs in Canada is offered through a mixture of public and private in- surance plans. In 2000, 53 percent of Canadians were covered by public drug plans, 58 percent were covered by private drug plans, 13 percent were covered by both private and public drug plans, and 2 percent of the population had no form of drug coverage (Fraser Group and Tristat Resources 2002).
The Canadian Institute for Health Information (CIHI 2005a) estimates that expenditure on pre- scribed drugs accounted for 82.5 percent of total drug expenditure in Canada in 2004. Non-prescribed drugs are paid for mainly by individual out-of- pocket expenditure. For prescribed drugs, the expenditures are shared by public drug insurance plans, private drug insurance plans, and individual out-of-pocket payment. In 2002, the public share of
spending on prescription drugs was 46.4 percent, private insurers spent 33.8 percent, and patients spent 19.8 percent.
Variation in drug coverage among the Canadian population may lead to inequity in access to needed medications. Although a few studies have considered the distributional effects of public drug subsidies (Alan et al. 2002, 2005), no study has evaluated overall equity in drug utilization. However, we need to investigate equity in drug utilization because pre- scribed drug utilization has become a more and more important component of health care services world- wide. In Canada, per capita prescribed drug expenditure rose from $119 in 1975 to $562 in 2004,2 and expenditure on prescribed drugs as a proportion of total health expenditure increased from 6.3 percent to 13.8 percent (CIHI 2005b). Prescribed drug expenditure has risen at a more rapid rate than any other health care expenditure (CIHI 2005a). Moreover, as drugs are used increasingly as the therapy of choice for many conditions, their poten- tial applications to improve health are expanding rapidly. Because equity in health care access is the goal of most health care systems, when the impor- tance of drug use as a component of health care services goes up, equity in drug utilization becomes increasingly important for overall system performance.
This study investigates income-related equality and equity in pharmaceutical utilization in Ontario and the influence of public drug insurance on this equality and equity. The fundamental difference between inequality and inequity resides in the fact that inequity represents inequality that is considered unjust and avoidable. As a result, measuring inequal- ity in pharmaceutical utilization represents the first step toward the identification of inequity in phar- maceutical utilization. This is a two-dimensional study, both cross-sectional and over time, and also across population groups. First, I compare income- related equality and equity in drug use between the senior and non-senior population in Ontario at three points in time: 1990, 1996/97, and 2000/01. During this period, all seniors in Ontario were universally
CANADIAN PUBLIC POLICY - ANALYSE DE POLITIQUES, VOL. XXXIII, NO. 4 2007
This content downloaded from 185.44.78.113 on Mon, 16 Jun 2014 14:24:50 PMAll use subject to JSTOR Terms and Conditions

Equity in Pharmaceutical Utilization in Ontario 489
covered by the publicly financed Ontario Drug Ben- efit (ODB) program. This was not the case for the non-senior population. This difference in coverage provides an opportunity to examine the impact of universal drug coverage on income-related equality and equity in drug utilization. Second, I examine the changes in income-related equality and equity for both population groups at each of the three time points. Cost-sharing and other changes introduced into the ODB during this period allow us to identify the influence of income-related equality and equity on changes in drug coverage policies.
The analysis proceeds as follows. First, for each time point, I identify whether there exists income- related inequality in observed drug utilization for each population group. Inequality here refers to the degree to which the individuals in an income distribution have shares of drug utilization that are unequal in quantity. Secondly, I measure income-related inequity in drug use. Equity here refers to horizontal equity, namely, access to drugs by all people on the basis of need. When the term access is used in most empirical studies, it is usually defined as "receipt of treatment." Although access to treatment and receipt of treatment may not be the same thing (the former refers to the opportuni- ties open to people, while the latter refers to the realization of those opportunities), I follow most em- pirical studies by measuring access as receipt of treatment because it is difficult to find measures in the datasets on opportunities open to people. In an equita- ble system, people with equal need should utilize the same amount of drugs regardless of their income or socioeconomic status. Thirdly, I decompose the in- equality into its causes. The decomposition sheds light on the causes of inequity and can inform efforts by policy-makers to improve equity in drug utilization. Finally, I compare income-related inequality and in- equity in drug use between population groups and time points.
In the next section, I briefly introduce drug cover- age in Ontario. The third section describes the data and methods that I use. The fourth section presents my results. In the last section, I draw my conclusions.
DRUG COVERAGE IN ONTARIO
Coverage for prescription drugs in Ontario is offered through a mixture of public and private insurance plans. In 2000, 62 percent of Ontario residents were covered by various private drug plans (Fraser Group and Tristat Resources 2002). It is difficult to obtain data on the percentage of Ontarians who were covered by private drug plans in 1990 and 1996/97. However, according to the Canadian Institute for Health Information (2005b), private insurers' share of prescription drug expenditure in Canada was con- sistently in the range of 30.2-33.8 percent from 1988 to 2002. Therefore, we can assume that there were no significant changes in the proportion of private drug coverage in our period of investigation.
Currently, three publicly financed provincial drug insurance programs are administered by the Drug Programs Branch of the Ministry of Health and Long-Term Care: the Ontario Drug Benefit (ODB), the Trillium Drug Program (TDP), and the Special Drug Program (SDP).
The target populations of the Ontario Drug Ben- efit program are seniors, residents of long-term care facilities and homes for special care, and social as- sistance recipients. All seniors were universally and fully covered (with no co-payments required) by this program from August 1975 to 14 July 1996. Since 15 July 1996, all seniors have continued to be uni- versally covered, but not fully covered. Single seniors with an annual income of $16,018 or more, and seniors in couples with a combined annual in- come of $24,175 or more, pay a $100 annual deductible per senior. After paying the deductible, they then pay up to $6.11 toward the dispensing fee for each prescription. All other ODB-eligible people may be asked to pay up to $2 for each prescription.
The Trillium Drug Program (TDP) is available to all residents of Ontario with valid Ontario Health Insurance (OHIP) who are not eligible for the ODB program. Individuals or families can apply to the Trillium Drug Program if private insurance does not
CANADIAN PUBLIC POLICY -ANALYSE DE POLITIQUES, VOL. XXXIII, NO. 4 2007
This content downloaded from 185.44.78.113 on Mon, 16 Jun 2014 14:24:50 PMAll use subject to JSTOR Terms and Conditions
490 Hai Zhong
cover 100 percent of their prescription drug costs. The program has a deductible of roughly 4 percent of total household income. The TDP is provided as a last resort for those who have a high level of out- of-pocket drug expenditure. It provides a protective cap on drug expenses for Ontario residents. Since April 1995, when the program was established, the number of applications has grown rapidly. From 1996 to 2001, the number of applications increased from 18,172 to 59,599 (Ontario Ministry of Health and Long-Term Care 2005).
The Special Drugs Program (SDP) covers the full cost of certain outpatient drugs used in the treat- ment of specific conditions, such as cystic fibrosis. To qualify, an individual must have one of the dis- eases or conditions covered by the program, and meet established criteria. There are no deductibles or co-payments; eligible people do not have to pay for these treatments. The total public SDP cost in- creased from $82.6 million in 1996/97 to $107.3 million in 2000/01 (Ontario Ministry of Health and Long-Term Care 2005).3
At the first time point (1990) of my study, all sen- iors in Ontario were universally and fully covered by the ODB program. A small proportion of non-seniors who received social assistance were also covered by the ODB.4 Approximately 60 percent of non-seniors were protected by private drug insurance as well. At the last two time points of my study (1996/97 and 2000/ 01), all seniors in Ontario were still universally cov- ered by the ODB, but they had to pay a deductible and some co-payments; for non-seniors, there were two new publicly financed drug insurance plans: the Trillium Drug Program and Special Drugs Program.
Differences in drug insurance coverage between seniors and non-seniors, and policy changes over time, may have influenced equality and equity in drug utilization:
Equality and equity in drug utilization among seniors may be more "pro-poor" than that among non-seniors.
*The imposition of deductibles and co-payments for seniors in the mid-1990s may have a nega- tive influence (pro-rich) on equality and equity in drug utilization.
* The implementation of the TDP and SDP may have a positive influence (pro-poor) on equality and equity in drug utilization among non-seniors.
I examine these hypotheses in the following analysis.
DATA, VARIABLES, AND METHODS
To analyze equality and equity in drug utilization, we need individual-level information on drug use, income, and other variables that may affect drug use, including gender, age, health status, recent illness and injury, education, immigration status, and ad- ditional medical insurance information.
Data The data for the three time points in this study come from the Ontario Health Survey 1990 (Ontario Min- istry of Health 1990), the public use microdata file of the National Population Health Survey 1996/97 (Statistics Canada 1996/97) and the master file of the Canadian Community Health Survey 2000/01 (Statistics Canada 2000/01).
1990 Ontario Health Survey (OHS). This compre- hensive health survey of the population of Ontario sampled all 42 public health units that existed at the time. Certain groups such as the homeless, aborigi- nal people on reserves, and those living in institutions were excluded. The survey was con- ducted by face-to-face interviews from January to November 1990 (excluding July). Each participant was asked the following question: "How many dif- ferent numbers of prescription drugs have you taken in the last four weeks?" Responses to this question form the basis for the measure of drug utilization in this analysis. The OHS also contains measures of health status, socioeconomic status, household and demographic information, income, medical
CANADIAN PUBLIC POLICY - ANALYSE DE POLITIQUES, VOL. XXXIII, NO. 4 2007
This content downloaded from 185.44.78.113 on Mon, 16 Jun 2014 14:24:50 PMAll use subject to JSTOR Terms and Conditions

insurance, and so forth, which are necessary for this analysis.
The total sample size for the 1990 OHS is 77,663. To make the analyses comparable over time, obser- vations for people between the ages of 1 and 11 years old are excluded (the National Population Health Survey and Canadian Community Health Survey contain information on drug utilization only for people aged 12 and older). The sample size for the non-senior population between the ages of 12 and 64 is 53,820; the sample size for the senior popula- tion aged 65 or over is 8,769.
1996/97 National Population Health Survey (NPHS). The NPHS is designed to collect information related to the health of the Canadian population. It is com- posed of three parts: a survey of households, a survey of institutions, and a survey of the North. My analy- sis is based on the health microdata file of the survey of households.
This component includes household residents in all provinces, with the principal exclusion of populations on Indian reserves, Canadian Forces bases, and in some remote areas of Quebec and Ontario. This analysis employs the public use file of the Ontario section of NPHS household survey (Statistics Canada 1996/97). The household survey contains two separate data files: a general microdata file and a health microdata file. In each household, some limited information was collected from all household members (general microdata file), and one person was randomly selected for a more in- depth interview (health microdata file). The health microdata file contains information about drug uti- lization for people aged 12 and over.
The NPHS asked each subject 21 questions as to whether he or she had taken a particular kind of drug in the past month. A derived variable on the "number of different drugs taken in the past month" can be constructed based on those questions and is the measurement of drug utilization in this analysis. The NPHS also includes measures of health status, socio-
Equity in Pharmaceutical Utilization in Ontario 491
economic status, household and demographic infor- mation, income, and medical insurance, which are necessary for this analysis.
The 1996/97 survey is the second cycle of the NPHS. For this cycle, the Ontario government pro- vided extra funds so that a larger sample of dwellings could be selected. The purpose of this buy-in was to obtain a sufficient sample size to provide reliable cross-sectional estimates at subprovincial levels. Therefore, the Ontario part of the NPHS 1996/97 is also referred to as the OHS 1996/97. The total sam- ple size for the Ontario health microdata file in the NPHS 1996/97 cycle is 39,010: 7,102 for the senior population, and 31,908 for the non-senior popula- tion. Data collection in Ontario ran from October 1996 to August 1997, after the reform of provincial drug plans was implemented in 15 July 1996.
2000/01 Canadian Community Health Survey (CCHS). The CCHS 2000/01 is the first cycle of the Canadian Community Health Survey, a large sam- ple, general population health survey. Information was collected between September 2000 and Novem- ber 2001 for 136 health regions, covering all provinces and territories. The CCHS - Cycle 1.1 collected responses from persons aged 12 or older living in private dwellings. Individuals living on Indian reserves and on Crown Lands, institutional residents, full-time members of the Canadian Armed Forces, and residents of certain remote regions are excluded.
The CCHS 2000/01 asked each subject 21 ques- tions as to whether the individual had taken a particular kind of drug in the past month-the same questions used in the NPHS 1996/97. A derived vari- able on the "number of different drugs taken in the
past month" was constructed based on those ques- tions as the measurement of drug utilization in this
analysis. One limitation is that inclusion of the ques- tions on drug use was optional in the CCHS 2000/ 01. Only regions with a need for data or an interest in this topic selected it. Out of the 37 public health regions in Ontario, 29 regions selected this topic;
CANADIAN PUBLIC POLICY - ANALYSE DE POLITIQUES, VOL. XXXIII, NO. 4 2007
This content downloaded from 185.44.78.113 on Mon, 16 Jun 2014 14:24:50 PMAll use subject to JSTOR Terms and Conditions
492 Hai Zhong
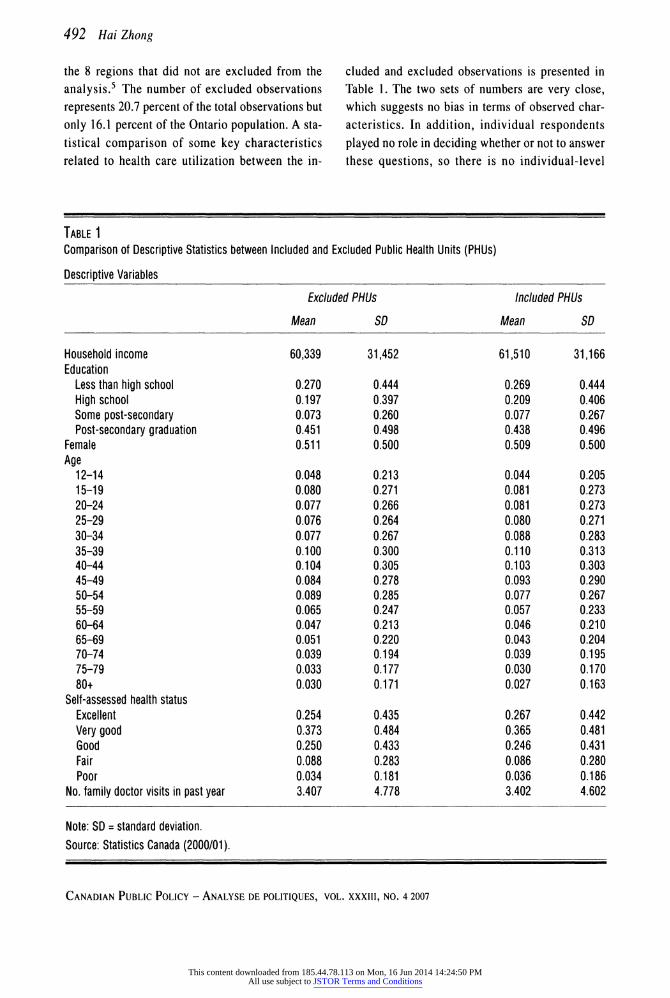
the 8 regions that did not are excluded from the analysis.5 The number of excluded observations represents 20.7 percent of the total observations but only 16.1 percent of the Ontario population. A sta- tistical comparison of some key characteristics related to health care utilization between the in-
cluded and excluded observations is presented in Table 1. The two sets of numbers are very close, which suggests no bias in terms of observed char- acteristics. In addition, individual respondents played no role in deciding whether or not to answer these questions, so there is no individual-level
TABLE 1 Comparison of Descriptive Statistics between Included and Excluded Public Health Units (PHUs)
Descriptive Variables
Excluded PHUs Included PHUs
Mean SD Mean SD
Household income Education
Less than high school High school Some post-secondary Post-secondary graduation
Female Age
12-14 15-19 20-24 25-29 30-34 35-39 40-44 45-49 50-54 55-59 60-64 65-69 70-74 75-79 80+
Self-assessed health status Excellent Very good Good Fair Poor
No. family doctor visits in past year
60,339
0.270 0.197 0.073 0.451 0.511
0.048 0.080 0.077 0.076 0.077 0.100 0.104 0.084 0.089 0.065 0.047 0.051 0.039 0.033 0.030
0.254 0.373 0.250 0.088 0.034 3.407
31,452
0.444 0.397 0.260 0.498 0.500
0.213 0.271 0.266 0.264 0.267 0.300 0.305 0.278 0.285 0.247 0.213 0.220 0.194 0.177 0.171
0.435 0.484 0.433 0.283 0.181 4.778
61,510
0.269 0.209 0.077 0.438 0.509
0.044 0.081 0.081 0.080 0.088 0.110 0.103 0.093 0.077 0.057 0.046 0.043 0.039 0.030 0.027
0.267 0.365 0.246 0.086 0.036 3.402
31,166
0.444 0.406 0.267 0.496 0.500
0.205 0.273 0.273 0.271 0.283 0.313 0.303 0.290 0.267 0.233 0.210 0.204 0.195 0.170 0.163
0.442 0.481 0.431 0.280 0.186 4.602
Note: SD = standard deviation. Source: Statistics Canada (2000/01).
CANADIAN PUBLIC POLICY - ANALYSE DE POLITIQUES, VOL. XXXIII, NO. 4 2007
This content downloaded from 185.44.78.113 on Mon, 16 Jun 2014 14:24:50 PMAll use subject to JSTOR Terms and Conditions
Equity in Pharmaceutical Utilization in Ontario 493
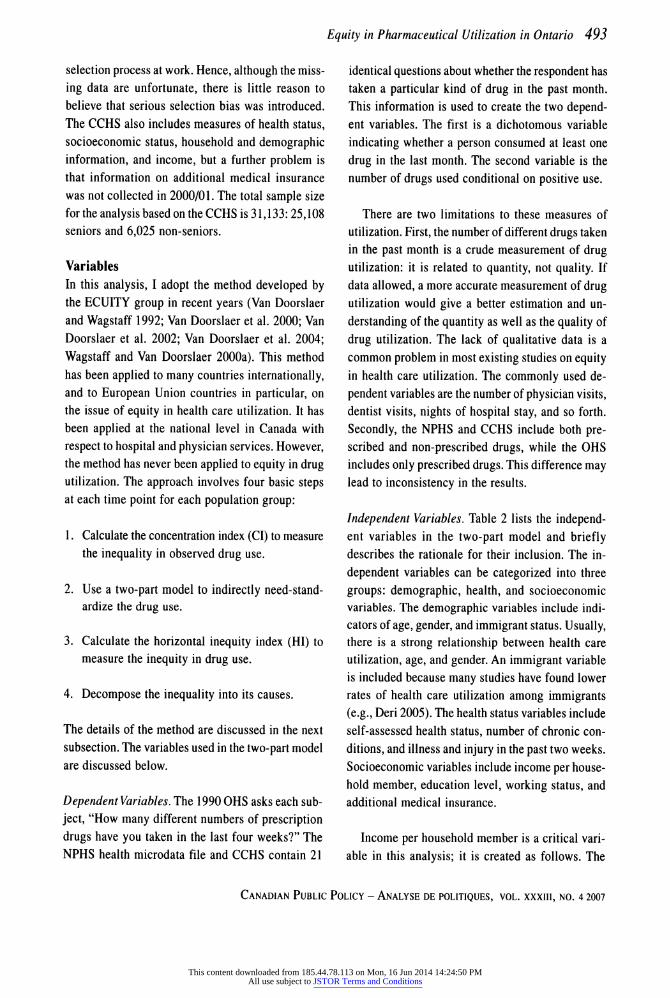
selection process at work. Hence, although the miss- ing data are unfortunate, there is little reason to believe that serious selection bias was introduced. The CCHS also includes measures of health status, socioeconomic status, household and demographic information, and income, but a further problem is that information on additional medical insurance was not collected in 2000/01. The total sample size for the analysis based on the CCHS is 31,133: 25,108 seniors and 6,025 non-seniors.
Variables In this analysis, I adopt the method developed by the ECUITY group in recent years (Van Doorslaer and Wagstaff 1992; Van Doorslaer et al. 2000; Van Doorslaer et al. 2002; Van Doorslaer et al. 2004; Wagstaff and Van Doorslaer 2000a). This method has been applied to many countries internationally, and to European Union countries in particular, on the issue of equity in health care utilization. It has been applied at the national level in Canada with respect to hospital and physician services. However, the method has never been applied to equity in drug utilization. The approach involves four basic steps at each time point for each population group:
1. Calculate the concentration index (CI) to measure the inequality in observed drug use.
2. Use a two-part model to indirectly need-stand- ardize the drug use.
3. Calculate the horizontal inequity index (HI) to measure the inequity in drug use.
4. Decompose the inequality into its causes.
The details of the method are discussed in the next subsection. The variables used in the two-part model are discussed below.
Dependent Variables. The 1990 OHS asks each sub-
ject, "How many different numbers of prescription drugs have you taken in the last four weeks?" The NPHS health microdata file and CCHS contain 21
identical questions about whether the respondent has taken a particular kind of drug in the past month. This information is used to create the two depend- ent variables. The first is a dichotomous variable indicating whether a person consumed at least one drug in the last month. The second variable is the number of drugs used conditional on positive use.
There are two limitations to these measures of utilization. First, the number of different drugs taken in the past month is a crude measurement of drug utilization: it is related to quantity, not quality. If data allowed, a more accurate measurement of drug utilization would give a better estimation and un- derstanding of the quantity as well as the quality of drug utilization. The lack of qualitative data is a common problem in most existing studies on equity in health care utilization. The commonly used de- pendent variables are the number of physician visits, dentist visits, nights of hospital stay, and so forth. Secondly, the NPHS and CCHS include both pre- scribed and non-prescribed drugs, while the OHS includes only prescribed drugs. This difference may lead to inconsistency in the results.
Independent Variables. Table 2 lists the independ- ent variables in the two-part model and briefly describes the rationale for their inclusion. The in- dependent variables can be categorized into three groups: demographic, health, and socioeconomic variables. The demographic variables include indi- cators of age, gender, and immigrant status. Usually, there is a strong relationship between health care utilization, age, and gender. An immigrant variable is included because many studies have found lower rates of health care utilization among immigrants (e.g., Deri 2005). The health status variables include self-assessed health status, number of chronic con- ditions, and illness and injury in the past two weeks. Socioeconomic variables include income per house- hold member, education level, working status, and additional medical insurance.
Income per household member is a critical vari- able in this analysis; it is created as follows. The
CANADIAN PUBLIC POLICY - ANALYSE DE POLITIQUES, VOL. XXXIII, NO. 4 2007
This content downloaded from 185.44.78.113 on Mon, 16 Jun 2014 14:24:50 PMAll use subject to JSTOR Terms and Conditions

494 Hai Zhong
TABLE 2 Independent Variables: Description and Rationale for Inclusion
Variable Description and Rationale Need Status
Demographics Age Age of the respondent at the time of interview. Age is defined by a series of 15 categorical Y
variables. The reference category is age 12-14. Aging is associated with chronic health decline and need for drugs. The use of an age-specific dummy variable allows maximum flexibility in the age-drug utilization relationship.
Female Males and females have different attitudes and needs for health care services. Sex is Y indicated by a dummy variable in which female is 1 and male is 0.
Immigrant Indicator of whether the respondent is an immigrant. Immigrant is defined in all three N surveys as not born in Canada. Immigrants may experience barriers to drug utilization because of language barriers and lack of information about the Canadian health care system.
Health status Self-assessed Respondent's self-assessed health status, defined by a series of 5 categorical variables Y health status (excellent, very good, good, fair, and poor). The reference category is excellent. Self-assessed
health status is a well-validated general health measure that is strongly associated with drug utilization.
Illness/injury Indicator of whether the respondent has experienced illness or injury (self-reported) in the Y past two weeks. Illness/injury refers to conditions that require staying in bed or cutting down on activities, which may positively relate to drug utilization.
Chronic Respondent's self-reported number of chronic conditions. Chronic conditions are strongly Y conditions associated with drug utilization.
Socioeconomic status Income Income per household member, in $1,000s. Income may be positively related to drug N
utilization. Most individuals, even those with drug insurance coverage, are required to pay a deductible and/or co-payment for prescription drugs.
Education The highest level of education attained by the respondent. Education is defined by a series of N dummy variables (less than high school, high school, some post-secondary, degree). Education has two opposite potential influences on drug utilization: (a) higher education levels are associated with better health, which may have a negative influence on a drug use; (2) higher education levels are associated with a positive attitude to health care, which may have a positive influence on drug use.
Working status Indicator of whether the respondent has held a job (full-time or part-time) in the past year. N Labour force participation has two opposite potential influences on drug utilization: (a) higher time cost and better health associated with labour force participation may have a negative influence on drug use; (b) higher income and better private drug coverage associated with labour force participation may have a positive influence on drug use.
Insurance Indicator of whether the respondent has insurance that covers all or part of the cost of N prescription medications (including any private, government, or employer-paid plans). Insurance may positively relate to drug utilization. This variable is missing in the CCHS 2000/01.
Notes: CCHS = Canadian Community Health Survey. Source: Author's compilation.
CANADIAN PUBLIC POLICY - ANALYSE DE POLITIQUES, VOL. XXXIII, NO. 4 2007
This content downloaded from 185.44.78.113 on Mon, 16 Jun 2014 14:24:50 PMAll use subject to JSTOR Terms and Conditions
OHS 1990 and NPHS 1996/97 surveys contain cat- egorical information on total household income in increments of $5,000, from no income to over $80,000.6 The CCHS 2000/01 contains information on the best estimate of total household income. All the datasets also contain information on the number of individuals in the household. Income per house- hold is defined as the mid-point of the total household income in each category divided by the number of members in that household. Several other variables that may capture multiple influences on drug utilization, such as education and working sta- tus, are also discussed in Table 2. The main purpose of the regression model is prediction rather than estimation of a causal relationship; therefore, it is not a structural model.
The descriptive statistics of the variables are pre- sented in Table 3 and Table 4. The means of most independent variables are relatively constant over time; one exception is the income per household member variable, which increased over time. For non-seniors, there are significant increases in the two dependent variables. The average number of drugs used increased from 1.023 in 1990 to 1.836 in 2000/01, and the probability of drug use increased from 0.53 in 1990 to 0.805 in 2000/01. For the sen- ior population, the number of drugs used and the probability of drug use increased slightly over time.
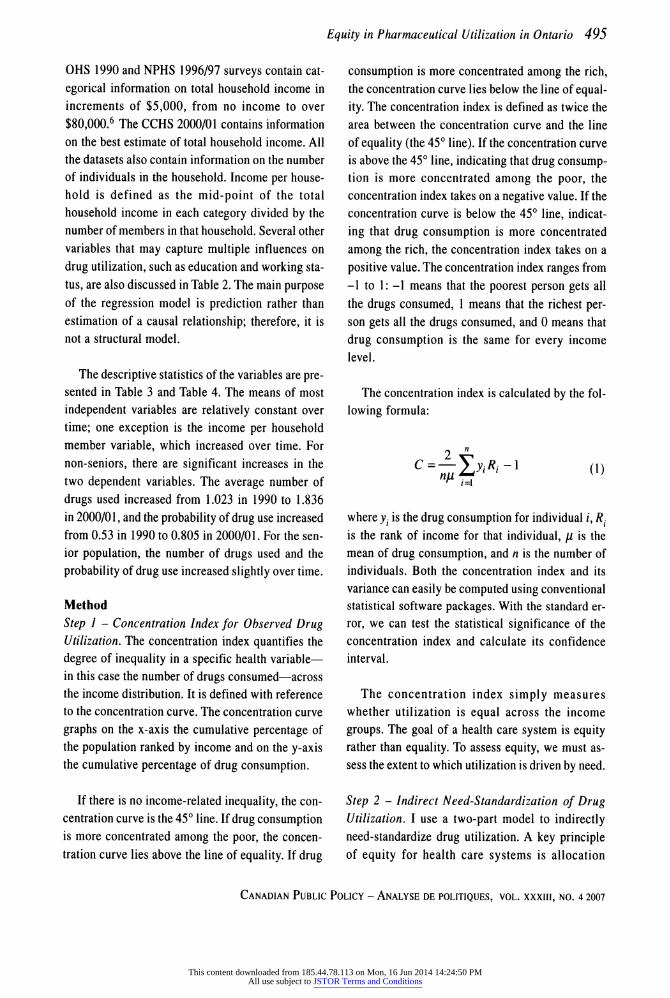
Method Step 1 - Concentration Index for Observed Drug Utilization. The concentration index quantifies the degree of inequality in a specific health variable-- in this case the number of drugs consumed-across the income distribution. It is defined with reference to the concentration curve. The concentration curve graphs on the x-axis the cumulative percentage of the population ranked by income and on the y-axis the cumulative percentage of drug consumption.
If there is no income-related inequality, the con- centration curve is the 450 line. If drug consumption is more concentrated among the poor, the concen- tration curve lies above the line of equality. If drug
Equity in Pharmaceutical Utilization in Ontario 495
consumption is more concentrated among the rich, the concentration curve lies below the line of equal- ity. The concentration index is defined as twice the area between the concentration curve and the line of equality (the 450 line). If the concentration curve is above the 450 line, indicating that drug consump- tion is more concentrated among the poor, the concentration index takes on a negative value. If the concentration curve is below the 450 line, indicat- ing that drug consumption is more concentrated among the rich, the concentration index takes on a positive value. The concentration index ranges from -1 to 1: -1 means that the poorest person gets all the drugs consumed, I means that the richest per- son gets all the drugs consumed, and 0 means that drug consumption is the same for every income level.
The concentration index is calculated by the fol- lowing formula:
C= i=1 (1)
where yi is the drug consumption for individual i, Ri is the rank of income for that individual, yt is the mean of drug consumption, and n is the number of individuals. Both the concentration index and its variance can easily be computed using conventional statistical software packages. With the standard er- ror, we can test the statistical significance of the concentration index and calculate its confidence interval.
The concentration index simply measures whether utilization is equal across the income groups. The goal of a health care system is equity rather than equality. To assess equity, we must as- sess the extent to which utilization is driven by need.
Step 2 - Indirect Need-Standardization of Drug Utilization. I use a two-part model to indirectly need-standardize drug utilization. A key principle of equity for health care systems is allocation
CANADIAN PUBLIC POLICY - ANALYSE DE POLITIQUES, VOL. XXXIII, NO. 4 2007
This content downloaded from 185.44.78.113 on Mon, 16 Jun 2014 14:24:50 PMAll use subject to JSTOR Terms and Conditions

496 Hai Zhong
TABLE 3 Descriptive Statistics: Non-Senior Population
Non-Senior Population
Descriptive Variables 1990 OHS 1996/97 NPHS 2000/01 CCHS
Mean SD Mean SD Mean SD
Number of drugs used 1.023 1.825 1.660 1.528 1.836 1.630
Probability of any drug use 0.530 0.757 0.781 0.414 0.805 0.397 Income 16.770 10.721 20.202 14.536 24.482 20.532 Female 0.505 0.500 0.521 0.500 0.501 0.500 Age
15-19 0.106 0.307 0.069 0.254 0.094 0.292 20-24 0.092 0.290 0.086 0.280 0.094 0.292 25-29 0.114 0.318 0.106 0.307 0.092 0.290 30-34 0.122 0.328 0.134 0.340 0.102 0.303 35-39 0.118 0.323 0.137 0.344 0.128 0.334 40-44 0.108 0.310 0.109 0.312 0.119 0.324 45-49 0.087 0.282 0.093 0.290 0.108 0.310 50-54 0.072 0.259 0.085 0.279 0.090 0.286 55-59 0.071 0.257 0.072 0.258 0.067 0.250 60-64 0.066 0.249 0.069 0.253 0.054 0.226
With 1 chronic condition 0.308 0.462 0.270 0.444 0.276 0.447 With 2 chronic conditions 0.176 0.381 0.145 0.352 0.161 0.368 With 3 chronic conditions 0.088 0.283 0.073 0.261 0.082 0.275 With 4+ chronic conditions 0.075 0.263 0.073 0.260 0.081 0.273 Illness/injury in past 2 weeks 0.124 0.330 0.119 0.324 0.094 0.292
Self-assessed health status Very good 0.303 0.460 0.403 0.491 0.385 0.487 Good 0.214 0.410 0.238 0.426 0.235 0.424 Fair 0.053 0.225 0.067 0.249 0.064 0.246 Poor 0.013 0.115 0.024 0.153 0.026 0.158
Education High school 0.242 0.429 0.181 0.385 0.210 0.408 Some post-secondary 0.237 0.425 0.403 0.491 0.349 0.477 Degree 0.109 0.312 0.167 0.373 0.193 0.394
Immigrant 0.190 0.392 0.189 0.392 0.307 0.461 Working 0.634 0.482 0.649 0.477 0.745 0.436 Additional insurance 0.717 0.451 0.680 0.466 - -
Notes: OHS = Ontario Health Survey. NPHS = National Population Health Survey. CCHS = Canadian Community Health Survey. SD = standard deviation.
Source: Ontario Ministry of Health (1990); Statistics Canada (1996/97, 2000/01).
CANADIAN PUBLIC POLICY - ANALYSE DE POLITIQUES, VOL. XXXIII, NO. 4 2007
This content downloaded from 185.44.78.113 on Mon, 16 Jun 2014 14:24:50 PMAll use subject to JSTOR Terms and Conditions

Equity in Pharmaceutical Utilization in Ontario 497
TABLE 4 Descriptive Statistics: Senior Population
Senior Population
Descriptive Variables 1990 OHS 1996/97 NPHS 2000/01 CCHS
Mean SD Mean SD Mean SD
Number of drugs used 2.585 2.735 2.310 1.797 2.983 2.036
Probability of any drug use 0.868 0.810 0.873 0.333 0.922 0.268
Income 14.935 10.387 18.874 11.879 21.950 18.008
Female 0.561 0.496 0.598 0.490 0.561 0.496 Age
65-69 0.377 0.485 0.313 0.464 0.310 0.462 70-74 0.259 0.438 0.293 0.455 0.282 0.450 75-79 0.205 0.404 0.196 0.397 0.213 0.409
1 chronic condition 0.229 0.420 0.216 0.412 0.176 0.381
2 chronic conditions 0.222 0.416 0.212 0.409 0.204 0.403
3 chronic conditions 0.172 0.378 0.156 0.363 0.183 0.387
4+ chronic conditions 0.247 0.432 0.245 0.430 0.315 0.465
Illness/injury in past 2 weeks 0.153 0.360 0.139 0.346 0.072 0.259
Self-assessed health Very good 0.242 0.429 0.301 0.459 0.241 0.427 Good 0.276 0.447 0.333 0.471 0.320 0.466 Fair 0.153 0.360 0.173 0.378 0.217 0.412 Poor 0.031 0.173 0.059 0.236 0.100 0.300
Education High school 0.179 0.384 0.195 0.396 0.199 0.399 Some post-secondary 0.135 0.342 0.259 0.438 0.249 0.433 Degree (BA, MA, PhD) 0.053 0.223 0.088 0.284 0.103 0.304
Immigrant 0.272 0.445 0.275 0.446 0.405 0.491
Working 0.068 0.252 0.051 0.219 0.094 0.292 Additional insurance 0.689 0.463 0.600 0.490 - -
Notes: OHS = Ontario Health Survey. NPHS = National Population Health Survey. CCHS = Canadian Community Health Survey. SD = standard deviation. Source: Ontario Ministry of Health (1990); Statistics Canada (1996/97, 2000/01).
CANADIAN PUBLIC POLICY - ANALYSE DE POLITIQUES, VOL. XXXIII, NO. 4 2007
This content downloaded from 185.44.78.113 on Mon, 16 Jun 2014 14:24:50 PMAll use subject to JSTOR Terms and Conditions

498 Hai Zhong
according to need. Under this principle, horizontal equity requires that persons in equal need of treat- ment should receive the same amount of treatment. Because the concentration index measures only the income-related inequality in observed drug utiliza- tion, an analysis of equity in drug utilization requires that we adjust for underlying need.
To do so, I use the indirect need-standardization approach proposed by Wagstaff and Van Doorslaer (2000b). The measure of drug utilization used in this analysis is the number of drugs used in the past month. The need-adjusted drug utilization can be predicted by a two-part model. Jones (2000) pro- vides an overview of the econometric methods that have been applied to this kind of count data. For health data, it is common to have a large proportion of zero observations and "overdispersion." Overdispersion means that the variance of the dis- tribution exceeds the mean. The two-part model accommodates the high proportion of zeros. Under the two-part model in this situation, the first part is a logit regression, and the second part is a negative binomial regression that deals with the "over- dispersion." The dependent variable in the first part of the model is a dichotomous variable indicating whether a person consumed at least one drug in the last month. The dependent variable in the second part of the model is the number of drugs used con- ditional on positive use. With the two-part model, not only could we measure equity in the number of drugs used, but we could also measure equity in the probability of drug use. Moreover, several studies (Grootendorst 1995; Jones 2000; Van Doorslaer et al. 2000) show that the two-part model is the best choice when the dependent variable is a quantita- tive measure of health care utilization. Therefore, I adopt the two-part model approach with appropri- ate modelling of the count data.
To measure equity, we need to create a measure in which utilization does not reflect the influence of non-need factors; it must reflect what utilization would be like if need alone drove utilization. There- fore, need-standardization requires that each
variable be classified as need related or non-need related. In this analysis, the following variables are classified as need factors: self-assessed health sta- tus, age, gender, number of chronic diseases, and illness/injury in the past two weeks. Income, edu- cation level, immigrant status, additional insurance status, and working status are classified as non-need factors. There is no unanimous agreement about what factors should be considered as need factors. Some researchers argue that education and working status should also be considered as need factors. In this case, I simply take age, gender, and morbidity as need factors because these variables are much less con- troversial and are most commonly defined as need factors in the equity studies of health care utilization.
After the estimation of each part, I fix the non- need factors at the sample means, and then predict the need-standardized probability and need- standardized number of drugs used conditional on pqsitive use based on the need factors. By doing so, we assume the average population relationship be- tween need and treatment as the norm of equity. The need-standardized expected total number of drugs used is equal to the product of need-standardized probability and the need-standardized conditional number.
Step 3 - Horizontal Inequity Index. In the third step, I calculate the horizontal inequity index (HI) for the probability of any drug use, the conditional number of drugs used, and the total number of drugs used.
The horizontal inequity index is equivalent to the concentration index for y"S (Van Doorslaer et al. 2000), where
yi yi -yi*y (2)
where yi is the measure of actual drug utilization in
the past month, Yi is the need-adjusted measure of
drug utilization, and ym is the sample mean of the measure of drug utilization in the past month.
CANADIAN PUBLIC POLICY - ANALYSE DE POLITIOUES, VOL. XXXIII, NO. 4 2007
This content downloaded from 185.44.78.113 on Mon, 16 Jun 2014 14:24:50 PMAll use subject to JSTOR Terms and Conditions

Step 4 - Decomposition of Inequality. Finally, I de- compose the inequality in observed utilization into its causes. I adopt the decomposition method pro- posed in Wagstaff, Van Doorslaer, and Watanabe (2003). In order to use this method, the number of drugs used has to be expressed by a linear equation of a set of variables that determine drug utilization. In other words, the decomposition has to be based on an OLS (ordinary least squares) regression. Van Doorslaer et al. (2004) argue that in most cases the concentration index based on OLS-predicted values is close to the true concentration index, even if the dependent variable is a count measure. In my case, the concentration index based on OLS-predicted values is also close to the true concentration index; however, because of the nature of count data, the OLS-based decomposition of inequality is an ap- proximation only.
In an OLS regression, the number of drugs used can be expressed as
Yi=a (3) k
where xk is a set of k determinants of y. The concen- tration index is
C (4) n i=1
When equation 3 is substituted into the above equa- tion, it is rearranged as
C (5) k
where xk is the elasticity of drug use with re-
spect to determinant k; Ck is the CI for variable k,
GC . and is an error term. The estimated inequality
It
Equity in Pharmaceutical Utilization in Ontario 499
in drug use can be expressed as a weighted sum of the inequality in each of its determinants; the weights are the drug use elasticities of the determi- nants. Based on the OLS regression, I decompose the concentration index for each population group.
RESULTS
Step 1 - Concentration Indices for Observed Drug Use Figure 1 and Figure 2 present the average number of drugs used by income quartile, and the average number of drugs used by those who have consumed drugs by income quartile, respectively. The bar graphs can give us a more intuitive impression of the inequality in drug use. Generally speaking, people in the lower income quartiles use more drugs than people in the higher income quartiles.7 Sen- iors use more drugs than non-seniors. And there is a trend of increased drug utilization over time.
The concentration indices measuring income- related inequality on observed drug use are reported in Table 5. The distribution is pro-poor for the sen- ior population at all three time points, although not significantly different from zero in 1996/97. For the non-senior population, the distribution is pro-poor in 1990 and pro-rich in 1996/97 and 2000/01. At all time points, the concentration indices for the senior population are more negative or, when positive, are smaller (more pro-poor) than those for the non- senior population. From 1990 to 1996/97, there is an increase in the concentration index for both the senior and non-senior population. The distribution is less pro-poor over time. This change may result from the imposition of ODB deductibles and co- payments for seniors and from a rapid increase in drug utilization by non-seniors. During this period, for the non-senior population the average number of drugs used increased from 1.02 to 1.66 (Figure 1), and the probability of drug use increased from 0.53 to 0.78 (Figure 2). This increase reflects the changes in health technology, whereby more condi- tions are being treated outside hospital settings. The
CANADIAN PUBLIC POLICY - ANALYSE DE POLITIQUES, VOL. XXXIII, NO. 4 2007
This content downloaded from 185.44.78.113 on Mon, 16 Jun 2014 14:24:50 PMAll use subject to JSTOR Terms and Conditions

500 Hai Zhong
FIGURE 1 Number of Drugs Used, by Income Quartile
3.5
3
2.5
2
1.5
1
0.5
0 1990 1990 1996/97 1996/97 2000/01
Senior Non-Senior Senior Non-Senior Senior
Bottom quartile
2nd quartile
3rd quartile
Top quartile
2000/01 Non-Senior
Source: Ontario Ministry of Health (1990); Statistics Canada (1997/97, 2000/01).
FIGURE 2 Number of Drugs Used, by Those Who Have Consumed Drugs, by Income Quartile
3.5
3
2.5
1.5
1
0.5
Bottom quartile
2nd quartile
3rd quartile
Top quartile
1990 1990 1996/97 Senior Non-Senior Senior
1996/97 2000/01 Non-Senior Senior
Source: Ontario Ministry of Health (1990); Statistics Canada (1997/97, 2000/01).
CANADIAN PUBLIC POLICY - ANALYSE DE POLITIQUES, VOL. XXXIII, NO. 4 2007
2000/01 Non-Senior
This content downloaded from 185.44.78.113 on Mon, 16 Jun 2014 14:24:50 PMAll use subject to JSTOR Terms and Conditions

Equity in Pharmaceutical Utilization in Ontario 501
TABLE 5 Concentration Index for Observed Drug Utilization
1990 OHS 1996/97 NPHS 2000/01 CCHS Population Concentration t-Statistics Concentration t-Statistics Concentration t-Statistics
Index Index Index
Senior -0.0657 -5.1328 -0.0094 -1.1899 -0.0229 -2.8272
Non-Senior -0.0210 -2.9577 0.0108 2.5714 0.0118 3.0256
Notes: OHS = Ontario Health Survey. NPHS = National Population Health Survey. CCHS = Canadian Community Health Survey. SD = standard deviation. Source: Ontario Ministry of Health (1990); Statistics Canada (1996/97, 2000/01).
increased drug utilization might be unbalanced in favour of the rich. From 1996/97 to 2000/01, the concentration index for the senior population slightly decreases (more pro-poor), while there is no significant change for the non-senior population. During this period, there is no drug policy change for seniors, and the introduction of the Trillium Drug Program and the Special Drug Program may have mitigated the worsening of the income-related in- equality among the non-senior population. From 1996 to 2001, the number of TDP applications in- creased from 18,172 to 59,599, and the total SDP cost increased from $82.6 million to $107.3 million (Ontario Ministry of Health and Long-Term Care 2005). These two programs aim to help those most in medical need who have the greatest financial con- straints. Given that the income-related inequality in drug utilization is relatively small, the TDP and SDP may have significant influence on the distribution of drug utilization across income groups.
Step 2 - Indirect Need-Standardization of Drug Utilization The goal of most health care systems is equity rather than equality. In order to measure horizontal inequity, observed drug utilization must be indirectly
need-standardized, after which we can compute the horizontal inequity index.
In view of space considerations, the results of the two-part model (a logit model on the probability of drug use, and a negative binomial model conditional on positive drug use) are not reported separately here.8 The general patterns are very similar for both parts. Generally speaking, at all three time points, for both the senior and non-senior population, there is a strong relationship between drug utilization and need factors (number of chronic diseases, illness/ injury in the past two weeks, self-assessed health status, gender, and age). Drug use increases as the number of chronic diseases increases and self- assessed health status worsens. The link between drug use and non-need factors (education, immigra- tion status, additional drug insurance, working status, and income) is much weaker. However, com- pared to the senior population, the link between drug use and non-need factors is more salient for non- seniors. The role of education, income, and immigrant status in drug use is less significant for seniors. For both seniors and non-seniors, the mag- nitude of the link between drug use and need factors is weaker at the later time points than in 1990, and
CANADIAN PUBLIC POLICY - ANALYSE DE POLITIQUES, VOL. XXXIII, NO. 4 2007
This content downloaded from 185.44.78.113 on Mon, 16 Jun 2014 14:24:50 PMAll use subject to JSTOR Terms and Conditions
502 Hai Zhong
the link between drug use and non-need factors is stronger.
After the estimation, I fix the non-need factors at the sample means, and then predict the need- standardized probability of drug use, the number of drugs used conditional on positive use, and the to- tal number of drugs used based on the need factors.
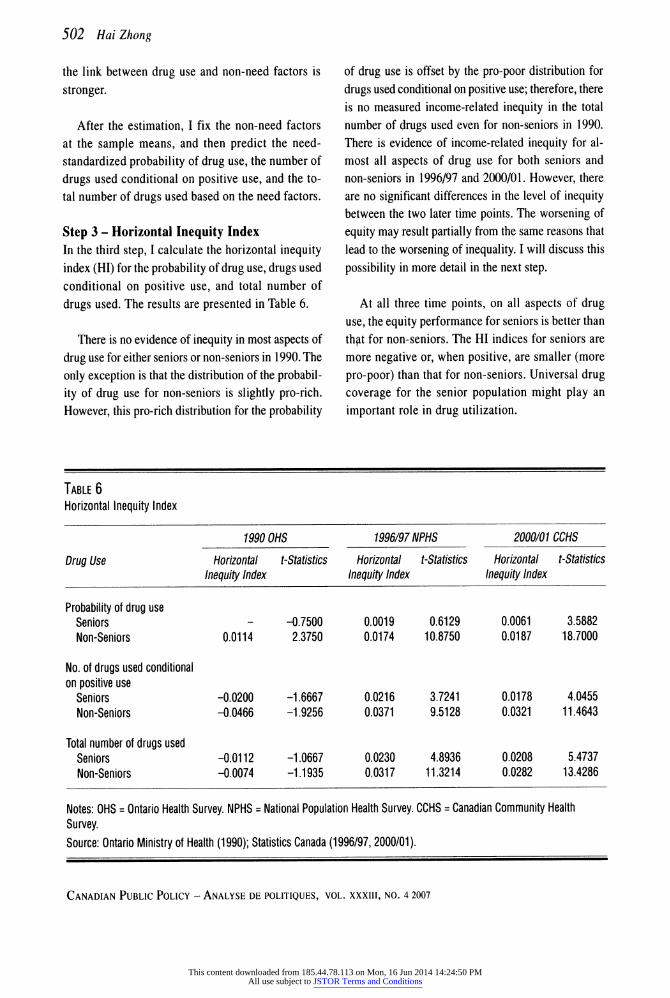
Step 3 - Horizontal Inequity Index In the third step, I calculate the horizontal inequity index (HI) for the probability of drug use, drugs used conditional on positive use, and total number of drugs used. The results are presented in Table 6.
There is no evidence of inequity in most aspects of drug use for either seniors or non-seniors in 1990. The only exception is that the distribution of the probabil- ity of drug use for non-seniors is slightly pro-rich. However, this pro-rich distribution for the probability
of drug use is offset by the pro-poor distribution for drugs used conditional on positive use; therefore, there is no measured income-related inequity in the total number of drugs used even for non-seniors in 1990. There is evidence of income-related inequity for al- most all aspects of drug use for both seniors and non-seniors in 1996/97 and 2000/01. However, there are no significant differences in the level of inequity between the two later time points. The worsening of equity may result partially from the same reasons that lead to the worsening of inequality. I will discuss this possibility in more detail in the next step.
At all three time points, on all aspects of drug use, the equity performance for seniors is better than thp~t for non-seniors. The HI indices for seniors are more negative or, when positive, are smaller (more pro-poor) than that for non-seniors. Universal drug coverage for the senior population might play an important role in drug utilization.
TABLE 6 Horizontal Inequity Index
1990 OHS 1996/97 NPHS 2000/01 CCHS
Drug Use Horizontal t-Statistics Horizontal t-Statistics Horizontal t-Statistics Inequity Index Inequity Index Inequity Index
Probability of drug use Seniors - -0.7500 0.0019 0.6129 0.0061 3.5882 Non-Seniors 0.0114 2.3750 0.0174 10.8750 0.0187 18.7000
No. of drugs used conditional on positive use
Seniors -0.0200 -1.6667 0.0216 3.7241 0.0178 4.0455 Non-Seniors -0.0466 -1.9256 0.0371 9.5128 0.0321 11.4643
Total number of drugs used Seniors -0.0112 -1.0667 0.0230 4.8936 0.0208 5.4737 Non-Seniors -0.0074 -1.1935 0.0317 11.3214 0.0282 13.4286
Notes: OHS = Ontario Health Survey. NPHS = National Population Health Survey. CCHS = Canadian Community Health Survey. Source: Ontario Ministry of Health (1990); Statistics Canada (1996/97, 2000/01).
CANADIAN PUBLIC POLICY - ANALYSE DE POLITIQUES, VOL. XXXIII, NO. 4 2007
This content downloaded from 185.44.78.113 on Mon, 16 Jun 2014 14:24:50 PMAll use subject to JSTOR Terms and Conditions

Equity in Pharmaceutical Utilization in Ontario 503
Step 4 - Decomposition of Inequality At each time point, for each population group, I decompose the unadjusted inequality (the concen- tration index) into the separate contributions of the various determinants to the total inequality. The decomposition results are summarized in Table 7 and Figure 3.
At all three time points, the overall concentra- tion indices for the senior population are more negative or smaller than that for the non-senior popu- lation. There is a more pro-poor distribution in drug use among seniors. The decompositions show that the most important source of the more pro-poor dis- tribution among seniors is that more seniors suffer from poor health, and poor health among seniors is concentrated among the poor. Compared to non-sen- iors, need factors among seniors-such as a higher number of chronic conditions, worsening self- assessed health status, illness/injury in the past two
weeks-are more concentrated among the poor. Therefore, the concentration indices of these fac- tors for seniors are more negative. Moreover, there is a positive relationship between drug use and need factors; hence, for seniors, the need factors make larger negative contributions to the total concentra- tion indices. Among non-seniors, people who are relatively older usually have poorer health status and higher income; therefore, the need factors are less concentrated among the poor, and thus make less negative contributions to the total concentration indices.
Part of the gap in concentration indices between seniors and non-seniors results from the variables of education, additional drug insurance, and immigration status. Higher education levels and additional medical insurance are concentrated more among the rich in both the senior and non-senior population. At the same time, the positive relationships between drug use and
TABLE 7 Contribution of Income-Related Inequality to the Number of Drugs Used
Contribution to Overall Cl
Variables Seniors Non-Seniors
1990 1996/97 2000/01 1990 1996/97 2000/01
Income -0.0083 0.0133 0.0026 -0.0023 0.0063 0.0102 Female 0.0003 -0.0005 -0.0015 -0.0030 -0.0040 -0.0051 Age -0.0021 0.0001 0.0005 0.0176 -0.0012 0.0024 Chronic conditions -0.0111 -0.0114 -0.0194 0.0045 -0.0010 0.0003 Illness and injury in past 2 weeks -0.0007 -0.0021 -0.0008 0.0002 -0.0020 -0.0018 Self-assessed health status -0.0257 -0.0168 -0.0216 -0.0187 -0.0137 -0.0136 Education 0.0005 -0.0002 0.0025 -0.0053 0.0062 0.0054 Immigration status 0.0019 0.0010 0.0037 0.0002 0.0028 0.0082 Working status -0.0020 -0.0008 0.0007 -0.0075 -0.0008 0.0009 Additional insurance -0.0005 0.0029 - 0.0052 0.0077 - Error -0.0181 0.0052 0.0105 -0.0119 0.0080 0.0048
Cl -0.0657 -0.0094 -0.0229 -0.0210 0.0108 0.0118
Note: CI = concentration index Source: Ontario Ministry of Health (1990); Statistics Canada (1996/97, 2000/01).
CANADIAN PUBLIC POLICY - ANALYSE DE POLITIQUES, VOL. XXXIII, NO. 4 2007
This content downloaded from 185.44.78.113 on Mon, 16 Jun 2014 14:24:50 PMAll use subject to JSTOR Terms and Conditions

504 Hai Zhong
FIGURE 3 Contribution to Concentration Indices
2000/01 Non-senior
1996/97 Non-senior
1990 Non-senior
Income
Need
Education
Immigrant
Working
Additional Insurance
Error
2001/01 Senior
1996/96 Senior
1990 Senior
-50% 0% 50% 100%
Source: Ontario Ministry of Health (1990); Statistics Canada (1996/97, 2000/01).
these two variables are stronger for non-seniors than seniors. Therefore, education and insurance make positive contributions to the gap in inequality of drug use between seniors and non-seniors. Immigration status has a different influence on drug use between senior and non-senior populations. Immigrants use fewer health care services presumably because of language barriers and lack of information about the Canadian health care system, or some other cultural reasons. Generally speaking, the negative relation- ship between immigration status and drug utilization is more significant for non-seniors. Moreover, for both seniors and non-seniors, immigrants on aver- age have less income, which implies negative concentration indices for immigration status. There- fore, immigration status makes a positive contribution to inequality in drug use between sen- iors and non-seniors. Without universal coverage, the drug utilization of non-seniors tends to be more influenced by non-need factors.
For both seniors and non-seniors, the most im- portant source of worsening of inequality in drug use over time comes from the income variable. In 1990, there is a negative but statistically insignifi- cant relationship between drug use and income. In 1996/97 and 2000/01, the relationship between drug use and income becomes positive and statistically significant, and leads to an increase of both inequal- ity and inequity in drug use. This change might be related to the introduction of ODB deductibles and co-payments for seniors, and the rapid increase in drug utilization among non-seniors during that period.
The horizontal inequity index measures only the inequality in drug use that results from non-need factors. However, because we define equity in this study as drug use according to need, and poor sen- iors are more in need, the gap of inequity in drug use (HI) between seniors and non-seniors is not as
CANADIAN PUBLIC POLICY - ANALYSE DE POLITIQUES, VOL. XXXIII, NO. 4 2007
-100%
This content downloaded from 185.44.78.113 on Mon, 16 Jun 2014 14:24:50 PMAll use subject to JSTOR Terms and Conditions

large as the gap of inequality in drug use (CI) be- tween seniors and non-seniors.9
CONCLUSION
This study analyzes equality and equity in pharma- ceutical utilization in Ontario, an issue which has not previously been examined. In 1990, I find no evidence of pro-rich inequality and inequity in drug utilization in Ontario for either seniors or non- seniors. In 1996/97 and 2000/01, I find evidence of pro-rich inequality and inequity for both population groups. At all three time points, the equality and equity performance in drug utilization for the sen- ior population dominates that of the non-senior population. Universal drug coverage for seniors might play a role in drug utilization. From 1990 to 1996/97, there is a worsening in equality and equity performance for both senior and non-senior populations, so that the distribution is less pro-poor over time. This result might be partly related to the introduction of ODB deductibles and co-payments for seniors and to the rapid increase in drug utiliza- tion during this period. From 1996/97 to 2000/01, the equality and equity performance for the senior population slightly decreased, while there is no sig- nificant change for the non-senior population. The introduction of the Trillium Drug Program and the Special Drug Program may have mitigated the wors- ening of income-related inequality and inequity among the non-senior population.
Decomposing the inequality into its causes re- veals that poor seniors are more in need of drug utilization than poor non-seniors, resulting in a more pro-poor distribution of drug utilization among sen- iors. The gap in equity performance between seniors and non-seniors is not as large as the gap in equal- ity. The gap in equity performance results partly from the variables of education, immigration sta- tus, and additional drug insurance. Without universal coverage, these variables have a greater influence on drug utilization among non-seniors. For both sen-
Equity in Pharmaceutical Utilization in Ontario 505
iors and non-seniors, the most important cause of worsening equality and equity in drug use over time comes from the income variable. The relationship between drug use and income becomes positive and statistically significant over time.
These findings may be confounded by other sys- tem changes in the health care sector during the study period. A major change in the physician sec- tor in the 1990s was the introduction and then removal of global physician-expenditure caps. Another major change was hospital restruc- turing in the late 1990s. These system changes may have influenced drug utilization. However, the im- pact of these changes on the distribution of drug use should be much smaller than the impact on overall drug use.
The most important policy implication to be de- rived from this study is that equity performance in drug utilization is closely related to drug coverage policy. Expanding special public drug programs for people highly in need (e.g., TDP and SDP), or in- troducing programs for underutilizing groups such as immigrants (e.g., programs to reduce language barriers) would improve equity in drug utilization.
NOTES
I would like to thank Jerry Hurley, Tom Crossley, and an anonymous referee for helpful comments. I also acknowl- edge the data support by Statistics Canada RDC at McMaster and the University of Western Ontario.
'First-dollar coverage refers to health insurance cov- erage without deductibles and co-payments.
2Values are converted to 2004 constant dollars.
3These costs represent approximately 1.9 percent of total drug expenditure in Ontario in 1996 and 1.7 percent in 2000.
4It is difficult to estimate the size of this group of peo- ple. According to Social Development Canada (2005), 5 to 8 percent Ontarians received social assistance each year
CANADIAN PUBLIC POLICY - ANALYSE DE POLITIQUES, VOL. XXXIII, NO. 4 2007
This content downloaded from 185.44.78.113 on Mon, 16 Jun 2014 14:24:50 PMAll use subject to JSTOR Terms and Conditions

506 Hai Zhong
from 1999 to 2004. A significant proportion of the re- cipients were children and seniors.
5The eight excluded public health units are Haliburton- Kawartha-Pine Ridge; Hastings and Prince Edward; Brant; Renfrew; Kingston, Frontenac Lennox & Addington; Ottawa-Carleton; Eastern Ontario; and Leeds- Grenville-Lanark.
6The categories of household income are 0-$5000, $5000-$9999, $10000-$14999, $15000-$19999, $20000- 24999, $25000-$29999, $30000-$39999, $40000-$49999, $50000-$59999, $60000-$79999, and $80000+.
7These seemingly "pro-poor" results are not yet ad- justed for need and, if the poor have greater need, it may nonetheless be the case that the utilization of drugs is not equitable with the poor possibly receiving less drugs than would be equitable based on need.
8Results of step 2 are available upon request.
9By definition, the HI index is equal to the sum of contributions of non-need factors to the total inequality.
REFERENCES
Alan, S., T. Crossley, P. Grootendorst, and M. Veall. 2002. "The Effects of Drug Subsidies on Out-of-pocket Pre- scription Drug Expenditures by Seniors: Regional
Evidence from Canada." Journal of Health Econom- ics 21:87-108.
- 2005. "Distributional Effects of General Population Prescription Drug Programs in Canada." Canadian Journal of Economics 38:128-48.
Alter, D., D. Naylor, P. Austin, and J. Tu. 1999. "Effects of Socioeconomic Status on Access to Invasive Car- diac Procedures and on Mortality after Acute Myocardial Infarction." New England Journal of Medi- cine 341:1359-67.
Canadian Institute for Health Information (CIHI). 2005a. Drug Expenditure in Canada, 1985 to 2004. Ottawa: CIHI.
- 2005b. National Health Expenditure Trends, 1975 to 2004. Ottawa: CIHI.
Deri, C. 2005. "Social Networks and Health Service Uti- lization." Journal of Health Economics 24:1076-107.
Eyles, J., S. Birch, and K. Newbold. 1995. "Delivering the Goods? Access to Family Physician Services in
Canada: A Comparison of 1985 and 1991." Journal of Health and Social Behaviour 36:322-32.
Fraser Group and Tristat Resources. 2002. Drug Expense Coverage in the Canadian Population: Protection from Severe Drug Expenses. Toronto: Fraser Group and Tristat Resources.
Grootendorst, P. 1995. "A Comparison of Alternative Models of Prescription Drug Utilization." Health Eco- nomics 4:183-98.
Jones, A. 2000. "Health Econometrics." In Handbook of Health Economics, ed. A. Culyer and J. Newhouse. Amsterdam: North Holland.
Newbold, K., J. Eyles, and S. Birch. 1995. "Equity in Health Care: Methodological Contributions to the Analysis of Hospital Utilization within Canada." So- cial Science & Medicine 40:1181-92.
Ontario Ministry of Health. 1990. Ontario Health Survey 1990. Toronto: Knowledge Management and Report- ing Branch, Ontario Ministry of Health and Long-Term Care (renamed).
Ontario. Ministry of Health and Long-Term Care (MOHLTC). 2005. 2004/05 Report Card for the On- tario Drug Benefit Program. Toronto: MOHLTC.
Social Development Canada. 2005. Social Assistance Sta- tistical Report: 2004. Ottawa: Social Development
Canada. Statistics Canada. 1996/97. National Population Health
Survey 1996/97 - Household Component. Ontario
health microdata file. Cat. No. 82C0013. Ottawa: Min- istry of Industry.
Statistics Canada. 2000/01. Canadian Community Health Survey - Cycle 1.1. At http://www.statcan.ca/english/ concepts/health/index.htm
Van Doorslaer E., X. Koolman, and F. Puffer. 2002. "Eq- uity in the Use of Physician Visits in OECD Countries: Has Equal Treatment for Equal Need Been Achieved?" In Measuring Up: Improving Health Systems Perform- ance in OECD Countries. Paris: OECD.
Van Doorslaer E., C. Masseria, and the OECD Health Eq- uity Research Group. 2004. "Income-Related Inequality in the Use of Medical Care in 21 OECD Countries." OECD Health Working Paper No. 14, Paris.
Van Doorslaer E. and A. Wagstaff. 1992. "Equity in the Delivery of Health Care: Some International Compari-
sons." Journal of Health Economics 11:389-411. Van Doorslaer E., A. Wagstaff, H. van der Burg, T.
Christiansen, D. de Graeve, I. Duchesne, U. Gerdtham,
M. Gerfin, J. Geurts, L. Gross, et al. 2000. "Equity in
CANADIAN PUBLIC POLICY - ANALYSE DE POLITIQUES, VOL. XXXIII, NO. 4 2007
This content downloaded from 185.44.78.113 on Mon, 16 Jun 2014 14:24:50 PMAll use subject to JSTOR Terms and Conditions

Equity in Pharmaceutical Utilization in Ontario 507
the Delivery of Health Care in Europe and the U.S." Journal of Health Economics 19:553-83.
Wagstaff A. and E. Van Doorslaer. 2000a. "Equity in Health Care Financing and Delivery." In Handbook of Health Economics, ed. A. Culyer and J. Newhouse. Amsterdam: North Holland.
- 2000b. "Measuring and Testing for Inequity in the
Delivery of Health Care." Journal of Human Resource 35:716-33.
Wagstaff, A., E. Van Doorslaer, and N. Watanabe. 2003. "On Decomposing the Causes of Health Sector In-
equalities with an Application to Malnutrition Inequalities in Vietnam." Journal of Econometrics 112(1):207-23.
CANADIAN PUBLIC POLICY - ANALYSE DE POLITIQUES, VOL. XXXIII, NO. 4 2007
This content downloaded from 185.44.78.113 on Mon, 16 Jun 2014 14:24:50 PMAll use subject to JSTOR Terms and Conditions