Embed Size (px)
Citation preview

Episodic Transdermal Delivery of TestosteroneRitu Malik,† K. S. Venkatesh,‡ Anil Kumar Dwivedi,† and Amit Misra*,†
†Pharmaceutics Division, CSIR-Central Drug Research Institute, Lucknow, 226001, India‡ACES and Department of Electrical Engineering, Indian Institute of Technology, Kanpur, 208016, India
ABSTRACT: Film-forming lotions, precast films and adhesive patches containing testosterone (T) were prepared bycompounding vinylic, acrylic and cellulosic polymers with a variety of excipients in order to achieve distribution of T in domainsof heterogeneity within multicomponent matrices. The feasibility of this approach in achieving episodic transdermal delivery oftestosterone (T) was investigated. Composition-dependent differences in extent of in vitro drug release and periodicity wereobserved. Representative formulations showing the most pronounced episodic T release in vitro were tested in female rats.Whereas intravenously administered T decayed exponentially, three maxima of T in serum were observed upon application ofselected formulations. Thus, peak serum concentrations of 240, 36, and 29 ng/dL were observed at 0.2, 5, and 16.8 h afterapplication of the preferred lotion formulation, and 89, 65, and 64 ng/dL at 1, 16.4, and 48.8 h after patches. Deconvolution,noncompartment pharmacokinetic analysis and multiple peak fitting also indicated episodicity. These results suggest thefeasibility of using transdermal systems for pulsatile T delivery in a variety of clinical applications, including hormonesupplementation and male contraception.
KEYWORDS: nanoparticles, adhesive-dispersion, dermatopharmaceutics, skin permeation
■ INTRODUCTIONTestosterone (T) is a crucial androgen mediating variedanabolic and reproductive effects. Exogenous administration ofT is indicated for androgen replacement therapy in malehypogonadism, erectile dysfunction, type 2 diabetes andtreatment of female androgen deficiency.1−3 T also haspotential as a stand-alone, noninvasive and user-friendlyhormonal male contraceptive.4
Design of T delivery systems requires attention to the timecourse of T secretion in healthy, fertile adult males. The malereproductive endocrine axis in fertile men displays a 24 hbiorhythm evocative of the 28 day menstrual cycle in women.The hypothalamus secretes gonadotrophin-releasing hormonein synchronous bursts, which stimulate episodic secretion ofgonadotrophins by the anterior pituitary. Luteinizing hormonefrom the pituitary acts on Leydig cells in the testes, stimulatingT production required to support spermatogenesis. T crossesthe blood−testis barrier and feedback-inhibits secretion ofhypothalamic and pituitary hormones.5 Ideally, therefore,exogenous replacement of T should mimic the transient risesand falls in blood levels observed in normal physiology.Episodic T delivery, rather than maintenance of a high,
inhibitory concentration of T, additionally has the potential tofeedback-inhibit the episodic secretion of reproductivehormones necessary for male fertility.6 The present reportdescribes transdermal formulations capable of delivering T inan episodic manner.The pharmacokinetics of conventional transdermal T are
beneficial in androgen supplementation, but are not effective asstand-alone male contraceptives, probably because the serum Tlevels generated are inadequate for suppression of thereproductive endocrine axis.7−10 Transdermal androgen gels,including those providing sustained and higher serum T levels,are associated with incomplete suppression of spermatogenesisalong with other adverse effects of T,11 and are additionallyliable to accidentally virilize contacts of their users.12,13
Transdermal T has been formulated as patches,14−17 film-forming lotions and sprays,18 and supersaturated liquid-crystalgels,19,20 but episodic T delivery is addressed by none of these.
Received: May 4, 2011Revised: April 17, 2012Accepted: April 25, 2012Published: April 25, 2012
Article
pubs.acs.org/molecularpharmaceutics
© 2012 American Chemical Society 1537 dx.doi.org/10.1021/mp200558a | Mol. Pharmaceutics 2012, 9, 1537−1543

Yet, the overall circadian profile of T concentrations, consistingof one maximum over a 24 h period, is provided by a number offormulations. Most transdermal T formulations for whichclinical and/or preclinical pharmacokinetics are establisheddemonstrate a curious “biphasic” profile in serum, which wasinitially reported as a formulation-related outcome, but isdiscernible in data published by unrelated groups.6,17,21,22 Suchbiphasic behavior indicates the possibility of using acombination of formulation strategies and the skin reservoireffect to obtain multiple maxima in the delivery profile.6,17,21
We have earlier shown that formulating T as nanoparticles ofcontrolled size and crystallinity can control drug delivery in thetime dimension and provide pulsatile drug delivery.6 Confine-ment of T within pores of a polymeric matrix yieldsnanoparticles with crystal dimensions and habit controlled byconstraining the growing crystals within “pockets” of electro-static charge that impart stability to unstable crystal forms.Nanoparticulate T possesses different levels of free surfaceenergy leading to differences in dissolution behavior.23 Theapproach taken in the present work employs formulationadditives to achieve pulsatile T release. The aim was tostandardize drug−polymer−modifier matrices containing uni-formly dispersed domains of different composition in a singledelivery system.24
■ EXPERIMENTAL SECTIONTestosterone, B.P., was obtained from Fluka Laboratories(Switzerland). Poly(vinyl pyrrolidone) (PVP, MW 400),poly(vinyl acetate) (PVAc, degree of polymerization 4000),poly(methyl methacrylate) (PMMA, MW 15000), hydroxy-propyl methylcellulose (HPMC, 80−120 cP) and CremophorEL were procured from Sigma-Aldrich. Emdilith DM-45 is aproprietary (Mafatlal Dyes and Chemicals, India) pressure-sensitive adhesive formulation widely used for making stick-oncosmetic bindis for application on the forehead and is based onan ethylene-vinyl acetate copolymer. It was purchased from thelocal market. Labrasol was sourced from Gattefosse, USA; oleicacid and poly(ethylene glycol) (PEG 400) were purchasedfrom Merck, India. Soybean oil was from Cargill, India, andethylene glycol, isopropanol and α-terpineol were obtainedfrom S.D. Fine Chemicals, India. Ethanol was freshly distilledfrom commercial rectified spirit. Chromatography gradesolvents were supplied by Merck, Qualigens, or ThomasBaker (India). Serum T concentrations were assayed induplicate using an ELISA kit (DRG Instruments GmBH,Germany).Outbred, female Sprague−Dawley rats (Rattus rattus), more
than 8 weeks of age, were used for in vivo studies. The animalswere provided by the Laboratory Animals Division of theInstitute, and experiments were approved and supervised by theInstitutional Animal Ethics Committee.Formulations. For intravenous administration, a solution of
50 mg/mL was prepared by dissolving T in a 1:1 mixture ofCremophor EL:distilled ethanol. A 200 μL aliquot was diluted20 times with dextrose−normal saline and sterile-filteredthrough a 0.22 μm filter prior to administration.Fractional factorial designs (data not shown) were used to
arrive at various compositions of film-forming lotions, precastfilms or adhesive-dispersion patches, based on a desirabilityindex constructed from four parameters: film integrity, tack,breaking strength and transparency. Lotions (L1−L3) thatdeposit in situ films on the skin were prepared using PVP inisopropanol (IPA).21 Ingredients described in Table 1 were
homogenized with indicated volumes of solvent for 2 min at12,000 rpm. Compositions containing smaller amounts ofingredients than those specified released smaller amounts of T,whereas further increases in the amounts of excipients did notresult in appreciable increases in T (data not shown).Films (F1−F4) of composition detailed in Table 1 and
containing 9 mg of T/cm2 were cast on mercury. Using amicropipet, the slurry was layered gently on the surface, and itsspread was confined within a Teflon O-ring of inner diameter1.13 cm placed on the surface, to obtain unit films of area ∼1cm2. Films were left overnight at room temperature to dry.Transdermal patches of dose strength 9 mg/cm2 each were
prepared using Emdilith DM-45 as reported earlier.17 T wasdissolved in a minimal volume of methanol and incorporated1:50 in Emdilith by geometric mixing. The compoundedmixture was coated on fabric strips by spreading evenly with aglass slide. The strips were allowed to air-dry overnight at roomtemperature. The adhesive side of the dry strip was sealed witha removable linear. Patches of diameter 1.13 cm (area ∼1 cm2)were cut from the strips and checked for weight variation andcontent uniformity.
Analytical Method Validation, Assays for WeightVariation, Dose Uniformity and Recovery (ExtractionEfficiency). Formulations were tested for weight variation (n =10) on a Mettler AE 160 5-digit balance. For establishing
Table 1. Transdermal Formulations Containing 9 mg of Tper Unit
code description
Film-Forming LotionsL1 T (1 parts w/v)
PVP (10 parts w/v)soyabean oil (0.7 part v/v)IPA (70 parts v/v)
L2 L1 + span 85 (1 part w/v)L3 L2 + oleic acid (0.5 part w/v)
+ ethylene glycol (3.5 parts v/v)+ Labrasol (1 part w/v)
FilmsF1 T (0.1 part w/v)
PVP (20 parts w/v)PVAc (30 parts w/v)methanol (500 parts)
F2 F3 + oleic acid (0.5 part w/v)+ ethylene glycol (3 parts v/v)+ Labrasol (1 part w/v)
F3 T (0.1 part w/v)PMMA (20 parts w/v)HPMC (5 parts w/v)isopropanol:dichloromethane, 2:3 (250 parts v/v)Emdilith DM 45 (1 part w/v suspended in 10 parts methanol)
F4 F1 + oleic acid (0.5 parts w/v)+ ethylene glycol (3 parts v/v)+ Labrasol (1 part w/v)
PatchesP1 T (1 part w/w)
methanol, q.s.Emdilith DM 45 (50 parts w/w)
P2 P1 + α-terpineol (0.5 part v/v)P3 P1 + ethylene glycol (1 part v/v)P4 P3 + oleic acid (0.5 part w/v)
+ Labrasol (1 part w/v)
Molecular Pharmaceutics Article
dx.doi.org/10.1021/mp200558a | Mol. Pharmaceutics 2012, 9, 1537−15431538

content uniformity, films and patches were extracted overnightwith dichloromethane and the extracts filtered, dilutedappropriately with methanol and analyzed by high performanceliquid chromatography (HPLC). Calibration standard solutionsof logarithmic dilution and QC samples were prepared intriplicate. Partial validation of the analytical method was doneby determining the accuracy (% DFA) and precision (CV %)among three replicates during intraday and interday analysis.The % RSD for the drug content among the patches and filmsof the same batch was determined.For determining extraction efficiency, different amounts of T
(2, 4, 6, 8, and 10 mg) were spiked as methanol solutions in T-free formulation matrix. Spiked matrices were allowed to dry,extracted, reconstituted in methanol and analyzed by HPLC.T was analyzed using a Shimadzu HPLC system, equipped
with a SCL-10 ATVP system controller, LC-10 AT VP twinpumps, SPD-10 AVP UV−vis detector, and Rheodyne injector(Cotati, USA) with a 20 μL injection loop. Separation wasachieved on a C-18 reverse phase analytical column(Phenomenex). Data were acquired using Shimadzu HPLCsoftware Class-VP. Chromatographic conditions comprised amobile phase of acetonitrile:0. 1% glacial acetic acid 50:50 (v/v) at a flow rate of 1 mL/min and detection wavelength 239nm.In Vitro Drug Release. In vitro drug release was studied
using a flow through diffusion cell proposed and validated byAddicks et al.25,26 and employed previously for similar studies.17
PBS at pH 7.4, containing 40% (v/v) poly(ethylene glycol)(PBS-PEG)17,21,27 was used as the release medium at the rate of1 mL/min using an HPLC pump. Films or patches were placedin the cell to ensure contact with the release medium across acircular aperture of radius 0.564 cm (area 1 cm2) and coveredwith an occlusive backing adhesive tape to secure them in place.Samples were collected at intervals of 30 min. The releaseddrug was analyzed by HPLC. Partial validation of thecalibration curve in PBS-PEG flow media was also carried outas above.Pharmacokinetics in Rats. Female Sprague−Dawley rats
weighing 200−250 g were used for these studies. Prior toapplication of test formulations, 1 mL blood samples weredrawn at clock times 10 a.m., 4 p.m., 10 p.m. and 4 a.m. At leastone week was allowed between blood sampling experiments forthe animals to recover.Serum concentrations at 5 min intervals following intra-
venous (iv) administration of 0.1, 0.25, and 0.5 mg T werestudied for 1 h in ketamine-anesthetized female rats with thesciatic vein canulated. Blood samples of 100 μL each weredrawn for these studies. Serum concentrations resulting fromapplication of film-forming lotions (100 μL) containing 9 ±0.04 mg, films containing 9.02 ± 0.46 mg and patchescontaining 9 ± 1.35 mg of T were studied for 24 or 72 h.One day prior to application of test formulations, a portion
of the dorsal surface was depilated and allowed to heal for 24 h.Each formulation was tested in duplicate. Blood samplingfollowing transdermal application was staggered among twosets of 4 animals each (A1, B1, C1, D1, A2, B2, C2, and D2) toavoid hypovolemic stress. A1 and A2 were sampled by orbitalpuncture at 0.5 and 4 h postapplication; B1 and B2 at 1 and 8 h,and so on, to obtain ∼1 mL of blood at 0.5, 1, 1.5, 2, 4, 8, 16,and 24 h after application of lotions and films. Additionalsamples were drawn at 36, 48, 60, and 72 h after application ofpatches. Samples were immediately centrifuged at 10000g for 3min. The serum was separated and stored at −70 °C until
analysis by ELISA. The minimal detectable dose was 0.083 ng/dL. The range of the assay was between 0 and 1600 ng/dL. Theintra- and interassay coefficients of variation were approx-imately 3.8% and 9.8%, respectively. A standard curved wasgenerated using an unweighted Logit-Log regression fit.
Data Analysis. All batches of formulations were analyzedfor content variation by parametric one way ANOVA usingSigmastat version 3.5. The Kolmogorov−Smirnov statistic wasused to ascertain the normality of the distribution (P = 0.05).Multiple pairwise comparisons were therefore done using theHolm−Sidalk test for means comparison. Statistical significancewas inferred for an outcome of p-values less than or equal to0.05. Data are presented as mean ± SD.Serum concentration−time data was deconvoluted using
WinNonlin ver. 5.3. The unit impulse response (UIR) wascalculated from the constants A (inverse of the volume ofdistribution at steady state, Vss, calculated as the product ofmean residence time at infinity and clearance) and α(elimination rate constant K1,0) derived from pharmacokineticdata following iv administration. Secondary parameters of ivpharmacokinetics were calculated from primary data using a 1-compartment “bolus” model: Ct = D/V(e−K1,0t). Noncompart-ment analysis (NCA) of deconvoluted data was used to derivepharmacokinetic parameters following transdermal application.Peak detection in the serum concentration−time profiles was
additionally conducted using the Giddings chromatographicpeak-fitting functions.28 Nonlinear curve fitting by Simplexiterations to minimize χ2 was done using MicroCal Origin.Weighting by standard deviations from mean observed valueswas employed.
■ RESULTSPhysicochemical Evaluation. Since differences in content
uniformity can strongly affect drug release rates, it wasimportant to establish whether the reported formulationswere reproducible and uniform in content. For this purpose,the method of analysis was first validated. The HPLC methodwas satisfactory, showing baseline separation of the T peak andlinear (r2 > 0.99) quantitation between 200 ng and 8 μg/mLregardless of the nature of the matrix. Intraday accuracy (%DFA) was 0. 6−4.3% and precision (% CV) was 0.44−5.3%among three replicates. Interday % DFA was 0.78−5.2%, and %CV was 1.08−4.18%. Intraday validation of calibration curve inPBS-PEG resulted in 0.80−5.7% DFA and 0.30−4.2% CV,while corresponding ranges interday were 0.47−5.02% and0.61−5.5% respectively.Extraction efficiencies or recovery of T from formulation
matrix were 84−115 (% CV 0.4−4.7%), (% CV 1.2−3.9%)respectively. Uniformity of content was observed in allprototype formulations. The % RSD of within-batch weightvariation in precast films and patches was <10%, and unit dosescontained 85−115% of the expected amount (9 mg/dose).Within-batch variance in drug content estimated by mean sumof squares was of the order of 2 × 10⁻⁴, while a single ANOVAfor all categories (batches), followed by post hoc comparison ofmeans indicated no significant differences between units fromdifferent batches.
In Vitro Drug Release. Drug release from film-forminglotions could not be studied in vitro, since the liquid nature ofthe formulation resulted in immediate equilibration with therelease medium. Films and patches containing 9 mg of T werestudied using a flow-through cell and exhibited release profilesshown in Figure 1. Additives significantly enhanced the
Molecular Pharmaceutics Article
dx.doi.org/10.1021/mp200558a | Mol. Pharmaceutics 2012, 9, 1537−15431539

quantum of release from both sets of formulations. F1 and F3released 0.3 and 0.4% of their content in 7 h, while F2 and F4released 3.5 and 6% respectively, in the same period. Theenhancement in extent of drug release was more prominent inthe case of patches, presumably on account of the larger relativeproportion of additives that could be incorporated in patches(Table 1). The proportion of additives in films could not beincreased significantly without compromising film integrity,flexibility and organoleptic properties.Pharmacokinetics in Rats. Figure 2 shows results
obtained following iv administration of 0.5, 0.25, and 0.1 mg
of T to female rats. Model fitting using WinNonlin 5.3generated pharmacokinetic parameters shown in Table 2. The
values of t1/2 (35 min) and Cl (140 dL/min) calculated fromthe data are in agreement with values reported in theliterature.19 Values of A and α required to calculate the unitimpulse response used for deconvolution were derived from thegrand-averaged t1/2 and Vss.Blood levels determined after administration of T to animals
not only represent concentrations arising as a result of theexogenous input but also include endogenous T released intothe bloodstream. Background serum T in female rats(presumably released from the adrenals) ranged from 0 to 4ng/dL at all sampling times. The four samples taken covering24 h showed a circadian rhythm. There was a peak at ∼4 a.m.and a nadir at ∼4 p.m., and there were intermediate serumconcentrations at ∼10 a.m. and ∼10 p.m. (inset, Figure 3A).
Representative formulations showing the most prominentepisodes of T delivery were tested in vivo. Transdermalapplication of T-containing lotions resulted in elevation ofserum T by at least an order of magnitude above thebackground levels (Figure 3A). Serum T data obtained afterapplication of L1 and L3 was deconvoluted using values of Aand α shown in Table 2, and subjected to NCA for determiningsecondary pharmacokinetic parameters (Table 3). L1 delivered
Figure 1. In vitro release of T from films F1 through F4 and patchesP1 through P4 (n = 4/formulation, ± SD).
Figure 2. Intravenous pharmacokinetics of T at 0.5, 0.25, and 0.1 mgdose levels in female rats (n = 4, ± SD).
Table 2. Secondary Pharmacokinetic Parameters and UIR Following Iv Dosing
param AUC (min·ng/dL) K1,0t1/2 (min) C0 (ng/dL) Cl (dL/min) Vss (dL) A (ng/dL/mg) α (1/min)
Dose: 0.1 mgvalue 1802.54 41.02 30.46 55.48 3283 0.000305 1.014SEM 103.53 3.71 1.27 3.19 137 0.00001 0.03
Dose: 0.25 mgvalue 2251.96 41.52 37.59 111.01 6650 0.00015 1.002SEM 103.46 2.65 1.07 5.11 189 0.00001 0.04
Dose: 0.5 mgvalue 1962.78 22.36 60.85 254.74 8217 0.0001217 1.860SEM 130.63 2.46 4.67 16.97 631 0.00001 0.18
Averagevalue 2005.76 34.97 42.97 140.41 6050 0.000192 1.292SEM 75.92 3.64 5.30 34.28 841 9.84 × 10⁻⁵ 0.492
Figure 3. (A) Mean serum concentration of T in female rats (n = 4,±SD) after dermal application of L1 (filled squares) and L3 (opensquares). Curves were generated by deconvolution. The shadedportion depicts baseline levels in the same animals. (B) Three peaksdetected by peak-fitting functions and the curve (r2 = 0.98) fitted tothe data with respect to L3. (C) Multiple peaks were not detected inthe case of L1 by the same analysis.
Molecular Pharmaceutics Article
dx.doi.org/10.1021/mp200558a | Mol. Pharmaceutics 2012, 9, 1537−15431540
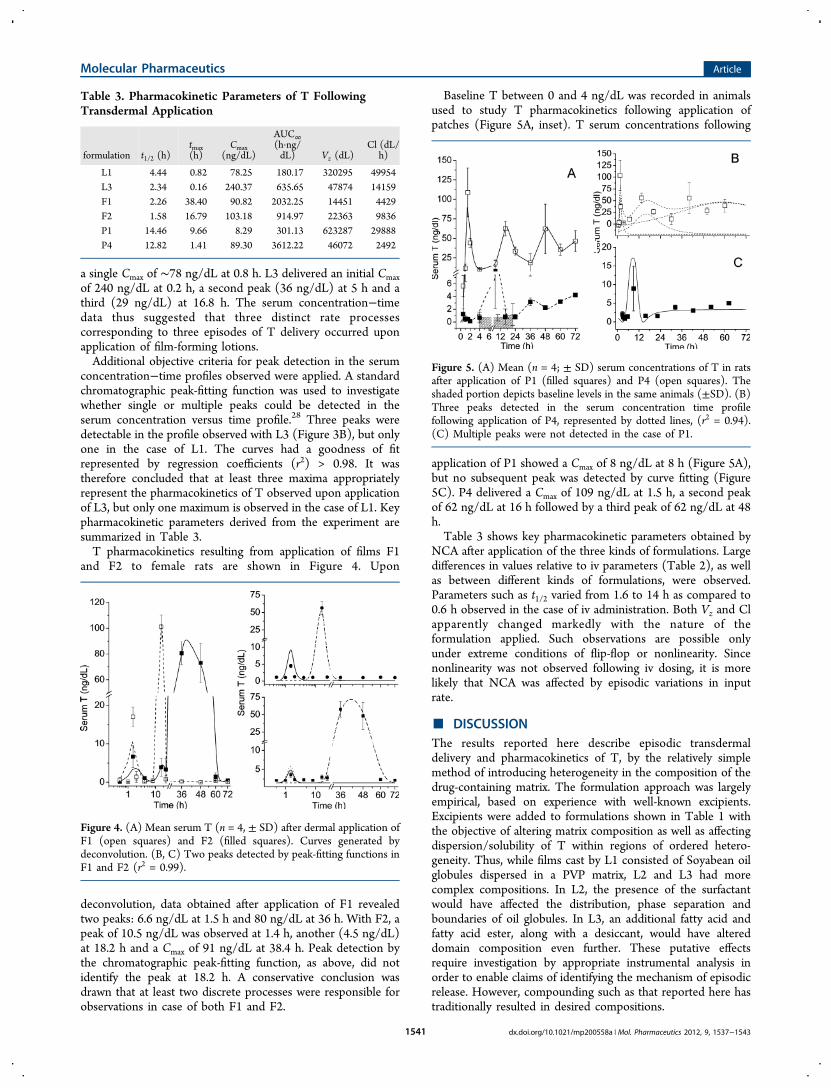
a single Cmax of ∼78 ng/dL at 0.8 h. L3 delivered an initial Cmaxof 240 ng/dL at 0.2 h, a second peak (36 ng/dL) at 5 h and athird (29 ng/dL) at 16.8 h. The serum concentration−timedata thus suggested that three distinct rate processescorresponding to three episodes of T delivery occurred uponapplication of film-forming lotions.Additional objective criteria for peak detection in the serum
concentration−time profiles observed were applied. A standardchromatographic peak-fitting function was used to investigatewhether single or multiple peaks could be detected in theserum concentration versus time profile.28 Three peaks weredetectable in the profile observed with L3 (Figure 3B), but onlyone in the case of L1. The curves had a goodness of fitrepresented by regression coefficients (r2) > 0.98. It wastherefore concluded that at least three maxima appropriatelyrepresent the pharmacokinetics of T observed upon applicationof L3, but only one maximum is observed in the case of L1. Keypharmacokinetic parameters derived from the experiment aresummarized in Table 3.T pharmacokinetics resulting from application of films F1
and F2 to female rats are shown in Figure 4. Upon
deconvolution, data obtained after application of F1 revealedtwo peaks: 6.6 ng/dL at 1.5 h and 80 ng/dL at 36 h. With F2, apeak of 10.5 ng/dL was observed at 1.4 h, another (4.5 ng/dL)at 18.2 h and a Cmax of 91 ng/dL at 38.4 h. Peak detection bythe chromatographic peak-fitting function, as above, did notidentify the peak at 18.2 h. A conservative conclusion wasdrawn that at least two discrete processes were responsible forobservations in case of both F1 and F2.
Baseline T between 0 and 4 ng/dL was recorded in animalsused to study T pharmacokinetics following application ofpatches (Figure 5A, inset). T serum concentrations following
application of P1 showed a Cmax of 8 ng/dL at 8 h (Figure 5A),but no subsequent peak was detected by curve fitting (Figure5C). P4 delivered a Cmax of 109 ng/dL at 1.5 h, a second peakof 62 ng/dL at 16 h followed by a third peak of 62 ng/dL at 48h.Table 3 shows key pharmacokinetic parameters obtained by
NCA after application of the three kinds of formulations. Largedifferences in values relative to iv parameters (Table 2), as wellas between different kinds of formulations, were observed.Parameters such as t1/2 varied from 1.6 to 14 h as compared to0.6 h observed in the case of iv administration. Both Vz and Clapparently changed markedly with the nature of theformulation applied. Such observations are possible onlyunder extreme conditions of flip-flop or nonlinearity. Sincenonlinearity was not observed following iv dosing, it is morelikely that NCA was affected by episodic variations in inputrate.
■ DISCUSSIONThe results reported here describe episodic transdermaldelivery and pharmacokinetics of T, by the relatively simplemethod of introducing heterogeneity in the composition of thedrug-containing matrix. The formulation approach was largelyempirical, based on experience with well-known excipients.Excipients were added to formulations shown in Table 1 withthe objective of altering matrix composition as well as affectingdispersion/solubility of T within regions of ordered hetero-geneity. Thus, while films cast by L1 consisted of Soyabean oilglobules dispersed in a PVP matrix, L2 and L3 had morecomplex compositions. In L2, the presence of the surfactantwould have affected the distribution, phase separation andboundaries of oil globules. In L3, an additional fatty acid andfatty acid ester, along with a desiccant, would have altereddomain composition even further. These putative effectsrequire investigation by appropriate instrumental analysis inorder to enable claims of identifying the mechanism of episodicrelease. However, compounding such as that reported here hastraditionally resulted in desired compositions.
Table 3. Pharmacokinetic Parameters of T FollowingTransdermal Application
formulation t1/2 (h)tmax(h)
Cmax(ng/dL)
AUC∞(h·ng/dL) Vz (dL)
Cl (dL/h)
L1 4.44 0.82 78.25 180.17 320295 49954L3 2.34 0.16 240.37 635.65 47874 14159F1 2.26 38.40 90.82 2032.25 14451 4429F2 1.58 16.79 103.18 914.97 22363 9836P1 14.46 9.66 8.29 301.13 623287 29888P4 12.82 1.41 89.30 3612.22 46072 2492
Figure 4. (A) Mean serum T (n = 4, ± SD) after dermal application ofF1 (open squares) and F2 (filled squares). Curves generated bydeconvolution. (B, C) Two peaks detected by peak-fitting functions inF1 and F2 (r2 = 0.99).
Figure 5. (A) Mean (n = 4; ± SD) serum concentrations of T in ratsafter application of P1 (filled squares) and P4 (open squares). Theshaded portion depicts baseline levels in the same animals (±SD). (B)Three peaks detected in the serum concentration time profilefollowing application of P4, represented by dotted lines, (r2 = 0.94).(C) Multiple peaks were not detected in the case of P1.
Molecular Pharmaceutics Article
dx.doi.org/10.1021/mp200558a | Mol. Pharmaceutics 2012, 9, 1537−15431541

Mechanistic explanations of the factors responsible forepisodic drug delivery may be derived from a considerationof the familiar processes leading to Fickian diffusion-controlleddrug release from matrices.29 Unlike polymer films ofhomogeneous composition, these transdermal systems arecomposed of discrete “domains”, as established previously.6 Forhomogeneous matrices, the diffusion coefficient of a solute (D)is considered invariant in the general equation of Fick’s secondlaw for time-dependent change in concentration (c) of thesolute across the matrix path length (x) and other geometricdimensions (y, z). The formulations reported here apparentlyrelease the incorporated drug under conditions of varyingD.17,21 A summation of fluxes from individual domains may beattempted, using Fick’s second law:
∑− ∂∂
=∂∂
+∂∂
+∂∂=
⎡⎣⎢⎢
⎤⎦⎥⎥
cx
Dc
xcy
czi
n
ii
i
i
i
i
i12 2 2
Numerical estimation of the net flux, however requiresdiscrete diffusion coefficients, viz., D1, D2, ..., Dn and the x, y andz dimensions of individual drug-releasing domains. Theexperiments reported here do not address the determinationof either domain-specific diffusion coefficients or physicaldimensions of these domains and are therefore inadequate formechanistic analysis of time-varying flux of T. As pointed outmore than 30 years ago,30 the fluxes calculated from polymericmatrices using Fick’s laws, or relations deriving from moving-boundary conditions related to matrix swelling, dissolution,erosion, etc., are approximations despite being numericallyaccurate.29
Formulations reported here are similar to those prepared aspolymer blends31−33 and gel-matrices34 that release incorpo-rated drugs with multimodal or pulsatile kinetics. Such pulsatiledrug delivery systems use combinations of release mechanisms.The experiments reported here did not address key factors suchas solvation, swelling, dissolution and erosion of the matrix byskin fluids. A detailed analysis of drug release from thepolymeric matrices and the nature of putative “domains”reported here is therefore beyond the scope of the presentreport. However, it is evident from the observations that thepatterns of drug release were distinct, episodic, and dependenton the presence of formulation additives.Serum concentration−time data following application of
transdermal systems on female rats also indicated episodicchanges in T concentrations. Compartment and noncompart-ment analysis with no time-lag and first-order elimination wasattempted with the serum concentration time data usingWinNonlin version 5.3. Pharmacokinetic modeling of the datayielded high values of Akaike’s information criterion andSchwarz’s Bayesian criterion, and r2 values were <0.5, indicatingthe fit to be poor (data not shown).Deconvolution and peak detection using a function that is
used to analyze chromatograms containing multiple peaks wereemployed as two independent objective criteria to investigatewhether the blood levels actually peaked and fell more thanonce. In most cases, both kinds of analyses were in agreement.When, as in the case of the precast film formulation F2, therewas lack of agreement, the more conservative estimate of thenumber of peaks observed was adopted. The use ofchromatographic peak fitting to analyze pharmacokinetic datawas prompted by two considerations. First, NCA, which isbased on the theory of statistical moments, considers the bodyas a system from which a “drug” is “cleared” by rate processes
identifiable by an “elimination rate constant” and a “volume ofdistribution”; chromatography is an analogous process whereinan “analyte” is “eluted” from a stationary phase through“partitioning” in “column volumes” of mobile phase. Second,the objective of peak detection and integration in aconcentration−time profile has been addressed in somedepth and extent by the field of chromatography, while aconsensus is yet to emerge on appropriate tools to studypharmacokinetics where there are multiple peaks and episodicdrug delivery. It is therefore submitted that pulsatility detectedby both NCA and chromatographic peak fitting is sufficientevidence of episodic transdermal delivery.The major limitation of the results reported here is
inapplicability for the purpose of allometric scaling to humans.Since the skin of hairy rats is very different in terms of thepermeation, the extent of the conclusions that can be drawnfrom this study is that pulsatile pharmacokinetics were observedafter transdermal application of the reported formulations. Noclear conclusions regarding either rates or extents of delivery inhumans can be drawn.These results also support the conjecture that a composite
formulation containing different “domains” to hold T in one ofseveral states of solubilization or crystallization in different sizesshould lead to discrete release rates from different domains. Inthe lotion and precast film formulations, these putative domainswere sought to be established by means of blending polymerswith different affinities toward T. The material used forpreparing patches was itself a polymer blend, furthercompounded with additives. It is also speculated that theaddition of modifiers resulted in generation of furthercomplexity in the domain structure of the delivery systemreported earlier.6,17,21 The use of antinucleating polymers suchas PVP is likely to have affected crystallization of T in theformulations, keeping T in a more amorphous, “nano-particulate” form.35,36 However, experimental evidence tosupport this conjecture is required and is not in the scope ofthe present report.In conclusion, we submit that formulations developed on the
basis reported here could be useful in a variety of indicationsrequiring androgen supplementation, and additionally possesspotential as hormonal male contraceptives for use by eugonadalmales.
■ AUTHOR INFORMATION
Corresponding Author*CSIR-Central Drug Research Institute, Pharmaceutics Divi-sion, Chhattar Manzil Palace, Lucknow, UP, 226001, India. Tel:+91-522-2612411 ext 4302. Fax: +91-522-2623405. E-mail:[email protected].
NotesThe authors declare no competing financial interest.
■ ACKNOWLEDGMENTS
The authors are grateful for financial support from CSIRNWP0035. R.M. received a Senior Research Fellowship of theCSIR. This is CDRI Communication Number 8241.
■ REFERENCES(1) Cunningham, G. R.; Toma, S. M. Clinical review: Why isandrogen replacement in males controversial? J. Clin. Endocrinol.Metab. 2011, 96 (1), 38−52.
Molecular Pharmaceutics Article
dx.doi.org/10.1021/mp200558a | Mol. Pharmaceutics 2012, 9, 1537−15431542

(2) Jones, T. H. Effects of testosterone on Type 2 diabetes andcomponents of the metabolic syndrome. J. Diabetes 2011, 2 (3), 146−56.(3) Guay, A.; Traish, A. Testosterone therapy in women withandrogen deficiency: Its time has come. Curr. Opin. Invest. Drugs 2011,11 (10), 1116−26.(4) Nieschlag, E. The struggle for male hormonal contraception. BestPract. Res., Clin. Endocrinol. Metab. 2010, 25 (2), 369−75.(5) Ellis, G. B.; Desjardins, C. Male rats secrete luteinizing hormoneand testosterone episodically. Endocrinology 1982, 110 (5), 1618−27.(6) Malik, R.; Tondwal, S.; Venkatesh, K. S.; Misra, A. Nanoscaffoldmatrices for size-controlled, pulsatile transdermal testosteronedelivery: nanosize effects on the time dimension. Nanotechnology2009, 19, 435101.(7) Bals-Pratsch, M.; Knuth, U. A.; Yoon, Y. D.; Nieschlag, E.Transdermal testosterone substitution therapy for male hypogonad-ism. Lancet 1986, 2 (8513), 943−6.(8) Bals-Pratsch, M.; Langer, K.; Place, V. A.; Nieschlag, E.Substitution therapy of hypogonadal men with transdermal testoster-one over one year. Acta Endocrinol. (Copenhagen) 1988, 118 (1), 7−13.(9) Findlay, J. C.; Place, V. A.; Snyder, P. J. Transdermal delivery oftestosterone. J. Clin. Endocrinol. Metab. 1987, 64 (2), 266−8.(10) Meikle, A. W.; Mazer, N. A.; Moellmer, J. F.; Stringham, J. D.;Tolman, K. G.; Sanders, S. W.; Odell, W. D. Enhanced transdermaldelivery of testosterone across nonscrotal skin produces physiologicalconcentrations of testosterone and its metabolites in hypogonadalmen. J. Clin. Endocrinol. Metab. 1992, 74 (3), 623−8.(11) Wang, C.; Iranmanesh, A.; Berman, N.; McDonald, V.; Steiner,B.; Ziel, F.; Faulkner, S. M.; Dudley, R. E.; Veldhuis, J. D.; Swerdloff,R. S. Comparative pharmacokinetics of three doses of percutaneousdihydrotestosterone gel in healthy elderly men--a clinical researchcenter study. J. Clin. Endocrinol. Metab. 1998, 83 (8), 2749−57.(12) Nizar, H.; Balasanthiran, A.; Morganstein, D.; Norman, B.;Shotliff, K. Transdermal testosterone gel. Don’t take blood from thearm where gel is applied. Brit. Med. J. 2010, 341, c4014.(13) Kathiresan, A. S.; Carr, B. R.; Attia, G. R. Virilization frompartner’s use of topical androgen in a reproductive-aged woman. Am. J.Obstet. Gynecol. 2011, 205 (3), e3−4.(14) Raynaud, J. P.; Legros, J. J.; Rollet, J.; Auges, M.; Bunouf, P.;Sournac, M.; Fiet, J. Efficacy and safety of a new testosterone-in-adhesive matrix patch applied every 2 days for 1 year to hypogonadalmen. J. Steroid Biochem. Mol. Biol. 2008, 109 (1−2), 168−76.(15) Raynaud, J. P.; Aumonier, C.; Gualano, V.; Betea, D.; Beckers,A. Pharmacokinetic study of a new testosterone-in-adhesive matrixpatch applied every 2 days to hypogonadal men. J. Steroid Biochem.Mol. Biol. 2008, 109 (1−2), 177−84.(16) Asscheman, H.; Gooren, L. J. Scrotal testosterone patches: agood addition to therapeutic options for hypogonadal men. Ned.Tijdschr. Geneeskd. 2000, 144 (18), 847−50.(17) Misra, A.; Pal, R.; Majumdar, S. S.; Talwar, G. P.; Singh, O.Biphasic testosterone delivery profile observed with two differenttransdermal formulations. Pharm. Res. 1997, 14 (9), 1264−8.(18) Chik, Z.; Johnston, A.; Tucker, A. T.; Chew, S. L.; Michaels, L.;Alam, C. A. Pharmacokinetics of a new testosterone transdermaldelivery system, TDS-testosterone in healthy males. Br. J. Clin.Pharmacol. 2006, 61 (3), 275−9.(19) Kuhnert, B.; Byrne, M.; Simoni, M.; Kopcke, W.; Gerss, J.;Lemmnitz, G.; Nieschlag, E. Testosterone substitution with a newtransdermal, hydroalcoholic gel applied to scrotal or non-scrotal skin: amulticentre trial. Eur. J. Endocrinol. 2005, 153 (2), 317−26.(20) Leichtnam, M. L.; Rolland, H.; Wuthrich, P.; Guy, R. H.Enhancement of transdermal testosterone delivery by supersaturation.J. Pharm. Sci. 2006, 95 (11), 2373−9.(21) Misra, A.; Raghuvanshi, R. S.; Ganga, S.; Diwan, M.; Talwar, G.P. Singh Om. Formulation of a transdermal system for biphasicdelivery of testosterone. J. Controlled Release 1996, 39 (1), 1−7.
(22) Lin, S.; Xing, Q. F.; Chien, Y. W. Transdermal testosteronedelivery: comparison between scrotal and nonscrotal delivery systems.Pharm. Dev. Technol. 1999, 4 (3), 405−14.(23) Beiner, M.; Rengarajan, G. T.; Pankaj, S.; Enke, D.; Steinhart,M. Manipulating the crystalline state of pharmaceuticals by nano-confinement. Nano Lett. 2007, 7 (5), 1381−5.(24) Bravo-Osuna, I.; Ferrero, C.; Jimenez-Castellanos, M. R. Drugrelease behaviour from methyl methacrylate-starch matrix tablets:effect of polymer moisture content. Eur. J. Pharm. Biopharm. 2008, 69(1), 285−93.(25) Addicks, W. J.; Flynn, G. L.; Weiner, N.; Chiang, C. M. Drugtransport from thin applications of topical dosage forms: developmentof methodology. Pharm. Res. 1988, 5 (6), 377−82.(26) Addicks, W. J.; Flynn, G. L.; Weiner, N. Validation of a flow-through diffusion cell for use in transdermal research. Pharm. Res.1987, 4 (4), 337−41.(27) Cichon, R.; Janicki, S. Effect of polyoxyethylene glycols (PEG)on properties of the matrix model of transdermal therapeutic system(TTS) with testosterone. Pharmazie 1991, 46 (10), 719−23.(28) Usher, K. M.; Simmons, C. R.; Dorsey, J. G. Modelingchromatographic dispersion: a comparison of popular equations. J.Chromatogr., A 2008, 1200 (2), 122−8.(29) Siepmann, J.; Siepmann, F. Modeling of diffusion controlleddrug delivery. J. Controlled Release 2011, DOI: 10.1016/j.jcon-rel.2011.10.006.(30) Lee, P. I. Diffusional release of a solute from a polymeric matrix approximate analytical solutions. J. Membr. Sci. 1980, 7 (3), 255−275.(31) Ishino, R.; Yoshino, H.; Hirakawa, Y.; Noda, K. Design andpreparation of pulsatile release tablet as a new oral drug deliverysystem. Chem. Pharm. Bull. (Tokyo) 1992, 40 (11), 3036−41.(32) Kim, H.; Fassihi, R. Application of binary polyrner system indrug release rate modulation 2. Influence of formulation variables andhydrodynamic conditions on release kinetics. J. Pharm. Sci. 1997, 86,323−328.(33) Karavas, E.; Georgarakis, E.; Bikiaris, D. Application of PVP/HPMC miscible blends with enhanced mucoadhesive properties foradjusting drug release in predictable pulsatile chronotherapeutics. Eur.J. Pharm. Biopharm. 2006, 64 (1), 115−26.(34) Shah, A. C.; Britten, N. J.; Olanoff, L. S.; Badalmenti, J. N. Gel-matrix systems exhibiting bimodal controlled release for oral drugdelivery. J. Controlled Release 1989, 9 (2), 169−175.(35) Matsumoto, T.; Zografi, G. Physical properties of solidmolecular dispersions of indomethacin with poly(vinylpyrrolidone)and poly(vinylpyrrolidone-co-vinyl-acetate) in relation to indometha-cin crystallization. Pharm. Res. 1999, 16 (11), 1722−8.(36) Miyazaki, T.; Yoshioka, S.; Aso, Y.; Kojima, S. Ability ofpolyvinylpyrrolidone and polyacrylic acid to inhibit the crystallizationof amorphous acetaminophen. J. Pharm. Sci. 2004, 93 (11), 2710−7.
Molecular Pharmaceutics Article
dx.doi.org/10.1021/mp200558a | Mol. Pharmaceutics 2012, 9, 1537−15431543


![[DL輪読会]Neural Episodic Control/Model-Free Episodic Control](https://img.dokumen.tips/doc/110x75/5a64790d7f8b9a57568b463b/dlneural-episodic-controlmodel-free-episodic-control.jpg)