Embed Size (px)
Citation preview

REPUBLIC OF MACEDONIA
University „St. Kliment Ohridski „ Bitola
Faculty of Economics - Prilep
ENTREPRENEURSHIP AS DRIVER OF COMPETITIVENESS:
The case of Macedonian fruit and vegetable processing industry
Candidate: Mentor:
Tanja Micalevska Prof. Marika Basheska
Gjorgieska
Prilep
2015

Entrepreneurship as driver of competitiveness: The case of Macedonian fruit and vegetable processing industry.
2015
To my mother Marija
Tanja Micalevska 2
Entrepreneurship as driver of competitiveness: The case of Macedonian fruit and vegetable processing industry.
2015
Contents
INTRODUCTION....................................................................................................................13
The importance of competitiveness and entrepreneurship for The Republic of Macedonia13
The scope of the research..........................................................................................14
The structure of the thesis..........................................................................................14
Expected contribution................................................................................................14
PART1: THEORETICAL FRAMEWORK AND BACKGROUND ANALYSIS.................14
Chapter 1: A study into competitiveness on different levels................................................14
1. The Competitiveness concept – literature review.....................................................14
1.1 Competitiveness on a national level......................................................................14
1.1.1 Competitiveness on a national level – background analysis for The Republic of Macedonia.........................................................................................................................14
1.2 Competitiveness on industry level.........................................................................14
1.2.1 Competitiveness on industry level – background analysis for Republic of Macedonia.........................................................................................................................14
1.2.2 Competitiveness in Macedonian Fruit and Vegetable Processing industry.......14
1.3. Competitiveness on a company level.....................................................................14
Chapter 2: Entrepreneurship and entrepreneurial determinants...........................................14
2.1 Literature review of the concept of entrepreneurship............................................14
2.2 The determinants of entrepreneurial activity in a country.....................................14
2.3 The components of entrepreneurship.....................................................................14
Chapter 3 The relationship between entrepreneurship and competitiveness........................14
PART 2. METHODOLOGY...................................................................................................14
Chapter 4 Data collection.....................................................................................................14
4.1 Population, Sample size and selection........................................................................14
4.2 Conducting of the survey and availability of data......................................................14
Tanja Micalevska 3

Entrepreneurship as driver of competitiveness: The case of Macedonian fruit and vegetable processing industry.
2015
Chapter 5 Construction of composite indexes......................................................................14
5.1Composite indexes and their characteristics................................................................14
5.2 Steps for creating composite indexes..........................................................................14
5.3 Limitations of composite indexes...............................................................................14
5.4 Construction of the composite index for competitiveness in the Fruit and vegetable processing industry...........................................................................................................14
5.5Construction of the composite index for entrepreneurship in the Fruit and vegetable processing industry...........................................................................................................14
Chapter 6: The Regression model........................................................................................14
Chapter 7 Results and discussion.........................................................................................14
7.1The overall competitiveness of fruit and vegetable industry in The Republic of Macedonia.........................................................................................................................14
7.2The entrepreneurial activity in fruit and vegetable industry in The Republic of Macedonia.........................................................................................................................14
7.3 The relation between entrepreneurial activity and competitiveness of companies in Fruit and vegetable industry in The Republic of Macedonia............................................14
Conclusions and recommendations..........................................................................................14
Contributions from the research...........................................................................................14
Limitations of the research...................................................................................................14
Recommendations for further research................................................................................14
BIBLIOGRAPHY....................................................................................................................14
Apendixes.................................................................................................................................14
Appendix 1........................................................................................................................14
Appendix 2........................................................................................................................14
Appendix 3........................................................................................................................14
Appendix 4........................................................................................................................14
Tanja Micalevska 4
Entrepreneurship as driver of competitiveness: The case of Macedonian fruit and vegetable processing industry.
2015
List of Tables
Table 1. Research questions, main hypothesis and sub-hypothesis.........................................14Table 2. Literature review of the concept of competitiveness................................................14Table 3: Global Competitiveness Report pillars......................................................................14Table 4: World Competitiveness Yearbook pillars..................................................................14Table 5: Western Balkans GCI 2012-2013 and 2013-2014.....................................................14Table 6: Macedonian key sectors according to their contribution in value added, employment and exports...............................................................................................................................14Table 7: Porter diamond applied on Macedonian Wearing apparel sector..............................14Table 8: Porter diamond applied on Macedonian Production of iron and steel.......................14Table 9: Porter diamond applied on Macedonian Tobacco products.......................................14Table 10: Porter diamond applied on Macedonian Processed fish, meat, fruit, vegetables.....14Table 11: Market structures.....................................................................................................14Table 12: Measures for productivity, profitability, growth and export competitiveness.........14Table 13: SWOT and PEST Analysis......................................................................................14Table 14: Definitions on entrepreneurship...............................................................................14Table 15: Clustering and networking approaches characteristics............................................14Table 16 The relation entrepreneurship- competitiveness – related works.............................14Table 17: Census data vs Sample- Advantages and disadvantages.........................................14Table 18 : Labels for coding the answers.................................................................................14Table 19: Normalization methods............................................................................................14Table 20: Multivariate analysis (Cronbach’s alpha) competitiveness sub indicators..............14Table 21: Inter-Item Correlation Matrix- competitiveness sub indicators...............................14Table 22: Item-Total Statistics – competitiveness sub indicators............................................14Table 23: Multivariate analysis (Cronbach’s alpha) entrepreneurship sub indicators.............14Table 24: Inter - Correlation Matrix –entrepreneurial elements..............................................14Table 25: Item-Total Statistics................................................................................................14Table 26: Competitiveness index descriptive analysis.............................................................14Table 27: Descriptive analysis of Entrepreneurship index for companies in Fruit and vegetable processing industry..................................................................................................14Table 28: Correlation between entrepreneurship and comptitiveness.....................................14Table 29 Regression model entrepreneurship and competitiveness........................................14
Tanja Micalevska 5
Entrepreneurship as driver of competitiveness: The case of Macedonian fruit and vegetable processing industry.
2015
List of Graphs
Graph 1: Global Competitiveness Index for the Republic of Macedonia 2006-2013..............14Graph 2: Western Balkans GCI 2012-2013 and 2013-2014....................................................14Graph 3: The Republic of Macedonia and EU countries GCI 2012-2013..............................14Graph 4: The Republic of Macedonia and EU countries GCI 2013-2014..............................14Graph 5: The Republic of Macedonia GCI pillars for the period 2012-2013 and the period 2013-2014................................................................................................................................14Graph 6: CIPI for the Republic of Macedonia 1990-2012.......................................................14Graph 7: CIPI for Western Balkans.........................................................................................14Graph 8: MVA pc and MX pc for Western Balkans................................................................14Graph 9: MVAsh and MHVAsh for Western Balkans............................................................14Graph 10: MXsh and MHXsh for Western Balkans................................................................14Graph 11: Im WMVA and Im WMT for Western Balkans.....................................................14Graph 12: CIPI for The Republic of Macedonia and EU countries.........................................14Graph 13: Value added in Macedonian manufacturing...........................................................14Graph 14: Annual real growth rate of manufacturing sectors..................................................14Graph 15: Structure of manufacturing in The Republic of Macedonia 2005 and 2010...........14Graph 16: Branches participation in value added....................................................................14Graph 17: Main branches participation in value added...........................................................14Graph 18: Branches number of employs, as a share in total manufacturing employment.......14Graph 19: Branches participation in exports............................................................................14Graph 20: Macedonian key sectors according to their contribution in value added, employment and exports..........................................................................................................14Graph 21: Western Balkan countries ranks – Ease of Doing Business....................................14Graph 22: Western Balkan countries ranks – Starting a business............................................14Graph 23: Western Balkan countries ranks: Dealing with construction permits.....................14Graph 24: Western Balkan countries ranks- Getting electricity..............................................14Graph 25: Western Balkan countries ranks- Registering property..........................................14Graph 26: Western Balkan countries ranks- Getting credit.....................................................14Graph 27: Western Balkan countries ranks- Protecting investors...........................................14Graph 28: Western Balkan countries ranks- Paying taxes.......................................................14Graph 29: Western Balkan countries ranks- Trading across borders.......................................14Graph 30: Western Balkan countries ranks- Enforcing contacts.............................................14Graph 31: Western Balkan countries ranks- Resolving insolvency.........................................14Graph 32: The Republic of Macedonia and EU – Ease of Doing Business.............................14Graph 33: Radar chart – Doing business..................................................................................14Graph 34: Missing values chart patterns..................................................................................14Graph 35: Regression model entrepreneurship competitiveness.............................................14Graph 36: Competitiveness index Fruit and vegetable processing industry............................14
Tanja Micalevska 6

Entrepreneurship as driver of competitiveness: The case of Macedonian fruit and vegetable processing industry.
2015
Graph 37: Productivity of companies in Fruit and vegetable industry....................................14Graph 38: Profitability of companies in Fruit and vegetable processing industry...................14Graph 39: Growth of companies in Fruit and vegetable processing industry..........................14Graph 40: External competitiveness of companies in Fruit and vegetable processing industry..................................................................................................................................................14Graph 41: Entrepreneurship among companies in Fruit and vegetable processing industry...14Graph 42:Notice opportunities.................................................................................................14Graph 43: Creative ideas..........................................................................................................14Graph 44:Previous knowledge.................................................................................................14Graph 45: Contacts...................................................................................................................14Graph 46: Opportunity recognition among managers in Fruit and vegetable processing industry’ companies.................................................................................................................14Graph 47:Use of resources.......................................................................................................14Graph 48:Human resources......................................................................................................14Graph 49: Access to capital......................................................................................................14Graph 50: Informed..................................................................................................................14Graph 51: The resource management in the companies in Fruit and vegetable processing industry.....................................................................................................................................14Graph 52: Traditional job vs entrepreneurship........................................................................14Graph 53: Minimize risks.........................................................................................................14Graph 54: Experiment..............................................................................................................14Graph 55: Risk prospendity.....................................................................................................14Graph 56: Risk taking propensity among the managers in the Fruit and vegetable processing industry.....................................................................................................................................14Graph 57: New products, markets............................................................................................14Graph 58: Innovation support..................................................................................................14Graph 59: Introduce innovation...............................................................................................14Graph 60: Innovation budget...................................................................................................14Graph 61 Innovation among the managers in the Fruit and vegetable processing industry....14Graph 62: Satisfying customers...............................................................................................14Graph 63: Market research.......................................................................................................14Graph 64: communication with customers..............................................................................14Graph 65: Loyal customers......................................................................................................14Graph 66 Market approach among the managers in the Fruit and vegetable processing industry.....................................................................................................................................14
Tanja Micalevska 7

Entrepreneurship as driver of competitiveness: The case of Macedonian fruit and vegetable processing industry.
2015
List of Figures
Figure 1: Porter national diamond.......................................................................................................14Figure 2: Three generic competitive strategies...................................................................................14Figure 3: Porter Five Forces Model of competititon............................................................................14Figure 4: Conceptual framework of entrepreneurship........................................................................14Figure 5: Business management education versus entrepreneurial education......................................14Figure 6: Entrepreneurial learning strategy.........................................................................................14Figure 7: Clustering and networking....................................................................................................14Figure 8: Clusters in The Republic of Macedonia.................................................................................14Figure 9: Factors determining opportunities recognition....................................................................14Figure 10: The relationship between the entrepreneurship and competitiveness..............................14Figure 11: The relationship between the entrepreneurship and competitiveness on a national level 14Figure 12 : The spiral effect entrepreneurship- competitiveness........................................................14Figure 13: Value chain -The Fruit and Vegetable Processing industry in The Republic of Macedonia.............................................................................................................................................................14Figure 14: The relationship entrepreneurship-competitiveness on a company level..........................14Figure 15: Research methodology – step by step................................................................................14Figure 16: Likert scale..........................................................................................................................14Figure 17: Missing values.....................................................................................................................14Figure 18: Steps in creating composite indicators...............................................................................14Figure 19: Regression model...............................................................................................................14Figure 20: Regression model Entrepreneurship and competitiveness.................................................14
Tanja Micalevska 8

Entrepreneurship as driver of competitiveness: The case of Macedonian fruit and vegetable processing industry.
2015
ACKNOWLEDGEMENT
Today, I am happy to have the opportunity to share this Phd thesis with you, but as for
everything in life, this would not be possible to be done without the help and support of the
wonderfull people mentioned hereinafter.
First of all, I would like to express my deepest gratitude to my mentor Prof. Marika
Baseska Gjorgievska. The Faculty of economics in Prilep is fortunate to have proffesors like
her, who bring projects and experiences from foreign more developed coutries. Prof. Marika
is most deserving for enabling me and my coleagues with the chance to attend the Doctoral
programme DOCSMES and have the posibility to learn from some of the best domestic and
foreign profesors included in the project. From the very begining of the project, she was
always ready to help us for any questiones we had conserning the applying process, exams,
books and papers. At the classes she made pleasant atmosphere and explained us the essence
of entrepreneurship and reserch methods through interactive teaching.
I was one of the rare form our group who had the luck to have her as a mentor. During
the mentoring process she was always available for me, whenever I needed help, consultation
and inspiration, in and out of workin hours. She led me to conceptualizing the theme and the
thesis of research, the preparation of the thesis aplication, and further through the literature
review process, the design of the questionary and the data collection process. She offerd me
access to the needed books and papers, supervision and guidelines, but in the same time
freedom to express myself in the disertation. Apart from being proffesional and devoted,
what I most apriciate is the human beeing she is, the motivation and inspiration she gave to
me, her positive aproach and readiness to help. Prof. Marika - Thank you very much for your
time and patience.
Second, I would like to thank Prof Dimitar Nikolovski for showing me the importance
of quantitative methods and econometrics in economic science. After, attending his
econometric classes, I promised to myself that I would try any research of mine, to be
enchased by empirical research. Thus, when I decided to develop the idea for the doctoral
dissertation, after consulting my mentor, I went and discussed hour and hours with him for
the econometric feasibility of the study. He gave me clear directions from the begininig till
Tanja Micalevska 9

Entrepreneurship as driver of competitiveness: The case of Macedonian fruit and vegetable processing industry.
2015
the end of the research. Professor Dimitar - I am very proud for the paper we published
together, and I wouuld be honored if I publish again with you in future.
Considering that my dissertation concerns the concept of competitiveness to large
extent, I had the luck to have Prof. Vasilika Kume in my commitee. She allowed me access to
papers and gave me usefull directions in the design of the questionary
Also gratitude to ____________, and ______________ for their sugestiones which
lead the dissertation to have this final form.
Among the proffesors who most influenced over my desicion to research and awaken
the reserch potential in me, I must mention Prof. Dimko Kokaroski, who I respect a lot as a
scientist and primarly as a person. Also, gratitude to Professor Olivera Kostoska for her
directions, advices, and for opening my horizons considering the use of internationally
accepted classifications and models in the research.
For all the administrative procedures, I am thankfull to Maria Midovska.
I would also like to mention the people who were my greatest support during the
period of my Phd.
My mother, who i dedicate my thesis, was my biggest fan, mu biggest support and
love. She belived in me as noone else ever did, encouraged me to apply for this programe,
and when I was accepted as a Phd student, we were hugging and jumping out of happiness.
The same happened for every passed exam and for every published paper. She always
teached me to have goals, to work toward achiving them, and whenever I was scared she used
to say to me “God helps to those who strive to succed. I know you can make it”. Just the fact
that she belived in me, was enough to overcome every obstacle and to walk courageously on
the path that everyone who hopes to becme Phd must pass. After her death, everything lost
sense, my interest for science and for life just dropped. In that hard moments my second
parents, my uncle Dragan and his wife Rusanka stand by me and with their unconditional
love help me to start again where I have stopped. Wheneever I was low, they were reminding
me that they are here for me. Also, my aunts Ljube and Verce were supporting and kind.
However, most deserving for my revival were my cousin Ana and her husband Toni. They
gave me the best present, my niece Atanasia. Atanasia you light up my life.
In the same period, when I found out that I will have a niece, I had the luck to be hired
in Stopanska banka a.d Bitola. Immence gratitude to the people who sellected me for the job
and offered me the opportunity to financially support myself, have better living conditions
Tanja Micalevska 10

Entrepreneurship as driver of competitiveness: The case of Macedonian fruit and vegetable processing industry.
2015
and be able to cover the costs for the research. Anyway, greates gain from the work was the
possibility to be around the most succesfull people in the bank, to draw from their experience
and to learn not only banking and management, but also attitude, bravery and humanity.
I would also like to give my special thanks to my friends who were here for me:
Kristina as you once said we were somehow meant to be friends, so different but so related to
eachother. Bale – you, despite knowing me, still liked my company and helped me recover
my self-confidence so many times. . Ljube – you never got tired of calling me to ask how I
am even when I was a tiresome. Thank you for your loyality. Ilche you show me that no
matter how far in miles a person may be, when it comes to real friendship, that person may be
closer to you than anybody near you. You were daily updated for every aspect of my life,
could undestand me, even when I could not understand myself, always showed me the big
picture, and encouraged me to be a figheter and follow my dreams.
Well, somehow I did manage follow my dreams, and as my mother said God did
helped me to find the strenhgt I needed. Even through, there were moments when I did forgot
what I want, I never forgot whose daughter I am. And as Mare’s daugther I had not just the
will, but the mission to justify her thrust in me. Now, holding my Phd thesis in the hands, I
feel relived because I know that whenever and wherever she is, she is very proud.
Tanja Micalevska 11

Entrepreneurship as driver of competitiveness: The case of Macedonian fruit and vegetable processing industry.
2015
INTRODUCTION
THE IMPORTANCE OF COMPETITIVENESS AND ENTREPRENEURSHIP FOR THE
REPUBLIC OF MACEDONIA
The importance of competitiveness and entrepreneurship for the prosperity of
countries, industries and companies is widely acknowledged. Today, almost all economies in
the world are trying to improve their competitiveness on domestic and international markets.
They introduce framework programs aimed to improve the growth, employment and business
climate on a sustainable base. Those programs include innovations and entrepreneurship as
main drivers of competitiveness.
Republic of Macedonia also strives to become more competitive and entrepreneurial
economy, so this strategic goal, has contributed Macedonian governments to make huge
reforms in the political and economical scene in the country. Political reforms included
democratization of the country, and economic ones creating a more market oriented, free and
competitive economy. (Nikolovski & Micalevska, 2012)
In order to be more competitive and success on global markets, Macedonian firms
which are mainly small and medium, use cheap labor force and mainly compete with low
prices, should develop other competitive advantages as well. Competitive advantages may
take many forms such as higher quality, distribution, good service (Smith, 2006). They
depend on the industry in which enterprises operate, and the position they will manage to take
in that industry, and are commonly developed in firms which are entrepreneurially managed.
Entrepreneurial firms are those where the managers have vision and skills to
recognize opportunities, see chances where others do not, take decisions in uncertain
circumstances, and are oriented to the market perceived and still unperceived needs.
Entrepreneurial companies always come out with new creative ideas, combine and recombine
resources and implement the ideas in a way that satisfies buyer’s needs. To manage this, they
Tanja Micalevska 12

Entrepreneurship as driver of competitiveness: The case of Macedonian fruit and vegetable processing industry.
2015
continually look for new better ways for functioning, come out with new or improved
products, new processes, supplementary services and new markets.
According to the Global Entrepreneurship Monitor, there exist a number of
entrepreneurial firms and entrepreneurs in The Republic of Macedonia, and the
entrepreneurial activity is high. However, half of them are motivated by necessity instead of
opportunity. In future the number of entrepreneurs motivated by opportunity should increase.
The entrepreneurship can be increased in any country by creating positive business
climate, developing enterprise culture and supporting institutional framework. The
entrepreneurial culture is created by improving the educational system and offering
entrepreneurial education. In the last few years, the entrepreneurship is more and more
present in the education and the ties between private sector and universities have been
strengthened. The institutional system has been improved with reforms in the public
administration and establishment of bodies for supporting entrepreneurship. The reforms are
still ongoing and up to the present moment have shown some positive results such as stronger
private sector, more innovative ideas, increased value added, employment and exports.
For the development of the private sector growth and employment in a given country
a crucial importance has the existence of strong and diversified industrial base. That is
acknowledged in the Macedonian Industrial Policy 2009-2020 which points out the important
aspects for developing Macedonian industries, without favoring any industry branch more
than others.
The industry, according to the Statistical Office in The Republic of Macedonia,
incorporates three main branches: (i) mining and quarrying; (ii) manufacturing and (iii)
electricity, gas, steam and air conditioning (Office). Manufacturing has the biggest number of
registered businesses counting 8251 in 2012. Most of them are small and medium businesses
and they pull creation of new ventures which already established business can collaborate
with by horizontal and vertical linking.
Manufacturing branches which create most of the value added, exports and
employment in The Republic of Macedonia are Food Processing industry and Textile and
Clothing. Therefore, increasing the competitiveness and entrepreneurship in those industries
will be crucial element for improving the overall competitiveness of the economy, which
would create conditions for increasing the employment and the standard of living in The
Republic of Macedonia.
Tanja Micalevska 13

Entrepreneurship as driver of competitiveness: The case of Macedonian fruit and vegetable processing industry.
2015
The scope of the research
In recent years The Republic of Macedonia has made many reforms to strengthen the
private sector, increase the entrepreneurial spirit and the competitiveness of its companies, in
order to improve the current situation, accelerate the economic development of the country,
and facilitate the entrance in the EU family. Most of the reforms have given results, while
some are still ongoing. Their impact is researched and stated in country and international
reports such as Global Competitiveness Report, Doing Business Report etc. Those reports
illustrate the advancements on a country level and are mainly oriented on the effects of
macroeconomic measures undertaken in the country.
In this research, I acknowledge the importance of the Macroeconomic situation and
the business environment for the development of the private sector, but also I intend to stress
the importance of the bottom-up approach. The so called “bottom-up approach” considers the
microeconomic situation, the impact of business owners and their entrepreneurial capacity on
the development of businesses and on the entire competitiveness of the economy.
Business owners who have entrepreneurial capacity are individuals who recognize
opportunities, combine resources in a way to create something new and valuable for the
market and are ready to take risks. Therefore, I address the question if entrepreneurs can
affect the competitiveness on their companies and consequently on that the competitiveness
of the entire industries.
In relation to the main research question, many other questions arise:
What is the competitiveness?
What is entrepreneurship and entrepreneurs?
Is there a relation among entrepreneurship and competitiveness?
Tanja Micalevska 14

Entrepreneurship as driver of competitiveness: The case of Macedonian fruit and vegetable processing industry.
2015
In order to respond to above questions, I attempt to investigate the relationship among
entrepreneurship and competitiveness in the Macedonian companies that operate in the fruit
and vegetable processing industry. The reason I chose this industry as a subject of research is
first, because it is the fastest growing industry in the last couple of years, and second it is
closely linked with agriculture products, which represents a competitive advantage because
The Republic of Macedonia is rich with this kind of resources.
Therefore, Fruit and vegetable processing industry may exploit the unused potentials
of agro business and in the same time to improve the rural development. The main outcomes
of the Fruit and vegetable processing industry are conserved fruit and vegetable, canned fruit,
frozen vegetable. The main markets where the products are sold are in foreign countries, so I
assume that they are competitive.
Therefore, my first hypothesis is:
H1: Companies in Fruit and vegetable processing industry are competitive
Furthermore I assume that the key factor for their competitiveness is entrepreneurship
described as recognizing opportunities, taking risks, combining resources to create value,
introducing innovation and promoting relationship marketing approach. Hence, the second
hypothesis is:
H2: Companies in the Fruit and vegetable processing industry are
entrepreneurially managed.
And my last hypothesis is:
H3: The entrepreneurial approach in managing companies in the Fruit and
vegetable processing industry drives their competitiveness.
Tanja Micalevska 15

Entrepreneurship as driver of competitiveness: The case of Macedonian fruit and vegetable processing industry.
2015
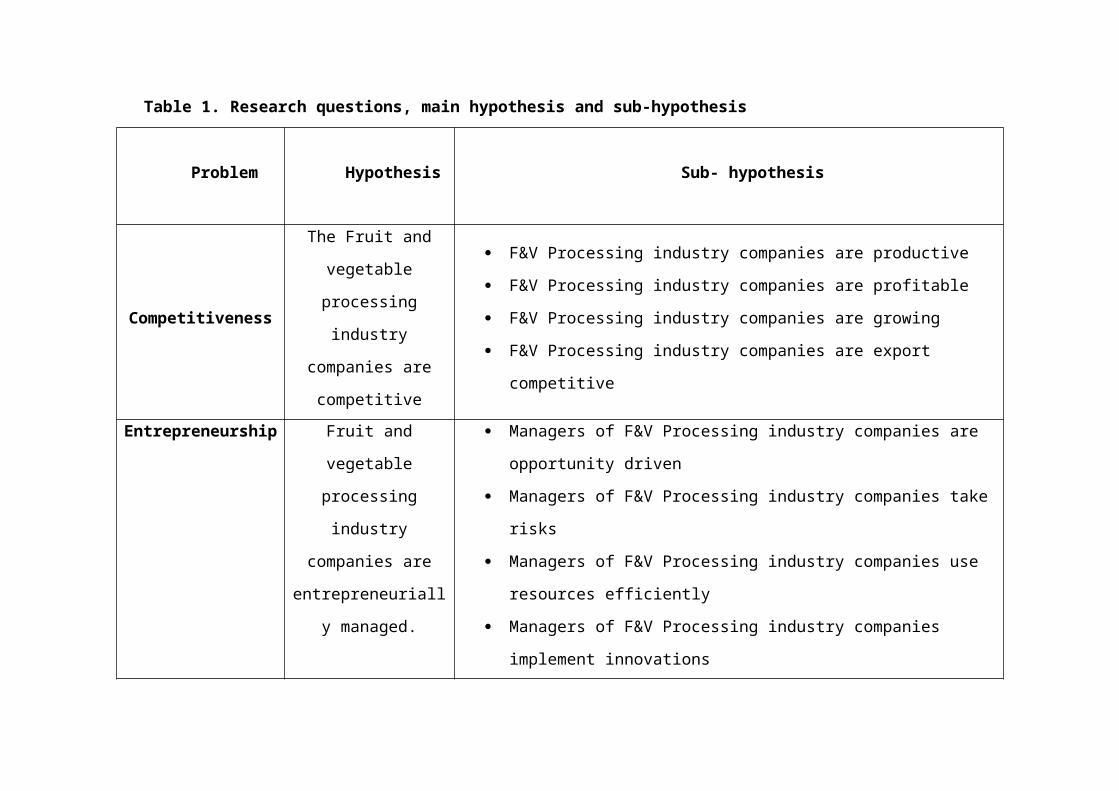
The research questions, main hypothesis and sub-hypothesis are given in the table
below.
Tanja Micalevska 16

Table 1. Research questions, main hypothesis and sub-hypothesis
Problem Hypothesis Sub- hypothesis
Competitiveness
The Fruit and vegetable
processing industry
companies are
competitive
F&V Processing industry companies are productive
F&V Processing industry companies are profitable
F&V Processing industry companies are growing
F&V Processing industry companies are export competitive
Entrepreneurship
Fruit and vegetable
processing industry
companies are
entrepreneurially
managed.
Managers of F&V Processing industry companies are opportunity driven
Managers of F&V Processing industry companies take risks
Managers of F&V Processing industry companies use resources efficiently
Managers of F&V Processing industry companies implement innovations
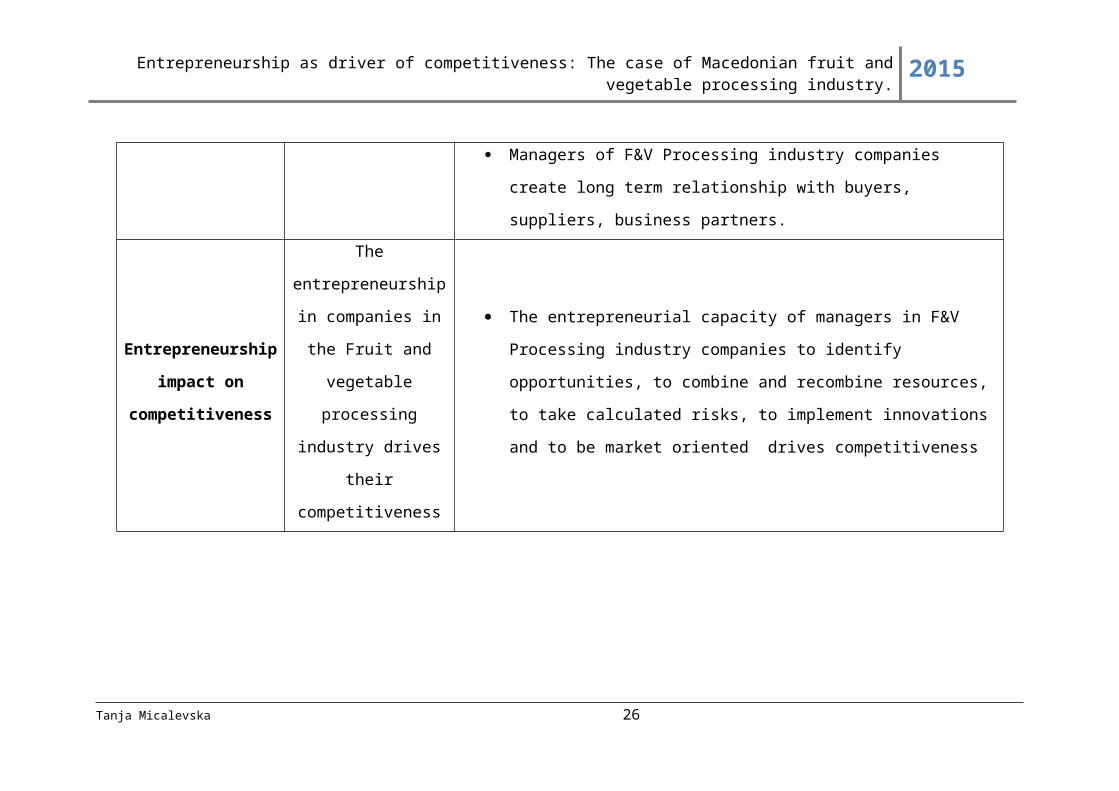
Managers of F&V Processing industry companies create long term
relationship with buyers, suppliers, business partners.
Entrepreneurship
impact on
competitiveness
The entrepreneurship in
companies in the Fruit
and vegetable
processing industry
drives their
competitiveness
The entrepreneurial capacity of managers in F&V Processing industry
companies to identify opportunities, to combine and recombine resources,
to take calculated risks, to implement innovations and to be market oriented
drives competitiveness

The structure of the thesis
The thesis is organized in three parts comprised of seven chapters, introduction and
conclusions.
In the introduction the problem of research is stated and its importance for The
Republic of Macedonia and elsewhere is briefly elaborated. Then, the research context is
developed by posing the main goal of the research starting with broader research questions,
and continuing with their concretization and by drawing the research hypothesis and sub-
hypothesis. This part includes the structure of the thesis and the expected contribution.
The first part represents a review of the theory and background analysis related to
the concepts of competitiveness, entrepreneurship and their relationship.
In the first chapter, it is given an overview of the concept of competitiveness, and the
competitiveness in The Republic of Macedonia is elaborated on three different levels. The
national competitiveness of The Republic of Macedonia is compared with other Western
Balkans and with EU countries. Then, follows deeper investigation into Macedonian
competitiveness through its industries competitiveness, examined by using three quantitative
criteria: value added, exports and employment. On the other side, qualitative analysis of the
main industries is made by the Porters diamond method. Next, competitiveness is considered
at a company level through indicators such as productivity, profitability, growth and export
competitiveness.
The second chapter, in this part, gives an exploration of the entrepreneurship concept
through its main definitions, state of the art, and then follows a discussion about the
entrepreneurship in The Republic of Macedonia. Furthermore, the main factors that influence
over its development, such as, business climate, education and networking are recounted.
Then, follows explanation of the main elements of entrepreneurship among which are
identification of an opportunity, taking risks, combining resources, creating innovations and
developing relationship marketing approach.
The third chapter is focused on the relationship between entrepreneurship and
competitiveness, and how each of the entrepreneurial elements influences the
competitiveness of companies, and consequently the competitiveness of industries and
countries.

Entrepreneurship as driver of competitiveness: The case of Macedonian fruit and vegetable processing industry.
2015
In the second part is described how the research was conducted and what
methodology was used in the research. This part includes three chapters: chapter four, chapter
five and chapter six.
In the fourth chapter, there is a description of the population, the sample design and
size, list of the companies in the fruit and vegetable processing industry. Then, follow the
questioner design, the methods used for obtaining data from companies and the process of
encoding and verification of the data, as well as imputing missing values in order to get a
complete dataset.
In the fifth chapter is given an overview of the composite indexes, their
characteristics, limitations and the way they can be created in this context. Also, it is given
the model for creating the index for competitiveness by using indicators of competitiveness
as its components. Furthermore, the model for construction of the index for entrepreneurship
is presented, with entrepreneurial elements as its components. Finally, in chapter six, I
conduct test of econometric models that best suit for investigating the relationship among
variables: competitiveness as a dependent variable and entrepreneurship elements as
independent variables. The analysis is performed by using the software package SPSS.
The third part includes the main findings and detailed description and elaboration of
the results obtained from the research. This part includes three chapters each of them
discussing the implications of findings for every one of the main hypotheses set at the
beginning of the research.
The conclusions are given at the end of the theses, accompanied with practical
recommendations relevant for managers in fruit and vegetable processing industry, but also
for other industries in the country and abroad. In this section are elaborated the contributions
of the study for companies in fruit and vegetable processing industry and other industries as
well and for enriching the empirical theory for academics. Apart from contributions,
limitations encountered in the research are also pointed out, which gives the research higher
validity and reliability.
At last, recommendations for further researchers interested in the topic, are given just
to awaken their creative potential and encourage their interest to work on fresh ideas that
arise as questions from the findings of this research.
Tanja Micalevska 19

Entrepreneurship as driver of competitiveness: The case of Macedonian fruit and vegetable processing industry.
2015
Expected contribution
The expected contributions from the study are twofold. On one hand the research is
valuable for companies in fruit and vegetable processing industry and other industries as well,
because of its applicability in terms of improving managerial practices, becoming more
entrepreneurial and more competitive. On the other hand, the research should quantify the
entrepreneurship and competitiveness as multidimensional concepts and quantify their
relationship.
Tanja Micalevska 20
Entrepreneurship as driver of competitiveness: The case of Macedonian fruit and vegetable processing industry.
2015
PART1: THEORETICAL FRAMEWORK AND BACKGROUND ANALYSIS
In the last couple of years, researchers, politicians and practitioners have all given
their attention to the concepts of competitiveness and entrepreneurship.
Researchers recommend improving competitiveness and entrepreneurship among
countries, regions, industries, businesses as a way to revive the economy, encourage growth,
increase jobs and advance living standard of people.
Politicians are interested to advance competitiveness and support entrepreneurship in
their countries, in order to faster the recovering from the crisis, increase employment and gain
citizens on their side. Therefore, they continually introduce measures to create environment
that is suitable for improving competitiveness and supporting national businesses and entire
industries.
Business people are also interested to improve their enterprises competitiveness, make
them more agile, gain market shares, earn higher profits and enlarge their wealth.
However, despite the great interest of all these diverse groups, there are still no simple
answers or concrete definitions for the concepts of competitiveness and entrepreneurship.
In order to make those concepts more understandable, the goal of this part of the study
to review and examine in depth some of the main definitions, contributors, and determinants
of competitiveness and entrepreneurship, as well as to and highlight some of their most
commonly used measures.
Then, the study aims to elaborate the mutual relationship competitiveness –
entrepreneurship and how they both affect one to eachnother. Moreover, the theoretical
elaborations are enriched with background analysis of the concepts of and their status in The
Republic of Macedonia during the examined period, and the perspectives for their
improvement in future.
Tanja Micalevska 21

Entrepreneurship as driver of competitiveness: The case of Macedonian fruit and vegetable processing industry.
2015
CHAPTER 1: A STUDY INTO COMPETITIVENESS ON DIFFERENT LEVELS
In this chapter the concept of competitiveness is elaborated, the main countributions
in the research area are stated, and the three different levels at which competitiveness can be
considered are reviwed. The levels are national, industrial and businesses’ level.
The three are related and interdependent. As in the saying “Little drops make big
ocean” – when explaining the competitiveness we take into consideration the ocean –
national competitiveness, but also the rivers flowing into it – the competitiveness of the
country’ industries and the drops raining into the rivers, that are the companies operating in
the industries, sectors, branches. Therefore, national economy cannot be competitive if its
industries are not competitive, and an industry cannot be competitive if its sectors and firms
are not competitive.
The chapter has a goal to investigate the competitiveness and then to focus on the
competitiveness of The Republic of Macedonia and to answer the following questions:
Where The Republic of Macedonia stands with its national competitiveness
compared with EU and Western Balkan countries?
Where the country stands with its industry competitiveness, and which branches
have the biggest potential in terms of competitiveness?
Which are the factors affecting companies competitiveness and which are the
indicators for its measuring?
Therefore, the chapter is structured in the following order.
First, there is a literature review of the concept of competitiveness, the levels of
investigation and the main contributions in the development of the scientific aproach of
competitiveness. Then, there is an outline of the historical development of the main
Tanja Micalevska 22

Entrepreneurship as driver of competitiveness: The case of Macedonian fruit and vegetable processing industry.
2015
theoretical and empirical works about competitiveness on national level. The commonly used
measures are applied to explore the Macedonian national competitiveness through the years,
and to make comparative analysis of Macedonian national competitiveness with the
competitiveness of European Union and Western Balkan countries.
After, it follows review of the factors determining the industrial competitiveness and
the indicators for measuring industrial competitiveness, as well as backgroung analysis
concerning the place of Macedonian industry compared with EU and Western Balkans, and a
consideration of Macedonian main branches, explored by quantitative and qualitative
methods, with special accent on the Fruti and vegetable processing industry as main subject
of interest in the thesis.
At last, there is an overview of the competitiveness on a company level, the main
forces determining firm’s competitiveness and the elements/ indicators used to measure it.
Tanja Micalevska 23
Entrepreneurship as driver of competitiveness: The case of Macedonian fruit and vegetable processing industry.
2015
1. The Competitiveness concept – literature review
The term “competitiveness’’ has been used in many different variants to describe the
success, quality, capacity of people, goods, companies, industries, regions and whole
national economies in comparation with other people, goods, companies, industries,
regions and economies. However, despite its common usage and various interpretations,
the meaning of the concept of competitivenss and its essence is still not clear enough, nor
in everyday life, nor in science.
The list of the scientific explanations of the concept, synonims and atributes used for
its description in different periods and stages of the development of the economic thought
is long. Therefore, only the most influentual contributions are selected among all the
authors, works who have their role for the development of the knowledge related to
competitiveness, its origins, the theoretical and methodological aproaches used for
explaining it.
Having into consideration that the knowledge is dinamic, continually evolves and
depends from the context in which the research is done, competitiveness is captured
through distinction of the perspectives first by the economic theories, then by the scope
and the level of analysis in the formulation of competitiveness, and by the basis to explain
it. The most theories worth to mention are:
The clasical economy theory for identifying four factors of production, (Adam
Smith, 1976) and highlighting that countries should compete because their
diferences in productivity for producing certan goods (David Ricardo,1817).
The neoclasical view for offering the perfect competition model, where
competitiveness is not suitable on the long run.
The Keynesian theory which claims that production factors labor and capital
are complementary and the state can intervene in economy.
Schumpeterian theory for pointing out the factor entrepreneur as main for
competitiveness and growth.
The endogenous theories for highlightining the importance of knowledge.
Tanja Micalevska 24
Entrepreneurship as driver of competitiveness: The case of Macedonian fruit and vegetable processing industry.
2015
Michael Porter’s theory for summarizing the previous theories and explaining
the importance of strategy for obtaining competitive advantage.
Tanja Micalevska 25
Entrepreneurship as driver of competitiveness: The case of Macedonian fruit and vegetable processing industry. 2015
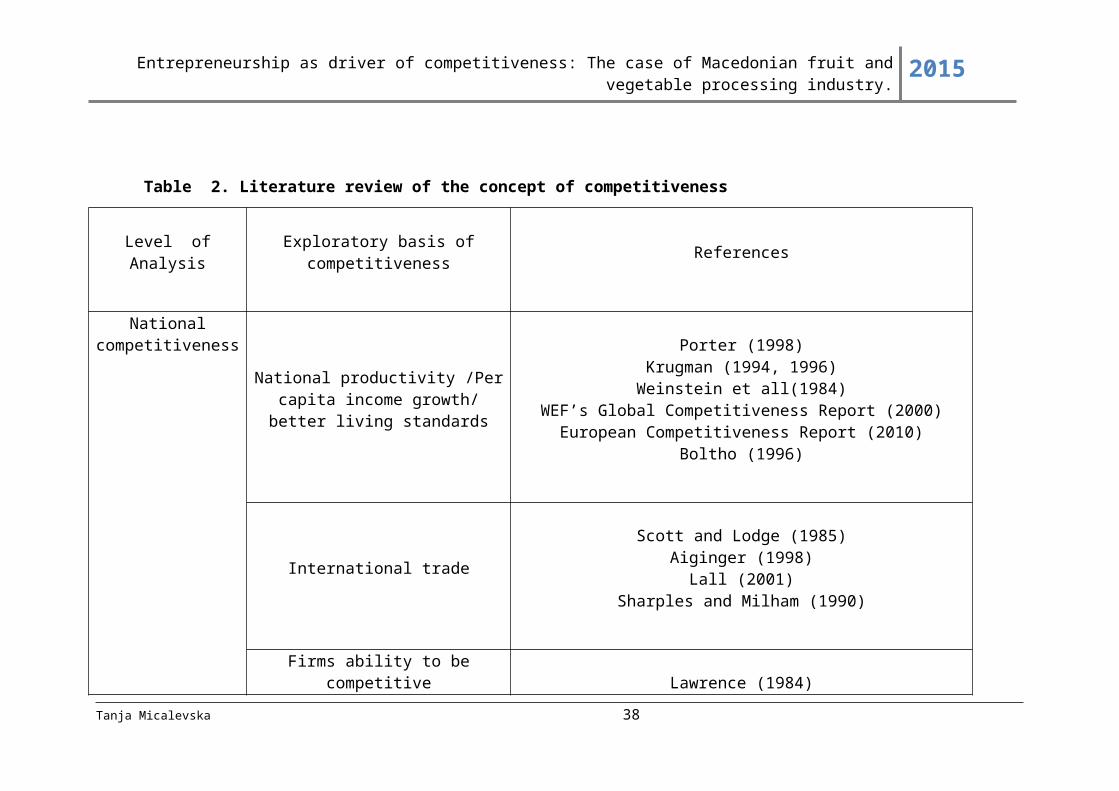
Table 2. Literature review of the concept of competitiveness
Level ofAnalysis Exploratory basis of competitiveness References
Nationalcompetitiveness
National productivity /Per capita income growth/ better living standards
Porter (1998)Krugman (1994, 1996)Weinstein et all(1984)
WEF’s Global Competitiveness Report (2000)European Competitiveness Report (2010)
Boltho (1996)
International trade
Scott and Lodge (1985)Aiginger (1998)
Lall (2001)Sharples and Milham (1990)
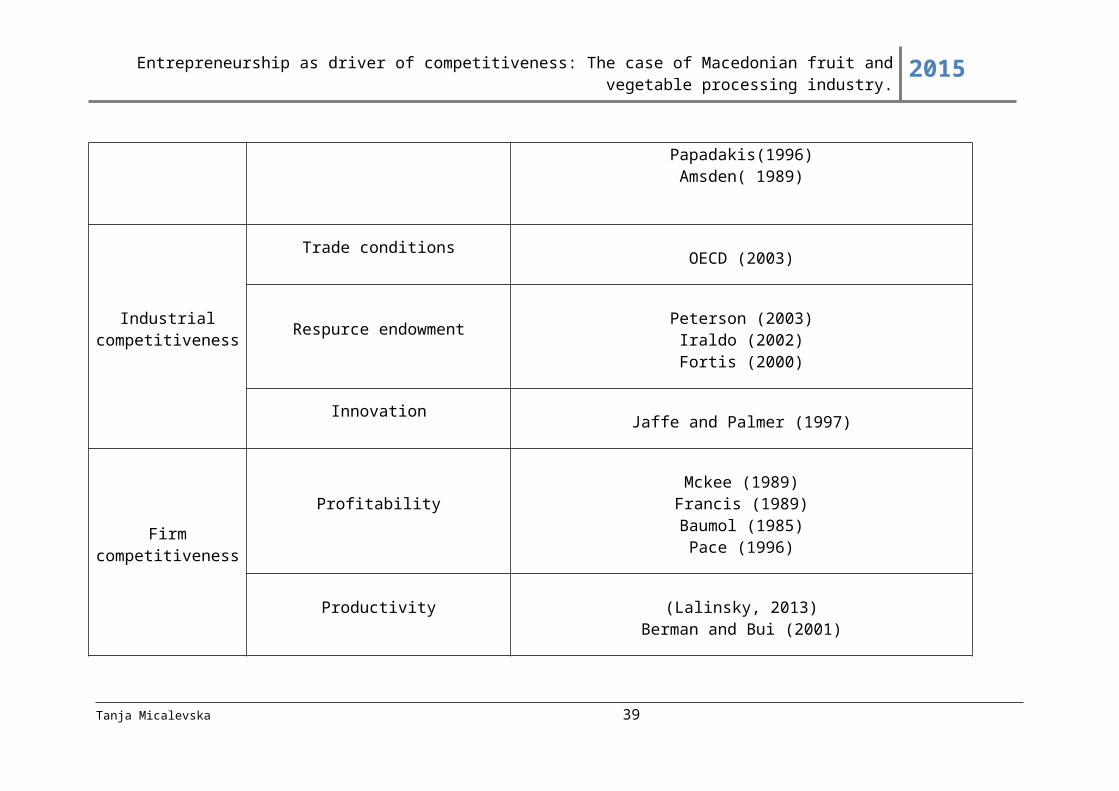
Firms ability to be competitiveLawrence (1984)Papadakis(1996)Amsden( 1989)
Industrial Trade conditions
Tanja Micalevska 26

Entrepreneurship as driver of competitiveness: The case of Macedonian fruit and vegetable processing industry. 2015
competitiveness
OECD (2003)
Respurce endowment Peterson (2003)Iraldo (2002)Fortis (2000)
Innovation Jaffe and Palmer (1997)
Firm competitiveness
ProfitabilityMckee (1989)Francis (1989)Baumol (1985)
Pace (1996)
Productivity (Lalinsky, 2013)Berman and Bui (2001)
MarketingDou (1998)
Corbett(1993)Hammer (1993)
Strategic managmentPorter (1999)Grupp (1997)
Papadakis (1994)Ghemawat (1990)
Tanja Micalevska 27
Entrepreneurship as driver of competitiveness: The case of Macedonian fruit and vegetable processing industry.
2015
1.1 Competitiveness on a national level
All countries in the world are interested in accomplishing greater national
competitiveness. Developed countries want to keep their dominance on the international
market, developing countries are trying to catch on with developed ones, and countries in
transition to win new markets. Even through, the goal is the generally same, greater
competitiveness, the understanding of its meaning, measurements, and proposed ways for
achieving it, are different.
National competitiveness is represented by the progress of the country, its wealth, the
growth rate, the rising living standards and the ability of a contry to sell its goods
internationaly. The main factors influencing national competitiveness are diverse: goverments
policies, exchange rates, investment rates, the culture and the mentality of the population.
In order to understand it better, some of the most cited definitions used to explain national
competitiveness, are given below:
"The ability of companies, industries, regions, nations or supranational regions to
generate, while being and remaining exposed to international competition, relatively high
factor income and factor employment levels on a sustainable basis" (Hatzichronoglou,
1996).
“The ability to sustain, in a global economy, an acceptable growth in the real standard of
living of the population, with an acceptably fair distribution, while efficiently providing
employment for substantially all who can and wish to work and doing so without
reducing the growth potential in the standards of living of future generations”
(G.Hickman, 1992).
“The set of institutions, policies, and factors, that determine the level of productivity of a
country” (The Global Competitiveness Report 2013–2014, 2013).
Tanja Micalevska 28

Entrepreneurship as driver of competitiveness: The case of Macedonian fruit and vegetable processing industry.
2015
National competitiveness, as can be noticed from the Table 2 and the definitions
stated, is mostly related with national productivity on one side and with the national
capability to trade on international markets on the other. The first approach explains the
domestic competitiveness of a country by using indicators such as growth per capita and total
productivity. The second approach takes into consideration the international trade
performance.
Both have their strengths and weaknesses, but, by understanding them we can
understand the concept of competitiveness better. To explain the approaches I go briefly
through the theories and the development of economic doctrines related with them.
The first approach relates national competitiveness with national productivity and per
capita income growth. They can be observed through the growth theories which are given
below with focus on the most importat works in historical order.
The predecessor of the classical theory, William Petty, has pointed out that ”Labor is
the father of wealth, and nature is its mother” (Stojkov, Development of economic thought,
2002). He calculated the surplus rate as a relation between the surplus product and the
necessary input (Salvador, Heinz D. Kurz & Neri).
The classical theory includes the views of Adam Smith and Thomas Robert Malthus.
Its most eminent presenter, Smith, in his book Wealth of the Nations, which is considered as
bible in economic thought, claims that crucial aspects for wealth of a country are the
accumulation of capital and the specialization of labor. Accumulation of capital depends of
the ability to save. The specialization results in increased productivity because: (i) the
improvement of the dexterity of workers; (ii) the saving of time which is otherwise lost in
passing from one sort of work to another; and, most importantly, (iii) the invention of specific
machinery (Salvadori, 2003).
According to Malthus, increased productivity will result with increased output only on
a short run, and, as the population increases, the output per person will decrease, as a
consequence of the diminishing of marginal productivity of labor. (Petreski, 2002)
Karl Marks analysis is based on the theory for added value. He distinguished absolute
added value, as a result of extension of the working day or increase the intensity of labor, and
relative added value, as a result of increased productivity of labor (Stojkov, Development of
economic thought, 2002).
Tanja Micalevska 29

Entrepreneurship as driver of competitiveness: The case of Macedonian fruit and vegetable processing industry.
2015
Joseph Schumpeter is another name important for the theories for growth and
productivity. He stresses the role of innovations and of the entrepreneur as main actor in the
process of creative destruction, which is the way that new industries are created, and
economic growth can be achieved (Philippe Aghiony).
Keynes theory for growth builds on three basic principles: (i) the economic system
may not tend to full employment, (ii) investment decisions are independent of saving
decisions and (iii) the autonomous components of demand may affect the rate of growth of
the economy (Pasquale Commendatore, Salvatore D’Acunto, Carlo Panico, Antonio Pinto,
2001).
The post Keynesian model of economic growth was developed independently by Roy
Harrod and Evsey Domar. In this model, investments have central place in economic growth,
and they are considered as creators of income and productive capacity. The increased
capacity results in bigger output and unemployment, depending on the movements in the
income. Changes in income can be expressed through growth rates (Petreski, 2002).
The neoclassical theory overcomes the limits of previous models. Thus, Solow model
explains long term self-sustainable growth through large production, capital inflow or
sufficiently high level of savings (Petreski, 2002).
Unlike the previous theories, the endogenous theories analyze economic growth as
endogenous outcome of the economic system, not the result of forces that impinge outside.
Those theories point the role of human capital and knowledge as main factors (Romer, 1994).
The second approach for explaining national competitiveness, considers the trade
performances, which are elaborated through the doctrines of classical, neoclassical and
modern trade theories.
Classical theories include: Mercantilism, Adam Smith’s theory of absolute advantages
and David Ricardo’s theory of comparative advantages.
Mercantilists advocated an approach according to which a source of the wealth in a
country is the trade, and countries should favor their export, and discourage the import in
order to keep the wealth into the country (Stojkov, Development of economic thought, 2002)
Adam Smith, by his theory of absolute advantages, declares that if one country “A”
produces some product more efficiently than other country “B”, then, the country “A” has an
Tanja Micalevska 30

Entrepreneurship as driver of competitiveness: The case of Macedonian fruit and vegetable processing industry.
2015
absolute advantage over the country “B”. The country “B”, on the other side, may be more
efficient than country “A”, in producing some other product. Therefore, every country should
specialize in producing the products that it has an absolute advantage for (Roceska, 2003).
Adam Smith’s theory does not explain the situation when country “A” has an absolute
advantage in producing both products. This gap was captured and answered by David
Ricardo. According to him, even in a situation when country “A” has an absolute advantage
in producing the both products, there is still an economic justification for trading between
countries. In this case, the countries specialize in the production of the product where their
advantages are bigger, which is where they have comparative advantages (Roceska, 2003).
Classical trade theories are based on the premise of the existance of perfect markets.
Their discrepancies with the reality lead to further research and emerging of neoclasical
theories.
These theories have based their assumptions over the David Ricardo’s theory. Among
neoclassical theories, I take into consideration the Hecksher-Ohlin theory. It is built over the
premise that countries dispose with different proportions of the factors of production. Each
country has a comparative advantage for producing the products, for which the country is rich
with inputs. However, comparative advantages were not sufficient to explain the international
trade in markets today, so as Michael Porter noted, the world needed another modern
concept.
Modern theories include the views of Michael Porter and Paul Krugman.
Porter, in his most famous book, Competitive advantage of nations, gives a new
theory based on competitive instead of comparative advantages. The competitive advantages
can be achieved in all their forms, and are not based only on their factor driven strengths.
According to Porter, some see competitiveness as macroeconomic phenomenon driven by
exchange rates, interest rate and government deficits, while others, see it as a function of
cheap and abundant labor or natural resources, government interventions and differences in
management practices. Nevertheless, none of these views is sufficient by itself. In fact, each
of them contains some truth in it, but, a broader and more complex set of forces seem to be at
work.
Paul Krugman goes even further in his criticism and states that: “Competitiveness is a
seductive idea, promising easy answers to complex problems. But the result of this obsession
is misallocated resources, trade frictions and bad domestic economic policies.” Furthermore,
Tanja Micalevska 31

Entrepreneurship as driver of competitiveness: The case of Macedonian fruit and vegetable processing industry.
2015
he criticizes leaders of countries who use “seemingly sophisticated arguments, most of which
are supported by careless arithmetic and sloppy research” (Krugman, 1994).
In the theoretical frame are included some of the most important explanations for
national competitiveness as productivity and international trade patterns, but, in order to be
more comprehensive, the empiricics for the concept and the most frequently used metrics for
national competitiveness are reviewed too.
The indicators that have been used to measure competitiveness are many, and among
them are: Revealed comparative advantage, Relative unit labor cost, Total Factor
productivity. Still, in the scope of this research, competitiveness will be accessed by using
only the two best known reports: The Global competitive report and World competitiveness
yearbook.
The Global competitiveness report is an annual report on competitiveness of countries
around the world. It was introduced in1979, and since 2005, the global competitiveness index
is calculated. In 2013, 144 countries were analyzed by using over 120 criteria. It is composed
by 12 pillars each of them measuring different aspect of competitiveness (The Global
Competitiveness Report 2013–2014, 2013).
The first pillar, institutions, takes into consideration public and private
institutions, the legal and administrative environment, the judicial system, the fiscal system,
and the business climate.
The second pillar, infrastructure, includes the roads, the railways, the air lines,
then, the telecommunication, internet, and, also access to electricity and water.
The third pillar, macroeconomic environment, is related with the
macroeconomic conditions and stability in countries such as inflation rate, level of public
deficit and public debt, interest rates.
The fourth pillar, health and primary education, is important for the ability of
people to work, because, they work more and are more efficient in obtaining working tasks
when they are healthy and educated.
Tanja Micalevska 32

Entrepreneurship as driver of competitiveness: The case of Macedonian fruit and vegetable processing industry.
2015
The fifth pillar, higher education and training, is linked with the possibilities
of workers to add value. When their skills are better and their knowledge greater, they add
more value through their work.
The sixth pillar, goods market efficiency, illustrates the functioning of the free
market, customer orientation and buyer sophistication.
The seventh pillar, labor market efficiency, points the freedom of movement
of the workforce in places where their potential can be used to maximum, the employment
and the wage system efficiency.
The eighth pillar, financial market development, gives the level of
sophistication on financial markets. The more developed and diversified the financial sector
is, the better is the allocation of resources.
The ninth pillar, technological readiness, refers to the access to technology
that a country has, as well as the possibilities for adopting already existing technologies.
The tenth pillar, market size, refers to the boarders of the market. It is
determined by the domestic demand and exports.
The eleventh pillar, business sophistication, is composed by two related
elements. The first refers to individual firm characteristics as production processes,
marketing, distribution, and, the second refers to grouping of firms in clusters and networks.
The twelfth pillar, innovation, shows the capability of a country’s firms to
have research and development, to implement creative, new ways of doing things, new
products and services, new methods of marketing.
The pillars are grouped in three categories:
Basic requirements,
Efficiency enhancers and
Innovation and sophistication factors.
They are given in Table 3.
Tanja Micalevska 33

Entrepreneurship as driver of competitiveness: The case of Macedonian fruit and vegetable processing industry.
2015
Table 3: Global Competitiveness Report pillars
Basic requirements Institutions Factor driven economies
Infrastructure
Macroeconomic stability
Health and primary education
Efficiency enhancers Higher education and
training
Efficiency driven economies
Goods market efficiency
Labor market efficiency
Financial market
sophistication
Technological readiness
Market size
Innovation and
sophistication factors
Business sophistication Innovation driven economies
Innovation
Data source: Global Competitiveness Report 2013-2014
The World competitiveness yearbook ranks economies according to their ability to
manage resources and competencies. It was first published in 1989, and compares 60
countries on over 300 criteria. The criteria used, are grouped in four main groups (Table 4).
The first one, economic performance includes variables that illustrate the
macroeconomic situation of an economy.
The second, government efficiency, considers policies and the regulative norms.
The third, business efficiency, consists of variables related with the environment
essential for doing business.
The last category is about infrastructure.
Tanja Micalevska 34
Entrepreneurship as driver of competitiveness: The case of Macedonian fruit and vegetable processing industry.
2015
Table 4: World Competitiveness Yearbook pillars
Economic performance Domestic economy
International trade
International investment
Employment
Prices
Government efficiency Public finance
Fiscal policy
Institutional framework
Business legislation
Social framework
Business efficiency Productivity and efficiency
Labor Market
Finance
Management practices
Attitudes and values
Infrastructure Basic infrastructure
Technological infrastructure
Scientific infrastructure
Health and environment
Education
Data source: www.imd.org
From the tables, we can see that both most famous reports for competitiveness
worldwide have similarities in the categories they take into account. The sources of the data
are combinations of statistics taken from reliable institutions such as World Bank, World
Trade Organization and surveys. There are some differences too. The major difference is that
the Global competitive index classifies countries in three categories as given in the Table 1,
while The World competitiveness yearbook does not. Nevertheless, despite the differences
their rankings are usually similar.
Tanja Micalevska 35
Entrepreneurship as driver of competitiveness: The case of Macedonian fruit and vegetable processing industry.
2015
1.1.1 Competitiveness on a national level – background analysis for The
Republic of Macedonia
After presenting the most influential theories considering competitiveness and the
common indicators for measuring competitiveness on a national level, the research moves on
applying the measures in practice by measuring the national competitiveness of The Republic
of Macedonia. The country is not ranked on the World Competitiveness yearbook, so, in the
analysis that follows, its competitiveness is measured only by the Global competitive index.
According to the Global competitiveness report 2013-2014, Republic of The Republic
of Macedonia is ranked on the 73 position among 148 countries. This position is a huge
success of the country, because for only one year, it is improved for 7 places. However, if we
take a closer look, the growth in the rank of The Republic of Macedonia is not only better
compared with the last year, but has continually been improving in the years after 2008.
The trend line of the Global competitive index is shown in Graph 1. It illustrates the
Global competitive index in the period 2006- 2013, considering that the data records for
Republic of Macedonia are available since the year 2006. As shown below, on the horizontal
axis are given the years in the period 2006- 2013, and on the vertical the value of the index.
In the investigated year (2013) the value is 4.14.
Graph 1: Global Competitiveness Index for the Republic of Macedonia 2006-
2013
Macedonia GCI
3.53.63.73.83.9
44.14.2
2006-2
007
2007-2
008
2008-2
009
2009-2
010
2010-2
011
2011-2
012
2012-2
013
2013-2
014
GCI
Data source: www.weforum.org
Tanja Micalevska 36

Entrepreneurship as driver of competitiveness: The case of Macedonian fruit and vegetable processing industry.
2015
The advancement in the index for The Republic of Macedonia is meaningful
information, but, also important is its relative position compared with other Western Balkan
countries and EU member countries. For that purpose, data for rank and index value of other
Western Balkans are taken from the report and illustrated in Table 5.
Table 5: Western Balkans GCI 2012-2013 and 2013-2014
Country 2012-2013 GCI 2013-2014 GCI
The Republic of Macedonia 80 4.04 73 4.14
Albania 89 3.91 95 3.85
Serbia 96 3.87 101 3.77
Bosnia and Herzegovina 88 3.93 87 4.02
Croatia 81 4.04 75 4.13
Montenegro 72 4.14 67 4.2
Data source: Global Competitiveness Report
From the table, we can notice that The Republic of Macedonia has better
competitiveness than Albania, Serbia, Croatia, Bosnia and Herzegovina, and lower from
Montenegro. This is illustrated in the Graph 2.
Graph 2: Western Balkans GCI 2012-2013 and 2013-2014
0
20
40
60
80
100
120
Maced
onia
Albania
Serb
ia
Bosna a
nd Herzego
vina
Croatia
Montenegro
2012-2013
2013-2014
Data source: Table 5
Tanja Micalevska 37
Entrepreneurship as driver of competitiveness: The case of Macedonian fruit and vegetable processing industry.
2015
The next level of the analysis is comparing The Republic of Macedonia with the
European countries. According to the data from 2012-2013 Global Competitiveness Report,
The Republic of Macedonia is more competitive only from Greece and Croatia. All other
countries show better performances as illustrated in Graph 3.
Graph 3: The Republic of Macedonia and EU countries GCI 2012-2013
Data source: Global Competitiveness Report 2012-2013
In the report 2013-2014, The Republic of Macedonia is again more competitive than
Greece and Croatia, but is also more competitive than Romania and Slovac Republic. (See
graph 4)
Graph 4: The Republic of Macedonia and EU countries GCI 2013-2014
0
1
2
3
4
5
6
Finl
and
Germ
any
Swed
enNe
ther
land
sUn
ited
Denm
ark
Aust
riaBe
lgiu
mLu
xem
bour
gFr
ance
Irela
ndEs
toni
aSp
ain
Mal
taPo
land
Cze
chIta
lyLit
huan
iaPo
rtug
alLa
tvia
Bulg
aria
Cypr
usSl
oven
iaHu
ngar
yM
aced
onia
Ro
man
iaCr
oatia
Slov
akGr
eece
Data source: Global Competitiveness Report 2013-2014
Tanja Micalevska 38
Entrepreneurship as driver of competitiveness: The case of Macedonian fruit and vegetable processing industry.
2015
The position of The Republic of Macedonia is result of the rankings in the twelve
pillars described above. Given the rank of the country for each pillar, a radar chart was
created which gives information where The Republic of Macedonia is relatively good and
where it has weaknesses. The violet line shows the parameters for the period 2012-2013, and
the red one is for the period 2013-2014. The Graph 5 illustrates that The Republic of
Macedonia should make improvements in the areas of Business sophistication and Market
size, but also in Innovation and Infrastructure.
Graph 5: The Republic of Macedonia GCI pillars for the period 2012-2013 and
the period 2013-2014.
020406080
100120
institutions
Infrastructure
Macroeconomic stabil ity
Health and primaryeducation
Higher education andtraining
Goods market efficiency
Labor market efficiency
Financial marketdevelopment
Technological readiness
Market size
Business sophistication
Innovation
Data source: Global Competitiveness Report
Tanja Micalevska 39

Entrepreneurship as driver of competitiveness: The case of Macedonian fruit and vegetable processing industry.
2015
1.2 Competitiveness on industry level
The competitiveness of one country, as in the example with the ocean formed by the
rivers flowing into it, depends significantly of the competitiveness of the country’s
sectors. According to Martin, Westgren, and van Duren (1991) ‘the sustained ability to
profitability gain and maintain market share’ is what makes sectors competitive. So
industry competitiveness is related with profitability on one side, and with the
participation on the international and domestic markets on the other.
According to Sharples and Milham competitiveness is the “ability to deliver goods
and services at the time, place and form sought by overseas buyers at prices as good or
better than those of other potential suppliers whilst earning at least opportunity costs
returns on resources employed”. This definition incorporates competition of a sector on
international markets and competition between sectors for domestic market factors.
Another view, The McKinsey Global institute claims that “a competitive sector is one
in which companies improve their performance by increasing productivity through
managerial and technological innovation and offer better quality or lower price for their
products, thereby expanding demand for their products.
K. Momaya defines industrial competitigveness as “Extent to which a business sector:
satisfies the needs of customers from the appropriate combination of the following
product/service characteristics: price, quality, innovation; satisfies the needs of its
constituents for example, workers in terms of involvement, benefit pro grammes, training,
and safe workplace; offers attractive return on investment; offers the potential for
profitable growth”.
The European Competitiveness and Sustainable Industrial Policy Consortium points
out two main dimensions of competitiveness of sectors, the vertical, related with the
sector’s internal dynamics the company-level strategies and business models, and the
horizontal, relating to the business environment.
Michael Porter .investigated the determinants, that lead one industry to be more
competitive than others. He among the main factors which determine industry
competitiveness points out the local conditions, the resources and transport costs,the
related industries, the level of collaboration among sectors, the market conditions, the
Tanja Micalevska 40

Entrepreneurship as driver of competitiveness: The case of Macedonian fruit and vegetable processing industry.
2015
business climate, regulations and factors within the industry such as strategies of firms,
rivarly and collaboration among industries firms.
The folowing figure shows the main powers determining national industries
competitivenss.
Figure 1: Porter national diamond
Source: The four main forces are: (Porter M. , On Competition, Updated and
Explained Edition, 2008)
Factor conditions- refer to natural resources, human and capital resources,
infrastructure. In the previous period, competitiveness was related with the richness in these
kinds of factors. However, Porter claims that factors given in some location are not as
important as the factors created.
Demand conditions – They include the domestic demand for goods of the
concrete branch and the sophistication of buyers. If companies understand the present and
future needs of their current and potential consumers, they will react and improve the supply.
Tanja Micalevska 41

Entrepreneurship as driver of competitiveness: The case of Macedonian fruit and vegetable processing industry.
2015
Related and supported industries refer to all the backward and forward
oriented industries. If the suppliers offer quality products, they improve the chances of the
companies in the given branch to be more efficient. The same applies to the speed of delivery
by suppliers.
Strategy of the firm presents the way firms are organized, managed, their main
goals and motivations, while the rivalry of firms provides the dynamic process of
improvement.
The other two influential forces, besides the main four, are the following:
The government - It can foster competitiveness by advancing the conditions
for flourishing the four above mentioned forces. The enhancements can be made in the field
of infrastructure, education, training, the institutional base, regulatory reforms, or by
stimulating local competitiveness. However, government should not intervene to the point
where it hinders rather than helps.
Chance- includes factors that are out of the power of companies. They are
given, but can significantly impact the environment for business.
The strength of this model is the approach on the sectors, instead as on isolated islands, as
on dynamic categories, which may be subjects of internal, but also external changes.
The main pillars on which economies are based, and build their competitiveness are
agriculture, industry and services. The share of each of these pillars, in economies, varies
from one country to another. Before the global crises, countries where agriculture and
industry appeared as main contributors in the GDP (Gross Domestic Product) were
considered as less developed. Service dominated economies were recognized as more
developed and more competitive (Ilievska, 2015).
Today, after the global crisis, agriculture and industry are accepted as important as the
sectors offering services. After the turbulences on the financial markets, it became clear, that
Tanja Micalevska 42
Entrepreneurship as driver of competitiveness: The case of Macedonian fruit and vegetable processing industry.
2015
fundamental for one country’s competitiveness are sectors that generate material wealth such
as agriculture, manufacturing, mining and construction. Services and trade are built on the
products created by previous sectors. Therefore, economies which tend to be competitive
should improve their industry performances, and even then, to support their products by
offering different kind of services. An example for this is Germany, as a country which
despite the crisis managed to maintain and improve its position on global markets.
Industry is a broad concept. According to the International Standard Industrial
Classification (ISIC) Revision 3 industry corresponds with divisions 10-45 (United Nations
Statistics Devision, 2013). It includes manufacturing, construction and electricity. In this
study the term industry will refer only to manufacturing (divisions 15- 37) and both terms
will be used interchangeably.
Manufacturing includes ”the physical or chemical transformation of materials or
components into new products, whether the work is performed by power-driven machines or
by hand, whether it is done in a factory or in the worker's home, and whether the products are
sold at wholesale or retail” (United Nations Statistics Devision, 2013).
The main measures for the contribution of the manufacturing to the total output of an
economy is based on the volume of production produced and marketed on domestic and
foreign markets, and the value added in the products.
The United Nations industrial development organization has developed Competitiveness
Industrial Performance index (CIPI) to measure countries’ manufacturing development. The
index is consisted of six variables, grouped in three sets, which present three different
dimensions (The Industrial Competitiveness of Nations Looking Back, forging ahead, 2013).
The first dimension describes the capacity of a country to produce and export
manufactories and covers the variables:
The MVA pc (Manufacturing value added per capita), which considers the
added value, instead of the volume of produced goods.
The MX pc (Manufacturing export per capita), which gives information on the
exports of manufactured goods by a country.
Tanja Micalevska 43

Entrepreneurship as driver of competitiveness: The case of Macedonian fruit and vegetable processing industry.
2015
The second dimension refers to technology, and the variables reviewed are:
Share of manufacturing value added in GDP, which gives information for the
capacity of a country to transform goods.
Share of Medium and High tech value added in total manufacturing value
added, which gives information about the technological advancement in
countries manufacturing.
And, the third dimension investigates the impact of the countries in the total world
manufacturing.
Share of manufactured exports in total merchandised exports, which shows the
participation of manufacturing products in the total export.
Share of Medium and High tech exports in total merchandised exports, which
shows the complexity of the exported products.
Tanja Micalevska 44

Entrepreneurship as driver of competitiveness: The case of Macedonian fruit and vegetable processing industry.
2015
1.2.1 Competitiveness on industry level – background analysis for Republic of
Macedonia
In this study the focus is put on the manufacturing competitiveness of The Republic of
Macedonia. Therefore, I explore Macedonian competitive industrial performance through
years, and, its position on the scale of industrial performances among other Western Balkans
countries (except Montenegro and Kosovo because there is no information available for CIPI
for those economies). Furthermore, I compare Republic of Macedonia manufacturing
advancement with EU countries. The data is taken from the Competitive industrial
performance report UNIDO 2012-2013 (Yumkella, 2013). The analyses are presented
graphically in order to visualize the results.
The graph presents time series of CIPI for The Republic of Macedonia1. As we can
see in the period since 1990 until 2012, the manufacturing competitiveness in Macedonia has
not changed a lot. There are some improvements in the last three years, but mainly the CIPI
has obtained approximate values of 0.02.
Graph 6: CIPI for the Republic of Macedonia 1990-2012
Source: http://www.unido.org/data1/Statistics/Research/cip.html
1 The last data available for Macedonia is the year 2012.
Tanja Micalevska 45

Entrepreneurship as driver of competitiveness: The case of Macedonian fruit and vegetable processing industry.
2015
According to the last available data for the CIPI, manufacturing in The Republic of
Macedonia, lags behind Croatia, Serbia, Bosnia and Herzegovina, and is more competitive
only from manufacturing in Albania. The described situation is illustrated in Graph 7.
Graph 7: CIPI for Western Balkans
0
0.01
0.02
0.03
0.04
0.05
0.06
0.07
Croatia Serbia Bosnia andHerzegovina
Macedonia Albania
CIP
Data source: Competitive industrial performance report UNIDO 2012-2013
In order to analyze more in depth, the position of The Republic of Macedonia among
other Western Balkans, its strenghts and weaknesses compared with its neighbors, I made
comparison of the given economies in each of the CIPI composite dimensions. Thereby, I
found that the order of countries is same in individual variables as in the composite index.
(See graph 8, 9, and 10). Still, the charts show some useful information. For example, in chart
8 we can notice that the manufacturing exports per capita, for all observed economies, are
greater than the value added in the process of production.
Graph 8: MVA pc and MX pc for Western Balkans
Data source: Competitive industrial performance report UNIDO 2012-2013
Tanja Micalevska 46

Entrepreneurship as driver of competitiveness: The case of Macedonian fruit and vegetable processing industry.
2015
From the ninth graph, it can be seen that in all Western Balkan countries, except The
Republic of Macedonia, the manufacturing value added is a result mainly of technological
improvement. This signals that if the country plans to be competitive on the long term,
changes in the industrialization intensity in The Republic of Macedonia are required.
Graph 9: MVAsh and MHVAsh for Western Balkans
Data source: Competitive industrial performance report UNIDO 2012-2013
In the next graph- Graph 10, we notice that the quality of Croatian export is the
highest, while Serbia, Bosnia and Herzegovina and especially The Republic of Macedonia
and Albania should improve their manufacturing export performances.
Graph 10: MXsh and MHXsh for Western Balkans
Data source: Competitive industrial performance report UNIDO 2012-2013
At last, the third dimension is explored, and as visible in Graph 11, countries shares in
the world export have minimal importance. Croatia is again most successful among the
considered countries, while The Republic of Macedonia is penultimate, and it is better only in
Tanja Micalevska 47
Entrepreneurship as driver of competitiveness: The case of Macedonian fruit and vegetable processing industry.
2015
comparison with Albania. In its contribution in the World manufacturing value added, The
Republic of Macedonia lags behind other Western Balkan countries, except Albania. This
fact may seriously affect its long term competitiveness.
Graph 11: Im WMVA and Im WMT for Western Balkans
Data source: Competitive industrial performance report UNIDO 2012-2013
The next analysis illustrates The Republic of Macedonia’s position compared with the
European Union countries. According to the data considering the Competitiveness industrial
performance index, The Republic of Macedonia is in a very unfavorable position, and its
industrial performances are far behind the developed European countries. As illustrated on
the Graph 12, The Republic of Macedonia is more competitive in manufacturing only than
Cyprus, but less competitive from all others twenty eight economies.
Graph 12: CIPI for The Republic of Macedonia and EU countries
Data source: Competitive industrial performance report UNIDO 2012-2013
Tanja Micalevska 48
Entrepreneurship as driver of competitiveness: The case of Macedonian fruit and vegetable processing industry.
2015
The competitiveness of manufacturing can be analyzed and measured in general, as in
the previous graphs, but it is more useful when it is analyzed by specific industries. The
classical economic thought claims that countries cannot be equally competitive in producing
all products and they should specialize in the field where their competitive advantages are
greater. Today, this view is supported and supplemented by many famous names in
economics. One of them is Krugman who links competitiveness with specialization and
economies of scale.
Researchers have used different measures to identify the particular sectors in which
one country is more competitive than others. In this study, I take into consideration the
following measures as most reliable:
industry products share in value added and their growth rate over time,
industry share in total manufacturing employment,
industry share in the total manufacturing export.
In order to illustrate which goods in The Republic of Macedonia have highest share in
the value added, I use data from UNIDO online database INSTAD 2 – Industrial Statistics
Database, which provides time series data for manufacturing grouped at 2- digit level of the
International Standard Industrial Classification of All Economic Activities (ISIC). The 2-digit
classification is given in the Appendix 1.
The structure of Macedonian manufacturing sector, in the value added, is shown
below on the graph 13. The pie chart illustrates the situation in the year 2010 (the last
available information).
Graph 13: Value added in Macedonian manufacturing15 - Food and beverages
16 - Tobacco products
17 - Textiles
18 - Wearing apparel, fur
19 - Leather, leather products and footwear
20 - Wood products (excl. furniture)
21 - Paper and paper products
22 - Printing and publishing
23 - Coke,refined petroleum products,nuclear fuel
24 - Chemicals and chemical products
25 - Rubber and plastics products
26 - Non-metallic mineral products
27 - Basic metals
28 - Fabricated metal products
29 - Machinery and equipment n.e.c.
30 - Offi ce, accounting and computing machinery
31 - Electrical machinery and apparatus
32 - Radio,television and communication equipment
33 - Medical, precision and optical instruments
34 - Motor vehicles, trailers, semi-trailers
35 - Other transport equipment
36 - Furniture; manufacturing n.e.c.
Data source: http://www.unido.org/statistics/
Tanja Micalevska 49

Entrepreneurship as driver of competitiveness: The case of Macedonian fruit and vegetable processing industry.
2015
The greatest share in the value added has the food and beverages branch, then basic
metals, wearing apparel, tobacco products, while the participation of radio television and
communication equipment, medical and optical instruments, motor vehicles is minimal.
The participation of a specific branch in the value added gives valuable information
for the state of manufacturing in the examined period, but the intensity with which each of
the branches develops, indicates the direction of its future structure.
According to the last available data for the year 2010, the annual real growth rate of
manufacturing sectors in the branches food and beverages, tobacco products, paper and paper
products, printing and publishing, chemicals and chemical products, rubbers and plastic
products, fabricated market products, machinery and equipment, and furniture note positive
growth rate.
Other branches, such as textile, wearing apparel, leather and foot wear, office
accounting and computing machinery, electrical machinery, radio television and
communication equipment, medical and optical instruments, motor vehicles and other
transport equipment note negative growth rate.
The annual growth rate is given in the Graph 14.
Graph 14: Annual real growth rate of manufacturing sectors
-30-25-20-15-10-505
10152025
15 -
Foo
d an
d
16 -
Tob
acco
17 -
Tex
tiles
18 -
Wea
ring
19 -
Leat
her,
20 -
Woo
d
21 -
Pap
er a
nd
22 -
Prin
ting
and
23 -
Cok
e,re
fined
24 -
Che
mic
als
25 -
Rub
ber a
nd
26 -
Non
-met
allic
27 -
Bas
ic m
etal
s
28 -
Fab
ricat
ed
29 -
Mac
hine
ry
30 -
Offi
ce,
31 -
Ele
ctric
al 32 -
33 -
Med
ical
,
34 -
Mot
or
35 -
Oth
er
36 -
Fur
nitu
re;
Data source: http://www.unido.org/statistics/
Tanja Micalevska 50

Entrepreneurship as driver of competitiveness: The case of Macedonian fruit and vegetable processing industry.
2015
Depending on the growth or decline in the added value created by one industry
branch, the structure of the manufacturing can change. Such a change is illustrated on the
radar graph 15 for the period 2005-2010.
Graph 15: Structure of manufacturing in The Republic of Macedonia 2005 and
2010
0
5
10
15
20
2515
1617
18
19
20
21
22
23
2425
2627
28
29
30
31
32
33
34
3536
2005
2010
Data source: http://www.unido.org/statistics/
The 2-dight classification of branches refers to broad areas. In order to specify the
particular branches that create most of the value added, and make them more concretely, the
INDSTAD 4 Industrial Database can be used. It is composed by data based on the 3-diht and
4-diht level of aggregation of ISIC Revision 3. INSTAD 4 offers indicators about the value
added by branch, but also about the number of employs and wages (See Appendix 2).
In the pie (graph 16 and 17) the participation of the branches in the total
manufacturing value added is given. The graph 16 shows all subcategories in each of the
manufacturing sectors.
Tanja Micalevska 51
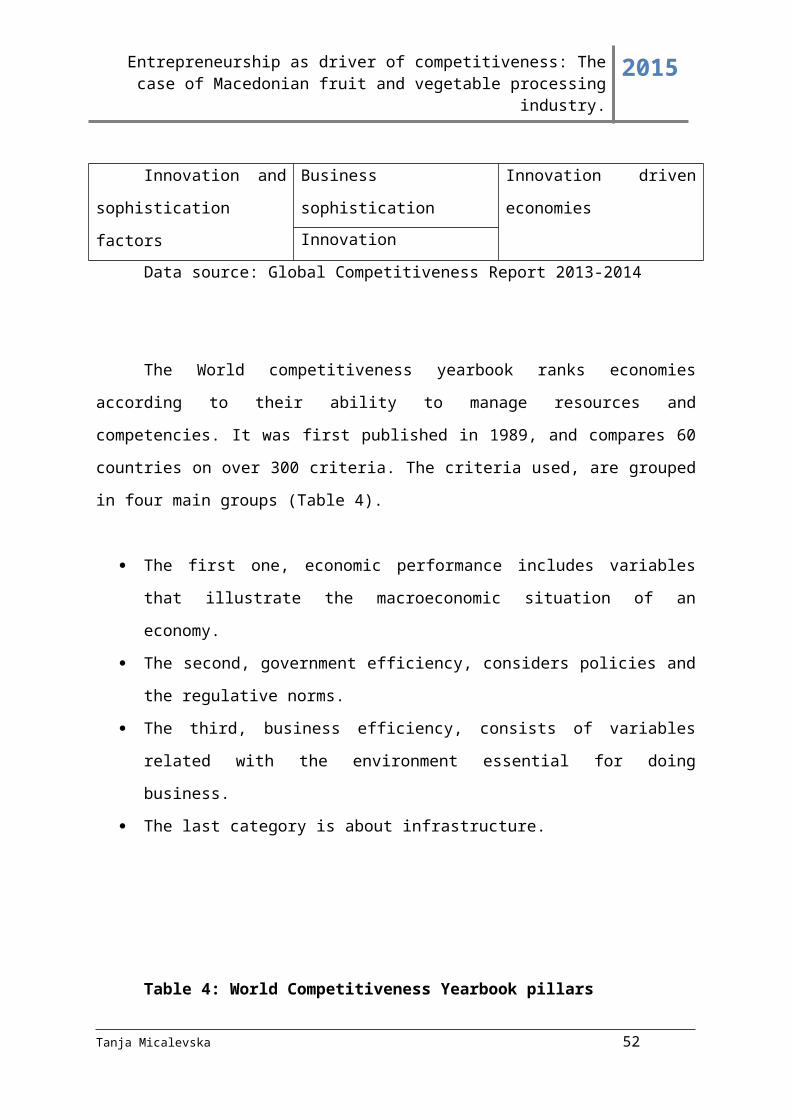
Entrepreneurship as driver of competitiveness: The case of Macedonian fruit and vegetable processing industry.
2015
Graph 16: Branches participation in value added
1810 - Wearingapparel, except furapparel
1600 - Tobaccoproducts
269 - Non-metallicmineral productsn.e.c.
155 - Beverages
154 - Other foodproducts
3430 -Parts/accessoriesfor automobiles
Data source: http://www.unido.org/statistics/
In order to get clearer information, in the next pie branches are filtered and only the
first ten with greater share in manufacturing are given in the chart 17.
Graph 17: Main branches participation in value added
20%
13%
11%
11%
10%
10%
10%
6%5% 4% 1810 - Wearing apparel, except
fur apparel
1600 - Tobacco products
269 - Non-metallic mineralproducts n.e.c.
155 - Beverages
154 - Other food products
3430 - P arts/accessories forautomobiles
242 - Other chemicals
151 - P rocessedmeat,fish,fruit,vegetables,fats2710 - Basic iron and steel
2520 - P lastic products
Data source: http://www.unido.org/statistics/
Tanja Micalevska 52

Entrepreneurship as driver of competitiveness: The case of Macedonian fruit and vegetable processing industry.
2015
The greatest participation in the value added in manufacturing for 2010 has the
wearing apparel with 13.83%, then tobacco products with 8.30, non metallic mineral
products, beverages, food products and parts for automobiles.
The second grouping is made according to the number of employs in branches, as a
share in total manufacturing employment. Again, only the branches were filtered and only
those which participated in the total manufacturing employment, the most, are considered and
visualized on the graph. They are the wearing apparel, food and tobacco products, footwear,
and furniture.
Graph 18: Branches number of employs, as a share in total manufacturing
employment
1810 - Wearing apparel, exceptfur apparel
154 - Other food products
1920 - Footwear
3610 - Furniture
289 - Other metal products;metal working services
1600 - Tobacco products
2520 - P lastic products
151 - P rocessedmeat,fish,fruit,vegetables,fats
281 - Struct.metalproducts;tanks;steamgenerators269 - Non-metallic mineralproducts n.e.c.Data source: http://www.unido.org/statistics/
The third grouping illustrates the other side of the coin of competitiveness, the
external competitiveness. It is demonstrated by the exports and value added in exports. The
analysis of exports is made by using the Standard International Trade Classification SITC
Revision 3 (See Appendix 3). SITC Revision 3 is consisted of ten main groups of products,
which are further disaggregated on smaller groups. According to the last data available (year
2010), the majority of Macedonian manufacturing export is consisted of women or girl coats,
jackets trousers, miscellaneous chemical products, petroleum oils, medicaments, foot wear,
Tanja Micalevska 53

Entrepreneurship as driver of competitiveness: The case of Macedonian fruit and vegetable processing industry.
2015
articles of apparel, of textile fabrics, alcoholic beverages, electrical apparatus, vegetables,
prepared or preserved, and so on. However, to be more suitable for presenting the
manufacture export share in accordance with the branches which produce the listed products,
the data was recombined.
The information about the products which compose the trade, classified by SITC, was
reclassified into ISIC by using correspondence tables. Thus, the data for merchandised
manufactures was divided by branches. From the graph 19, we can notice that from all the
products that are manufactured in the sectors 15- 37, basic iron and steel have the greatest
share, then follows wearing apparel, chemicals, refined petroleum products, processed meat,
fish, fruit, vegetables and beverages.
Graph 19: Branches participation in exports151 - Processed meat,fish,fruit,vegetables,fats
1520 - Dairy products
153 - Grain mill products; starches; animal feeds
154 - Other food products
155 - Beverages
1600 - Tobacco products
171 - Spinning, weaving and finishing of textiles
172 - Other textiles
1730 - Knitted and crocheted fabrics and articles
1810 - Wearing apparel, except fur apparel
1820 - Dressing & dyeing of fur; processing of fur
191 - Tanning, dressing and processing of leather
1920 - Footwear
2010 - Sawmilling and planing of wood
202 - Products of wood, cork, straw, etc.
210 - Paper and paper products
221 - Publishing
222 - Printing and related service activities
2230 - Reproduction of recorded media
2310 - Coke oven products
2320 - Refined petroleum products
241 - Basic chemicals
242 - Other chemicals
251 - Rubber products
2520 - Plastic products
2610 - Glass and glass products
269 - Non-metallic mineral products n.e.c.
2710 - Basic iron and steel
2720 - Basic precious and non- ferrous metals
273 - Casting of metals
281 - Struct.metal products;tanks;steam generators
289 - Other metal products; metal working services
291 - General purpose machinery
292 - Special purpose machinery
2930 - Domestic appliances n.e.c.
3000 - Office, accounting and computing machinery
3110 - Electric motors, generators and transformers
3120 - Electricity distribution & control apparatus
3130 - Insulated wire and cable
3140 - Accumulators, primary cells and batteries
3150 - Lighting equipment and electric lamps
3190 - Other electrical equipment n.e.c.
3210 - Electronic valves, tubes, etc.
3220 - TV/radio transmitters; line comm. apparatus
3230 - TV and radio receivers and associated goods
331 - Medical, measuring, testing appliances, etc.
3320 - Optical instruments & photographic equipment
3330 - Watches and clocks
3410 - Motor vehicles
3420 - Automobile bodies, trailers & semi- trailers
3430 - Parts/accessories for automobiles
351 - Building and repairing of ships and boats
3520 - Railway/tramway locomotives & rolling stock
3530 - Aircraft and spacecraft
359 - Transport equipment n.e.c.
3610 - Furniture
369 - Manufacturing n.e.c.
3710 - Recycling of metal waste and scrap
3720 - Recycling of non-metal waste and scrap
344 - Petroleum gases and other gaseous hydrocarbons,n.e.s.
Data source: http://www.unido.org/statistics/; author’s reclassification based on
correspondence table
The description and visualization of the classes that contribute in manufacturing value
added, employment and exports, help to identify the key branches in The Republic of
Macedonia. For that purpose, the branches with larger contribution are presented in a table
and a comparative analysis, according to the three criteria, is made. The outcome as presented
shows that the sectors wearing apparel and processed fish, meat, fruit, vegetables emerged as
relevant in all three categories. Tobacco products are relevant in two of them, manufacturing
value added and employment. Non metallic mineral products, chemicals and beverages are
also important for two categories, the manufacturing value added and exports.
Tanja Micalevska 54
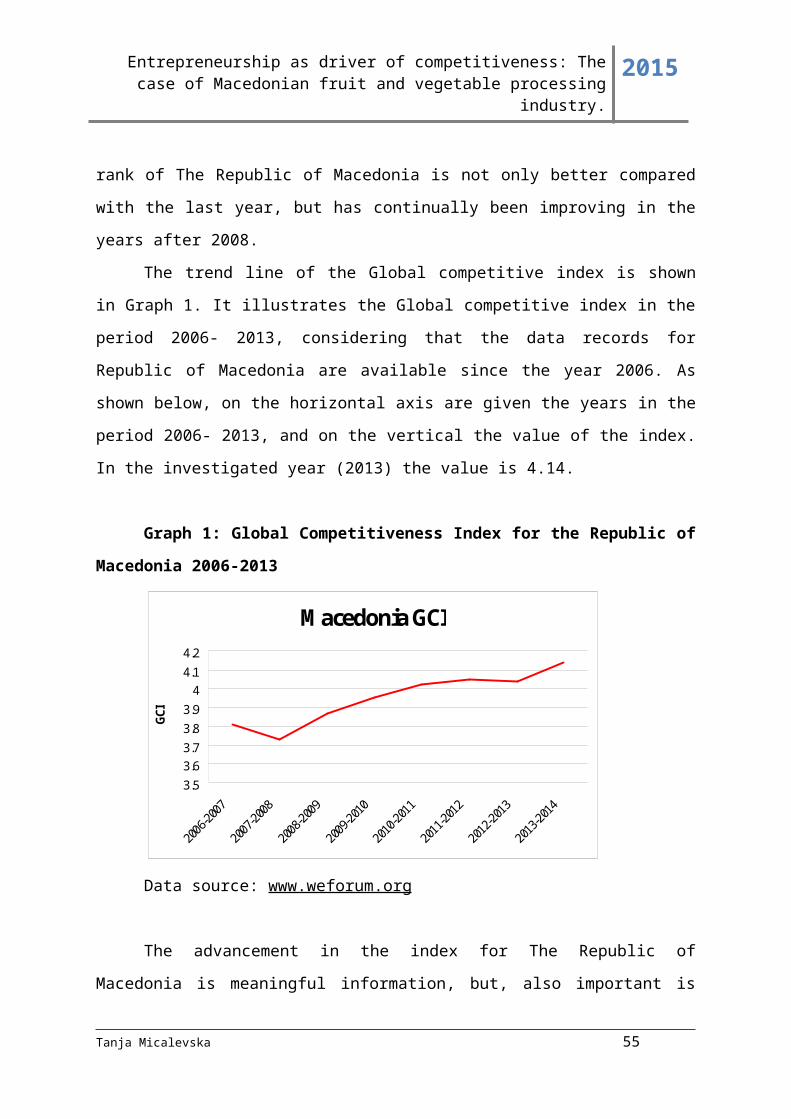
Entrepreneurship as driver of competitiveness: The case of Macedonian fruit and vegetable processing industry.
2015
Table 6: Macedonian key sectors according to their contribution in value added,
employment and exports
Sectors Value added (VA)
Employment (EM)
Exports (EX)
VA & EM
VA & EX
M & EX
VA & EM & EX
1810 Wearing apparel X
1600 Tobacco products X
269 Non metallic mineral
products
X
155 Beverages X
154 Food products X
3430 Parts for
automobiles
X
242 Chemicals X
151 Processed fish, meat,
fruit, vegetables
X
1920 – Footwear X
3610 – Furniture X
289 - Other metal
products; metal working services
X
2520 - Plastic products X
2710 Basic iron and steel X
2320 Refined petroleum
products
X
Data source: Authors classification based on previously explained statistics
Tanja Micalevska 55
Entrepreneurship as driver of competitiveness: The case of Macedonian fruit and vegetable processing industry.
2015
The sectors from the table are given on the graph 20.
Graph 20: Macedonian key sectors according to their contribution in value
added, employment and exports
0
5
10
15
20
25
30
35
Value added (VA)
Employment (EM)
Exports (EX)
Data source: http://www.unido.org/statistics
The table and the graph show that some of the branches contribute significantly in
exports, but do not employ workers, others are important for increasing the number of
employers, but do not create added value. Therefore, we cannot favor one branch over
another. However, we can understand which branches have the biggest potential for
improving competitiveness and to explore them more deeply. That leads to the next step, the
qualitative analysis of branches detected as significant contributors under the all three
criteria. The methodology, which is used for the qualitative investigation, includes applying
Porter’s national diamond as shown on the picture.
The tables present brief analyses of the forces in those branches, characterized with
greater value added, employment and exports in The Republic of Macedonia. The four Porter
forces are applied concretely on each of the given industries. Furthermore, the sector’s
strengths or positive sides for every specific factor are in the column marked with plus (+),
and the weaknesses or negative sides are in the column marked with minus (-).
Tanja Micalevska 56
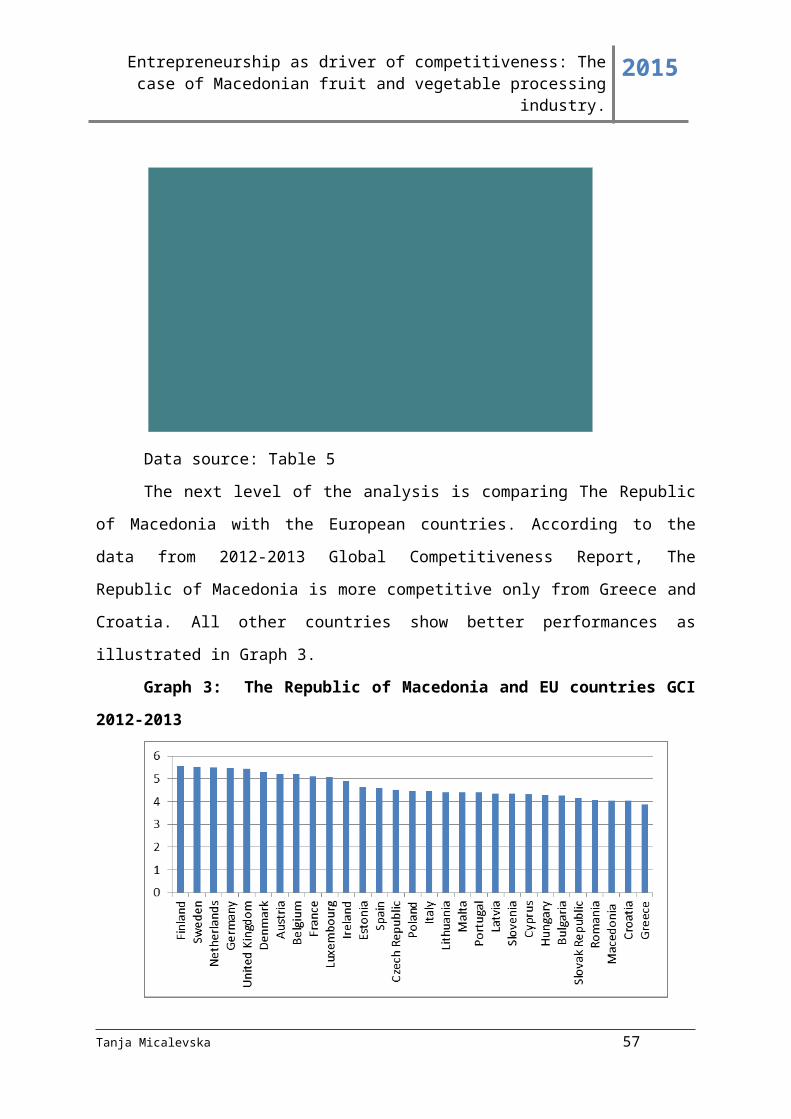
Entrepreneurship as driver of competitiveness: The case of Macedonian fruit and vegetable processing industry.
2015
Table 7: Porter diamond applied on Macedonian Wearing apparel sector
Branc
h
Wearing apparel sector + -
Porter
Forces
Factor conditions Low costs for salaries
Increasing number of
students in textile high
schools
Favorable location
Lower average
productivity of
workers
Lack of domestic
production of textile
inputs
Demand conditions Improving the
sophistication of buyers
Virtual communication
with buyers
Fashion weeks
Buyers prefer cheap
Chinese clothes
High unemployment
Related and supported industries Collaboration with
transport firms, IT
companies
Universities: European
University – Design
department Faculty of
technology &
metallurgy –
Department for textile
engineering
Strategy of the firm and rivalry The production is
based on LON
system, mainly for
other brands
Lack of Macedonian
brands
Tanja Micalevska 57
Entrepreneurship as driver of competitiveness: The case of Macedonian fruit and vegetable processing industry.
2015
Source: by the author
Tanja Micalevska 58

Entrepreneurship as driver of competitiveness: The case of Macedonian fruit and vegetable processing industry.
2015
Table 8: Porter diamond applied on Macedonian Production of iron and steel
Branc
h
Production of iron and
steel
Porter
Forces
Factor conditions Rich with natural
resources
Quality of the raw
resources
Limited high skilled
workers
Need for cleaner and
saver technology
Energy intensive
industry
High transport costs
Demand conditions Increased demand
from companies that
produce auto parts,
construction firms
International demand
larger than domestic
Related and supported industries Development of
construction industry
that uses steel,
Foreign firms like
Jonson Mateys
Strategy of the firm and rivalry Low level of value
creation
Lack of organization
and collaboration
Small investments in
innovations
Source: by the author
Tanja Micalevska 59

Entrepreneurship as driver of competitiveness: The case of Macedonian fruit and vegetable processing industry.
2015
Table 9: Porter diamond applied on Macedonian Tobacco products
Branch Tobacco products
Porter
Forces
Factor conditions Natural conditions
for growing tobacco
Experienced workers
Decreasing
production through
years
Demand conditions Fragmented demand
Quality control and
testing
Related and supported industries Vertical integration,
contracts between
producers and buyers
Tobacco association
and industries
Educational
institutions
Bad relations among
producers and buyers
Strategy of the firm and rivalry Low mechanization
Bad management
Use of cheaper low
quality seed
Source: by the author
Tanja Micalevska 60

Entrepreneurship as driver of competitiveness: The case of Macedonian fruit and vegetable processing industry.
2015
Table 10: Porter diamond applied on Macedonian Processed fish, meat, fruit,
vegetables.
Sector Processed fish, meat, fruit,
vegetables
Porter
Forces
Factor conditions Richness with
natural resources
Tradition in
preparing processed
vegetable and fruit
Possibility for
applying IPARD
funds
Seasonal
employment
Demand conditions Increased demand on
the domestic market
Demand from the
diasporas
Sophisticated buyers
Ecological
importance
Related and supported
industries
Number of agro
businesses
Association of
Macedonian
processors
Strategy of the firm and
rivalry
Networking interest
for exports
Producing for
private marks , not
having recognizable
brand
Lower productivity
of workers
Source: the author
Tanja Micalevska 61
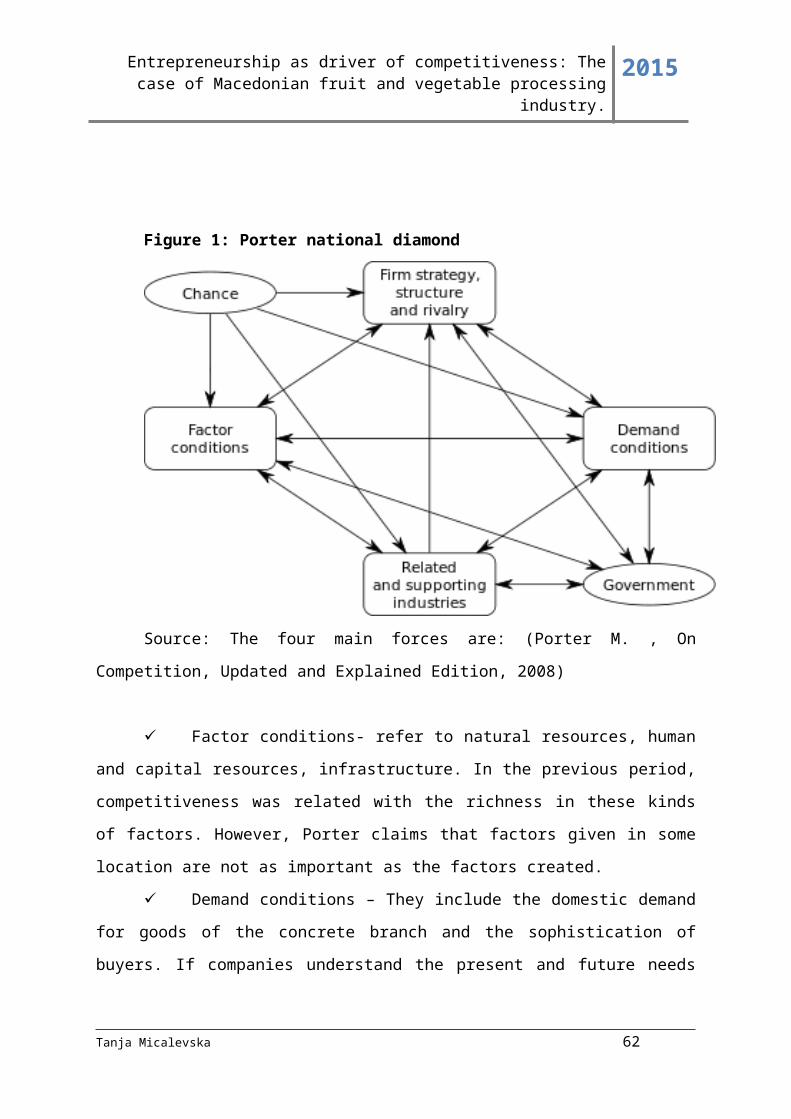
Entrepreneurship as driver of competitiveness: The case of Macedonian fruit and vegetable processing industry.
2015
1.2.2 Competitiveness in Macedonian Fruit and Vegetable Processing industry
The industry of interest for the research is Macedonian Fruit and vegetable processing
industry. The reasons for investigating competitiveness concretely in this industry are: its
participation in manufacturing added value, exports and employment (illustrated in the
previous sub chapter), and its close link with the agricultural sector as a source of raw
materials.
The Republic of Macedonia has a favorable climate and natural conditions for
succeeding of many agriculture cultures. The inputs for this industry are mainly found in the
south eastern region of the country, the towns of Strumica and Gevgelija, where the
Mediterranean climate creates favorable conditions for producing many kinds of fruit and
vegetables. The climate in Kumanovo, Skopje, Resen and Ohrid is continental, and in these
regions fruit and vegetable production is advantageous too.
The fruits and vegetables quantity and quality is significant for their further purpose
and consequently for the development of the fruit and vegetable processing industry.
Fruit subsector is consisted of apples (62%), plumbs (20%), sour cherries (8%),
peaches (6%), pears and apricots (Processing industtry of Republic of Macedonia). Apples
are most common with the sorts: ajdared, jonathen and golden delicious. Most of the apples
produced in The Republic of Macedonia are exported in neighbor countries and processed
there. Only a small part is processed in Macedonian capacities.
The second most common fruit, the plum, is mostly used for preparing Rakia,
traditional Macedonian beverage and some part is dried or processed. Cherries are produced
mainly in the region of Tetovo, and they are consumed fresh, processed or frozen. Peaches
are mostly consumed fresh or are exported in Russia, so the disposable volume of this kind of
fruit is insufficient for the needs of processing industry. Pomegranate, kiwi and figs are sold
mainly on domestic market and few are exported. (Processing industtry of Republic of
Macedonia)
Vegetable subsector is even more important for the Fruit and vegetable processing
industry in The Republic of Macedonia, because most of the final products of the industry are
based on vegetables. The vegetable is produced in glasshouses, greenhouses and outdoors on
Tanja Micalevska 62
Entrepreneurship as driver of competitiveness: The case of Macedonian fruit and vegetable processing industry.
2015
a 60000 hectares area (Processing industtry of Republic of Macedonia). In the last couple of
years the production in enclosed areas is continually increasing. From the vegetables,
tomatoes, potatoes, cabbage, beans and peppers prevail. Most of the fresh vegetable is
exported in the countries of Former Yugoslavia.
The fruit and vegetable that farmers sell or export has very low price because there is
not much value added. If these raw inputs are dried, frozen or concentrated their value is
increasing and they may be sold for a greater price on domestic and foreign markets.
Furthermore, if they are processed and conserved, they can be sold as finished, final goods
for even better price.
The current situation shows that processing companies in The Republic of Macedonia
produce both vegetable and fruit products. The participation of vegetable is dominant with 91
%, while fruit products participate with only 9 % (Macedonia, 2014). The outcomes are
mainly semi finished products and that: dried products such as vegetables including peppers,
carrots and parsley, fruits mostly plums, then concentration of tomato juices, ketchup,
concentrate of apples. The final products are in smaller quantities are consisted of traditional
Macedonian dishes ajvar, lutenica, roasted peppers, guvec, marinated vegetables, and canned
fruits, cherries preserved in alcohol, compotes and marmalades.
Fruit and vegetables products are prepared, satisfying European standards for food
production. Most of the firms have implemented HACCAP standard and some of them own
ISSO 22000 certificate. Complying with standards, matters for two reasons. First, the
awareness of domestic consumers for the environmental nature of food products has
increased in recent years, and second, compliance with standards already adopted in foreign
countries will contribute, the exports to those countries, to run smoothly.
The export orientation of Fruit and vegetable industry is strong and it continues to
grow. Main export destinations are EU countries, Serbia, Croatia. Other consumers are
overseas countries where the Macedonian Diasporas are concentrated, USA and Australia.
Tanja Micalevska 63

Entrepreneurship as driver of competitiveness: The case of Macedonian fruit and vegetable processing industry.
2015
1.3. Competitiveness on a company level
The company’s competitiveness is only a drop in the river which flow into the ocean
of the overall competitiveness of the country, but without it, the ocean will be less, because of
that missing drop. Based on the view that every drop counts, this study is investigating
companies’ competitiveness in The Republic of Macedonia.
Firm competitiveness presents the ability of firms to continualy be efficient, produce
and deliver products and services that customers prefer to buy before the ones of domestic or
foreign competitors and keep long term profitability. It is determined external forces such as
macro economic and microeconomic condiditons, but also by managers capabilities to lead
the company and answer to the external environment.
Among the theories for firm competitiveness the most influential are the resource
based theories (Peteraf and Barney, 2003; Amit and Schoemaker, 1993; Peteraf, 1993,
Mahoney and Pandian, 1992; Conner, 1991; Barney, 1991; Wernerfelt, 1984) and industrial
organization theories, among which most famous is Porters’s theory for competitive
advantage and competitive strategies.
The resource based theories are based on the premise that firms are consisted of a
number of resources which are heterogeneous, and they are not perfectly mobile among
firms. Therefore, companies’ success depends from the usage of those resources. Recently,
the resource based view focuses on knowledge, information and competemces as crucial
resources for obtaining long term and sustainable competitiveness.
The main difference among resource based theories and Porter theory is that resource
based theories consider firms resorces as their main compatitive advantage while in Porter’s
theory for the competitiveness of firms, the central position is given to the competitive
advantage of companies, which can be achieved by implementing a competitive strategy.
Generally, there are three generic strategies: cost leadership, differentiation and focus.
The first strategy includes capital investments, building of capacities, lowering
costs, avoiding credits for the buyers, cheaper distribution system and low costs for research
and development, promotion. To achieve position of cost leadership, firms should have great
Tanja Micalevska 64

Entrepreneurship as driver of competitiveness: The case of Macedonian fruit and vegetable processing industry.
2015
share of the market, access to raw materials, control of costs and appropriate organizational
structure.
The second strategy differentiation is based on creating brand, a distribution
network or unique service in order to attract and keep loyal customers. This strategy is related
with investments in research and development, attracting qualified workers and marketing
campaigns.
The third strategy – focus- means either the company to work with low costs,
either to diferentiate. Its main feature is haing a target group, a narrow segment of buyers,
geographic market.
Figure 2: Three generic competitive strategies
Source: http://tatler.typepad.com/nose/2005/04/three_generic_c.html
A great role, in the choise of competitive strategies, plays the market structure in the
particular industry branch. The science recognizes four main market structure models: perfect
competition, monopolistic competition, monopoly and oligopoly.
The table 11 below shows their main charadteristics:(Louis E. Boone, 2011)
Table 11: Market structures
Characteristics Perfectcompetition
Monopolistic competition
Oligopoly Monopoly
Number od competitors
Many Many Few None
Entrance in the industry
Easy Harder Very hard Controled by the state
Similarity in products
Homogeneous Heterogenic Similar and different
Unique
Companies power to control prices
None Some Some Pure monopol great, regulated monopol less than in pure
Tanja Micalevska 65

Entrepreneurship as driver of competitiveness: The case of Macedonian fruit and vegetable processing industry.
2015
monopol, but still big
Source: (Louis E. Boone, 2011)
Perfect competition is a theoretical model, and does not exist in practice. Therefore,
here are discussed the other three market structures - monopoly, oligopoly and monopolistic
competition.
In the case of monopoly, there is only one supplier of the particular good and no
competition among firms in the industry. The barriers for entrance are high and buyers’
power is small.
Oligopoly is characterized with limited competition among companies, there are few
suppliers of the same or similar products, who often agree on prices. The barriers for entrance
are high and buyers’ power is limited.
Monopolistic competition is characterized with large number of firms operating in the
sector producing differentiated products. The barriers for entrance in these industries are
relatively low, buyers and suppliers have power, and there are many complementary and
substitute goods.
To maintain advantage for a long term period, companies may use the focus strategy,
focus on a particular segment, and serve this segment either at lower cost or with product
variations. However, by focusing on one segment, firms lose the opportunity for profit in
other segments. Therefore, when making strategic decisions, apart from the market structure,
firms should consider other determinants, as the kind of the industry in which they operate.
The industry can be emerging, fragmented, mature, declining or global.
In emerging industries, procedures for operations should be developed in future,
possibilities for implementing new and developing complementary products are
many, and firms can earn high profits.
Fragmented industry is characterized with a large number of firms with equal size,
and the opportunities can be found in collaboration among firms, producing products
that are supporting one with each other, sharing of information, knowledge and
resources.
Mature industries are those where there is a slow or no increase in demand for the
products. The possibilities for companies lay in introducing innovations, pre and post
sale industries.
Tanja Micalevska 66
Entrepreneurship as driver of competitiveness: The case of Macedonian fruit and vegetable processing industry.
2015
Declining industries are even more limited, because the demand for their products is
decreasing. However, firms can succeed in this type of industries by finding a niche
markets or reducing costs.
Global industries have big potential due to the international sales. International
markets offer new possibilities for the already established products, but also for new
products and supporting industries which can develop from the different local
demands and tastes.
In his book, Competitive strategy, he explains the forces which influence the intensity of
the competition in one industry, the generic competitive strategies which firms use to achieve
competitive advantage, and the strategic decisions referring to expanding capacity and
vertical linkages. The competition in an industry depends from the following five forces: the
buyer’s power, the supplier’s power, the treat of new entrants, the rivalry among existing
firms, and the threat of the firms which produce substitute products.
The model is given on Figure 2.
Figure 3: Porter Five Forces Model of competititon
Source:http://www.strategy4u.com/assessment_tools/porters_five_forces/
five_forces_popup.shtml
Tanja Micalevska 67

Entrepreneurship as driver of competitiveness: The case of Macedonian fruit and vegetable processing industry.
2015
Another perspective, for investigating competitiveness, is by using concepts which
explain competitiveness, and which can be used as indicators, and measured in a quantitative
way. The choice of the concepts to capture competitiveness is difficult, especially because
there are many viewpoints among researchers. For instance, some of them consider that
firms’ competitiveness depends from their productivity, their profitability and market share of
firms, while others consider the growth rate and the international trade performances.
There are as many indicators as there are researchers dealing with this issue, and
limiting on only a few of them involves the risk of omitting any relevant issue. However, in
case when all possible factors cannot be taken into consideration, it is recommended, the
researcher to make a judgment which indicators to include, even through, there is a dose of
subjectivity, in the selection, that the researcher cannot avoid, but intend to minimize.
In the following, are selected the concepts, associated with firm competitiveness, and
then, each of them is briefly explained. Among them are productivity, profitability, growth
and trade performances.
Productivity is crucial for long-term competitiveness of organizations (A guide to
productivity management, 2011) (Lalinsky, 2013). It can be defined as the ratio of the
total output in relation with total inputs. The bigger is the output produced with given
inputs or the same output with lower cost for inputs, the better is the productivity of
the company. There are selective indicators of productivity: labor productivity and
capital productivity.
Labor productivity illustrates the efficiency of the labor in generating the output.
In the OECD System of Unit Labor Cost and Related Indicators, labor
productivity is defined in two ways: labor productivity per hour; or labor
productivity per person employed (Freeman, 2008). Labor productivity per hour is
defined as real output divided by total hours worked by all employers, while labor
productivity per person employed is defined as real output divided by total
employed persons. This measure for productivity is partial measure, but it is easy
to calculate and the data needed is often available.
Capital productivity shows how the growth in the capital reflects on the output.
Capital productivity has to be distinguished from the return of capital rate. The
former is measure of the physical capital, the assets in the company, and the latter
Tanja Micalevska 68

Entrepreneurship as driver of competitiveness: The case of Macedonian fruit and vegetable processing industry.
2015
presents the capital income, to the value of the capital stock (Measuring
productivity OECD Manual, 2001). In more developed countries where
production is automatic, the labor factor productivity is bigger, and vice versa,
where there is a lack of capital, the capital productivity is bigger. Except selective
productivity measures there is the multifactor productivity, which refers to the
productivity as a result of engagement of all the production factors (capital, labor,
energy, material). This tool is most appropriate to measure productivity, but its
limits are in the unavailability of data required for the calculation.
Profitability is another concept that is often related with competitiveness in research
papers (Panagiotis Liargovas, 2010) (Konstantinidis, 2009) (Lalinsky, 2013).
Profitability refers to the capacity of the company to earn revenues greater than the
costs of the business activities. The measures for profitability are many. Among them
are: gross profit margin, return on assets and return on equity.
Gross profit margin pictures the revenues that remain after the company
covers the costs related to the generation of those revenues. The higher the
ratio is, the better the company is compared with its competitors.
Return on assets measures the profit generation with the company assets in the
given period.
Return on equity measures the return in the investments of shareholders.
Irrespective of the measures used to express it, the capacity of the firm to
continually increase their profitability is considered as a good signal for improved
competitiveness. Higher profitability provides more opportunities for product,
technology and organization development, for application of innovative sales
methods, or for increasing the standards of human resources. (Gal, 2010)
Furthermore, increased profitability increases the assets that firms have at their
disposal and can reinvest in order to increase its capacity and grow.
Growth of the firm is another relevant indicator for its competitiveness (Lalinsky,
2013) (Ourania Notta, 2011). Growth of the firm is important for its survival, and
firms which grow faster have greater chances to survive in the first two to five years.
Tanja Micalevska 69
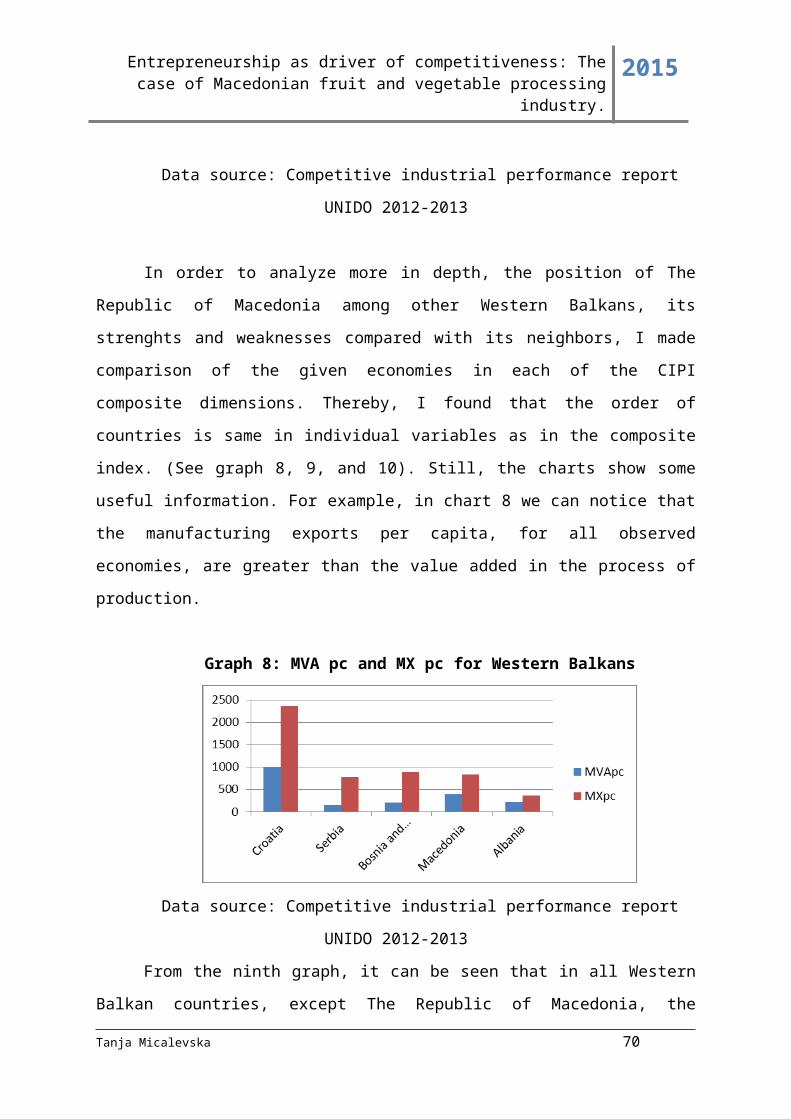
Entrepreneurship as driver of competitiveness: The case of Macedonian fruit and vegetable processing industry.
2015
A firm growth can be observed as increased market value, assets base, or number of
employers (John Graham, 2009).
The increased number of employers is more important when investigating
growth on macro level, because it gives information on the employment growth. On
micro level, growth is often expressed as sales growth and assets growth. Companies
can increase their sales and market share, by selling at lower price than costs, but on
the long run this approach is not sustainable. The long term growth can be achieved
only by investing the returns of the sales in the company. Therefore, growth of the
assets would be appropriate measure.
International competitiveness is related with firm’s capability to achieve higher
performance than its competitors in foreign markets and preserve the conditions that
sustain its higher performance also in the future (Depperu, 2014). Many companies
that show good performances on domestic markets fail to attract customers on foreign
markets. Two measures of competitive performance are export sales growth and
export dependency (Peter J. Buckley, 1988). In the globalized world, the international
competitiveness is more important than ever. It is determined by two groups of
factors: factors controllable by the firm and factors that are not affected by the firm
(exchange rates, tariffs and other trade barriers) (Carl H. Christense). Today, the
benefits of free trade are worldwide and protectionism has decreased compared with
before, and firms should concentrate their attention to the first group of determinants.
After, elaborating the concepts determining competitiveness of companies, which can
be measured in a quantitative way, follows a table with the most common measures for
productivity, profitability, growth and export performance. (See: Table 12)
Tanja Micalevska 70

Entrepreneurship as driver of competitiveness: The case of Macedonian fruit and vegetable processing industry.
2015
Table 12: Measures for productivity, profitability, growth and export
competitiveness
Dimension Indicator Strenghts Weaknesses
ProductivityProduction/ number of workers
Data for production can be calculated from the sale and inventories.Also, it is easy to get the data about the number of registered workers in a given firm in a given period
The data about production can be aproximate because is indirectly calculated from other data which are available in bilancesThe number of workers is not constant, it is drasticaly bigger in summer than in winter (sesional character).
Production/ assets
Data for production can be calculated from the sale and inventories.Shows the effectiveness of the use of the capital, the effect of the improvements in mashinery.
The data about production can be indirectly calculated from other data (revenues, and inventories).The data about the number of mashines is harder to obtain
Profitability (Revenues-costs)/ revenues
Simple to use, available from the data in financial statements
Depends from the Accounting accuracy and relability
Profit this year/ profit last year
The data about the profit or eventually the loss is easy availableShows the trend of the profits of the company as one of its main goals
The profit does not awlays have to illustrate an improvement in the operative efficasy. Sometimes it results from other factors.
Growth Current revenues/ Previous revenues
Gives information about the market share of the company in the curent year compared with the year before
Inflation can give misleading information abouth the growth, therefore prices should be adjusted
Current assets/ Previous assets
Gives information about the investment policy of the firm.The data can be obtained from the financial statements
Different accounting methods may result in diferent results
External competitiveness
Current export/ Previous export
Important information for the trend of the external competitiveness.
Considering that the exports are given in relative numbers, as a % of the total sale, it is possible to obtain misleading information.
Source:
Tanja Micalevska 71

Entrepreneurship as driver of competitiveness: The case of Macedonian fruit and vegetable processing industry.
2015
1.3.1. Competitiveness on a company level in Macedonian Fruit and vegetable
processing industry
The number of companies in the Fruit and vegetable processing industry is
approximately 50. Most of them are micro and small enterprises, located near the agriculture
locations in the country. They are grouped in association named Macedonian Association of
processors and collaborate with each other in order to strength the cooperation with farmers,
public and private institutions, to better their export potential and to improve their
competitiveness.
The competitiveness of companies Fruit and vegetable processing industry, in this
part of the study, is analyzed from the perspective is the Porter model for competitive
advantage and strategy. Thereby, each of the Porter five forces is elaborated with an accent of
its influence over the competitiveness of the companies in The Fruit and Vegetable industry
inMacedonia.
The bargaining power of buyers:
It depends from the number of buyers, the level of diffeerentiation of products, the
switching costs for using other products and the possibilities for background integration.
The number of buyers in relation with firm’s capacities in Fruit and vegetable
industry in republic of Macedonia has increased in recent years, and has a potential to
increase even more in future, on domestic as well as on foreign markets. This trend may be
positive for companies then, but, in this moment, buyers still have enough power to decrease
the prices of processed fruit and vegetable.
The current level of differentiation, of dried and concentrated products, is low, while
the traditional Macedonian dishes are more differentiated compared with products offered by
other vegetable processing industries worldwide.
Switching cost for using other products are low, and producers should work on this by
creating long term relationships with buyers, in a way that they will be emotionally linked
with the products.
The background integration is a serious treat for the firms which produce tomato,
concentration for juices, while the ones that produce final products are less vulnerable.
Tanja Micalevska 72

Entrepreneurship as driver of competitiveness: The case of Macedonian fruit and vegetable processing industry.
2015
The bargaining power of suppliers:
The suppliers are the farmers in the region of Gevgelija, Strumica, Resen, Ohrid,
Tetovo, who grow fruits and vegetables and workers who work on the production lines. They
can affect the fruit and vegetable processing industry in many ways. The industry is resource
dependent and every little change in the supply of resources can lower its profitability. The
availability of substitute inputs is limited and may increase the costs especially in the raw
fruits and vegetables. Farmers can decide to offer their production to foreign buyers for
higher prices. Another constraint is that the availability of inputs depends on weather
conditions, climate changes. They can influence on the quantity and on the quality of inputs.
Sometimes even through the volume of raw fruits and vegetables is satisfying, their quality
may not be, and may influence the quality of the final goods. Except, weather conditions
farmers can also decrease the quality, by using cheap and inadequate seeds, insufficient
protection of pests, inappropriate cultivation. The food processing firms are not prone to
backward integration, while the farmers may invest in equipment and start a business in the
processing industry. That depends of the barriers to entry.
Threat of new entrants
There are no some huge barriers to entry in the industry, such as economies of scale
because most of the firms are small, the products are differentiated, but established firms
have not some special competitive advantage such as established brand, non imitable
protected products, patents. Major barriers are the eco standards that companies should
comply and the availability of distribution channels. Distribution channels cause high costs
even for already established firms. The greatest barrier however is the capital requirement for
equipment, first supplies and first salaries. Anyway, new entrants may overcome this problem
by using IPARD funds. This kind of support is related with compliance of many requirements
but can be very useful and beneficial.
Threat of substitute products
The palette of substitute products for fruit and vegetable processing industry goods is
wide but in the same time limited. There are many products that can be consumed instead of
dried fruit, for example other sugar products and cakes, or honey and chocolate cream instead
Tanja Micalevska 73

Entrepreneurship as driver of competitiveness: The case of Macedonian fruit and vegetable processing industry.
2015
of marmalades. However, there is a good side of the story of substitutes in this particular
industry. Namely, people perceptions have changed over the last couple of years in favor of
fruit and vegetable products instead of sugars, chips and snacks. This means that from the
many substitutes available on markets, the probability for consumers to chose healthier, sugar
free products is bigger. Here lay many possibilities for the future development and growth of
the fruit and vegetable processing industry. In other word, in today healthy oriented society,
switching cost for consuming processed or frozen fruit and vegetables are too high, at least in
consumer minds.
Rivalry among existing firms:
The number of domestic firms competing in this industry is small, and the rivalry
between them is not so intense. However, their main buyers are consumers from abroad, so
foreign companies should be considered too, as direct rivals. They present real treat for
Macedonian products because of their economies of scale (India, China). Anyway,
Macedonian firms produce for niche markets and manage to sell their products. According to
the data, exports are growing continually and the industry is growing. This growth is
expected to continue in future too. However there are two characteristics that influence bad
over the Macedonian processors. The first is that competition of Macedonian firms with its
rival is based on low prices, and the second even more alarming is that Macedonian
producers have no established brand. They produce for established brands and sell their
products as private marks. Then, they come in a situation to compete in supermarkets with
their own production packed under some foreign brand name. This is a losing game, because
final buyers buy branded foreign products for higher price instead of Macedonian brands on
one hand, and Macedonian producers sell their products for lower price to the same foreign
brands. Macedonian producers lose, foreign brands earn on the margin. This problem asks for
quick solution, awareness of Macedonian producers for their loss and the need for investing
into a Macedonian brand. They claim that branding is expensive, but the expenses on long
run will bring higher revenues and better profitability.
The forces reveal the most significant aspects of the competitive environment, and
provide a baseline for sizing up companies’ strengths and weaknesses (Porter M. , The Five
Competitive Forces That Shape Strategy). Strengths, weaknesses, opportunities and threats of
Fruit and vegetable processing industry are in Table 13.
Tanja Micalevska 74
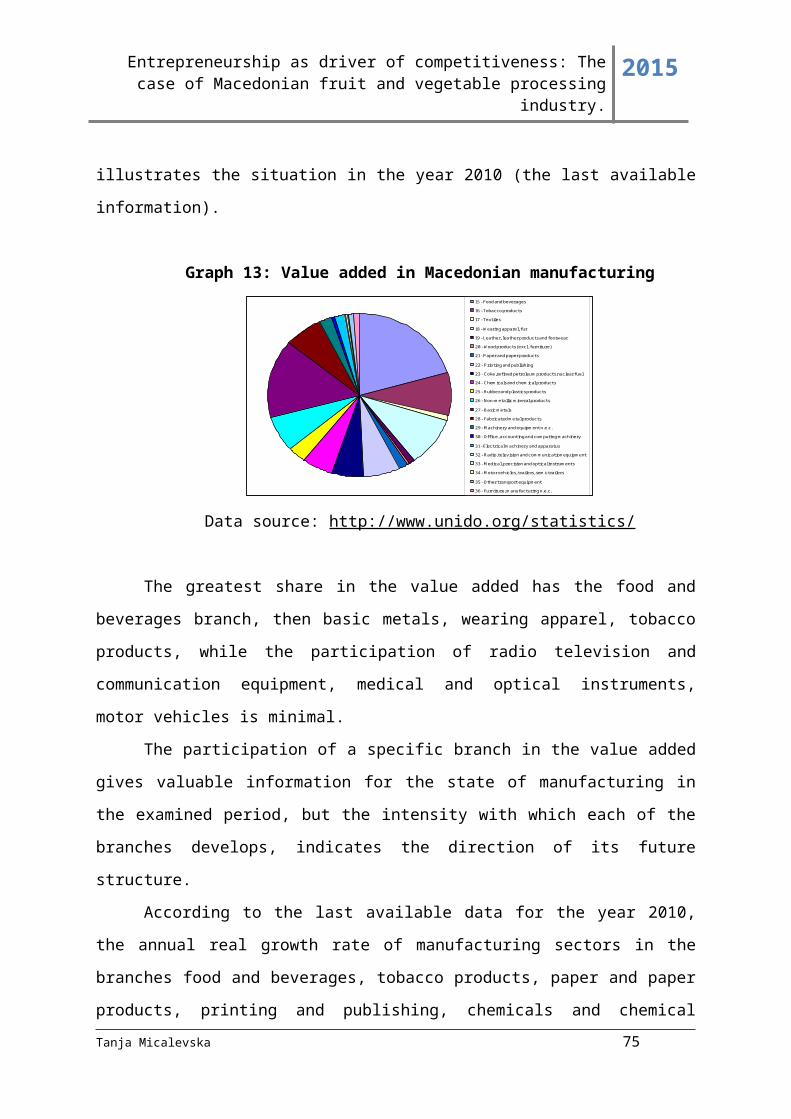
Entrepreneurship as driver of competitiveness: The case of Macedonian fruit and vegetable processing industry.
2015
Table 13: SWOT and PEST Analysis
SWOT ANALYSIS PEST ANALYSIS• Strengths Political forcesEstablished markets Experience in the secorDiversified productsFactor endowmentDeveloped delivery network
Aspirations for entrance in EU and implementation of policies for compliance with EU standards Favorable tax policy
• Weaknesses EconomicSmall capacitiesLack of planed aproachHigh fixed costsSesional character of the businessClimate can affect the supply of resourcesSmall added value (need fo further processing)Undeveloped marketing aproach
Improved conditions for doing business according to Doing business reportDecrease of the interest rates Increasing prices
• Opportunities Social forcesGreather cooperation witk the agriculture sector for obtaining resourcesNew needs of customersNew technologies for processing and technology transferNew markets abroadIncreased demand for heathy foodGverment support Vertical and horizontal integration
Not enough qualified workers Increased demand for healthy food
Threats Technological forcesIncreasing of the price of resourcesCompetition from neibor countriesLower number of qualified workers Poltion
Access to new technologies and transfer of technologyIncreased but still insufficient collaboration with universities Insufficient investments in research and development
Source: author’
Tanja Micalevska 75

Entrepreneurship as driver of competitiveness: The case of Macedonian fruit and vegetable processing industry.
2015
Once the forces affecting competition in Macedonian fruit and vegetable processing
industry have been discussed, the approaches which companies can use for strategic
positioning, exploiting or shaping the forces are presented.
Having into consideration that the Fruit and vegetable processing industry in The
Republic of Macedonia have the features of monopolistic competition and the products are
heterogeneous, companies may use differentiation strategy and to offer variety of products to
buyers who are willing to pay a higher price.
Also, they may sell to buyers which are interested to buy greater volume by
specializing for some product. Unfortunately, even through barriers for entry in the branch
exist, they are not so high, and other competitors may entry, copy the strategy and lower the
long term profits of firms.
Fruit and vegetable processing industry belongs to the fragmented industries. The key
strategy that companies should use in fragmented sectors is consolidation. (Porter M. E.,
1988).
Tanja Micalevska 76
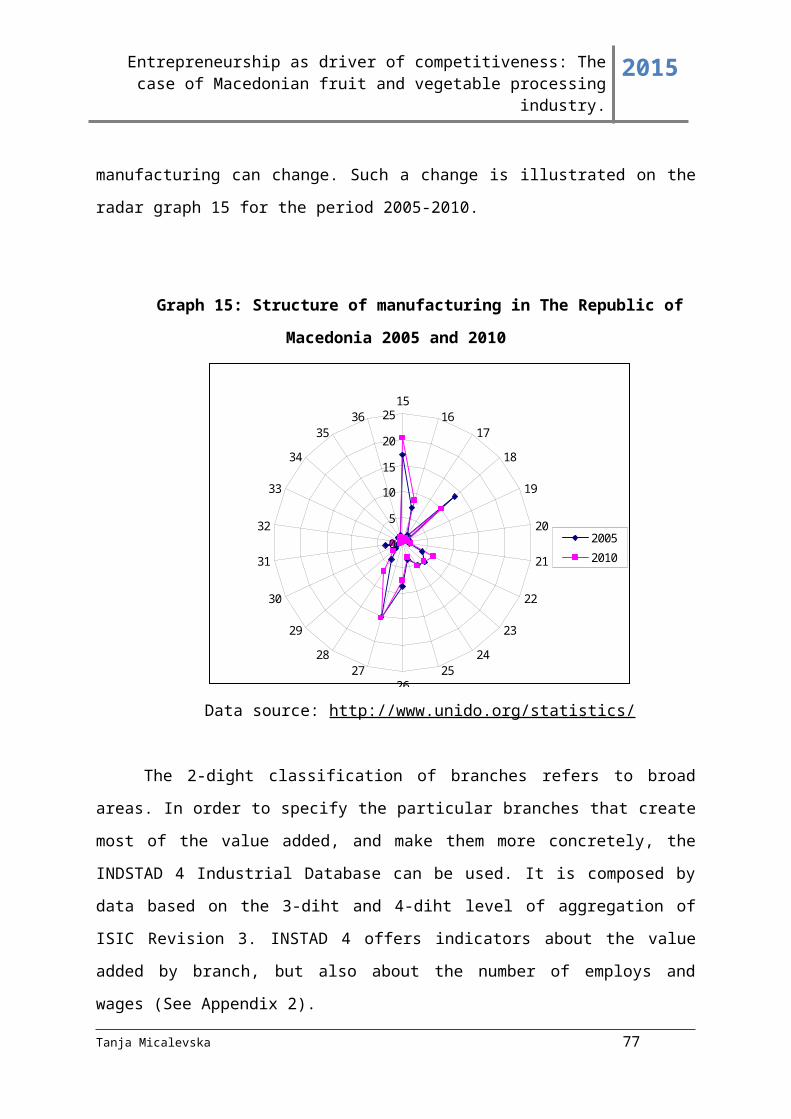
Entrepreneurship as driver of competitiveness: The case of Macedonian fruit and vegetable processing industry.
2015
CHAPTER 2: ENTREPRENEURSHIP AND ENTREPRENEURIAL DETERMINANTS
Entrepreneurship became very popular concept in recent years. It was introduced in
education, positioned as one of the main goals in policymakers programs, and the term is
more and more present in commercial and scientific books. It is used to describe the creation
of new ventures, the creativity of some people, the visionary ideas, the huge profits and huge
risks. Even through, each of these terms reflect some part of the entrepreneurship concept,
but none gives the whole picture.
The concept is complex by itself, and the reason lays in its multidisciplinary nature. In
that context, entrepreneurship has been researched through the lens of sociology, psychology
and economy. Sociologists investigate the social factors that influence on people to open their
own businesses and pursue their ideas, from one side, and the impact of the entrepreneurial
ventures on society, on the other side. Psychologists are more interested in the characteristics
of entrepreneurs, what drives them to launch enterprises and in which way are they different
from other people. Economists are interested in entrepreneurship as a driver of economic
development, reducer of poverty and enhancer of the employment.
This chapter investigates entrepreneurship from the economic point of view. It should
give an answer to the following questions:
What are the main theoretical considerations about entrepreneurship?
Which are the factors that determine entrepreneurship?
How are the conditions for doing business, the entrepreneurial attitudes,
activity and aspirations in The Republic of Macedonia?
In order to answer the questions the chapter first gives a literature review of the
concept , definitions and theoretical perspectives concernng entrepreneurship, the factors
which determine its development in a country, and the state of the entrepreneurship on the
territory of The Republic of Macedonia. Then, there is an elaboration of the features
Tanja Micalevska 77
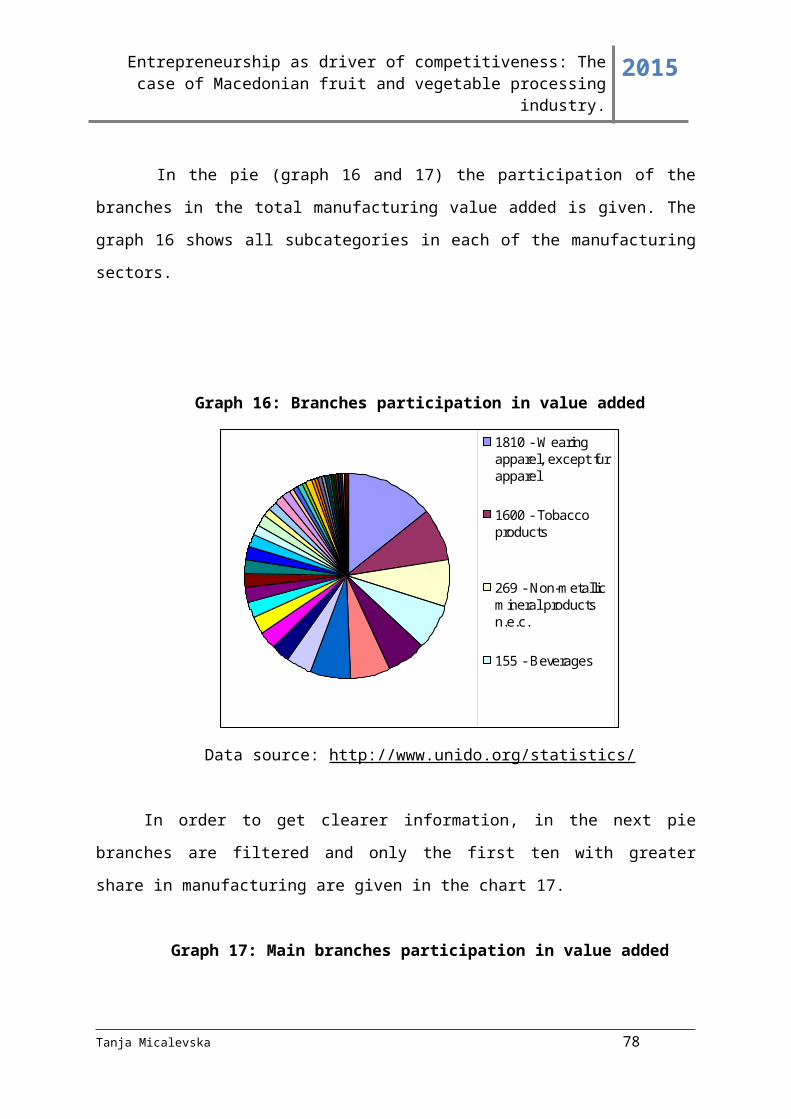
Entrepreneurship as driver of competitiveness: The case of Macedonian fruit and vegetable processing industry.
2015
distinguishing entrepreneurs from ordinary business owners and on each of the
entrepreneurial elements.
2.1 Literature review of the concept of entrepreneurship
Today, and generally in the last twenty years, there are many articles, books, papers
that treat the problem of entrepreneurship. However, that was not always so in economics.
There were times when entrepreneurs were not even considered as important. Since the first
introduction of the term entrepreneurship in the literature, done by the French economist
Cantillon, the interest for entrepreneurship was very low and almost insignificant. In this
early period, contributions for the discipline of entrepreneurship have had Jean Bathist Say,
John Stewart Mill, Karl Marks and Alfred Marshal, Frank Knight and Joseph Schumpeter.
Jean Bathist Say put the term “entrepreneur” in common usage, and distinguished the
entrepreneur from the capitalist. He defines entrepreneurs as people who organize resources
and accept risk by buying at certain and selling at an uncertain price. Say linked production
with creating utility, not just material goods. The utility is created by organizing three types
of factors labor, land and capital where the central role has the entrepreneur. (Stojkov,
Development of the economic thought, 2008)
John Stewart Mill, in the theory related to entrepreneurship, is known for introducing
the term entrepreneurs among British economists, and for integrating the risk taking and
managing in the entrepreneurial function.
Karl Marks tied the entrepreneurial function with active capitalists. According to him
there are two types of capitalists, the ones who earn by lending the capital they poses, and the
ones who reproduce the capital. Those who reproduce the capital earn the entrepreneurial
gains. (Taki Fiti, 2007)
Alfred Marshal treated entrepreneurs as one of the production factors and the profit as
income for entrepreneur’s capabilities to drive the production and distribution process, to
coordinate supply and demand on the market, and capital and labor within the firm. They
undertake risk and are innovators (Praag, 1999). He has explained the level of profit through
the demand and supply of entrepreneurial capabilities.
Frank Knight assumes that risk and uncertainty are the main factors which should be
considered in the economy. According to him, entrepreneurs are those individuals who take
Tanja Micalevska 78
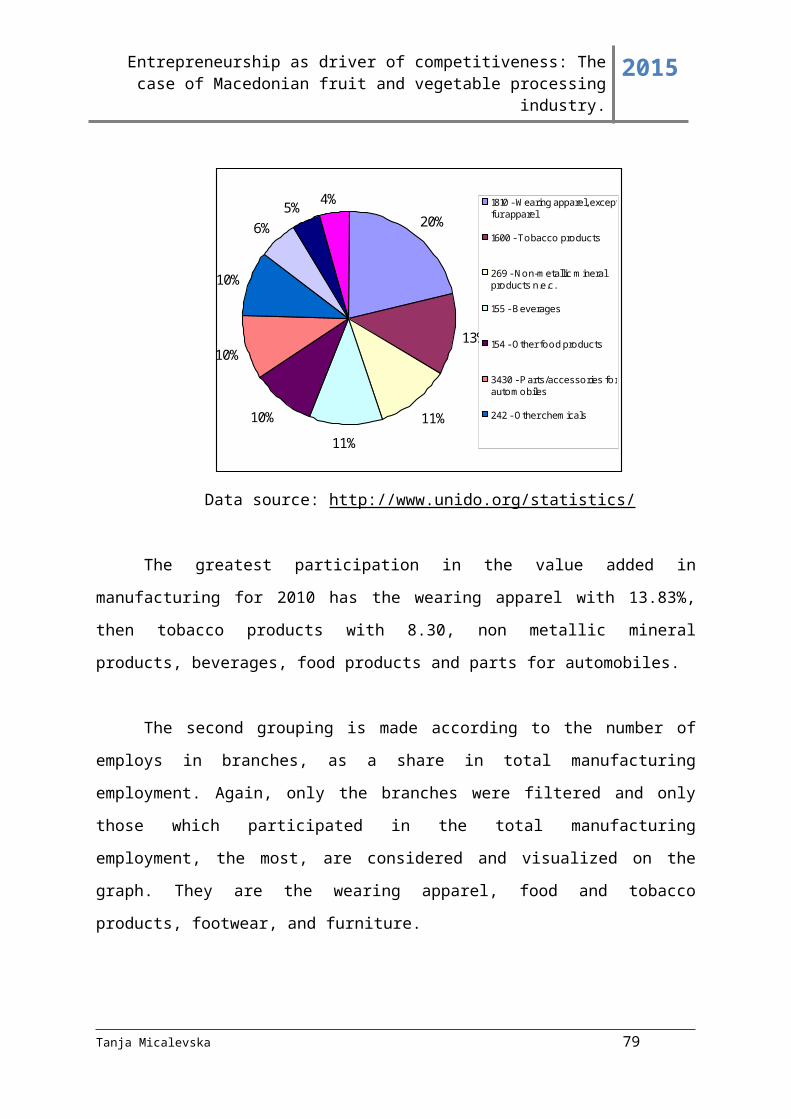
Entrepreneurship as driver of competitiveness: The case of Macedonian fruit and vegetable processing industry.
2015
actions in situations of uncertainty, who produce goods not by knowing, but by forecasting
the market needs and wants. Therefore, contrary to risk which can be predicted by former
events, uncertainty cannot be forecasted and entrepreneurs should be ready to bear the
uncertainty of losing in order to win profits. (Rocha, 2012)
The economist who has the main role in highlighting the significance of the
entrepreneurship is Joseph Schumpeter. He considers entrepreneurship as the name for
activities consisting of innovation. Innovation can be introduction of new products, new
methods of production, new markets, new materials or new type of organization. Those
individuals who create and implement new things create disequilibrium situation in the
economy, break from the routine, and earn higher profits than normal. The process of
destabilizing the equilibrium situation Schumpeter calls creative destruction (Schumpeter J.
A., 1939). Creative destruction is how new industries are created and economic growth can
be achieved. After Schumpeter, many other economists investigated entrepreneurship
offering similar or diametrically different premises.
One of the followers of Schumpeter’s ideas, who also consider entrepreneurship as
substantial factor in the economy, is William J. Baumol. He states that entrepreneurs can be
found in many different societies, investigates the societies, from ancient Rome till Japan,
and extends the theory by stressing the importance of the entrepreneurial activities’
allocation. If entrepreneurial activities are allocated in productive goals, they have positive
implication over growth. Anyway, they can be also allocated in unproductive or even
destructive goals. In this context, Baumol recommends creating conditions for productive
entrepreneurship to flourish (Baumol, 1990).
Peter Dracker is another name in the group of Schumpeter’s supporters and one of the
most significant scientists who has researched entrepreneurship. His focus is on entrepreneurs
as bringers of innovation (Drucker, 2006). According to him, in today’s rapidly changing
society only enterprises which perceive change as opportunity and innovate can be
successful. Innovations can arise from seven different sources, and he elaborates each of
them separately. The entrepreneurial spirit is crucial for managing the company, no matter of
its size.
Israel Kirzner, a researcher from the Austrian economics school, opposite to
Schumpeter, considers entrepreneurs as drivers of the equilibrium state in the economy. He
assumes that entrepreneurs do not have to be creative and invent new products or processes,
Tanja Micalevska 79
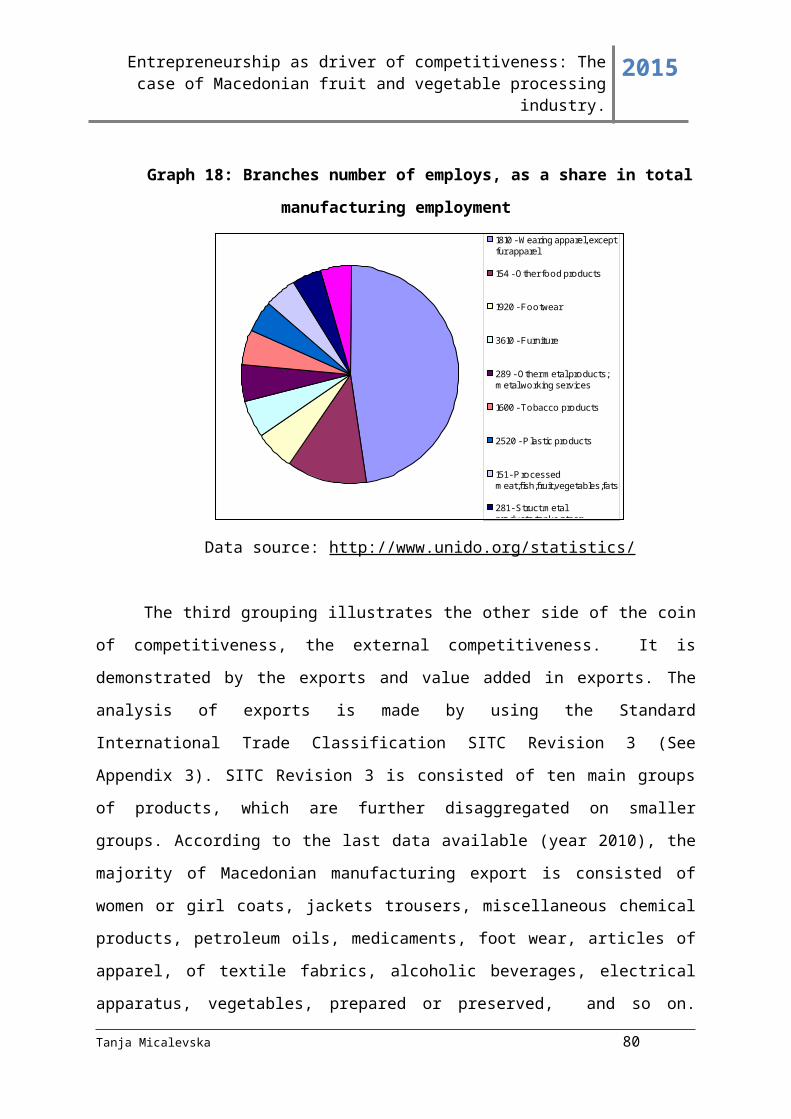
Entrepreneurship as driver of competitiveness: The case of Macedonian fruit and vegetable processing industry.
2015
but they should be alert to recognizing market changes that have already occurred. By
noticing them they can still produce already existing products and earn profits with arbitrage
on the price differentials (Kirzner, 2008). Thus, by competing for profits entrepreneurs drive
the market equilibrium.
In the contemporary theories for entrepreneurship, there are many different
approaches, but as some of the most cited, and consequently on that, most influential and
relevant, are the following names: Karl Vesper, Albert Shapero, Gifford Pinchot, Mark
Casson, Howard Aldrich and William B. Grathner.
Karl Vesper distinguishes the economics’, psychology’ and sociology’ definitions of
entrepreneurs. He points that entrepreneurs should have the core skills to sell products to
consumers, and ventures to venture capitalist. They should also have the emotional feature
readiness, for failure, as well as for success, in every instance of the entrepreneurial process.
Vesper declares that school is limited when it comes to entrepreneurial knowledge. There are
four types of knowledge: general entrepreneurial knowledge, generalized business
knowledge, opportunity specific knowledge and venture specific knowledge. The last two are
learned on the market, rather than in schools (Goossen, 2008).
Albert Shapero views the entrepreneur as initiator, risk taker and person who has
internal locus of control. The development of the entrepreneurship is influenced by social and
economic factors (Taki Fiti, 2007). Gifford Pinchot presents the intrapreneur, as a person
employed in a big company, who acts entrepreneurially. Even through, the intrapreneur
works for salary, he still poses the entrepreneurial spirit and way of managing (Viramgami,
2007). McClelland stresses the need for achievement and the need for power as main
characteristics of entrepreneurs. He link entrepreneurs with setting realistic but challenging
goals (McClelland, 2010).
Mark Casson tries to create theory of entrepreneurship by synthesizing the previous
theories. He goes through them, analyses their strengths and weaknesses, and points out the
common characteristic in theories, which makes entrepreneurs, to be entrepreneurs. That
characteristic is the judgment. In his view, entrepreneurs are making judgmental decisions
about the coordination of scare resources, when there is no given decision making model and
the information is incomplete. Casson’s entrepreneurs process information in order to resolve
new and complex problems. Their motivation lays in profits, especially if profits are greater,
and in personal characteristics (Casson).
Tanja Micalevska 80

Entrepreneurship as driver of competitiveness: The case of Macedonian fruit and vegetable processing industry.
2015
Howard Aldrich takes an evolutionary approach to entrepreneurship. He writes about
the need of better entrepreneurial theory. In his articles, he studies small firms, more
concretely, start ups, family business, gender differences in startups, and the role of the social
networking for the new ventures (Aldrich, 2012).
William B. Grathner explains new venture creation from one side and entrepreneurial
behavior on the other. He tries to enrich the theoretical base of entrepreneurship and has
published a lot of influential articles concerning the features of entrepreneurs, entrepreneurial
organizations and the skills for starting a venture (Gartner, 2009).
At last, the development of the theories and state of the art in entrepreneurship is
completed with a summary of definitions referring the entrepreneurship and the entrepreneur.
They are given in the Table 14.
Table 14: Definitions on entrepreneurship
Definition Citation Ellements
Entrepreneurs buy at certain
prices in the present and sell at
uncertain prices in the future.
The entrepreneur is a bearer of
uncertainty.
(Cantillon, 1755/1931)
(Seymour)
Risk and uncertanity
Entrepreneurs attempt to predict
and act upon change within
markets. The entrepreneur bears
the uncertainty of market
dynamics.
(Knight, 1921) (Seymour) Uncertanity
“Entrepreneurs carry out new
combinations by such things as
introducing new products or
processes, identifying new
export markets or sources of
supply, or creating new types of
Joseph Schumpeter (1934)
(Schumpeter J. , 1934)
Innovation
Tanja Micalevska 81

Entrepreneurship as driver of competitiveness: The case of Macedonian fruit and vegetable processing industry.
2015
organization”
“An entrepreneur is a kind of
person willing to put his carrier
and financial security on the line
and take risks in the name of an
idea, spending much time as
well as capital on an uncertain
venture with an uncertain
outcome”
Peter Drucker (1970) (Drucker,
2006)
Risk and innovation
Entrepreneurship consist of the
competitive behaviors that drive
the market process
Kirzner (1973) (Davidsson,
2004)
Market approach
“Entrepreneurs are specialists
who use judgment to deal with
novel and complex problems.”
Casson(1982) (Casson) Innovation
Entrepreneurship is the creation
of new organizations
Gartner(1988) (David Stoks,
2010)
Innovation
Entrepreneurship is the process
in which individuals – either on
their one or inside organizations
– pursue opportunities without
regard to the resources they
currently control
Stivenson and Jarlio (1990)
(David Stoks, 2010)
Opportunity recognition and
resource managing
Entrepreneurship is the manifest
ability and willingness of
individuals, on their own, in
teams, within and outside
existing organizations, to
perceive and create new
economic opportunities (new
products, new production
Wennekers and Thurik (1999)
(David Stoks, 2010)
Innovation, opportunity
recognition, risk taking and
resources managing
Tanja Micalevska 82

Entrepreneurship as driver of competitiveness: The case of Macedonian fruit and vegetable processing industry.
2015
methods, new organizational
schemes and new products
market combinations) and to
introduce their ideas in the
market, in the face of
uncertainty and other obstacles,
by making decisions on
location, form and the use of
resources and institutions.
Entrepreneurship is the
introduction of new economic
activity that leads to change in
the marketplace
Simon in Sarasvathy (1999) Innovation and market
approach
“the process by which
„opportunities to create future
goods and services are
discovered, evaluated and
exploited‟”
S. Shane and S. Venkataraman
(Christopher J. Collins,
2005)
Opportunities recognition
Entrepreneurship is the process
of creating something new of
value, by devoting the necessary
time and effort, assuming the
accompanying financial ,
psychic and social risks, and
receiving the resulting rewards
of monetary and personal
satisfaction and independence
Hirish and Peters (2002) (David
Stoks, 2010)
Innovation, risk taking
Entrepreneurship is a way of
thinking, reasoning and acting
that is opportunity based,
holistic in approach and
leadership balanced.
Timmons and Spinelli (2004)
(David Stoks, 2010)
Opportunity recognition,
innovation
Tanja Micalevska 83

Entrepreneurship as driver of competitiveness: The case of Macedonian fruit and vegetable processing industry.
2015
Entrepreneurship results in the
creation, enhancement,
realization and renewal of value
not just for the owners but for
all participants and shareholders
“Any attempt at new business or
new venture creation, such as
self-employment, a new
business organization, or the
expansion of an existing
business, by an individual, a
team of individuals, or an
established business.”
Bosma, Wennekers & Amorós,
(2012) (Siri Roland Xavier,
2012)
Innovation
“Entrepreneurship is the
mindset and process to create
and develop economic activity
by building risk-taking,
creativity and/or innovation
with sound management, within
a new or an existing
organization”
Green paper on
Entrepreneurship in Europe
(2003) (comunitie, 2003)
Risk taking and innovation
Entrepreneurship and entrepreneurs have been defined in research works from many
disciplines, and a number of theories and methodologies have been developed to explain the
concepts. Among the most influential researchers and entrepreneurship related works stand
out the following authors/books:
Schumpeter, J. (1934), Theory of economic development, Cambridge, MA: Harvard
University Press.
Knight, F (1921) Risk, Uncertainty and Profit, Chicago, IL: University of Chicago
Press
Schumpeter, J (1942), Capitalism, Socialism and Democracy, New York: Harper and
Brothers.
Tanja Micalevska 84

Entrepreneurship as driver of competitiveness: The case of Macedonian fruit and vegetable processing industry.
2015
Bhidé A (2000) The Origin and Evolution of New Businesses, New York: Oxford
University Press.
Kirzner, I (1973) Competition and Entrepreneurship, Chicago, IL: University of
Chicago.
McClelland, D (1961) The Achieving Society, Princeton, NJ: Van Nostrand.
Apart from the books, in the field of entrepreneurship, there have been published
papers and in the most cited journals such as: The Strategic Management Journal, Research
Policy, Academy of Management Journal, Small Business Economics, Academy of
Management Review, Journal of Business Venturing and Journal of Management Studies.
Also there are reports exploring different aspects of entrepreneurship among which
are: The Doing Business Report, The Global Entrepreneurial Report, and The
Entrepreneurship at Glance etc.
The Doing Business Report is published by The World Bank, investigates the
business climate in countries, or more concretely the legal requirements for
opening and doing business.
The Global Entrepreneurial Report investigates the entrepreneurial activity,
aspirations and attitudes in different countries in the world.
The Entrepreneurship at Glance published by the OECD Eurostaat
Entrepreneurship Indicators Program which measures the state of
entrepreneurship.
However, despite the popularity of the concept and all the works, still, there is not a
clear and generally accepted view on entrepreneurship. The trth is that if we try to define it
only by considering one aspect of entrepreneurship, we will limit it. Therefore, in this study
entrepreneurship will be researched as a system2 of elements.
From the definitions in table 14, one can notice that the most common mentioned
elements connected with entrepreneurship are: identifying opportunities, creating and
implementing innovations, taking risks, managing resources and orienting to the market.
Nevertheless, the system does not exist in an isolation, and it is affected by external factors,
2 “ a regularly interacting or interdependent group of items forming a unified whole” http://www.merriam-webster.com/dictionary/system
Tanja Micalevska 85

Entrepreneurship as driver of competitiveness: The case of Macedonian fruit and vegetable processing industry.
2015
such as the business environment (legislative, infrastructure), the entrepreneurial culture and
networking among firms.
The main entrepreneurial elements and the external factors which influence over the
development of entrepreneurship are given in Figure 4, and explained in depth in the
following sub chapters.
Figure 4: Conceptual framework of entrepreneurship
Author’s framework
2.2 The determinants of entrepreneurial activity in a country
The figure 4 illustrates the elements of entrepreneurship and the external factors
which influence over its development. Even through determinants of entrepreneurship are
diverse, mainly they can be arranged into three major groups as follows:
Business climate
Entrepreneurial education
Tanja Micalevska 86

Entrepreneurship as driver of competitiveness: The case of Macedonian fruit and vegetable processing industry.
2015
Networking
The business climate
The business climate presents the macroeconomic environment, the legal system,
monetary and fiscal policies, institutions and labor force characteristics. In the simpliest
terms, as the weather conditions, sunny, cloudy or rainy, determine the harvesting, the
business environment patterns determine the capacity of businesses to progress.
The characteristics of the weather are measured with the temperature, the air pressure,
the humidity, and in the case with business climate the measures are more complex and
various. One of the widely accepted sources of information and measure, about the business
climate, is the Doing Business Report (Doing business). The main goal of the report is to
show where the country stands among other included countries benchmarked by the legal
requirements and regulative concerning businesses. The Doing Business Report was first
published in the year 2003 and contained 133 economies ranked by 5 indicators. Until today,
the scope of the report has been broaden and contains 185 countries which are ranked by 11
indicators. Each of the pillars measures different aspect of the business environment. They
are described below (Doing business).
The first pillar is named starting a business and is related with the number of
procedures, and the licenses needed for registration and starting a business. It also
counts the time needed, measured in days, the cost for all the official payments for
professional and other services, and, the minimum capital required to be paid before
registration.
The second refers to dealing with construction permits. It measures the time and cost
for obtaining all the necessary documents such as licenses, permits, certificates for
construction a warehouse and getting water, telephone connections.
Getting electricity is the third indicator. It shows the ease, the time and cost necessary
to connect to the electricity connection and permanently receive electricity. This is
linked with regulative procedures, electricity utilities and distribution.
The fourth pillar, registration of the property, includes the whole sequence of phases
and required documents that the owner should obtain to register the property.
Tanja Micalevska 87

Entrepreneurship as driver of competitiveness: The case of Macedonian fruit and vegetable processing industry.
2015
Getting credit is acknowledged as a very important aspect of the ease of doing
business in a country. Better access to finance for companies, means less barriers for
realizing ideas. However, access to finance depends from many factors, among which
the Doing Business Report takes into consideration the protection of the legal rights
of borrowers and lenders on one hand, and the development of the credit information
system on other. The protection of the legal rights of the parties included is
determined by laws, especially collateral and bankruptcy laws. The availability of
credit information, their scope and coverage is measured with data from public or
private credit bureaus.
Protecting investors is an indicator that measures the rights of the shareholders with
minority participation in the capital, concerning the company operations. The
indicator contains three types of rights: stakeholders should have access to all the
relevant documents about transactions of their interest, they may ask for legal
remedies if directors cause some damages, and they have a right of disclosure and
approval.
Paying taxes is about all the taxes and contributions companies should pay. Their
number, level, and way of paying, varies among countries. The faster all procedures
for preparing files and paying are, the smaller their number and their size as a percent
of profits, the better the country is in this field.
The next parameter is trading across borders. It includes recording of all the
documents, the time and the cost, for importing or exporting goods from one country
to another.
Enforcing contracts includes all the procedures, time and cost for resolving disputes
among companies. It shows the efficiency of the judiciary, starting from the moment
when the case is submitted, till the enforcement of the court’s decision.
Resolving insolvency is another important issue. It happens in case when firms are not
in a condition to recover their money, because some of their partners are not able to
meet their obligations, close the business, or for any other reason cannot pay their
debts.
All indicators are given as ranks, and together, they give information about the overall
business climate of a country in comparison with other countries. If the rank of the country is
lower, the regulative climate is better. Countries are ranked on an annual base, so every
Tanja Micalevska 88

Entrepreneurship as driver of competitiveness: The case of Macedonian fruit and vegetable processing industry.
2015
improvement or worsening from year to year, and from country to country can be noticed.
However, ranks give relative information and are dependent between each other. Thus, the
change in the rank of one country can be a result not only from changes in its own regulatory
environment, but also from changes in other countries’ conditions. Hence, the improvement
in the economy’s rank over time does not always have to illustrate advancement in its
business environment (Nikolovski & Micalevska, 2012).
In this research, the Doing business report is used to measure the business climate in
Macedonia, its ranking in the investigated period, the changes through time in every
particular segment, and its place on the ranking list among Western Balkans and EU
countries. The Republic of Macedonia in 2013 takes the 23 position, which is a relatively
good position, and indicates that the business environment is favorable. Opening and
managing business in the country is easier than in all Western Balkans and some EU
countries. That is illustrated on the graphs.
Graph 24 shows that The Republic of Macedonia is far better destination for business
than Bosnia and Herzegovina, Kosovo, Serbia and Albania, but also from Montenegro and
Croatia. Moreover, there are separate graphs, where The Republic of Macedonia is compared
with Western Balkans, in every aspect, from starting a business until resolving insolvency.
(See graphs: 21,22,23,24,25,26,27,28,29,30). Thus, it is obvious that The Republic of
Macedonia’s business environment is better than the regional average, in the areas: starting a
business, dealing with construction permits, and paying taxes.
Graph 21: Western Balkan countries ranks – Ease of Doing Business
Ease of Doing Business Rank
0
20
40
60
80
100
120
140
Macedonia,FYR
Montenegro Croatia Albania Serbia Kosovo Bosnia andHerzegovina
Бројка 1
Tanja Micalevska 89

Entrepreneurship as driver of competitiveness: The case of Macedonian fruit and vegetable processing industry.
2015
Source: data from the webpage: http://www.doingbusiness.org/
Graph 22: Western Balkan countries ranks – Starting a business
Starting a Business - Rank
020406080
100120140160180
Macedonia,FYR
Montenegro Albania Croatia Serbia Bosnia andHerzegovina
Kosovo
Source: data from the webpage: http://www.doingbusiness.org/
Graph 23: Western Balkan countries ranks: Dealing with construction permits
Dealing with Construction Permits - Rank
020406080
100120140160180200
Macedonia,FYR
Croatia Bosnia andHerzegovina
Kosovo Montenegro Serbia Albania
Source: data from the webpage: http://www.doingbusiness.org/
Tanja Micalevska 90
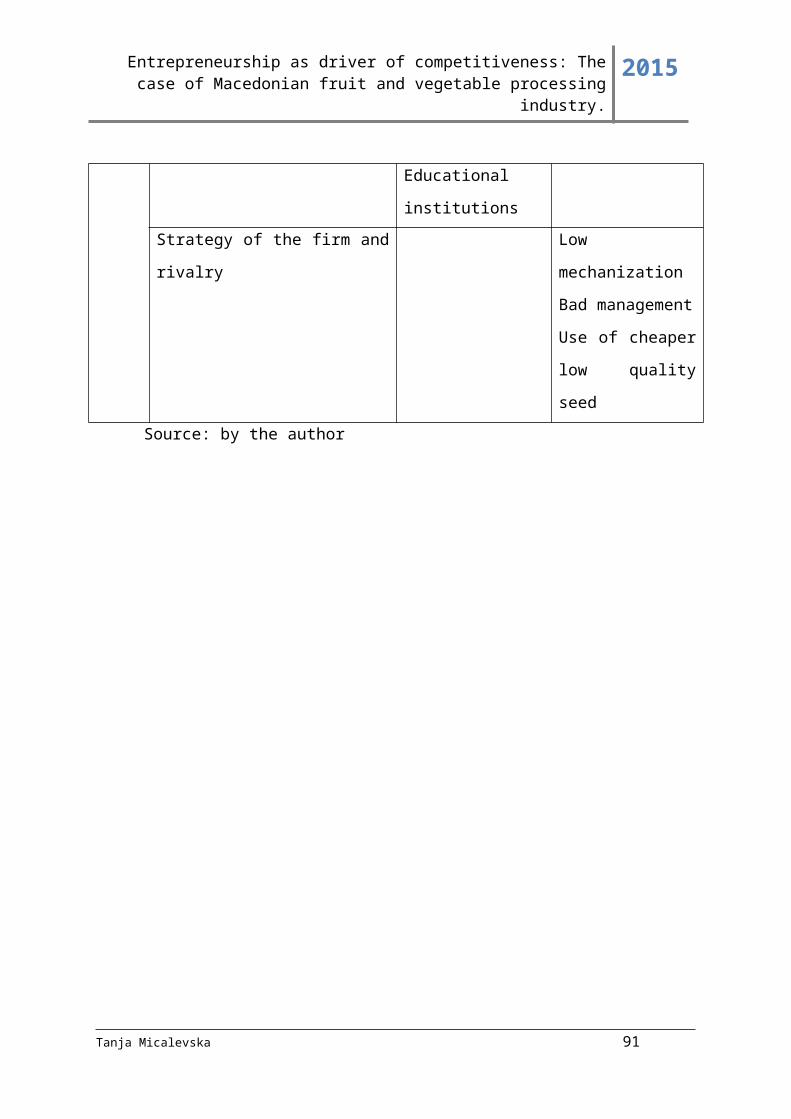
Entrepreneurship as driver of competitiveness: The case of Macedonian fruit and vegetable processing industry.
2015
Graph 24: Western Balkan countries ranks- Getting electricity
Getting Electricity - Rank
020406080
100120140160180
Croatia Montenegro Serbia Macedonia,FYR
Kosovo Albania Bosnia andHerzegovina
Source: data from the webpage: http://www.doingbusiness.org/
Graph 25: Western Balkan countries ranks- Registering property
Registering Property - Rank
0
20
40
60
80
100
120
140
Serbia Macedonia,FYR
Kosovo Bosnia andHerzegovina
Croatia Montenegro Albania
Source: data from the webpage: http://www.doingbusiness.org/
Graph 26: Western Balkan countries ranks- Getting credit
Getting Credit - Rank
01020
30405060
7080
Montenegro Serbia Macedonia,FYR
Kosovo Albania Croatia Bosnia andHerzegovina
Source: data from the webpage: http://www.doingbusiness.org/
Tanja Micalevska 91

Entrepreneurship as driver of competitiveness: The case of Macedonian fruit and vegetable processing industry.
2015
Graph 27: Western Balkan countries ranks- Protecting investors
Protecting Investors - Rank
020406080
100120140160180200
Albania Macedonia,FYR
Montenegro Serbia Bosnia andHerzegovina
Croatia Kosovo
Source: data from the webpage: http://www.doingbusiness.org/
Graph 28: Western Balkan countries ranks- Paying taxes
Paying Taxes - Rank
02040
6080
100120
140160
Macedonia,FYR
Croatia Kosovo Montenegro Bosnia andHerzegovina
Serbia Albania
Source: data from the webpage: http://www.doingbusiness.org/
Graph 29: Western Balkan countries ranks- Trading across borders
Trading Across Borders - Rank
0
20
40
60
80
100
120
140
Montenegro Macedonia,FYR
Albania Serbia Croatia Bosnia andHerzegovina
Kosovo
Source: data from the webpage: http://www.doingbusiness.org/
Tanja Micalevska 92

Entrepreneurship as driver of competitiveness: The case of Macedonian fruit and vegetable processing industry.
2015
Graph 30: Western Balkan countries ranks- Enforcing contacts
Enforcing Contracts - Rank
020406080
100120140160180
Croatia Macedonia,FYR
Albania Serbia Bosnia andHerzegovina
Montenegro Kosovo
Source: data from the webpage: http://www.doingbusiness.org/
Graph 31: Western Balkan countries ranks- Resolving insolvency
Resolving Insolvency - Rank
0
20
40
60
80
100
120
Kosovo Montenegro Macedonia,FYR
Albania Bosnia andHerzegovina
Croatia Serbia
Source: data from the webpage: http://www.doingbusiness.org/
Graph 31 presents the rank of The Republic of Macedonia compared with EU
countries. As illustrated, The Republic of Macedonia has easier regulations for doing
business than 21 EU countries among which Belgium, Netherlands, Austria, France,
Slovenia, Cyprus, Spain, Malta, Croatia, Greece, Italy, Romania, Bulgaria, Czech Republic,
Luxemburg, Poland, Hungary, Slovak Republic. On the other side, Denmark, United
Kingdom, Finland Sweden, Ireland, Germany and Estonia have better business legislative for
business than The Republic of Macedonia.
Graph 32: The Republic of Macedonia and EU – Ease of Doing Business
Tanja Micalevska 93

Entrepreneurship as driver of competitiveness: The case of Macedonian fruit and vegetable processing industry.
2015
Ease of doing business EU and Macedonia
0
20
40
60
80
100
120
Source: data from the webpage: http://www.doingbusiness.org/
From the all the above, it can be concluded that the regulations in The Republic of
Macedonia are favorable. Anyway, they can be further improved. In order to identify the
fields for improvements, and offer some solutions first, the indicators are presented in a radar
chart which illustrates the strengths and weaknesses of The Republic of Macedonia’s
regulative and institutional framework that creates the business conditions.
Graph 33: Radar chart – Doing business
Tanja Micalevska 94
Entrepreneurship as driver of competitiveness: The case of Macedonian fruit and vegetable processing industry.
2015
Source: data from the webpage: http://www.doingbusiness.org/
As shown on Graph 33, the most favorable business condition, in The Republic of
Macedonia, is starting a business. This can be done fast, with only two procedures, low cost
and there are no requirements for paying minimum capital. Another is the protection of
investors, which by itself reflects that shareholders are informed, and there exists a disclosure
of materials and liability of the directors, which makes self dealing restricted. Getting credit
indicator gives information that lenders and borrowers have access to credit information from
public credit registry and private bureau, they are legally protected, and the collateral registry
is in operation. Paying taxes is another good side, because the process of complying with tax
and contributions obligations including filling, preparing and paying them is easy for firms,
tax rates are low and there are some tax exemptions and relives for investors.
On the other side, getting electricity, trading across borders and dealing with
construction permits are the fields with the main weaknesses and some reforms should be
undertaken in these areas. By using the Doing Business Simulator, I make some simulations,
how the improvements in these specific fields will affect the business climate and point out
their effect on the overall ranking of the country.
Tanja Micalevska 95
Entrepreneurship as driver of competitiveness: The case of Macedonian fruit and vegetable processing industry.
2015
Getting electricity indicator shows that the procedures, time and cost from the
moment of the application, until the moment of obtaining electricity are many. If the number
of procedures from five is reduced at four, and the time needed is cut at 120 days instead of
150, then the rank for ease of getting electricity may improve the overall rank on the country
at the 21 position.
The second indicator where the patterns are unfavorable is trading across borders. We
simulate lowering the number of documents needed from 6 to 4 and the days from 11 at 10.
The result from this scenario is improving the overall rank at the 22 position.
The third simulation is about the field dealing with construction permits. By cutting
the days needed for dealing with construction permits, from 117 to 110, and the number of
procedures, from 10 to 9, the overall rank of the country will advance.
Simulations can be made on other topics, as well as comparisons among counties and
through time. However, even though the report gives us valuable information about the
business climate in a country, we must not deliver conclusions about the business in reality
only by taking into consideration data from The Doing business report. The reasons for this
are:
The Doing business report can be misinterpreted because many factors which
influence the business climate are not included in the topics that compose the
index. Therefore, the report measures only regulations included in its
methodology, while others regulations relevant for businesses which are not
included may have greater influence than the ones taken into consideration.
If governments guided by the Doing business report focus their attention on
implementing policies that will improve the country ranking, they may miss to
eliminate some other constraints for businesses, and deliver satisfactory
business climate on paper, but far from favorable in practice.
The data collection process should be improved because inaccuracy in primary
data, may distort the image about countries real performances.
The report is based on the principle “one size fits all”, and uses the same
evaluation process for developed and developing countries. However, this
approach may do more harm than good, when calculating the rankings and
when comparing them.
Tanja Micalevska 96

Entrepreneurship as driver of competitiveness: The case of Macedonian fruit and vegetable processing industry.
2015
The ranks are interdependent and the change in the rank of one country results
not only from changes in its own regulatory environment, but also from
changes in other countries’ conditions. Therefore, we may observe
improvement in some country rank over years, without necessary existence of
real improvements in its business environment, or even when there is
worsening in its conditions for doing business.
The entrepreneurial education
The entrepreneurial education is a process aimed to raise the awareness for
entrepreneurship, prepare learners for creative and critical thinking, and introduce them with
methods to entrepreneurship. Traditionally, the role of entrepreneurial education has been
underestimated, but, today it is accepted as one of the crucial elements for creating
entrepreneurial friendly environment.
In that context, beside knowledge and skills in business, entrepreneurship education is
aimed to develop beliefs, values, and attitudes among students, to consider entrepreneurship
as an attractive and valid alternative to employment or unemployment (Mário Raposo, 2011).
Apart from creating entrepreneurial mindsets which should result with new ventures
establishment, other objectives of the entrepreneurial education are continually developing
entrepreneurial capabilities and knowledge, and improving entrepreneurial performance on a
long run.
Linan (2004) distinguishes four kinds of entrepreneurship education programs (Lorz,
2011).
"Entrepreneurial Awareness Education" program with an objective to influence
attitudes that may impact intentions.
"Education for Start-Up" for people who have entrepreneurial ideas and need practical
skills and knowledge to realize them.
"Education for Entrepreneurial Dynamism" program for entrepreneurs who have
already been through the start-up phase.
"Continuing Education for Entrepreneurs" programs for experienced entrepreneurs.
Tanja Micalevska 97

Entrepreneurship as driver of competitiveness: The case of Macedonian fruit and vegetable processing industry.
2015
Entrepreneurial education programs, according to Vesper and McMullan, have two
crucial differences: the capacity quickly to exploit a business opportunity and the capacity to
plan in greater detail and schedule further in the future (Karali, 2013).
Researchers make distinction between entrepreneurial education and business
management education. The main differences are illustrated in the figure 1 (Alexandria
Valerio, 2014).
Figure 5: Business management education versus entrepreneurial education
Source: (Alexandria Valerio, 2014)
The entrepreneurial education can be formal or informal. Both types are important
and should complement each other.
The formal education includes school education primary, secondary, and higher
education. Most researches are mainly focus on the university level education (e.g., Raposo,
Ferreira, Paço, & Rodrigues, 2008; Sánchez, 2009) or in the secondary school (e.g., Paço,
Ferreira, Rodrigues, & Dinis, 2008; Rodrigues, Dinis, Paço, & Ferreira, 2008) (Mário
Raposo, 2011). However, it is recommendable this process to begin even in primary school.
In the primary school, entrepreneurship education can help children to be creative,
responsible and initiative from the youngest age. Unfortenately, in primary schools, there is
no separate subject for entrepreneurship. Anyway, it is present to some extent and integrated
in other subjects, mostly as a part of social sciences subjects (Entrepreneurship education at
school in Europe, National Strategies,Curricula and Learning objectives, 2012). Unlike
Tanja Micalevska 98
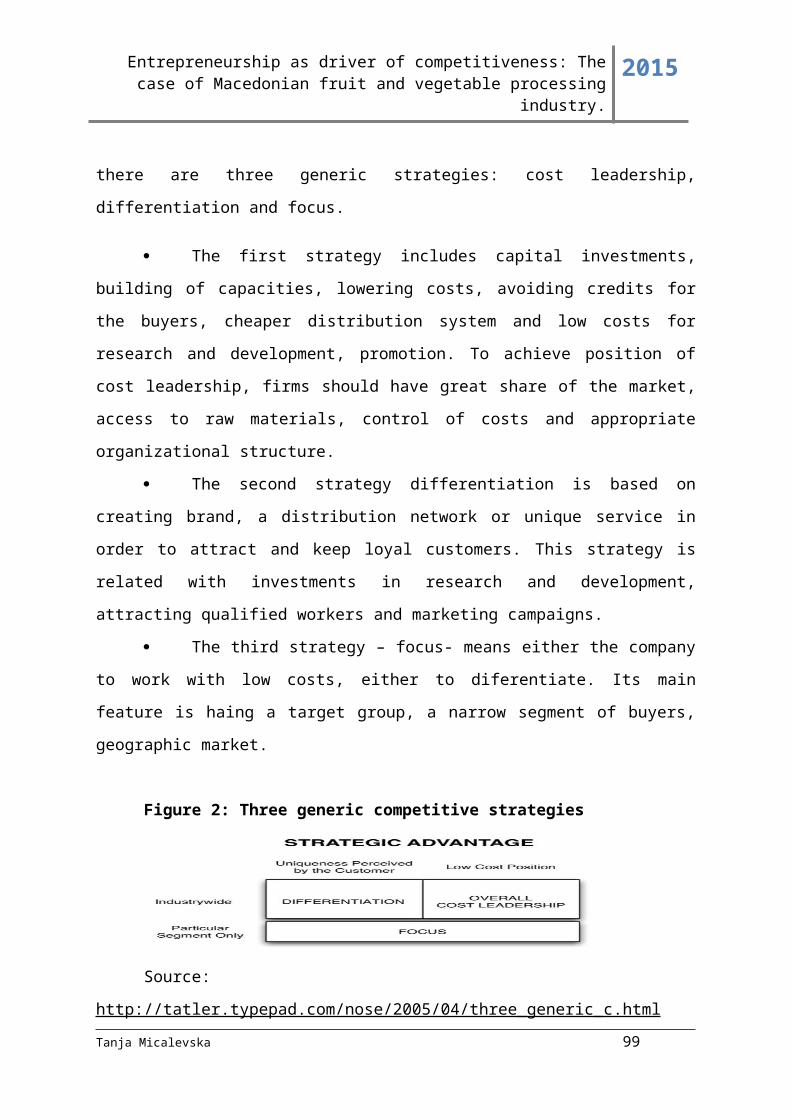
Entrepreneurship as driver of competitiveness: The case of Macedonian fruit and vegetable processing industry.
2015
primary schools, secondary schools offer entrepreneurship classes, in obligatory and optional
subjects. Thus, pupils are learned the required skills for starting a company and encouraged
to devote on practical activities. Lately, efforts are made worldwide, to boost the
entrepreneurial education from the early age in primary and secondary schools.
The situation in higher education is similar. Even through, there are Universities that
offer programs related with entrepreneurship, they are primarily in business, management and
economics faculties, while in other faculties there are elective business courses (Marika
Baseska - Gjorgjieska, 2012). The studies in universities are organized in three levels: first,
second and third cycle. There are different kinds of programs but mostly, first and second
cycle programs aim to teach students how to start a business, to managed it, to find resources,
to innovate. Third cycle is more research oriented and aims to create entrepreneurship
teachers who will further share entrepreneurship practices and trainings.
The informal entrepreneurial education and training is equally important as the
formal. It can be organized by different institutions including Small business development
centers, Business incubators; Alumni outreach programs, manufacturing assistance centers
etc. This kind of obtaining an entrepreneurial knowledge is usually on a voluntary base, and
is oriented to develop practical skills for the needs of real world entrepreneurs.
Informal entrepreneurial education beneficiaries are different groups such as young
people who are unemployed and want to improve their skills and competencies, entrepreneurs
who are already working and facing the businesses challenges, people who have obtained
education through the formal education process and are willing to upgrade it with practical
skills, marginalized groups including women who are interested in opening their own
businesses and other interested parties.
The flexibility of informal entrepreneurial educaton and its availability for people
with different backgrounds, in different regions, and timings, and at lower price than fomal
education are the main strengths of informal entrepreneurial education and training.
However, there are many others advantages of informal entrepreneurial education among
which are the promotion of innovations and risk taking attitudes, the proactive approach to
self-employment and economic independence, its orientaton to the practical component of
the job and the offer of solutions for real business problems, the networking opportunities
and the follow up activities to implement what is learned, as well as the resources and new
technologies effective utilization.
Tanja Micalevska 99

Entrepreneurship as driver of competitiveness: The case of Macedonian fruit and vegetable processing industry.
2015
Regardless of the strengths, this kind of education has its limitations such as lack of
accredited institution standing behind and offering a particular degree or certification, the
narrow range of skills with little or no theoretical base, and the lack of modern technologies
in the process of learning. Other limitations are the lower discipline compared with formal
education, lack of specific criteria for evaluation and comparation of the progress of learners.
In order to achieve better results, providers of formal and informal education and
training anywhere should collaborate between each other. The effectiveness of the programs
will be beneficial if they are in an integrative framework. Therefore, policymakers in
European countries have undertaken many initiatives for promoting entrepreneurship in
systematic way, by adopting documents as: The European Agenda for Entrepreneurship3
adopted in 2004, Small Business act for Europe4 adopted in 2008, The Entrepreneurship 2020
Action Plan5 adopted in 2012.
On the basis on European strategic documents, in The Republic of Macedonia was
developed Entrepreneurial learning strategy which covers the following five main pillars:
creating awareness about entrepreneurial learning, continuously developing teachers, using
the state-of-the-art technology in implementing entrepreneurial learning, sharing best
practices for implementation of entrepreneurial learning and cooperating on international
level (Radmil Polenakovik, 2014).
3 ftp://ftp.cordis.europa.eu/pub/incubators/docs/action_plan_on_entrepreneurship.pdf4 http://eur-lex.europa.eu/LexUriServ/LexUriServ.do?uri=COM:2008:0394:FIN:EN:PDF5 http://eur-lex.europa.eu/LexUriServ/LexUriServ.do?uri=COM:2012:0795:FIN:EN:PDF
Tanja Micalevska 100
Entrepreneurship as driver of competitiveness: The case of Macedonian fruit and vegetable processing industry.
2015
Figure 6: Entrepreneurial learning strategy
2
Source: http://www.mon.gov.mk
In The Republic of Macedonia, formal entrepreneurial education has been
implemented in the educational system in primary, secondary and all three cycles of tertiary
education. In the primary education implementing of entrepreneurial education is some
subject is ongoing. In the secondary education there are business related subject since the
period after 2000, Entrepreneurship in higher education is established as a course in almost
all Universities at a bachelor level, half of them on master level and at a doctoral level on the
Faculty of economics in Prilep, starting from 2012.
Informal entrepreneurial education in The Republic of Macedonia is less developed.
Although, there are institutions that offer trainings, and there is interest among managers of
SME’s to obtain trainings for entrepreneurship, the presense of this type of education is low.
The reason for the low evel of use of informal education in The Republic of Macedonia is the
limited financial resources of SME’s managers who consider the trainings expensive and with
low quality.
Tanja Micalevska 101
Entrepreneurship as driver of competitiveness: The case of Macedonian fruit and vegetable processing industry.
2015
Clustering and networking
Clustering and networking among firms determines the development of
entrepreneurship by providing knowledge, services and finance for enterprises from the
cluster or the network. By clustering and networking companies support each other and
receive assistance from institutions. The benefits lay in expansion of the markets,
participation in larger projects, reduction of risks by dividing the cost for research and
development, easier access to finance etc.
Clusters are focused on a specific geography, oriented towards a set of related
industries, and they provide a structure for actual collaboration (Ketels, 2012). Clustering
considers the availability of adequate resources for creating entrepreneurial initiative
(Bianchi, 2010). Therefore, it is a resource based approach for linking firms in a given region
which collaborate, exchange information, knowledge, services. Clusters also include
supporting organizations, agencies for developing of entrepreneurship, chambers of
commerce and other institutions aimed to help companies by offering different services and
know- how. However, to create the needed critic mass of resources ready for exploiting takes
a long period, so they are inappropriate for considering situations that have not yet happened.
Networks of firms may or may not be confined to a specific geographical location and
set of industries. They are created for active collaboration which can be open-ended or
focused on a specific project task (Ketels, 2012). Networking is related with initial idea on
which actors and supporters focus their resources, create and spread a net of links between
new business, their customers and suppliers (Massimo Bianchi, 2009). The most important
element in networking is exploring for and creating links, it takes less time to create the
network, and fewer resources at the beginning. The links are called ties and can be weak,
among business partners that do not cooperate so much, and strong ties among long term
partners who have built mutual trust. The network provides formal knowledge in database in
the net that can match supplies/demands. Also, there are spillovers of informal knowledge.
Networking is not limited on a given region which makes it more suitable in today’s
globalizing and information society.
The main characteristics, similarities and differences among clustering and
networking approaches are shown in the Table 15.
Tanja Micalevska 102

Entrepreneurship as driver of competitiveness: The case of Macedonian fruit and vegetable processing industry.
2015
Table 15: Clustering and networking approaches characteristics
Aproach Clustering Networking
Definition Traditional methods which
consider the availability of
adequate resources to
create entrepreneurial
initiative.
Start up comes form initial
idea (NGO, public project)
on which actors and
supporters focus their
resources with target to
spread a net of links with
customers and suppliers.
Model
Resource based Net based
Aproach to entreprise
creation
Push Pull
Assets Tangible assets Intangible assets (quality
and quantity of contacts)
The start up determinants The level of critic mass of
resources
The critic time span to
build stable relationships
amnog entities
Information support It comes from agencies for
developmet in order to
enrich the offer of services
Demand expressed by
people who go to offices
expecting concrete help
Knowledge Geathered information and
put inside the cluster as
know how
The knowledge is in the
net waiting to be used
Being up to date Not being up to date,
innapropriate for situations
that did not happen yet
Formal knowledge
databases, infomal
knowledge spillovers
Source: author’s summary and classification on the basis on sources:
Tanja Micalevska 103

Entrepreneurship as driver of competitiveness: The case of Macedonian fruit and vegetable processing industry.
2015
Figure 7: Clustering and networking
– Clustering and Networking approaches
.Networking .Clustering
Source:(Bianchi, 2010)
The concepts of Clustering and Networking, in the last years have been acknowledged
by public policy makers, who have introduced interventions programs and projects to
facilitate firm’s linkages. Among them are also international organizations and institutions as
UNIDO, USAID, World Bank, The European Union.
The process of clustering and networking in The Republic of Macedonia started in
2002 with the support of USAID project “Macedonian Competitiveness Activity” that ended
in 2006. After that, in 2009, the Macedonian government adopted the Strategy for Industrial
Policy 2009 –2020, which considered clusters and networks as one of the five main areas of
interventions.
Consequently, the Program for Support and Development of Clusters’ Associations in
the Republic of Macedonia was developed. The program has three main objectives: to
encourage cooperation between companies, promote the development of clusters through
increased investments in infrastructure, and to ease the formation of clusters in practice
(Marinkovic, 2011).
Tanja Micalevska 104

Entrepreneurship as driver of competitiveness: The case of Macedonian fruit and vegetable processing industry.
2015
Several clusters already operate in The Republic of Macedonia: Lamb and Cheese
Cluster, Tourism Cluster, Automotive cluster, Cluster for Candies industry, Cluster for
Agriculture mechanization, Cluster for Honey, Cluster for Wood, Cluster for fashion and
design, Cluster for Processing Fruits and Vegetables, Cluster for Wine (Machačová Jana,
2008) (Gerasimovska, 2013).
Figure 8: Clusters in Republic of Macedonia
Source: (Gerasimovska, 2013)
Tourism cluster of hotels, restaurants, touristic agencies, educational institutions,
health food manufacturers, transport companies, sports clubs. It was established in 2011 with
a goal to strength the cooperation in the field of tourism services, enabling implementation of
joint projects.
Tanja Micalevska 105

Entrepreneurship as driver of competitiveness: The case of Macedonian fruit and vegetable processing industry.
2015
The Automotive Cluster of The Republic of Macedonia consisted from the firms
of the automotive industry, established in 2008 with an aim to protect member’s interests,
join marketing and research and development activities.
Cluster for fashion and design established in 2005 as an association in order to
link Macedonian designers with textile companies and to organize fashion shows and events.
In 2008 become part of the project "Promotion of export of custom collections in the textile
industry by way of qualification and regional networking of fashion designers”.
Cluster for Processing Fruits and Vegetables created in 2002 with the following
goals: to increase the competitiveness of companies in the sector, to strengthen their
potential, to protect their interest, to strengthen the cooperation with farmers, foreign
companies.
Cluster for Wine formed in 2006 from representatives from Wine and Tourism
sector. The main goal is developing alternative tourism with special attention of Wine
tourism. The cluster has participated in smaller projects and organized many conferences,
forums, events.
Cluster for ITC was established in 2000, and it operates as independent chamber.
Now, it has 80 member companies of software, IT services, hardware distributors, telecom
companies, training centers, ICT consultants.
Cluster for wood processing established in 2007, with a goal to reduce the gray
economy in the production of furniture and wood products, to connect with clusters in the
region and beyond, increase the export promotion, establish recognizable common brand, to
organize conferences, trade shows and workshops.
Diary and meat cluster established in 1998 with objectives to improve dairy and
meat industry, develop a recognizable brand for confirmed quality, provide information on
developments in the industry, equipment, packaging, raw materials and additives.
Tanja Micalevska 106
Entrepreneurship as driver of competitiveness: The case of Macedonian fruit and vegetable processing industry.
2015
2.3 The components of entrepreneurship
The business climate, entrepreneurial education, clustering and networking can
improve the development of the entrepreneurship in a country, but equally, and sometimes
even more important, are the internal factors which determine entrepreneurship. They can be
researched through three approaches: as behaviors, processes and outcomes (David Stoks,
2010).
The three are interrelated and we can never describe entrepreneurship from only one
aspect.
The behaviors approach is mainly interested in the behavior of entrepreneurs
as people who recognize opportunities, make initiatives, use judgment and take decisions,
take responsibility, set goals and solve problems.
The outcomes approach investigates the output of the entrepreneurship such as
new products and services, new organizations, new values for society etc.
The process approach goes through the activities that entrepreneurs undertake
such as identifying opportunities, feasibility analysis, writing a business plan, developing
business model, preparing the legal foundation, getting funds, building a team and developing
marketing strategies.
In this research each of the dimensions is acknowledged and the focus is put on the
entrepreneurial elements: (See figure 4)
opportunity recognition
resources management
risk taking
creation and implementation of innovations
marketing oriented approach
The first element is opportunity recognition. Opportunity is a favorable set of
circumstances that creates a need for a new product, service or business (Bruce R. Barringer,
2011). The recognition of an opportunity is noticing something and acting upon it before
others. This can happen unexpected by serendipity, or as in most of the cases can follow from
Tanja Micalevska 107

Entrepreneurship as driver of competitiveness: The case of Macedonian fruit and vegetable processing industry.
2015
a process of search for opportunities. When opportunity is identified without some deliberate
search, it may be born from some problem that the entrepreneur is trying to solve, from some
gap that exist in the market, need that waits to be satisfied.
Austrian school defends the approach that opportunities are given and only alert
individuals, entrepreneurs, can notice them and create a business from them (Kirzner, 2008).
This view is limited on the things that already exist. Another view, developed by Long and
MCMullan (1984), is that opportunity recognition is a complex process composed by several
phases starting from pre-vision, point of vision, opportunity elaboration and decision to
proceed (Gerald E. Hills). The feature of entrepreneurs to recognize opportunities depends
from various factors including external forces and internal determinants (Bruce R. Barringer,
2011). The factors are given in the figure 9.
Figure 9: Factors determining opportunities recognition
Source: Author’s framework on the basis on source (Bruce R. Barringer, 2011)
Tanja Micalevska 108
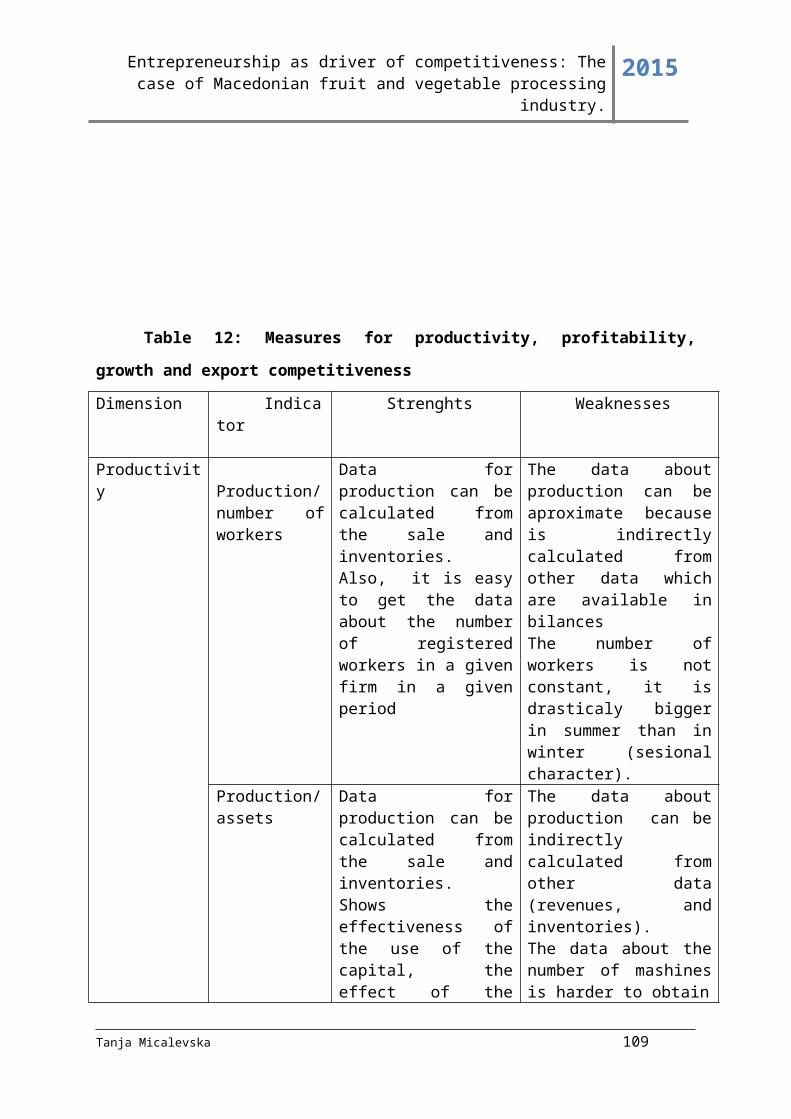
Entrepreneurship as driver of competitiveness: The case of Macedonian fruit and vegetable processing industry.
2015
External forces include economic, social, demographic and technological changes.
These forces influence by transforming the environment where entrepreneurs operate, and
therefore creating chances for new businesses of for improving the existing ones. They are
not isolated one from another, but rather coexist, and together, impact on the environment in
which entrepreneurs recognize opportunities.
• Economic forces are manifested in the way that the economical variables influence
markets. Changes in prices, in interest rates, in employment, in the consumer’s
income affect opportunities in many different ways. For example, increase in
resources’ prices, may affect industries, but also opens opportunities for entrepreneurs
to create products which are more efficient.
• Political forces refer to the political stability of a country or region, and on the
regulations that companies must comply. Regulations can limit firms from one side,
but they also create opportunities for entrepreneurs, on the other. For example, if the
government introduces environmental laws, entrepreneurs will search for a way to
produce the products and comply with the laws. That can lead them to develop new
better production methods and new or improved environment friendly products.
• Demographic forces include the features of people as nation, race, age that influence
over the tastes of consumers, the trends, the buying patterns. For instance, the
concentration of a nation, in a given region, opens opportunity for entrepreneurs, to
offer products and services the particular nation is fond of.
• Technological forces refer to introducing new technologies. They create opportunities
that may be life changing, may advance peoples life, and create possibilities for new
things to be built upon them, as well as a whole chain of new chances and
possibilities.
Internal determinants are also related and interdependent. They include previous
experiences and knowledge in the given industry or in other related industries, creative
potential and strong imagination, social contacts, and other personal characteristics that make
entrepreneurs better in identifying opportunities than ordinary people (Baron, 2006).
Tanja Micalevska 109

Entrepreneurship as driver of competitiveness: The case of Macedonian fruit and vegetable processing industry.
2015
Knowledge is a broad concept, and includes information and judgment. It can be
addressed by its sources or by the types of knowledge. The sources of knowledge are
education and experience (Wei Lee Lim, 2015).
Education can be formal and informal, and has essential role for the way
entrepreneurs process information and relate one to another. Previous experience, on
the other side, can improve practical skills and noticing of potential problems.
According to Shane, prior knowledge triggers recognition of the value of the new
information (A theory of entrepreneurial opportunity identification and development,
2003). It can be related to the industry, to the market or to the technology.
The types of knowledge are technological knowledge, industry knowledge,
and market knowledge. Industry knowledge enables entrepreneurs to notice gaps in
the industry and create businesses to fill the gap. Technological knowledge is useful
for recognizing technological changes which are about to happen, and for solving
technological problems. Market knowledge contributes in evaluating the feasibility of
ideas by presenting them to customers and sizing in which manner they attract
customer’s attention. Feasibility depends on markets, so knowledge about markets
increases the chance of ideas to be accepted and transformed into valuable
opportunities.
In simple terms, all types of knowledge improve person’s awareness for
opportunities. Awareness, perception, understanding, things and making judgments
about them, improve the alertness.
Alertness is a unique capability to pay attention and act according to the situation. It
depends on cognitive capacities possessed by individuals such as high intelligence,
creativity, and other personal characteristics such as optimism (Baron, 2006).
Creativity is a process of challenging accepted ideas and ways of doing things in order
to find new solutions or concepts (Boulden, 2002). For entrepreneurs, there is not only
one right way to act upon a situation. They use their imagination and are open to
different solutions, generate new idea, and connect the unconnected, keep questioning
already established ways of thinking.
Social contacts can be strong ties referring to the limited number of people with who
entrepreneurs have continuous and intensive contacts and weak ties referring to the
larger number of people that entrepreneurs meet, but not contact so often. The
Tanja Micalevska 110

Entrepreneurship as driver of competitiveness: The case of Macedonian fruit and vegetable processing industry.
2015
researchers have shown that weak ties contribute more that strong ties in the process
of generating ideas and recognizing opportunities (Bruce R. Barringer, 2011).
Resource management is acquisition, combination and recombination of resources.
Resources are important in every business, in every industry, because the final product or
service depends of their quality. Anyway, resources are limited in quantity, so entrepreneurs
must manage them well in order to accomplish efficacy and effectiveness in the process.
Resources include all tangible and intangible inputs. They may be in a form of raw materials,
equipment and technological devices, people, money, etc.
Some authors distinguish input resources and knowledge resources (G. Galunic,
1997). In input resources they include people, plant and equipment, property rights and
capital. In knowledge resources are considered information, know-how and understanding.
Others, take more general approach and distinguish four main types of resources: natural
resources, people (human resources), information, and capital (financial and non financial)
(Louis E. Boone, 2011).
Natural resources are the ones coming from the nature such as water, soil, land,
energy, and can be renewable and non-renewable. Non-renewable resources such as
forests, oil, gas, do not regenerate, and therefore are more limited. Renewable
resources, as clean air and water, solar energy, winds, on the other side, create
opportunities for entrepreneurs to use and build businesses upon them.
Human resources, depending on the industry in which companies operate, may
present small or large percentage of the total resources. However, they are crucial for
the success of the business. By operating with other resources, they add value and
create the goods or services which companies offer on the market. Therefore, in
companies’ interest is human resource to be engaged in their work and to involve
energy, skills and knowledge in order to provide better results and earn higher the
revenues.
To achieve this, leaders are trying to motivate people in their organizations to
maintain and improve their skills, readiness, inspiration and energy. Leading and
managing human resources is hard, mostly because every person has its own personal
characteristics, different skills and knowledge, different cultural background and finds
Tanja Micalevska 111

Entrepreneurship as driver of competitiveness: The case of Macedonian fruit and vegetable processing industry.
2015
motivation in different things (money, promotion, participation). Therefore,
entrepreneurs, to bring on the surface the best out of every employee, should convince
them to work passionately in pursuing entrepreneurial goals as their own.
Every entrepreneur uses its own manners and techniques in motivating and
organizing people to efficiently complete the company’s tasks. Some create
organizations where every worker has description of their work and a place in the
hierarchy, while, others encourage team work and involvement of all functions in
completing projects. Regardless of the manner the organization is structured, what
really matters is achieving the final result.
The insights about the achievements and failures in managing human
resources, entrepreneurs can measure by comparing the achieved outcomes with the
planned ones. If they correspond or exceed the plan, the company moves in the
desirable direction. Otherwise, entrepreneurs need to take further activities, to
improve the human resources managing process.
Information is another essential resource in entrepreneurial businesses. It can refer to
markets’ circumstances, customers’ wants and satisfaction, competitors’ actions and
perspectives, regulative and environmental changes which affect businesses.
The so called informational society brought information at one place, the
internet, so the availability of information today is “no problem“. However, in the
same time, it is “bigger problem” than ever before, considering that the world is
overwhelmed with different information, and selecting the needed one form the poll
takes much time.
Timeliness, completeness and relevance of information, on the other side,
plays great role when it comes to making specific decisions. After all, only on time
information has value for entrepreneurs by giving them chance to act in the right
moment and use the benefits of its possession. Moreover, in order to be relevant,
information should be meaningful and significant and characterized with truthfulness,
faithfulness, clearness and objectiveness. At last, information needs to be complete
without essential parts being missed.
Information can be obtained by own research, primary information, or by
newspapers, magazines, reports, the internet, secondary information. After collecting,
Tanja Micalevska 112
Entrepreneurship as driver of competitiveness: The case of Macedonian fruit and vegetable processing industry.
2015
it follows organizing and relating information, making them easy for comprehension,
in meaning, causes and links.
Capital is the factor which remotes the distance from a feasible idea to realized
project. It includes money and other material inputs, required in business. However,
access to capital/finance is often a barrier for transforming entrepreneurial ideas into
businesses, due to the unwillingness of financial institutions to credit new and risky
project, the lack of coverage to secure the debt, the long period needed to implement
the idea and return the money. To overcome it, entrepreneurs usually use the three F
sources - sources from family, friends and own funds, or borrow from specialized
institutions for financing small business, venture capital funds or business angels.
Having into consideration, that resources, people, information, capital and time are
limited, entrepreneurs make efforts to use them as productive as possible. Therefore, they
search for the best way to manage resources, to reach their optimal combination which will
minimize costs and maximize profits. Achieving the winning combination requires a lot of
thinking, analyzing and creativity, in order to find methods for fully exploiting the resources,
by engaging them in many different combinations and processes which create value for the
company, and are in accordance with the perceived demand.
Combination and recombination of resources is often related with capabilities.
Capability is unique combination of resources, allowing the firm to take specific action, in
order to create value for customers (David G. Sirmon, 2007). Furthermore, there are activities
of stabilizing, enriching and pioneering in the combination or recombination of resources.
Stabilizing are those, when minor improvements in resources, results with minor
improvements in capabilities. Enriching involves adding resources, which results with
enchasing of the capabilities. And, pioneering refers to including new resources in the firm’s
portfolio. Stabilizing activities are at least risky, while pioneering ones include risks.
The third element of entrepreneurship is risk taking. The desire of the
entrepreneur for profit should be in line with his readiness to take risks. Some entrepreneurs
have bigger goals, stronger need to achieve, so they take risks more than others. Risk taking,
as indivisible part of entrepreneurship, has been subject of interest in many research studies
Tanja Micalevska 113

Entrepreneurship as driver of competitiveness: The case of Macedonian fruit and vegetable processing industry.
2015
and it has been investigated from different angles. In the past, the entrepreneurial
characteristic to undertake risks was considered as gambling, taking decisions, and acting in
uncertain conditions, based on the feeling of the entrepreneurs. Lately, risk propensity is
related with rational calculations of the risk involved and using judgment in decision making.
Risk taking can be seen as a trait of entrepreneurs or as a behavior (T.K.Das, 1998).
The trait is psychological feature, need for challenges, for thrill and excitement. People who
own this trait, do not take the entrepreneurial path because of money, but because their need
to experiment, to face uncertainty and prove its control over it. The risk taking as a behavior
is related with the various situations in which occurs.
Risks are related with the time dimension. The time is actually mother of the risk.
Entrepreneurs undertake actions whose results will be seen in future. The assumed outcome
may or may not happen. The longer the time horizon is, the bigger is the uncertainty and the
risk involved. Entrepreneurs who have positive expectation of the future, who imagine the
results in the distant future take higher risk, compared with those who expect the results from
their actions in nearer future.
The risk entrepreneurs undertake is composed by several risks among which:
financial, job risk, social and family risk, mental risk (Mehdi Aman Allah, 2011).
Financial risk includes the possibility of losing financial assets, savings,
property, etc.
Job risk includes loosing the security that offers traditional job, the lack of
possibilities to find job or return to the previous job if the venture fails.
Social and family risk is related with the shorter time available for
entrepreneurs to spend with family and friends, because of the commitment to
the business.
Mental risk is considered as one of the biggest risk. The reason is that
entrepreneur is continually exposed on stress, on fear of failure and should be
psychically strong and resistant to daily tension.
After all, the most dangerous risk is the risk of “not taking risks“. This kind of risk
can be described with the saying: “Ships are safe in harbor, but that is not what ships are
for”6. This type of risk, of not taking risks, can make the entrepreneur miss the opportunity in
6 William G.T. Shedd
Tanja Micalevska 114

Entrepreneurship as driver of competitiveness: The case of Macedonian fruit and vegetable processing industry.
2015
front of him, and loose the profits, success and fame just because of the fear of losing.
Therefore, entrepreneurs should be able to balance between the risk of making changes and
the risk of staying on the “safe” side by not undertaking chances. As difficult as it may be, to
do this, there are many examples of people that have succeeded, and are placed among the
names of famous entrepreneurs and innovators.
Innovation is another crucial element of entrepreneurship. The importance of
innovation has been pointed out by Schumpeter who understood the capitalism as
evolutionary system in which continuous innovation has a central role (Schumpeter J. , 1934).
He distinguished five types of innovation: product innovation, process innovation, new
markets, new sources of inputs, new forms of organization.
Product innovation refers to a new good or a new quality of the existing
product for customers.
Process innovation is introduction of a new method of production in the
branch of manufacture concerned, or a new way of handling a commodity
commercially.
New market may be a market that didn’t exist before, or a market, that the
given branch of manufacture has still not entered.
New forms of organization present new ways to organize that are more
suitable. For example, new division or new communication system.
After Schumpeter, Peter Drucker in his book, Innovation and entrepreneurship, puts
innovation as the most important element for the success of companies, their growth and
absorption of new jobs, and entrepreneurs as individuals capable of creating new things.
Moreover, he states that entrepreneurs should practice planned innovation, which is related
with seven sources of the innovation: the unexpected, incongruities, process needs, industry
and market structure, demographics, changes in perception and new knowledge (Drucker,
2006).
The unexpected includes the unexpected success, the unexpected failure, or
the unexpected external event which entrepreneurs should notice and exploit.
Tanja Micalevska 115

Entrepreneurship as driver of competitiveness: The case of Macedonian fruit and vegetable processing industry.
2015
The incongruities include the incongruity between economic reality as it is and
how it should be, the reality and our expectations about it, the actions of the
industry and the expectations and values of its customers, and, the internal
incongruity in the process.
The process need is captured by the proverb “necessity is a mother of
discovery”. It comes from the limitations that the existing process has and the
new solution should fit easily in the whole process and improve it.
The changes in the industry or market structure are often ignored by
companies, even when they hide within themselves possibilities for
innovating.
Demographic changes can be noticed in advance, but, many times they have
been overlooked.
Changes in perceptions of people open space for something new, but the
entrepreneur should be careful if they are temporary or long lasting.
The new scientific and non scientific knowledge is a source with great and
potential must neglected. However, there is a time span between the
knowledge emerges and is accepted by the market.
Irrespective of the source, innovation must not be viewed as a single event, but rather
as a process consisting of series of activities linked in some ways to the others(Trott, 2008).
The process has several phases: invention, innovation, imitation and diffusion.
Invention is coming up of new idea, which in the given moment may be, but also may
not be interesting on the markets. In order the invention to become innovation the idea should
be feasible, to be demanded on the market, or at least to have potential for future demand.
The second stage of the process is commercialization and exploitation of the invention. The
first commercialization is innovation. Then, it follows the third stage called imitation, which
is often called transfer of technology or adoption. The adoption can be in some part, or in the
whole. At last, the diffusion is when companies spread the innovations by imitating. The
diffusion can create the ground for series of innovations to be build upon the primary
innovation, changing in that way the markets, the economy or the society.
People usually link innovation with new technology and high costs for research and
development. However, innovation does not necessary need to include new high tech
Tanja Micalevska 116

Entrepreneurship as driver of competitiveness: The case of Macedonian fruit and vegetable processing industry.
2015
technology and huge amount of money for its development. Non-high tech and not high
budget demanding innovations are not less important. In fact, cheaper innovations have
proved to have the ability to change products, services, processes, tastes of people.(David
Deakins, 2012).
Innovation is a systematic process which can be compared with the Russian doll, so
called “Matryoshka” (Peter Skarzynski, 2008). As the doll, the innovation from far, should
look so simple that makes people ask themselves: “Why didn’t I remember it?”, but if we
analyze it in its essence, it is complex enough and includes many processes, activities and
people who experiment and scan new solutions.
Depending on the novelty of the innovation, there are radical and incremental
innovations (Latzer, 2009). Radical are those innovations where something totally new is
introduced, which can lead to paradigm shift, and the so called “breaktrough”. However, they
are hardest to succeed for two reasons. First, the period needed for the new knowledge to
become applicable is very long, and, second, different types of knowledge need to
convergence in order to emerge one new product, service or process. Therefore, most of the
attempts for radical innovations fail, due to being premature or missing some pieces of
knowledge. Incremental, on the other side, is the innovation where there is improvement in
some elements of the existing goods or processes.
Another classification distinguishes innovation as continuous, dynamically continuous
and discontinuous (Kathleen Debevec, 1985). Continuous innovation have little disruptive
effect on already established patterns, dynamically continuous innovation have more
disruptive effect, while the discontinuous innovation involve establishments of new patterns.
The last element of entrepreneurship is the market oriented approach. The
exploitation of ideas and their transformation into innovations depends from their acceptance
on the market. The market oriented approach is discovering, analyzing and satisfying
expressed and unexpressed needs and whishes of customers and therefore creating loyal
customers. In order to satisfy the customers’ needs, entrepreneurs do marketing research of
customer motives and the factors that influence their buying decisions. Marketing research is
systematically gathering data about the markets, processing the data and analyzing the
information derived from the data in order entrepreneurs to understand the markets’
movements and act upon them.
Tanja Micalevska 117
Entrepreneurship as driver of competitiveness: The case of Macedonian fruit and vegetable processing industry.
2015
Marketing research should provide information about the market situation and the
marketing mix. Entrepreneurial marketing mix is an innovative process which utilizes the
capabilities of individual and combines components of Price, Product, Promotion and Place,
trying to deliver further values (Amir Mohammad Kolabi, 2011). The entrepreneurs’
marketing mix can be accessed by answering four main questions:
a. The first question: What are the entrepreneurs selling? - may refer to products,
services or whatever that presents value for customers. Sometimes only the product or
the service is not enough. They may be just a part of the whole solution, the whole
value for customers. Other parts, for example delivering, may influence over the
buyers decision to a large extent.
b. The second question: Who are they selling to? – refers to the existing customers and
potential customers for the value the entrepreneurial firm is offering. Choosing the
market segment that the product or service will fit the best is vital for creating the
demand. Segments can be selected by sex, age, style of life, purchasing power and
other features, but they should be precisely defined. For that purpose, entrepreneurs
first investigate the potential market size, then evaluate which needs of that specific
market the solution is able to satisfy, how much potential customers are willing to pay
for it, and the benefits that the product or service will bring to them. After
determining the segment the entrepreneurial firm is going after, follows the plan for
attracting the niche market.
c. The third question: How will entrepreneurs sell the solution to the target market?
Generally, there are two ways for reaching the buyers indirect and direct. Even
through in the past the indirect selling through retailers, distributors, and sales
persons, was more common, today the direct selling is growing rapidly. Direct selling
can be through personal selling or through the internet. For some products both
approaches are used in combination. Anyway, the way of selling mostly depends of
the characteristics of the target market.
Tanja Micalevska 118
Entrepreneurship as driver of competitiveness: The case of Macedonian fruit and vegetable processing industry.
2015
d. The last question: Where entrepreneurs will promote their products or services? The
promotion can be done by advertising on television, on radio, in a newspaper, but
entrepreneurs use cheaper and again effective ways such as trade shows, word of the
mouth marketing, the internet and especially social media.
Trade shows can be used for building awareness for the product, present new
products, develop new relationships, find business partners and gain information for
competitors.
Word of the mouth marketing presents the capability of the company to get
people talking about its products, services, brands. The driver of the word of mouth is
the experience and satisfaction that people get from the company, so to get people to
talk about the company is asking them for evaluation and offer premium for sharing
their satisfaction with others.
The internet or E-marketing is a strong promotional tool, so having a web page
is a necessity. Customers should be allowed ease and speed access to the website,
focus on the product or service, friendly navigation, credibility and interaction. There
are two ways to attract visitors on the web page: by paying to research engines such as
Google, Alta Vista, Yahoo and others to show the web page at the first pages through
search, or by entering key words and following the traffic on the web page.
Email marketing is another cheap and effective way for promoting. It enables
entrepreneurs to communicate with a group of people, business and inform them
about the benefits of given products or services, new solutions, new qualities of the
existing ones, discounts or actions. The precondition for successful email marketing is
having a web page where interest parties can see details about the offer contained in
the mail, interesting design and content of the message. The frequency of the
messages should be carefully selected, and customers to be informed on a regular
basis.
Social media are very powerful tool of modern marketing. It includes blogs,
Facebook, Twitter, Google plus, Instagram, Youtube, LinkedIn. Blogs are used for
describing products and their benefits, instructions for use, testimonials from
customers, videos and so on. Facebook allows companies to share information,
pictures and videos with a great number of customers and fans with just a click
through viral marketing. Twiter allows companies to promote their products by
Tanja Micalevska 119
Entrepreneurship as driver of competitiveness: The case of Macedonian fruit and vegetable processing industry.
2015
sending short messages that followers read on their home pages, and provides
followers the opportunity to spend more time interacting with the products online.
Instagram allows users to take photo and share it with other users who are connected
to the social network. Youtube is used as promotional medium through videos made
for the target market. LinkedIn is a professional network which allows companies to
create professional profiles for themselves and their business where they can to
promote their products or services and communicate with customers.
The final goal of the market oriented approach of entrepreneurs is to establish,
develop and enhance relations with customers, but also to make those relationships
long term. There is nothing more valuable than a long term relation with loyal
customer. The following features speak in favor of loyal customers: they are harder to
switch to another company, they are less price-sensitive, they are more likely to buy
other products from the same company and they are the best promotional tool of the
company (Ilievska, 2015).
Tanja Micalevska 120
Entrepreneurship as driver of competitiveness: The case of Macedonian fruit and vegetable processing industry.
2015
CHAPTER 3 THE RELATIONSHIP BETWEEN ENTREPRENEURSHIP AND
COMPETITIVENESS
The relationship among entrepreneurship and competitiveness is complex, especially
because there is no strict definition niether for the concept of competitiveness, niether for the
concept of entrepreneurhip. Therefore, the relation among them depends from the elements
and perspectives used in the aproach when discussing these multidimensional concepts.
The variety of studies elaborating this relationshp include linking entrepreneurship
with economic growth (Rajshree Agarwal, 2008), entrepreneurial elements - innovation,
proactiveness, risk taking with performance (Dess, G.T. Lumpking and Gregory G, 1996),
entrepreneurial governance and creating strategic advantage (David B. Audretsch, 2007).
Given that this study explored the compeitiveness on three levels, in this chapter the
relation the relation competitiveness - entrepreneurship, is reviewed on three different levels.
Moreover, in order to be comprehensive and exhaustive the relationship is reviewed through
the prism of the two directions: the impact of entrepreneurship over competitiveness on one
hand, and the influence of competitiveness on entrepreneurship.
Thereby, the chapter is aimed to answer the folloing questiones:
Is there any relationship among entrepreneurship and national competitiveness?
Is there relationship among entrepreneurship and industrial competitiveness?
Is there any relationship among entrepreneurship and competitivness of companies?
On a country level, the elaboration considers how competitiveness creates favorable
conditions for flourishing of entrepreneurship, and how entrepreneurship influences over
competitiveness through its effects on the employment, diversification of products, and the
quality of life.
On an industry level, it considers how the improved conditions, resulting from better
competitiveness, open windows of opportunity for new start ups to emerge and to change the
competition of the industry in which they operate, the industry’ structure, its labor market,
trade patterns and the added value it creates.
Tanja Micalevska 121
Entrepreneurship as driver of competitiveness: The case of Macedonian fruit and vegetable processing industry.
2015
On a company level, it investigates how entrepreneurship, expressed through its
elements, affects the companies’ performances which reflect their competitiveness.
3.1 Literature review of the relation between entrepreneurship and
competitiveness
The relationships between competitiveness and entrepreneurship have been analyzed
in the literature, but considering that, the concepts, entrepreneurship and competitiveness, are
multifaced, each of the researches, significantly differs from others. They take into
considerations different assumptions and indicators for describing entrepreneurship and
competitiveness, and use different variables in the analysis for estimating the relation of the
concepts.
In this research, the works related with the examination of the relation
entrepreneurship – competitiveness are sistematized in three groups according to the level on
which the analysis of the relation is made. (See Table 16)
Part of the literature on this thematic explores weather the country’s rate of
entrepreneurial dynamics impacts its level of economic development, weather the
entrepreneurial activity influence over economic growth depends upon the level of per capita
income, .weather entrepreneurship plays a different role in countries with different stages of
economic development.
Apart from the stage of development of the country, also important is the stage of
industry life cycle, weather it is in an early stage or a mature stage of industry development.
The differences are aparent depending on the environment in industries. Generally, there are
two main views connected to the environment: the first is that entrepreneurial opportunities
emerge in the environment, and the second is that entrepreneurs shape the environment
(Renko, L. Edelman and H. Yli, 2010). This research accepts both as accurate. Thereby,
competitiveness is determined by the external environment, the internal firm factors and the
entrepreneurs (Chan, K. F and Man, Thomas Yunlong and Lau, Theresa, 2002).
The influence of firm factors and especially the impact of innovativenes, pro-
activeness and risk taking as entrepreneurial elements have been investigated from many
authors in theoretical and empirical researches. Among them there are two main groups, the
ones who consider those elements as individual factors which influence over firms
Tanja Micalevska 122
Entrepreneurship as driver of competitiveness: The case of Macedonian fruit and vegetable processing industry.
2015
performences (e.g., Lumpkin & Dess, 1996; Kreiser et al., 2002) and those who take them as
one factor the entrepreneurial factor and state that their efect over firms performance is
important when they are in combination Miller’s (1983) work, Covin et al. (2006).
Table 16 The relation entrepreneurship- competitiveness – related works
Level ofAnalysis References
Nationallevel
Nascent entrepreneurship and the level of economic development (Sander Wennekers, Andre van Wennekers,Roty Thurik, Paul
Reynolds, 2005)
The Effect of entrepreneurial activity on National economic growth ( Andre van Steel, Martin Carree, Roy Thurik, 2005)
Entrepreneurship and competitiveness dynamics in Latin America (Zoltan Jacs, Jose Ernesto Amoros,2008)
Entrepreneurship in Relation to the Competitive Potential and Position of Economies – a Regional Approach Based on Polish
Provinces (Aleksandra Gawel,2014)
Industrial level
Measuring changes in entrepreneurial orientation following industry deregulation: The development of a diagnostic instrument.
(Ginsberg, A. 1985.)
Linking two dimensions of entrepreneurial orientation to firm performance:the moderating role of envoronment and industry life
cycle(G.T. Lumpkin, GregoryG Dess,2001)
Tanja Micalevska 123

Entrepreneurship as driver of competitiveness: The case of Macedonian fruit and vegetable processing industry.
2015
Firm level
The Competitiveness of Small and Medium Enterprises: A Conceptualization with Focus on Entrepreneurial Competencies (Chan, K. F and Man, Thomas Yunlong and Lau, Theres,2002)
The relationship between firm level entrepreneurship and firm performance : The unique impact of innovativenes, pro-activeness and risk taking (Kreiser and Davis,2008)
The Simultaneous effect of individual entrepreneurial competencies on SMEs competitive advantage (Rungwitoo,2012)
Dividing the literature according to the level of inestigation is usefull, but after
separating the relationships at three levels, follows their sinthetizing in order to illustrate the
big picture and the inter level relationships. They are visually presented on figure 10.
Namenly, the if the factors which influence the development of entrepreneurship such
as positive business climate, quality educational system and networking supporting
environment, are favorale, entrepreneurs are able to identify more opportunities, create
innovetions and sell them on the markets. Also, they are encouraged to open new ventures
and this way they intensify the competition which leads to a change in the industries
structure. Increased competition is pushing companies to add more value in order to make
their products and services more competitive. Also, it changes the trade paterns and the
conditions in the labor market (qualification structure, salaries etc). These changes influence
on micro and macro competitiveness. The micro - firm competitiveness effect is manifested
by the improved productivity of workers which leads to higher profitability, growth and
exports. The macro competitiveness efect is manifested in greather employment, growth and
advanced export patterns. Improvements in these variables contribute for greather
competitiveness which is better living standards and environment for doing business.
Tanja Micalevska 124
Entrepreneurship as driver of competitiveness: The case of Macedonian fruit and vegetable processing industry.
2015
Tanja Micalevska 125

Entrepreneurship as driver of competitiveness: The case of Macedonian fruit and vegetable processing industry. 2015
Figure 10: The relationship between the entrepreneurship and competitiveness
Source: Author’s framework
Tanja Micalevska 126
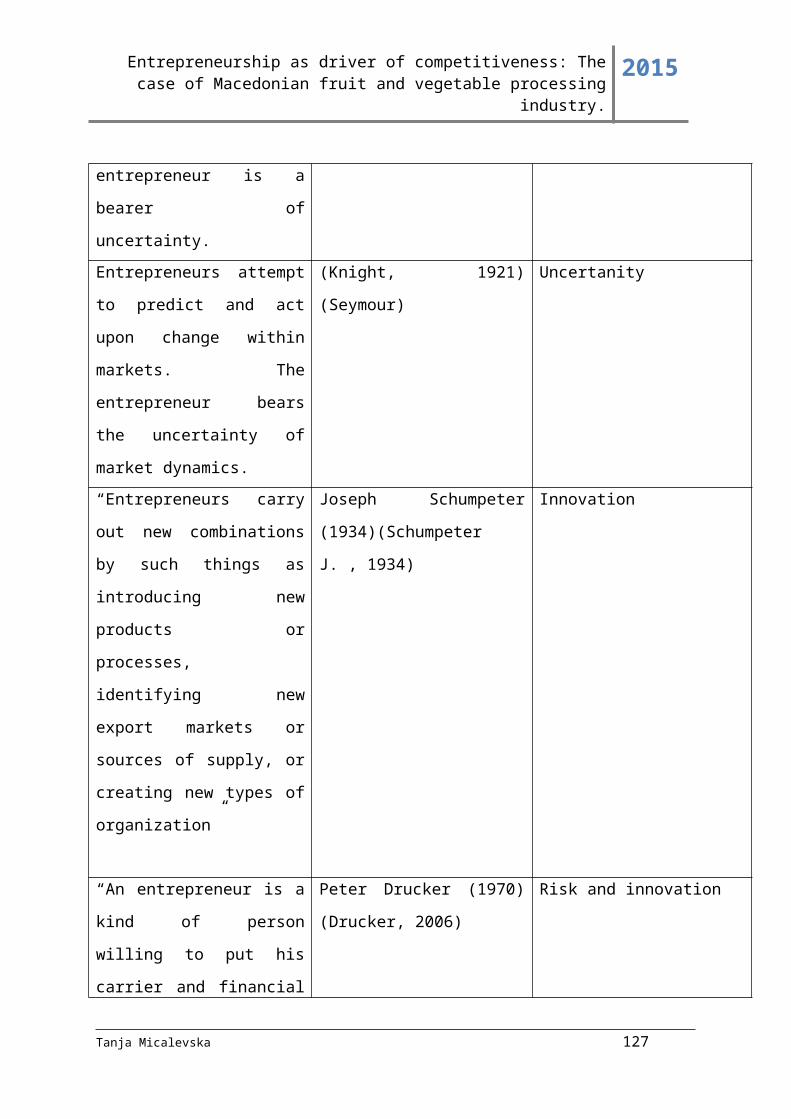
Entrepreneurship as driver of competitiveness: The case of Macedonian fruit and vegetable processing industry.
2015
3.2 The relationship between the entrepreneurship and competitiveness on a
national level
The relationship entrepreneurship- national competitiveness has been investigated
through the prism of the impact of entrepreneurship over growth and development (Naudé,
2013) (Thaddeus, 2012), the impact of entrepreneurship and entrepreneurs for national export
features (Jolanda Hessels, André van Stel, 2008) (Igor Filatotche, Xiaohui Liu, Trevor Buck
and Mike Wright,, 2009) and the impact of development, regulations and business climate
over entrepreneurship (Leora F. Klapper, Anat Lewin and Juan Manuel Quesada Delgado ,
2009).
The greatest contribution in the exploration of the relationship national
competitiveness - entrepreneurship has Michael Porter. In his works and speaches, he
synthetizes the previous views and claims that national competitiveness depends from
countries’ endowments and macroeconomic conditions (policies, social development) on one
side, and from the microeconomic capability of the economies, on the other.
Microeconomic capability of economies is again determined by the national business
environment, the clusters and the entrepreneurship development. Therefore, creating positive
business and cultural base and putting accent on supporting entrepreneurship and
entrepreneurial capacity development among people, is the crucial factor for achieving
national competitiveness (Porter M. , Innovation and Competitiveness, 2011).
However, entrepreneurship with its externalities as job growth, innovations,
diversified products and services, which advance the standard of living of people, satisfy their
needs and create competitive climate, despite being a factor for competitiveness, in the same
time is affected by it. For instance, the improved competitiveness in a country creates more
favorable business climate, tax policy, institutional system, and better education. These
variables have an effect over the development of entrepreneurship.
In fact, the relation entrepreneurship –competitiveness, is never one direction process.
On the contrary, it is a complex process where both variables affect one to each other, as
illustrated on figure 11.
Tanja Micalevska 127
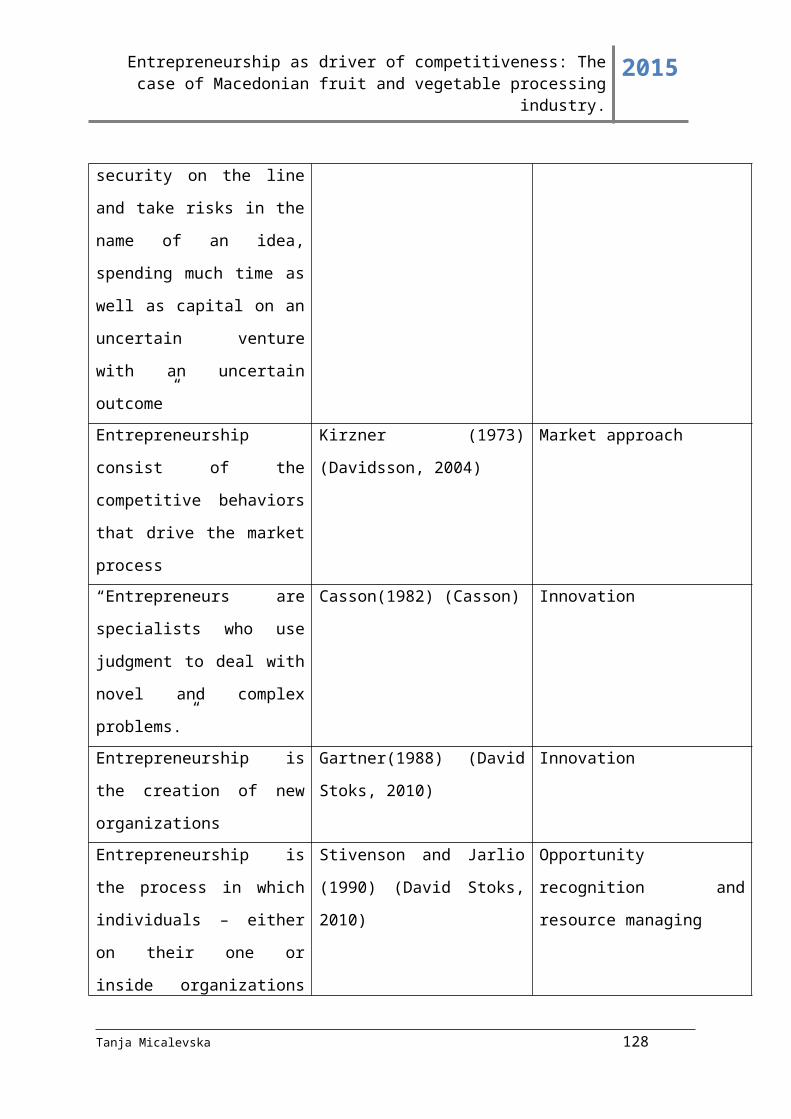
Entrepreneurship as driver of competitiveness: The case of Macedonian fruit and vegetable processing industry.
2015
Figure 11: The relationship between the entrepreneurship and competitiveness
on a national level
Source:http://www.hbs.edu/faculty/Publication%20Files/2012-
0124_SaudiArabia_GCF_65a10518-39d6-4bf6-a7b1-8074892f0849.pdf
The mutual influence of competitiveness over entrepreneurship and vice versa of
entrepreneurship on competitiveness can be compared with the spiral effect (See Figure 12).
The spiral effect is continuous and as shown on the picture goes like this: individuals
with entrepreneurial capacity by recognizing profitable opportunities and taking all the
necesseary actions to exploit them, undertake risks and introduce innovations which are
further commercialized on the market. In this way, they create value for them and for the
stakeholders. That leads to improved standard of living for entrepreneurs and stakeholders
and improved export potential. The improvements results with advancement in the
competitiveness at the domestic country and better international trade performance i.e. higher
level of national competitiveness. Improved national competitiveness opens new
opportunities for entrepreneurs and advanced conditions for entrepreneurship and business
development, which leads to new products, businesses and so on. Therefore, the picture
illustrates the accelerating rise in the level of competitiveness of a country, primarily due to
the development of the entrepreneurship.
Tanja Micalevska 128
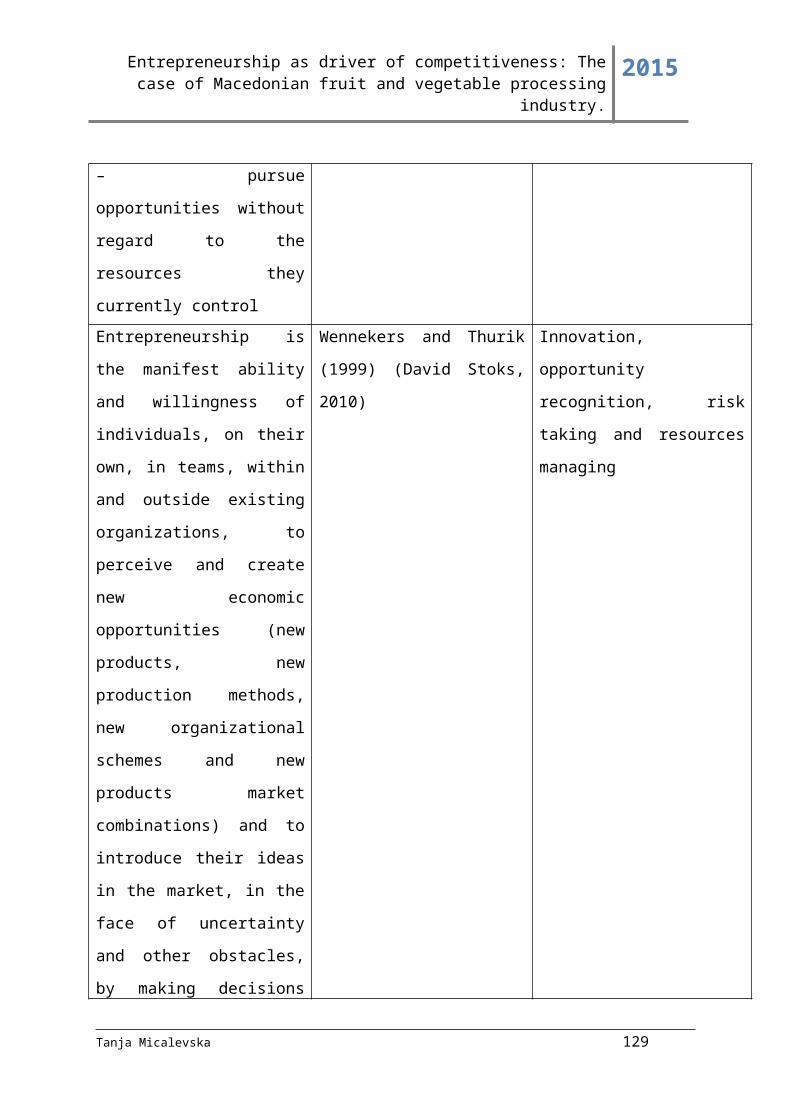
Entrepreneurship as driver of competitiveness: The case of Macedonian fruit and vegetable processing industry.
2015
Figure 12 : The spiral effect entrepreneurship- competitiveness
Source: by the author
The tempo of the spiral, self reinforcing effect, depends of the existing entrepreneurial
activity in a country. According to the GEM (Global entrepreneurship monitor) there are
three stages of development of countries, depending on the economics features of countries,
chalenges that entrepreneurs face with, the basis on which they compete and build their
competitive advantage. The stages are: factor driven, efficiency driven and innovation driven
economies (José Ernesto Amorós, 2014). There are also contries which are between two of
the three stages of development, and are in transition from one stage to another.
In factor driven stage economies, companies compete mainly on the basis of the
endowements as cheap labor force and natural resources. Entrepreneurship is not
developed and entrepreneurial activity is motivated mostly by neccesity. Only a small
percentage of entrepreneurs are motivated by opportunity and implement innovations.
In fact, innovations participate with only 5% of the economic activity in these
economies (Zoltan Acs, 2010).
In efficiency driven economies, competitiveness depends from markets efficiency and
size, technology and higher education. Entrepreneurship is more developed and
Tanja Micalevska 129

Entrepreneurship as driver of competitiveness: The case of Macedonian fruit and vegetable processing industry.
2015
companies compete with efficient production processes and quality of products.
However, the percent of innovations is still small (10% of the economic activity).
Innovation driven economies are characterized with sophistication of businesses,
developed education system, cooperation among research institutions and businesses,
developed markets for goods and services, finance and labor, stable macroeconomic
situation. Entrepreneurs base their competitive advantage on innovations, which
account for 30% of the economic activity.
The stage of development of a country is important, because entrepreneurship plays a
different role in countries with different stage of development. Some empirical analyses
which quantify the relationship among entrepreneurship and national competitiveness, by
finding links between the Global competitiveness index (GCI) as indicator of National
competitiveness and TEA index7 as indicator of entrepreneurial activity, have shown that in
developed countries entrepreneurship increases the growth, and in less developed has
negative impact on growth. The reason for that is that entrepreneurs businesses in developed
counties are mainly based on implementation of original ideas. On the contrary, in less
developed countries, entrepreneurship is more necessity than opportunity based.
Entrepreneurs open businesses as an alternative for unemployment, so these businesses are
not always exploiting a profitable opportunity. Therefore, they fail more often and do not
conduct for national growth (André van Stel, 2004).
The Republic of Macedonia belongs to the group of efficiency driven countries. In the
year 2013 most of the entrepreneurs were motivated by necessity (60.98%) and only 22.95%
were motivated by opportunity. Compared with the countries in the region and the average
for European Union countries, Macedonia has higher number of entrepreneurs motivated by
necessity, a lower rate of entrepreneurs motivated by opportunity of all except Bosnia and
Herzegovina.
The promotion of entrepreneurial opportunities has increased in recent years, but this
has not resulted in an increase in the number of startups. The TEA index in 2013 was 6.63%,
which is a large reduction compared to 2008 when it was 14.5%. Compared with countries in
the region and the average value for TEA index in the European Union, Macedonia has the
lowest TEA in 2013, except Slovenia. The percent of nascent entrepreneurs (those who have
7 “Percent of adult population (18-64 years old) that is either actively involved in starting a new venture or the owner/manager of a business that is less than 42 months old” -
Tanja Micalevska 130

Entrepreneurship as driver of competitiveness: The case of Macedonian fruit and vegetable processing industry.
2015
business to 3 months) was 3.35%, and the percent of new entrepreneurs (who have business
activities up to 3.5 years) was 3.53%. The rate of innovation for businesses TEA in 2013 was
13.82%, while for established businesses 4.23%.
Tanja Micalevska 131

Entrepreneurship as driver of competitiveness: The case of Macedonian fruit and vegetable processing industry.
2015
3.3 The relationship between the entrepreneurship and competitiveness on a
manufacturing level
The relation between entrepreneurship and manufacturing competitiveness varies
depending upon the stage of economic development of the country, the time horizon and the
industries/branches where manufacturing companies are operating.
Traditionally, manufacturing firms have been transforming raw materials into
products, in large companies where through economies of scale, the costs were minimized, in
order to gain higher profits. Therefore, they aimed to make the process as efficient as
possible, and the financial returns higher. However, the era of financial gains through mass
production is coming to an end, and companies tend to create multiple values.
Today, value creation in the manufacturing sector has broader meaning than just
earning profit through mass production. It includes expanding business offerings, providing
better customers experience and maintaining long term customer relationships. That is related
with a whole set of activities such as research, design and development, distribution,
implementation, and interlinked products and services. Therefore, companies need to have
entrepreneurial approach.
Entrepreneurs recognize opportunities, manage risks, solve problems and implement
innovations. Many relate manufacturing competitiveness with technological innovation.
Although, there are many examples of firms who have succeeded by implementing new
technology, not every innovation must be connected with new technology. Some of them are
connected with applying existing technologies in new ways, and creating new business
models.
Lately, new business models often include networking, collaboration of entrepreneurs
with other entrepreneurs and managers in the process of supply, production, marketing and
after-sale services. In this manner, they actually create flexible, specialized and
interdependent manufacturing value chains consisting of a number of interconnected and
coordinated, primary and supporting activities, included in the process of converting inputs to
outputs (Porter M. , On Competition, Updated and Explained Edition, 2008).
Primary activities are those directly related with the process of supply, production,
logistics, marketing, sale and post-sale services, while supporting activities are the ones
Tanja Micalevska 132
Entrepreneurship as driver of competitiveness: The case of Macedonian fruit and vegetable processing industry.
2015
related with the infrastructure of firms, human resources, administrative and organizational
activities, information flows etc.
Entrepreneurs manage the linkages between all activities, within and around
organizations, and make combinations with an aim to obtain competitive advantage.
Moreover, they link, vertically or horizontally, with other entrepreneurs, and create broader
value system. This results with redefined and restructured industry sectors, which change the
playing field where companies compete, and open new opportunities.
Recognizing opportunities in networking and managing with value chains by
entrepreneurs, enables them to implement innovations, enchase resources’ efficiency, and
satisfy customers’ needs. The result is added value and improved manufacturing
competitiveness.
From the above elaboration, we can conclude that entrepreneurship changes the
landscape in manufacturing. Furthermore, this concept of transitioning of manufacturing from
operations in large enterprises with huge production capacities and enormous fixed cost, into
collaborative and innovative businesses in entrepreneurial small and medium enterprises,
shows that entrepreneurs have power, to improve the competitiveness of manufacturing
branches, by improving their firms’ competitiveness.
Finally, in Figure 13 is presented mapping of the value chain for The Fruit and
Vegetable Processing industry in The Republic of Macedonia.
Figure 13: Value chain -The Fruit and Vegetable Processing industry in The Republic of
Macedonia
Source: authors
Tanja Micalevska 133
Entrepreneurship as driver of competitiveness: The case of Macedonian fruit and vegetable processing industry.
2015
3.4 The relationship between the entrepreneurship and competitiveness on a
company level
By now, the relatonship of entrepreneurship and competitiveness was investigated on
an agregate level, in a national economy and in sectors. Thereby, several times, it was stated
that the root of the relationship entrepreneurship - competitiveness should be investigated on
a company level in order to get better understanding of concepts and their interrelations.
The literature points out some relationships found among elements linked with
competitiveness such as productivity, profitability, growth and trade performances, and
elements of entrepreneurship such as opportunities identification, resources management, risk
taking, innovation and market approach.
Many researchers claim existence of a positive relation among entrepreneurship and
firms’ productivity. For example, some of them have investigated if entrepreneurship
influences productivity of firms, and noticed that there is an influence which is negative at the
beginning, and then, after few years comes the positive impact (Martin Andersson, 2010).
Others, relate entrepreneurs with companies growth (Thomas M. Cooney, 2012), (Priya
Dhamija Gupta, 2013), or growth rates and profitability measures (Jason R. Fitzsimmons,
2005).
Apart from entrepreneurially oriented firms’ success on domestic markets, also, there
are studies which examine how entrepreneurship is related with small and medium
enterprises internationalization (Basile, 2012). Furthermore, they have found that the
promotion of products, establishing and keeping contact with foreign customers, and how that
contributes to better export performance for those firms(Rasha H. A. Mostafa, 2005).
Having into consideration the researchers above and many others which have
investigated the separate relationships between entrepreneurship and competitiveness
indicators, as well as studies which have investigated how entrepreneurial elements connect
with competitiveness, here there is an attempt to investigate how entrepreneurial elements
together affect competitiveness. Therefore, the aim is to offer a synthesis of all those linkages
by researching the relationship of the two concepts entrepreneurship and competitiveness.
(See Figure 14)
Tanja Micalevska 134

Entrepreneurship as driver of competitiveness: The case of Macedonian fruit and vegetable processing industry.
2015
Figure 14: The relationship entrepreneurship-competitiveness on a company
level
Source: Porter- adopted by the author
The subjects of the investigation in this study are companies in The Fruit and
vegetable processing industry in The Republic of Macedonia. And the main hypothesis is:
H0: The entrepreneurial capacity of managers in the companies in Fruit and Vegetable
Processing Industry drives competitiveness.
Tanja Micalevska 135
Entrepreneurship as driver of competitiveness: The case of Macedonian fruit and vegetable processing industry.
2015
PART 2. METHODOLOGY
The methodology used in the thesis is in line with the research objectives and the
research questions posed in the introduction part. Therefore, in this part I briefly discuss the
activities undertaken, the data characteristics, the collection process, as well as the model
used to analyze and test the assumptions and hypothesis.
At first, the data type, size and sources are addressed, the data collection method and
the responsiveness of companies and institutions is stated. Then, follows description the
composite indicators’ construction process, with all the necessary steps included in order to
get composite indicators for the two areas of interest, firms’ competitiveness and
entrepreneurship.
The constructing process is not easy and simple, and there are many issues that should
be taken into consideration from methodological point of view. To reduce the risk of missing
on some important issue the process is divided in several subsequent stages. Each stage of the
construction process is important for the quality of the final information and should be
performed carefully.
Finally, the two obtained composite indicators, one for entrepreneurship and one for
firms’ competitiveness, are confronted and put into a regression model. The regression model
shows if the relations among investigated subjects exist, which gives the answer of the main
research question. The main research question and the sub questions and hypothesis are
answered in the part which elaborates the discussion related to the results obtained from the
research.
The methodology for this research is illustrated with a concept map (See Figure 15)
Tanja Micalevska 136

Entrepreneurship as driver of competitiveness: The case of Macedonian fruit and vegetable processing industry.
2015
Tanja Micalevska 137
Entrepreneurship as driver of competitiveness: The case of Macedonian fruit and vegetable processing industry. 2015
Figure 15: Research methodology – step by step
Source: authors
Tanja Micalevska 138

Entrepreneurship as driver of competitiveness: The case of Macedonian fruit and vegetable processing industry. 2015
Tanja Micalevska 139

Entrepreneurship as driver of competitiveness: The case of Macedonian fruit and vegetable processing industry.
2015
Chapter 4 Data collection
In the previous chapters of the study, the goals of the research were posed, the theory
related with the investigated subjects was reviewed, and the research questions have been
stated. Now, in this chapter follows definition of the population of interest, the characteristics
of the population important for the purposes of the study, and the sources where the needed
information can be found.
The data can be obtained by primary sources, when the researcher himself creates the
questionnaire for the purpose of the study, and delivers it to respondents. Also, it can be
secondary, when data is gotten from other sources institutions, reports, and other researches.
The final stage in the conducting of the survey is coding the data and preparing them
for further analyses.
4.1 Population, Sample size and selection
The population is a set of all the units that have some common feature which is a
subject of interest (Sotirovski, 2004). When the population is small enough, and the
researcher can investigate each and every unit of it, then, he/she works with census.
Whenever it is possible, it is recommendable to work with census because the punctuality is
greater and the results are reliable.
Anyway, in social sciences, among which economics, it is almost impossible to reach
and investigate all the units of interest, mainly because there are plenty of limiting factors
such as consumption of time, costs involved in the research, management of the data, rate of
responsiveness of the units etc. Therefore, sometimes, it is more appropriate to use a sample.
The sample is part of the entire population, and should be representative of the population.
Sample and census data have both advantages and disadvantages (Parker, 2011). In
table there is a comparison of positive and negative sides (pluses and minuses) of each of the
approaches.
Tanja Micalevska 140

Entrepreneurship as driver of competitiveness: The case of Macedonian fruit and vegetable processing industry.
2015
Table 17: Census data vs Sample- Advantages and disadvantages
Advantages Disadvantages
Census Reliability in the
results for the whole
population
Benchmarking
possible
Higher costs
More time is needed
for collecting the data
More time is needed
for processing the
data
Lower responsiveness
Sample Lower costs
Reduced time for
collecting data
Higher
responsiveness
Results can be
obtained sooner
Lower reliability in
the results
Source: based on (Parker, 2011)
Most studies, as well as this study, use sample, mainly because the limited time and
budget provided for the purpose of investigation. The sampling procedure involves the
following steps: defining the population, determining sample frame, determining sample size,
conducting sample selection procedure.
Defining of the population includes determining of the sector of interest, the
sampling units, the geographic area and the duration of the investigation. In this research, the
population is The Fruit and Vegetable Processing Industry. The units are the firms that
process vegetable and fruit and produce ajvar, conserved fruit, conserved vegetable, frozen
fruit and vegetable, dried fruit and vegetable. The geographic area where the research is
conducted is the territory of Republic of Macedonia and the duration of the investigation is
one year, precisely in the period December 2013- December 2014. The first concept tested
among firms is the presence of entrepreneurship in fruit and vegetable processing firms and
Tanja Micalevska 141
Entrepreneurship as driver of competitiveness: The case of Macedonian fruit and vegetable processing industry.
2015
the entrepreneurial capacity of their managers. It is derived by the features that indicate
existence of entrepreneurship. The second concept is companies’ competitiveness
domestically and internationally, and, it is derived from the financial indicators of firms.
The sample frame is the set of source materials from which the sample is selected, or
in simpler terms the sample frame is a list of the units in the target population. It depends
from the relationship among the target population and the units of selection. A perfect sample
frame is one that is complete, accurate and up-to-date. This research sampling frame was
taken from the Report for the performances of Fruit and vegetable processing industry page
23 and 24. The list is consisted of name of the company, address, phone number, e-mail
address and web page. Another list was the list of members of Macedonian association of
processors, where the same contact data were given and also a name of the contact person.
Many of the companies on both lists repeat so the two sets were merged into one in order to
avoid duplication. In that way every company was taken into consideration only once.
The sample size is important, because from the sizing of the sample, depends the
reliability of the research. Larger samples are often better representativeness of the
population, but are also more difficult to obtain in terms of time and costs. Therefore, it is
meaningful to reach the balance where the reliability of the study is accomplished, the error is
minimized and the time and costs are acceptable. The initial idea, in this study, was using a
census data, primarily because the population is small in number of units. However, after the
pilot research was done, it was obvious that all firms cannot be involved in the study. Part of
them have not got any processing activities in the given period, and only traded these
products, and part of them, were unwilling to participate in the investigation. So, using a
sample in order to draw conclusions and answer the research questions set, came out as more
appropriate option.
The sample selection procedure depends from the aims of the research. There are
two major types of sampling, probability and non probability. If the purpose is to start from
the sample and make generalizations and inferences about the whole population, the
probability sampling is more convenient. This sampling method allows for every unit of the
population a non- zero probability to be selected (Walonick, 2004). The simplest form of this
Tanja Micalevska 142

Entrepreneurship as driver of competitiveness: The case of Macedonian fruit and vegetable processing industry.
2015
method is the random sampling where every unit from the population has an equal probability
to be selected. This research uses probability sampling, concretely a simple random sampling.
4.2 Conducting of the survey and availability of data
Conducting of the survey depends from all the previous steps and should start after
the goals are clear, the research questions posed, the supporting theory reviewed, the
population and sample decided. When all those phases are finished, the next step is
determining the source of the data and the model of administration.
The questions should correspond to the information that needs to be obtained. There
are two main types of questions: open questions and close questions. Open questions give the
respondents the possibility to answer however they want, so that makes harder for researchers
to administrate. Close questions present a set of fixed alternatives and the respondents chose
among the answers which are given. Therefore, it is easier to process the answers and to
compare them.
The questions in our questioner are closed (See Appendix). It contains 25 questions,
which are geared to answer the presence of entrepreneurship among fruit and vegetable
processing firms. There are 6 possible answers for every question, and the design is as a
Likert scale, which allows gradation from strongly positive attitude concerning the statement
in the question, to strongly negative position on that same statement.
When the first version of the questionnaire was finished, a pretesting was made, in
order to check how well the questions are accepted among respondents. The questionnaire
was introduced to random selected firms’ managers by calling them on phone and asking
them to spend time answering the questions. Most of the firms gave answers, and helped me
to precise some statements and make them more understandable. Also, they helped me to
realize, that respondents are not willing to give financial information for their companies, so
the data needed for measuring productivity should be obtained in a different way.
After the questioner was defined and finalized, the decision for the choice of the
collection method followed. There are different methods for gathering answers such as email
Tanja Micalevska 143

Entrepreneurship as driver of competitiveness: The case of Macedonian fruit and vegetable processing industry.
2015
surveys, postal questionnaires, telephone survey and personal interviews. The response rates,
time, costs related to the survey depend from the method.
The questionnaire was initially sent by e-mail with a covering letter explaining the
reason for the research and instructions how to respond the questions. The e-mail was sent to
all the companies from the list. This method was chosen, because the companies are
distributed in different parts of the country, the costs and time for delivering the questionnaire
was minimal and they all got the questions in the same time. However, the response rate was
minimal as well. In fact, it was less than 20%.
The non responses were followed and the questionnaire was sent to them once again,
but this time the mails were personalized, by including the respondents name and surname
and informing them in which sense concretely their response is significant for the research.
Even though, there was an improvement in the response rate, many of the companies’
managers remained uninterested to participate.
The next step was the telephone survey. The telephone survey has its advantages as
having the possibility to explain the respondents, what the research is about, and how their
answers will contribute to it, but on the other side, it is really hard to reach the right person
who should answer the questions. However, I insisted to get the answer from the managers
instead of their assistants, especially because the entrepreneurial traits of the management
were investigated.
For those managers, who could not be reached by phone, a hand delivered
questionnaires were prepared and given to collectors who live in the area where the
companies are situated. This improved the response rate.
The questions about measuring productivity consisting mainly of financial data were
removed from the final version of questioner even after the pilot testing. The reason was their
sensitivity, and the resistance of companies’ managers to give such a data. Therefore, they
were obtained by the Central register of Republic of Macedonia. The institution offers
financial reports of companies in abbreviated form. They contain enough data to calculate the
needed financial indicators which illustrate the competitiveness of the firms. The supply is
made by formal requisition and the data is delivered after the payment of the price for the
service.
The next step, when the activities for collection of the data are over, is the coding
process. Coding is actually translating responses in numerical codes so they can be easily
Tanja Micalevska 144

Entrepreneurship as driver of competitiveness: The case of Macedonian fruit and vegetable processing industry.
2015
entered in the computer and manipulated. In this study, the questions were closed given with
Likert scale as shown on Figure 16.
Figure 16: Likert scale
The coding of closed questions is often done before the data is collected, according to
a coding frame with labels. The questions had assigned labels, by using the numbers -1,-2, 0,
1 and 2 as given in the Table 18.
Table 18 : Labels for coding the answers
Label Answer
-2 Strongly disagree
-1 Disagree
0 Niether agree, niether disagree
1 Agree
2 Strongly agree
After the data is completed and the process of coding is done, starts the checking. The
main purpose of reviewing at this stage is to discover any accidental mistakes which can
influence over the accuracy in the further process of data analysis. This is not editing the data,
but only comprehensive checking in order to ensure that there are not noticeable errors as
missing entry in the recording, duplication of an entry or using code outside the range
(Bryman, 2012). Anyway, the possibility for errors as a result of wrong answers by the
respondents remains.
The dataset contains 49 cases and 31 variables (See Appendix). During the
verification process, it was noticed that there were some missing values in the dataset. The
overall summary of the missing values is given in Figure 17.
Tanja Micalevska 145

Entrepreneurship as driver of competitiveness: The case of Macedonian fruit and vegetable processing industry.
2015
Figure 17: Missing values
Source: authors missing values analysis
As given in the Figure the missing values were analyzed by variables, by cases and in
total. Therefore, it was noted that from number of 30 analyzed variables8, 20 variables
(66,67%) had complete data, and 10 variables (33,33%) had some missing data. Furthermore,
if we consider the cases in the sample, 43 of all 49 cases have answers of all of the questions,
and only 6 of them have given incomplete data. This is a result of the achieved good response
rate on the questions in the questioner which consider the entrepreneurship and
entrepreneurial capacity of firms’ managers, and the availability of secondary data, the
abbreviated balance sheets, concerning the data for the competitiveness of firms.
In the variable summary, given at Graph 34 are given the missing values. Most of
them are about inventories, number of workers, total assets, cost and revenues. The missing
values were further treated, in order to get a full data set.
8 Number of 30 instead of 31 variables, because the Variable Name of the company was used as identification tool.
Tanja Micalevska 146

Entrepreneurship as driver of competitiveness: The case of Macedonian fruit and vegetable processing industry.
2015
Graph 34: Missing values chart patterns
Source: author’s calculations
Tanja Micalevska 147
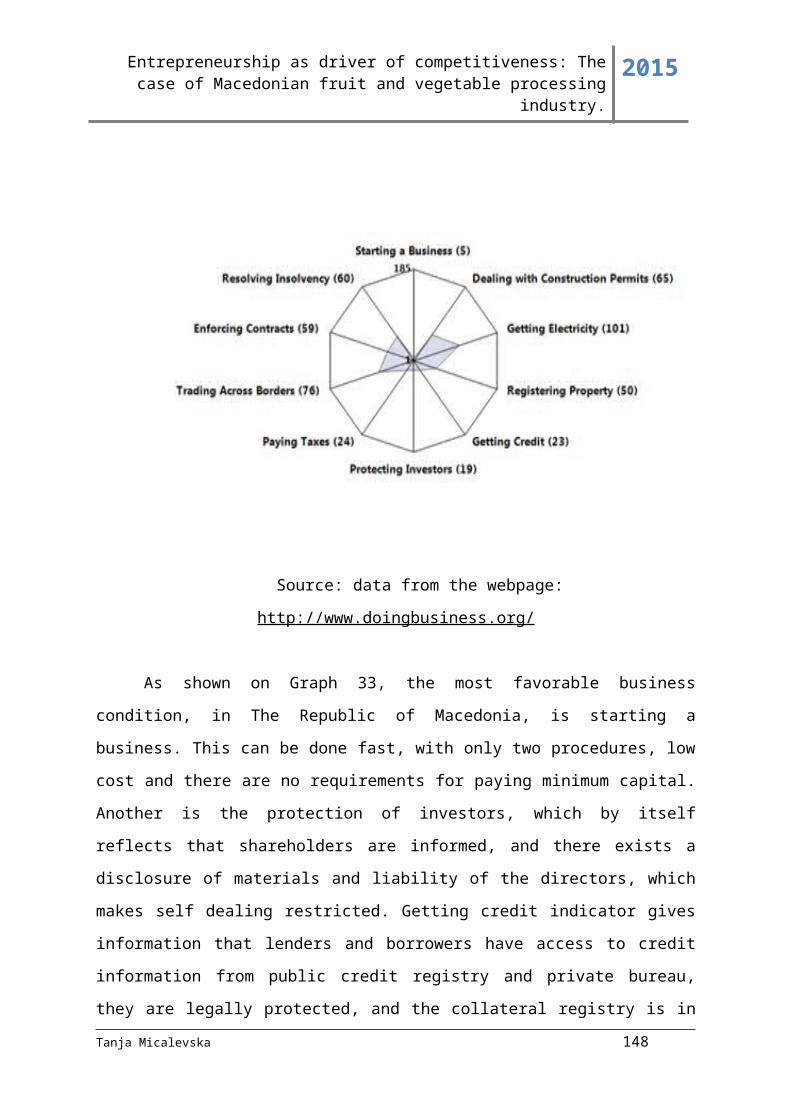
Entrepreneurship as driver of competitiveness: The case of Macedonian fruit and vegetable processing industry.
2015
Chapter 5 Construction of composite indexes
One of the main challenges in any research is to manage to find the data for the
investigation. However, when the methodology of the study includes composite measures the
second main challenge is to assure that the construction process is sound and all the
procedures have been executed carrefuly and the computed composite indexes are ready to fit
in the explaratory model.
This chapter has a goal first to explain what composite indexes are, and separate them
from other measures and indicators, then to provide guidelines for the construction process,
to stress the main steps and judgements which need to be made, and after introducing the
framework for creating the indexes to go into the practical aspects for creating the composite
indexes for competitiveness and entrepreneurship.
5.1Composite indexes and their characteristics
“An indicator is a quantitative or qualitative measure derived from a series of
observed facts that can reveal relative position in a given area and, when measured over time,
can point out the direction of change”9. Indicators are useful in identifying trends in
performance and policies and drawing attention to particular issues. There are basically three
levels of indicator groupings (Group):
1) Individual indicator sets represent a menu of separate indicators or statistics. This
can be seen as a first step in stockpiling existing quantitative information.
2) Thematic indicators are individual indicators which are grouped together around a
specific area or theme. This approach requires identifying a core set of indicators that are
linked or related in some way. They are generally presented individually rather than
synthesized in a composite.
3) Composite indicators are formed when thematic indicators are compiled into a
synthetic index, and presented as a single composite measure.
9 https://ec.europa.eu/jrc/en/coin/10-step-guide/step-1
Tanja Micalevska 148

Entrepreneurship as driver of competitiveness: The case of Macedonian fruit and vegetable processing industry.
2015
Composite indexes are created by a combination of different indicators, with an aim
to explain multidimensional concepts. They include more individual indicators merged into a
single one, which compile the dimensions of the concept being measured. By showing many
aspects of one concept, they can go into its essence. In fact, by taking into consideration the
different angles, the composite indicator is able to give the big picture (Handbook on
constructing composite indicators Methodology and user guide, 2008).
The big picture, the puzzle, illustrated by composite indexes is more than just a simple
aggregation of different parts. Simple aggregation means adding indicators which have
common measure, which is not the case of composite indexes, and it also means getting just a
sum of included indicators. The composite index, on the contrary, should get insights in the
“whole”, which is more than the sum of individual parts. They present a type of a common
denominator of all the units they are consisted of.
Composite indicators are measurements intended to simplify the phenomena they are
describing, to communicate the key information to their users enabling them to see the
meaning behind the raw data, picture the current state of the object of interest, and measure
the change over a period of time or even identify some trends.
However, in order to be valuable for the users, composite indicators must be crafted
on the basis of sound theoretical background, transparent methodological approach, and
above all that, to have a good narrative, a quality presentation (Handbook on constructing
composite indicators Methodology and user guide, 2008). If any of these elements misses, the
index may be misleading and to result in pure information tool.
In order to be meaningful information tool, composite indexes should have the
following features: to be valid, reliable, relevant, measurable and timely. Valid means to give
true information, one which captures the concept that is measured (Rugg). This is especially
important when due to the lack of time or resources, in the data collection process instead of
direct variables, the constructor of the index uses proxy variables. In such a situation, in order
to maintain accuracy, it is preferably to stress out which of the variables are proxy ones, and,
to state the reasons for using them.
Reliable is when no matter how many times, by who or in which period, the index is
measured, if the data used for calculation is the same, the results will remain the same. In
other words, reliability is present when the possibility for occurring measurement error is
minimal. The error may occur if the sample is not representative, but also if there are
Tanja Micalevska 149
Entrepreneurship as driver of competitiveness: The case of Macedonian fruit and vegetable processing industry.
2015
inaccurate answers or high non response rate. Also, error may be caused if there is
subjectivity when interpreting data. In order to improve the reliability, the researcher should
aim to avoid these pitfalls and examine the indicators for their reliability, including here, their
timeliness.
The next feature, the relevance of indicators shows whether the indicators meet the
need, they are crafted for. If an indicator is not linked with the reason for its existence, then
no important information can be derived from it. Those indicators are not worth collecting
and reporting, because they do not contribute in achieving the goals of their developer.
Another attribute that makes indicators useful is measurability. Measurability or
ability to quantify, gives the researcher chance to scale, estimate and compare. Measurability
is often hard to achieve, mainly because it is related with high costs for data collection. When
the indicator is measurable and gives quantitative information, it can facilitate the
communication with its users, and show progress over time.
All the above mentioned attributes, make composite indicators providers of better
informational base for making decisions. Therefore, creators strive to calculate reliable,
relevant, timely and measurable indicators, by using methods that suit the best for the
indicators purpose. There are number of frameworks and methods for creating composites,
each of them with its own strengths and limits. Nevertheless, there are some steps that are
common for most of them, which are crucial for crafting meaningful indexes.
5.2 Steps for creating composite indexes
Creating composite indexes cannot just be captured in few successive steps because it
is complex process. However, it is good to have some roadmap, as a reminder, which key
things must not be omitted. There are no strictly established rules what should be involved in
the process of developing indexes below are some guidelines that will be used for the indexes
in this research. The latter is that some of them have already been encountered previously
through the text. They are listed in the scheme on Figure 18(Group).
Tanja Micalevska 150

Entrepreneurship as driver of competitiveness: The case of Macedonian fruit and vegetable processing industry.
2015
Figure 18: Steps in creating composite indicators
Source: https://composite-indicators.jrc.ec.europa.eu/?q=content/overview
Step 1. Developing a theoretical framework: The first step is actually putting the
foundations on which the creation process is based, and it is necessary for getting an
adequate picture about the phenomena that is measured. In this phase, the researcher
should explain what is being measured, the form, the substance, the dimensions
included in the composition, and their participation in it.
This step has been underestimated by many indexes creators, who were
unaware that not drawing enough intention in this phase may affect the other phases
and reduce the accuracy and relevancy of the index. Therefore, to keep the quality
level of the index, we must take a serious approach even at the beginning, and
precisely define the phenomena measured by the index, to use the right terms and to
avoid ambiguity.
When properly defined, the phenomena should be divided into its components.
Each of them is separately analyzed, in terms of the dimension they describe, and the
importance that dimension has for the overall composite index. Dimensions are
measured with separate indicators. Therefore, it is crucial to elaborate the selection of
the separate indicators in the index, and how those indicators relate with the
dimensions they describe. For each and every sub indicator the composer gives the
Tanja Micalevska 151

Entrepreneurship as driver of competitiveness: The case of Macedonian fruit and vegetable processing industry.
2015
pros and cons, and arguments which make the indicator meritorious to be part of the
index. Moreover, the theoretical framework elaborates the information provided by
individual indicators given separately, compared with the added value of the overall
index.
Step.2: Selecting indicators: This step is tightly connected with the choice of the
indicators from which the index is consisted. Indicators must be selected on the basis
of their power to explain the dimensions of the phenomena and to contribute in the
whole index. If two indicators give the same information, it is recommended to be
used only one. When two indicators, don’t give the same information, but are highly
correlated, both can be considered.
Apart from being theoretically supported and capturing the essence of the
dimension, indicators should meet other criteria, to be measurable, understandable,
valid and feasible. Those characteristics desired for indicators, may be endangered if
the data is not solid, if the access to data is difficult or there are many missing values.
For this reason, for each individual indictor, the composer discusses and checks for
each individual indictor, the availability of relevant data, through time and units, the
source and the type of the data. If the data is available from updated databases and for
all units it is recommended. If there is a lack of quantitative precise data, or proxy
data is used, that should be reasoned.
Step 3. Imputation of missing data: This step reduces the problems which arise with
the incompleteness of the data. It refers to data imputation, treatment of outliers and
scale adjustments. Data imputation is useful when there are missing values, because
allows instead of case deletion, to impute values. This results with larger sample size.
In such a situation, the constructor must be careful with the imputation, and use
variance estimates in order to avoid misleading results. Also, he needs to explain the
methods used, the procedures, the statistical properties. There are two types of
imputation: single and multiple.
The essence of single imputation is that it fills the place where the value
misses by analyzing other responses, and putting the value which is most likely to be
suitable. When there are not many missing values, this approach is good, but when
Tanja Micalevska 152
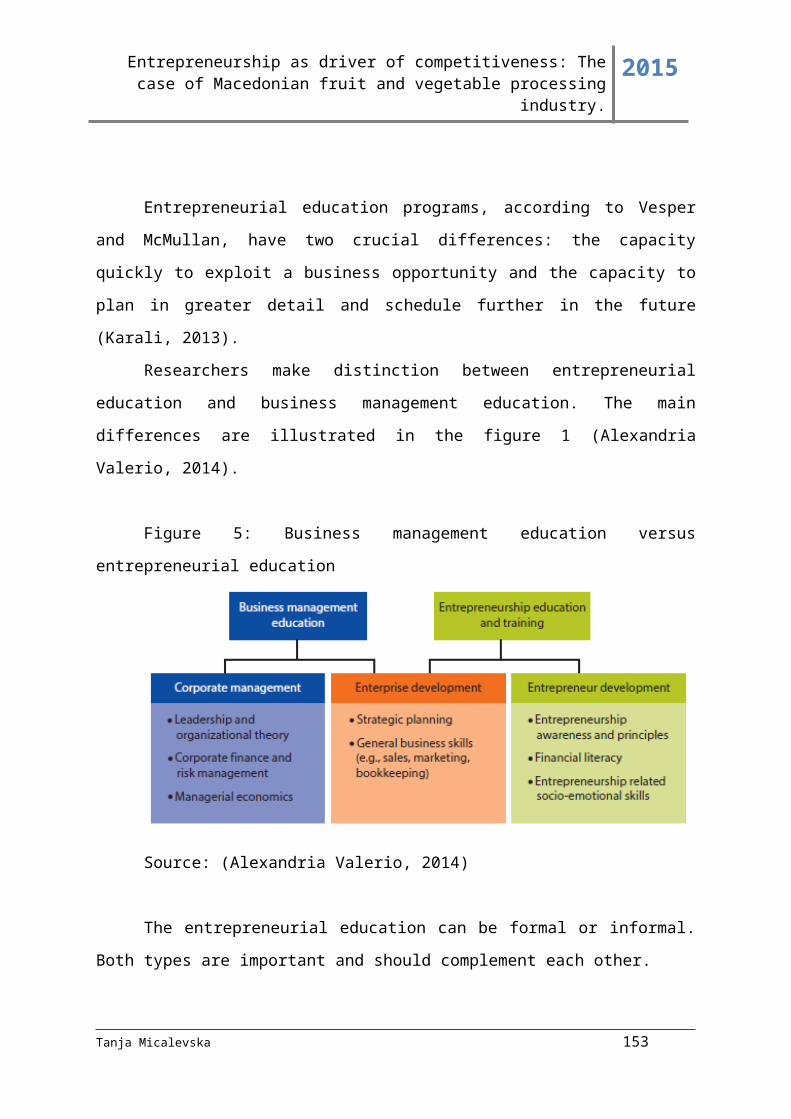
Entrepreneurship as driver of competitiveness: The case of Macedonian fruit and vegetable processing industry.
2015
there are many missing values, it can cause misleading analysis due to the variance.
Methods to impute values through single imputation are mean/median/mode
substitution, regression imputation, hot and cold desk imputation and expectation-
maximization imputation.
Multiple imputations are harder to compute, because the constructor uses
simulation models such as Markov Chain Monte Carlo algorithm, in order to get
confidence intervals and to find the range of answers where the variance is the
smallest. They are appropriate for sets where the number of missing values is bigger.
Step 4. Multivariate analysis: It refers to examination of several variables
simultaneously and allows deeper understanding of the attributes of the data, the
relationships among different variables. It is used for simplification of the data, in
terms of reducing the dimensionality of the number of variables included in the study.
Methods used in this phase are descriptive methods, Principal component analysis,
Factor analysis, Cronbach’ coefficient alpha and Cluster analysis.
Descriptive methods such as scatter plots between all pairs of variables
shown together can illustrate how each variable is related to every
other variable in the data set.
Principal component analysis is characterized with creating a new set
of uncorrelated variables, called principal components, obtained as
linear combinations of the first set of correlated variables. Therefore,
the first principal component explains the maximum amount of
variation, while the other linear combinations, independent of the first,
explain the remaining variance. Principal component analysis is related
with factor analysis.
Factor analysis aims to represent the interrelations among variables,
and the common variance of variables excluding the unique variance.
It is based on a statistical model.
Cronbach coefficient model is testing internal consistency of data,
through investigation of the total variability due to the correlation
among the variables.
Tanja Micalevska 153

Entrepreneurship as driver of competitiveness: The case of Macedonian fruit and vegetable processing industry.
2015
Cluster analysis also reduces dimension of variables in the composite
index by grouping variables in clusters according to their similarity or
dissimilarity.
Step 5. Normalization of data: This step is important because it adjust
variables in a way that they can be expressed in the same measurement unit. The selection of
normalization method deserves attention, and depends from the properties of the data and the
purpose of the composite index. There are several methods of normalization among which
are: ranking, standardization, min-max, distance to reference measure, categorical scale,
indicators above or below the mean, methods for cyclical indicators, and percentage of
differences over consecutive time points. Table presents the methods of normalization, their
positive and negative characteristics. The final choice on the method of normalization
depends from the theoretical framework and the data features.
Tanja Micalevska 154

Entrepreneurship as driver of competitiveness: The case of Macedonian fruit and vegetable processing industry.
2015
Table 19: Normalization methods
Method of
normalization
Description (+) positive
aspects
(-) negative
aspects
Ranking Putting values in
numerical order and
then assigning new
values to denote where
in the ordered set they
fall.
Simple
Not affected by
outliers
Loss of information in
absolute terms
It is not possible to
folow the changes in
the values over time
Standardization Creating standarized
indicators with mean
equal to 0, and standard
deviation equal to 1.
Extreme values have
greather effect on the
indicator
Re-scaling Normalizes indicators to
move into equal range
Wieden the size of
indicators lying in a
given interval and
The min and max can
be unreliable outliers
Could violate the
transformed indicator
Distance
to reference
measure
Uses the ratio between
the indicator value and a
reference value
Consideres evolution
over time or distance
from the benchmark
The min and max can
be unreliable outliers
Categoric
al scale
Indicators have assigned
categorial score
(qualitative or
quantitative)
Small changes in the
score dont affect the
normalized value
Loss of information
Indicators
above or below
the mean
Divides values
depending on where
from the mean (0) they
belong- above (1) or
below (-1)
Simple
Not affected by
outliers
Loss of absolute
information
Percentige of
diferences over
consecutive time
Uses the ratio between
the indicator and
previous period value
Consideres evolution
over time
Can be aplied only if
data is available for
more years
Tanja Micalevska 155

Entrepreneurship as driver of competitiveness: The case of Macedonian fruit and vegetable processing industry.
2015
Step 6. Weighting and aggregation: The index developer must approach seriously to
this step, because weights given to single indicators show indicators’ importance for
the overall index. Therefore, weights need to be properly located in reference to the
theoretical framework and the characteristics of the data among which the statistical
significance and the level of correlation that exist between the sub indicators.
The most widely used method of weighting, when constructing composite
indexes, is equal weighting. The essence of this method is in not favoring any integral
part of the index and considering all equally relevant. In fact components are assessed
for significance, and are granted the same significance. However, although it is the
simplest of all, the use of this method, may indicate lack of knowledge and
understanding of the matter that is measured. That happens in cases where variables
are highly correlated. It is almost impossible to find two indicators which determine
phenomena and are not correlated at all. But, when a great degree of correlation
exists, and they are equally weighted, the method can cause imbalance, and incorrect
presentation of the phenomena measured. Therefore, all weighting methods should be
examined in light of correlation among variables, before the selection is made.
The methods for weighting may be based on statistical models or expert opinions.
The ones based on statistical methods are principal component analysis and factor
analysis, data envelopment analysis, regression analysis, and unobserved components
models.
The principal component analysis and factor analysis first test the level of
correlation between indicators in the structure of the composite indicator.
Then, it finds latent factors which depend of coefficients that measure the
correlation of indicators. After choosing them, follows the rotation of factors
with an aim to minimize the number of indicators, and the allocation of
weights.
The data envelopment analysis determines a benchmark, and later measures
the distance with respect to the benchmark. This method uses linear
programming.
The regression method is useful and dangerous in the same time. From one
side, it can point out the links among indicators and the output measure, but,
Tanja Micalevska 156

Entrepreneurship as driver of competitiveness: The case of Macedonian fruit and vegetable processing industry.
2015
on the other side, if indicators are highly correlated, the variance will be high
and the model not adequate
The unobserved components model is based on a linear regression, but the
difference with the previous model is that the dependent variable here is
unknown. However, it is related with all sub indicators and its assessment can
help to recognize the indicators relation with the composite and to assign
weights that minimize the error.
Models based on expert opinion, even through more subjective, sometimes are
valuable source of knowledge. They are budget allocation, public opinion, analytical
hierarchy process and conjoint analysis.
The budget allocation method values experts competence and experience and
is consisted of a given amount of points, which experts should allocate on
individual indicators according to the judgment about their importance for the
composite. It is usually used for small number of indicators.
The public opinion method is similar as the first, with that difference that
instead of experts’ opinion, it considers public opinion, so it is usually used for
indicators which enjoy public interest.
The third method, analytical hierarchy process, evaluates pairs of indicators
for their relevance and then calculates relative weights.
The conjoint analysis method consists in evaluation alternative sets of values
for indicators and estimating the probability of the preference.
Regardless of which of the weighting methods will be used, through this process,
the composer should find how to bypass the problems that may arise from correlation
among indicators, and then, to choose which indicators to aggregate.
Aggregation is summing the individual indicators which have previously been
normalized and weighted. There are also various aggregation methods:
Linear aggregation is used when we have totally independent indicators,
and there exist total compensability among indicators, components in the
composite index.
Geometric aggregation is also based on compensability, with the
difference that it is preferred for indicators with lower level, because some
Tanja Micalevska 157

Entrepreneurship as driver of competitiveness: The case of Macedonian fruit and vegetable processing industry.
2015
improvement in them, will cause bigger improvement in the composite
index.
Multi criteria analysis is most suitable, if there is no compensability
between indicators. This method uses mathematical formulation and is
more complex than the other two.
Step 7. Test for Robustness: It includes making uncertainty and sensitivity
analysis in order to improve robustness. Uncertainty analysis finds the sources of uncertainty,
whatever that is the quality of the data, or the normalization procedure, or maybe the
weighting and aggregation procedure. The sensitivity analysis, on the other side, investigates
the impact of each of the sources of uncertainty on the composite indicator as an output of the
process of construction. Uncertainly and sensitivity analysis can be used separately, but are
most effective when used together.
Step 8. Back to the details: After creating the composite index, comes the
phase when the same should be decomposed in order to explain the contribution of each of its
components. So components are analyzed in light of strengths and weaknesses, and then units
are compared in their performance for every component of the index separately.
Step 9. Association with other variables: This step is linking the obtained
composite index with other indicators. The composite may be correlated with other indicators
or indexes, or there may be a causality relationship where one of them depends from the
other, and the change in one of them causes changes in the other.
Step 10. Presentation and dissemination: The visualization of the idea in front
of other people and interested parties is crucial, because the composite is not created just to
be, but to convey an important message, to trigger attention and cause action. To do that, it
must be clearly explained and presented. The presentation can be in a table, bar chart, pie,
trend line, radar, and other presentation tools depending on the purpose that need to be
pictured.
Tanja Micalevska 158

Entrepreneurship as driver of competitiveness: The case of Macedonian fruit and vegetable processing industry.
2015
5.3 Limitations of composite indexes
Composite indexes are powerful information tool because they allow explaining
multidimensional phenomena with one single measure. Anyway, as much as this is their great
advantage, in the same time, it is a limit. Sublimating many indicators into one includes all
the steps in the previous section of this chapter, and one little mistake or misjudgment in one
of them may affect the composite index’ accuracy. Therefore, composite indexes should be
calculated, but constructors should be aware of their limitations, and to make efforts for
detecting them. Some of the disadvantages of the composite indexes are the possibility of
sending misleading messages, the danger of being misused, the risk of provoking dispute for
the choice of the normalization method and the weighting method, and the obtained results to
be controversial.
In order to minimize the flaws that composite indexes may have, the developer has
responsibility to increase the transparency in the creation process, by admitting limitations,
starting from the moment when the theoretical framework is build and assumptions are made,
when the data is collected, during the process of data transformation, and until the results are
presented. Moreover, it must be clearly stated what the index can and what cannot explain.
The most common risks with composite indicators are when selecting the variables that
should be included in the index, when choosing the method for imputation missing data, and
when deciding the normalization and weighing method.
The uncertainty starts with the judgment which variables will enter in the calculation
of the indicator. Regardless of the number of arguments in favor of some variable, the final
judgment, for its inclusion in the index, is made by the index creator. Therefore, there is some
degree of subjectivity, so in order to be scientifically justified, all pros and cons for including
the variable should be explained and documented.
Transparency is also crucial when selecting the method for imputation missing data.
There are different methods for imputation of data, so the constructor uses the one which he
considers as the most suitable. The decision depends of the data, their characteristics and
quantity. If the sample is large, the constructor may delete the case. Otherwise, if the set is
small and every single data counts, the described techniques for imputation are used. The
Tanja Micalevska 159
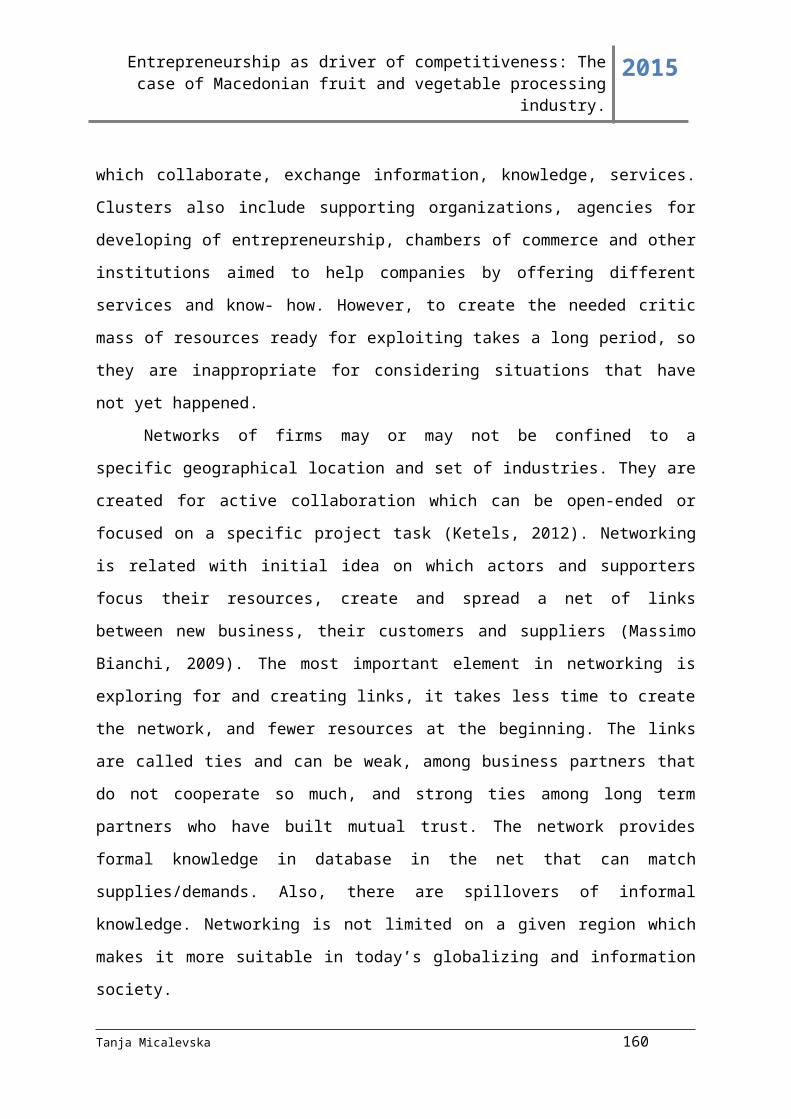
Entrepreneurship as driver of competitiveness: The case of Macedonian fruit and vegetable processing industry.
2015
decision whether to single or multiple imputation techniques is determined by the size and
quality of the data.
The main disputes arise about choosing normalization method and weighing method.
Having into mind that the normalization and weighing are the core of the index, the attention
in those parts needs to be at the highest level, the facts well elaborated, sustained and
supported scientifically. However, it is rarely possible to achieve a complete objectivity in
this stage, so all the subjective decisions should be augmented.
5.4 Construction of the composite index for competitiveness in the Fruit and
vegetable processing industry
The development of a composite index, which will successfully measure the
competitiveness in Fruit and vegetable processing industry in The Republic of Macedonia,
asks for clear and defined concept, strong theoretical basis, clear index dimensions and sub
dimensions, appropriate variables, available data, and method for combining them into an
index.
In this study, the theoretical basis is given in the first part, in the third section named
“Competitiveness on a firm level”. Having into consideration competitiveness
multidimensionality, the sub dimensions among which profitability, productivity, external
competitiveness and growth were discussed and the indicators for their measurement were
presented. Although, indicators for measuring competitiveness sub dimensions are numerous,
in the study, they were selected according to the theoretical and statistical convenience, and
the availability of data.
After deciding about the measures for productivity, profitability, growth and external
performance, followed the dataset observation and treatment of missing values. The percent
of missing values was minimal, but still, case deletion was not considered as an option. The
reason for this is that the population is small, so every data counts. Therefore, by using the
method of single imputation, mean values were entered at places where the data was missing.
Having the complete dataset, variables for the sub indicators were created by using
formulas. In following each of the variables is briefly elaborated.
Tanja Micalevska 160

Entrepreneurship as driver of competitiveness: The case of Macedonian fruit and vegetable processing industry.
2015
i. Productivity is measured as ratio of output and input. The output is the production of
processed fruits and vegetables, while the input is the average number of employs in
the company.
The formula for calculating productivity is:
PRODUCTIVITY = PRODUCTION/ AVERAGE NUMBER OF EMPLOYS
Where:
• Production is the number of products produced in a
year, and it is obtained as (sale +current inventory) –
previous inventory
• Average number of employs is a data taken from the
Central register of The Republic of Macedonia
ii. Profitability can be measured as revenues minus costs, as operative profit margin and
gross profit margin. I use the gross profit margin which is the difference between
revenues and costs, divided by the costs.
PROFITABILITY = (REVENUES-COSTS)/ REVENUES
Where:
- Revenues are all operative and non-operative revenues earned
by a company in a given year
- Costs are all operative and non-operative costs for that same
year
Tanja Micalevska 161

Entrepreneurship as driver of competitiveness: The case of Macedonian fruit and vegetable processing industry.
2015
iii. Growth, as the third sub indicator, can be calculated as ratio of assets in the current
and assets in the previous year. Also, it can be expressed by the ratio of sales in the
current year and sales in the previous year. In this study I use the measure assets in
two successive periods, as given in the following formula.
GROWTH = TOTAL ASSETS IN YEAR T/ TOTAL ASSETS IN YEAR (T-1)
Where:
• Total assets in year T includes all the assets (current and
noncurrent) of the company in year T
• Total assets in year (T-1) includes all the assets (current
and noncurrent) of the company in the year (T-1)
iv. The external competitiveness can be calculated by the sales exported abroad in the
current year and sales exported abroad in the previous year. The formula for external
competitiveness is:
EXTERNAL COMPETITIVENESS = EXPORT IN YEAR T / EXPORT IN YEA R
(T-1)
Where:
• Export in year T - is the percent of the revenues from
sale earned on foreign markets in the year T
• Export in year (T-1) - is the percent of the revenues
from sale earned on foreign markets in the year (T-1)
Tanja Micalevska 162
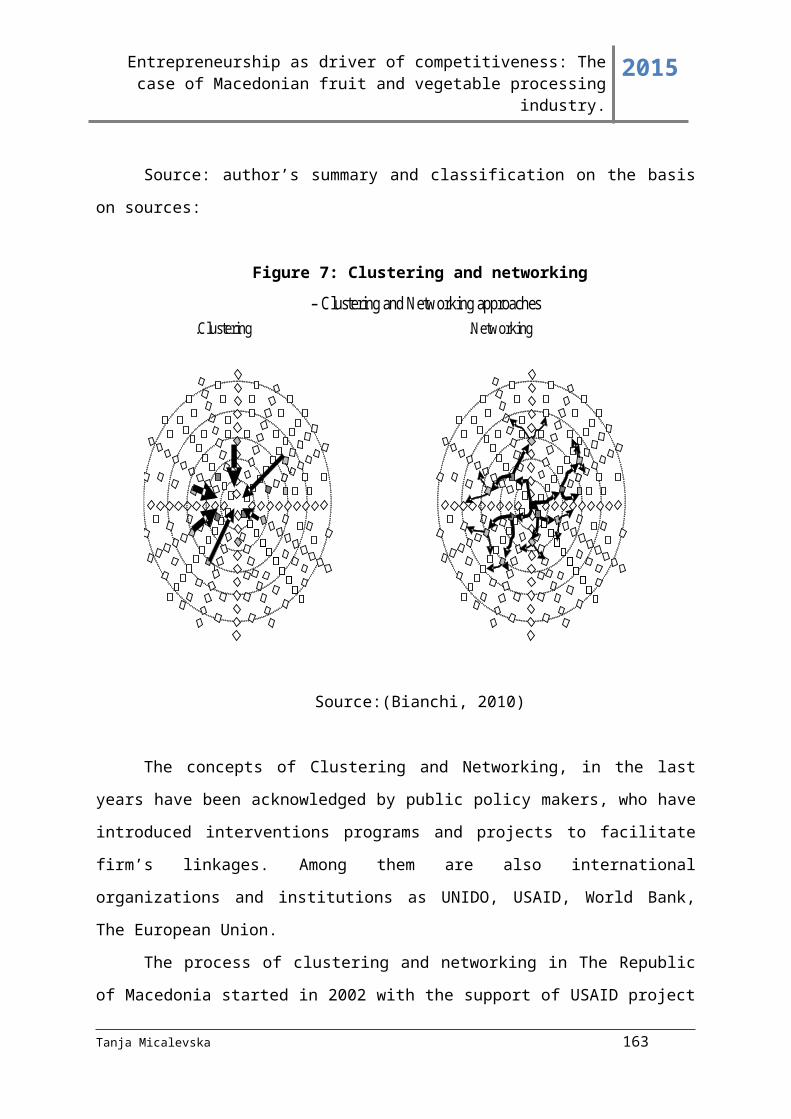
Entrepreneurship as driver of competitiveness: The case of Macedonian fruit and vegetable processing industry.
2015
The new variables were created and then multivariate analyses were done, aimed to
contribute for the reliability of the index, and to indicate if there is a need to include or
exclude some data. Having into consideration the characteristics of multivariate analyses’
methods, which were described before, the method Cronbach’s alpha was taken as the most
appropriate for our sample, because the sample is small, and the use of other methods (Factor
analysis, Principal components) could have given incorrect results.
The Cronbach’s Alpha analyses show some interesting information. For example,
from the difference among Cronbah’s alpha and the standardized value for Cronbach’s alpha
we can notice that variables Productivity, Profitability, Growth and External competitiveness
do not follow normal distribution.
Table 20: Multivariate analysis (Cronbach’s alpha) competitiveness sub
indicators
Case Processing Summary
%
Cases Valid
9
100.0
Excludeda .0
Total
9
100.0
a. Listwise deletion based on all variables in the procedure.
Reliability Statistics
Cronbac
h's Alpha
Cronbac
h's Alpha
Based on
Standardized
Items
N of
Items
.303 .685 4
Source: SPSS author’s calculations
Tanja Micalevska 163
Entrepreneurship as driver of competitiveness: The case of Macedonian fruit and vegetable processing industry.
2015
Then, from the inter-item correlation matrix ( See table 21), we can notice that
correlation among sub indicators used in the creation of the index for competitiveness exists,
but, it is not that high to endanger the reliability and truthfulness of the index, or to signalize
that some of the items should be deleted.
The coefficient of correlation among productivity and profitability is 29,8%, between
productivity and growth is 32.,9%, and between productivity and external competitiveness is
50%. Profitability and growth are in correlation 17,4%, and profitability and external
competitiveness correlation coefficient is 34,6%. Growth and external competitiveness are in
correlation 49,2%. From the coefficients, we see that the highest correlation exist among
growth and external competitiveness
Table 21: Inter-Item Correlation Matrix- competitiveness sub indicators
Inter-Item Correlation Matrix
PRODUCTI
VITY
PROFUTABI
LITY
GROW
TH
EXTERNAL_COMPETITI
VENESS
PRODUCTIVITY 1.000 .298 .329 .473
PROFUTABILITY .298 1.000 .174 .346
GROWTH .329 .174 1.000 .492
EXTERNAL_COMPETITI
VENESS
.473 .346 .492 1.000
Source: SPSS author’s calculations
Finally, the dilemma if there is need to delete items, becomes clearer from the Table
19, where we compare the last column, “Cronbach’s Alpha if item deleted” and the value for
the Cronbach’s Alpha which is 0,303. The values for “Cronbach’s Alpha if item deleted” for
productivity, growth and export competitiveness is smaller than the initial Cronbach’s Alpha,
and the one for profitability is not much higher. Therefore, there is no need to delete any of
the variables, and all four variables can be aggregated into the final index. However, before
the aggregation, they are first normalized and weighted.
Tanja Micalevska 164

Entrepreneurship as driver of competitiveness: The case of Macedonian fruit and vegetable processing industry.
2015
Table 22: Item-Total Statistics – competitiveness sub indicators
Item-Total Statistics
Scale Mean if Item Deleted
Scale Variance if Item Deleted
Corrected Item-Total Correlation
Squared Multiple Correlation
Cronbach's Alpha if Item Deleted
PRODUCTIVITY 5803572.0429
9.033E14
.394 .256 .295
PROFUTABILITY 5840700.0012
9.414E14
.241 .143 .340
GROWTH -396513.0073 6.036E13
.504 .255 .246
EXTERNAL_COMPETITIVENESS
6274340.8775
7.055E14
.509 .385 .055
Source: SPSS author’s calculations
All sub indicators calculated for measuring competitiveness are in the form of
coefficients, and have different measurements. To make them suitable for aggregation, we
use normalization method of Z-scores standardization. The normalization results with new
standardized variables: Z-productivity, Z-profitability, Z-growth and Z-external
competitiveness. The new Z-variables are normally distributed, with mean 0, and standard
deviation =/-3.
Before summarizing normalized variables into the index for competitiveness, they are
given weights. The judgment about attaching weights on index components is one of the
hardest and can change the end results. Considering that the correlation among sub indicators
is not very high, as given in table 19, we assume that the components have equal impact on
the competitiveness and give them equal weights.
Finally, the index is obtained, as sum of the sub indicators. The formula for the index
is:
COMPETITIVENESS = PRODUCTIVITY + PROFITABILITY + GROWTH + EXPORT
COMPETITIVENESS
Tanja Micalevska 165

Entrepreneurship as driver of competitiveness: The case of Macedonian fruit and vegetable processing industry.
2015
5.5Construction of the composite index for entrepreneurship in the Fruit and
vegetable processing industry
The construction process of the index for entrepreneurship starts with the theoretical
basis given in the first part of the study, Chapter 2, where the concept, determinants of
entrepreneurship and each of the components included in this index are elaborated and
explained. Moreover, dimensions are chosen on the basis on the criteria of theoretically,
statistically convenience and availability of data.
The first step after the decision about the sub indicators is the dataset observation. The
data in this part is complete, and all companies have answered the questions in the
questionnaires which can be seen from the analysis of the missing values patterns on Graph
34. The answers were measured with Likert scale and grades (in the range -2+2), were
attached to every question, showing the entrepreneurial capacity of managers in Fruit and
Vegetable processing industry, in discovering opportunities, resources management, risk
management, innovativeness and market approach. Then, for each of these sub dimensions,
were calculated variables. The variable is sum of the grades related to the questions which
illustrate that specific element. They are given with formulas hereinafter.
i. Opportunity recognition is measured as a sum of the grades for the first four questions
in the questioner. So the formula for calculating it is:
OPPORTUNITY RECOGNITION = Q1(grade)+Q2(grade)+Q3(grade)+Q4(grade)
Where:
• Q1 is the capacity for noticing chances to develop
something perspective and valuable
• Q2 is the capacity to often come out with creative ideas
• Q3 is the knowledge and experience before starting this
business
• Q4 is the managers opinion about the number of
contacts they have
Tanja Micalevska 166

Entrepreneurship as driver of competitiveness: The case of Macedonian fruit and vegetable processing industry.
2015
ii. Resource management is calculated at the same way. It is measured as sum of the
grades for the questions considering the use of resources (Question 5-8 in the
questionnaire). Shown with formula the calculation looks like this:
RESOURCE MANAGEMENT= Q1(grade)+Q2(grade)+Q3(grade)+Q4(grade)
Where:
• Q1 is the capability to always look for to use
resources(workers, materials, equipment) more
productively
• Q2 is the power to motivate people to work together in
multifunctional teams, to exchange information, ideas
and skills
• Q3 is the capability to manage to find the capital needed
for starting business, its development and growth
• Q4 is the will to be informed about trends in economy,
politics
iii. Risk taking as the third variable presents a sum of the grades for questions 9-12, and
is given by the following formula
RISK TAKING = Q1(grade)+Q2(grade)+Q3(grade)+Q4(grade)
Where:
• Q1 is the level the person misses working traditional job
because of security.
• Q2 is how much they try to minimize risk
• Q3 is likeness to experiment in the business
• Q4 is the choice made when investing money and the
fear from losing money when invest
Tanja Micalevska 167
Entrepreneurship as driver of competitiveness: The case of Macedonian fruit and vegetable processing industry.
2015
iv. The innovation can be calculated by summing the grades for questions 13-16as given:
INNOVATION = Q1(grade)+Q2(grade)+Q3(grade)+Q4(grade)
Where:
• Q1 is the business success in developing new
products and their sale on the markets
• Q2 is the support of innovative ideas, no matter
which organization level they come from
• Q3 is how often the business introduces innovation
(new products, new marketing strategies, new
distribution channels, new methods of production,
new combination of resources)
• Q4 is the existence of special budget for research
and development of new concepts
v. The marketing approach is sum of the grades from 1 to 5, and is given in the
following formula:
MARKETING APROACH = Q1(grade)+Q2(grade)+Q3(grade)+Q4(grade)
Where:
• Q1 is the priority that is given to satisfying the
needs of the clients
• Q2 shows if there is a market research before
launching a new product , or change some of the
exciting ones
Tanja Micalevska 168

Entrepreneurship as driver of competitiveness: The case of Macedonian fruit and vegetable processing industry.
2015
• Q3 is the level of introducing the customers with the
new products, promotions, and discounts offered
• Q4 is the number of loyal long term customers
The new variables created will be included in the index, but before that, multivariate
analyses are made, in order to explain the reliability of the index, and if needed to exclude
some data. Having into consideration the characteristics of the methods for multivariate
analysis, the method Cronbach alpha is considered again, as the most appropriate, because the
sample is small, and the variables are ordinal. The Cronbach’s alpha is 0.562.
Table 23: Multivariate analysis (Cronbach’s alpha) entrepreneurship sub
indicators
Case Processing Summary
N %
Cases Valid 49 100.0
Excludeda 0 .0
Total 49 100.0
a. Listwise deletion based on all
variables in the procedure.
Reliability Statistics
Cronbach's
Alpha
Cronbach's
Alpha Based on
Standardized
Items N of Items
.562 .640 5
Source: SPSS author’s calculations
Tanja Micalevska 169

Entrepreneurship as driver of competitiveness: The case of Macedonian fruit and vegetable processing industry.
2015
In the analysis we investigate the correlation among opportunity recognition, the use
and management of resources, the propensity for taking risks, innovativeness and the
marketing approach. They are given in the table 24, from which it can be noticed that the
correlation coefficients are not very high, the greatest correlation exists between resource’s
management and market approach, risk taking and innovation.
Table 24: Inter - Correlation Matrix –entrepreneurial elements
Inter-Item Correlation MatrixOPPORTUNITY_REC
RESORCES_MANAGEMENT
RISK_TAKING
INNOVATIVE
MARKET_APPROACH
OPPORTUNITY_REC
1.000 .224 -.008 .216 .151
RESORCES_MANAGEMENT
.224 1.000 .337 .357 .444
RISK_TAKING -.008 .337 1.000 .440 .112INNOVATIVE .216 .357 .440 1.000 .347MARKET_APPROACH
.151 .444 .112 .347 1.000
Source: author’s calculations in SPSS
On table 25, we see the impact of the correlation. Furthermore, all values for
“Cronbach's Alpha if Item Deleted” are smaller than the initial Cronbach's Alpha, except in
the case of opportunity recognition.
Table 25: Item-Total Statistics
Item-Total Statistics
Scale Mean
if Item
Deleted
Scale
Variance if
Item
Deleted
Corrected
Item-Total
Correlation
Squared
Multiple
Correlation
Cronbach's
Alpha if
Item
Deleted
OPPORTUNITY_REC 19.5102 27.547 .213 .094 .672
RESORCES_MANAGEMENT 20.3878 32.159 .489 .313 .411
RISK_TAKING 21.0000 40.917 .262 .264 .540
INNOVATIVE 20.4082 35.955 .485 .319 .442
MARKET_APPROACH 20.0816 38.077 .376 .253 .491
Source: SPSS author’s calculations
Tanja Micalevska 170

Entrepreneurship as driver of competitiveness: The case of Macedonian fruit and vegetable processing industry.
2015
The next step in the index creation process is normalization. Therefore,
standardization is made and Z-scores of the variables for the sub dimensions are created.
Then, weights are attached to the components of the index. The decision for the weighting
method is based on the assumption that the components have equal impact on the
entrepreneurial capacity of managers in Fruit and vegetable processing industry.
Although, we must admit that there is some correlation among the variables,
illustrating the entrepreneurship elements, it is not so high to affect the results. Moreover,
each of the variables has it special and unique meaning for the composite index and their
relations does not make them interchangeable.
Finally, the index is obtained, as sum of the sub indicators. The formula for the index
is
ENTREPRENEURSHIP = OPPORTUNITY RECOGNITION+ USE OF RESOURCES+
RISK TAKING + INNOVATIVENESS + MARKETING APROACH
Tanja Micalevska 171
Entrepreneurship as driver of competitiveness: The case of Macedonian fruit and vegetable processing industry.
2015
Chapter 6: The Regression model
The regression model is used to analyze two or more variables and find their
relationship, the strength and the direction of that relationship. In fact, the regression analysis
examines the dependence of the variables one from another. Therefore, in this kind of
analyses there is one dependent variable, and one or more independent variables.
The process of regression analysis is given on Figure 19.
Figure 19: Regression model
Source: author’s
The first step of the regression analysis process is to define the equation of regression,
which is to identify the form of the relationship (linear, non-linear), then to identify the
direction of the relationship (positive, negative), to make logic analysis which of the variables
is dependent and which is independent.
The next step is to combine the variables into a regression equation which represents
the regression model, and has a systematic component and an error term. The equation can be
used for estimation parameters which are unknown and for forecasting and analyses of
parameters. Therefore, the researcher can make interpolations and extrapolations.
Finally the regression equation is evaluated through tests for statistical significance,
autocorrelation and heteroscedasticity.
Tanja Micalevska 172
Entrepreneurship as driver of competitiveness: The case of Macedonian fruit and vegetable processing industry.
2015
In this study, the regression analysis is used to investigate the relationship between
competitiveness and entrepreneurship, the causality of the one variable upon the other.
Moreover, the main interest is to estimate the quantitative effect of the entrepreneurship over
the competitiveness. Their relation is estimated with the curve given on graph 35.
Graph 35: Regression model entrepreneurship competitiveness
Source:SPSS author’s calculations
The assumption that entrepreneurially oriented companies are more competitive, the
data for companies competitiveness and entrepreneurial capacity and the indexes created,
now are put in an equation.
C = α + βE + ε
Tanja Micalevska 173
Entrepreneurship as driver of competitiveness: The case of Macedonian fruit and vegetable processing industry.
2015
Where:
• The variable C is for competitiveness and is
“dependent”
• E is for entrepreneurship and is “independent,”
• α is a constant amount (the competitiveness of a
company with zero entrepreneurial orientation)
• β is the effect of an additional unit of entrepreneurial
orientation over competitiveness
• ε explains the other factors that influence
competitiveness different from entrepreneurship.
The regression model is based on the assumption that the relationship between
variables is linear and that predicted minus observed values follow the normal distribution.
Tanja Micalevska 174

Entrepreneurship as driver of competitiveness: The case of Macedonian fruit and vegetable processing industry.
2015
CHAPTER 7 RESULTS AND DISCUSSION
7.1The overall competitiveness of fruit and vegetable industry in The Republic of
Macedonia
The overall competitiveness in The Republic of Macedonia is first measured with the
competitiveness index, and companies which hold the best position in the industry according
to the index are pointed out. Then the index is decomposed to its part, in order to see where
the most competitive companies have gained their scores, and in which of the elements of the
competitiveness index they lead.
The results show that industry average score of competitiveness index of Macedonian
fruit and vegetable industry is 0.14, with a standard deviation of 2.8. This number has no
meaning by itself, but is meaningful when compared with values of the index for each
company individually, in order to see if the company is below or above the average. As
shown in Table 22, 50% of the companies, show competitiveness index greater than -0.49
and the remaining 50% are below -0.49.
Table 26: Competitiveness index descriptive analysis
Case Processing Summary
Cases
Valid Missing Total
N Percent N Percent N Percent
COMPETITIVENES
S
49 10
0.0%
0 .0
%
49 10
0.0%
Tanja Micalevska 175
Entrepreneurship as driver of competitiveness: The case of Macedonian fruit and vegetable processing industry.
2015
Descriptives
Statistic Std. Error
COMPETITIVENES
S
Mean .0000 .40972
95% Confidence Interval
for Mean
Lower Bound -.8238
Upper Bound .8238
5% Trimmed Mean .0205
Median -.0611
Variance 8.226
Std. Deviation 2.86802
Minimum -9.77
Maximum 8.58
Range 18.35
Interquartile Range 1.92
Skewness -.205 .340
Kurtosis 3.562 .668
Source: SPSS author’s calculations
The maximum value of the index shows the most competitive company of all, which
in our case is the company Vitalia with a competiveness index of 8.58, then, follows Diem
with competitiveness index 6.04, Trgo produkt with an index 5.12, Peroli with an index 4.31
and Industriski ladilnik with an index of 3.58 (See graph 36).
The least competitive company is Ds foods with a index of -9.77, thenUniverzal
promet with an index of -6.3, Bonum with index -3.92, Global marketing (-3.44), Agrofer(-
3.35).
Tanja Micalevska 176

Entrepreneurship as driver of competitiveness: The case of Macedonian fruit and vegetable processing industry.
2015
Graph 36: Competitiveness index Fruit and vegetable processing industry
Source: SPSS author’s calculations
After, getting the most competitive companies follows decomposition of the
competitiveness index in order to explain where their scores come from. For that purpose, I
made a descriptive statistics for each of the sub indicators variables which are included in the
composite.
The results are the following:
Productivity: The average productivity of companies in fruit and vegetable processing
industry is 0 with a standard deviation of 1. Half of the companies have productivity
greater than 0.2 and the remaining 50% are below 0.2. Once again numbers have not
value by themselves, but in comparison one to another.
Tanja Micalevska 177

Entrepreneurship as driver of competitiveness: The case of Macedonian fruit and vegetable processing industry.
2015
As shown on Graph 37, the maximum productivity from 4.16 has the company
Peroli, then follow Vitalia with productivity of 2,5, Green product with value 1, Diem
with 0.85 and Industriski ladilnik(0.79). The minimum productivity show the
companies Ds foods with value of -2.38, Drak (-2.35), Global marketing (-2.18) .
Graph 37: Productivity of companies in Fruit and vegetable industry
Source: calculations in SPSS
Profitability: The average profitability of companies in fruit and vegetable processing
industry is 0 with a standard deviation of 1 (standardized values). Half of the
companies have profitability greater than 0.139 and the remaining 50% are below
0.139. The maximum profitability from 1.62 has the company Frites An, then folow
Diem (0.57), Industriski ladilnik (0.56), Altra (0.52). The minimum profitability show
the companies Univerzal promet with value of -5.63, Ds foods (-2.87), Agrofer (-0.7)
and Agrolon (-0.4) (See Graph 38).
Tanja Micalevska 178
Entrepreneurship as driver of competitiveness: The case of Macedonian fruit and vegetable processing industry.
2015
Graph 38: Profitability of companies in Fruit and vegetable processing industry
Source: SPSS author’s calculations
Growth: The average growth of companies in fruit and vegetable processing industry
is 0 with a standard deviation of 1. Most of the companies have negative growth, half
of them note growth is less than -0.22 and the remaining 50% are above -0.22. The
maximum growth from 3.85 has the company Trgoprodukt, then follow Milbos (2.4),
Diem (2.25), Vitalia (1.9) and Industriski ladilnik (1.3). The minimum growth show
the companies: Bonum (-2.96), Potkolesino( -0.96), Global marketing (-0.77). (See
graph 39).
Tanja Micalevska 179
Entrepreneurship as driver of competitiveness: The case of Macedonian fruit and vegetable processing industry.
2015
Graph 39: Growth of companies in Fruit and vegetable processing industry
Source: author’s calculations SPSS
Export competitiveness: The average export competitiveness of companies in fruit
and vegetable processing industry is 0 with a standard deviation of 1. Half of the
companies have export competitiveness greater than 0.059 and the remaining 50% are
below 0.059. The maximum export competitiveness from 3.54 has the company
Vitalia, and then follows Diem wit value of 2.3, Trgoproduct 1.09 and Svislon agrar
with 1. The minimum export competitiveness show the companies Ds foods with
value of -4.03, Vipro with -2.3, Baga (-1.05) ( See graph 40).
Tanja Micalevska 180

Entrepreneurship as driver of competitiveness: The case of Macedonian fruit and vegetable processing industry.
2015
Graph 40: External competitiveness of companies in Fruit and vegetable
processing industry
Source: author’s calculations
In the overall competitiveness rankings, Vitalia holds the best position as a result of
its scores in all four sub indicators, which are all, above the average of the industry. For
example the company holds the second highest position in productivity, it is among the five
most profitable companies ranked by profitability, holds the forth position for the indicator
for growth, and in export competitiveness has the first position.
The second company with the highest competitive index is Diem. The company is
fourth in the industry according to the score in productivity, second according to profitability
with value 0.57, holds the third place referring to the growth, and the second in export
competitiveness. Diem, as well as in the case of Vitalia, is among the best in all four
subcomponents, which results with a high final score for the competitiveness.
Tanja Micalevska 181

Entrepreneurship as driver of competitiveness: The case of Macedonian fruit and vegetable processing industry.
2015
The third most competitive company is Trgo product. This company is not among the
five most productive or the five most profitable companies in the industry. However, it is the
fastest growing company in the industry, and it is also among the top three companies which
are export competitive.
Peroli is fourth according to the overall competitiveness index, but it is the most
productive company, with value for the productivity coefficient equal to 4.16, which is the
main factor for its high positioning in the competitive index ranking.
At last, Industriski ladinlik, as the fifth most competitive company in the fruit and
vegetable processing industry, is at the fifth place compared by its productivity, at the third
place by its profitability, and at the fifth place by growth and by export competitiveness.
7.2The entrepreneurial activity in fruit and vegetable industry in The Republic
of Macedonia
The entrepreneurial capacity of managers in fruit and vegetable processing industry in
Republic of Macedonia was measured by creating the entrepreneurship index by aggregating
five sub indicators for each of the entrepreneurial elements: opportunity recognition, resource
management, risk taking, innovation and marketing approach. Then, companies which hold
the best position in the industry according to the index are pointed out, and the index is
decomposed to its part, in order to see where the most entrepreneurial companies have gained
their scores, and in which of the elements of the entrepreneurship index they lead.
The results show that industry average score of entrepreneurship index of Macedonian
fruit and vegetable industry is 0 with a standard deviation of 3.2. This number has no
meaning by itself, but, it is meaningful compared with values of the index for each company
individually, because it can illustrate where is the company position in the industry, below or
above the average. As shown in the graph, 50% of the companies, show entrepreneurship
index greater than -0.87 and the remaining 50% are below -0.87. The negative sign before the
number shows that most of the companies in the investigated industry are not
entrepreneurially managed.
Tanja Micalevska 182

Entrepreneurship as driver of competitiveness: The case of Macedonian fruit and vegetable processing industry.
2015
Table 27: Descriptive analysis of Entrepreneurship index for companies in Fruit
and vegetable processing industry
Case Processing Summary
Cases
Valid Missing Total
NPer
cent NPer
cent NPer
centENTREPRENEURSHIP
49 100.0% 0 .0%
49 100.0%
DescriptivesSta
tisticStd.
ErrorENTREPRENEURSHIP
Mean .0000 .4571595% Confidence
Interval for MeanLower
Bound-.9192
Upper Bound
.9192
5% Trimmed Mean -.0171Median -.0868Variance 10.240Std. Deviation 3.20007Minimum -8.91Maximum 7.22Range 16.13Interquartile Range 3.68Skewness .029 .34
0Kurtosis .581 .66
8 Source: SPSS author’s calculations
The maximum value of the index shows that the most entrepreneurial of all
companies is the company Peroli, with an index of 7.22, and then, follow the companies
Mirana with index 6.90, Altra with an entrepreneurial index 5.81, Ksenos with an index 5.18
and Vitalia with an index of 4.81. (See graph 41)
Tanja Micalevska 183
Entrepreneurship as driver of competitiveness: The case of Macedonian fruit and vegetable processing industry.
2015
The least entrepreneurial company is Ds foods with an index of -8.91, then Universal
promet with an index of -5.07, Agrolon (-4.43), Evrokom (-4.35) and Fritko (-4.19). (See
graph 41)
Graph 41: Entrepreneurship among companies in Fruit and vegetable
processing industry
Source: SPSS author’s calculations
The rank, of the most and the least entrepreneurial companies, is explained with
decomposition of entrepreneurship index. For that purpose, I made a descriptive statistics for
each of the sub indicators variable included in the composite. The sub indicators were created
from the data obtained by the answers of managers on the questions from the questioner.
Opportunity recognition: The first four questions picture the ability of entrepreneurs
to notice opportunities measured through their answers on questions about noticing
chances to develop something valuable, coming out with creative ideas, previous
Tanja Micalevska 184

Entrepreneurship as driver of competitiveness: The case of Macedonian fruit and vegetable processing industry.
2015
knowledge and experience and number of contacts. The answers are given as pie-
charts in graph 42, graph 43, graph 44 and graph 45.
Graph 42: Notice opportunities
Source: author’s calculations
Graph 43: Creative ideas
Tanja Micalevska 185

Entrepreneurship as driver of competitiveness: The case of Macedonian fruit and vegetable processing industry.
2015
Source: author’s calculations
Graph 44: Previous knowledge
Source: author’s calculations
Graph 45: Contacts
Tanja Micalevska 186

Entrepreneurship as driver of competitiveness: The case of Macedonian fruit and vegetable processing industry.
2015
Source: author’s calculations
The average ability to recognize opportunities of companies in fruit and vegetable
processing industry is 0 with a standard deviation of 1. Half of the mangers recognize
opportunities more than 0.04 and the remaining 50% less than 0.04. The maximum capacity
for opportunity recognition is 5.5 and has the manager of the company Peroli, then follow
Bres company (2.5), Diem (0.59), Mirana (0.59), Dentina (0.59) and Vitalia (0.31). The
minimum shows the company Potkolesino with value of -1.3, and the companies Ds foods (-
1), Global marketing (-1), Frutana (-0.7) and Evrokom (-0.7).
Opportunity recognition among companies is given in the graph 46
Graph 46: Opportunity recognition among managers in Fruit and vegetable
processing industry’ companies
Tanja Micalevska 187

Entrepreneurship as driver of competitiveness: The case of Macedonian fruit and vegetable processing industry.
2015
Source: author’s calculations SPSS
Resource management: The questions 5, 6, 7 and 8 in the questionnaire aim to picture
the efficiency with which resources in the industry are managed, and the way they are
combined and recombined by managers in order to create higher value. The graphs
47, 48, 49 and 50 show the factors which determine the resource management of
companies. They refer to the way managers of the companies look for a way to use
resources productively, encourage team work and exchange of information, as well as
if they are informed and willing to use different sources for finding the capital needed
for current operations and growth.
Graph 47: Use of resources
Tanja Micalevska 188
Entrepreneurship as driver of competitiveness: The case of Macedonian fruit and vegetable processing industry.
2015
Source: author’s calculations
Graph 48: Human resources
Tanja Micalevska 189
Entrepreneurship as driver of competitiveness: The case of Macedonian fruit and vegetable processing industry.
2015
Source: author’s calculations
Graph 49: Access to capital
Source: author’s calculations
Graph 50: Informed
Tanja Micalevska 190
Entrepreneurship as driver of competitiveness: The case of Macedonian fruit and vegetable processing industry.
2015
Source: author’s calculations
The average capacity, among managers in Fruit and vegetable processing industry’
companies, to manage resources is 0 with a standard deviation of 1(standardized values). Half
of the companies manage resources more than the median value of 0.018 and the remaining
50% are less than 0.018. The maximum value of resource the management capacity is 4.11
and has the manager of the company Dim komerc, then follow Mirana, Vitalia, Milbos and
Ksenos, while the minimum shows the company Ds foods with value of -2.25 ( See graph
51).
Graph 51: The resource management in the companies in Fruit and vegetable
processing industry
Tanja Micalevska 191
Entrepreneurship as driver of competitiveness: The case of Macedonian fruit and vegetable processing industry.
2015
Source: author’s calculations
Risk taking: The questions 9, 10, 11 and 12, picture the propensity of managers to
take risks. The answers for questions related with the risk appétit are given as pie-
charts in graph 52, graph 53, graph 54 and graph 55.
Graph 52: Traditional job vs entrepreneurship
Tanja Micalevska 192

Entrepreneurship as driver of competitiveness: The case of Macedonian fruit and vegetable processing industry.
2015
Source author’s calculations
Graph 53: Minimize risks
Source author’s calculations
Tanja Micalevska 193

Entrepreneurship as driver of competitiveness: The case of Macedonian fruit and vegetable processing industry.
2015
Graph 54: Experiment
Source: author’s calculations
Graph 55: Risk prospendity
Source author’s calculations
They show that most of the managers of fruit and vegetable processing companies are
not afraid to take risks, and are aware that in order to win profit they must undertake risks.
Tanja Micalevska 194
Entrepreneurship as driver of competitiveness: The case of Macedonian fruit and vegetable processing industry.
2015
However, they do try to minimize the risks, and to undertake calculated risks. The risk
taking’ indicator shows the following characteristics: average propensity to take risks of 0
with a standard deviation of 1(standardized values). Half of the companies’ managers take
risks more than 0.39 and the remaining 50% take risks less than 0.39. The maximum risk
taker is the manager of the company Mirana, then follow Altra, Industriski ladilnik, FritesAn
and Ksenos. The minimum risk taker is the manager of the company Ds foods with value of -
2.6, and also Sika, Evrokom and Fritko. Risk taking propensity by all companies in fruit and
vegetable processing industry is given in the graph 57.
Graph 56: Risk taking propensity among the managers in the Fruit and
vegetable processing industry
Source: author’s calculations
Innovation is illustrated by the questions 13, 14, 15, and 16, about the orientation of
companies on new ideas for products, services, markets, the support of the ideas and
the success in developing and implementing them in the companies. The answers to
Tanja Micalevska 195

Entrepreneurship as driver of competitiveness: The case of Macedonian fruit and vegetable processing industry.
2015
the questions related with introducing new concepts show that companies encourage
ideas, develop new products, and also introduce other types of innovations such as
new markets, new distribution methods. However, they do not always plan special
budget for innovations.
Graph 57: New products, markets
Source author’s calculations
Graph 58: Innovation support
Tanja Micalevska 196

Entrepreneurship as driver of competitiveness: The case of Macedonian fruit and vegetable processing industry.
2015
Source: author’s calculations
Graph 59: Introduce innovation
Source: author’s calculations
Tanja Micalevska 197
Entrepreneurship as driver of competitiveness: The case of Macedonian fruit and vegetable processing industry.
2015
Graph 60: Innovation budget
Source: author’s calculations
Therefore, the innovation indicator shows the following characteristics: average
ability to innovate of 0 with a standard deviation of 1(standardized values). Half of the
managers of companies innovate more than 0.035 and the remaining 50% innovate less than
0.035. The maximum value of the innovation indicator is 1.75 (the company Mirana) then
follow the companies Altra, Diem, Vitalia and Ksenos, while the minimum value is -2.25
(the company Potkolesino). The innovation indicators among all investigated companies are
as shown on Graph 61.
Tanja Micalevska 198
Entrepreneurship as driver of competitiveness: The case of Macedonian fruit and vegetable processing industry.
2015
Graph 61 Innovation among the managers in the Fruit and vegetable processing
industry
Source: author’s calculations
Marketing approach, among companies in fruit and vegetable processing industry
shows that satisfying customers’ needs is primary goal of the companies’ managers,
and they do make marketing research before lancing a new product. Also, they
communicate with clients, inform them about the discounts, promotions, and therefore
they do have loyal customers. (See graphs 62, 63, 64 and 65)
Tanja Micalevska 199

Entrepreneurship as driver of competitiveness: The case of Macedonian fruit and vegetable processing industry.
2015
Graph 62: Satisfying customers
Source
Graph 63: Market research
Source
Tanja Micalevska 200

Entrepreneurship as driver of competitiveness: The case of Macedonian fruit and vegetable processing industry.
2015
Graph 64: communication with customers
Source: author’s calculations
Graph 65: Loyal customers
Source: author’s calculations
Tanja Micalevska 201
Entrepreneurship as driver of competitiveness: The case of Macedonian fruit and vegetable processing industry.
2015
Even through, the general conclusion is that according to their answers they do
implement market approach, some of them, are better than others. (See graph 67). The best
marketing approach has the company Mirana with value of 1.57 for the specific indicator.
Half of the companies have an indicator greater than -1.52, and the other half lower than -
1.52. The lowest value holds the company Grinfungo and it is -1.87
Graph 66 Market approach among the managers in the Fruit and vegetable
processing industry
Source: author’s calculations
In the overall entrepreneurship rankings, Peroli holds the best position as a result of
its scores in sub indicators, especially in opportunity recognition, where the company holds
the first highest position. Also, it is among the first seven companies ranked by resources
combination and recombination, and among the tenth most market oriented firms.
The second company with the highest entrepreneurial index is Mirana. The company
holds the third place in the industry according to the score in opportunity recognition, with a
Tanja Micalevska 202

Entrepreneurship as driver of competitiveness: The case of Macedonian fruit and vegetable processing industry.
2015
value of 0.59, second according to resource management, and holds the first place for risk
taking and managing, innovation and market approach.
The third most entrepreneurial company is Altra. This company is second according
to risk taking, innovation and market approach, and third in resources management.
Ksenos is ranked fourth according to the overall entrepreneurial index. The company
is among the fifth best companies in the areas risk taking, resources managing and
innovating, and is fourth in market orientation.
At last, Vitalia, as the fifth most competitive company in the fruit and vegetable
processing industry, is at the six place compared by the criteria opportunity recognition, at the
third place according to resources managing, fourth place if we consider the innovation
capacity and third in the market oriented approach.
7.3 The relation between entrepreneurial activity and competitiveness of
companies in Fruit and vegetable industry in The Republic of Macedonia
The results obtained about competitiveness index and entrepreneurial index show that
some companies are more competitive and more entrepreneurial than others. In Table 23 we
can see that the number of positive and negative values for entrepreneurship and
competitiveness is similar. We observe that often the same firm that has better score in the
competitiveness indicators, and in the competitiveness composite index, has better scores in
entrepreneurial indicators, and consequently in the composite index for entrepreneurship. For
example the company Vitalia is positioned first according to the competitiveness index, and it
is among the first five most entrepreneurial companies. Similarly, the company Diem which
is second by competitiveness is among the seventh most entrepreneurial companies.
Trgoprodukt is third most competitive, and has high rank for entrepreneurship (seventh
position). Furthermore, Peroli is in the same time the most entrepreneurial managed
company, and fourth most competitive company. Industriski ladinlik is among the fifth most
competitive and the tenth most entrepreneurial firms. Altra holds the third position for
entrepreneurship and is among the seventh most profitable companies. Mirana and Ksenos
also are among the first tenth most entrepreneurial and most competitive firms.
Tanja Micalevska 203
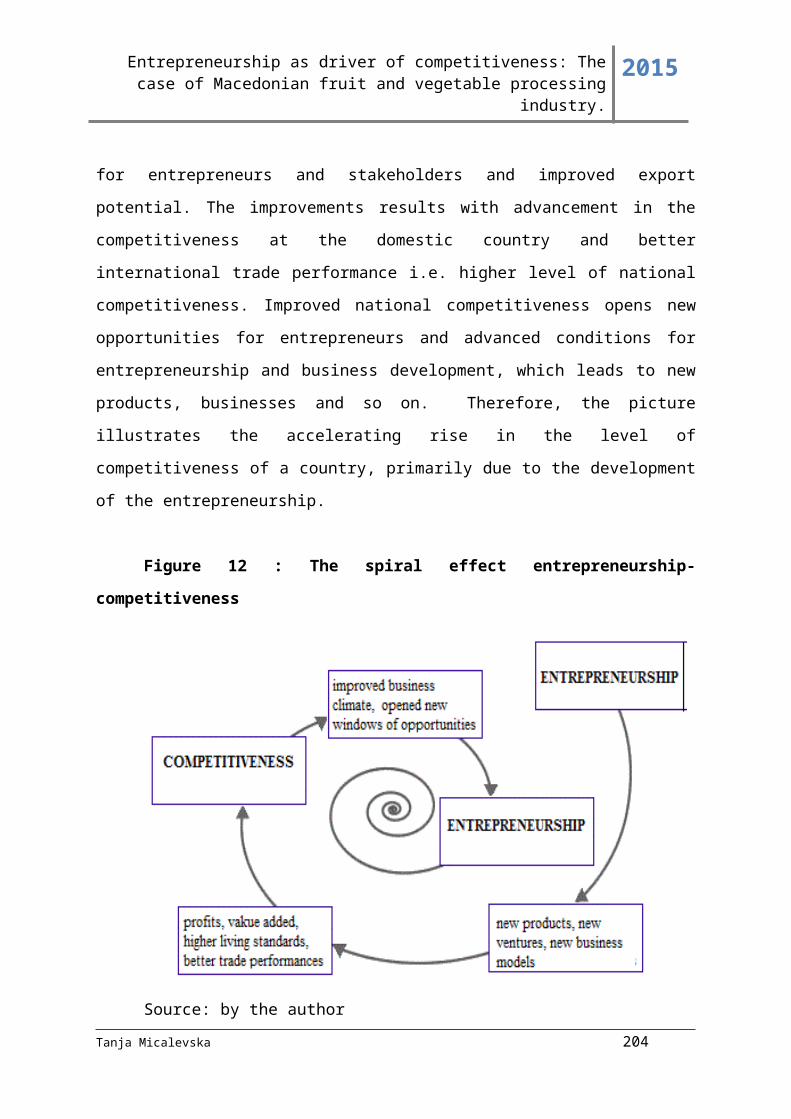
Entrepreneurship as driver of competitiveness: The case of Macedonian fruit and vegetable processing industry.
2015
However, observations are not enough to conclude that entrepreneurship and
competitiveness are related. Therefore, the two commonly used statistical techniques for
investigating relations among variables, correlation and regression analysis, were applied.
The first is the correlation, which investigates if two variables are related with each
other, without considering the direction of the relation. The correlation analysis is illustrated
in table 28, where we can notice that there is relation among variables. The Pearson
Correlation coefficient may have values in the range 0-1, where 0 is a sigh that there is no
correlation, and 1 reflects perfect correlation. Any value, between shows the level of
correlation among variables. In our case, the Pearson coefficient is 0.7, which shows a strog
correlation among entrepreneurship and competitiveness.
Table 28: Correlation between entrepreneurship and comptitiveness
Correlations
COMPETITIVENESS ENTREPRENEURSHIP
COMPETITIVENESS Pearson Correlation 1 .703**
Sig. (2-tailed) .000
N 49 49
ENTREPRENEURSHIPPearson Correlation .703** 1
Sig. (2-tailed) .000
N 49 49
**. Correlation is significant at the 0.01 level (2-tailed).
Source: author’s calculations in SPSS
In order to see the direction of the relation, we use the regression model, which is
illustrated on figure 20.
Tanja Micalevska 204

Entrepreneurship as driver of competitiveness: The case of Macedonian fruit and vegetable processing industry.
2015
Figure 20: Regression model Entrepreneurship and competitiveness
Source SPSS
The model indicates that entrepreneurship has a high power in explaining the
competitiveness variation (R-Square of 0.70). This means that 70% of the variation in the
competitiveness index among firms in fruit and vegetable processing industry is result of the
entrepreneurship presence in those firms, and the other 30% is a result of other factors.
Considering that 70 % is not negligible percent, companies should foster entrepreneurship in
their firms in order to improve competitiveness.
Tanja Micalevska 205

Entrepreneurship as driver of competitiveness: The case of Macedonian fruit and vegetable processing industry.
2015
Table 29 Regression model entrepreneurship and competitiveness
Model Summary
Model RR Square
Adjusted R Square
Std. Error of the Estimate
Change StatisticsR Square Change
F Change df1 df2
Sig. F Change
.703a .495 .484 2.05994 .495 46.045 1 47 .000a. Predictors: (Constant), ENTREPRENEURSHIP
ANOVAb
Model Sum of Squaresdf Mean Square F Sig.1Regression 195.387 1 195.387 46.045 .000a
Residual 199.438 47 4.243
Total 394.825 48
a. Predictors: (Constant), ENTREPRENEURSHIPb. Dependent Variable: COMPETITIVENESS
Coefficientsa
Model
Unstandardize
d Coefficients
Standardize
d
Coefficients
t Sig.
Correlations
Collinearity
Statistics
Std.
Error Beta
Zero
-
order
Partia
l Part
Toleranc
e VIF
(Constant) -
2.652E
-16
294 000 .000
ENTREPRENEURSH
IP
.630 .093 .703 6.78
6
.000 .703 .703 .70
3
1.000 1.00
0
a. Dependent Variable: COMPETITIVENESS
Source: SPSS author’s calculations
Tanja Micalevska 206

Entrepreneurship as driver of competitiveness: The case of Macedonian fruit and vegetable processing industry.
2015
From the table with coefficients, other information about the relation between
entrepreneurship and competitiveness can be seen. They show that when there is no
entrepreneurship in companies, their competitiveness is -2.6 However, this data is not
statistically significant (the p-value is much higher than 0.05).
The second coefficient is more meaningful and it is statistical significant in the same
time. It shows that if there is a change in entrepreneurship in companies, for 1 unit, the
competitiveness will increase for 0.63. This leads to conclusion that if managers in fruit and
vegetable processing industry nurture and develop entrepreneurial skills, attitudes and
behaviors their firms may become more competitive.
Tanja Micalevska 207

Entrepreneurship as driver of competitiveness: The case of Macedonian fruit and vegetable processing industry.
2015
CONCLUSIONS AND RECOMMENDATIONS
Today, after more than 20 years of researching the national competitiveness and in a
time when competitiveness is among the main goals that countries are interested to achieve,
the concept is still not clear enough. Although, there are many definitions about what national
competitiveness is, none of them is generally accepted. Some authors consider
competitiveness as productivity and growth, others, as dominance on international markets,
third as improved living standards and development. Many times researchers equate
competitiveness with its determinants, and by trying to measure the determinants, they create
measures for competitiveness.
One of the most popular measures for competitiveness is The Global Competitive
Index. According to the value of the index, countries are ranked, and the lower the rank, the
greater is the competitiveness of the country. In the case of The Republic of Macedonia the
rank is decreasing continually since 2008, and in 2013-2014 the country was on the 73 place,
which is a relatively good position. Compared with Western Balkans, The Republic of
Macedonia is in a better position of all Western Balkans, except Montenegro. Compared with
the EU countries, The Republic of Macedonia is more competitive than four European
economies which is a good indicator. However, further improvements are needed especially
in the industry/ manufacturing competitiveness.
Industrial competitiveness is important for the overall prosperity of a country.
Manufacturing is the process of converting inputs into final goods and creates the real base
upon which services then develop. In order to have a strong economy and structural
competitiveness manufacturing matters a lot. In The Republic of Macedonia, compared with
other Western Balkans and EU, manufacturing is not as developed. Measured with the CIP
index, the economy shows worse results than other countries in “manufacturing value added”,
and also in “manufacturing exports”. Moreover, its greatest weakness is the technological
advancement.
In order to improve the current situation, it is not enough to state the need to improve,
but rather to analyze where the improvements can be made. I investigated each of the main
industries by using quantitative indicators such as value added, employment and exports by
sector, but also by applying qualitative approach – The Porter Diamond. The results from the
quantitative research clearly show that Wearing apparel sector, Production of iron and steel,
Tanja Micalevska 208
Entrepreneurship as driver of competitiveness: The case of Macedonian fruit and vegetable processing industry.
2015
Tobacco products and processed fish, meat, fruit and vegetable are the key sectors. The
qualitative research stresses the positive and negative sides of each of these industries and
contributes to locate the sectors from main interest for achieving faster development and
country’ national competitiveness.
The results from the research indicate that the industries Processed fruit and vegetable
and Wearing apparel have potential to be competitive on domestic and international markets.
They contribute into the value added, employment and exports. However, their contribution
in the value added should be increased, and that will improve also the international
competitiveness. In the domestic economy, it will contribute in supporting the employment
and wages in the concrete industries. Furthermore, once the spiral is started, the development
of the industries and supporting industries as well will accelerate as well.
In order to achieve the effect and initiate the process of development of industries
measures should be taken on macro, but also on micro level. Macro level measures may
concern the climate for doing business, the legal environment, monetary and fiscal policies.
These areas have already been widely investigated and strategies, plans and programs have
been developed by policymakers to advance them. However, only by themselves,
macroeconomic improvements cannot be effective in achieving the main goal. They need to
be supported by the micro level measures.
The micro level measures depend of the businesses and their manager’s capacities to
notice opportunities, organize the process of work, to innovate, and to have more market
oriented approach. Those capacities depend from the level of the entrepreneurial spirit.
Entrepreneurial spirit in The Republic of Macedonia is relatively high. The GEM Report,
which represents the largest research in entrepreneurship in the World shows that the degree
of the total entrepreneurial activity in The Republic of Macedonia is good. However, this
research includes entrepreneurship motivated by opportunity and entrepreneurship motivated
by necessity.
Entrepreneurship motivated by opportunity is recognizing opportunities and creating a
business upon them. The process of recognizing opportunities is influenced by external
factors economic, demographic, technological and political forces, and by internal factors
which determine the degree to which entrepreneurs are capable to discover the opportunity.
Among them are the knowledge, the alertness, creativity and social contacts of the person.
Entrepreneurs with these characteristics are more likely to identify business chances.
Tanja Micalevska 209
Entrepreneurship as driver of competitiveness: The case of Macedonian fruit and vegetable processing industry.
2015
After identifying opportunities follows their implementation which includes taking
risks, combining recombining and substituting different kinds of resources in order to use
them in the most appropriate and most effective way. If resources are combined in a new
way, or the final result is something new, or there is new way for distribution of the value to
customers, then, there is an innovation.
Innovation is crucial element of entrepreneurship. It is not just having a new idea, but,
also it is important the new solution to be recognized as valuable on the market, and to be
implemented and exploited. Therefore, the other important element of entrepreneurship is the
market orientation.
Market orientation is creating relationships with customers, continuously trying to
satisfy their needs, to attract them and keep them as loyal customers. Considering that
different customers have different whishes and needs, and even the same customers can have
different needs in two different periods, entrepreneurs should be able to analyze them and
recognize their needs. This can be done by close relationships with customers, researching
the trends on a continuous base and acting as the customer is “the king”. Even though it may
sound as a cliché, this statement, it is pure reality in today’s society. Namely, the fast life of
the 21 century and the ever changing environment has created a world where customers
loyalty gained through entrepreneurial approach are the best competitive advantages a firm
can have.
Competitive advantages as ability to recognize opportunities where others see
nothing, to take risks in order to exploit that opportunities, to recombine given resources in a
new way or introduce new ones, to implement innovations and bare the risk of their
acceptation and demand on the market for a long period, are really rare among firms. So, the
firms who have them, the ones who are managed by individuals with special characteristics,
the entrepreneurial ones, are those which will gain the higher profits, the fastest growth, the
higher productivity levels and the higher levels of exports. In one word, entrepreneurial firms
are the ones which are most competitive, and which can improve competitiveness of sectors
where they operate.
Supporting more firms to be entrepreneurial will result with greater competitiveness.
The results from this study show the entrepreneurship in The Fruit and Vegetable industry in
Republic of Macedonia has an important influence over the competitiveness of the industry.
Namely, the entrepreneurial oriented firms have greater chances to be competitive than their
Tanja Micalevska 210
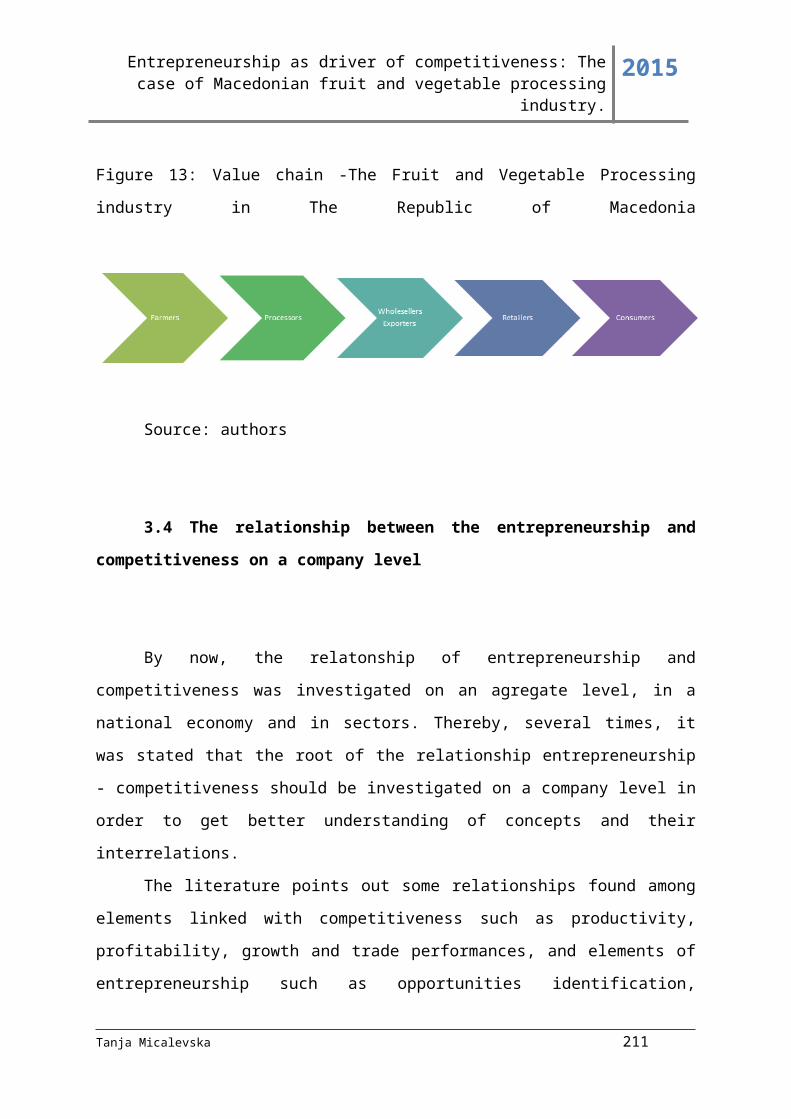
Entrepreneurship as driver of competitiveness: The case of Macedonian fruit and vegetable processing industry.
2015
competitors. The relation between entrepreneurship and competitiveness is relatively strong
and 70% of the competitiveness in companies in Fruit and vegetable processing industry
depends from the presence of entrepreneurship in the way companies are managed, and only
30% of the competitiveness depends from other factors.
The results obtained for the Fruit and vegetable processing industry in Macedonia
may be applied on other industries as well. Therefore, by fostering entrepreneurship in
Macedonian firms and industries, the entire national competitiveness of The Republic of
Macedonia can be improved. By reaching that goal we will be more competitive on European
markets, and consequently the standard of living will be improved.
Tanja Micalevska 211
Entrepreneurship as driver of competitiveness: The case of Macedonian fruit and vegetable processing industry.
2015
CONTRIBUTIONS FROM THE RESEARCH
The results and conclusions of this study have twofold contributions: practical
application for making improvements by entrepreneurs and by policymakers, and scientific
application which is more empirical than theoretical.
First, the practical value of the study lies in the applicability that findings have for the
managers of companies in fruit and vegetable processing industry. Namely, they may see
where their company stands among competitors, which are its strengths or weaknesses
compared with other firms, to discover the reasons for the company’s particular rank, and
detect which dimension should be improved, and which dimensions are satisfying.
Moreover, by pointing out how managers can improve their companies’
competitiveness through developing their entrepreneurial capacity, many managers can
contribute as well. They can understand the key factors in the entrepreneurial management of
the company, and may make efforts to act more entrepreneurially, to risk more, to innovate
etc. For example, if they notice that other firms are more competitive, because they are more
informed about trends, or have better resource management, or introduce more innovations,
and are customer oriented, they detect the areas for potential improvement.
This research may affect improving competitiveness not just in the fruit and vegetable
processing industry, but in many other industries as well. If we take into consideration that
industries are sum of many firms working and producing same, similar or supporting
products, by confirming the positive effect that entrepreneurship can have over the success of
the companies, the competitiveness of a whole range of national industries can be advanced.
For example, managers from other industries can use the methodology and calculate their
competitiveness and their entrepreneurial potential, then, to see the areas of weaknesses in
their firms and in their managing approach, in order to fix them.
Policymakers can calculate the competitiveness and entrepreneurial index on a larger
population, as all manufacturing firms, or all service firms, all companies in the country.
Therefore, based on the results they may take measures to foster entrepreneurship where it is
not developed, review the industrial strategy and so on. This can further improve the
competitiveness of the whole country.
Tanja Micalevska 212
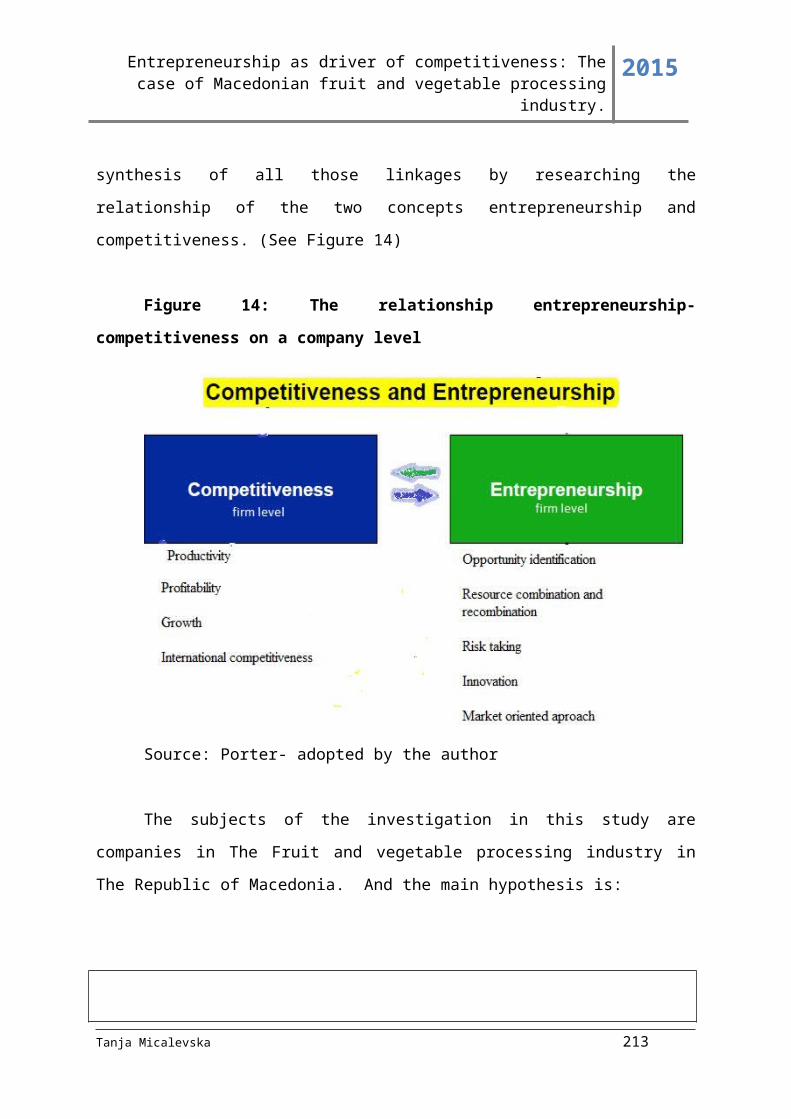
Entrepreneurship as driver of competitiveness: The case of Macedonian fruit and vegetable processing industry.
2015
Second, the significance of the study for scientific purposes, as stated at the
beginning, is more empirical than theoretical. Indeed, in the theory the externalities that
entrepreneurship has for developing competitiveness are not new and unknown. On the
contrary, it has already been investigated by many researchers. However, most studies have
been theoretical review, and less had some quantitative approach. Moreover, they are mainly
oriented on the effect of entrepreneurship on the national industries competitiveness, and
rarely tackle the problem of entrepreneurial elements as determinants and drivers of
competitiveness on a company level. By investigating the indicators and creating composite
indexes for competitiveness and entrepreneurship, this study quantifies those categories and
goes into econometric modeling of their relationship. Therefore, the research is not a
breakthrough, and its scientific contribution is small, mainly enriches the microeconomics
approach in examining competitiveness and entrepreneurship with quantitative calculations.
However, without it, the researches student this area would be less for one.
Tanja Micalevska 213

Entrepreneurship as driver of competitiveness: The case of Macedonian fruit and vegetable processing industry.
2015
LIMITATIONS OF THE RESEARCH
The research has its limitations that I would like to admit, and inform readers and
users about, in order to avoid further misunderstandings.
First, the indicators used for the index are theoretically sustained, but they may
not be the only ones which determine competitiveness or entrepreneurship.
This limitation is covered, by assuming other factors influence in the
regression model.
Second, in the chapter explaining the manufacturing competitiveness the data
for the CIP index used to make calculations and comparisons among countries
is from the year 2010, because of lack of newer data available.
Third, the research used questioner which was delivered to the managers by
mail and phone, so even through the intention was 100% security that the
questions are answered by the managers of the firms, they may have been
answered by other employs.
Fourth, the indexes were constructed by using proxy values which may not
give completely objective results and includes a dose of subjective judgment.
For example, managers gave their own perception about the loyalty of
customers, the introducing of innovations, which does not have to be 100 %
true.
Fifth, in the construction process, the methods used for normalization and
weighting, even through based on theoretical background and other
researchers’ experiences, include subjective judgment by the resercher/
constructor.
At last, the research has found that entrepreneurship determines
competitiveness, states that entrepreneurship should be increased among
managers, but it does not give measures how to improve entrepreneurship in
companies.
Tanja Micalevska 214

Entrepreneurship as driver of competitiveness: The case of Macedonian fruit and vegetable processing industry.
2015
Finally, the research limitations are mainly because of lack of data, time and resources
for further research and validation. However, they are addressed, and it is recommended to be
leveled in further researches.
RECOMMENDATIONS FOR FURTHER RESEARCH
This research has found that there is relationship among entrepreneurship and
competitiveness in fruit and vegetable processing industry, but further research may
investigate their relation in this industry in other countries, and make e comparisons among
countries, or it may explore the relationship in other industries as well.
Also, future researchers may include other factors which are important for
understanding competitiveness and entrepreneurship different from the ones taken into
account in this study and use the same methodology.
Finally, they may offer some measures and strategies how to improve and stimulate
entrepreneurship on a company level.
Tanja Micalevska 215

Entrepreneurship as driver of competitiveness: The case of Macedonian fruit and vegetable processing industry.
2015
BIBLIOGRAPHY
(n.d.). https://composite-indicators.jrc.ec.europa.eu/?q=content/overview
(2011). A guide to productivity management. Singapore: SPRING Singapore Solaris.
A theory of entrepreneurial opportunity identification and development. (2003). 13.
Aldrich, H. E. (2012). An Evolutionary Approach to Entrepreneurship: Selected Essays by Howard E. Aldrich Paperback. (Edward Elgar Publishing BLOG) Преземено 01 04, 2015 од http://elgarblog.com: http://elgarblog.com/2013/02/06/entrepreneurship-an-evolutionary-approach-by-howard-aldrich/
Alexandria Valerio, B. P. (2014). Entrepreneurship Education and Training Programs around the World. Washington: International Bank for Reconstruction and Development / The World Bank.
Amir Mohammad Kolabi, H. K. (2011). Developing Entrepreneurial Marketing Mix: Case Study of Entrepreneurial Food Enterprises in Iran. (5).
André van Stel, M. C. (2004). The effect of entrepreneurship on national economic growth:An analysis using the GEM database. Berlin: The first GEM Research conference:Entrepreneurship, goverment policies and economic growth.
Baron, R. A. (2006). Opportunity Recognition as Pattern Recognition: How Entrepreneurs “Connect the Dots” to Identify New Business Opportunities.
Basile, A. (2012). Entrepreneurial Orientation In Smes: Risk-Taking To Entering International Markets. 7 (2).
Baumol, W. J. (1990). Entrepreneurship: Productive, Unproductive, and Destructive. 98.
Bianchi, M. (2010). The Impact of Project Management Based on Networking- The case of SVILOPIM Project and Its Dissemination on Therritory. (2).
Boulden, G. P. (2002). Thinking Creatively. London: Dorling Kindersley Limmited.
Bruce R. Barringer, R. D. (2011). Entrepreneurship Succesfully Launching New Ventures. Pearson.
Bryman, A. (2012). Social Research Methods. Oxford: Oxford University Press.
Carl H. Christense, A. d. (н.д.). An empirical investigation of the factors influencing exporting success of Brasilian firms.
Tanja Micalevska 216

Entrepreneurship as driver of competitiveness: The case of Macedonian fruit and vegetable processing industry.
2015
Casson, M. (н.д.). http://www.econlib.org/. ( Library of Economics and Liberty) Преземено 04 26, 2014 од Liberty fund Inc: <http://www.econlib.org/library/Enc1/Entrepreneurship.html>
Chan, K. F and Man, Thomas Yunlong and Lau, Theresa. (2002). The Competitiveness of Small and Medium Enterprises: A Conceptualization with Focus on Entrepreneurial Competencies. Journal of Business Venturing , 123-142.
Christopher J. Collins, M. A. (2005). Entrepreneurial human resource strategy.
Commission, E. (n.d.). HORIZONS 2020. Retrieved November 11, 2013, from http://ec.europa.eu/programmes/horizon2020/en/what-horizon-2020: http://ec.europa.eu/programmes/horizon2020/en/what-horizon-2020
comunitie, C. o. (2003). Green PaperEntrepreneurship in Europe. Brussels.
David B. Audretsch, E. E. (2007). Creating Strategic Advantage through Entrepreneurial Governance in New Ventures. Jena Economic Research Papers .
David Deakins, M. F. (2012). Entrepreneurship and Small Firms fourth edition.
David G. Sirmon, M. A. (2007). Managing firm resources in dinamic environments to create value:looking inside the black box. Texas.
David Stoks, N. W. (2010). Entrepreneurship. Cengage Learning EMEA.
Davidsson, P. (2004). Researchin entrepreneurship. Boston: Spinger Science + Business Media Inc.
Depperu, D. (2014, 04 16). Analysing international competitivenss at the firm level: concepts and measures. Повратено од http://www3.unicatt.it/unicattolica/dipartimenti/DISES/
Dess, G.T. Lumpking and Gregory G. (1996). Clarifying the entrepreneurial orientation construct and linking it to performance. The Academy of Management Review , pp. 135-172.
Doing business. (н.д.). (The World Bank) Преземено 05 28, 2013 од http://www.doingbusiness.org/
Drucker, P. F. (2006). Innovation and entrepreneurship-Paperback. New York: Harer & Row Publichers .
Entrepreneurship education at school in Europe, National Strategies,Curricula and Learning objectives. (2012).
Freeman, R. (2008). Labor productivity indicators. OECD Statistics Directorate.
G. Galunic, S. (1997). Resource recomnbinations in the Firm:Knowledge structures and ther potential for Schumpeterian innovation. Fontainebleau, France: INSEAD.
Tanja Micalevska 217

Entrepreneurship as driver of competitiveness: The case of Macedonian fruit and vegetable processing industry.
2015
G.Hickman, B. (1992). International Productivity and Competitiveness. New York: Oxford University Press.
Gal, A. N. (2010). Competitiveness of small and medium sized enterprises - a possible analytical framework.
Gartner, W. B. (2009). "Who is an Entrepreneur?" is the Wrong Question.
Gerald E. Hills, D. J. Opportunity Recognition Processes: A Value Creation Context. Babson-Kauffman Entrepreneurship Research Conference.
Gerasimovska, O. (2013). Republic of Macedonia National Cluster Atlas An Inventory of Clusters, Cluster-Related Networks and Initiatives . Skopje: DATAPONS dooe Skopje.
(2008). New Venture Experiences. Во R. J. Goossen, Entrepreneurial Excellence: Profit from the Best Ideas of the Experts. Objective Systems Pty Ldt.
Group, C. I. (н.д.). 10-Step guide for the construction of a composite indicator.
Handbook on constructing composite indicators Methodology and user guide. (2008). OECD.
Hatzichronoglou, T. (1996). Competitiveness: Relevant Indicators. OECD Science,Technology and Industry Working Papers .
http://www.makemigration.com. (н.д.). Преземено 05 23, 2014 од Emigration Agency of Republic of Macedonia: http://www.makemigration.com/cd/KONZERVNA/start.swf
Igor Filatotche, Xiaohui Liu, Trevor Buck and Mike Wright,. (2009). The export orientation and export performance of high-technology SMEs in emerging markets: The effects of knowledge transfer by returnee entrepreneurs. Journal of International Business Studies .
Ilievska, K. (2015). Marketing in services. Prilep: Faculty of economics - Prilep.
Jason R. Fitzsimmons, P. S. (2005). Growth and Profitability in Small and Medium Sized Australian Firms. Melbourne: AGSE Entrepreneurship Exchange.
John Graham, S. S. (2009). Corporate Finance: Linking Theory to What Companies Do. Joe Sabatino.
Jolanda Hessels, André van Stel. (2008). Во Measuring Entrepreneurship (стр. 265-278). Springer US.
José Ernesto Amorós, N. B. (2014). Global entrepreneurship monitor 2013 Global report. Global Entrepreneurship Research Association (GERA).
Tanja Micalevska 218
Entrepreneurship as driver of competitiveness: The case of Macedonian fruit and vegetable processing industry.
2015
Karali, S. (2013). The Impact of entrepreneurship education programs on entrepreneurial intentions: An application of the theory of planned behavior. Rotterdam: Erasmus University of Rotterdam.
Kathleen Debevec, P. W. (1985). The Effects of Knowledge and Imagery on Advertising Responses to an Innovation. Advances in Consumer Research , 13 . Association for Consumer Research.
Ketels, C. (2012). The impact of clusters and networks of firms on EU competitiveness . WIFO.
Kirzner, I. M. (2008). The Alert and Creative Entrepreneur: A Clarification.
Konstantinidis, C. (2009). The Competitiveness of greek meat entreprices. Chania, Grete: Agg econsearch.
Krugman, P. (1994). Competitiveness: A Dangerous Obsession. Foregin Affairs , 28-44.
Lalinsky, T. (2013). Firm competitiveness determinants: Results of a panel data analysis . National bank of Slovakia.
Latzer, M. (2009). Information and Communication Technology Innovations:Radical & Disruptive? Vague Concepts – Delicate Choices – Conflicting Results. Zurich: New Media & Society.
Leora F. Klapper, Anat Lewin and Juan Manuel Quesada Delgado . (2009, May 01). The Impact of the Business Environment on the Business Creation Process. World Bank Policy Research Working Paper No. 4937 .
Lorz, M. (2011). The Impact of Entrepreneurship Education on Entrepreneurial Intention. St. Gallen: The University of St.Gallen, School of Management, Economics, Law, Social.
Louis E. Boone, D. L. (2011). Contemporary businesss. Hoboken: John Wiley & Sons.
Macedonia, I. (2014). Agriculture and agroprocessing industry in Republic of Macedonia. Skopje: Agency for Foreign Investments and and Export Promotion of Republic of Macedonia.
Machačová Jana, D. E. (2008). Innovation Infrastructures in the Western Balkan Countries. Centre for Social Innovation (ZSI).
Marika Baseska - Gjorgjieska, M. M. (2012). Formal and Informal Education in Entrepreneurship and SME Management–Current Situation and Tendencies in Macedonia.
Marinkovic, I. (2011, 05). http://wbc-inco.net/. Преземено 03 06, 2015 од http://wbc-inco.net/object/news/3512
Tanja Micalevska 219

Entrepreneurship as driver of competitiveness: The case of Macedonian fruit and vegetable processing industry.
2015
Mário Raposo, A. d. (2011). Entrepreneurship education: Relationship between education and entrepreneurial activity. 23 (3).
Martin Andersson, P. B. (2010). Entrepreneurs, creative destruction and production, entrepreneurship by type, sector and sequence. MICRO-DYN Working Paper no. 36/10 .
Massimo Bianchi, L. T. (2009). The Networking in Transition Countries Project Management. Bologna: University of Bologna.
McClelland, D. C. (2010). The Achieving Society Paperback . New York: A free press paperback The Macmilian company.
(2001). Measuring productivity OECD Manual.
Mehdi Aman Allah, H. N. (2011). Entrepreneurship and risk – taking . Singapore : International Conference on E-business, Management and Economics, Singapore .
Naudé, W. (2013, Juli). Entrepreneurship and Economic Development:Theory, Evidence and Policy. Bonn, Germany.
Nikolovski, D., & Micalevska, T. (2012). THE IMPACT OF ECONOMIC CRISIS ON THE EASE OF DOING BUSINESS IN THE WESTERN BALKANS COUNTRIES. Banja Luka: Faculty of Economics, University of Banja Luka.
Office, S. S. (n.d.). State Statistical Office. Преземено 11 15, 2013 од State Statistical Office web site: http://www.stat.gov.mk/
Ourania Notta, A. V. (2011). Competitiveness in food and beverage manufacturing industries. Department of International Trade, Kastoria Campus, TEI of Western Macedonia.
Panagiotis Liargovas, K. S. (2010). Factors Affecting Firm Competitiveness: The Case of Greek Industry. 2.
Parker, S. (2011). Sampling Versus Census:Sampling Versus Census:. Lake Zurich: TNS Employee Insights.
Pasquale Commendatore, Salvatore D’Acunto, Carlo Panico, Antonio Pinto. (2001, September 01). KEYNESIAN THEORIES OF GROWTH. Преземено September 03, 2013 од http://growthconf.ec.unipi.it/papers/Commendatore.PDF
Peter J. Buckley, C. L. (1988). Measures of International Competitiveness: A critical survey.
Peter Skarzynski, R. G. (2008). Innovation to the core. Harvard Business Press.
Petreski, G. (2002). Economic growth and development. Skopje: Faculty of Economics Skopje.
Tanja Micalevska 220
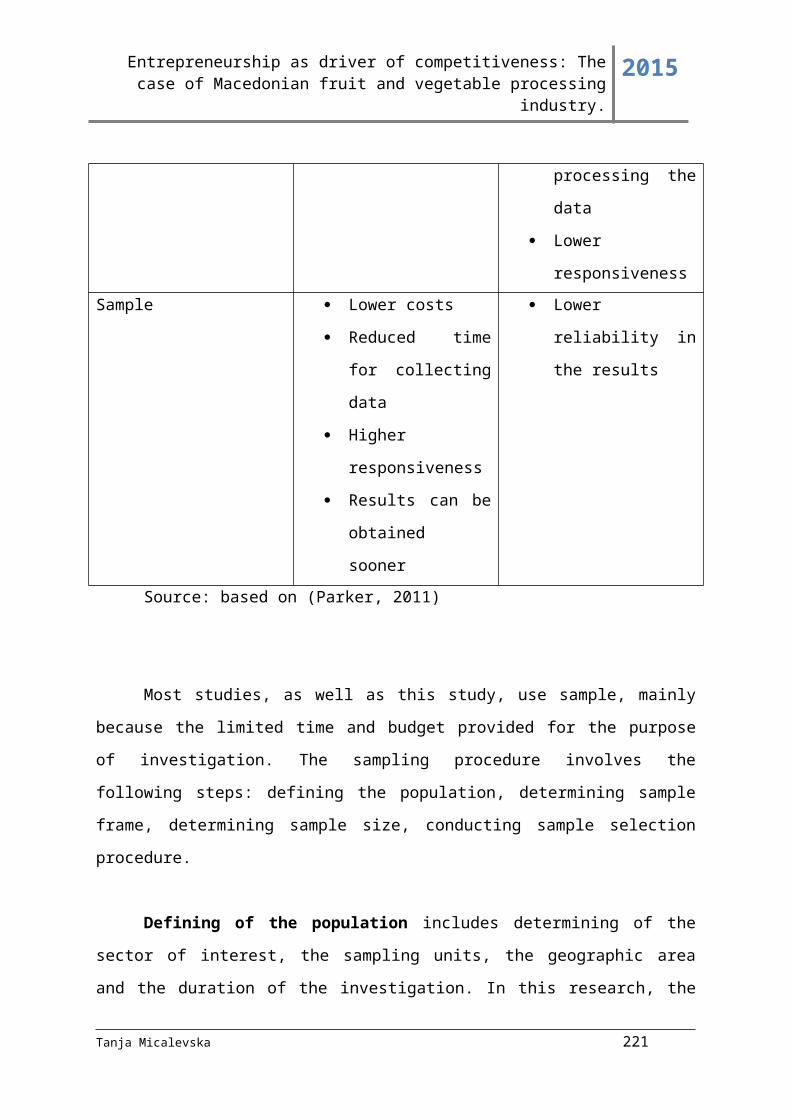
Entrepreneurship as driver of competitiveness: The case of Macedonian fruit and vegetable processing industry.
2015
Philippe Aghiony, U. A. (н.д.). What Do We Learn From Schumpeterian Growth Theory? Преземено 12 30, 2014 од http://scholar.harvard.edu: http://scholar.harvard.edu/files/aghion/files/what_do_we_learn_0.pdf
Porter, M. E. (1988). Competitive strategy. Free Press, a Divivsion of SIMON & SCHUSTER.
Porter, M. (2011). Innovation and Competitiveness.
Porter, M. (2008). On Competition, Updated and Explained Edition. Harvard Business School Publishing Corporation.
Porter, M. (н.д.). The Five Competitive Forces That Shape Strategy. Hardvard Business Reiew .
Praag, C. M. (1999). Some clasic views on entrepreneurship. 147 (3).
Priya Dhamija Gupta, S. G. (2013). Firm growth and its determinants.
Processing industtry of Republic of Macedonia. (н.д.). (Emigration agency of Republic of Macedonia) Преземено 6 25, 2014 од http://www.makemigration.com/cd/KONZERVNA/start.swf
Radmil Polenakovik, D. S. (2014). Entrepreneurial Learning Strategy of the Republic of Macedonia . Skopje: European Training Foundation.
Rajshree Agarwal, D. A. (2008). The Process of Creative Construction: Knowledge Spillovers, Entrepreneurship and Economic Growth. JENA ECONOMIC RESEARCH PAPERS .
Rasha H. A. Mostafa, C. W. (2005). Entrepreneurial orientation, commitment to the Internet and export performance in small and medium sized exporting firms . 3 (4).
Renko, L. Edelman and H. Yli. (2010). The Impact of Environment and Entrepreneurial Perceptions on VentureCreation. Entrepreneurship Theory and , 833-856.
Roceska, S. (2003). International Trade. Prilep: Faculty of Economics Prilep.
Rocha, V. C. (2012, April). The entrepreneurship in economic theory from an invisible man toward a new research field. Преземено 07 15, 2013 од http://wps.fep.up.pt/wps/wp459.pdf
Romer, P. M. (1994). The Origins of Endogenous Growth. The Journal of economic perspectives , 3-22.
Rugg, D. (н.д.). An introduction to indicators. UNAIDS Monitoring and Evaluation Fundamentals .
Tanja Micalevska 221

Entrepreneurship as driver of competitiveness: The case of Macedonian fruit and vegetable processing industry.
2015
Salvador, Heinz D. Kurz & Neri. (н.д.). Theories of Economic Growth – Old and New. Повратено од http://www.uni-graz.at/heinz.kurz/pdf/HKNS_Growthconf.pdf
Salvadori, N. (2003). The Theory of Economic Growth: A 'classical' Perspective edited by Neri Salvadori. Cheltenham: Edward Elgar Publishing Limited .
Schumpeter, J. A. (1939). Business Cycles: A Theoretical, Historical, and Statistical Analysis of the Capitalist Process.
Schumpeter, J. (1934). Theory of economic development. Cambridge: MA: Harvard University Press.r.
Seymour, N. A. (н.д.). DEFINING ENTREPRENEURIAL ACTIVITY:Definitions Supporting Frameworks for Data Collection. Преземено 08 05, 2014 од www.oecd.org: http://www.oecd.org/std/business-stats/39651330.pdf
Siri Roland Xavier, D. K. (2012). Global Entrepreneurship Monitor 2012 Global Report. GERA.
Smith, J. L. (2006). Creating Competitive Advantage. New York: The Doubleday Broadway Publishing Group.
Sotirovski, K. (2004). Statistics. Prilep: Faculty of economics - Prilep.
Stojkov, M. (2002). Development of economic thought. Skopje: Faculty of Economics Skopje.
Stojkov, M. (2008). Development of the economic thought. Skopje: Ekonomski fakultet Skopje.
T.K.Das, B. -S. (1998). Time and Entrepreneurial risk behaviour.
Taki Fiti, V. H.-V. (2007). Entrepreneurship. Skopje: Faculty of economics Skopje.
Thaddeus, E. (2012). Perspectives: Entrepreneurship Development & Growth of Enterprises in Nigeria. Entrepreneurial practice review .
(2013). The Global Competitiveness Report 2013–2014. Geneva: World Economic Forum.
(2013). The Industrial Competitiveness of Nations Looking Back, forging ahead. Vienna: UNIDO.
Thomas M. Cooney. (2012). Entrepreneurship Skills for Growth-Orientated Businesses. Copenhagen: Workshop on ‘Skills Development for SMEs and Entrepreneurship’,.
Trajkoski, B. (1997). Delovni finansii so finansiski menadžment.
Tanja Micalevska 222

Entrepreneurship as driver of competitiveness: The case of Macedonian fruit and vegetable processing industry.
2015
Trott, P. (2008). Innovation management and new product development fourth eddition. Pearson Education Limited.
United Nations Statistics Devision. (2013). (United Nations Publication Board) Повратено од http://unstats.un.org/unsd/cr/registry/regcs.asp?Cl=2&Lg=1&Co=D
Viramgami, H. S. ( 2007). Fundamentals of Entrepreneurship. New Delhi: APH Publishing.
Walonick, D. S. (2004). Survival Statistics. Bloomington: StatPac, Inc.
Wei Lee Lim, S. R. (2015). Opportunity Recognition Framework: Exploring the Technology Entrepreneurs. 5 (2).
Yumkella, K. K. (2013). The Industrial Competitiveness of Nations Looking back, forging ahead. Vienna: United Nations.
Zoltan Acs, E. A. (2010). The Global Entrepreneurship and Development Index: A Brief Explanation. London.
Tanja Micalevska 223
Entrepreneurship as driver of competitiveness: The case of Macedonian fruit and vegetable processing industry.
2015
APENDIXES
Appendix 1
Tanja Micalevska 224

Entrepreneurship as driver of competitiveness: The case of Macedonian fruit and vegetable processing industry.
2015
Appendix 2
Tanja Micalevska 225
Entrepreneurship as driver of competitiveness: The case of Macedonian fruit and vegetable processing industry.
2015
Appendix 3
Tanja Micalevska 226

Entrepreneurship as driver of competitiveness: The case of Macedonian fruit and vegetable processing industry.
2015
Appendix 4
Questionarie
Please nite the answer which is closest to your oppinion related to the statement
1 . I started this business because I noticed a chance to develop something perspective and valuable
o I totaly agree
o I agree o Niether agree niether disagree
o o I disagree O I totaly disagree
2 . I often come out with creative ideas
o I totaly agree
o I agree o Niether agree niether disagree
o o I disagree O I totaly disagree
3 . I have had previous knowlegde and experience before starting this business
o I totaly agree
o I agree o Niether agree niether disagree
o o I disagree O I totaly disagree
4 . I have many contacts
o I totaly agree
o I agree o Niether agree niether disagree
o o I disagree O I totaly disagree
Tanja Micalevska 227

Entrepreneurship as driver of competitiveness: The case of Macedonian fruit and vegetable processing industry.
2015
5 . I awlays look for a way to use resources(workers, materials, equipment) more productively
o I totaly agree
o I agree o Niether agree niether disagree
o o I disagree O I totaly disagree
6 . People in my organisation are motivated to work together in multifunctional teams, to exchange information, ideas and skills
o I totaly agree
o I agree o Niether agree niether disagree
o o I disagree O I totaly disagree
7 . I awlays manage to find the capital needed for starting business, its development and growth
o I totaly agree
o I agree o Niether agree niether disagree
o o I disagree O I totaly disagree
8 . I am trying to be informed for all actuel trends in economy, politics
o I totaly agree
o I agree o Niether agree niether disagree
o o I disagree O I totaly disagree
9. What I miss in working traditional job is security
o I totaly agree
o I agree o Niether agree niether disagree
o o I disagree O I totaly disagree
Tanja Micalevska 228

Entrepreneurship as driver of competitiveness: The case of Macedonian fruit and vegetable processing industry.
2015
10 . I am trying as much as I can to minimize risk
o I totaly agree
o I agree o Niether agree niether disagree
o o I disagree O I totaly disagree
11. I like to experiment in the business
o I totaly agree
o I agree o Niether agree niether disagree
o o I disagree O I totaly disagree
12. I am not afraid of losing money, you must invest in order to gain
o I totaly agree
o I agree o Niether agree niether disagree
o o I disagree O I totaly disagree
13. My business is succesfull in developing new products and their sale on the markets
o I totaly agree
o I agree o Niether agree niether disagree
o o I disagree O I totaly disagree
14 .In my company innovative ideas are supported, no matter which organization level they come from
o I totaly agree
o I agree o Niether agree niether disagree
o o I disagree O I totaly disagree
15 . My business often introduces innovation( new products, new marketing strategies, new distribution chanells, new methods of production, new combination of resources)
o I totaly agree
o I agree o Niether agree niether disagree
o o I disagree O I totaly disagree
Tanja Micalevska 229
Entrepreneurship as driver of competitiveness: The case of Macedonian fruit and vegetable processing industry.
2015
16. In the company we have budget for research and development of new concepts
o I totaly agree
o I agree o Niether agree niether disagree
o o I disagree O I totaly disagree
17 . Satisfying the needs of my clients is one of my primary goals
o I totaly agree
o I agree o Niether agree niether disagree
o o I disagree O I totaly disagree
18 . Before launcing a new product , or change some of the excisting we make market research
o I totaly agree
o I agree o Niether agree niether disagree
o o I disagree O I totaly disagree
19 . We introduce our customers with the new products, promotions, and discounts offered
o I totaly agree
o I agree o Niether agree niether disagree
o o I disagree O I totaly disagree
20. We have loyal longterm customers
o I totaly agree
o I agree o Niether agree niether disagree
o o I disagree O I totaly disagree
Tanja Micalevska 230