Embed Size (px)
Citation preview
Coverage: United Kingdom Theme: The Economy Released: 29 May 2019 Next Release: Spring 2020 Frequency of release: Annual Media contact: HMRC Press Office (Business) 03000 585028 Out-of-hours: 07860 359544 Statistical contacts: Stephen Bennett Chris Nash [email protected] KAI Direct Business Taxes Room 3/60 HM Revenue and Customs 100 Parliament Street London SW1A 2BQ Website: https://www.gov.uk/government/organisations/hm-revenue-customs/about/statistics
Enterprise Investment Scheme Seed Enterprise Investment
Scheme and Social Investment Tax Relief
May 2019
Statistics on Companies raising funds
2
Contents
Section 1: Key points and summary 3
Section 2: Introduction 6 About these statistics 6 Who might be interested in these statistics? 7
Section 3: Commentary 8
3.1 Enterprise Investment Scheme (EIS) 8 EIS: Number of EIS companies and amount of investment 8 EIS: New investment 10 EIS: Industry sector 11 EIS: Size of investment per company 13 EIS: Geographical region of company registration 14 EIS: Investors claiming Income Tax relief under EIS 15
3.2 Seed Enterprise Investment Scheme 16 SEIS: Number of SEIS companies and amount of investment 16 SEIS: Industry sector 19 SEIS: Size of investment per company 21 SEIS: Geographical region of company registration 22 SEIS: Investors claiming Income Tax relief under SEIS 23
3.3 Social Investment Tax Relief 24 SITR: Number of social enterprises and amount of investment 24
Section 4: Advance Assurance Requests (AARs) 26 EIS: Number of AARs received and outcomes 27 SEIS: Number of AARs received and outcomes 28 SITR: Number of AARs received and outcomes 29
Section 5: Background information 30 Policy background 30 Data sources 31 Methodology and reliability of the estimates 32 Revisions to previously published tables 33 Statistical Tables 33 User engagement 33 UKSA Assessment 33 Contact points 34
Annex A: Statistical reference tables 35
Section 1: Key points and summary
Enterprise Investment Scheme
Since the Enterprise Investment Scheme (EIS) was launched in 1993-94, 29,770
companies have received investment and over £20 billion of funds have been raised.
In 2017-18, 3,920 companies raised a total of £1,929 million of funds under the EIS
scheme. This is an increase from 2016-17, when 3,655 companies raised £1,901
million.
In 2017-18, a total of £759 million of investment was raised by the 1,710 companies
raising funds under the EIS scheme for the first time.
In 2017-18, companies from the Information and Communication sector accounted
for £641 million of investment (33% of all EIS investment).
London and the South East accounted for the largest proportion of investment with
companies registered in these regions receiving £1,283 million (67% of all EIS
investment) in 2017-18.
Seed Enterprise Investment Scheme
Since the Seed Enterprise Investment Scheme (SEIS) was launched in 2012-13, 12,900
companies have received investment and over £1 billion of funds have been raised.
In 2017-18, 2,320 companies raised a total of £189 million of funds under the SIES
scheme. This compares with 2016-17 when 2,425 companies raised £187 million.
Over 1,700 of the companies were raising funds under the SEIS scheme for the first
time in 2017-18, representing £159 million of investment.
In 2017-18, companies from the Information and Communication sector accounted
for £69 million (37% of all SEIS investment).
London and the South East accounted for the largest proportion of investment, with
companies registered in these regions receiving £117 million (67% of SEIS
investment) in 2017-18.
4
Social Investment Tax Relief
In 2017-18, 20 social enterprises received investment through the Social Investment
Tax Relief (SITR) scheme, and £1.4 million of funds were raised. This is a decrease
from 2016-17, when 30 enterprises raised £2.5 million. However, the 2017-18 figure
is likely to be revised upwards as more returns are received.
Since SITR was launched in 2014-15, 80 social enterprises have raised funds of £6.7
million through the scheme.
Advance Assurance Requests (AAR)
Since 2006-07, there have been a total of 30,965 AAR applications received for EIS,
and of these 25,430 (82%) have been approved.
In 2018-19, 3,270 AAR applications for EIS were received and 2,040 (62%) approved.
This is a decrease from 2017-18 when 3,815 AAR applications were received and
2,860 (75%) approved. The fall in the number of applications are likely to be due to a
change in the advance assurance service as described in more detail on page 26. The
approval rate for 2018-19 is likely to increase as more AAR applications are processed
– at this stage last year, 2,645 (69%) of the 2017-18 applications had been approved.
Since 2012-13, there have been a total of 19,820 AAR applications received for SEIS,
and of these 16,136 (82%) have been approved.
In 2018-19, 2,585 AAR applications for SEIS were received and 1,550 (60%) approved.
This is a decrease from 2017-18, when 3,375 AAR applications were received and
2,530 (75%) approved. The fall in the number of applications are likely to be due to a
change in the advance assurance service as described in more detail on page 26. The
approval rate for 2018-19 is likely to increase as more AAR applications are processed
– at this stage last year, 2,360 (70%) of the 2017-18 applications had been approved.
Since 2014-15, there have been a total of 390 AAR applications received for SITR, and
of these 250 (64%) have been approved.
In 2018-19, 50 AAR applications for SITR were received, and 25 (50%) approved. This
is a decrease from 2017-18 when 105 AAR applications were received and 40 (38%)
approved. The fall in the number of applications are likely to be due to a change in
the advance assurance service as described in more detail on page 26. The approval
rates are likely to increase as more AAR applications are processed – at this stage last
year, 37% of the 2017-18 applications had been approved.

5
Note While companies have a period of several years after shares are issued to submit a compliance statement (the EIS1, SEIS1 and SITR1 forms), the majority of these returns are made within three years. Therefore, the figures in this release, and particularly for 2017-18, are likely to be revised in future due to applications that have not yet been received or advance assurance applications received in 2018-19 that require further processing.
6
Section 2: Introduction
About these statistics
This is a National Statistics publication produced by HM Revenue & Customs (HMRC). It provides information on the number of companies raising funds, the number of subscriptions and the amounts raised through the Enterprise Investment Scheme (EIS) and Seed Enterprise Investment Scheme (SEIS). It also includes Official Statistics on social enterprises raising funds through the Social Investment Tax Relief (SITR) scheme. The EIS, SEIS and SITR are three of four tax-based Venture Capital schemes, the other being the Venture Capital Trust scheme1. This release includes the first estimates for 2017-18. The figures for 2015-16 and 2016-17 include small revisions and minor updates, arising from the receipt of a small number of further EIS1 and SEIS1 forms for these years.
The publication also provides information on the industrial and geographical breakdown of EIS and SEIS companies, the distribution of companies by the amounts of funds raised, and the distribution of investors by the size of their investment. Statistics on companies raising funds, subscriptions and amounts raised are based on the EIS1, SEIS1 and SITR1 returns received so far. Statistics on investors using the EIS and SEIS schemes are derived from Self-Assessment tax returns.
Section 1 summarises the key statistical points and Section 3 presents an overview of the statistics and discusses recent trends. In Section 4, this release includes updated estimates for Advanced Assurance Requests (AARs). As part of the qualifying process for seeking investment through the schemes, companies can provide a return to HMRC in advance of a share issue to check that it will meet the qualifying conditions for these conditions for these schemes. Section 5 provides background information, including a link to further detail on the policy background and key policy changes, and information on the data sources and methodology used to derive these statistics. Copies of the statistical tables are included in Annex A.
The next release is planned to be in Spring 2020.
These National Statistics are produced to the professional standards set out in the Code of Practice for Statistics (2018)2. For more information on Official and National Statistics and the governance of statistics produced by public bodies, please see the UK Statistics website: www.statisticsauthority.gov.uk.
HMRC Official and National Statistics can be found on the gov.uk website: https://www.gov.uk/government/organisations/hm-revenue-customs/about/statistics
1 Further information on the EIS and SEIS schemes is included in Section 5: Background Information 2 https://www.statisticsauthority.gov.uk/gsspolicy/code-of-practice-for-statistics/
7
Who might be interested in these statistics?
This publication is likely to be of interest to policy makers in government, academics, research organisations, the media, the Venture Capital associations and companies raising funds under the EIS, SEIS and SITR schemes. It will be of particular interest to investors investing in Venture Capital schemes.
People interested in this publication may also be interested in the National Statistics publication Venture Capital Trusts (VCT):
https://www.gov.uk/government/collections/venture-capital-trusts-statistics
We continue to welcome feedback on this release and the range of statistics presented. Contact details are included within Section 5.
8
Section 3: Commentary
3.1 Enterprise Investment Scheme (EIS)
EIS: Number of EIS companies and amount of investment
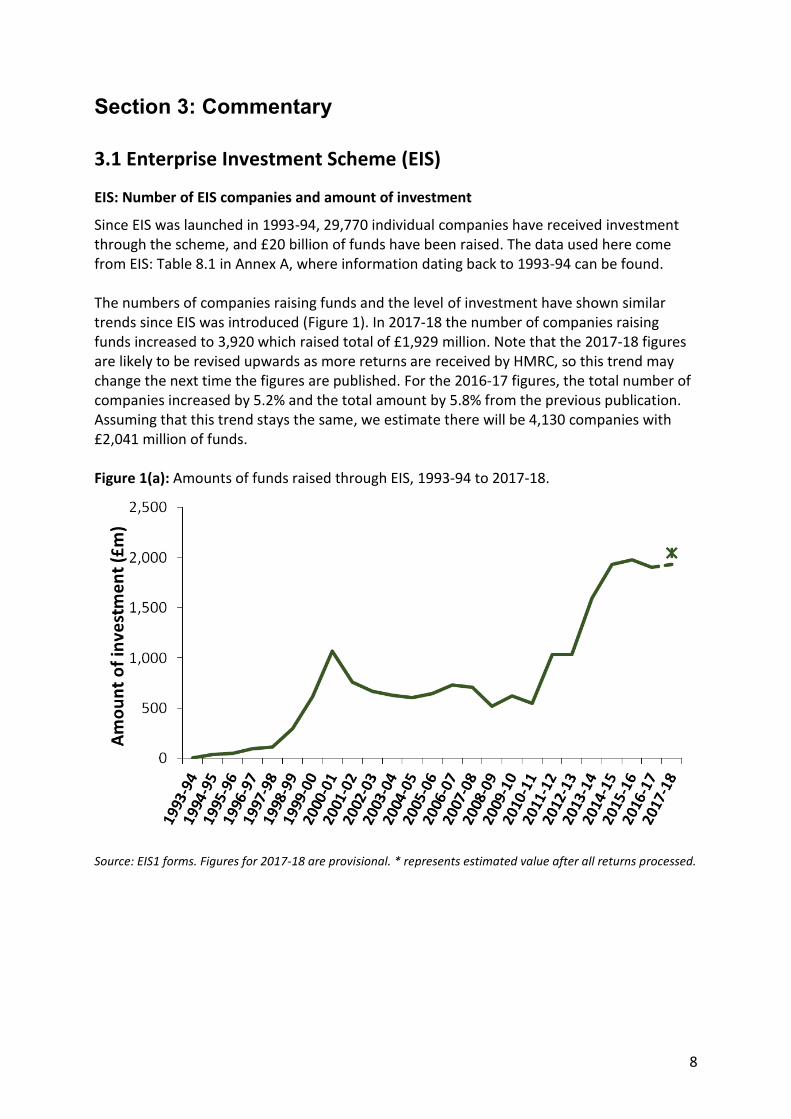
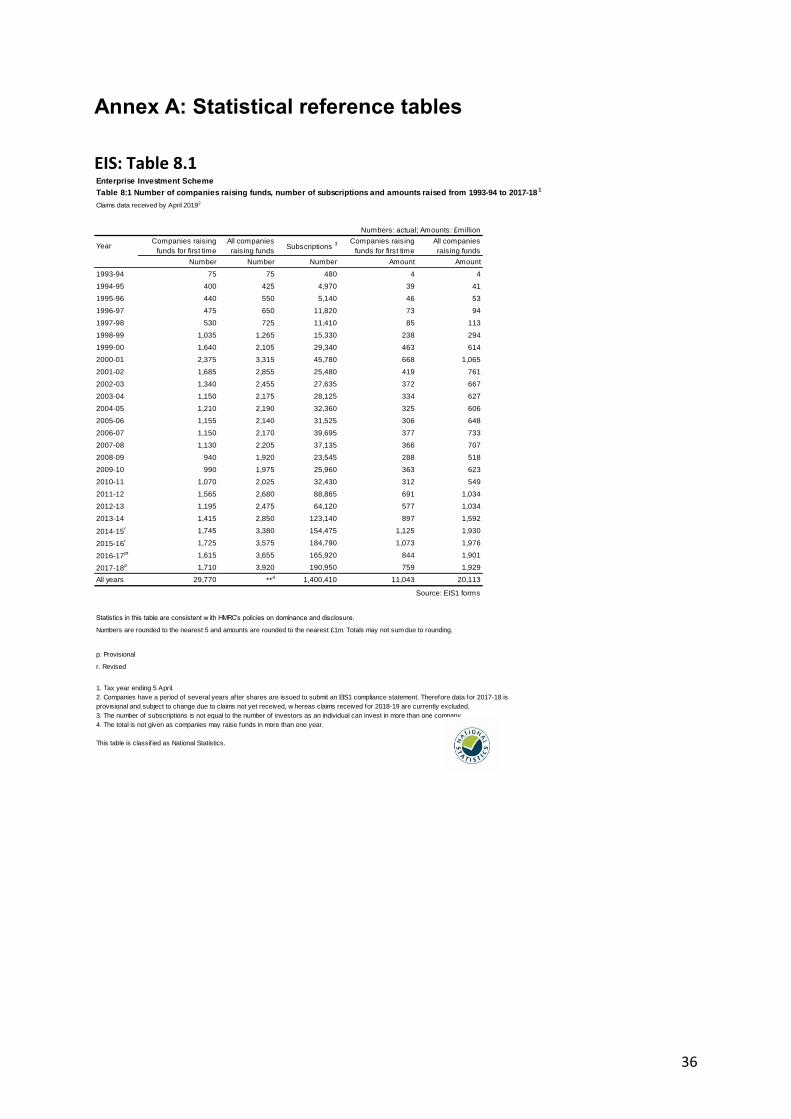
Since EIS was launched in 1993-94, 29,770 individual companies have received investment through the scheme, and £20 billion of funds have been raised. The data used here come from EIS: Table 8.1 in Annex A, where information dating back to 1993-94 can be found. The numbers of companies raising funds and the level of investment have shown similar trends since EIS was introduced (Figure 1). In 2017-18 the number of companies raising funds increased to 3,920 which raised total of £1,929 million. Note that the 2017-18 figures are likely to be revised upwards as more returns are received by HMRC, so this trend may change the next time the figures are published. For the 2016-17 figures, the total number of companies increased by 5.2% and the total amount by 5.8% from the previous publication. Assuming that this trend stays the same, we estimate there will be 4,130 companies with £2,041 million of funds. Figure 1(a): Amounts of funds raised through EIS, 1993-94 to 2017-18.
Source: EIS1 forms. Figures for 2017-18 are provisional. * represents estimated value after all returns processed.
9
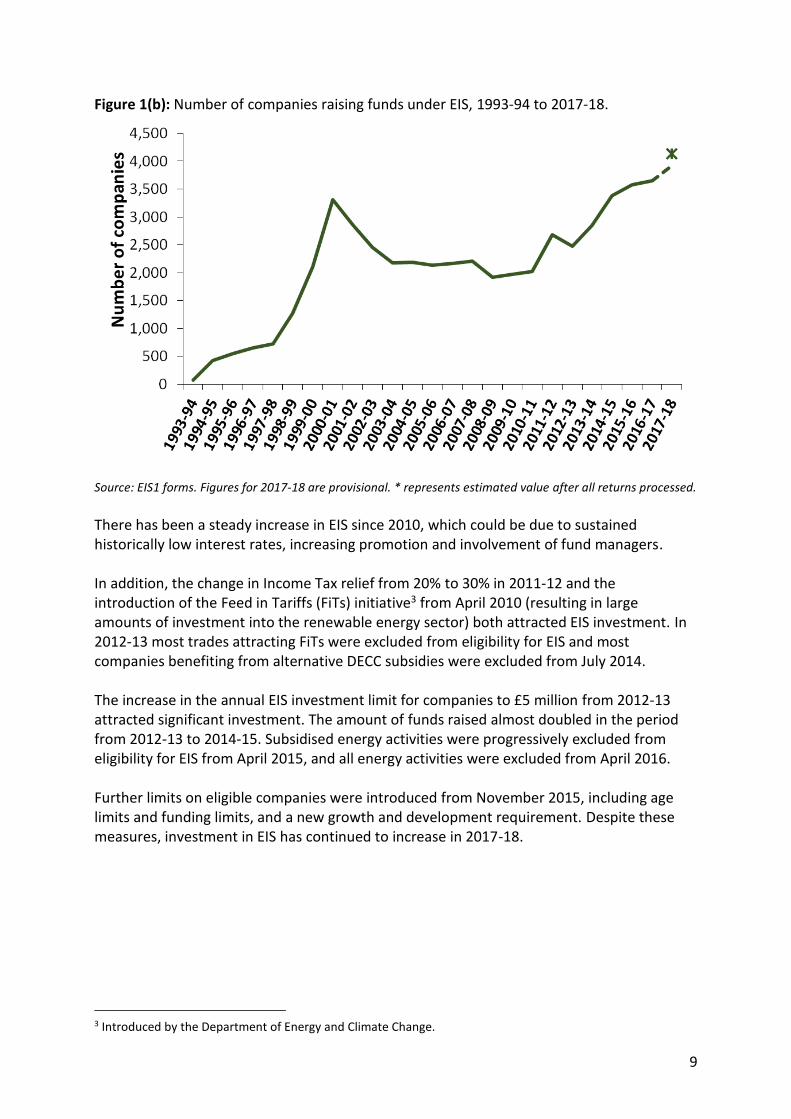
Figure 1(b): Number of companies raising funds under EIS, 1993-94 to 2017-18.
Source: EIS1 forms. Figures for 2017-18 are provisional. * represents estimated value after all returns processed.
There has been a steady increase in EIS since 2010, which could be due to sustained historically low interest rates, increasing promotion and involvement of fund managers. In addition, the change in Income Tax relief from 20% to 30% in 2011-12 and the introduction of the Feed in Tariffs (FiTs) initiative3 from April 2010 (resulting in large amounts of investment into the renewable energy sector) both attracted EIS investment. In 2012-13 most trades attracting FiTs were excluded from eligibility for EIS and most companies benefiting from alternative DECC subsidies were excluded from July 2014. The increase in the annual EIS investment limit for companies to £5 million from 2012-13 attracted significant investment. The amount of funds raised almost doubled in the period from 2012-13 to 2014-15. Subsidised energy activities were progressively excluded from eligibility for EIS from April 2015, and all energy activities were excluded from April 2016. Further limits on eligible companies were introduced from November 2015, including age limits and funding limits, and a new growth and development requirement. Despite these measures, investment in EIS has continued to increase in 2017-18.
3 Introduced by the Department of Energy and Climate Change.

10
EIS: New investment
The majority of investment through the scheme (55%) since the inception of EIS has been investment into companies raising EIS funds for the first time (Figure 2). However, in 2017-18, only 39% of funding was raised by companies using EIS for the first time. This decrease could be due to the fact that the scheme has been available since 1993-94, when by definition all the companies were using EIS for the first time. As time has gone on, more and more companies raising funds are repeated companies. The values for 2017-18 are provisional and are therefore shaded in Figure 2. For the 2016-17 figures, the amount invested by first-time companies increased by 9.8% from the previous publication. Assuming that this trend stays the same, we estimate the amount will be £833 million. Figure 2: Amount of investment received by new companies through EIS and by companies who received investment under EIS previously, from 2004-05 to 2017-18.
Source: EIS1 forms. Figures for 2017-18 are provisional. * represents estimated value after all returns processed.

11
EIS: Industry sector
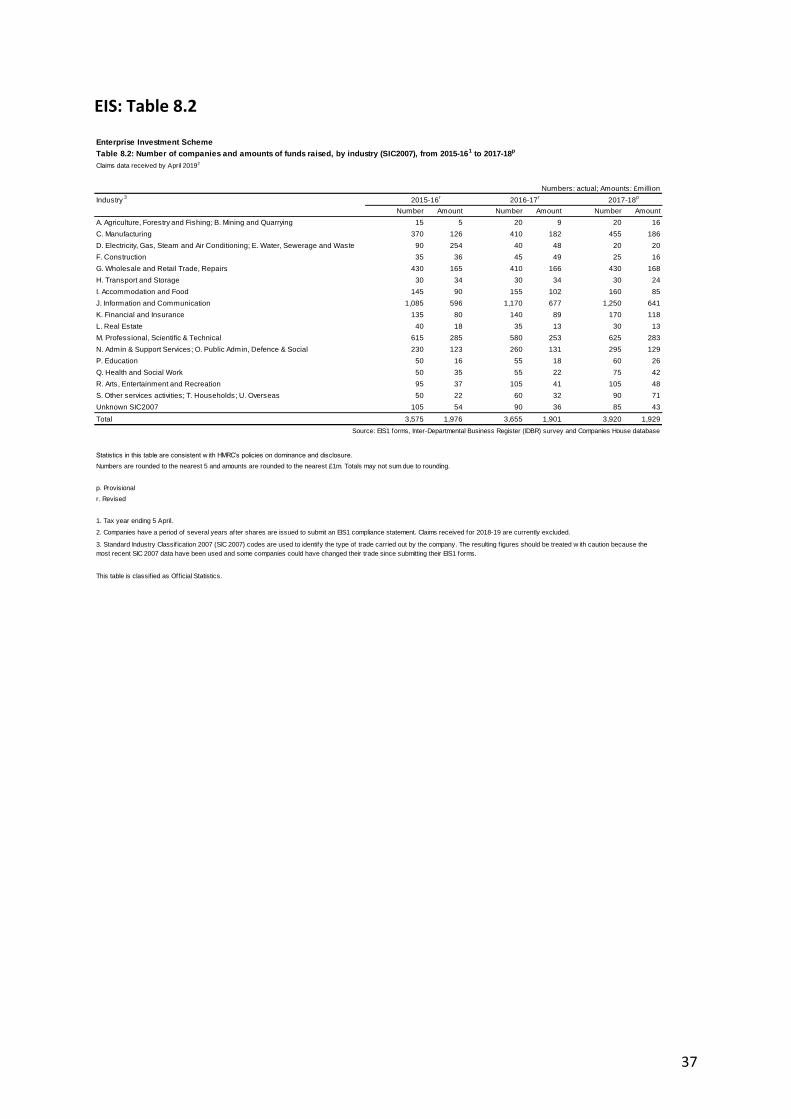
In 2017-18, companies from just 4 sectors (the Information & Communication, the Professional, Scientific & Technical, the Manufacturing, and the Wholesale & Retail Trade, Repairs sectors) together accounted for over £1.2bn of investment and made up 66% of all EIS Investment (Figure 3). This is a similar amount and proportion to the 2016-17 figures. The highest number of companies receiving EIS investment in 2017-18 were also in these 4 categories, which represent 70% of the total number of companies receiving investment through EIS. The data used here comes from EIS: Table 8.2 in Annex A.
Figure 3: The percentage distribution of EIS investment and number of EIS companies, by SIC2007 industry sector in 2017-18.
Source: EIS1 forms. Figures are provisional
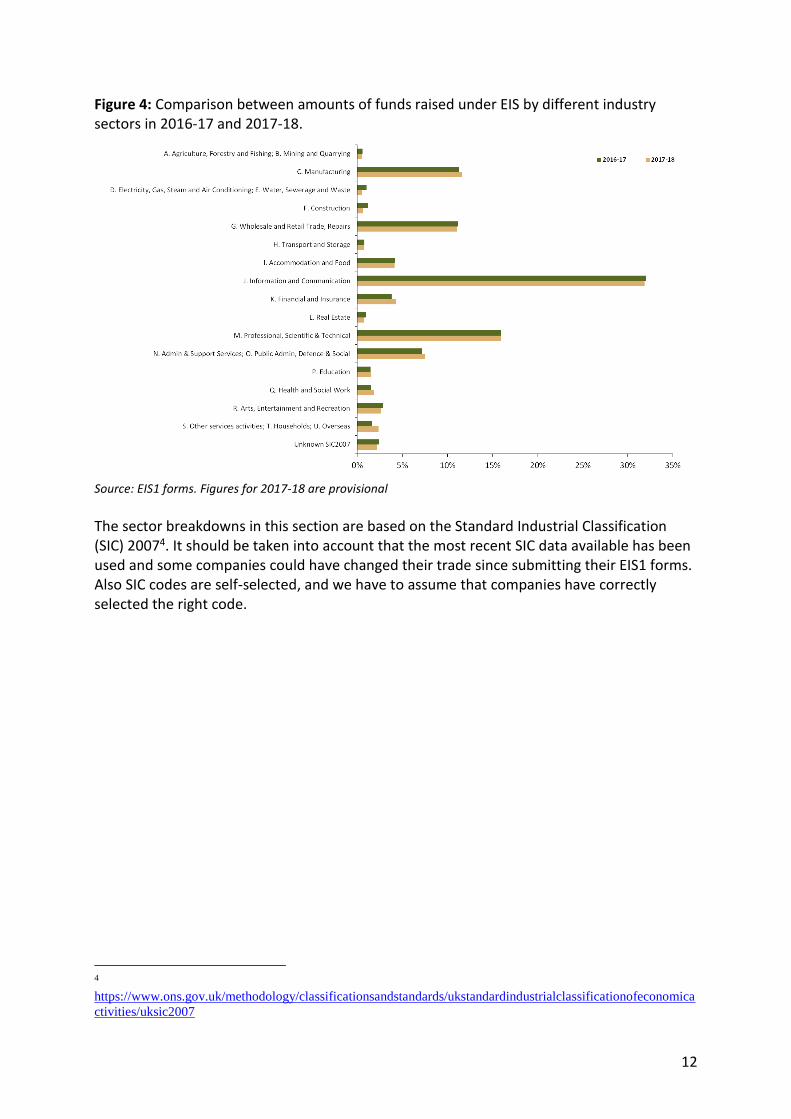
Figure 4 provides a comparison of the amount of investment raised under EIS between 2016-17 and 2017-18. The trends for the two years are very similar, with a decrease in the Electricity, Gas, Steam and Air Conditioning sector. This is likely to be related to policy changes excluding energy generation from venture capital schemes. There has also been a similar fall in the Construction sector.
12
Figure 4: Comparison between amounts of funds raised under EIS by different industry sectors in 2016-17 and 2017-18.
Source: EIS1 forms. Figures for 2017-18 are provisional
The sector breakdowns in this section are based on the Standard Industrial Classification (SIC) 20074. It should be taken into account that the most recent SIC data available has been used and some companies could have changed their trade since submitting their EIS1 forms. Also SIC codes are self-selected, and we have to assume that companies have correctly selected the right code.
4
https://www.ons.gov.uk/methodology/classificationsandstandards/ukstandardindustrialclassificationofeconomica
ctivities/uksic2007
13
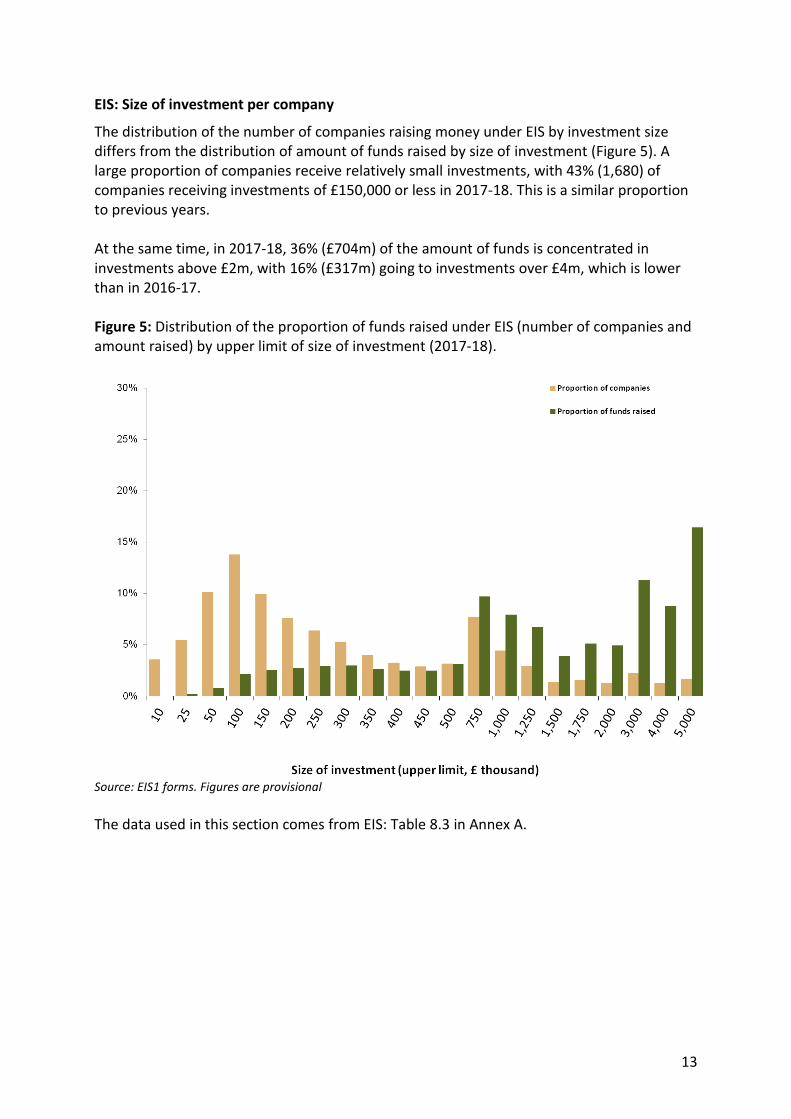
EIS: Size of investment per company
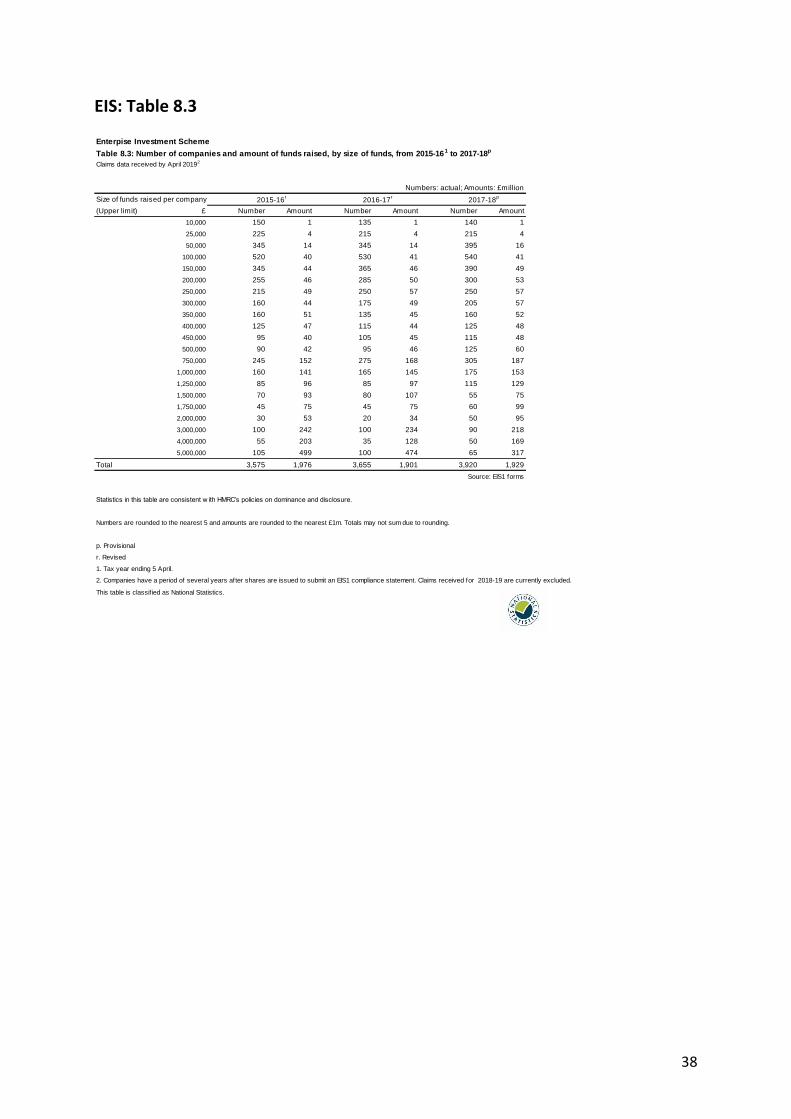
The distribution of the number of companies raising money under EIS by investment size differs from the distribution of amount of funds raised by size of investment (Figure 5). A large proportion of companies receive relatively small investments, with 43% (1,680) of companies receiving investments of £150,000 or less in 2017-18. This is a similar proportion to previous years. At the same time, in 2017-18, 36% (£704m) of the amount of funds is concentrated in investments above £2m, with 16% (£317m) going to investments over £4m, which is lower than in 2016-17. Figure 5: Distribution of the proportion of funds raised under EIS (number of companies and amount raised) by upper limit of size of investment (2017-18).
Source: EIS1 forms. Figures are provisional
The data used in this section comes from EIS: Table 8.3 in Annex A.
14
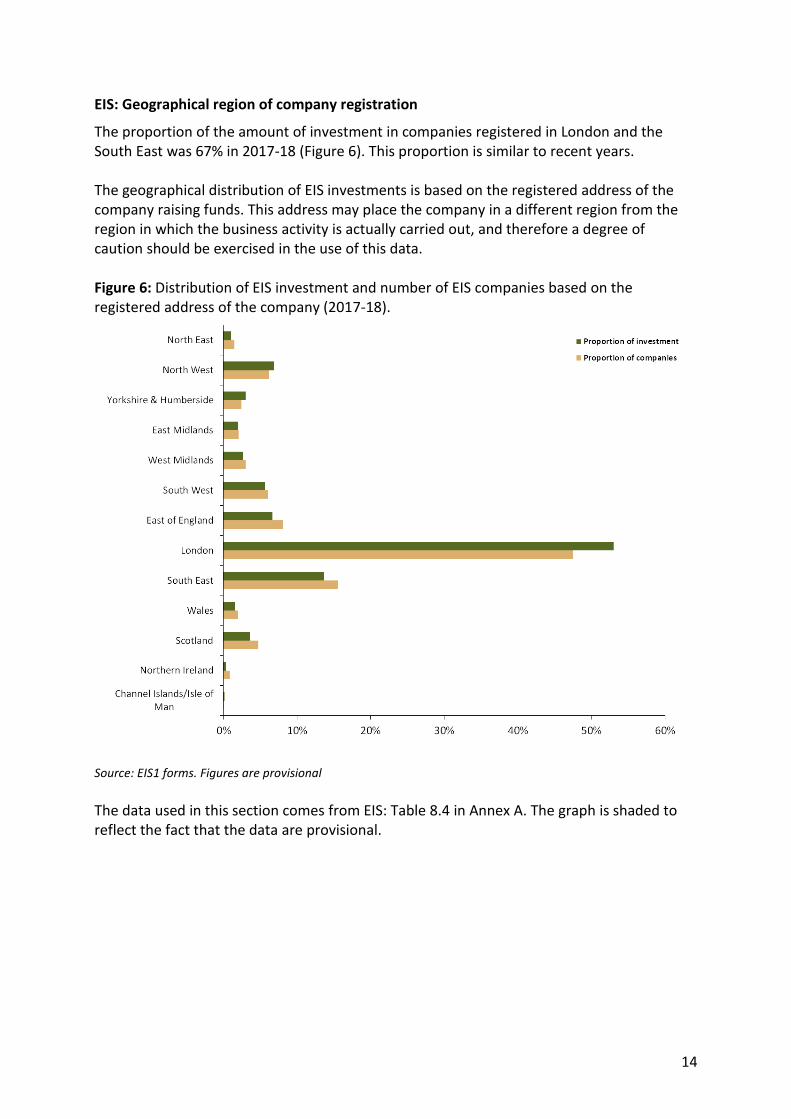
EIS: Geographical region of company registration
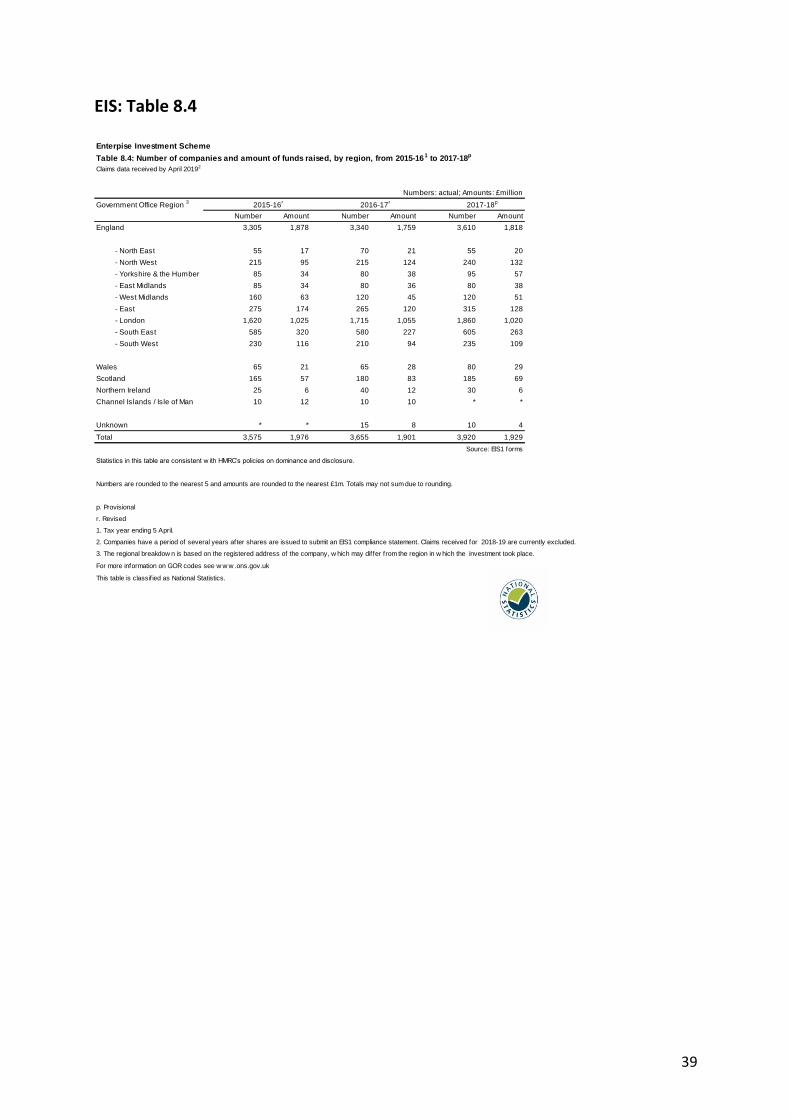
The proportion of the amount of investment in companies registered in London and the South East was 67% in 2017-18 (Figure 6). This proportion is similar to recent years. The geographical distribution of EIS investments is based on the registered address of the company raising funds. This address may place the company in a different region from the region in which the business activity is actually carried out, and therefore a degree of caution should be exercised in the use of this data. Figure 6: Distribution of EIS investment and number of EIS companies based on the registered address of the company (2017-18).
Source: EIS1 forms. Figures are provisional
The data used in this section comes from EIS: Table 8.4 in Annex A. The graph is shaded to reflect the fact that the data are provisional.
15
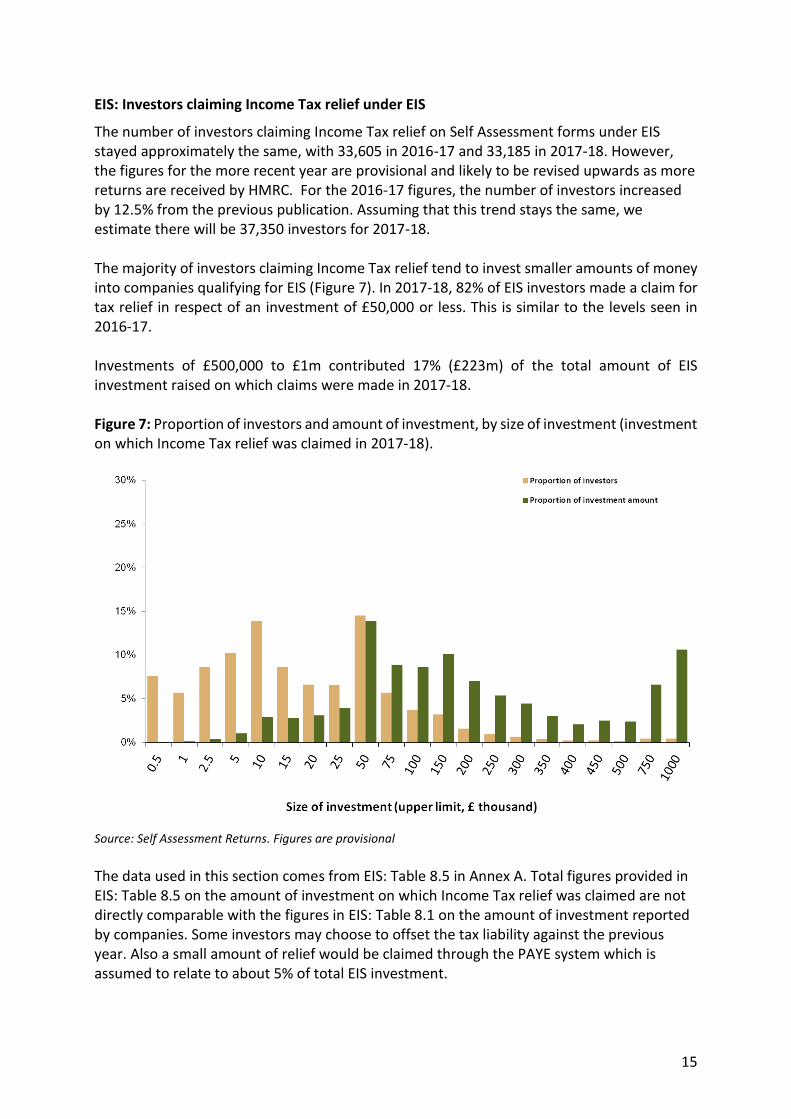
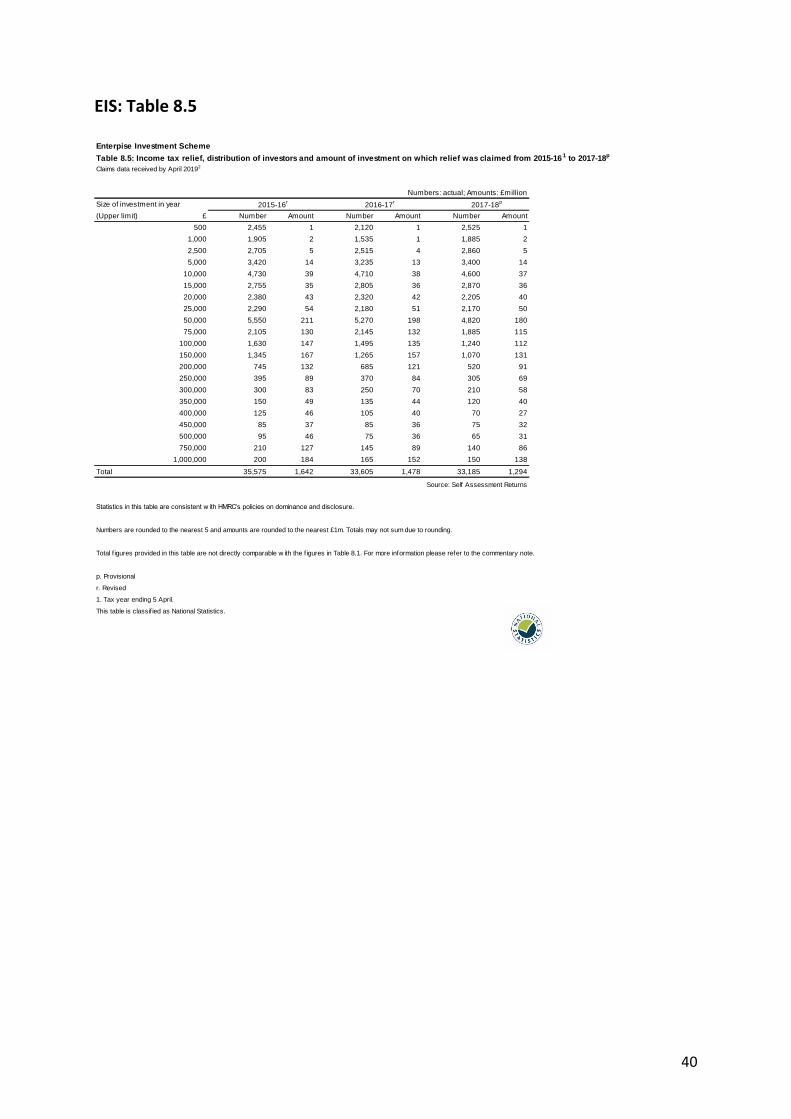
EIS: Investors claiming Income Tax relief under EIS
The number of investors claiming Income Tax relief on Self Assessment forms under EIS stayed approximately the same, with 33,605 in 2016-17 and 33,185 in 2017-18. However, the figures for the more recent year are provisional and likely to be revised upwards as more returns are received by HMRC. For the 2016-17 figures, the number of investors increased by 12.5% from the previous publication. Assuming that this trend stays the same, we estimate there will be 37,350 investors for 2017-18. The majority of investors claiming Income Tax relief tend to invest smaller amounts of money into companies qualifying for EIS (Figure 7). In 2017-18, 82% of EIS investors made a claim for tax relief in respect of an investment of £50,000 or less. This is similar to the levels seen in 2016-17. Investments of £500,000 to £1m contributed 17% (£223m) of the total amount of EIS investment raised on which claims were made in 2017-18. Figure 7: Proportion of investors and amount of investment, by size of investment (investment on which Income Tax relief was claimed in 2017-18).
Source: Self Assessment Returns. Figures are provisional
The data used in this section comes from EIS: Table 8.5 in Annex A. Total figures provided in EIS: Table 8.5 on the amount of investment on which Income Tax relief was claimed are not directly comparable with the figures in EIS: Table 8.1 on the amount of investment reported by companies. Some investors may choose to offset the tax liability against the previous year. Also a small amount of relief would be claimed through the PAYE system which is assumed to relate to about 5% of total EIS investment.
16
3.2 Seed Enterprise Investment Scheme
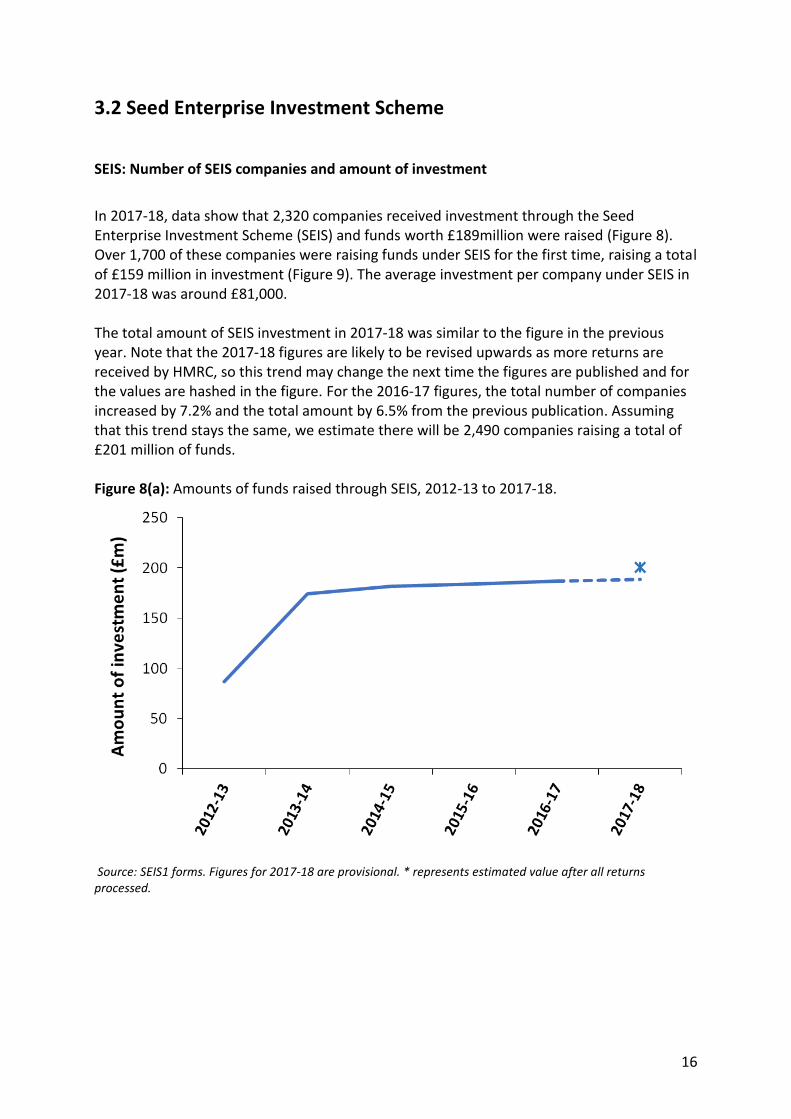
SEIS: Number of SEIS companies and amount of investment
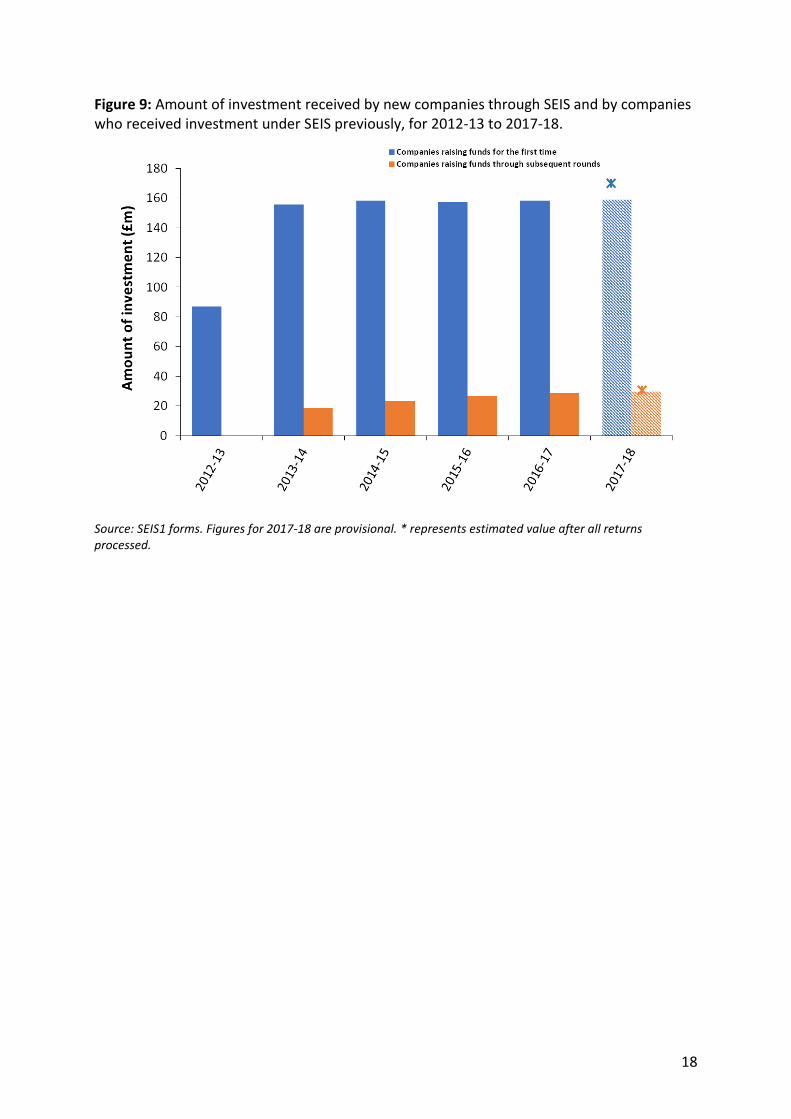
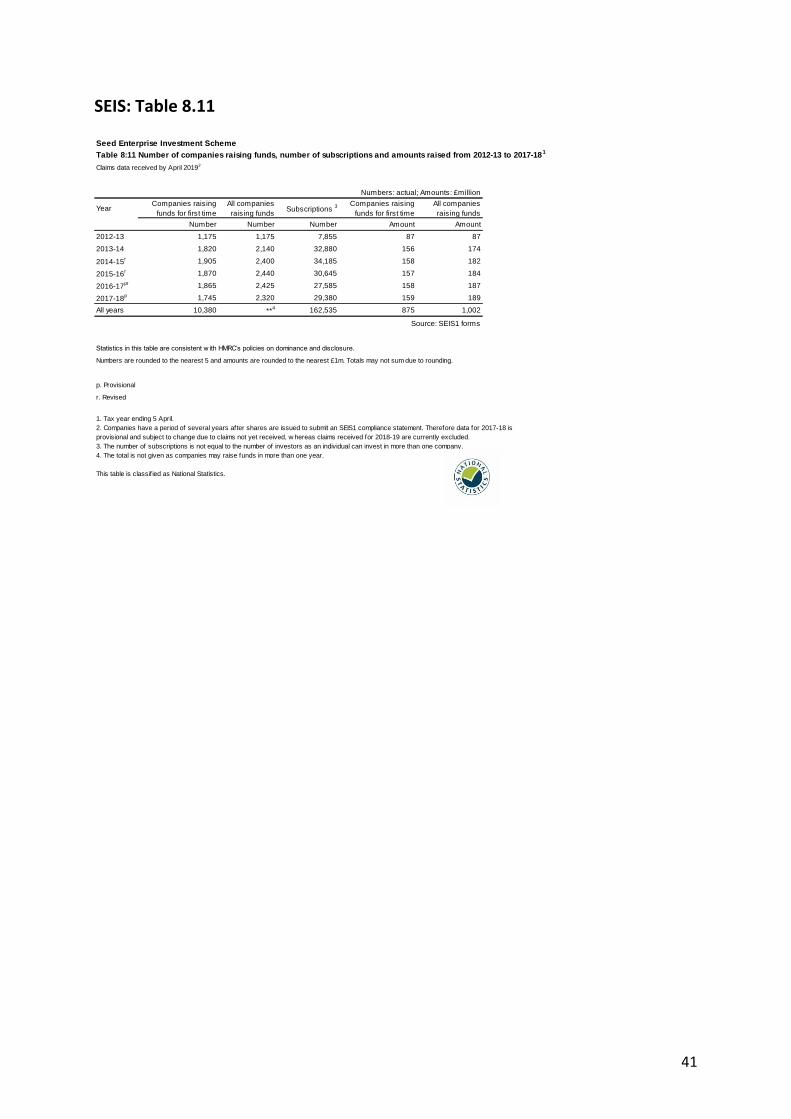
In 2017-18, data show that 2,320 companies received investment through the Seed Enterprise Investment Scheme (SEIS) and funds worth £189million were raised (Figure 8). Over 1,700 of these companies were raising funds under SEIS for the first time, raising a total of £159 million in investment (Figure 9). The average investment per company under SEIS in 2017-18 was around £81,000. The total amount of SEIS investment in 2017-18 was similar to the figure in the previous year. Note that the 2017-18 figures are likely to be revised upwards as more returns are received by HMRC, so this trend may change the next time the figures are published and for the values are hashed in the figure. For the 2016-17 figures, the total number of companies increased by 7.2% and the total amount by 6.5% from the previous publication. Assuming that this trend stays the same, we estimate there will be 2,490 companies raising a total of £201 million of funds. Figure 8(a): Amounts of funds raised through SEIS, 2012-13 to 2017-18.
Source: SEIS1 forms. Figures for 2017-18 are provisional. * represents estimated value after all returns processed.
17
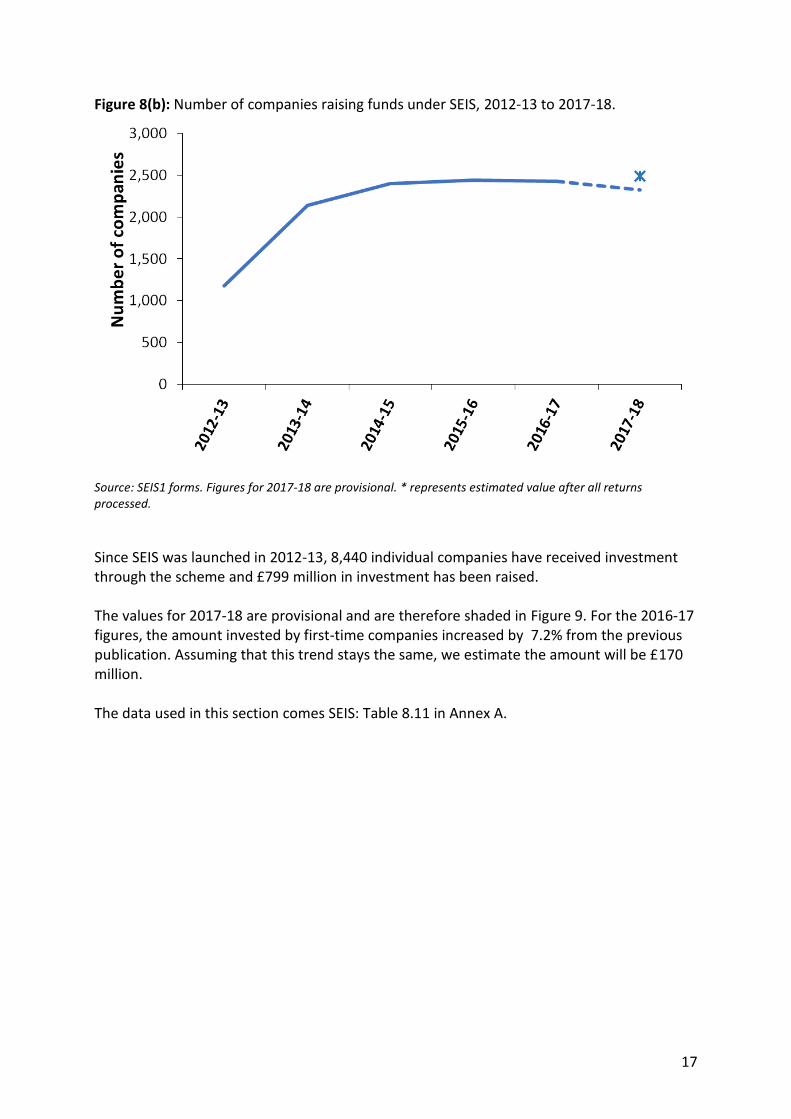
Figure 8(b): Number of companies raising funds under SEIS, 2012-13 to 2017-18.
Source: SEIS1 forms. Figures for 2017-18 are provisional. * represents estimated value after all returns processed.
Since SEIS was launched in 2012-13, 8,440 individual companies have received investment through the scheme and £799 million in investment has been raised. The values for 2017-18 are provisional and are therefore shaded in Figure 9. For the 2016-17 figures, the amount invested by first-time companies increased by 7.2% from the previous publication. Assuming that this trend stays the same, we estimate the amount will be £170 million. The data used in this section comes SEIS: Table 8.11 in Annex A.
18
Figure 9: Amount of investment received by new companies through SEIS and by companies who received investment under SEIS previously, for 2012-13 to 2017-18.
Source: SEIS1 forms. Figures for 2017-18 are provisional. * represents estimated value after all returns processed.
19
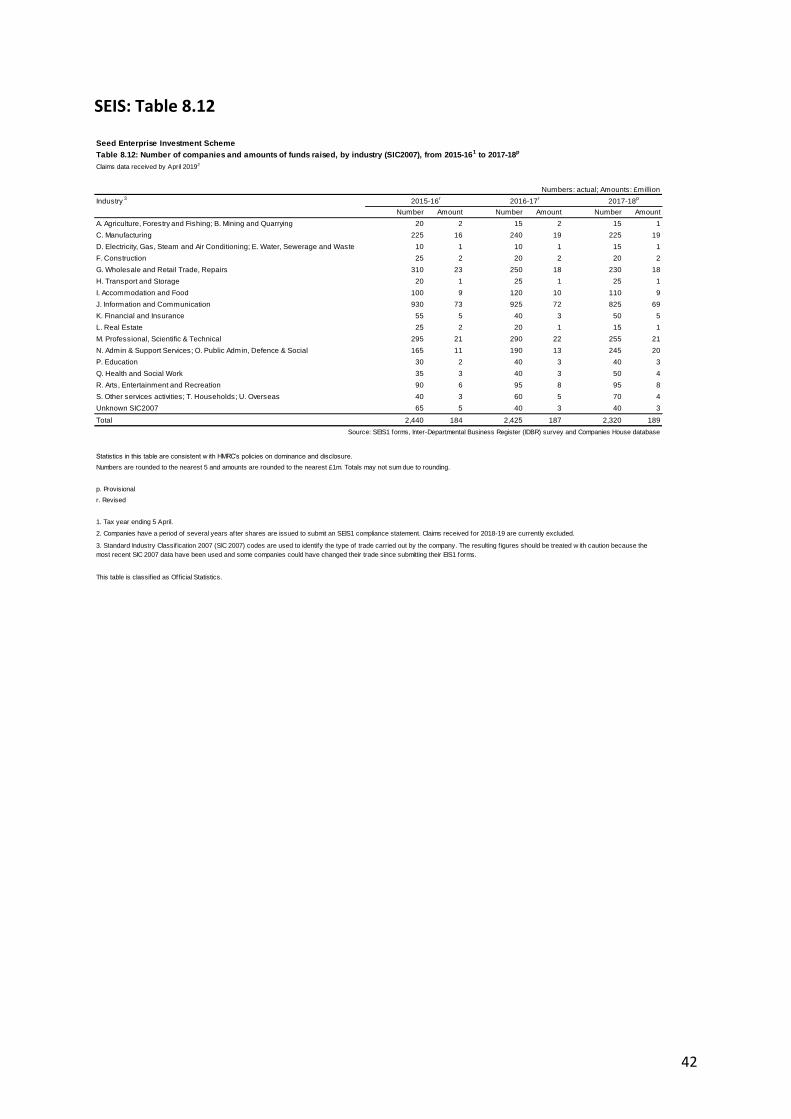
SEIS: Industry sector
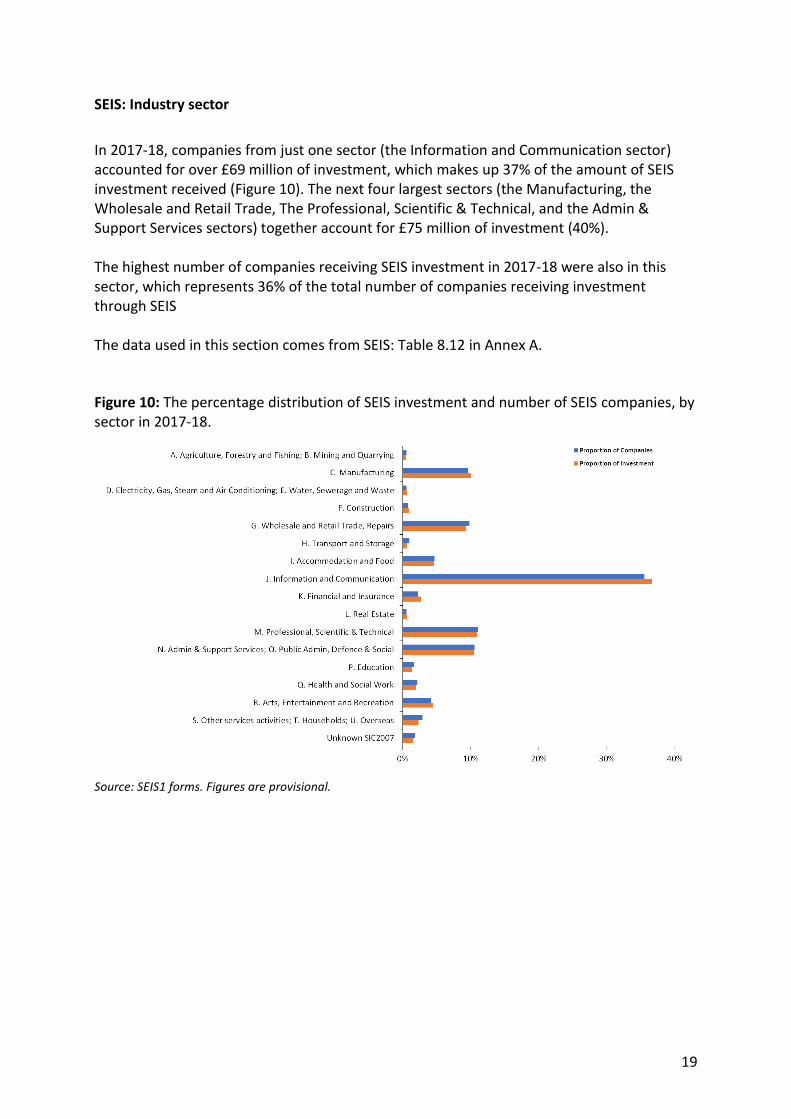
In 2017-18, companies from just one sector (the Information and Communication sector) accounted for over £69 million of investment, which makes up 37% of the amount of SEIS investment received (Figure 10). The next four largest sectors (the Manufacturing, the Wholesale and Retail Trade, The Professional, Scientific & Technical, and the Admin & Support Services sectors) together account for £75 million of investment (40%). The highest number of companies receiving SEIS investment in 2017-18 were also in this sector, which represents 36% of the total number of companies receiving investment through SEIS The data used in this section comes from SEIS: Table 8.12 in Annex A.
Figure 10: The percentage distribution of SEIS investment and number of SEIS companies, by sector in 2017-18.
Source: SEIS1 forms. Figures are provisional.
20
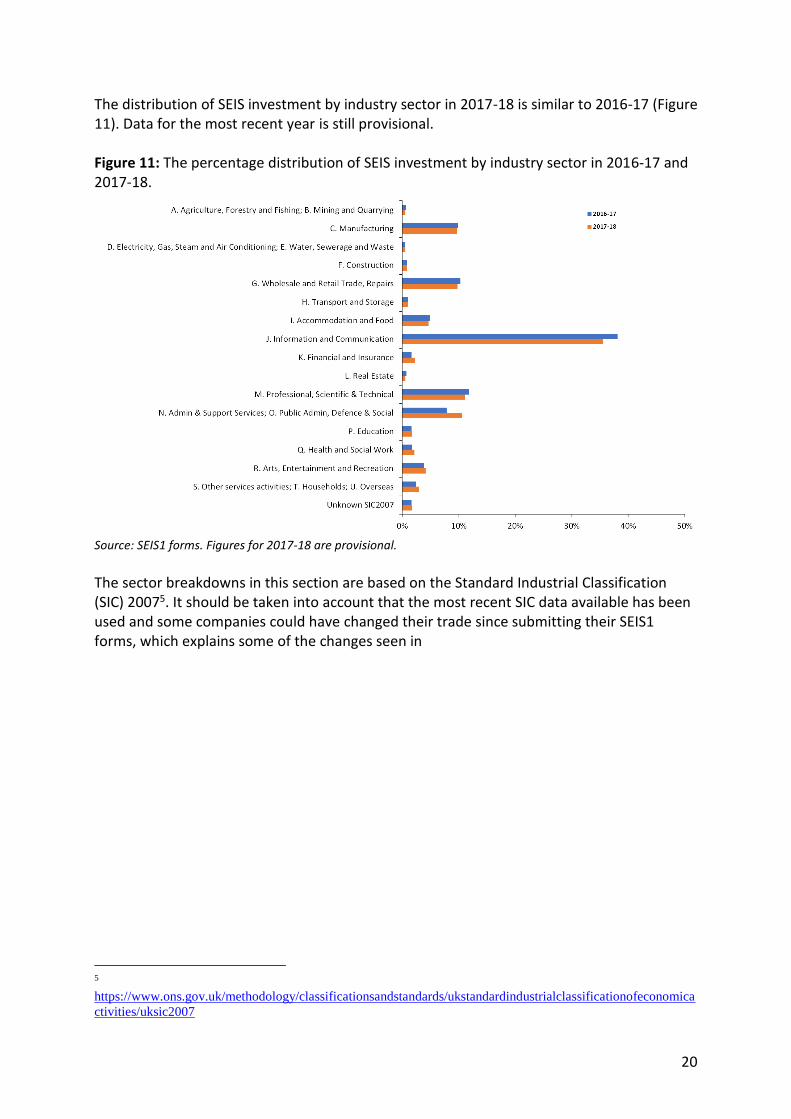
The distribution of SEIS investment by industry sector in 2017-18 is similar to 2016-17 (Figure 11). Data for the most recent year is still provisional. Figure 11: The percentage distribution of SEIS investment by industry sector in 2016-17 and 2017-18.
Source: SEIS1 forms. Figures for 2017-18 are provisional.
The sector breakdowns in this section are based on the Standard Industrial Classification (SIC) 20075. It should be taken into account that the most recent SIC data available has been used and some companies could have changed their trade since submitting their SEIS1 forms, which explains some of the changes seen in
5
https://www.ons.gov.uk/methodology/classificationsandstandards/ukstandardindustrialclassificationofeconomica
ctivities/uksic2007

21
The distribution of SEIS investment by industry sector in 2017-18 is similar to 2016-17 (Figure 11). Data for the most recent year is still provisional. Figure 11. Also SIC codes are self-selected, and we have to assume that companies have correctly selected the right code.
22
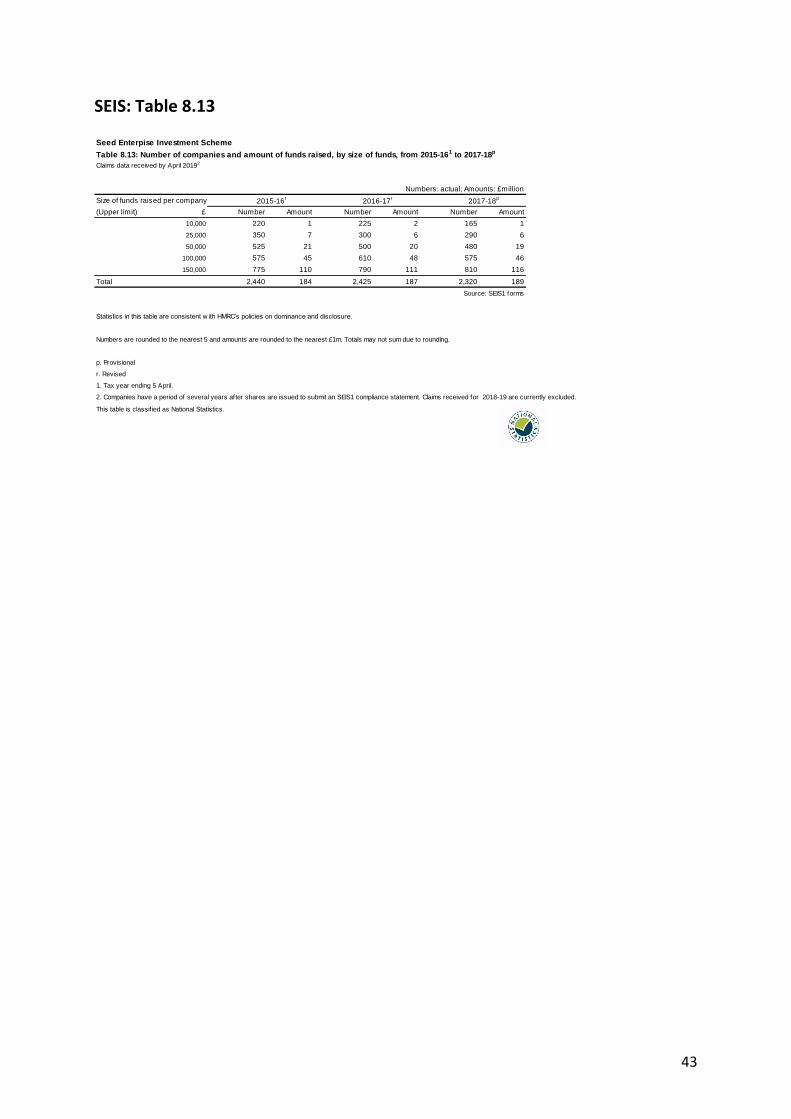
SEIS: Size of investment per company
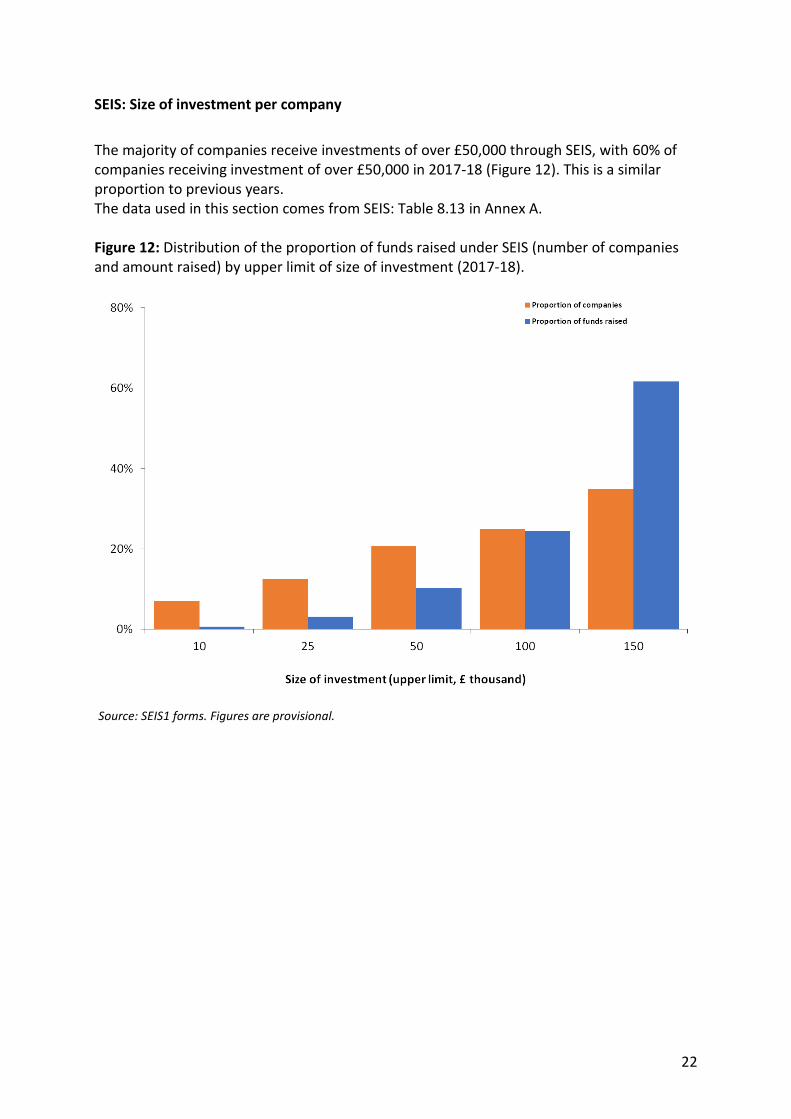
The majority of companies receive investments of over £50,000 through SEIS, with 60% of companies receiving investment of over £50,000 in 2017-18 (Figure 12). This is a similar proportion to previous years. The data used in this section comes from SEIS: Table 8.13 in Annex A. Figure 12: Distribution of the proportion of funds raised under SEIS (number of companies and amount raised) by upper limit of size of investment (2017-18).
Source: SEIS1 forms. Figures are provisional.
23
SEIS: Geographical region of company registration
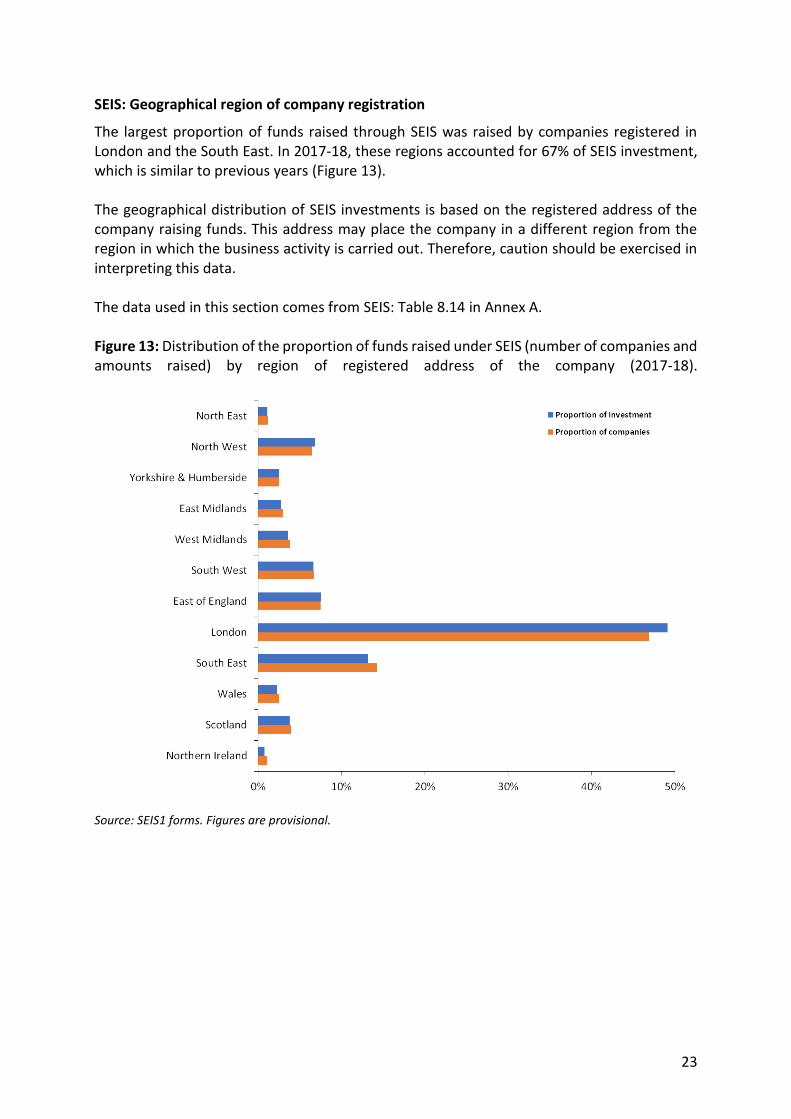
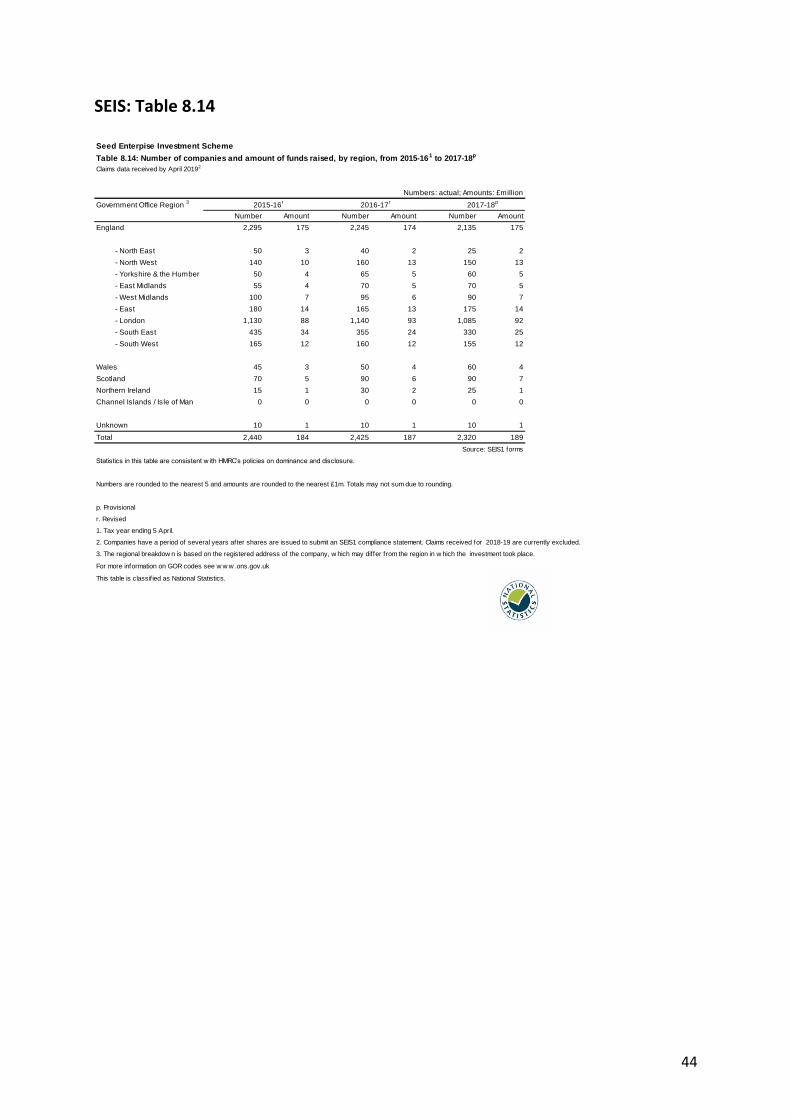
The largest proportion of funds raised through SEIS was raised by companies registered in London and the South East. In 2017-18, these regions accounted for 67% of SEIS investment, which is similar to previous years (Figure 13). The geographical distribution of SEIS investments is based on the registered address of the company raising funds. This address may place the company in a different region from the region in which the business activity is carried out. Therefore, caution should be exercised in interpreting this data. The data used in this section comes from SEIS: Table 8.14 in Annex A. Figure 13: Distribution of the proportion of funds raised under SEIS (number of companies and amounts raised) by region of registered address of the company (2017-18).
Source: SEIS1 forms. Figures are provisional.
24
SEIS: Investors claiming Income Tax relief under SEIS
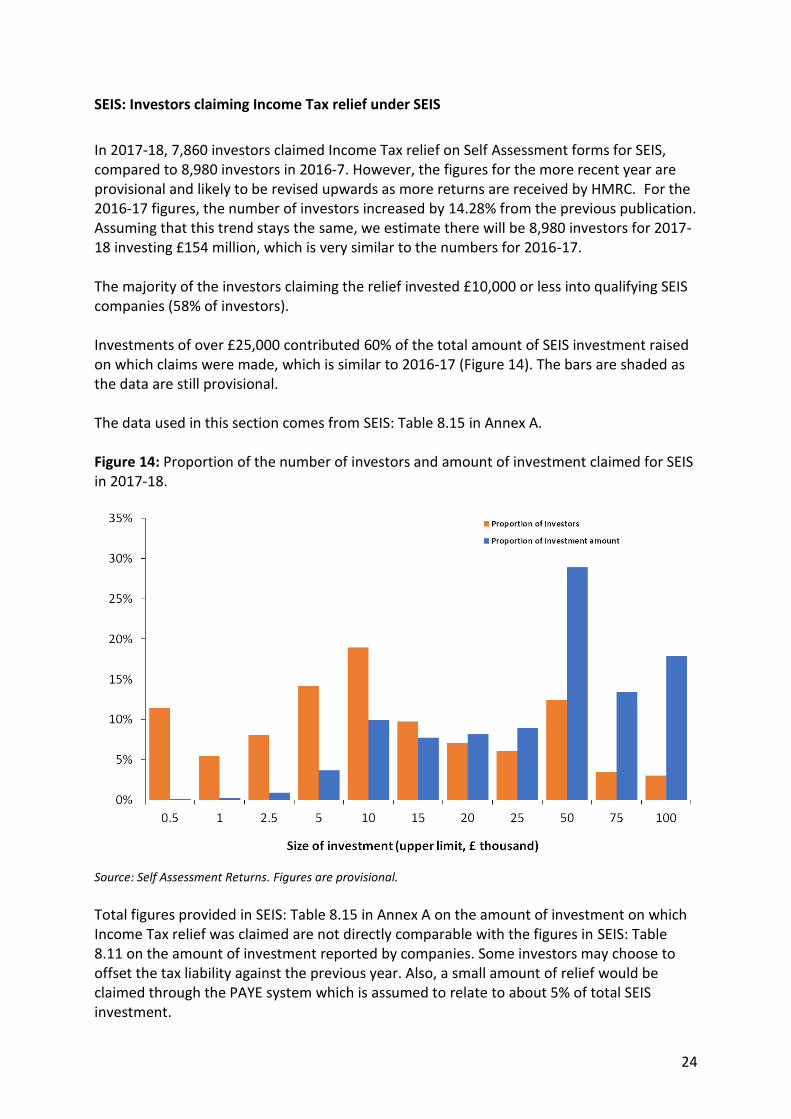
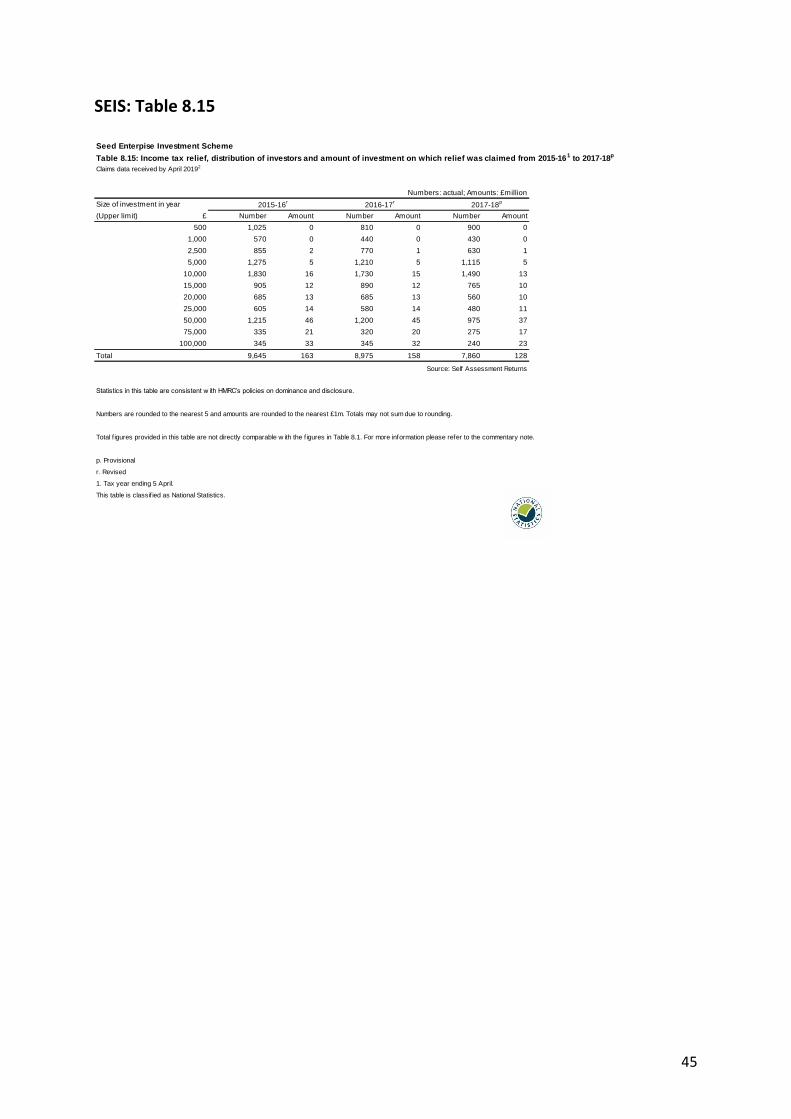
In 2017-18, 7,860 investors claimed Income Tax relief on Self Assessment forms for SEIS, compared to 8,980 investors in 2016-7. However, the figures for the more recent year are provisional and likely to be revised upwards as more returns are received by HMRC. For the 2016-17 figures, the number of investors increased by 14.28% from the previous publication. Assuming that this trend stays the same, we estimate there will be 8,980 investors for 2017-18 investing £154 million, which is very similar to the numbers for 2016-17. The majority of the investors claiming the relief invested £10,000 or less into qualifying SEIS companies (58% of investors). Investments of over £25,000 contributed 60% of the total amount of SEIS investment raised on which claims were made, which is similar to 2016-17 (Figure 14). The bars are shaded as the data are still provisional. The data used in this section comes from SEIS: Table 8.15 in Annex A. Figure 14: Proportion of the number of investors and amount of investment claimed for SEIS in 2017-18.
Source: Self Assessment Returns. Figures are provisional.
Total figures provided in SEIS: Table 8.15 in Annex A on the amount of investment on which Income Tax relief was claimed are not directly comparable with the figures in SEIS: Table 8.11 on the amount of investment reported by companies. Some investors may choose to offset the tax liability against the previous year. Also, a small amount of relief would be claimed through the PAYE system which is assumed to relate to about 5% of total SEIS investment.
25
3.3 Social Investment Tax Relief
SITR: Number of social enterprises and amount of investment
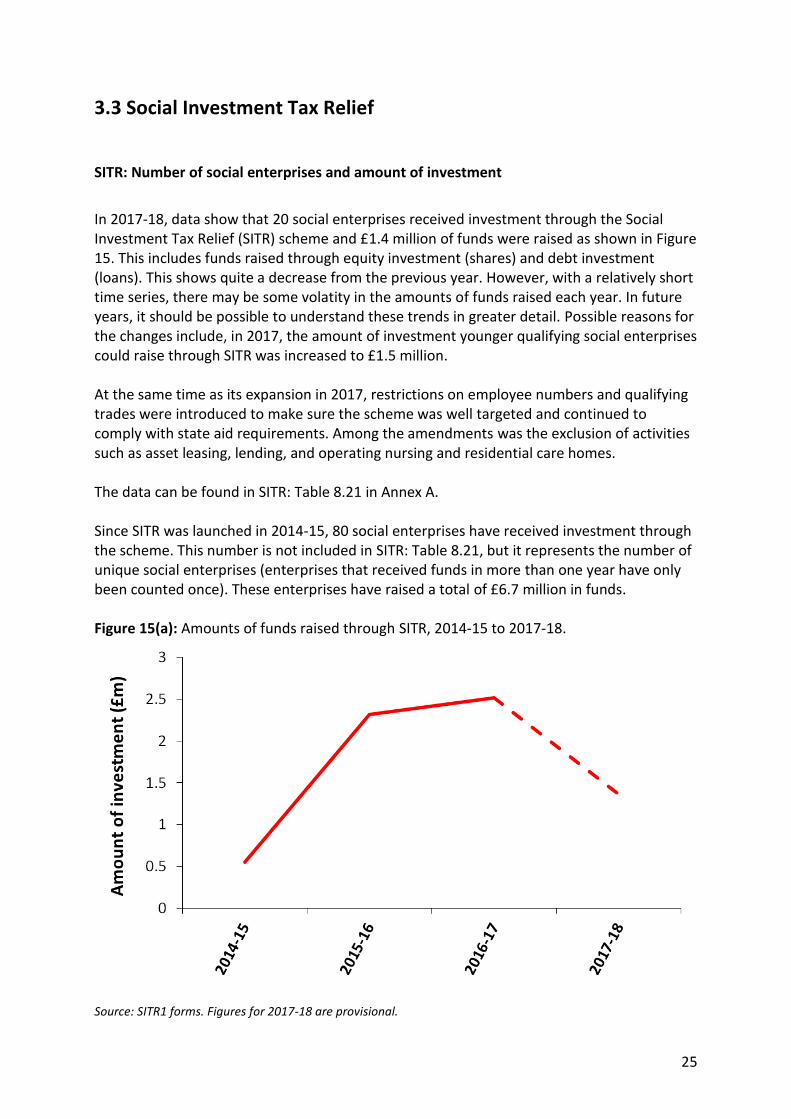
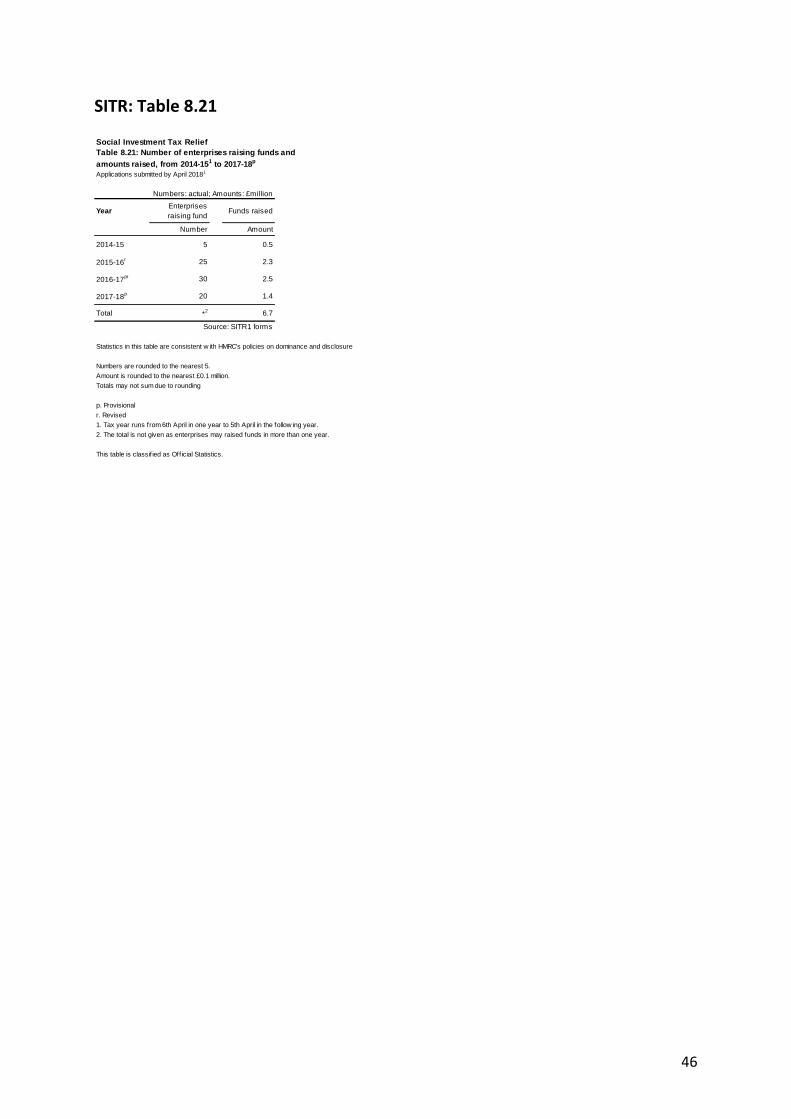
In 2017-18, data show that 20 social enterprises received investment through the Social Investment Tax Relief (SITR) scheme and £1.4 million of funds were raised as shown in Figure 15. This includes funds raised through equity investment (shares) and debt investment (loans). This shows quite a decrease from the previous year. However, with a relatively short time series, there may be some volatity in the amounts of funds raised each year. In future years, it should be possible to understand these trends in greater detail. Possible reasons for the changes include, in 2017, the amount of investment younger qualifying social enterprises could raise through SITR was increased to £1.5 million. At the same time as its expansion in 2017, restrictions on employee numbers and qualifying trades were introduced to make sure the scheme was well targeted and continued to comply with state aid requirements. Among the amendments was the exclusion of activities such as asset leasing, lending, and operating nursing and residential care homes. The data can be found in SITR: Table 8.21 in Annex A. Since SITR was launched in 2014-15, 80 social enterprises have received investment through the scheme. This number is not included in SITR: Table 8.21, but it represents the number of unique social enterprises (enterprises that received funds in more than one year have only been counted once). These enterprises have raised a total of £6.7 million in funds. Figure 15(a): Amounts of funds raised through SITR, 2014-15 to 2017-18.
Source: SITR1 forms. Figures for 2017-18 are provisional.

26
Figure 15(b): Number of enterprises raising funds under SITR, 2014-15 to 2017-18.
Source: SITR1 forms. Figures for 2017-18 are provisional.
27
Section 4: Advance Assurance Requests (AARs)
Companies considering using EIS, SEIS or SITR can obtain advance assurance that HMRC will regard the shares to be issued as satisfying the requirements of the scheme. The statistics show the number of companies seeking advance assurance, the number of AARs applications received and, of these, how many were approved, rejected or not pursued further. Statistics are presented from 2006-07 for EIS, 2012-13 for SEIS and 2014-15 for SITR. There are a number of ways in which the statistics may differ from those presented on the number of companies receiving investment through the various schemes shown in Section 3. For example:
The advance assurance process is not mandatory so not all companies put forward AARs before submitting compliance statements.
There will also be instances where a company does not go on to use EIS, SEIS or SITR despite having an advance assurance application approved, including where the legislation changes before an investment can be made.
For some companies, which we have collected in the category ‘Not pursued’, they may choose not to continue with the application after receiving a request for more information from HMRC in response to their initial application. Applications are received throughout the year, and some may be dealt with in subsequent financial years. This can particularly be the case for those received late in the year, for example in March when there is often a higher flow of applications. Advance Assurance Requests are both non-statutory and discretionary, and so the figures here will not match the number of completed applications. Due to increasing demand and limited resource, a consultation exercise was conducted in late 2017 about managing the AA service. One of the outcomes was “From 2 January 2018 we will not provide an advance assurance on speculative applications. More than a third of the advance assurances we provide do not result in an investment. To ensure HMRC resources are used efficiently, therefore, we will only provide an opinion where the application names the individual(s), fund manager(s) or other promoter(s) who are expected to make the investment. Though we do not expect the company making the application to have formalised offers of investment, we do expect the company to have approached potential investors before making the advance assurance application to determine the likelihood that they will attract actual investment.”6
6 https://assets.publishing.service.gov.uk/government/uploads/system/uploads/attachment_data/file/663935/Tax-
advantaged_venture_capital_schemes-streamlining_advance_assurance_service-Gov_response.pdf
28
EIS: Number of AARs received and outcomes
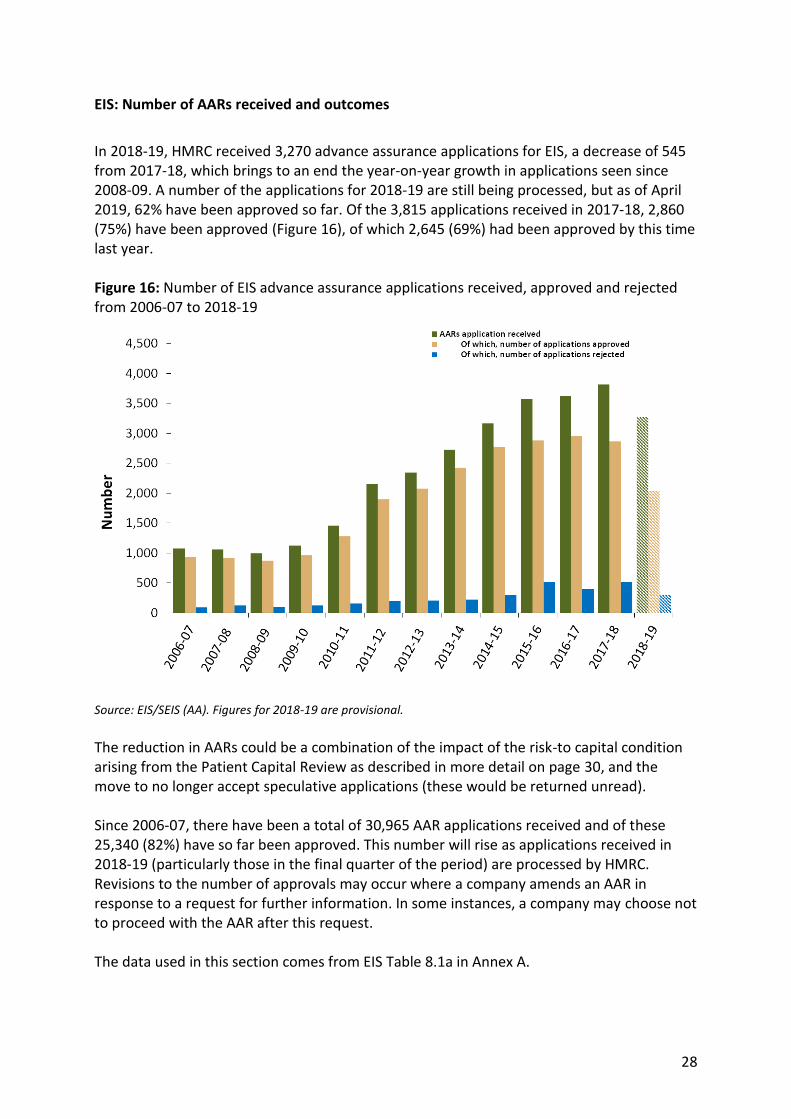
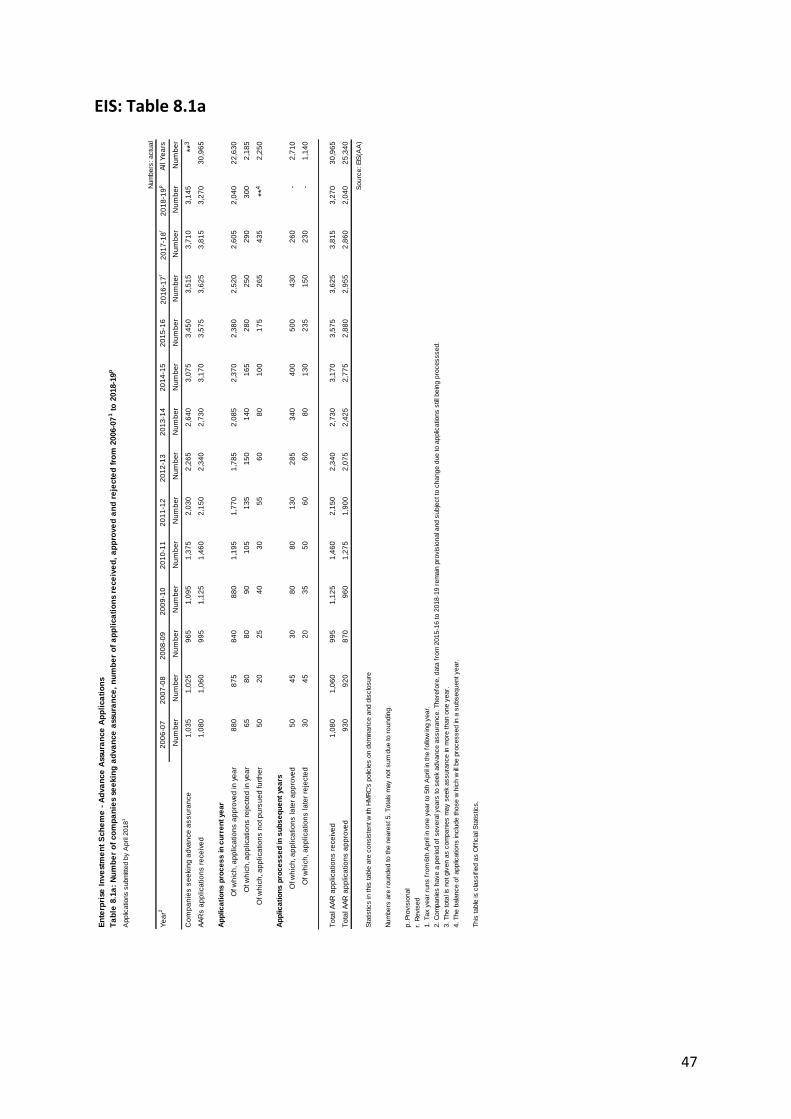
In 2018-19, HMRC received 3,270 advance assurance applications for EIS, a decrease of 545 from 2017-18, which brings to an end the year-on-year growth in applications seen since 2008-09. A number of the applications for 2018-19 are still being processed, but as of April 2019, 62% have been approved so far. Of the 3,815 applications received in 2017-18, 2,860 (75%) have been approved (Figure 16), of which 2,645 (69%) had been approved by this time last year. Figure 16: Number of EIS advance assurance applications received, approved and rejected from 2006-07 to 2018-19
Source: EIS/SEIS (AA). Figures for 2018-19 are provisional.
The reduction in AARs could be a combination of the impact of the risk-to capital condition arising from the Patient Capital Review as described in more detail on page 30, and the move to no longer accept speculative applications (these would be returned unread). Since 2006-07, there have been a total of 30,965 AAR applications received and of these 25,340 (82%) have so far been approved. This number will rise as applications received in 2018-19 (particularly those in the final quarter of the period) are processed by HMRC. Revisions to the number of approvals may occur where a company amends an AAR in response to a request for further information. In some instances, a company may choose not to proceed with the AAR after this request. The data used in this section comes from EIS Table 8.1a in Annex A.
29
SEIS: Number of AARs received and outcomes
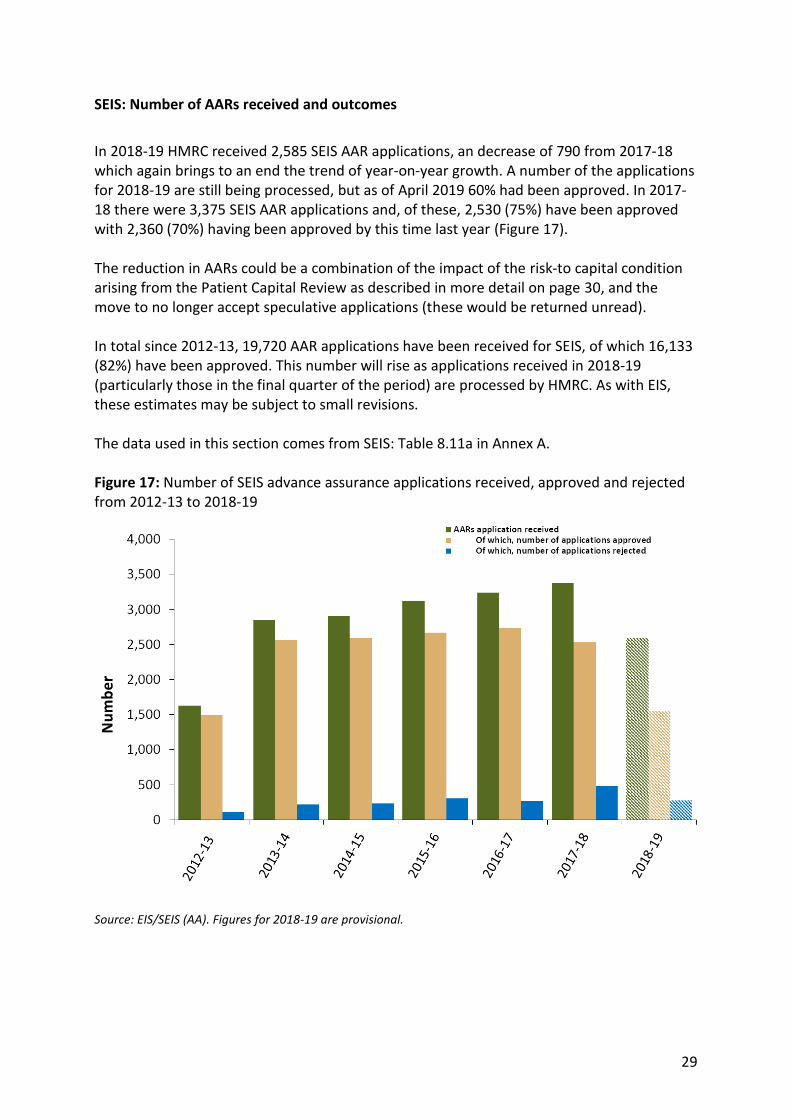
In 2018-19 HMRC received 2,585 SEIS AAR applications, an decrease of 790 from 2017-18 which again brings to an end the trend of year-on-year growth. A number of the applications for 2018-19 are still being processed, but as of April 2019 60% had been approved. In 2017-18 there were 3,375 SEIS AAR applications and, of these, 2,530 (75%) have been approved with 2,360 (70%) having been approved by this time last year (Figure 17). The reduction in AARs could be a combination of the impact of the risk-to capital condition arising from the Patient Capital Review as described in more detail on page 30, and the move to no longer accept speculative applications (these would be returned unread). In total since 2012-13, 19,720 AAR applications have been received for SEIS, of which 16,133 (82%) have been approved. This number will rise as applications received in 2018-19 (particularly those in the final quarter of the period) are processed by HMRC. As with EIS, these estimates may be subject to small revisions. The data used in this section comes from SEIS: Table 8.11a in Annex A. Figure 17: Number of SEIS advance assurance applications received, approved and rejected from 2012-13 to 2018-19
Source: EIS/SEIS (AA). Figures for 2018-19 are provisional.
30
SITR: Number of AARs received and outcomes
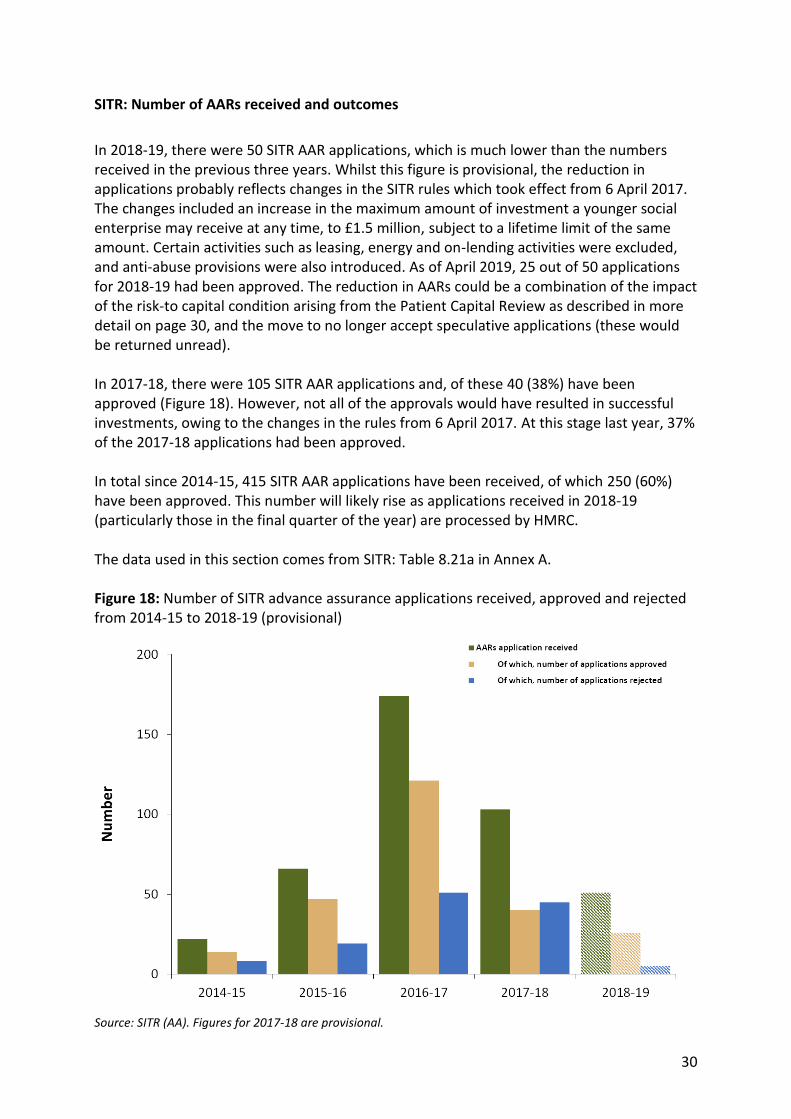
In 2018-19, there were 50 SITR AAR applications, which is much lower than the numbers received in the previous three years. Whilst this figure is provisional, the reduction in applications probably reflects changes in the SITR rules which took effect from 6 April 2017. The changes included an increase in the maximum amount of investment a younger social enterprise may receive at any time, to £1.5 million, subject to a lifetime limit of the same amount. Certain activities such as leasing, energy and on-lending activities were excluded, and anti-abuse provisions were also introduced. As of April 2019, 25 out of 50 applications for 2018-19 had been approved. The reduction in AARs could be a combination of the impact of the risk-to capital condition arising from the Patient Capital Review as described in more detail on page 30, and the move to no longer accept speculative applications (these would be returned unread). In 2017-18, there were 105 SITR AAR applications and, of these 40 (38%) have been approved (Figure 18). However, not all of the approvals would have resulted in successful investments, owing to the changes in the rules from 6 April 2017. At this stage last year, 37% of the 2017-18 applications had been approved. In total since 2014-15, 415 SITR AAR applications have been received, of which 250 (60%) have been approved. This number will likely rise as applications received in 2018-19 (particularly those in the final quarter of the year) are processed by HMRC. The data used in this section comes from SITR: Table 8.21a in Annex A. Figure 18: Number of SITR advance assurance applications received, approved and rejected from 2014-15 to 2018-19 (provisional)
Source: SITR (AA). Figures for 2017-18 are provisional.
31
Section 5: Background information
Policy background
The Enterprise Investment Scheme (EIS), Seed Enterprise Investment Scheme (SEIS) and Social Investment Tax Relief (SITR) are three of the four tax-based venture capital schemes, the other being the Venture Capital Trust (VCT) scheme. The EIS was introduced in 1994 to help smaller, higher-risk trading companies to raise finance by offering a range of tax reliefs to investors who purchase new full-risk ordinary shares in those companies. The SEIS was introduced in 2012 to complement EIS and is intended to recognise the particular difficulties which very early stage companies face in attracting investment by offering tax relief at a higher rate than that offered by EIS. The SITR was introduced in 2014 to help social enterprises raise money for their business activities by offering tax relief to investors. The investment may be in the form of equity investment (shares) or debt investment (loans). An amendment to tax-advantaged venture capital schemes, including EIS and SEIS, was published at Summer Budget 2015. Further information on these changes is available here: https://www.gov.uk/government/publications/income-tax-amendments-to-tax-advantaged-venture-capital-schemes Changes to exclude energy generation from the EIS, SEIS and SITR schemes were announced at Autumn Statement 2015: https://www.gov.uk/government/publications/income-tax-exclusion-of-energy-generation-from-venture-capital-schemes Changes to SITR were announced at Autumn Statement 2016 to increase the investment limit and improve the targeting of the scheme. Further information is available here: https://www.gov.uk/government/publications/income-tax-enlarging-social-investment-tax-relief The Patient Capital Review was announced in November 2016 and began in January 2017. Its final recommendations were presented ahead of Autumn Budget 2017. The review broadly sought to make sure that all the money being raised in the Venture Capital Trust (VCT) and Enterprise Investment Scheme (EIS) marketplace was being invested to meet the long-term funding requirements of small UK companies, on top of investors’ desires for capital growth enhanced by tax efficiencies. Further information is available here: https://www.gov.uk/government/publications/patient-capital-review The Patient Capital Review (https://www.gov.uk/government/consultations/financing-growth-in-innovative-firms) led to changes introduced in the Finance Act 2018 which included further flexibility for knowledge-intensive companies (EIS and VCTs) and the
32
introduction of a new ‘risk to capital condition’ (EIS, SEIS and VCTs) to re-direct investment from low-risk areas. The Official and National Statistics for the VCT scheme can be found here: https://www.gov.uk/government/collections/venture-capital-trusts-statistics
Data sources
The statistics in this release are compiled using data collected from companies’ EIS1, SEIS1 and SITR1 returns. All figures in this release are based on data extracted in April 2019. The returns, also known as ‘compliance statements’, are statutory declarations that the company is compliant with the conditions of the EIS, SEIS or SITR scheme. The data cover all EIS1, SEIS1 and SITR1 returns received by HMRC and approved by the Venture Capital Reliefs Team (VCRT) that administers the schemes. The VCRT decides if a company and a share issue qualifies. Companies have to submit an EIS1/SEIS1 form for each share issue where EIS or SEIS relief is to be claimed. The EIS1 and SEIS1 forms include details of investors who have indicated they will be claiming EIS/SEIS relief and the amount invested. The forms also include details of the date the shares were issued; these dates are used in the production of the statistics to record the investments within particular tax years. Social enterprises have to submit similar information under the SITR scheme using the SITR1 form. Income Tax Self Assessment returns are used to collect EIS and SEIS investor level information. Some investors will invest in both schemes in the same tax year. This information will not cover investors making Income Tax relief claims through other systems (e.g. PAYE) or not making any claims. This data were extracted in April 2019. Data on Advance Assurance Requests (AARs) is collected by the VCRT and compiled from AAR applications. The data cover all the AAR applications handled by the VCRT. The VCRT advises enterprises considering using the venture schemes about whether HMRC will regard their planned share issues, loans and business activities as satisfying the requirements of the scheme. AAR data were extracted in April 2019. Initial statistical checks carried out on the data include:
Plausibility checking that the amount of the investment has a realistic value. Any record showing a very high amount is referred back to VCRT, which will check on these cases;
Checking that the companies correspond to the company registration number. In case of inconsistencies, the correct information is retrieved from Companies House Database or VCRT; and
33
Checking all the duplicate records, i.e. individual companies records with the same issue data and amount of investment are checked with VCRT.
Once the EIS1/SEIS1/SITR1 forms data have been extracted from the analysis database:
Any significant changes in figures from one statistical release to the next are investigated.
Methodology and reliability of the estimates
Tables 8.1 to 8.4, tables 8.11 to 8.14 and table 8.21 include every case captured via EIS1, SEIS1 and SITR1 forms respectively. The Self Assessment tables (EIS Table 8.5 and SEIS Table 8.15) include every case captured via Self Assessment returns. The AAR table includes all AAR cases handled by the SCEC. As no sampling is necessary, sampling error is not an issue. Sources of error in the published statistics include:
The EIS/SEIS/SITR companies have a period of several years after shares are issued to submit a compliance statement. Therefore, there are a small number of returns submitted later which add to the existing data and can therefore result in minor revisions to previously published figures. Accordingly, some revisions have been made to EIS/SEIS figures prior to 2017-18.
This release provides figures on the number of investors and the amount claimed through Self Assessment in value terms. The EIS and SEIS investors can claim Income Tax relief up to five years after the 31 January following the tax year in which the investment was made. Therefore, in the next year’s publication, a small number of late claims will result in minor revisions to previously published figures, particularly to the provisional figures for 2017-18.
Data capture errors: companies may make errors entering their information on the EIS1/SEIS1/SITR1 forms. The data are subsequently entered onto HMRC’s systems manually. This is another point at which data may be altered due to human error or software errors. There is a risk that errors involve very large investment amounts. To mitigate this, checks are carried out and any incorrect large values which are detected are investigated (and potentially altered) in the analysis database before the statistics are produced.
34
Revisions to previously published tables
Companies’ funds raised are subject to revision and, although the majority of assessments are finalised within three years after shares are issued, there are exceptional cases which can take much longer. As a result, there is no specific point at which claims for the latest years can be considered as complete or final. In practice, the statistics are first published as provisional one year after the tax year being presented and subsequently revised in the following releases of the statistics. However, where the revision to a year is particularly small and would lead to the potential disclosure of individual companies, these revisions will be suppressed (based on our standard approach to statistical disclosure control) until a subsequent release. Revisions to the published Self-Assessment returns data are not routinely made until the following year’s release. Typically, the only revisions are to the most recent year’s figures reflecting returns submitted later.
Statistical Tables
In previous years, the statistical tables accompanying this commentary contained the AAR tables in a separate file. For this year, the relevant AAR table has been included in the main file (EIS, SEIS or SITR).
User engagement
HMRC is committed to providing impartial quality statistics that meet our users’ needs. We encourage our users to engage with us so that we can improve our National and Official Statistics and identify gaps in the statistics that we produce. This is the second year that we have published the statistics on EIS, SEIS and SITR as an annual release, combining the previous April and October publications. This allows us to provide breakdowns of the EIS and SEIS data earlier in the year, and makes it easier for users to find the statistics that they need. If you would like to comment on these statistics or have any enquiries please use the statistical contacts named at the end of this section and on the cover page.
UKSA Assessment
The EIS and SEIS National Statistics have been assessed for compliance with the Code of Practice for Official Statistics by the UK Statistics Authority (UKSA). The assessment report is available on the UKSA website: https://www.statisticsauthority.gov.uk/archive/assessment/assessment/assessment-reports/ The SIC breakdowns and SITR statistics have not yet been assessed by UKSA and are therefore classified as Official Statistics rather than National Statistics. UKSA is an independent body directly accountable to Parliament with the overall objective to promote and safeguard the production and publication of official statistics. It is also required to promote and safeguard the quality and comprehensiveness of official statistics and good practice in relation to official statistics.
35
Contact points
Enquiries about these statistics should be directed to the responsible statisticians: Stephen Bennett and Chris Nash KAI Direct Business Taxes HM Revenue & Customs Room 3/60 100 Parliament Street London SW1A 2BQ Telephone: 03000 599570
03000 566510 Email: [email protected] For enquiries relating to the EIS, SEIS and SITR schemes, please contact the HMRC Venture Capital Reliefs Team: Venture Capital Reliefs Team HM Revenue & Customs WMBC BX9 1BN e-mail: [email protected] Media enquiries should be directed to the HMRC Press Office contacts listed on the front page of this release.
36
Annex A: Statistical reference tables
EIS: Table 8.1
Enterprise Investment Scheme
Table 8:1 Number of companies raising funds, number of subscriptions and amounts raised from 1993-94 to 2017-18 1
Claims data received by April 20192
Numbers: actual; Amounts: £million
YearCompanies raising
funds for first time
All companies
raising fundsSubscriptions
3 Companies raising
funds for first time
All companies
raising funds
Number Number Number Amount Amount
1993-94 75 75 480 4 4
1994-95 400 425 4,970 39 41
1995-96 440 550 5,140 46 53
1996-97 475 650 11,820 73 94
1997-98 530 725 11,410 85 113
1998-99 1,035 1,265 15,330 238 294
1999-00 1,640 2,105 29,340 463 614
2000-01 2,375 3,315 45,780 668 1,065
2001-02 1,685 2,855 25,480 419 761
2002-03 1,340 2,455 27,635 372 667
2003-04 1,150 2,175 28,125 334 627
2004-05 1,210 2,190 32,360 325 606
2005-06 1,155 2,140 31,525 306 648
2006-07 1,150 2,170 39,695 377 733
2007-08 1,130 2,205 37,135 366 707
2008-09 940 1,920 23,545 288 518
2009-10 990 1,975 25,960 363 623
2010-11 1,070 2,025 32,430 312 549
2011-12 1,565 2,680 88,865 691 1,034
2012-13 1,195 2,475 64,120 577 1,034
2013-14 1,415 2,850 123,140 897 1,592
2014-15r 1,745 3,380 154,475 1,125 1,930
2015-16r 1,725 3,575 184,790 1,073 1,976
2016-17pr 1,615 3,655 165,920 844 1,901
2017-18p 1,710 3,920 190,950 759 1,929
All years 29,770 **4 1,400,410 11,043 20,113
Source: EIS1 forms
Statistics in this table are consistent w ith HMRC’s policies on dominance and disclosure.
Numbers are rounded to the nearest 5 and amounts are rounded to the nearest £1m. Totals may not sum due to rounding.
p. Provisional
r. Revised
1. Tax year ending 5 April.
3. The number of subscriptions is not equal to the number of investors as an individual can invest in more than one company.
4. The total is not given as companies may raise funds in more than one year.
This table is classif ied as National Statistics.
2. Companies have a period of several years after shares are issued to submit an EIS1 compliance statement. Therefore data for 2017-18 is
provisional and subject to change due to claims not yet received, w hereas claims received for 2018-19 are currently excluded.
37
EIS: Table 8.2
Enterprise Investment Scheme
Table 8.2: Number of companies and amounts of funds raised, by industry (SIC2007), from 2015-161 to 2017-18p
Claims data received by April 20192
Numbers: actual; Amounts: £million
Industry 3
Number Amount Number Amount Number Amount
A. Agriculture, Forestry and Fishing; B. Mining and Quarrying 15 5 20 9 20 16
C. Manufacturing 370 126 410 182 455 186
D. Electricity, Gas, Steam and Air Conditioning; E. Water, Sewerage and Waste 90 254 40 48 20 20
F. Construction 35 36 45 49 25 16
G. Wholesale and Retail Trade, Repairs 430 165 410 166 430 168
H. Transport and Storage 30 34 30 34 30 24
I. Accommodation and Food 145 90 155 102 160 85
J. Information and Communication 1,085 596 1,170 677 1,250 641
K. Financial and Insurance 135 80 140 89 170 118
L. Real Estate 40 18 35 13 30 13
M. Professional, Scientific & Technical 615 285 580 253 625 283
N. Admin & Support Services; O. Public Admin, Defence & Social 230 123 260 131 295 129
P. Education 50 16 55 18 60 26
Q. Health and Social Work 50 35 55 22 75 42
R. Arts, Entertainment and Recreation 95 37 105 41 105 48
S. Other services activities; T. Households; U. Overseas 50 22 60 32 90 71
Unknown SIC2007 105 54 90 36 85 43
Total 3,575 1,976 3,655 1,901 3,920 1,929
Source: EIS1 forms, Inter-Departmental Business Register (IDBR) survey and Companies House database
Statistics in this table are consistent w ith HMRC’s policies on dominance and disclosure.
Numbers are rounded to the nearest 5 and amounts are rounded to the nearest £1m. Totals may not sum due to rounding.
p. Provisional
r. Revised
1. Tax year ending 5 April.
2. Companies have a period of several years after shares are issued to submit an EIS1 compliance statement. Claims received for 2018-19 are currently excluded.
This table is classif ied as Official Statistics.
2015-16r
2016-17r
2017-18p
3. Standard Industry Classif ication 2007 (SIC 2007) codes are used to identify the type of trade carried out by the company. The resulting f igures should be treated w ith caution because the
most recent SIC 2007 data have been used and some companies could have changed their trade since submitting their EIS1 forms.
38
EIS: Table 8.3
Enterpise Investment Scheme
Table 8.3: Number of companies and amount of funds raised, by size of funds, from 2015-161 to 2017-18p
Claims data received by April 20192
Numbers: actual; Amounts: £million
Size of funds raised per company
(Upper limit) £ Number Amount Number Amount Number Amount
10,000 150 1 135 1 140 1
25,000 225 4 215 4 215 4
50,000 345 14 345 14 395 16
100,000 520 40 530 41 540 41
150,000 345 44 365 46 390 49
200,000 255 46 285 50 300 53
250,000 215 49 250 57 250 57
300,000 160 44 175 49 205 57
350,000 160 51 135 45 160 52
400,000 125 47 115 44 125 48
450,000 95 40 105 45 115 48
500,000 90 42 95 46 125 60
750,000 245 152 275 168 305 187
1,000,000 160 141 165 145 175 153
1,250,000 85 96 85 97 115 129
1,500,000 70 93 80 107 55 75
1,750,000 45 75 45 75 60 99
2,000,000 30 53 20 34 50 95
3,000,000 100 242 100 234 90 218
4,000,000 55 203 35 128 50 169
5,000,000 105 499 100 474 65 317
Total 3,575 1,976 3,655 1,901 3,920 1,929
Source: EIS1 forms
Statistics in this table are consistent w ith HMRC’s policies on dominance and disclosure.
Numbers are rounded to the nearest 5 and amounts are rounded to the nearest £1m. Totals may not sum due to rounding.
p. Provisional
r. Revised
1. Tax year ending 5 April.
2. Companies have a period of several years after shares are issued to submit an EIS1 compliance statement. Claims received for 2018-19 are currently excluded.
This table is classif ied as National Statistics.
2015-16r
2016-17r
2017-18p
39
EIS: Table 8.4
Enterpise Investment Scheme
Table 8.4: Number of companies and amount of funds raised, by region, from 2015-161 to 2017-18p
Claims data received by April 20192
Numbers: actual; Amounts: £million
Government Office Region 3
Number Amount Number Amount Number Amount
England 3,305 1,878 3,340 1,759 3,610 1,818
- North East 55 17 70 21 55 20
- North West 215 95 215 124 240 132
- Yorkshire & the Humber 85 34 80 38 95 57
- East Midlands 85 34 80 36 80 38
- West Midlands 160 63 120 45 120 51
- East 275 174 265 120 315 128
- London 1,620 1,025 1,715 1,055 1,860 1,020
- South East 585 320 580 227 605 263
- South West 230 116 210 94 235 109
Wales 65 21 65 28 80 29
Scotland 165 57 180 83 185 69
Northern Ireland 25 6 40 12 30 6
Channel Islands / Isle of Man 10 12 10 10 * *
Unknown * * 15 8 10 4
Total 3,575 1,976 3,655 1,901 3,920 1,929
Source: EIS1 forms
Statistics in this table are consistent w ith HMRC’s policies on dominance and disclosure.
Numbers are rounded to the nearest 5 and amounts are rounded to the nearest £1m. Totals may not sum due to rounding.
p. Provisional
r. Revised
1. Tax year ending 5 April.
2. Companies have a period of several years after shares are issued to submit an EIS1 compliance statement. Claims received for 2018-19 are currently excluded.
3. The regional breakdow n is based on the registered address of the company, w hich may differ from the region in w hich the investment took place.
For more information on GOR codes see w w w .ons.gov.uk
This table is classif ied as National Statistics.
2015-16r
2016-17r
2017-18p
40
EIS: Table 8.5
Enterpise Investment Scheme
Table 8.5: Income tax relief, distribution of investors and amount of investment on which relief was claimed from 2015-16 1 to 2017-18p
Claims data received by April 20192
Numbers: actual; Amounts: £million
Size of investment in year
(Upper limit) £ Number Amount Number Amount Number Amount
500 2,455 1 2,120 1 2,525 1
1,000 1,905 2 1,535 1 1,885 2
2,500 2,705 5 2,515 4 2,860 5
5,000 3,420 14 3,235 13 3,400 14
10,000 4,730 39 4,710 38 4,600 37
15,000 2,755 35 2,805 36 2,870 36
20,000 2,380 43 2,320 42 2,205 40
25,000 2,290 54 2,180 51 2,170 50
50,000 5,550 211 5,270 198 4,820 180
75,000 2,105 130 2,145 132 1,885 115
100,000 1,630 147 1,495 135 1,240 112
150,000 1,345 167 1,265 157 1,070 131
200,000 745 132 685 121 520 91
250,000 395 89 370 84 305 69
300,000 300 83 250 70 210 58
350,000 150 49 135 44 120 40
400,000 125 46 105 40 70 27
450,000 85 37 85 36 75 32
500,000 95 46 75 36 65 31
750,000 210 127 145 89 140 86
1,000,000 200 184 165 152 150 138
Total 35,575 1,642 33,605 1,478 33,185 1,294
Source: Self Assessment Returns
Statistics in this table are consistent w ith HMRC’s policies on dominance and disclosure.
Numbers are rounded to the nearest 5 and amounts are rounded to the nearest £1m. Totals may not sum due to rounding.
Total f igures provided in this table are not directly comparable w ith the f igures in Table 8.1. For more information please refer to the commentary note.
p. Provisional
r. Revised
1. Tax year ending 5 April.
This table is classif ied as National Statistics.
2015-16r
2016-17r
2017-18p
41
SEIS: Table 8.11
Seed Enterprise Investment Scheme
Table 8:11 Number of companies raising funds, number of subscriptions and amounts raised from 2012-13 to 2017-181
Claims data received by April 20192
Numbers: actual; Amounts: £million
YearCompanies raising
funds for first time
All companies
raising fundsSubscriptions
3 Companies raising
funds for first time
All companies
raising funds
Number Number Number Amount Amount
2012-13 1,175 1,175 7,855 87 87
2013-14 1,820 2,140 32,880 156 174
2014-15r 1,905 2,400 34,185 158 182
2015-16r 1,870 2,440 30,645 157 184
2016-17pr 1,865 2,425 27,585 158 187
2017-18p 1,745 2,320 29,380 159 189
All years 10,380 **4 162,535 875 1,002
Source: SEIS1 forms
Statistics in this table are consistent w ith HMRC’s policies on dominance and disclosure.
Numbers are rounded to the nearest 5 and amounts are rounded to the nearest £1m. Totals may not sum due to rounding.
p. Provisional
r. Revised
1. Tax year ending 5 April.
3. The number of subscriptions is not equal to the number of investors as an individual can invest in more than one company.
4. The total is not given as companies may raise funds in more than one year.
This table is classif ied as National Statistics.
2. Companies have a period of several years after shares are issued to submit an SEIS1 compliance statement. Therefore data for 2017-18 is
provisional and subject to change due to claims not yet received, w hereas claims received for 2018-19 are currently excluded.
42
SEIS: Table 8.12
Seed Enterprise Investment Scheme
Table 8.12: Number of companies and amounts of funds raised, by industry (SIC2007), from 2015-161 to 2017-18p
Claims data received by April 20192
Numbers: actual; Amounts: £million
Industry 3
Number Amount Number Amount Number Amount
A. Agriculture, Forestry and Fishing; B. Mining and Quarrying 20 2 15 2 15 1
C. Manufacturing 225 16 240 19 225 19
D. Electricity, Gas, Steam and Air Conditioning; E. Water, Sewerage and Waste 10 1 10 1 15 1
F. Construction 25 2 20 2 20 2
G. Wholesale and Retail Trade, Repairs 310 23 250 18 230 18
H. Transport and Storage 20 1 25 1 25 1
I. Accommodation and Food 100 9 120 10 110 9
J. Information and Communication 930 73 925 72 825 69
K. Financial and Insurance 55 5 40 3 50 5
L. Real Estate 25 2 20 1 15 1
M. Professional, Scientific & Technical 295 21 290 22 255 21
N. Admin & Support Services; O. Public Admin, Defence & Social 165 11 190 13 245 20
P. Education 30 2 40 3 40 3
Q. Health and Social Work 35 3 40 3 50 4
R. Arts, Entertainment and Recreation 90 6 95 8 95 8
S. Other services activities; T. Households; U. Overseas 40 3 60 5 70 4
Unknown SIC2007 65 5 40 3 40 3
Total 2,440 184 2,425 187 2,320 189
Source: SEIS1 forms, Inter-Departmental Business Register (IDBR) survey and Companies House database
Statistics in this table are consistent w ith HMRC’s policies on dominance and disclosure.
Numbers are rounded to the nearest 5 and amounts are rounded to the nearest £1m. Totals may not sum due to rounding.
p. Provisional
r. Revised
1. Tax year ending 5 April.
2. Companies have a period of several years after shares are issued to submit an SEIS1 compliance statement. Claims received for 2018-19 are currently excluded.
This table is classif ied as Official Statistics.
2015-16r
2016-17r
2017-18p
3. Standard Industry Classif ication 2007 (SIC 2007) codes are used to identify the type of trade carried out by the company. The resulting f igures should be treated w ith caution because the
most recent SIC 2007 data have been used and some companies could have changed their trade since submitting their EIS1 forms.
43
SEIS: Table 8.13
Seed Enterpise Investment Scheme
Table 8.13: Number of companies and amount of funds raised, by size of funds, from 2015-161 to 2017-18p
Claims data received by April 20192
Numbers: actual; Amounts: £million
Size of funds raised per company
(Upper limit) £ Number Amount Number Amount Number Amount
10,000 220 1 225 2 165 1
25,000 350 7 300 6 290 6
50,000 525 21 500 20 480 19
100,000 575 45 610 48 575 46
150,000 775 110 790 111 810 116
Total 2,440 184 2,425 187 2,320 189
Source: SEIS1 forms
Statistics in this table are consistent w ith HMRC’s policies on dominance and disclosure.
Numbers are rounded to the nearest 5 and amounts are rounded to the nearest £1m. Totals may not sum due to rounding.
p. Provisional
r. Revised
1. Tax year ending 5 April.
2. Companies have a period of several years after shares are issued to submit an SEIS1 compliance statement. Claims received for 2018-19 are currently excluded.
This table is classif ied as National Statistics.
2015-16r
2016-17r
2017-18p
44
SEIS: Table 8.14
Seed Enterpise Investment Scheme
Table 8.14: Number of companies and amount of funds raised, by region, from 2015-161 to 2017-18p
Claims data received by April 20192
Numbers: actual; Amounts: £million
Government Office Region 3
Number Amount Number Amount Number Amount
England 2,295 175 2,245 174 2,135 175
- North East 50 3 40 2 25 2
- North West 140 10 160 13 150 13
- Yorkshire & the Humber 50 4 65 5 60 5
- East Midlands 55 4 70 5 70 5
- West Midlands 100 7 95 6 90 7
- East 180 14 165 13 175 14
- London 1,130 88 1,140 93 1,085 92
- South East 435 34 355 24 330 25
- South West 165 12 160 12 155 12
Wales 45 3 50 4 60 4
Scotland 70 5 90 6 90 7
Northern Ireland 15 1 30 2 25 1
Channel Islands / Isle of Man 0 0 0 0 0 0
Unknown 10 1 10 1 10 1
Total 2,440 184 2,425 187 2,320 189
Source: SEIS1 forms
Statistics in this table are consistent w ith HMRC’s policies on dominance and disclosure.
Numbers are rounded to the nearest 5 and amounts are rounded to the nearest £1m. Totals may not sum due to rounding.
p. Provisional
r. Revised
1. Tax year ending 5 April.
2. Companies have a period of several years after shares are issued to submit an SEIS1 compliance statement. Claims received for 2018-19 are currently excluded.
3. The regional breakdow n is based on the registered address of the company, w hich may differ from the region in w hich the investment took place.
For more information on GOR codes see w w w .ons.gov.uk
This table is classif ied as National Statistics.
2015-16r
2016-17r
2017-18p
45
SEIS: Table 8.15
Seed Enterpise Investment Scheme
Table 8.15: Income tax relief, distribution of investors and amount of investment on which relief was claimed from 2015-161 to 2017-18p
Claims data received by April 20192
Numbers: actual; Amounts: £million
Size of investment in year
(Upper limit) £ Number Amount Number Amount Number Amount
500 1,025 0 810 0 900 0
1,000 570 0 440 0 430 0
2,500 855 2 770 1 630 1
5,000 1,275 5 1,210 5 1,115 5
10,000 1,830 16 1,730 15 1,490 13
15,000 905 12 890 12 765 10
20,000 685 13 685 13 560 10
25,000 605 14 580 14 480 11
50,000 1,215 46 1,200 45 975 37
75,000 335 21 320 20 275 17
100,000 345 33 345 32 240 23
Total 9,645 163 8,975 158 7,860 128
Source: Self Assessment Returns
Statistics in this table are consistent w ith HMRC’s policies on dominance and disclosure.
Numbers are rounded to the nearest 5 and amounts are rounded to the nearest £1m. Totals may not sum due to rounding.
Total f igures provided in this table are not directly comparable w ith the f igures in Table 8.1. For more information please refer to the commentary note.
p. Provisional
r. Revised
1. Tax year ending 5 April.
This table is classif ied as National Statistics.
2015-16r
2016-17r
2017-18p
46
SITR: Table 8.21
Social Investment Tax Relief
Table 8.21: Number of enterprises raising funds and
amounts raised, from 2014-151 to 2017-18p
Applications submitted by April 20181
Numbers: actual; Amounts: £million
YearEnterprises
raising fundFunds raised
Number Amount
2014-15 5 0.5
2015-16r 25 2.3
2016-17pr 30 2.5
2017-18p 20 1.4
Total *2 6.7
Source: SITR1 forms
Statistics in this table are consistent w ith HMRC's policies on dominance and disclosure
Numbers are rounded to the nearest 5.
Amount is rounded to the nearest £0.1 million.
Totals may not sum due to rounding
p. Provisional
r. Revised
1. Tax year runs from 6th April in one year to 5th April in the follow ing year.
2. The total is not given as enterprises may raised funds in more than one year.
This table is classif ied as Official Statistics.
47
EIS: Table 8.1a
En
terp
rise
In
ve
stm
en
t S
ch
em
e -
Ad
va
nce
Ass
ura
nce
Ap
pli
ca
tio
ns
Ta
ble
8.1
a:
Nu
mb
er
of
co
mp
an
ies
see
kin
g a
dva
nce
ass
ura
nce
, n
um
be
r o
f a
pp
lica
tio
ns
rece
ive
d,
ap
pro
ve
d a
nd
re
jecte
d f
rom
2006-0
71 t
o 2
018-1
9p
Applic
atio
ns s
ubm
itted b
y A
pril 2
018
1
Num
bers
: actu
al
Ye
ar2
20
06
-07
2
00
7-0
8
20
08
-09
2
00
9-1
0
20
10
-11
20
11
-12
2
01
2-1
3
20
13
-14
20
14
-15
20
15
-16
20
16
-17
r2
01
7-1
8r
20
18
-19
pA
ll Y
ea
rs
Nu
mb
er
Nu
mb
er
Nu
mb
er
Nu
mb
er
Nu
mb
er
Nu
mb
er
Nu
mb
er
Nu
mb
er
Nu
mb
er
Nu
mb
er
Nu
mb
er
Nu
mb
er
Nu
mb
er
Nu
mb
er
Co
mp
an
ies
se
ekin
g a
dva
nce
as
su
ran
ce
1,0
35
1,0
25
96
51
,09
51
,37
52
,03
02
,26
52
,64
03
,07
53
,45
03
,51
53
,71
03
,14
5**
3
AA
Rs
ap
plica
tio
ns
re
ce
ive
d1
,08
01
,06
09
95
1,1
25
1,4
60
2,1
50
2,3
40
2,7
30
3,1
70
3,5
75
3,6
25
3,8
15
3,2
70
30
,96
5
Ap
plic
ati
on
s p
roc
es
s in
cu
rre
nt
ye
ar
Of w
hic
h, a
pp
lica
tio
ns
ap
pro
ved
in
ye
ar
8
80
87
58
40
88
01
,19
51
,77
01
,78
52
,08
52
,37
02
,38
02
,52
02
,60
52
,04
02
2,6
30
Of w
hic
h, a
pp
lica
tio
ns
re
jecte
d in
ye
ar
6
58
08
09
01
05
13
51
50
14
01
65
28
02
50
29
03
00
2,1
85
Of w
hic
h, a
pp
lica
tio
ns
no
t p
urs
ue
d fu
rth
er
5
02
02
54
03
05
56
08
01
00
17
52
65
43
5**
42
,25
0
Ap
plic
ati
on
s p
roc
es
se
d in
su
bs
eq
ue
nt
ye
ars
Of w
hic
h, a
pp
lica
tio
ns
la
ter
ap
pro
ved
5
04
53
08
08
01
30
28
53
40
40
05
00
43
02
60
-2
,71
0
Of w
hic
h, a
pp
lica
tio
ns
la
ter
reje
cte
d
30
45
20
35
50
60
60
80
13
02
35
15
02
30
-1
,14
0
To
tal A
AR
ap
plica
tio
ns
re
ce
ive
d1
,08
01
,06
09
95
1,1
25
1,4
60
2,1
50
2,3
40
2,7
30
3,1
70
3,5
75
3,6
25
3,8
15
3,2
70
30
,96
5
To
tal A
AR
ap
plica
tio
ns
ap
pro
ved
93
09
20
87
09
60
1,2
75
1,9
00
2,0
75
2,4
25
2,7
75
2,8
80
2,9
55
2,8
60
2,0
40
25
,34
0
Sourc
e: EIS
(AA
)
Sta
tistic
s in
this
table
are
consis
tent w
ith H
MR
C's
polic
ies o
n d
om
inance a
nd d
isclo
sure
Num
bers
are
rounded to the n
eare
st 5. Tota
ls m
ay n
ot sum
due to r
oundin
g.
p. Pro
vis
ional
r. R
evis
ed
1. Tax y
ear
runs f
rom
6th
April i
n o
ne y
ear
to 5
th A
pril i
n the f
ollo
win
g y
ear.
2. C
om
panie
s h
ave a
period o
f severa
l years
to s
eek
advance a
ssura
nce. There
fore
, data
fro
m 2
015-1
6 to 2
018-1
9 r
em
ain
pro
vis
ional a
nd s
ubje
ct to
change d
ue to a
pplic
atio
ns s
till b
ein
g p
rocesssed.
3. The tota
l is n
ot giv
en a
s c
om
panie
s m
ay s
eek
assura
nce in
more
than o
ne y
ear.
4. The b
ala
nce o
f applic
atio
ns in
clu
de those w
hic
h w
ill b
e p
rocessed in
a s
ubsequent year.
This
table
is c
lassifie
d a
s O
ffic
ial S
tatis
tics.
48
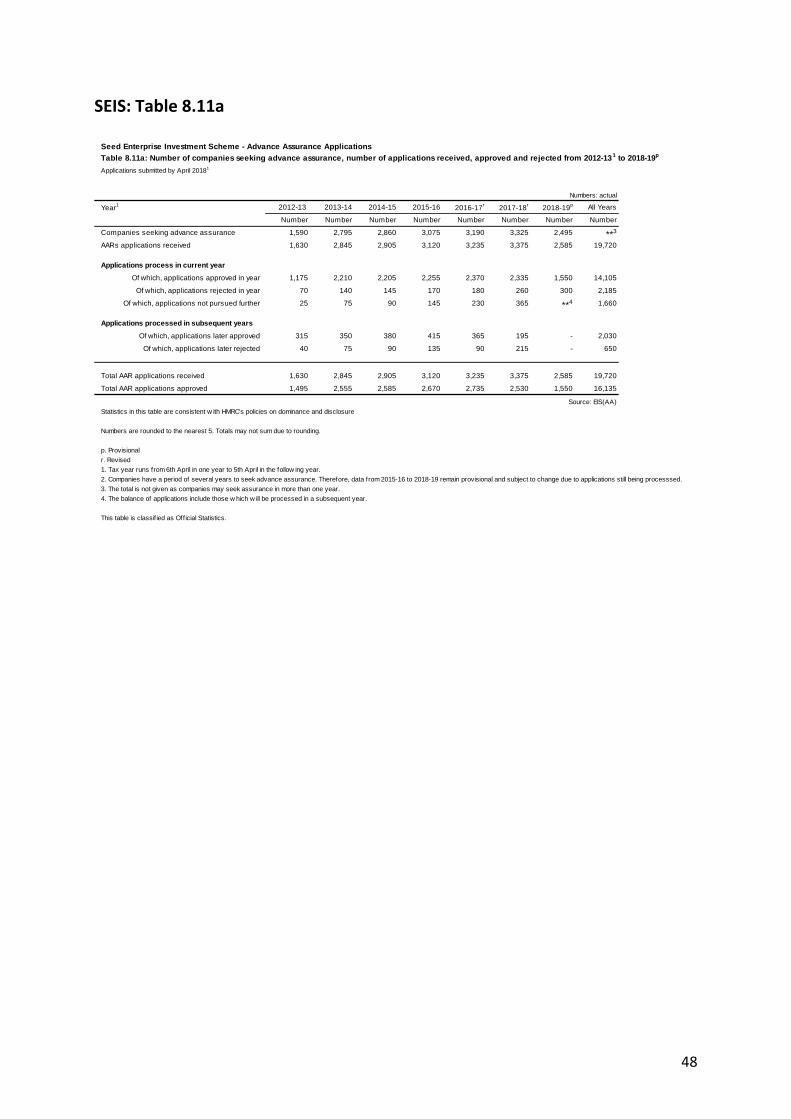
SEIS: Table 8.11a
Seed Enterprise Investment Scheme - Advance Assurance Applications
Table 8.11a: Number of companies seeking advance assurance, number of applications received, approved and rejected from 2012-131 to 2018-19p
Applications submitted by April 20181
Numbers: actual
Year1 2012-13 2013-14 2014-15 2015-16 2016-17
r2017-18
r2018-19
p All Years
Number Number Number Number Number Number Number Number
Companies seeking advance assurance 1,590 2,795 2,860 3,075 3,190 3,325 2,495 **3
AARs applications received 1,630 2,845 2,905 3,120 3,235 3,375 2,585 19,720
Applications process in current year
Of which, applications approved in year 1,175 2,210 2,205 2,255 2,370 2,335 1,550 14,105
Of which, applications rejected in year 70 140 145 170 180 260 300 2,185
Of which, applications not pursued further 25 75 90 145 230 365 **4 1,660
Applications processed in subsequent years
Of which, applications later approved 315 350 380 415 365 195 - 2,030
Of which, applications later rejected 40 75 90 135 90 215 - 650
Total AAR applications received 1,630 2,845 2,905 3,120 3,235 3,375 2,585 19,720
Total AAR applications approved 1,495 2,555 2,585 2,670 2,735 2,530 1,550 16,135
Source: EIS(AA)
Statistics in this table are consistent w ith HMRC's policies on dominance and disclosure
Numbers are rounded to the nearest 5. Totals may not sum due to rounding.
p. Provisional
r. Revised
1. Tax year runs from 6th April in one year to 5th April in the follow ing year.
2. Companies have a period of several years to seek advance assurance. Therefore, data from 2015-16 to 2018-19 remain provisional and subject to change due to applications still being processsed.
3. The total is not given as companies may seek assurance in more than one year.
4. The balance of applications include those w hich w ill be processed in a subsequent year.
This table is classif ied as Official Statistics.
49
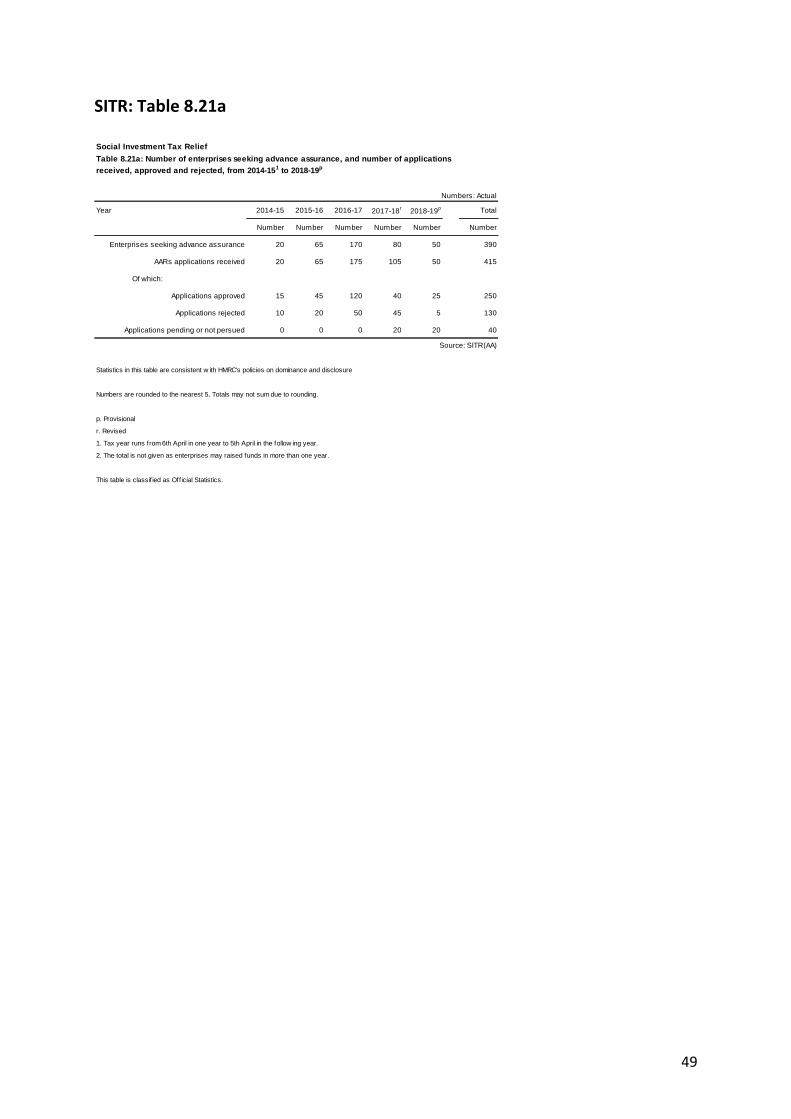
SITR: Table 8.21a
Social Investment Tax Relief
Table 8.21a: Number of enterprises seeking advance assurance, and number of applications
received, approved and rejected, from 2014-151 to 2018-19p
Numbers: Actual
Year 2014-15 2015-16 2016-17 2017-18r
2018-19p Total
Number Number Number Number Number Number
Enterprises seeking advance assurance 20 65 170 80 50 390
AARs applications received 20 65 175 105 50 415
Of which:
Applications approved 15 45 120 40 25 250
Applications rejected 10 20 50 45 5 130
Applications pending or not persued 0 0 0 20 20 40
Source: SITR(AA)
Statistics in this table are consistent w ith HMRC's policies on dominance and disclosure
Numbers are rounded to the nearest 5. Totals may not sum due to rounding.
p. Provisional
r. Revised
1. Tax year runs from 6th April in one year to 5th April in the follow ing year.
2. The total is not given as enterprises may raised funds in more than one year.
This table is classif ied as Official Statistics.