Embed Size (px)
Citation preview
Tariq Abu-Jaber, MA, MPH, Staff VP Clinical Informatics, EIM, WellPoint, Inc.
Praveen Soti, MD, MBA, Principal, Healthcare Consulting, Infosys Technologies
Enterprise Data Management as a Health Plan Quality Improvement Strategy
The Quality Colloquium, Harvard University August 21, 2007
2
Data Management to Improve Care Quality
Thesis: Enterprise Data Management Enables Integrated Care Coordination Across Products, Time and Services, Leading to Better Quality of Care and Therefore Health Outcomes
• Value Proposition• Industry Experience• Measuring Outcomes• Implementation Challenges• Recommendations

Value Proposition
4
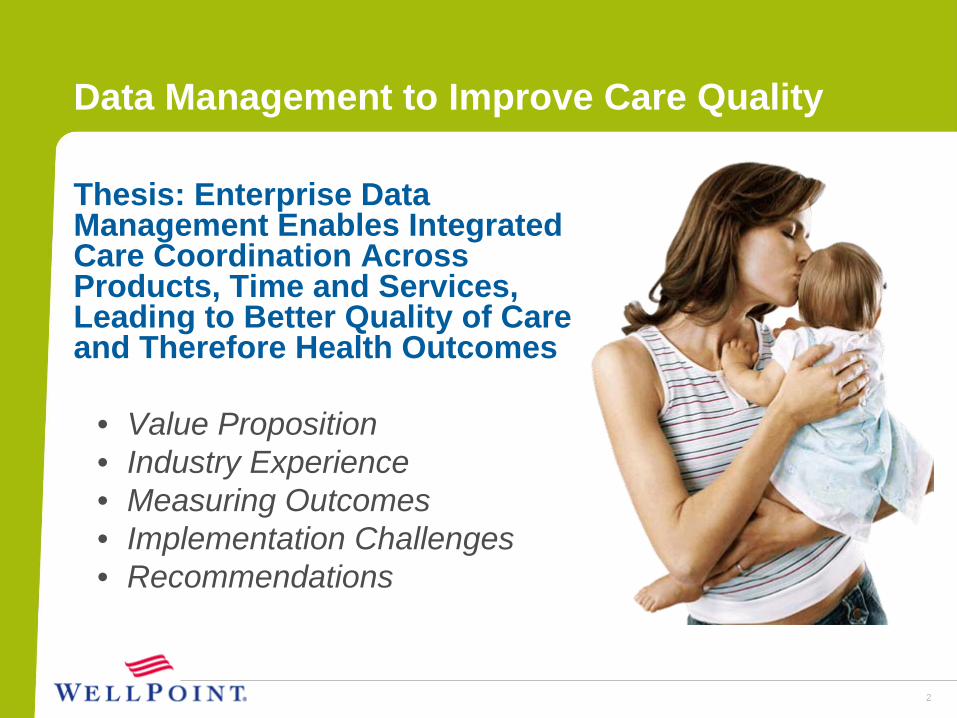
Value Proposition for Data Integration
For Health Plans …For Groups/Members …
“Direct” Improvements• Medical, pharmacy and
specialty cost reduction• Coordinated prevention,
diagnosis and treatment of conditions
“Indirect” Benefits• Absenteeism, disability,
family med leave, worker’s comp, “presenteeism”
• Intangible (pain, psychosocial costs, etc.)
Note: Productivity Costs usually 1- 3x Direct Medical Costs
Revenue & Membership Growth
• Increased penetration through integrated medical, behavioral health, specialty and clinical programs
• Lower cost of careIndustry Leadership
• Meets customer needs to manage overall expense
• Sets improved standard for quality of care

Industry Experience
6
Cost of Care
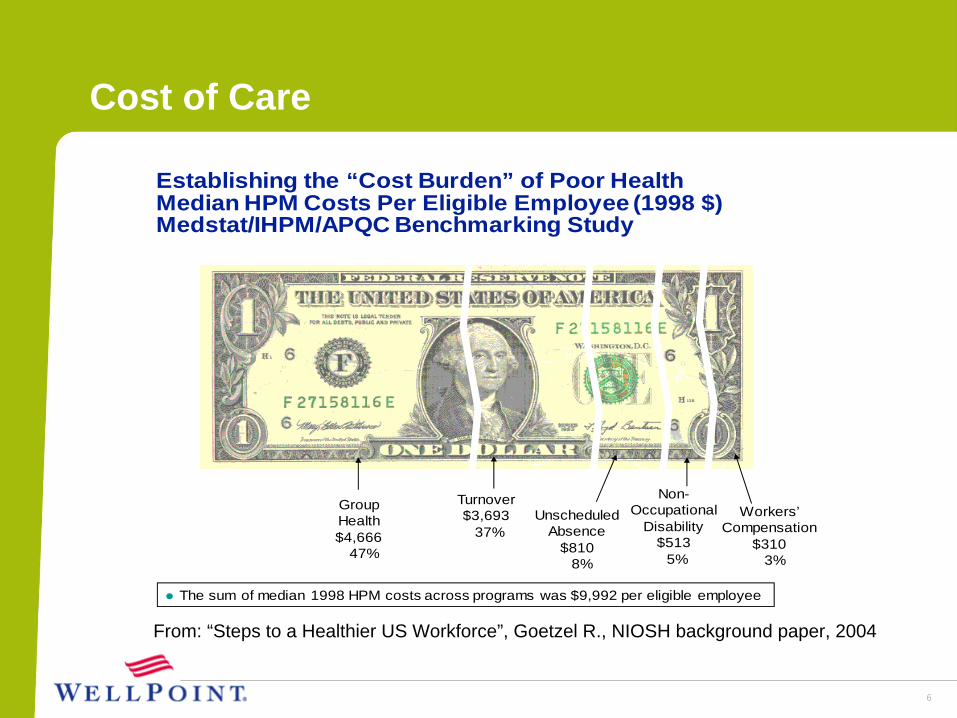
Establishing the “Cost Burden” of Poor HealthMedian HPM Costs Per Eligible Employee (1998 $) Medstat/IHPM/APQC Benchmarking Study
The sum of median 1998 HPM costs across programs was $9,992 per eligible employee
Workers’ Compensation
$3103%
Group Health$4,666
47%
Non-Occupational
Disability$513
5%
Turnover$3,693
37%Unscheduled
Absence$810
8%
From: “Steps to a Healthier US Workforce”, Goetzel R., NIOSH background paper, 2004
7
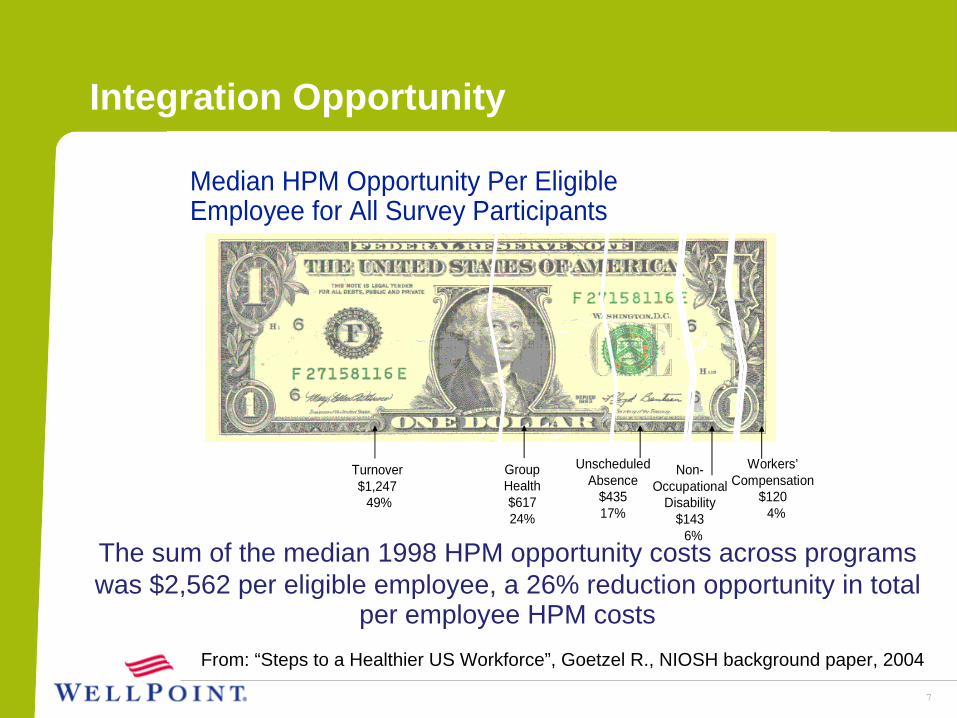
Median HPM Opportunity Per Eligible Employee for All Survey Participants
The sum of the median 1998 HPM opportunity costs across programs was $2,562 per eligible employee, a 26% reduction opportunity in total per employee HPM costs
Group Health$61724%
Unscheduled Absence
$43517%
Workers’ Compensation
$1204%
Turnover$1,247
49%
Non-Occupational
Disability$143
6%
Integration Opportunity
From: “Steps to a Healthier US Workforce”, Goetzel R., NIOSH background paper, 2004
The sum of the median 1998 HPM opportunity costs across programs was $2,562 per eligible employee, a 26% reduction opportunity in total
per employee HPM costs
88
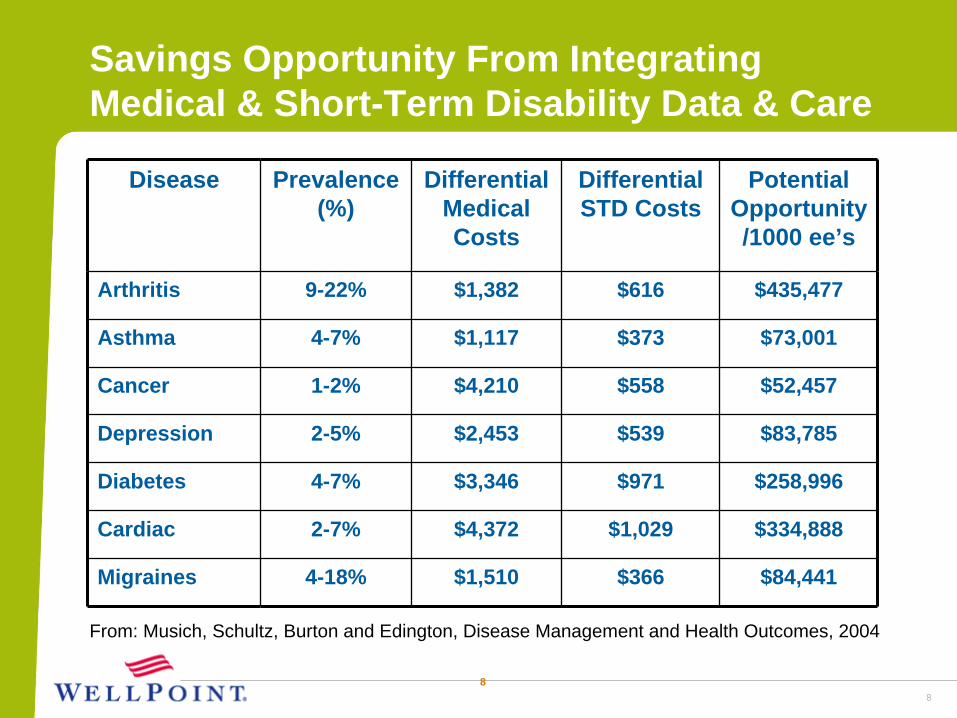
Savings Opportunity From Integrating Medical & Short-Term Disability Data & Care
Disease Prevalence (%)
Differential Medical Costs
Differential STD Costs
Potential Opportunity /1000 ee’s
Arthritis 9-22% $1,382 $616 $435,477
Asthma 4-7% $1,117 $373 $73,001
Cancer 1-2% $4,210 $558 $52,457
Depression 2-5% $2,453 $539 $83,785
Diabetes 4-7% $3,346 $971 $258,996
Cardiac 2-7% $4,372 $1,029 $334,888
Migraines 4-18% $1,510 $366 $84,441
From: Musich, Schultz, Burton and Edington, Disease Management and Health Outcomes, 2004
9
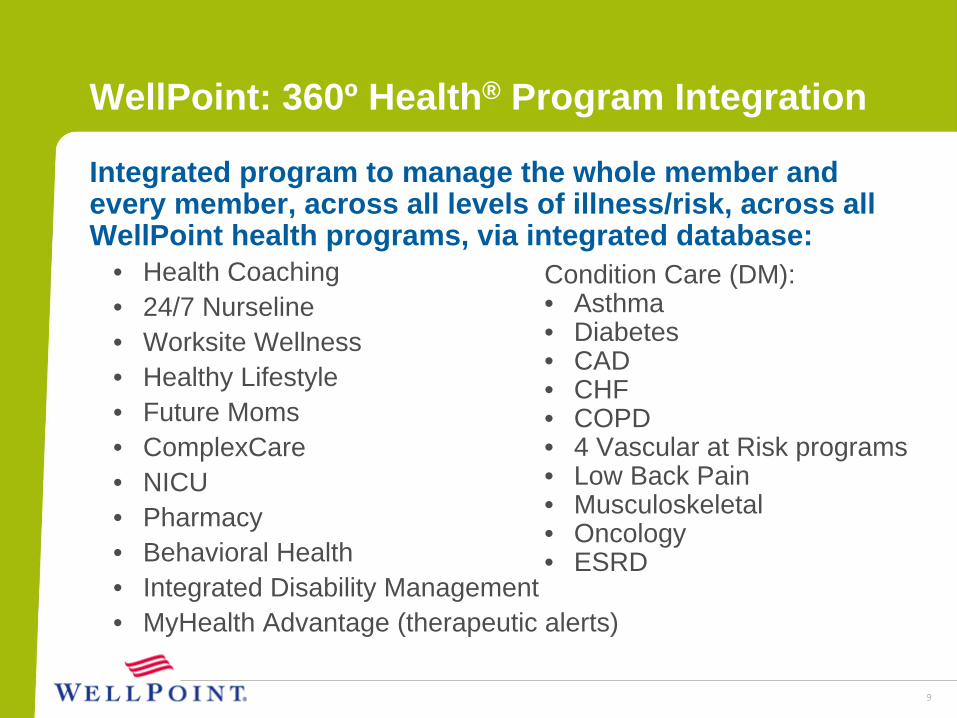
WellPoint: 360º Health® Program Integration
Integrated program to manage the whole member and every member, across all levels of illness/risk, across all WellPoint health programs, via integrated database:
• Health Coaching• 24/7 Nurseline• Worksite Wellness• Healthy Lifestyle• Future Moms• ComplexCare• NICU• Pharmacy• Behavioral Health• Integrated Disability Management• MyHealth Advantage (therapeutic alerts)
Condition Care (DM): • Asthma• Diabetes• CAD• CHF• COPD• 4 Vascular at Risk programs• Low Back Pain• Musculoskeletal• Oncology• ESRD
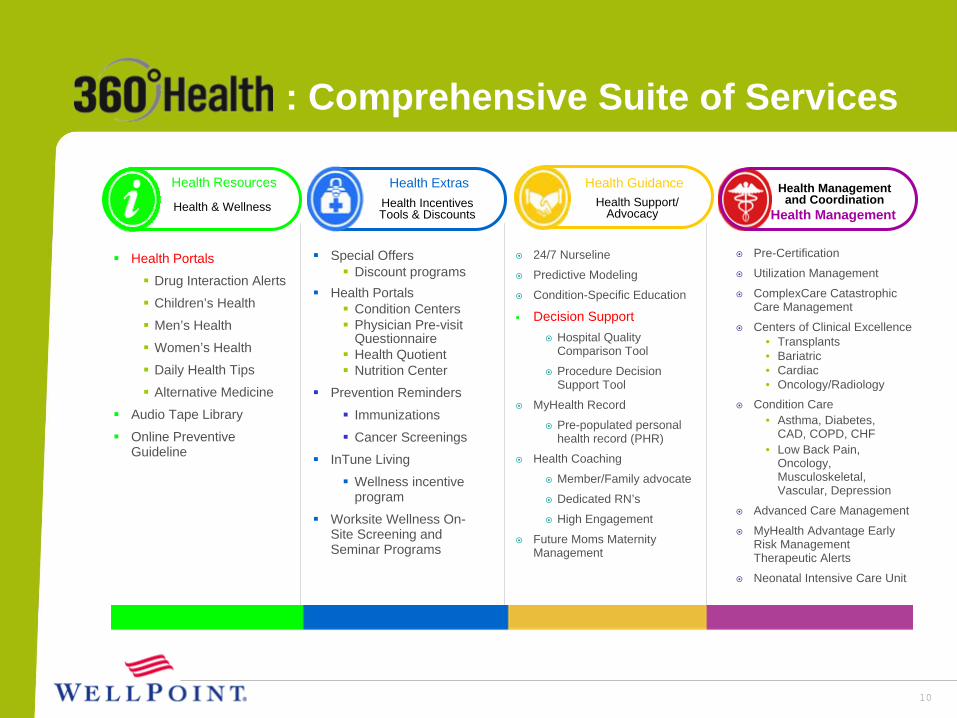
10
: Comprehensive Suite of Services
Pre-Certification
Utilization Management
ComplexCare Catastrophic Care Management
Centers of Clinical Excellence• Transplants• Bariatric• Cardiac• Oncology/Radiology
Condition Care• Asthma, Diabetes,
CAD, COPD, CHF• Low Back Pain,
Oncology, Musculoskeletal, Vascular, Depression
Advanced Care Management
MyHealth Advantage Early Risk Management Therapeutic Alerts
Neonatal Intensive Care Unit
Health Management
Health Management and Coordination
24/7 Nurseline
Predictive Modeling
Condition-Specific Education
Decision SupportHospital Quality Comparison Tool
Procedure Decision Support Tool
MyHealth Record
Pre-populated personal health record (PHR)
Health Coaching
Member/Family advocate
Dedicated RN’s
High Engagement
Future Moms Maternity Management
Special Offers Discount programs
Health PortalsCondition CentersPhysician Pre-visit QuestionnaireHealth QuotientNutrition Center
Prevention Reminders
Immunizations
Cancer Screenings
InTune Living
Wellness incentive program
Worksite Wellness On-Site Screening and Seminar Programs
Health Portals
Drug Interaction Alerts
Children’s Health
Men’s Health
Women’s Health
Daily Health Tips
Alternative Medicine
Audio Tape Library
Online Preventive Guideline
Health Resources
Health & Wellness
Health Extras Health GuidanceHealth Support/
AdvocacyHealth Incentives Tools & Discounts
11
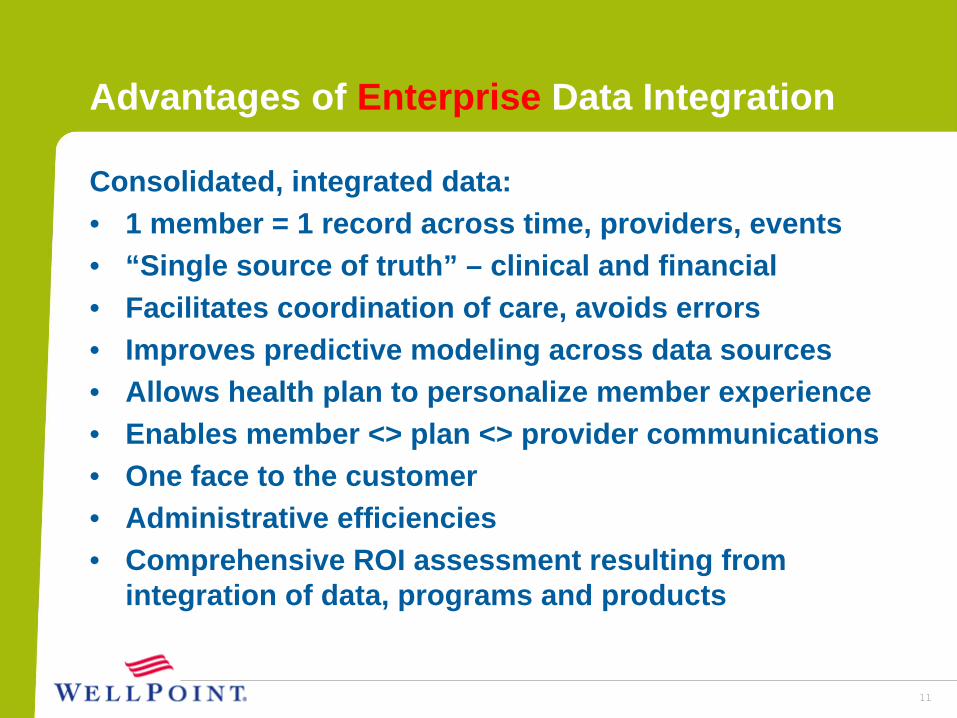
Advantages of Enterprise Data Integration
Consolidated, integrated data:• 1 member = 1 record across time, providers, events• “Single source of truth” – clinical and financial• Facilitates coordination of care, avoids errors• Improves predictive modeling across data sources• Allows health plan to personalize member experience• Enables member <> plan <> provider communications• One face to the customer• Administrative efficiencies• Comprehensive ROI assessment resulting from
integration of data, programs and products
12
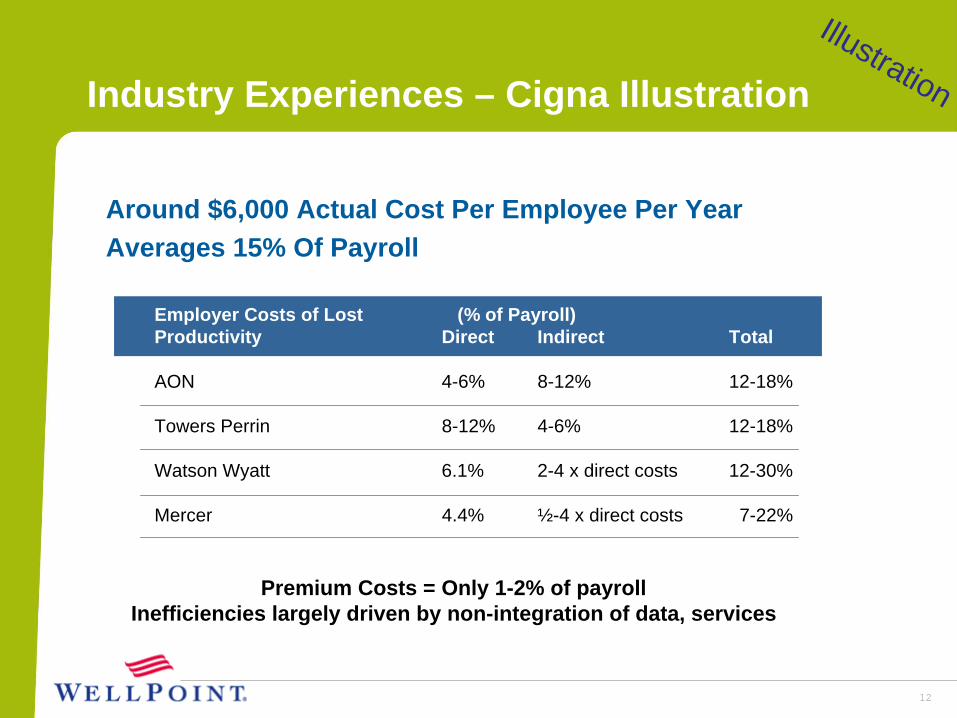
Employer Costs of Lost (% of Payroll)Productivity Direct Indirect Total
AON 4-6% 8-12% 12-18%
Towers Perrin 8-12% 4-6% 12-18%
Watson Wyatt 6.1% 2-4 x direct costs 12-30%
Mercer 4.4% ½-4 x direct costs 7-22%
Industry Experiences – Cigna Illustration
Around $6,000 Actual Cost Per Employee Per YearAverages 15% Of Payroll
Premium Costs = Only 1-2% of payrollInefficiencies largely driven by non-integration of data, services
Illustration
13
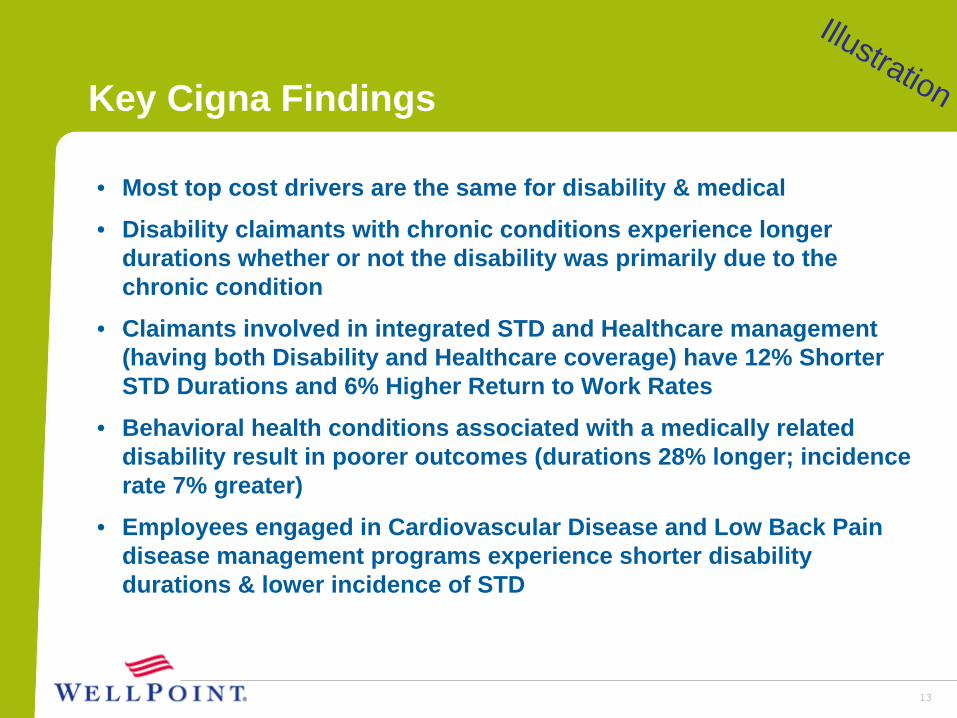
Key Cigna Findings
• Most top cost drivers are the same for disability & medical
• Disability claimants with chronic conditions experience longer durations whether or not the disability was primarily due to the chronic condition
• Claimants involved in integrated STD and Healthcare management (having both Disability and Healthcare coverage) have 12% Shorter STD Durations and 6% Higher Return to Work Rates
• Behavioral health conditions associated with a medically related disability result in poorer outcomes (durations 28% longer; incidence rate 7% greater)
• Employees engaged in Cardiovascular Disease and Low Back Pain disease management programs experience shorter disability durations & lower incidence of STD
Illustration
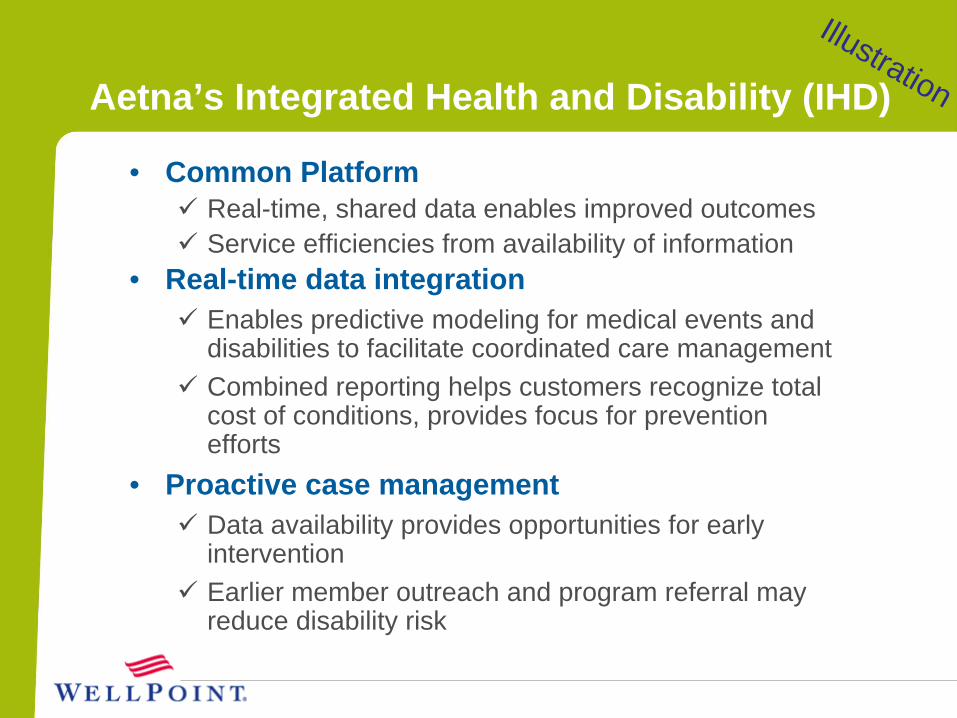
Aetna’s Integrated Health and Disability (IHD)
• Common Platform Real-time, shared data enables improved outcomes Service efficiencies from availability of information
• Real-time data integrationEnables predictive modeling for medical events and disabilities to facilitate coordinated care managementCombined reporting helps customers recognize total cost of conditions, provides focus for prevention efforts
• Proactive case management Data availability provides opportunities for early intervention Earlier member outreach and program referral may reduce disability risk
Illustration
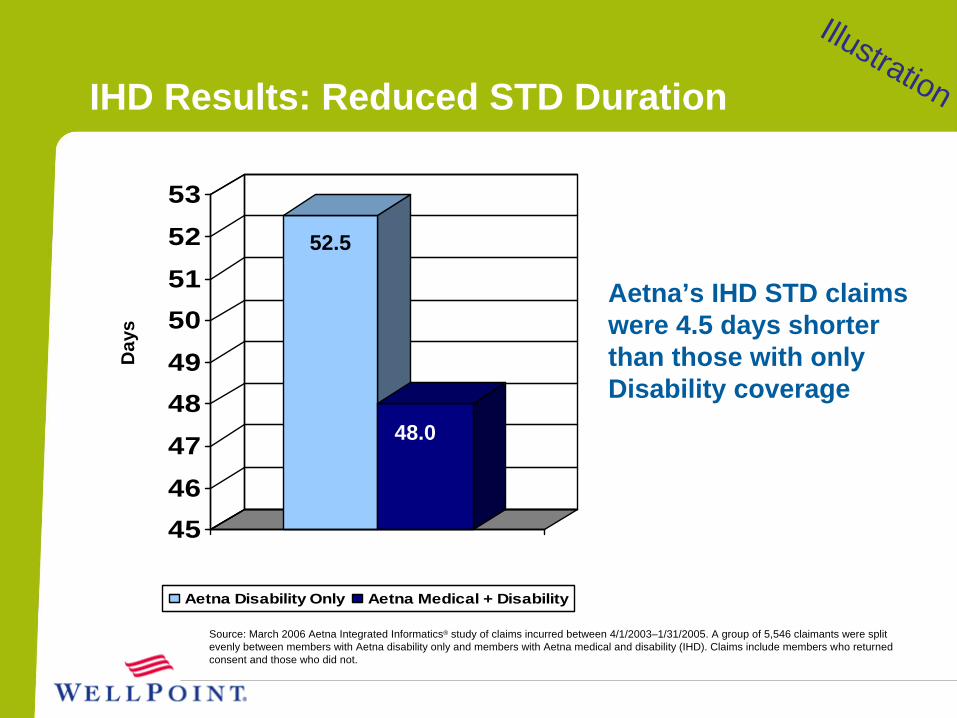
IHD Results: Reduced STD Duration
Source: March 2006 Aetna Integrated Informatics® study of claims incurred between 4/1/2003–1/31/2005. A group of 5,546 claimants were split evenly between members with Aetna disability only and members with Aetna medical and disability (IHD). Claims include members who returned consent and those who did not.
454647484950515253
Aetna Disability Only Aetna Medical + Disability
Day
s
52.5
48.0
Aetna’s IHD STD claims were 4.5 days shorter than those with only Disability coverage
Illustration
16
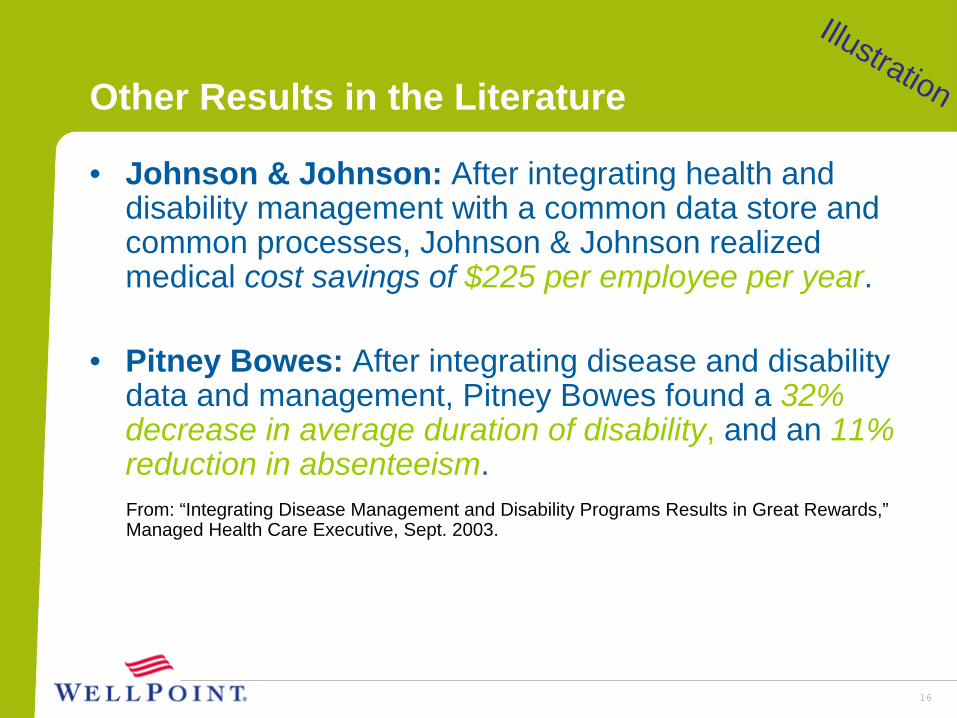
Other Results in the Literature
• Johnson & Johnson: After integrating health and disability management with a common data store and common processes, Johnson & Johnson realized medical cost savings of $225 per employee per year.
• Pitney Bowes: After integrating disease and disability data and management, Pitney Bowes found a 32% decrease in average duration of disability, and an 11% reduction in absenteeism.From: “Integrating Disease Management and Disability Programs Results in Great Rewards,” Managed Health Care Executive, Sept. 2003.
Illustration
Measuring Outcomes
18
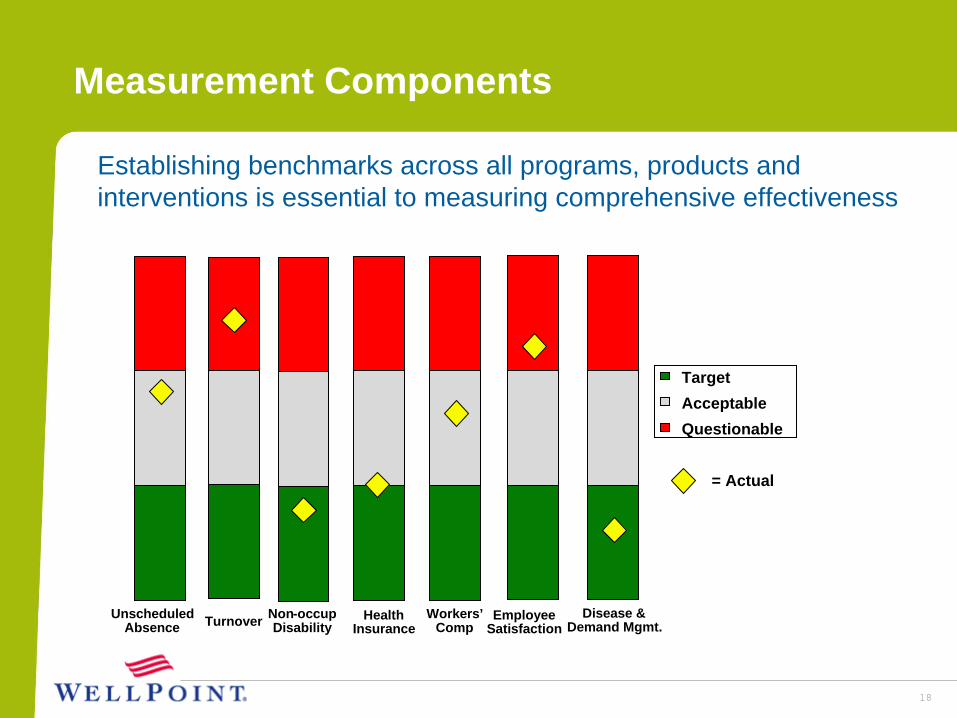
Measurement Components
TargetAcceptableQuestionable
= Actual
Health Insurance
Unscheduled Absence
EmployeeSatisfaction
Non-occupDisabilityTurnover Workers’
CompDisease &
Demand Mgmt.
Establishing benchmarks across all programs, products and interventions is essential to measuring comprehensive effectiveness
19
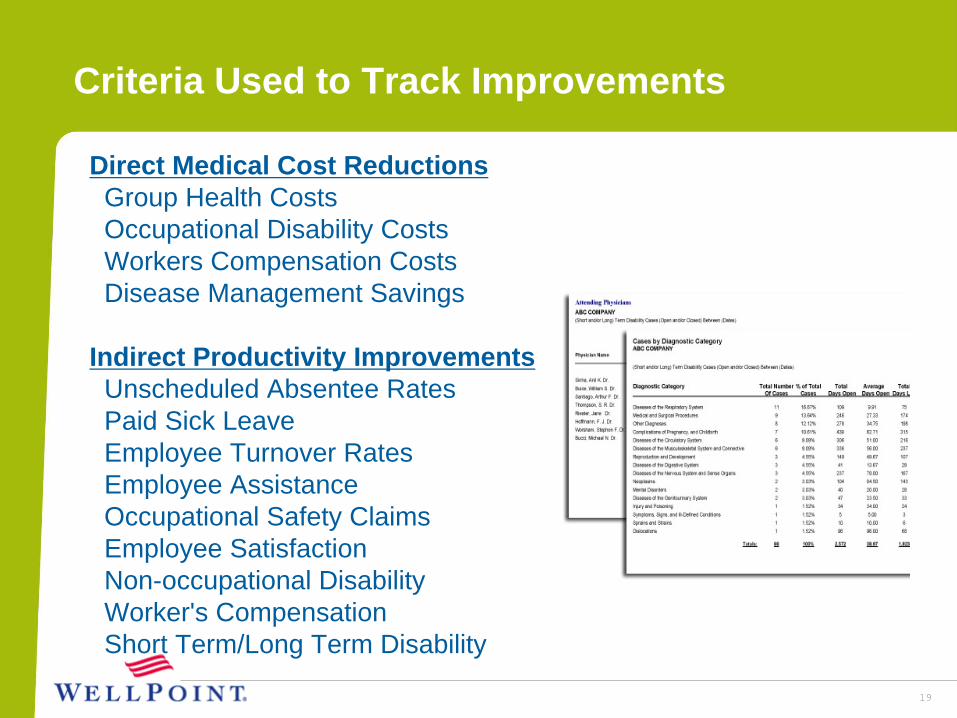
Criteria Used to Track Improvements
Direct Medical Cost ReductionsGroup Health Costs Occupational Disability CostsWorkers Compensation CostsDisease Management Savings
Indirect Productivity ImprovementsUnscheduled Absentee RatesPaid Sick LeaveEmployee Turnover RatesEmployee Assistance Occupational Safety ClaimsEmployee SatisfactionNon-occupational DisabilityWorker's CompensationShort Term/Long Term Disability
Recommendations
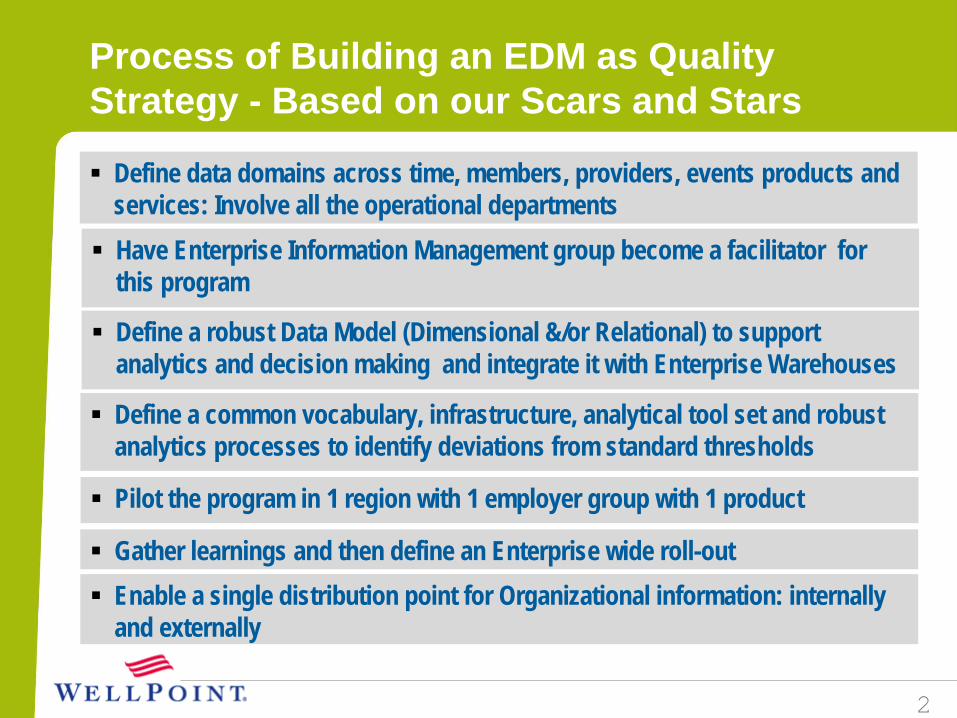
Process of Building an EDM as Quality Strategy - Based on our Scars and Stars
Define data domains across time, members, providers, events products and services: Involve all the operational departments
2
Define a robust Data Model (Dimensional &/or Relational) to support analytics and decision making and integrate it with Enterprise Warehouses
Gather learnings and then define an Enterprise wide roll-out
Define a common vocabulary, infrastructure, analytical tool set and robust analytics processes to identify deviations from standard thresholds
Pilot the program in 1 region with 1 employer group with 1 product
Have Enterprise Information Management group become a facilitator for this program
Enable a single distribution point for Organizational information: internally and externally
22
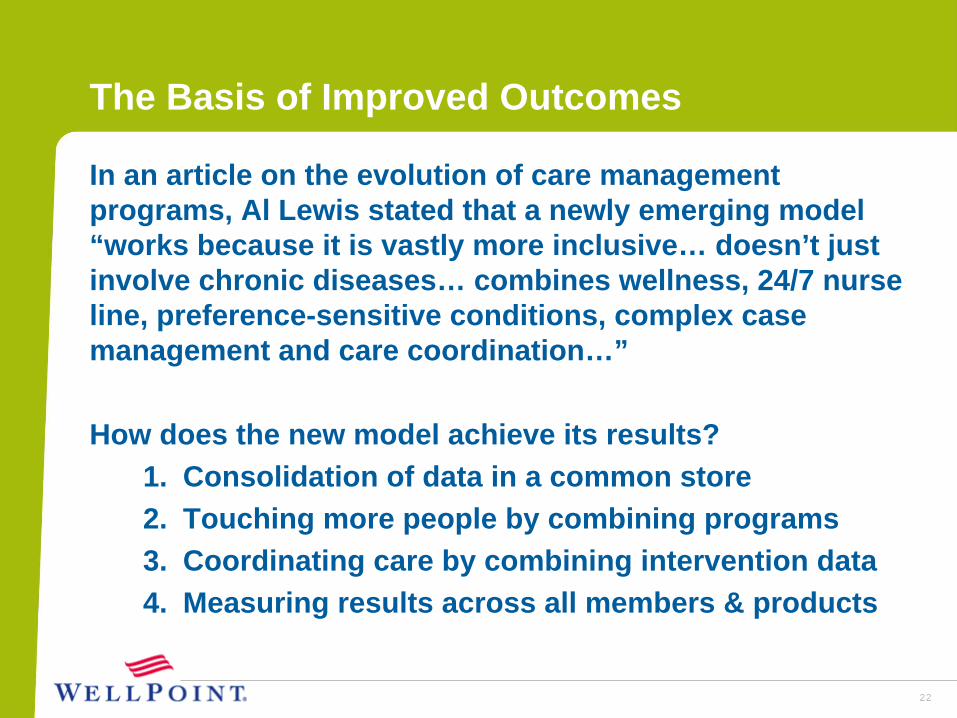
The Basis of Improved Outcomes
In an article on the evolution of care management programs, Al Lewis stated that a newly emerging model “works because it is vastly more inclusive… doesn’t just involve chronic diseases… combines wellness, 24/7 nurse line, preference-sensitive conditions, complex case management and care coordination…”
How does the new model achieve its results?1. Consolidation of data in a common store2. Touching more people by combining programs3. Coordinating care by combining intervention data4. Measuring results across all members & products
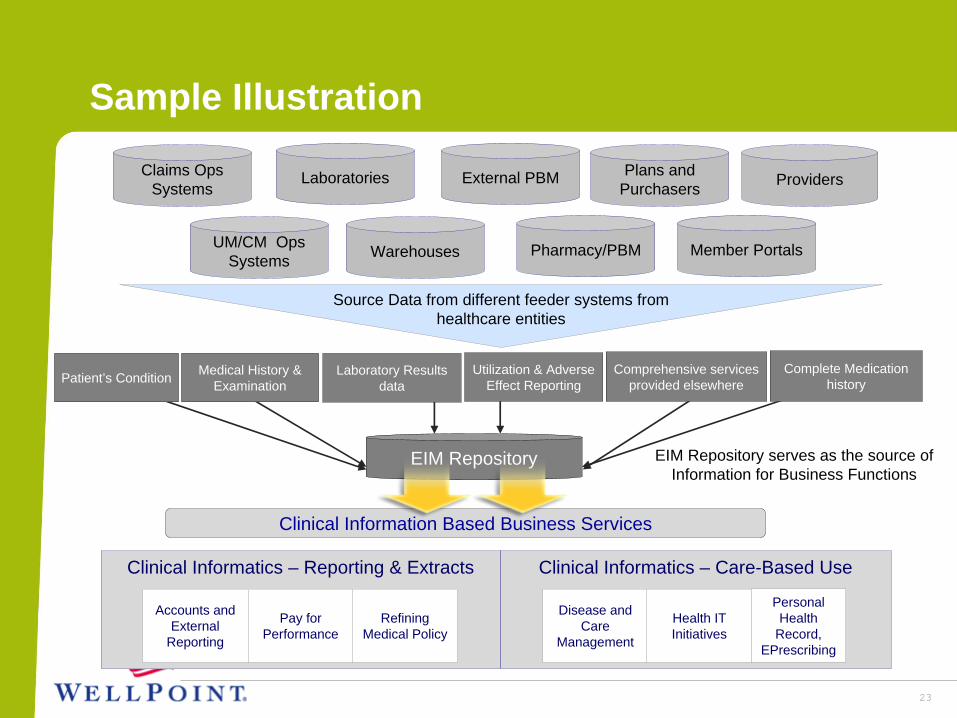
Sample Illustration
23
Clinical Informatics – Care-Based UseClinical Informatics – Reporting & Extracts
Warehouses
Laboratories
Pharmacy/PBM
Plans and Purchasers
Member Portals
Source Data from different feeder systems from healthcare entities
Accounts and External
Reporting
Pay for Performance
Refining Medical Policy
Disease and Care
Management
Health IT Initiatives
Personal Health
Record, EPrescribing
External PBM
UM/CM Ops Systems
EIM Repository
Clinical Information Based Business Services
EIM Repository serves as the source ofInformation for Business Functions
Claims Ops Systems Providers
Patient’s Condition Comprehensive services provided elsewhere
Complete Medication history
Utilization & Adverse Effect Reporting
Laboratory Results data
Medical History & Examination