Embed Size (px)
Citation preview
Enhancing Student Achievement on Performance Assessments in Mathematics
John Woodward
University of Puget Sound
Kara Monroe
Clover Park School District
Juliet Baxter
Educational Inquiries
In a special issue of Learning Disabilities Quarterly
1
Abstract. This article is part of a program of iterative research involving students
with learning disabilities in reform mathematics classrooms at the intermediate grade
levels. This study reports the findings from a larger, yearlong case study, focusing on
ways to improve problem solving through classwide performance assessment tasks and
ad hoc tutoring for students with learning disabilities. The purpose of these interventions
was to enhance a student’s deeper understanding of mathematics and to develop the kind
of strategic knowledge needed to solve complex problems. A quantitative analysis of the
results indicate that these two interventions led to demonstrable differences over time and
when compared to a limited number of students with learning disabilities who did not
receive this kind of instruction. Qualitative analyses of student performance show two
distinct trends in the improvement of the students in the intervention group. Findings
from this study have implications for special educators interested in mathematical
problem-solving instruction, as well as policymakers who are interested in performance
assessment.
2
The difficulties with traditional, norm-referenced tests as measures of student
achievement in disciplines such as mathematics are well documented. These tests, on
which students typically select answers from multiple-choice options, tend to stress
isolated facts, definitions, and procedures (Darling-Hammond, 1990; Linn, 1993; Smith
1991; Stiggins, 1997; Wilson, 1992). More importantly, educators such as Romberg
(1995) argue that norm-referenced tests and other objective assessments are anathema to
mathematical reform. By perpetuating the focus among teachers, administrators, and
policymakers on basic skills that are usually presented in a linear, fragmented fashion. In
order to promote deeper levels of curricular and pedagogical reform, Romberg and others
recommend substantive changes in the ways we assess mathematical understanding.
Alternative forms of assessments such as portfolios, performance tasks,
observations, and student interviews offer a variety of avenues for documenting
substantive mathematical understanding, while at the same time supporting and
reinforcing changes in classroom instruction (Kulm, 1990; Resnick & Resnick, 1992;
Romberg, 1995). Performance assessment tasks generally require students to: (a) solve a
complex problem(s), and (b) communicate how they derived their answer(s) or justify
why their answer(s) is correct. Examples of successful answers to performance
assessment tasks in mathematics include the use of pictures, tables, charts, and/or words
to explain thinking (e.g., Lesh & Lamon, 1992; Romberg, 1992; Webb, 1993).
Writing about one’s mathematical understanding presents intriguing possibilities
for math educators. Writing is seen not only as a means to communicate knowledge, but
also as a vehicle for learning (Connolly, 1989; King, 1982; McMillen, 1986; Yinger,
1985). Writing about mathematical concepts or solutions to problems can help students
3
critically examine, organize, and refine their understanding (Burns, 1995). In this regard,
writing can be an important vehicle for enhancing a student’s deeper understanding of
important mathematical ideas and of ways of engaging in mathematical inquiry (see
Morocco, this issue).
In fact, performance assessments can be a vehicle for helping students with
learning disabilities: (a) improve their strategic knowledge, (b) allow for substantive
interactions with peers in small group settings, and (c) facilitate teacher-guided
discussions (or constructive conversations, as Morocco describes them) in the classroom.
This latter issue of classroom discussions that involve students with learning disabilities is
particularly important. Current models of classroom mathematics discussions are
daunting for many practitioners because they require a considerable amount of content
and pedagogical knowledge, and with few, if any, models for how to engage students
with learning disabilities in these contexts (Ball, 1993; Ball & Rundquist, 1993; Cobb &
Bauersfeld, 1995; Lampert, 1997).
Writing about mathematics, whether it is in the form of journals or responses to
performance assessment tasks, can play a vital role in a discussion. Students can refer to
their work in discussions, and teachers can examine the mathematical understanding of
an entire class at a later time rather than having to make inferences about classroom
understanding in situ and on the basis of a few participants in a discussion. The writing
on performance tasks can provide useful information to teachers about individual
students, while supporting many of the goals of the current reform (e.g., reasoning,
communication).
4
For policymakers, written responses to math problems are a viable form of
statewide assessment, especially if open-ended or “extended response” formats for
mathematical problems parallel open-ended performance tasks in other core instructional
areas such as reading and writing. Thurlow (1994) noted that 40 states were considering
performance tasks on their statewide assessments in the early 1990s. Recently, Linn
(2000) suggested that even though alternative assessments designed around content
standards appear to be expensive, they are appealing to policymakers because they are
much more cost effective than more visible ways of changing education at the building
level (e.g., new curriculum, increased staff development, reduced class size).
As much as writing about mathematics on performance assessment tasks presents
potential benefits to classroom teachers and policymakers, it can present dramatic new
challenges to students with learning disabilities. In the past, mathematical problem
solving in special education was atheoretical in nature or guided largely by a behavioral
framework (Jitendra & Xin, 1997). Thus, students have typically been taught to work
simple, one-step word problems or sets of superficially complex problems that are solved
by directly applying a discrete set of rules (Woodward & Montague, 2000). These
problems are generally much easier than typical performance assessment tasks.
Assisting students with learning disabilities on performance assessments is also
likely to require instruction that goes beyond what the general classroom teacher can
provide. In fact, past naturalistic research in reform classrooms indicates that students
with learning disabilities and other academically low-achieving students in general
education classrooms do not benefit from reform mathematics as much as average and
high achieving students (Baxter, Woodward, & Olson in press; Woodward & Baxter,
5
1997). There are many reasons for this, but two main reasons include: (a) many teachers
in our past research do not call on non-volunteers during whole classrooms, particularly
academically low achieving students, and (b) the cognitive load of some of the
instructional materials are too great for these students. Logically, it would seem that this
would also be true of performance assessments. Additional assistance, whether it
involves a coordinated effort by a special education teacher and general education
teachers or the judicious use of classroom aides, is a promising way to help these students
benefit from reform mathematics.
One model for providing assistance to students with learning disabilities in
mainstreamed or inclusion settings is ad hoc tutoring (Good, Mulryan, & McCaslin,
1992; Woodward, Baxter, Olson, & Kline, 1996). With ad hoc tutoring, the regular
classroom teacher presents the majority of the lesson, with the teacher or classroom aide
providing follow-up work with target students on difficult skills, concepts, or problems at
a later point in the lesson or at another time in the day. Ad hoc tutoring can be a mix of
ongoing instruction in specific areas (e.g., fact practice, problem solving), as well as a
“preview-review” of content directly related to the lesson or unit of instruction in the
regular classroom. With a small group of students, ad hoc tutoring has the potential of
providing an instructional intensity that many in the field think is necessary for students
with learning disabilities (Baxter et al., in press; Woodward & Baxter, 1997; Zigmond &
Baker, 2000).
Purpose of the Study
This study builds on a prior, yearlong study of ad hoc tutoring and the use of
performance assessment tasks in the general education classroom (Woodward & Baxter,
6
1999). Those two interventions, which followed the structure described in this study,
were successful in helping students with learning disabilities maintain progress in the
reform math curriculum used in their regular classrooms. However, the ad hoc tutoring
in the previous study focused primarily on skill development and conceptual
understanding, and tutors helped students with learning disabilities only on the
“communication dimensions” of the classroom performance assessments. That is, tutors
helped students organize their answer space -- usually a large, blank box -- by having the
students mark off sections of the answer space into thirds and labeling the sections
“words,” “numbers,” and “pictures.” They also helped students with an answer by first
asking them to either say the answer or tell how they tried to solve it, and then they
dictating this response back to the student as he or she wrote it. Consequently, although
students with learning disabilities made discernible progress on performance assessment
tasks across the year, their answers often lacked task-appropriate or sophisticated
strategies, and most failed to achieve a correct answer to the problems. If anything,
these findings underscore how difficult complex mathematical tasks can be for students
with learning disabilities.
The purpose of the present study was to examine the combined effects of: (a)
classwide instruction on performance assessment tasks, and (b) problem-solving
instruction in ad hoc tutoring. What is reported here is only a portion of the data from a
larger case study. Specifically, the data describe the progress of students with learning
disabilities on the performance assessment measures over a five-month period.
Performance on criterion measures related to the math curriculum that were administered
throughout the period of this study, as well as the results of attitude surveys,
7
observations, and teacher interviews, are reported elsewhere (Woodward & Baxter,
2000).
METHOD
Participants
Teachers and schools. The participants in this study were seven fourth-grade
teachers and their students in three schools in the Pacific Northwest. The schools were
selected because they were using the Everyday Mathematics program (Bell, Bell, &
Hartfield, 1993), which is closely aligned with the 1989 NCTM Standards. All three
schools were middle-class, suburban elementary schools with similar socioeconomic
status (determined by the low number of students on free or reduced-cost lunch). All
seven teachers had a moderate level of experience with the Everyday Mathematics
program. Two of the schools had participated in the previous year study (Woodward &
Baxter, 1999). The third school was added so that quasi-experimental comparison could
be made at a stratified level (i.e., all classrooms would be at the fourth-grade level), as
well as to avoid the potentially confounding effects of having intervention and
comparison teachers in the same building.
Students. A total of 182 students at the three schools participated in this half-
year study. There were 102 students in the four intervention classes, and 79 students in
the three comparison classes. A total of 11 students were classified as learning disabled
on their IEPs and were receiving special education services for mathematics in general
education as well as resource room settings. Six of the students with learning disabilities
were in the intervention classrooms and five were in the comparison classes.
8
In addition to the students with learning disabilities, 25 other students in the study
were identified as at-risk for special education based on their mathematics performance
on the Iowa Test of Basic Skills (ITBS) (1996). These students were at or below the 34th
percentile on the total mathematics portion of the ITBS as well as its problem-solving
subtest. There were 17 at-risk students in the intervention classrooms and eight at-risk
students in the comparison classrooms. The number of students for each of the three
ability subgroups is listed in Table 1.
The scale scores from the math problem-solving subtest of the ITBS were used to
determine the comparability of the intervention and comparison groups. T-tests were
performed on all students in the two groups and on the low-ability students (i.e., those
scoring below the 34th percentile and the students with learning disabilities). Differences
between all students in the intervention and comparison groups on the math problem-
solving subtest of the ITBS were non-significant (t(1,180) = .94; p = .36). This was also
the case for the low-ability students (t(1,34) = .84; p = .41).
One of the main reasons for including the at-risk students as part of the study
stemmed from a high emphasis on mainstreamed instruction at all three schools. At one
of the participating schools, more students could have been referred for special education
services in mathematics but were not because of the nature of special education services
in the school. That is, the special education teacher at this school primarily served low-
incidence students (e.g., autistic, students with physical disabilities) or students who had
a reading disability. Consequently, there was "little room left" to serve students in math,
even if mathematics was part of their IEP. At other schools, many teachers objected to
the content of the program used in the resource room and thought that it did little to
9
develop substantive mathematical knowledge. For that reason, they did not refer their
students to special education for mathematics.
Materials
Daily curriculum. As mentioned earlier, the three schools in this study were using
a reform-oriented curriculum, the Everyday Mathematics program. This program reflects
over six years of development efforts by mathematics educators at the University of
Chicago School Mathematics Project (UCSMP). This program deemphasizes
computation and differs from many traditional elementary math curricula in the way
concepts are introduced and then reintroduced within and across grade levels. Students
learn core mathematics concepts through a “concentric ring” approach. That is, major
concepts are presented initially and then reappear later in the year and in the next grade
level, where they are addressed in greater depth. For example, fractions are introduced in
the first grade informally and through manipulatives. Then, over the subsequent grades
there are more substantive investigations of fractions, and activities become increasingly
formal and symbolic. Students begin learning algebra in the sixth grade.
Further, there is a significant emphasis on innovative forms of problem solving.
Unlike word problems in traditional math curricula that often lend themselves to a key
word approach, the problems or “number stories” in Everyday Mathematics often derive
from the students’ everyday world or from life science, geography, or other school
subjects. The developers agree with other mathematics educators (e.g., Carpenter, 1985)
that students come to school with informal and intuitive problem-solving abilities. As a
result, the lessons draw on this knowledge as a basis for math problem-solving exercises.
10
Students are encouraged to use or develop a variety of number models to display relevant
quantities in a problem (e.g., total and parts; start, change, end; quantity, quantity,
difference).
Each grade level of Everyday Mathematics is rich in problem-solving activities
that rarely involve the one-step problems common to traditional commercial curricula for
general and special education students. The program encourages teachers to discuss
different student solutions to problems, and these discussions are a vital part of the daily
lessons. This element is a significant departure from “end-of-the-chapter” problem sets
requiring students to merely apply basic operations to one- and two-step word problems
that are commonly found in special education research (Woodward & Montague, 2000;
Xin & Jitendra, 1999).
Everyday Mathematics, then, incorporates and emphasizes many of the NCTM
Standards (National Council of Teachers of Mathematics, 1989, 2000). Students spend
considerable time identifying patterns, estimating, and developing number sense. The
curriculum encourages teachers to conduct whole-class discussions in which students
describe their problem-solving strategies. An array of math tools and manipulatives--
calculators, scales, measuring devices, unifix cubes--are an important part of the daily
lessons. Finally, students work for a small portion of each day’s lesson in their math
workbooks, which generally contain five to 12 items that are intended to reinforce the
main concepts of the day’s lesson.
Performance assessment exercises in intervention classrooms. Performance
assessment exercises used in the intervention classrooms were modeled after the
extended response mathematics items on the Washington Assessment of Student
11
Learning (WASL). This statewide assessment is given at the fourth- and seventh-grade
level, and the extended response items generally involve a multistep problem followed by
a prompt that asks students to solve the problem and then explain how they derived their
answer using words, numbers, or pictures. In many respects, an extended response
problem functions as a math “essay” question that requires students to demonstrate
reasoning and communication skills.
The performance assessment exercises developed for the intervention classrooms
were taken from the Everyday Mathematics curriculum and transformed into a format
that resembled the extended response items on the WASL. In some cases, this meant
adding an extra step in the problem (e.g., a person in the problem derived an answer to
the problem, and students were required to determine if the person’s answer was correct
and why or why not). In other cases, such as problems involving geometry, multistep
problems were created based on the content of the three-week Everyday Mathematics
instructional unit in geometry. All the problems used in the performance assessment
exercises varied in style and content except for those on the pre- and posttests, which
consisted of alternate forms of the same problem.
Comparison classrooms. Students in the comparison classroom completed only
the pre- and posttest versions of the performance assessment. In all other respects, their
progress through the Everyday Mathematics program in the general education classrooms
was comparable to the students in the intervention classes.
Procedures
Students with learning disabilities in the intervention classrooms participated in
two types of interventions. The first involved regular classwide performance assessments
12
throughout the year. The second type of intervention was ad hoc tutoring. Both
interventions began in mid-October and continued until the end of February.
Performance assessments. All the students in the intervention classes practiced
performance assessments once every three weeks. This schedule of assessments was
developed around a realistic appraisal of how much teachers could depart from regular
practice under naturalistic conditions. Initial interviews with the teachers indicated that
more frequent assessments would require too much of an interruption of the curriculum
and, hence, would be infeasible.
Highly specific instructional procedures were developed for each assessment. On
the day prior to the assessment, students were assigned a practice problem to work on
individually for approximately 15 minutes. At the end of this time, the teacher presented
a predeveloped set of answers to the problem using an overhead projector. The teacher
and students discussed the quality of each answer and how it might be scored on a rubric
(see below). In addition, the discussion enabled students to share multiple solutions to
the problem. At the end of the practice session, students were given time to finish or
improve their answers. On some occasions, the teacher elicited answers to the practice
problem from the students rather than using the predeveloped set of answers.
Teachers made a special effort to engage students with learning disabilities and
other academically low-achieving students in the discussion. This approach was feasible
because tutors had worked with these students on the practice problems in ad hoc tutoring
sessions prior to the day when they were assigned in the general education classrooms.
The next day, all students in the classroom were given another performance
assessment. The problem was unlike the one on the previous day’s practice assessment
13
in terms of style and content. Students were given approximately 20 minutes to solve the
problem with no assistance from the teacher. A research assistant scored all of these
assessments and returned them to the intervention teachers within two days.
On the day when the assessments were returned, the teacher rehearsed the scored
assessments to the students and discussed a set of three answers to the problem. These
answers were based on actual student performance on the problem and reflected a range
of responses to the problem. The teacher and students discussed the quality of the three
answers based on the rubric, and then students were given time to improve their answers.
Ad hoc tutoring. Throughout the week, students with learning disabilities in the
intervention classrooms received ad hoc tutoring from a paraprofessional. Tutoring
occurred four times per week for approximately 30 minutes each session. Other
academically low-achieving students in the intervention classes participated in the
tutoring sessions on an irregular basis. Their participation depended upon the classroom
teacher’s perception of needs, as well as the number of students in ad hoc tutoring at one
time. No more than six students were tutored at once.
The teachers and tutors determined the content of the tutoring based on an
analysis of the curriculum unit (e.g., fractions, measurement, geometry) and on ongoing
student performance in the classroom. Tutors retaught or reviewed fundamental concepts
from the unit (e.g., the relationship of a fraction to a decimal; geometric properties such
as angles, parallel lines, rays) and assisted students with workbook exercises. They also
spent time teaching basic operations. Finally, tutors worked with students on the practice
performance assessment problem before it was taught in the general education classroom.
14
The tutoring occurred in different contexts. On some occasions, tutors worked
with target students in the classroom during the math lesson. On other occasions, they
worked with students before or after the math lesson (e.g., one half hour before school,
during the time other students were in band practice).
Unlike the previous year’s study, however, tutors also concentrated on problem-
solving instruction for at least one day per week, working with students on only one or
two complex problems. The nature of the problem-solving instruction was guided by a
concern for socially mediated interactions among the students and constructive discourse
between the tutor and the students.
Morocco (this issue) has already provided one example of small group work
where a tutor worked with students using a white board to capture student problem
solving. More generally, the tutor began each session by reading the problem with the
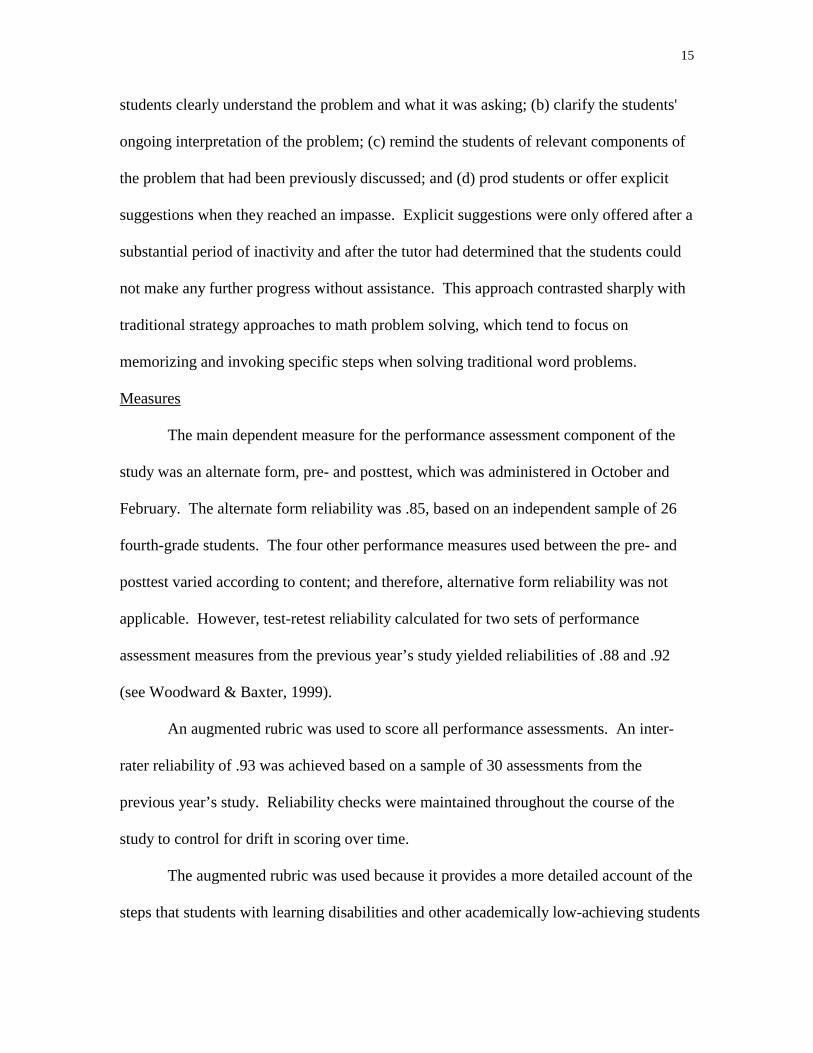
students and clarifying any questions. S/he then helped the students construct an initial
representation of the problem, either through a drawing or a table, or by using
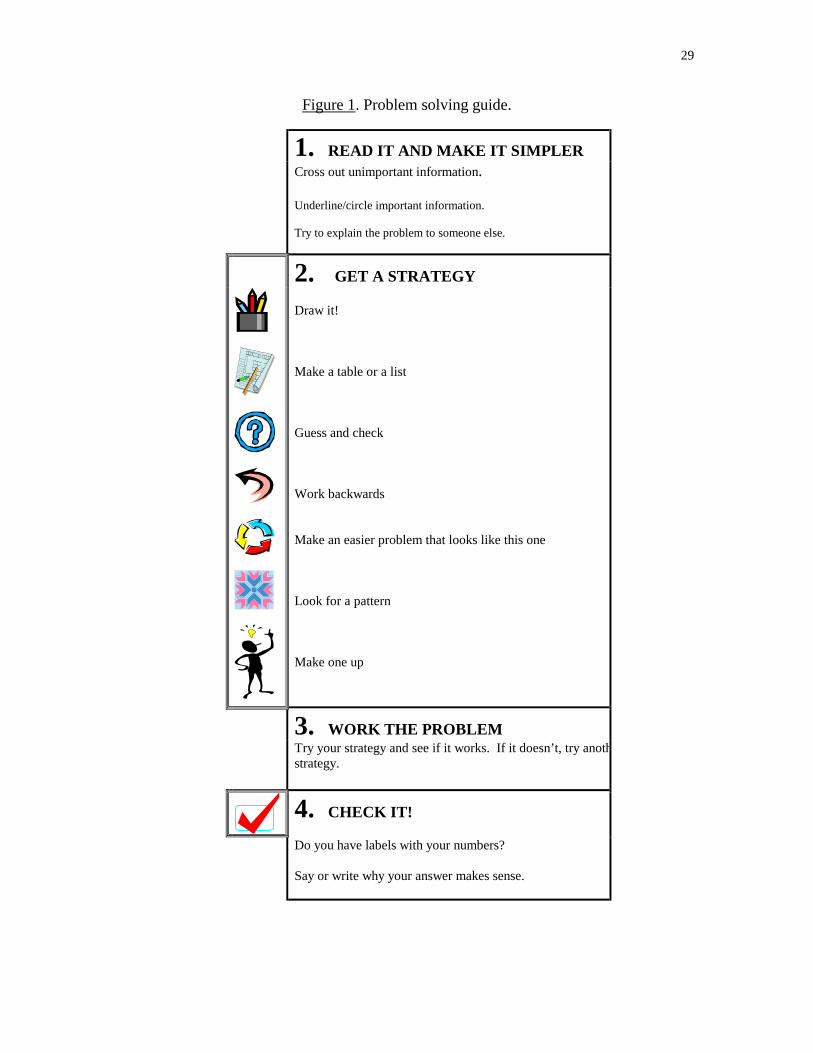
manipulatives. The Problem Solving Guide, as shown in Figure 1, served as one of many
tools for "getting started" on the problems.
--------------------------
Insert Figure 1 about here
--------------------------
As different students suggested a strategy for solving the problem, the tutor probed
the other students to see if they agreed and encouraged different individuals to work the
next step in the problem. For example, some students used calculators to try out a strategy
or find the answer to one step in the problem. Generally, the tutor's roles were to: (a) help
15
students clearly understand the problem and what it was asking; (b) clarify the students'
ongoing interpretation of the problem; (c) remind the students of relevant components of
the problem that had been previously discussed; and (d) prod students or offer explicit
suggestions when they reached an impasse. Explicit suggestions were only offered after a
substantial period of inactivity and after the tutor had determined that the students could
not make any further progress without assistance. This approach contrasted sharply with
traditional strategy approaches to math problem solving, which tend to focus on
memorizing and invoking specific steps when solving traditional word problems.
Measures
The main dependent measure for the performance assessment component of the
study was an alternate form, pre- and posttest, which was administered in October and
February. The alternate form reliability was .85, based on an independent sample of 26
fourth-grade students. The four other performance measures used between the pre- and
posttest varied according to content; and therefore, alternative form reliability was not
applicable. However, test-retest reliability calculated for two sets of performance
assessment measures from the previous year’s study yielded reliabilities of .88 and .92
(see Woodward & Baxter, 1999).
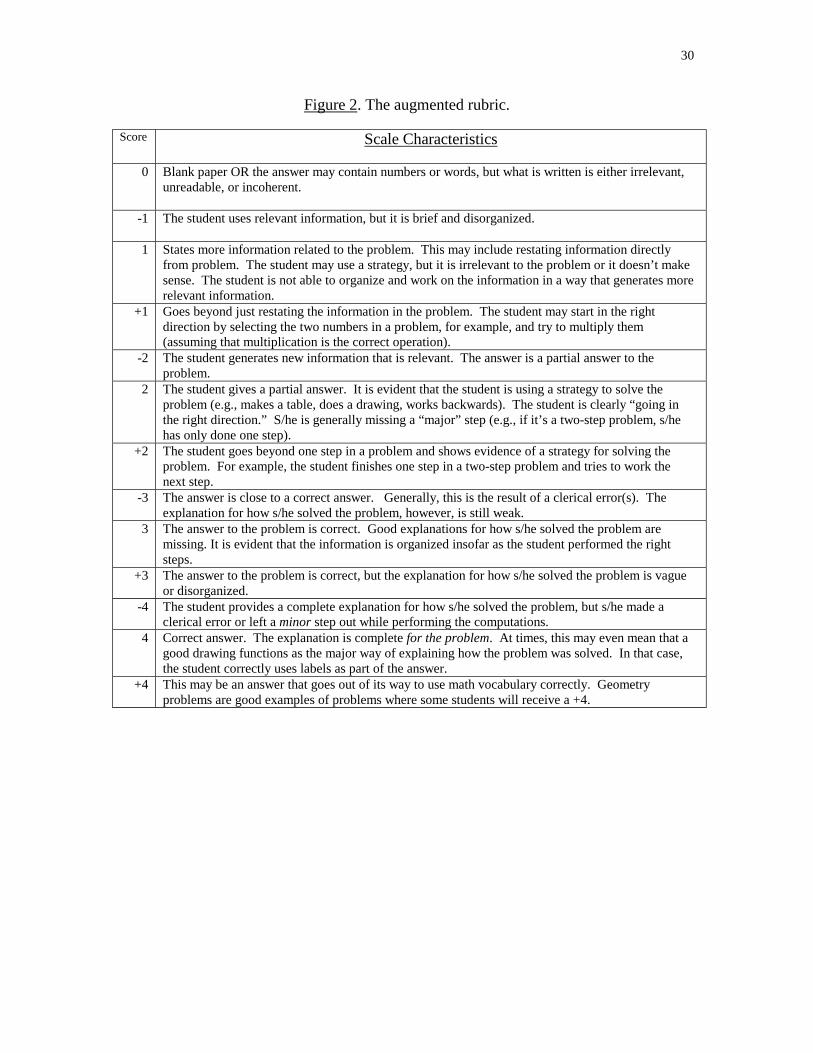
An augmented rubric was used to score all performance assessments. An inter-
rater reliability of .93 was achieved based on a sample of 30 assessments from the
previous year’s study. Reliability checks were maintained throughout the course of the
study to control for drift in scoring over time.
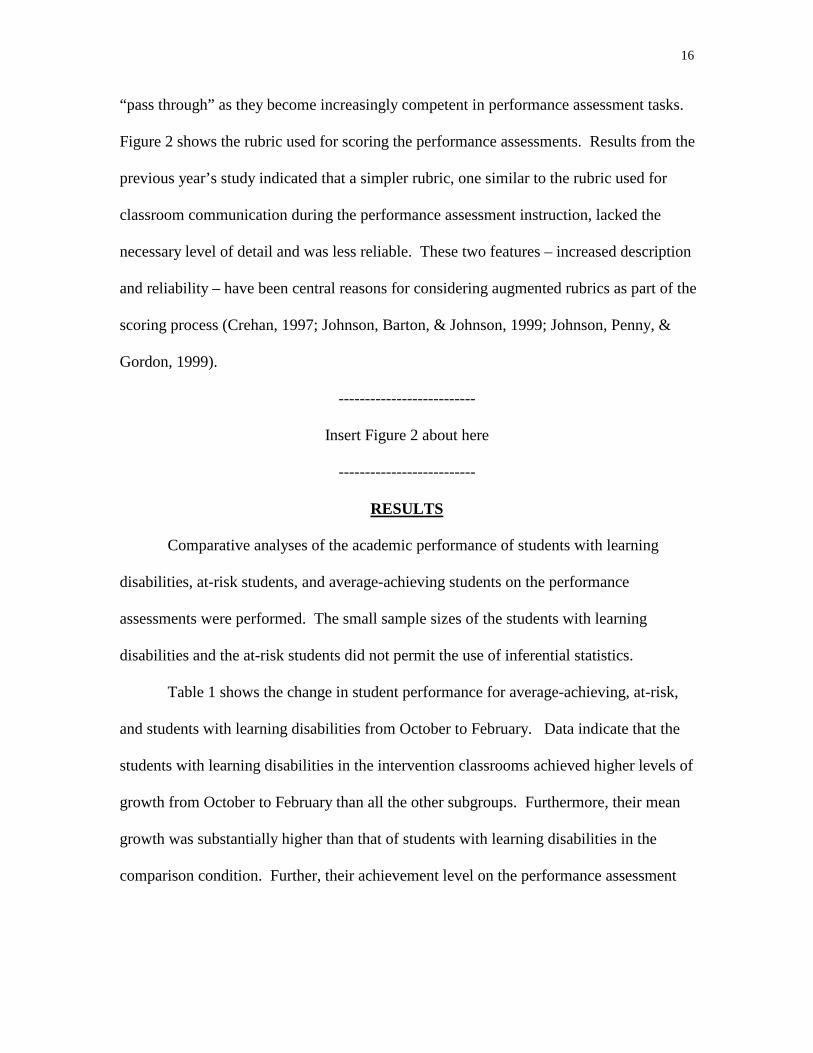
The augmented rubric was used because it provides a more detailed account of the
steps that students with learning disabilities and other academically low-achieving students
16
“pass through” as they become increasingly competent in performance assessment tasks.
Figure 2 shows the rubric used for scoring the performance assessments. Results from the
previous year’s study indicated that a simpler rubric, one similar to the rubric used for
classroom communication during the performance assessment instruction, lacked the
necessary level of detail and was less reliable. These two features – increased description
and reliability – have been central reasons for considering augmented rubrics as part of the
scoring process (Crehan, 1997; Johnson, Barton, & Johnson, 1999; Johnson, Penny, &
Gordon, 1999).
--------------------------
Insert Figure 2 about here
--------------------------
RESULTS
Comparative analyses of the academic performance of students with learning
disabilities, at-risk students, and average-achieving students on the performance
assessments were performed. The small sample sizes of the students with learning
disabilities and the at-risk students did not permit the use of inferential statistics.
Table 1 shows the change in student performance for average-achieving, at-risk,
and students with learning disabilities from October to February. Data indicate that the
students with learning disabilities in the intervention classrooms achieved higher levels of
growth from October to February than all the other subgroups. Furthermore, their mean
growth was substantially higher than that of students with learning disabilities in the
comparison condition. Further, their achievement level on the performance assessment
17
measure in February was marginally higher than that of the at-risk students in the
intervention group and the average ability students in the comparison condition.
--------------------------
insert Table 1 about here
--------------------------
Changes in improvement from October to February indicated that the intervention
students with learning disabilities moved from answers that contained some relevant
numbers and simply restating parts of the problem to completing at least the first step in
the problem and either writing about or showing a clear strategy for solving it. Figures 3
and 4 show representative answers by two students in the intervention group to the pre
and posttest performance assessment tasks. These students typify two different patterns
of growth over the five-month intervention.
--------------------------
insert Figures 3 and 4 about here
--------------------------
A qualitative analysis of the performance assessment tasks from October to late
February further validated what was described in the augmented rubric. The October
performance assessment for the intervention students with learning disabilities generally
consisted of an attempt to restate words or numbers in the problem. Half of the students
performed simple addition on the numbers rather than multiplication and addition. In that
regard, Jenny’s pretest in Figure 3 aptly characterizes how 50 percent of the students with
learning disabilities answered their first performance assessment task.
18
There was a clear trend in the responses of all of the students on the four
performance assessments between pre- and posttest. Over time, their answers reflected
more systematic organization (e.g., the students divide the answer box into a place for
calculations, an answer, a place for an explanation), and the students began to write two
and three sentence explanations.
However, two distinct groups emerged among the students with learning
disabilities. The highest group, represented by Athena in Figure 4, moved toward
increasingly sophisticated answers. These students began to include strategies for solving
a problem (e.g., “I made a table”), and they demonstrated a sense of all or a significant
part of the mathematical operations required to answer the problem correctly. Even the
explanations for how they solved the problem rose above a literal restatement of the
pictures or numbers included in the answer box. By January, two of the students even
began using “if-then” sentences to rationalize their answers.
In contrast, the lowest group (represented by Jenny in Figure 3) continued merely
to restate what was portrayed in the numbers or pictures they used as part of their
answers. Their answers lacked a conceptual understanding of the mathematics needed to
work the problems correctly. In essence, they were able to incorporate many of the
initial, superficial features for answering performance tasks of this type, but they lacked a
deeper conceptual understanding of the mathematical problems.
Overall, the pattern of progress for all the intervention students with learning
disabilities is best described as nonlinear. Some of the performance assessment problems
administered from October to February were clearly much more difficult for these
students than for others. Not surprisingly, their answers to the more difficult problems
19
reflected a lower conceptual understanding and more of the superficial features of
organization and restating what was already presented in words or pictures.
By further contrast, the comparison students with learning disabilities generally
showed little or no change from pre- to posttest. Figure 5 presents Carl’s pretest and
posttest. His responses are representative of the lack of growth over time for this group.
That is, comparison students who wrote only a few numbers or words in response to
the pretest problem did so on the posttest. Those who were able to answer part of the
problem (e.g., multiple one of the sets of numbers) did so again on the posttest. In two
cases, including the one shown in Figure 5, students used the same elaborate, but
irrelevant drawings as part of their answer. In only one case was there an apparent
increase in the quality of the answer. This student moved from a pretest answer that
simply contained a row of seven boxes to a pictorial representation of coins with heads
and tails as well as a column of seven 6’s. However, no explanation accompanied these
pictures and numbers.
--------------------------
insert Figure 5 about here
--------------------------
DISCUSSION
The data from this study suggest that the combined focus on problem solving in
the ad hoc tutoring sessions and the classwide practice on performance assessment tasks
led to positive effects over time. This was evident in the alternate form pre- and
posttests, as well as in the ongoing assessments during the October to February period in
20
the second year of research. All intervention students with learning disabilities made
progress; however, at a qualitative level the improvement was of two distinct types. Half
of the intervention students with learning disabilities improved in a way that indicated an
increasing level of strategic understanding, the other half made more superficial changes
associated with the simple communication dimensions of the performance assessments
(e.g., organization of the box into computations, drawings or numbers, and explanations).
Other data collected on this case study, which are not reported here (e.g.,
observations of classrooms and tutoring sessions, performance on criterion referenced
measures, daily work in the classroom), help illuminate some of the reasons for this
differential improvement. The intervention students with learning disabilities who made
the least progress on the performance assessments also had markedly lower performance
on the quarterly criterion tests. Their lack of participation in ad hoc tutoring (e.g., limited
contributions to problem solving discussions) was more evident than for other students in
the sessions, and the quality of their contributions indicated a lower level of conceptual
and strategic knowledge.
These findings are not surprising in light of the significant individual differences
in students with learning disabilities. Complex abilities such as problem solving are not
only interrelated with other knowledge (e.g., a declarative knowledge of facts, conceptual
and procedural knowledge of math topics and operations, domain specific problem
solving strategies), but are likely to take a considerable period of time to develop. The
kind of performance required of students in this study was much greater than that for the
tasks found in most traditional problem-solving studies involving students with learning
disabilities (see Woodward & Montague, 2000; Xin & Jitendra, 1997).
21
One of the promising advances in this research is a new model of problem-solving
instruction for students with learning disabilities. Traditional special education
interventions typically have students work a set of several one-step problems and
encourage students to use strategies that they have memorized. Moreover, teachers move
students as quickly as possible to problem-solving activities (e.g., worksheets) that are
completed individually with limited or no communication between students.
In contrast, the ad hoc tutoring intervention strategies reported here are more in
keeping with a math reform orientation (e.g., Hiebert et al., 1997; Stigler & Hiebert,
1999). Students work on only one or two problems during a session. Furthermore, there
is a high emphasis on tutor scaffolding and peer mediation (e.g., verbal collaboration
between students). In no case do students work the entire problem by themselves. Tutors
also make sure to stress the strategies that used, both while students are working on the
problem and after it has been completed.
The kind of scaffolding that occurs during ad hoc tutoring is likely to be viable
only when working with a small number of students. Again, earlier naturalistic research
in reform classrooms indicates that during the large-class discussions, students with
learning disabilities tend to remain passive (Baxter et al., in press). Even in the
classrooms observed for this study, only a small minority of the students had the
opportunity to make substantive contributions to the discussions of the performance
assessment tasks. These observations are consistent with recent writings on scaffolded
instruction and students with learning disabilities (Reid, 1998; Stone, 1998). The next
stage of our research, which is iterative in nature, will further examine the details of
scaffolding in small groups.
22
One other finding from this case study research bears mentioning. The
performance assessment tasks used in this study were nested within a statewide effort to
reform education. Over the past five years, the state has piloted and then progressively
administered high-stakes tests at the fourth- and seventh-grade levels. These tests are
composed of a mix of traditional multiple-choice items along with limited and extended
response questions. The challenging dimensions of this reform are evident in the fact that
only a minority of students at the fourth grade has passed the mathematics portion of
these statewide assessments in the last two years.
Most assuredly, the statewide reform was a motivating factor for teachers to
employ our classwide performance assessment intervention. Teachers were eager to
investigate what they perceived to be effective and efficient ways to help their students
with the statewide assessments that are administered every April. For these teachers,
meeting the needs of mainstreamed students with learning disabilities merged with those
of a wider number of students in the “lower half” of the class.
However, it is clear from the results of this study, as well as from the previous
year’s study, that students with learning disabilities still fall well below what would be
passing performance on the statewide assessments. Linn (2000) recently argued that the
linkage of content standards with alternative forms of assessment such as performance
assessments becomes problematic when policymakers mandate that all students be
required to meet the same levels of achievement.
By no means does Linn recommend abandoning high standards for all students.
Rather, his difficulty with this latest trend in assessment lies in applying the same
standards of achievement to all students. The findings from this research would seem to

23
provide tacit support for his observations. At an even wider level, this findings should
encourage a range of policymakers to examine what it means for students with learning
disabilities to have access to statewide assessments as prescribed under the recently
authorized IDEA legislation.
24
REFERENCES
Ball, D. (1993). With an eye on the mathematical horizon: Dilemmas of teaching
elementary school mathematics. Elementary School Journal, 93(4), 373-397.
Ball, D., & Rundquist, S. (1993). Collaboration as a context for joining teacher
learning with learning about teaching. In D. Cohen, M. McLaughlin, & J. Talbert (Eds.),
Teaching for understanding (pp. 13-42). San Francisco: Jossey-Bass.
Baxter, J., Woodward, J., & Olson, D. (in press). Effects of reform-based
mathematics instruction in five third grade classrooms. Elementary School Journal.
Bell, M., Bell, J., & Hartfield, R. (1993). Everyday mathematics. Evanston, IL:
Everyday Learning Corporation.
Burns, M. (1995). Writing in math class. Sausalito, CA: Math Solutions
Publications.
Carpenter, T. (1985). Learning to add and subtract: An exercise in problem solving. In
E. A. Silver (Ed.), Teaching and learning mathematical problem solving: Multiple research
perspectives (pp. 13-42). Hillsdale, NJ: LEA.
Cobb, P., & Bauersfeld, H. (Eds.). (1995). The emergence of mathematical
meaning: Interaction in classroom cultures. Hillsdale, NJ: L. Erlbaum Associates.
Connolly, P. (1989). Writing and the ecology of learning. In P. Connolly & T.
Vilardi (Eds.), Writing to learn mathematics and science (pp. 89-102). New York: Teachers
College Press.
Crehan, K. (1997, October). A discussion of analytic scoring for writing
performance assessments. Paper presented at the Arizona Education Research
Association, Phoenix, AZ.
25
Darling-Hammond, L. (1990). Achieving our goals: Superficial or structural
reforms? Phi Delta Kappan, 72(4), 286-295.
Good, T., Mulryan, C., & McCaslin, M. (1992). Grouping in instruction for
mathematics: A call for programmatic research on small group processes. In D. Grouws
(Ed.), Handbook of research on mathematics teaching and learning (pp. 165-196). New
York: MacMillan.
Hiebert, J., Carpenter, T., Fennema, E., Fuson, K., Wearne, D., Murray, H.,
Olivier, A., & Human, P. (1997). Making sense: Teaching and learning mathematics with
understanding. Portsmouth, NH: Heinemann.
Iowa Test of Basic Skills (1996). Iowa test of basic skills form M. Chicago, IL:
Riverside Publishing Co.
Jitendra, A., & Xin, A. (1997). Mathematical word problem solving instruction
for students with mild disabilities and students at-risk for failure: A research synthesis.
Journal of Special Education, 30(4), 412-438.
Johnson, C., Barton, K., & Johnson, R. (1999). Approaches to assessing writing:
A content analysis of a national sample of writing rubrics. Paper presented at the
American Educational Research Association, Montreal, Canada.
Johnson, R., Penny, J., & Gordon, B. (1999). Score resolution and the inter-rater
reliability of holistic scores. Paper presented at the American Educational Research
Association, Montreal, Canada.
King, B. (1982). Using writing in the mathematics class: Theory and practice. In
C. W. Griffin (Ed.), New directions for teaching and learning: Teaching writing in all
disciplines (pp. 39-44). San Francisco: Jossey-Bass.

26
Kulm, G. (1990). Assessing higher order thinking in mathematics. Washington,
DC: American Association for the Advancement of Science.
Lampert, M. (1997). Teaching about thinking and thinking about teaching,
revisted. In V. Richardson (Ed.), Constructivist teacher education: Building a world of
new understandings (pp. 84-107). London: Falmer Press.
Lesh, R., & Lamon, R. (1992). Assessment of authentic performance in school
mathematics. Washington, DC: American Association for the Advancement of Science.
Linn, R. L. (1993). Educational assessment: Expanded expectations and
challenges. Educational Evaluation and Policy Analysis, 20, 53-73.
Linn, R. (2000). Assessments and accountability. Educational Researcher, 29(2),
4-16.
Mayer, D. P. (1988). Do new teaching standards undermine performance on old
tests? Educational Evaluation and Policy Analysis, 20, 53-73.
McMillen, L. (1986). Science and math professors are assigning writing drills to
focus students' thinking. Chronicle of Higher Education, 22, 19-22.
National Council of Teachers of Mathematics, (1989). Curriculum and evaluation
standards for school mathematics. Reston, VA: NCTM.
National Council of Teachers of Mathematics, (2000). Principles and standards for
school mathematics. Reston, VA: NCTM.
Reid, D. (1998). Scaffolding: A broader view. Journal of Learning Disabilities,
31(4), 385-396.
Resnick, L., & Resnick, D. (1992). Assessing the thinking curriculum: New tools
for educational reform. In B. R. Gifford & M. C. O'Connor (Eds.), Changing
27
assessments: Alternative views of aptitude, achievement, and instruction (pp. 37-75).
Boston: Kluwer Academic Publishers.
Romberg, T. (1995). Reform in school mathematics and authentic assessment.
Albany: State University of New York Press.
Romberg, T. (Ed.). (1992). Mathematics assessment and evaluation : imperatives
for mathematics educators. Albany: State University of New York Press.
Smith, M. (1991). Put to the test: The effects of external testing on teachers.
Educational Researcher, 20(5), 8-11.
Stiggins, R. (1997). Student-centered classroom assessment. Upper Saddle
River, NJ: Prentice Hall, Inc.
Stigler, J., & Hiebert, J. (1999). The teaching gap: Best ideas from the world's
teachers for improving education in the classroom. New York: The Free Press.
Stone, C. (1998). The metaphor of scaffolding: Its utility for the field of learning
disabilities. Journal of Learning Disabilities, 31(4), 344-364.
Thurlow, M.L. (1994). National and state perspectives on performance
assessment and students with disabilities. Reston, VA: Council for Exceptional
Children.
Webb, N. (1993). Assessment in the mathematics classroom. Reston, VA:
National Council of Teachers of Mathematics.
Wilson, M. (1992). Educational leverage from a political necessity: Implications
of new perspectives on students assessment for Chapter 1 evaluation. Educational
Evaluation and Policy Analysis, 14, 123-144.
28
Woodward, J., & Baxter, J. (1997). The effects of an innovative approach to
mathematics on academically low achieving students in inclusive settings. Exceptional
Children, 63(3), 373-388.
Woodward, J., & Baxter, J. (1999). The Reach project: Analyses of year 1
intervention data (TN99-2). Tacoma, WA: University of Puget Sound.
Woodward, J., & Baxter, J. (2000). The Reach project: Analyses of year 2
intervention data (TN2000-1). Tacoma, WA: University of Puget Sound.
Woodward, J., Baxter, J., Olson, D., & Kline, D. (1996). The informed instruction
project: Final report. Tacoma, WA: University of Puget Sound. (ERIC Document
Reporduction Service No. ED409683)
Woodward, J., & Montague, M. (2000, April). Meeting the challenge of
mathematics reform for students with learning disabilities. Paper presented at the Annual
Convention for the Council for Exceptional Children, Vancouver, Canada.
Xin, Y., & Jitendra, A. (1999). The effects of instruction in solving mathematical
world problems for students with learning problems: A meta-analysis. The Journal of
Special Education, 32(4), 207-225.
Yinger, R. (1985). Journal writing as a learning tool. Volta Review, 87, 21-33.
Zigmond, N., & Baker, J. (2000). Full inclusion for students with learning disabilities:
Too much of a good thing? In L. Abbeduto (Ed.), Taking sides: Clashing views on controversial
issues in educational psychology (pp. 69-80). Guilford, CT: McGraw-Hill.
29
Figure 1. Problem solving guide.
1. READ IT AND MAKE IT SIMPLER Cross out unimportant information.
Underline/circle important information. Try to explain the problem to someone else.
2. GET A STRATEGY
Draw it! Make a table or a list Guess and check Work backwards Make an easier problem that looks like this one Look for a pattern Make one up
3. WORK THE PROBLEM Try your strategy and see if it works. If it doesn’t, try anoth
strategy.
4. CHECK IT!
Do you have labels with your numbers?
Say or write why your answer makes sense.
30
Figure 2. The augmented rubric. Score Scale Characteristics
0 Blank paper OR the answer may contain numbers or words, but what is written is either irrelevant,
unreadable, or incoherent.
-1 The student uses relevant information, but it is brief and disorganized.
1 States more information related to the problem. This may include restating information directly from problem. The student may use a strategy, but it is irrelevant to the problem or it doesn’t make sense. The student is not able to organize and work on the information in a way that generates more relevant information.
+1 Goes beyond just restating the information in the problem. The student may start in the right direction by selecting the two numbers in a problem, for example, and try to multiply them (assuming that multiplication is the correct operation).
-2 The student generates new information that is relevant. The answer is a partial answer to the problem.
2 The student gives a partial answer. It is evident that the student is using a strategy to solve the problem (e.g., makes a table, does a drawing, works backwards). The student is clearly “going in the right direction.” S/he is generally missing a “major” step (e.g., if it’s a two-step problem, s/he has only done one step).
+2 The student goes beyond one step in a problem and shows evidence of a strategy for solving the problem. For example, the student finishes one step in a two-step problem and tries to work the next step.
-3 The answer is close to a correct answer. Generally, this is the result of a clerical error(s). The explanation for how s/he solved the problem, however, is still weak.
3 The answer to the problem is correct. Good explanations for how s/he solved the problem are missing. It is evident that the information is organized insofar as the student performed the right steps.
+3 The answer to the problem is correct, but the explanation for how s/he solved the problem is vague or disorganized.
-4 The student provides a complete explanation for how s/he solved the problem, but s/he made a clerical error or left a minor step out while performing the computations.
4 Correct answer. The explanation is complete for the problem. At times, this may even mean that a good drawing functions as the major way of explaining how the problem was solved. In that case, the student correctly uses labels as part of the answer.
+4 This may be an answer that goes out of its way to use math vocabulary correctly. Geometry problems are good examples of problems where some students will receive a +4.

31

32

33
Figures 3-5 to follow with the print version

34
Table 1 Performance Assessment Results: Pretest and Posttest
Pretest Posttest Group N Mean Sd Mean Sd Average Ability Students Intervention 33 2.00 .93 2.90 .57 Comparison 29 1.93 .88 2.39 .97 At-Risk Students Intervention 17 1.79 .94 2.35 .53 Comparison 8 1.58 .42 1.96 .99 Students with Learning Disabilities Intervention 6 1.17 .28 2.39 .49 Comparison 5 1.26 .49 1.20 .73


![CSME - Enhancing Trade Competitiveness of SME Through Standardization & Conformity Assessments [2007]](https://img.dokumen.tips/doc/110x75/546bffe6af79596c298b4e02/csme-enhancing-trade-competitiveness-of-sme-through-standardization-conformity-assessments-2007.jpg)