Embed Size (px)
Citation preview
IOSR Journal of Applied Geology and Geophysics (IOSR-JAGG)
e-ISSN: 2321–0990, p-ISSN: 2321–0982.Volume 2, Issue 2 Ver. II. (Mar-Apr. 2014), PP 85-96
www.iosrjournals.org
www.iosrjournals.org 85 | Page
Enhancing Stream Sediment Geochemical Anomalies Using
Spatial Imaging: Case Study from Dagbala and Its Environs
Adiotomre, E. E. Department of Geology, Delta State University, Abraka, P. M. B. 1, Abraka, Delta State, Nigeria.
Abstract: The exploration for solid minerals is a very demanding and costly operation and exploration
techniques are continually modified, with the better data interpretation approach continuously sought after by
operators of the solid mineral industry, so as to improve the success rate of mineral deposit discovery. Spatial
imaging approach to interpretation of anomalies related to stream sediment geochemical data is increasingly
being recognized, as a significant component of the geochemical survey data analysis in the prospect for
concealed mineral deposits. It is apparent that the spatial rendering of such data enhances the interpretation of
associated anomalies. The present study, therefore, adopts this technique to investigate the regional distribution
of five chemical elements (Au, Zn, Pb, Cu, and Ag) in stream sediments derived predominantly from
Precambrian Basement rocks in the Dagbala area. Stream sediment samples were analyzed for these elements in
bulk fractions with an Atomic Absorption Spectrophotometer after hot extraction with aqua regia. In order to
improve the spatial mapping of geochemical anomalies, the computed statistical threshold for the chemical data
is used to augment geochemical models developed with Surfer – a contouring and 3-D surface mapping
package. Stream sediment concentration data are extrapolated or interpolated at the sample points on stream
beds, allowing geochemical anomalies to be aptly extracted for optimal spatial assessment. Geochemical
models show anomalies of Ag, Cu, Au, and Zn, while grid vector maps depict the dispersion trend of the
elements studied. Keywords: Dagbala; Geochemical Anomaly; Dispersion trend; Mineralization; Nigeria Basement Complex;
Surfer
I. Introduction The geological processes that result in the formation and deposition of mineral deposits may cause the
deposits to localize at or near the earth’s surface (Mukherjee et al., 2007). The processes are both physical and
chemical and generally result in the development of diagnostic signatures (textural, mineralogical, geophysical
or geochemical) as the mineral deposit is formed (Xie and Yin, 1993; Mukherjee et al., 2007). The associated
signatures are commonly sought after using geologic medium such as stream sediments, soil and rocks in the
prospect for concealed mineral deposits or in resource management and environmental studies (Fletcher, 1997;
Mukherjee et al., 2007; Alexakis, 2008). Stream sediment geochemical prospecting technique is commonly
adopted where there is a good concentration of rivers in the area delimited by the survey (Webb and Thompson,
1977; Mikoshiba et al., 2006; Mukherjee et al., 2007). Termite mounds have also been used as a geochemical
sampling medium to augment conventional soil geochemical surveys when thick regolith and transported cover
exist (Stewart et al., 2012; Arhin and Nude, 2010). Whatever geochemical medium is preferred, the ultimate
goal is to determine the spatial patterns in the distribution of the elements, specifically those abnormal patterns
or geochemical anomalies related to mineralization (Webb and Thompson, 1977). The use of stream sediment
geochemical survey in the search for mineral deposits is based on the premise; those sediments contain elements
that are mobilized by weathering from adjacent watersheds into stream beds. Consequently, the chemistry of the
sediments is representative of the composition of the drainage basin (Webb and Thompson, 1977; Mikoshiba et
al., 2006; Mukherjee et al., 2007).
Secondary negative and positive anomalies exist in stream sediments and are both useful in the prospect for
ore deposits (Suslov, 1992; Shi and Wang, 1995). The anomalies may co-exist or occur singly in the low
background or high background area; the joint occurrence of both anomalies in stream sediments has been
interpreted to suggest the dominance of lateral dispersion in element concentration (Shi and Wang, 1995). The
occurrence of negative anomalies on the margin of positive anomalies in the low background and high
background areas has been reported to indicate concentration and depletion in element content occurring to a
different extent in both areas during lateral dispersion (Shi and Wang, 1995). The situation where negative
anomalies occur around positive anomalies only in the low background area has also been documented. This
pattern would develop when high level of element's concentration occurs as elements are dispersed from a
negatively anomalous region to a positively anomalous region (Shi and Wang, 1995).
Previous studies have suggested the potential for the mineralization of Au and associated elements in
the study area (Adepoju and Adekoya, 2011, 2012). These studies, and several other studies conducted in

Enhancing Stream Sediment Geochemical Anomalies Using Spatial Imaging: ...
www.iosrjournals.org 86 | Page
different geologic settings (e. g. Reid, 1993; Adekeye, 1999; Atsuyuki et al., 2005; Alexakis, 2008; Bamigboye
and Adekeye, 2011) used stream sediment sampling as a medium to prospect for geochemical element. In
addition, these workers, developed geochemical distribution maps of element concentration, in river beds and
their tributaries. Since stream sediment concentration data are collected by following rivers where they occur,
the data obtained from stream sediment survey are more or less point data with irregular sample locations and
non-uniform sampling density (e.g. Nugraha, 2011). Nevertheless, the majority of stream sediment geochemical
studies are based on a conventional method of interpretation, where results of geochemical survey are presented
as point data in geochemical maps. This conventional practice of delineating anomaly based on point data on the
stream bed provides limited information on the spatial distribution of element concentration. However, it is
emphasized in past studies, that the spatial variation of anomalous concentration will be effectively established
over an area when point data on stream beds are extrapolated or interpolated beyond the sample point. In as
much as chemical elements represented in stream sediments are presupposed to have mobilized from adjoining
watersheds (e.g. Mikoshiba et al., 2006; Mukherjee et al., 2007). Although the spatial analyses of geochemical
concentration data have been used in the past for improved interpretation of anomalous elements (e.g.
McClenaghan et al., 1997; Adams, 2006; Mukherjee et al., 2007; Bamigboye and Adekeye, 2011; Samal et al.,
2011), the use of interpolated or extrapolated geochemical spatial variation maps continues to be scarce. In the
present study, stream sediment concentration data are analyzed by interpolating or extrapolating point data
spatially around sampling points. This allows the creation of spatial geochemical models that are used for the
optimal assessment of the spatial distribution of observed anomalies, and also provide adequate visualization of
element dispersion trends in the study area.
II. Geologic Setting The study area is situated within the south-western Basement Complex of Nigeria, and it is delimited by
latitude 7o 19´N and 7o 23´N, and longitude 6o 14´E and 6o 19´E (Fig. 1). The Nigerian Basement Complex
forms a part of the Pan-African mobile belt and lies between the West African and Congo Cratons and south of
the Tuareg Shield (Oyawoye, 1972; Black, 1980, Wright, 1985). It is intruded by the Mesozoic calc-alkaline
ring complexes (Younger Granites) of the Jos Plateau and is unconformably overlain by Cretaceous and younger
sediments (Burke and Dewey, 1972; Odeyemi, 1976; Dada, 2006; Obaje, 2009).
The Basement Complex rocks are subdivided into migmatite-gneiss complexes, the older metasediments,
the younger metasediments, the older granites and, the younger granite complexes and volcanic rocks (Grant,
1970; Rahaman, 1976; Obaje, 2009, Obiora and Ukaegbu, 2009). The Migmatite-Gneiss Complex is the
commonest and the oldest basement rock and comprises of gneisses (biotite gneiss and banded gneiss),
amphibolites, migmatite and metavolcanics. It is of sedimentary origin but was later profoundly altered by
metamorphic and igneous processes. The older metasediments were also among the earliest rocks to form on the
Nigerian Basement Complex. Similar to the Migmatite-Gneiss Complex, they are also of sedimentary origin
before they underwent prolonged and repeated metamorphism; and include rocks such as quartzite, calcareous
rocks (e.g. marble) and relics of highly altered clayey sediments and igneous rocks. The Younger
Metasediments consists of belts of roughly north-south trending, slightly metamorphosed ancient Precambrian
sedimentary and volcanic rocks that underlain most parts of the Basement Complex. The major rocks in this
category are quartz-biotite-muscovite schist and coarse-grained feldspar-bearing micaceous schists, although
ferruginous quartzites and talc schists may also occur. The older granites are widespread throughout the
Basement Complex and occur as large circular masses within the Schists and the Migmatite-Gneiss Complexes.
The Younger Granite Complexes in Nigeria are found mainly on the Jos Plateau, forming a distinctive group of
intrusive and volcanic rocks that are bounded by ring dykes or ring faults.
The local geology of the study area is dominated by the metasediments considered by Odeyemi (1988) to be
part of the Igarra Schist Belt that overlies the Migmatite-Gneiss Complex. The main rock types that occur in the
study area include quartz-biotite schist, porphyritic granite and granite gneiss (Fig. 2).
III. Materials And Methods
The initial part of the study entails a reconnaissance geochemical stream sediment survey, in which 100
samples of stream sediment weighing approximately 350g each are collected from depths of 15-20cm along
river beds over an area of 224km2. Precaution was taken to sample recently transported sediments, and care was
taken also to avoid materials derived from collapsing banks. Samples were oven dried and disaggregated before
they were screened through a <177µm stainless steel sieve. 0.25g weights of samples passing 177µm are
weighed in borosilicate test tubes and subjected to hot aqua regia digestion before they were analyzed for Au,
Ag, Pb, Zn and Cu content with an Atomic Absorption Spectrophotometer. The resulting chemical data were
processed with Surfer, which is a 3-D surface mapping, contouring and gridding package provided by Golden
Software Incorporation.

Enhancing Stream Sediment Geochemical Anomalies Using Spatial Imaging: ...
www.iosrjournals.org 87 | Page
For use in Surfer, the concentration data are transformed into XYZ format to generate a data file in
Microsoft Office Excel. In order to generate the data file, the study area is subdivided into equal blocks
patterned as rows and columns (Fig 3). The concentration data and sample locations are georeferenced with
respect to the geographic coordinates of the rows and columns. The intersection of each row and column
constitutes a grid node, and each row contains grid nodes with the same Y coordinate while each column
contains grid nodes with the same X coordinate. In Microsoft Office Excel, the data is organized in columns of
XYZ data points. The first two columns are the X and Y coordinates for the data points. The third column is the
Z value or element concentration assigned to the XY point (Surfer search for these coordinates in these columns
by default). As part of the data preparation, Latitude and Longitude are presented as decimal degrees for use in
Surfer. The data is imported into Surfer and a grid file created with the Kringing algorithm tool. Surfer is used to
generate geochemical models that consist of contoured concentration, grid vector and 3-D wireframe maps so as
to amply visualize the spatial distribution of concentration data and anomalies in the study area. The wireframe
3-D surface is a three-dimensional rendering of the grid file produced by linking Z values along lines of constant
X and Y, and with a height that corresponds to the element content associated with the grid node. The grid
vector map contains element content information and is characterized by arrows that illustrate the changing
trend in element spatial concentration. The threshold of analyzed geochemical elements is computed in line with
Kock and Link (1971) and used to augment the analysis of spatial maps so that geochemical anomaly is overtly
delineated.
IV. Results And Discussion
The results of the chemical analysis of stream sediment samples from the area of study shows Au and Cu
are characterised by wide ranges of concentration (0.56 to 10.12ppm and 0.92 to 6.22ppm respectively). While
the concentration ranges of other associated elements are narrow (Ag: 0.01 to 2.25ppm; Zn: 0.1 to 4.2ppm; Pb:
0.14 to 2.84ppm) (Tables 1 and 2). The mean content of Au, Ag, Cu, Zn and Pb are 5.7984, 0.9213, 2.6913,
1.9116, and 1.5245ppm respectively (Table 2). The highest Au content (10.12ppm) is recorded in stream
sediment in location 15(i.e. L15) while the lowest recorded Au value (0.56ppm) is associated with stream
sediment in location 6(L6). Ag content in analysed sediments reach a maximum value of 2.25ppm at location
1(L1), and the minimum Ag content of 0.01ppm is recorded in sediment sampled from location 6 (L6) (Table 1).
The maximum Cu content of 6.22ppm is recorded from the analysis of the sediment sample located at L15 while
a minimum Cu content of 0.92ppm is associated with sample collected in location 28(L28) (Table 1). Maximum
(4.2ppm, 2.84ppm) and minimum (0.1ppm, 0.14ppm) Zn and Pb contents occur in locations 17(L17) and
25(L25) and locations 6(L6) and 12(L12) respectively (Table 1).
Generated spatial geochemical models illustrate element concentration ranges designated as high
background and low background areas based on average background value, and anomalies of Au, Ag, Cu and
Zn and (Figs. 4a-4d). Computed statistical metrics of element content in sediment samples indicate that the
threshold value that separates background from Au anomalies is 11.161ppm (Table 2), which is 1.041ppm
higher than the maximum recorded Au content of the sediments analysed. However, the spatial rendering of the
concentration data depicts closed elliptical-spherical contours northwards of Dagbala in the area around Ineme-
Osa (Fig. 4a) which suggest the occurrence of a positive Au anomaly. The pattern of the concentration contours
illustrates a southwest spatial decrease in Au content from the anomaly in the northeast through the low
background area in the southwest (Fig. 4a).
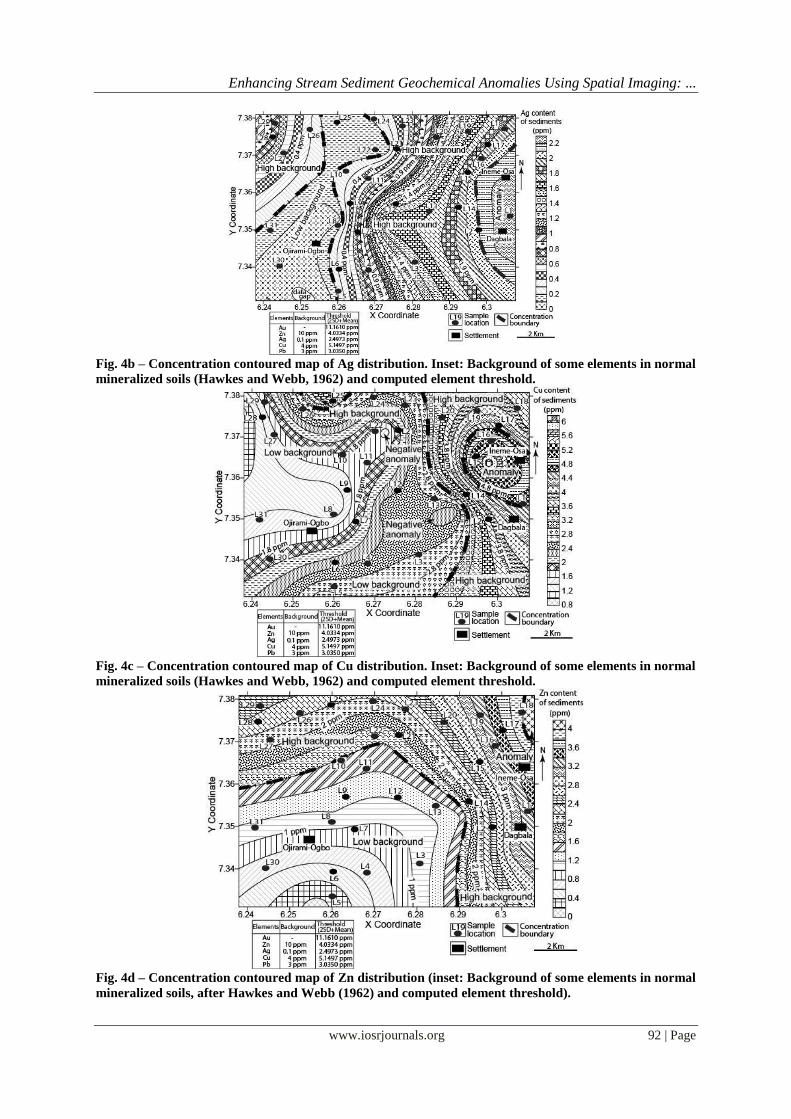
The threshold value (2.4973ppm; Tables 1 and 2) for discriminating background from anomalies is
0.2473ppm higher than the maximum Ag content (2.25ppm; Tables 1 and 2) in the stream sediments, which
suggest an absence of anomalous concentration of Ag in the study area. On the contrary, the analysis of spatial
concentration map shows semi-concentric contours characterised by an inward increase in Ag content in the
eastern part of Dagbala and Ineme-Osa, which exemplify the western part of a positive Ag anomaly that
developed to the east of these localities (Fig. 4b). The configuration of the contours is characterised by a spatial
decrease in Ag content to the west of the anomaly and through the high background to the low background area
in the western segment of the study area. An apparent change from low background to high background occurs
at approximately 10 kilometres northwest of Dagbala typifies by semi-concentric contours that abut the north-
western margin of the study area (Fig. 4b). This suggests that a positive Ag anomaly also developed north-
westerly of the study area.
The maximum Cu content (6.22ppm; Tables 1 and 2) recorded in the analysed stream sediments is, higher
than the computed statistical threshold value (5.1497ppm; Tables 1 and 2) used for discriminating background
from Cu anomalies in the study area, suggesting copper anomalous concentration. The contours obtained in the
spatial rendering of the concentration data are concentric in form in Ineme-Osa and north of Dagbala (Fig. 4c).
The observed configuration of these contours is characterised by an inward increase in Cu content which may
illustrate a positive Cu anomaly. At approximately 7 km northwards of Ojirami-Ogbo, concentration contours
show an inward increase in Cu content and abut the north margin of the study area (Fig. 4c). However, the
Enhancing Stream Sediment Geochemical Anomalies Using Spatial Imaging: ...
www.iosrjournals.org 88 | Page
element concentration in this locality did not develop strong geochemical response to illustrate a positive Cu
anomaly. The spatial concentration map also shows elliptical concentration contours situated in a low
background area and at approximately four kilometres to the east of Dagbala (Fig. 4c). The configuration of the
contours is characterised by an inward decrease in Cu content which exemplifies a negative Cu anomaly in this
region. An additional negative Cu anomaly developed approximately 6 km northwest of Ineme-Osa, although
the geochemical response is not as strong as the previous one (Fig. 4c). In this study, negative Cu anomaly
occurs in the low background area while positive Cu anomaly occurs in the high background area. This is an
indication that both depletion and concentration of geochemical element occurred and that lateral migration is an
important aspect of the metal concentration process. Similar observations have been reported in the Jungger and
Kunlun area of China where negative and positive anomalies occur in stream sediments, in a low background or
high background areas (Shi and Wang (1995).
The threshold value (4.0334ppm) used for discriminating background from Zn anomalies is 0.1666ppm
lower than the maximum Zn content in the analysed stream sediments, suggesting an anomalous concentration
of Zn in the sediments (Tables 1 and 2). Analysis of the spatially rendered element concentration map reveal
sections of semi-circular concentration contours located approximately two kilometres northwards of Ineme-Osa
in the north-eastern segment of the study area (Fig. 4d). The pattern of the contours is marked by an inward
increase in Zn content and may illustrate a positive Zn anomaly in this region.
The maximum Pb content (2.84ppm) in the analysed stream sediments is 0.195 lower than the threshold
values (3.035ppm) used for separating background from anomaly in the study area, which suggests an un-
mineralised concentration of Pb in the analysed stream sediments (Tables 1 and 2). The analysis of spatial
concentration map shows that closed concentration contours are not developed in the high background areas;
which also suggest an absence of Pb related anomaly. Although, semi-circular contours that abut the northern
part of the study area are developed approximately 6 km northwards of Ojirami-Ogbo, the pattern of the
contours, however, did not illustrate detail geochemical response to suggest a positive Pb anomaly (Fig. 4e). In
the southern part of the study area, elliptical concentration contours occur in the low background area
approximately four and seven kilometres from Ojirami-Ogbo and Dagbala respectively (Fig. 4e). The
concentration contours are marked by an inward decrease in Pb content and have a configuration that illustrates
a negative Pb anomaly. As earlier indicated for Cu, the recognition of a negative Pb anomaly in the low
background area may suggest that ample depletion in metal content occurred during lateral dispersion of
element to develop the observed geochemical response.
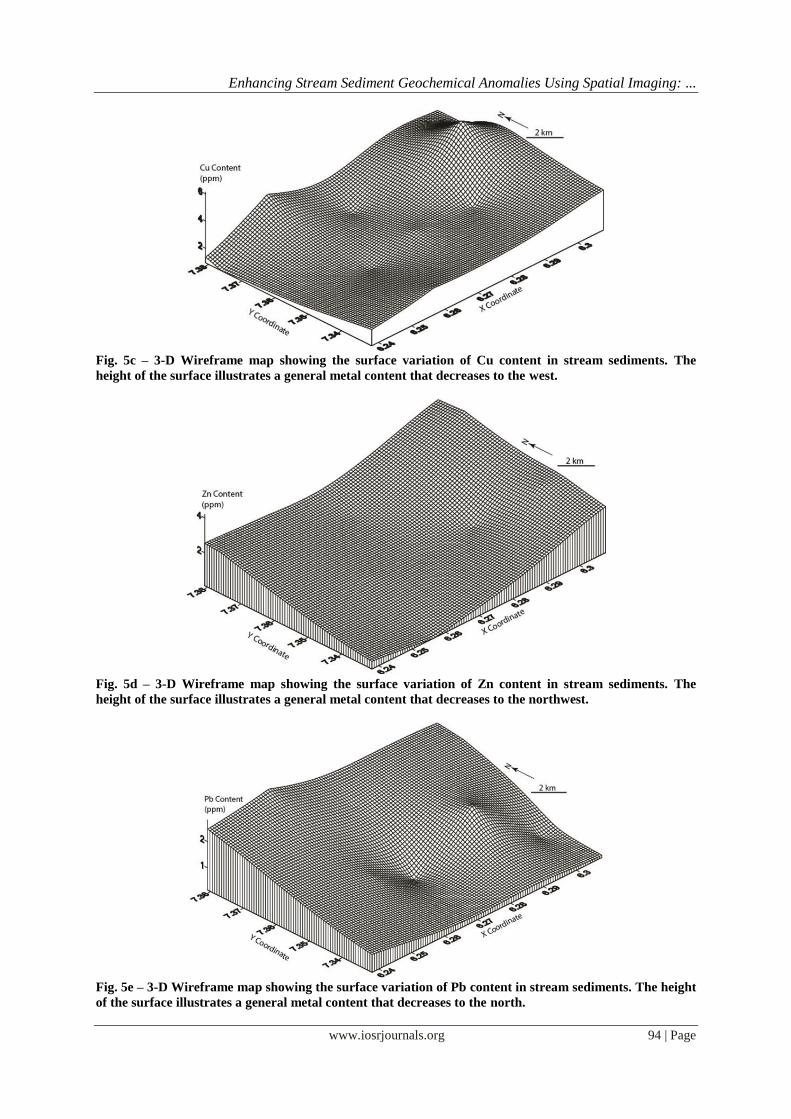
In 3-D, variation in the height of the surface of the wireframe map is analogous to variations in metal
content which decreases to the northwest for Au, Ag and Zn (Figs. 5a-5e). However a different pattern is
obtained for wireframe maps illustrating the surface variation in Cu and Pb content in the analysed sediments
that reveals a general decrease westward and northwards respectively (Figs. 5a-5e). The pronounced local dips
in the 3-D wireframe maps for Cu and Pb indicate areas of local depletions in metal content during lateral
dispersion, which are interpreted as negative anomalies in rendered spatial concentration contour maps.
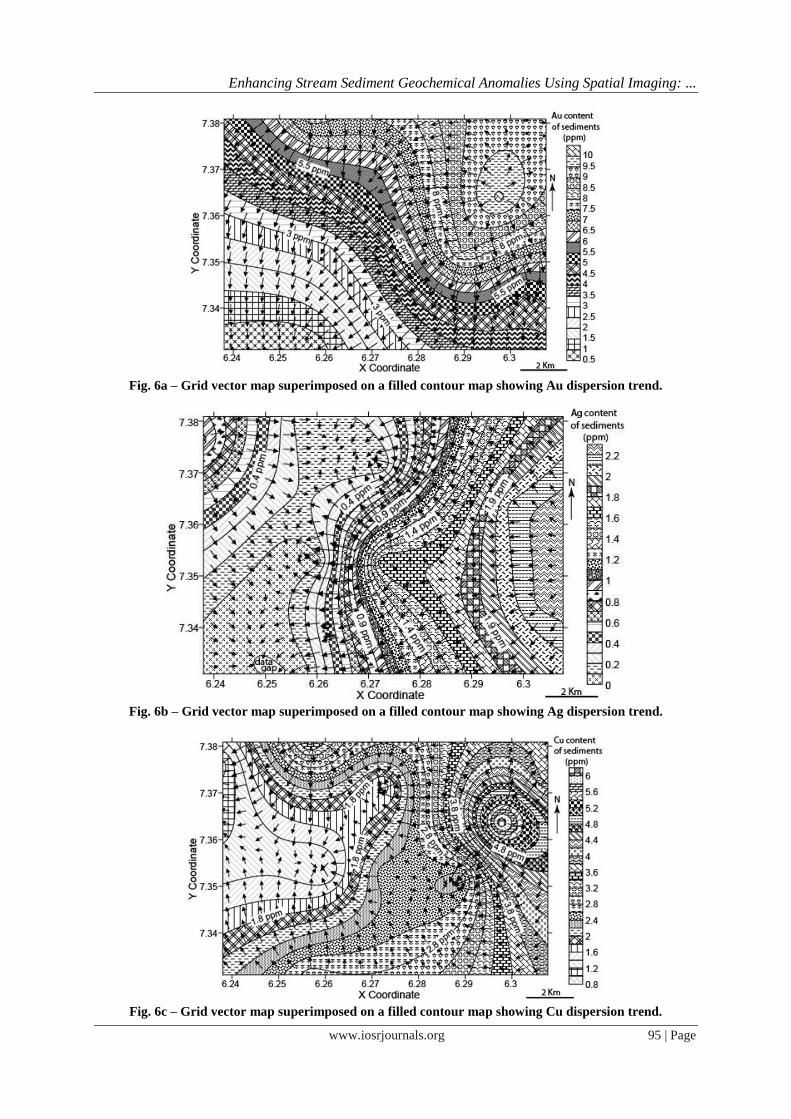
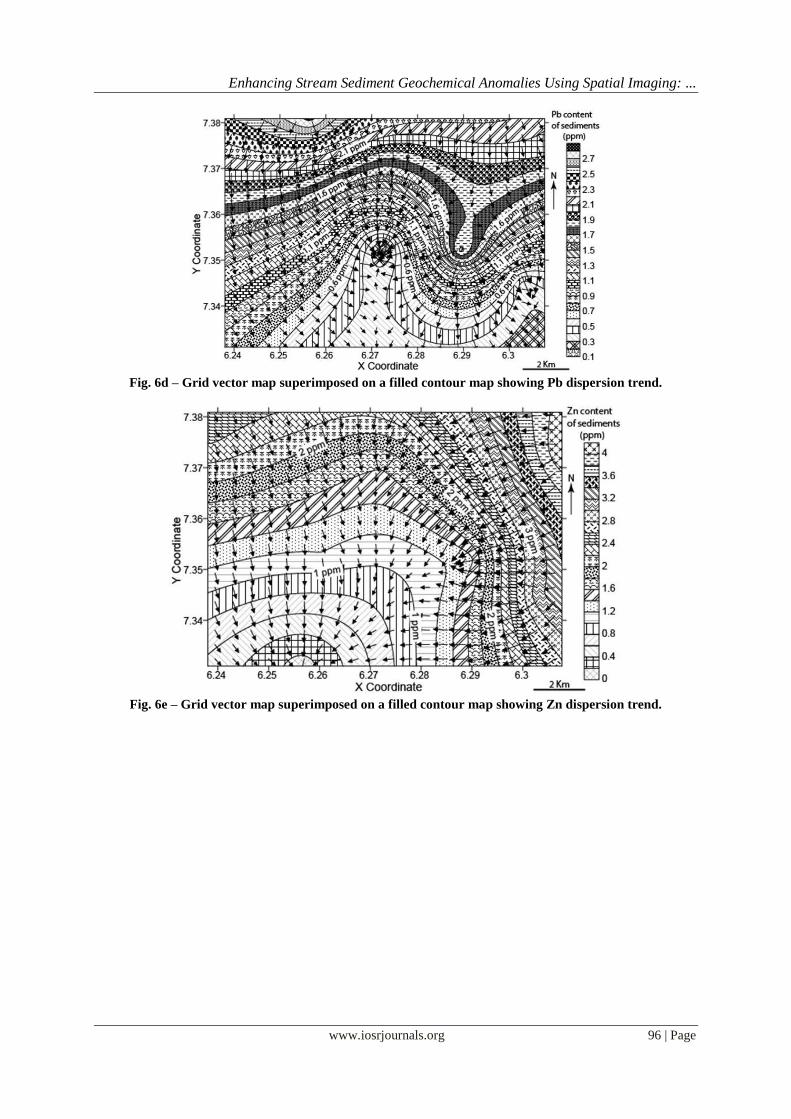
The dispersion trends of the elements analysed in the sediments is illustrated with a grid vector map
superimposed on filled contour maps (Figs. 6a-6e). The trends predicted by the grid vector maps correspond
with the spatial variation in metal content interpreted from the concentration contour and 3-D wireframe maps
(Figs. 4a-4e, 5a-5e). Grid vector maps contain vital information on magnitude and direction of point data, and
for the interpretation of elevation data the arrows point in the direction of the slope and arrow length increases
with the steepness of the slope (Golden Software Incorporation). In this study, geochemical models show that
the height at any point on the surface corresponds to the element content associated with the grid node.
Therefore, concentration is taken as a proxy for elevation and the differently directed arrows in the grid vector
maps are interpreted to indicate the changing trend in element spatial content, and also illustrate element lateral
dispersion trends over the area of study. Therefore, the arrows point in the direction of lateral dispersion of
geochemical elements from positively anomalous to negatively anomalous area. As portrayed on the grid vector
maps superimposed on the filled contoured-concentration maps for the elements analysed, the direction of the
vector arrows is primarily controlled by the relative position of the positively anomalous and negatively
anomalous areas (Figs. 6a-6e). For instance, the vector arrows on the Au, Ag, Zn and Cu grid vector maps
diverge from the positive anomalies located in the eastern segment of the study area (Figs. 6a and 6c). The
vector arrows are also observed to converge in the negative anomalies located to the east and central parts of the
grid vector maps for Cu and Pb respectively (Figs.6c and 6d). In general, vector arrows diverge in high
background areas or where positive anomalies exist, and converge in low background areas or where negative
anomalies are developed, for the elements analysed in this study (Figs. 6a-6e).
V. Conclusion
The results of the present study show that the discrimination of background data from anomalies based on
the analysis of spatially rendered geochemical maps is unequivocal, as compared with the use of statistical
Enhancing Stream Sediment Geochemical Anomalies Using Spatial Imaging: ...
www.iosrjournals.org 89 | Page
threshold values. However, the study demonstrates that statistical threshold values do not reliably separate
background from anomalies, and indicate the inexistence of anomalies (positive or negative) of some of the
elements studied whereas their occurrence is illustrated in the spatial geochemical maps produced. Furthermore,
pointing arrows in the grid vector maps produced depict the dispersion trends of the elements studied in four
delineated concentration zones namely, positively anomalous zones, high background areas, low background
areas and negatively anomalous zones. Vector arrows are observed to diverge from positive anomalies or high
background areas, and converge in negative anomalies or low background areas. In this way, the relative
position of positive anomalies and negative anomalies is clearly defined. Although Reimann et al. (2005)
suggest that the threshold values estimated by methods other than the one used in this study may offer a better
way for separating background data from anomalies, the application of spatial concentration maps in stream
sediment anomaly interpretation is overwhelming satisfactory. Consequently, computed statistical threshold
values are only used in this study to complement the interpretation of spatially rendered geochemical models of
element concentration. It is, therefore, suggested that spatially rendered geochemical models, should be
incorporated in stream sediments geochemical surveys, in order to enhance the interpretation of the anomalies
associated with element concentration during lateral dispersion. Furthermore, adopting this approach in the
interpretation of stream sediment geochemical survey data will significantly reduce the overall cost of mineral
exploration projects and enhance the degree of certainty in locating mineral deposits.
Acknowledgement The author thanks the management of the Delta State University, Abraka for their cooperation in supplying
the funding and logistical support to undertake this study that is the Phase I of an exploration research project in
Auchi Sheet 266. Thanks are also due to Golden Software Incorporation for providing the software used in the
interpretation of element concentration data.
References [1]. Adams, D. (2006). Geochemical Sampling and Geostatistics – Notes, Delta Mine Training Center; http://www. dmtcalaska.org/course
dev/explogeo/class12/notes12. html (accessed August 10, 2013). [2]. Adekeye, J. I. D. (1999). Heavy minerals in stream sediments and their relationship to bedrock types and mineralization in Oro Area
Southwestern Nigeria. Nigeria Journal of Pure and Applied Science, vol. 14, pp. 906-914.
[3]. Adepoju, M. O. and Adekoya, J. A. (2011). Reconnaissance geochemical study of a part of Igarra schist belt, southwestern Nigeria. Ife Journal of Science, vol. 13, no. 1, pp. 75-92.
[4]. Adepoju, M. O. and Adekoya, J. A. (2012). Distribution and assessment of heavy metals in sediments of the river Orle, southwestern Nigeria. Journal of Sustainable Development and Environmental Protection, vol. 2, no. 1, pp. 78-97.
[5]. Alexakis, D. (2008). Geochemistry of stream sediments as a tool for assessing contamination by Arsenic, Chromium and other toxic
elements: East Attica region, Greece. European Water, vol. 21, no. 22: pp.57-72. [6]. Arhin, E. and Nude, M. P. (2010). Use of termitaria in surficial geochemical surveys: evidence for >125-μm size fractions as the appropriate media for
gold exploration in northern Ghana. Geochemistry: Exploration, Environment, Analysis, vol. 10, no. 4, pp. 401-406.
[7]. Atsuyuki, O., Noboru, I., Shigeru, T. and Yoshiko, T. (2005). Influence of surface geology and mineral deposits on the spatial distributions of element concentrations in the stream sediments of Hokkaido Japan. Journal of Geochemical Exploration, vol. 86, 86-103.
[8]. Bamigboye, O. S. 1. and Adekeye, J. I. D. (2011). Stream sediment survey of eruku and its environs, central Nigeria: Implication
for exploration. IJRAS, vol. 7, no. 2, pp. 160-172. [9]. Fletcher, W. K. (1997). Stream Sediment Geochemistry in Today’s Exploration World. Exploration Geochemistry Paper 2. In
“Proceedings of Exploration 97: Fourth Decennial International Conference on Mineral Exploration” edited by A.G. Gubins, pp.
249–260. [10]. Golden Software Incorporation Surfer 9.
[11]. Kock, G. S. and Link, R. F. (1971). Statistical analysis of geological data (vol. II). John Wiley and Sons, Inc, New York, pp. 326.
[12]. McClenaghan, M. B., Thorleifson, L. H. and DiLabio, R. N. W. (1997). Till geochemical and indicator mineral methods in mineral exploration; In: Proceedings of Exploration 97: Fourth Decennial International Conference on Mineral Exploration, (ed.) Gubins A G, Prospectors and Developers
Association of Canada, pp. 233-248.
[13]. Mikoshiba, U. M., Imai, N., Terashima, S., Tachibana, Y. and Okay, T. (2006). Geochemical mapping in northern Honshu, Japan Applied Geochemistry, vol. 21, pp. 492-514.
[14]. Mukherjee, P. K., Purohit, K. K., Saini, N. K., Khanna, P. P., Rathi. M. S., and Grosz, A. E. (2007). A stream sediment geochemical survey of the
Ganga River headwaters in the Garhwal Himalaya. Geochemical Journal, vol. 41, pp. 83-95. [15]. Nugraha, H. S. (2011). Integration of stream sediment geochemical and airborne gamma-ray data for surficial lithologic mapping using clustering
methods. Unpublished Master’s thesis, Faculty of Geo-Information Scvience and Earth Observation, University of Twente.
[16]. Obaje, N. G. (2009). Geology and Mineral Resources of Nigeria. Lectures Notes in Earth Sciences, vol. 120, pp. 13-30. [17]. Obiora, C. and Ukaegbu, V. U. (2009). Petrology and geochemical characteristics of Precambrian granitic basement complex rocks
in the southernmost part of North-Central Nigeria. Chinese Journal of Geochemistry, vol., 28, no. 4, pp. 377-385.
[18]. Reid, J. C. (1993). A Geochemical Atlas of North Carolina, USA. Journal of Geochemical Exploration, 4711-4727. [19]. Reimann, C., Filzmoser, P. and Garrett, R. G. (2005). Background and threshold: critical comparison of methods of determination.
Total Environment, vol. 346, nos 1-3, pp. 1-16.
[20]. Samal, R. A., Sengupta, R. R. and Fifarek, H. R. (2011). Modelling spatial anisotropy of gold concentration data using GIS-based interpolated maps and variogram analysis: Implications for structural control of mineralization. Journal Earth System Science, 120, no. 4, pp. 583-593.
[21]. Shi, C. and Wang, C. (1995). Regional geochemical secondary negative anomalies and their significance. Journal of Exploration Geochemistry, vol.
55, pp. 11-23. [22]. Stewart, A. D., Anand, R. R. and Balkau, J. (2012). Source of anomalous gold concentrations in termite nests, Moolart Well,
Western Australia: Implications for exploration. Geochemistry, Exploration, Environment, Analysis, vol. 12, pp. 327-337.

Enhancing Stream Sediment Geochemical Anomalies Using Spatial Imaging: ...
www.iosrjournals.org 90 | Page
[23]. Suslov, A. B. (1992). Primary Ni negative haloes – a criterion for blind Cu-Ni orebodies. Geophysics Geochemistry Exploration
Abroad, vol. 2, pp. 52-55. [24]. Webb, J. S. and Thompson, M. (1977). Analytical requirements in exploration geochemistry. Pure and Applied Chemistry, vol. 49, pp. 1507-1518.
[25]. Xie, X. and Yin, B. (1993). Geochemical pattern from local to global. In: F. W. Dickson and L. C. Hsu (Editors). Geochemical Exploration 1991.
Journal Geochemical Exploration, vol. 47, pp. 109-129.
Fig. 1 – Geologic map of Nigeria showing the study area. Inset: Map of Africa.
Fig. 1- Schematic geologic map of the study area
Fig. 3 – Grid map showing location of stream sediment samples.
Table 1 – Stream Sediment Geochemical Data

Enhancing Stream Sediment Geochemical Anomalies Using Spatial Imaging: ...
www.iosrjournals.org 91 | Page
Location/Sample
ID
Elements Concentration(ppm)
Au Ag Cu Zn Pb
L1 7.75 2.25 4.7 3.28 1.17
L2 5.11 2.22 4.1 3.15 0.34
L3 5.15 1.56 2.56 1.1 0.67
L4 3.12 0.9 2.44 0.7 0.36
L5 1.35 0.3 2.57 0.4 0.48
L6 0.56 0.01 2.9 0.1 0.45
L7 3.43 0.7 1.82 1 0.6
L8 2.87 0.1 1.38 1.11 0.98
L9 2.91 0.07 1.18 1.19 1.02
L10 5.42 0.25 1.8 1.6 1.68
L11 5.41 0.47 1.77 0.47 1.34
L12 4.43 1.71 2.56 1.06 0.14
L13 7.73 1.65 2.65 1.38 1.4
L14 8.52 1.81 2.26 1.31 1.94
L15 10.12 2.13 6.22 3.01 1.81
L16 9.7 1.85 4.96 3.2 1.97
L17 9.12 2.1 3.62 4.2 2.01
L18 9.25 1.9 3.87 3.9 2.12
L19 9.2 1.57 4.01 3.2 2.12
L20 8.43 1.1 3.4 2.5 2.03
L21 6.21 0.11 1.5 1.65 1.75
L22 6.44 0.15 1.77 1.71 1.8
L23 7.7 0.48 2.58 2.23 2.2
L24 7.25 0.24 2.57 2.2 2.3
L25 7.71 0.16 3.71 2.36 2.84
L26 6.5 0.3 2.8 2.23 2.53
L27 4.83 0.5 1.7 2.15 2.15
L28 4.38 1.03 0.92 2.48 2.32
L29 5.5 0.68 1.8 2.42 2.47
L30 1.4 0.08 1.83 0.75 0.97
L31 2.25 0.18 1.48 1.22 1.3
Table 2 – Descriptive Statistics of Stream Sediment Geochemical Data Elements Units Mean Median Standard
Deviation
Min Max Count Threshold
(2SD+Mean)
Au ppm 5.7984 5.5 2.681457 0.56 10.12 31 11.161
Ag ppm 0.9213 0.68 0.787996 0.01 2.25 31 2.4973
Cu ppm 2.6913 2.56 1.229213 0.92 6.22 31 5.1497
Zn ppm 1.9116 1.71 1.060884 0.1 4.2 31 4.0334
Pb ppm 1.5245 1.75 0.755243 0.14 2.84 31 3.035
Fig. 4a – Concentration contour map of Au distribution. Inset: Background of some elements in normal
mineralized soils (Hawkes and Webb, 1962) and computed element threshold.
Enhancing Stream Sediment Geochemical Anomalies Using Spatial Imaging: ...
www.iosrjournals.org 92 | Page
Fig. 4b – Concentration contoured map of Ag distribution. Inset: Background of some elements in normal
mineralized soils (Hawkes and Webb, 1962) and computed element threshold.
Fig. 4c – Concentration contoured map of Cu distribution. Inset: Background of some elements in normal
mineralized soils (Hawkes and Webb, 1962) and computed element threshold.
Fig. 4d – Concentration contoured map of Zn distribution (inset: Background of some elements in normal
mineralized soils, after Hawkes and Webb (1962) and computed element threshold).

Enhancing Stream Sediment Geochemical Anomalies Using Spatial Imaging: ...
www.iosrjournals.org 93 | Page
Fig. 4e – Concentration contoured map of Pb distribution. Inset: Background of some elements in normal
mineralized soils (Hawkes and Webb, 1962) and computed element threshold.
Fig. 5a – 3-D Wireframe map showing the surface variation of Au content in stream sediments. The
height of the surface illustrates a general metal content that decreases to the northwest.
Fig. 5b – 3-D Wireframe map showing the surface variation of Ag content in stream sediments. The
height of the surface illustrates a general metal content that decreases to the northwest.
Enhancing Stream Sediment Geochemical Anomalies Using Spatial Imaging: ...
www.iosrjournals.org 94 | Page
Fig. 5c – 3-D Wireframe map showing the surface variation of Cu content in stream sediments. The
height of the surface illustrates a general metal content that decreases to the west.
Fig. 5d – 3-D Wireframe map showing the surface variation of Zn content in stream sediments. The
height of the surface illustrates a general metal content that decreases to the northwest.
Fig. 5e – 3-D Wireframe map showing the surface variation of Pb content in stream sediments. The height
of the surface illustrates a general metal content that decreases to the north.
Enhancing Stream Sediment Geochemical Anomalies Using Spatial Imaging: ...
www.iosrjournals.org 95 | Page
Fig. 6a – Grid vector map superimposed on a filled contour map showing Au dispersion trend.
Fig. 6b – Grid vector map superimposed on a filled contour map showing Ag dispersion trend.
Fig. 6c – Grid vector map superimposed on a filled contour map showing Cu dispersion trend.
Enhancing Stream Sediment Geochemical Anomalies Using Spatial Imaging: ...
www.iosrjournals.org 96 | Page
Fig. 6d – Grid vector map superimposed on a filled contour map showing Pb dispersion trend.
Fig. 6e – Grid vector map superimposed on a filled contour map showing Zn dispersion trend.