Embed Size (px)
DESCRIPTION
Enhanced Loss Mitigation Strategy. October 21, 2014. Our Mission: Minnesota Housing finances affordable housing for low- and moderate-income households while fostering strong communities. Enhanced Loss Mitigation Strategy. - PowerPoint PPT Presentation
Citation preview

1
Enhanced Loss Mitigation Strategy
October 21, 2014

2
Our Mission:
Minnesota Housing finances affordable housing for low- and moderate-income households while fostering strong communities.

3
Enhanced Loss Mitigation Strategy
Goal: To develop a new strategic loss mitigation approach to reduce
foreclosure losses and increase the number and success rate of permanent,
affordable loan modifications among identified high loss, high risk delinquent
loans.

4
Whole Loan Portfolio CharacteristicsJune, 2012
• Portfolio size: 14,426 loans, $1.320 Billion• Last origination in September, 2009• 58% Government, 42% Conventional• DQ rate of 6.91%, spiked at 8.85% by year end• FC rate of .67 ran up to 2.2% by Feb, 2013• Net losses on Conventional loans averaging
$54,919, $65,900 in some neighborhoods

5
2009 – 2012 Loss Mitigation Program
• US Bank as local sub servicer since 2005• Loan Modification Tools:– 0% Deferral loans– Capitalization of past interest– Extended maturity– Interest rate reductions
• Modification success rate- 71% current

6
7
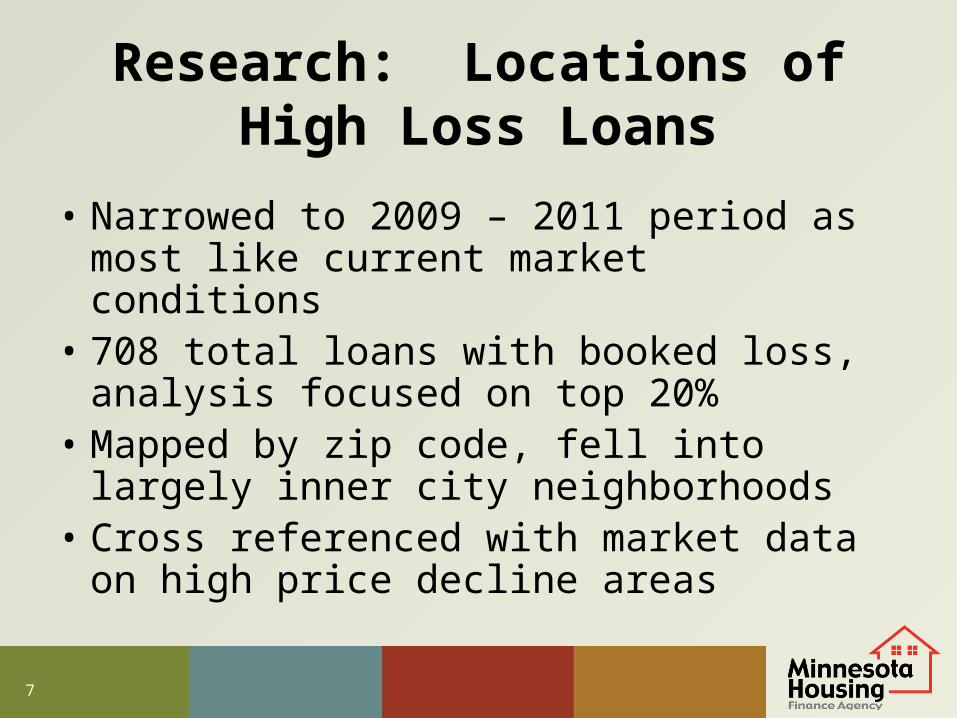
Research: Locations of High Loss Loans
• Narrowed to 2009 – 2011 period as most like current market conditions
• 708 total loans with booked loss, analysis focused on top 20%
• Mapped by zip code, fell into largely inner city neighborhoods
• Cross referenced with market data on high price decline areas

8
Metro Areas with High Average
Booked Loss and Significant Home
Sales Price Declines

9
Research: Added Risk Characteristics
• Conventional (insured or uninsured)• Originated between 2003 and 2007• Between $100,000 and $200,000• Used Entry Cost Assistance

10
Research: Booked Losses
• Loans in price decline area showed a 61% higher loss
• Loans in price decline areas + risk characteristics = added 44% higher loss
• 30% of all losses were from price decline areas + risk characteristics
• 72% probability that a loss for loans in decline areas + risk characteristics – over $50K

11
Developing ELMS
• Form a target list, applied location/risk characteristics to current 60 day + DQ and FC
• Review US Bank’s current collections and loss mitigation processes
• ELMS “Specialist” concept, embed at US Bank• Use new contact, communication, and
counseling techniques• Added Principal Reduction (capped @ 90% of
projected REO loss), and offer aggressively

12
US Bank’s Role
• Positive “partner attitude”• Experience with our portfolio and mission• Joint development of criteria and process• Willingness to integrate Specialist role and
authority

13
ELMS Results
• 2 phase program, 350 total eligible borrowers• Program term August 1, 2012 to December
31,2013 (Ph 2 launched May 1, 2013)• 17 brought current w/out modification• 108 received a modification (48 with PR), 77%
still current• PR investment $1.6 million, saved $2.4 million
in proj REO loss

14
Takeaways
• Personal contact key in gaining borrower commitment
• Principal Reduction gave borrowers a “fresh start”
• Impact of Specialist counseling skills• Mission impact for urban neighborhoods