Embed Size (px)
Citation preview
English Language Proficiency and Reading Growth
Presented at the 2018 NASP ConventionHeath Marrs, Ed.D., Central Washington University. [email protected] Langmack, B.S. Central Wash U.BriAnne Pauley, B.S., Central Wash U.
The purpose of this presentation is to help school psychologists better understand the relationships between English language proficiency and reading growth in English language learners. In addition, the presentation will review the characteristics of assessments related to ELLs, including home language surveys, English language proficiency tests, and universal screeners. Participants will learn how to better interpret assessment information important for evaluation and intervention planning for English language learners.

Outline of Presentation
1) Assessment tools for use with ELLs: Home Language Surveys, English Language Proficiency Assessment, Universal Screeners and Progress Monitoring
2) What is the relationship between English Language Proficiency and Reading Growth?
3) Interpreting assessment data on English language proficiency and reading growth.
1. Assessment Tools
• Home Language Surveys
• English Language Proficiency Tests
• Group administered and individually administered
• Universal Screeners

Home Language Surveys (HLS)
• Bailey & Kelly (2011) reviewed Home Language Survey practices across the US.
• Their conclusions:
• Majority of states mandate some form of HLS
• Great variation in number and phrasing of survey items
• Almost no evidence on the validity of HLS
• Problems with HLS raise questions about the validity of state English-language proficiency assessment.
• To date no state that evidence that their HLS is identifying the right pool of students for subsequent assessment.
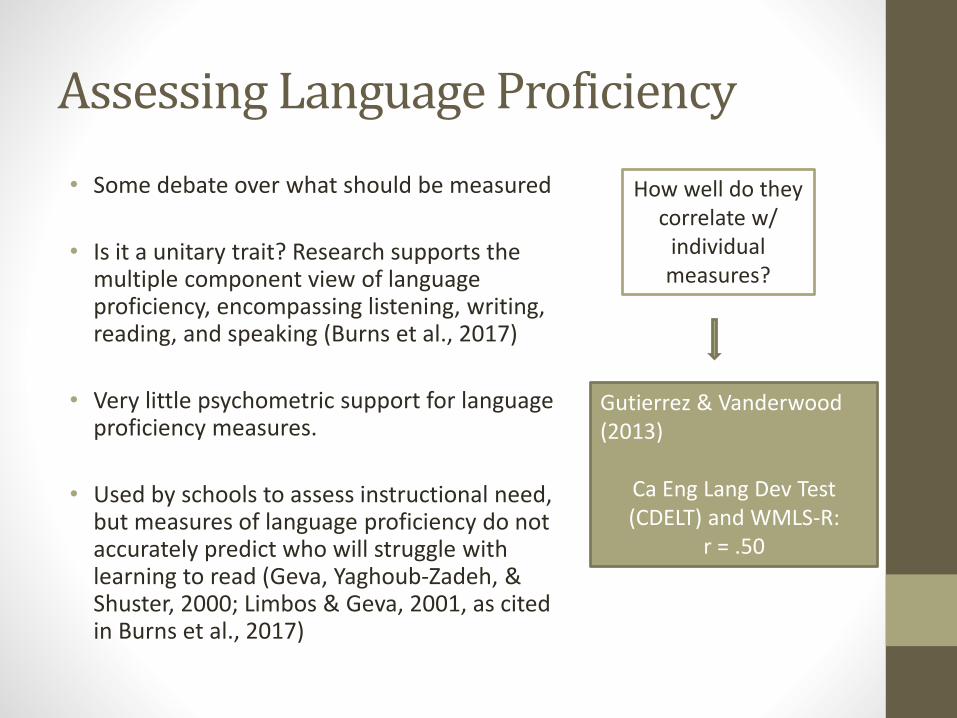
Assessing Language Proficiency
• Some debate over what should be measured
• Is it a unitary trait? Research supports the multiple component view of language proficiency, encompassing listening, writing, reading, and speaking (Burns et al., 2017)
• Very little psychometric support for language proficiency measures.
• Used by schools to assess instructional need, but measures of language proficiency do not accurately predict who will struggle with learning to read (Geva, Yaghoub-Zadeh, & Shuster, 2000; Limbos & Geva, 2001, as cited in Burns et al., 2017)
How well do they correlate w/
individual measures?
Gutierrez & Vanderwood(2013)
Ca Eng Lang Dev Test (CDELT) and WMLS-R:
r = .50
English Language Proficiency Measures
• Measures of ELP used to determine eligibility or placement in English language learner services
• Prior to NCLB focused on social language proficiency – since NCLB have focused more on academic language proficiency.
• Many different measures used – varies by state and changes regularly (Albers, 2009)
• In WA transitioned from WLPT to WELPA to ELPA21 (English Language Proficiency Assessment for the 21st Century).
• In doing record review you may see a variety of ELP tests.

From Albers (2009)

Critiques of Oral Language Proficiency Measures• Klinger et al. (2016) argue that it is a misconception that
“native language proficiency assessments commonly administered to ELs to determine their native language proficiency present a clear picture of linguistic proficiency” (p. 70).
• Why?
• Is deficit-focused and falsely identifies non-speakers at a high rate.
• Tend to assess not only oral language abilities but also other literacy skills.
• Recommend carefully assessing oral language and written language.
• Recommend focusing on authentic assessment of language

How do we identify ELLs?
• Two Step Process
• Step 1: At the time of enrollment, families complete a Home Language Survey (HLS).
• In Washington there is a standard form for the state HLS
• Use of HLS varies by state – little research on forms – 23 states mandate use of a specific form. Others provide samples or leave it up to districts
• Step 2: Completion of the WELPA (or ELPA21) placement test.
• ELPA21 website – used by Arkansas, Iowa, Nebraska, Ohio, Oregon, Washington, West Virginia

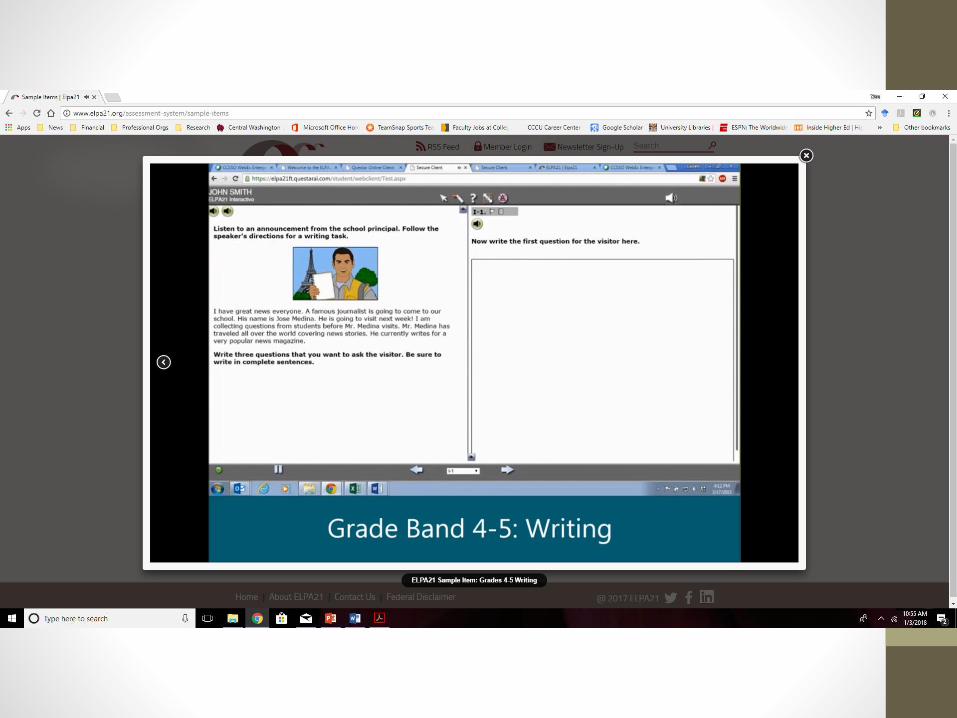
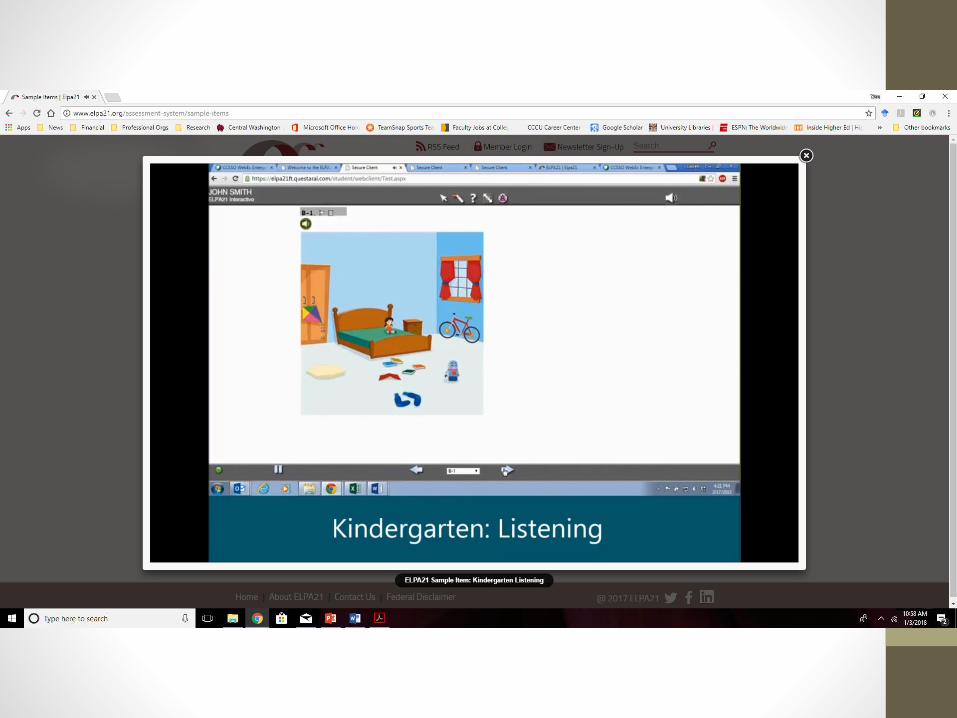
ELPA21 (English Language Proficiency
Assessment for the 21st Century)
• Computer administered
• Includes a screener and a summative assessment
• Screener for 6 grade bands (k, 1, 2, 3, 4-5, 6-8, 9-12)
• Provides baseline ELP and help with placement
• Summative assessment given at the end of the year

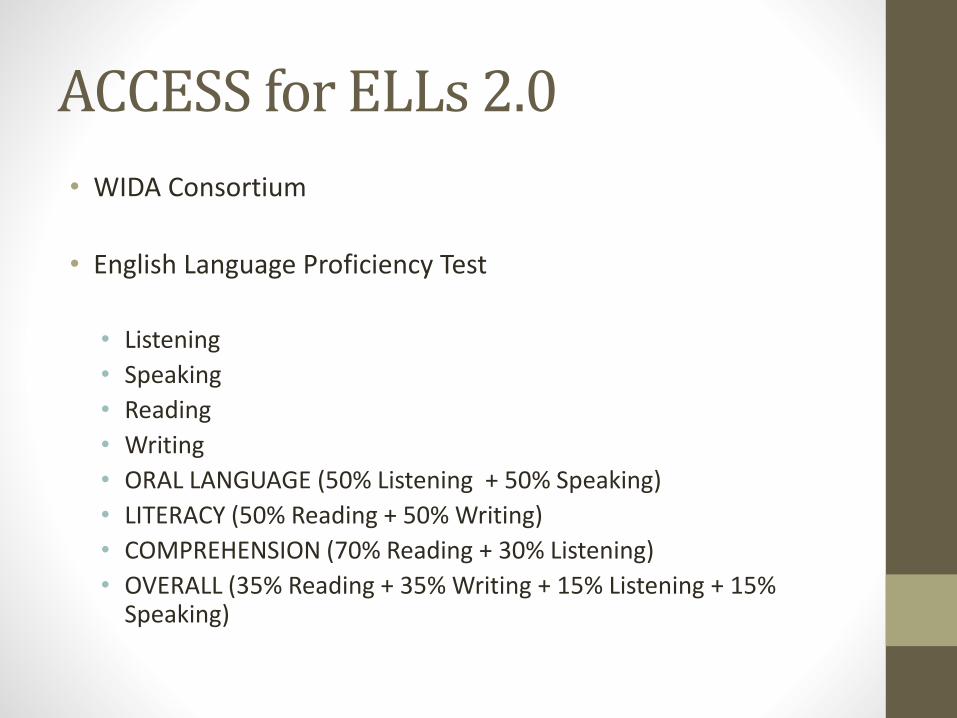
ACCESS for ELLs 2.0
• WIDA Consortium
• English Language Proficiency Test
• Listening
• Speaking
• Reading
• Writing
• ORAL LANGUAGE (50% Listening + 50% Speaking)
• LITERACY (50% Reading + 50% Writing)
• COMPREHENSION (70% Reading + 30% Listening)
• OVERALL (35% Reading + 35% Writing + 15% Listening + 15% Speaking)
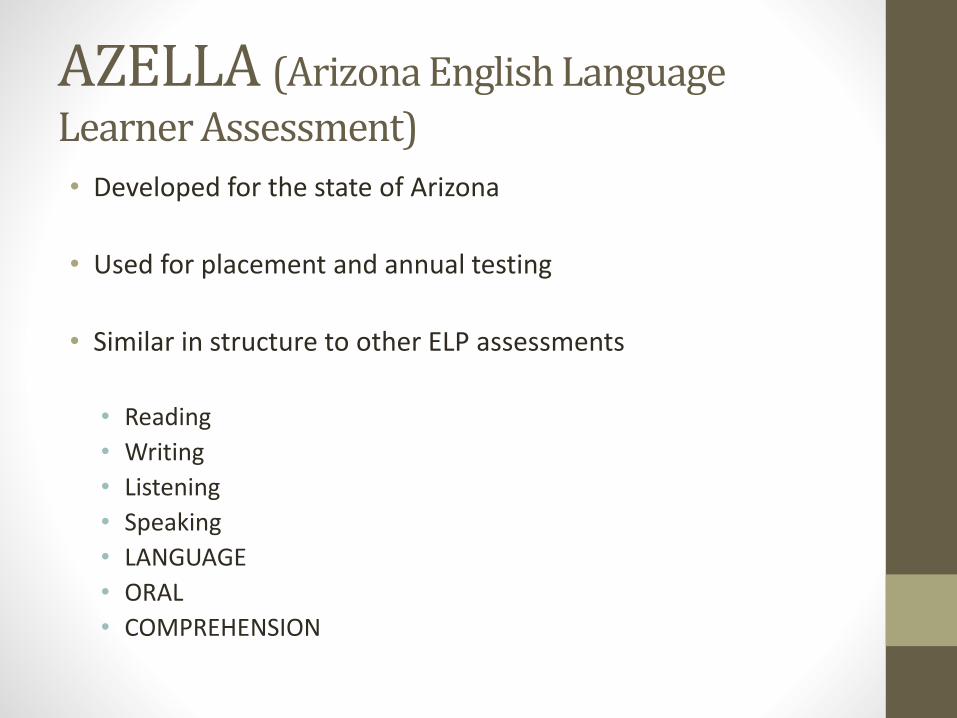
AZELLA (Arizona English Language
Learner Assessment)
• Developed for the state of Arizona
• Used for placement and annual testing
• Similar in structure to other ELP assessments
• Reading
• Writing
• Listening
• Speaking
• LANGUAGE
• ORAL
• COMPREHENSION

2. English Language Proficiency and Reading Growth
Application of the SVR (simple view of reading) to ELLs (Geva & Wiener, 2015)
SVR: RC = Language comp X Word-level skills

BIG ISSUE
Instruction Matters for English
Language Learners

• Research comparing different modes of instruction for ELLs (from immersion to dual-language) has generally supported the effectiveness of bilingual education/two-way immersion (Kim, 2015)
• Willig (1985) Meta-analysis
• Thomas & Collier (1997)
• Thomas & Collier (2002)
• Slavin (2005)
Effectiveness of Bilingual Instructional Models
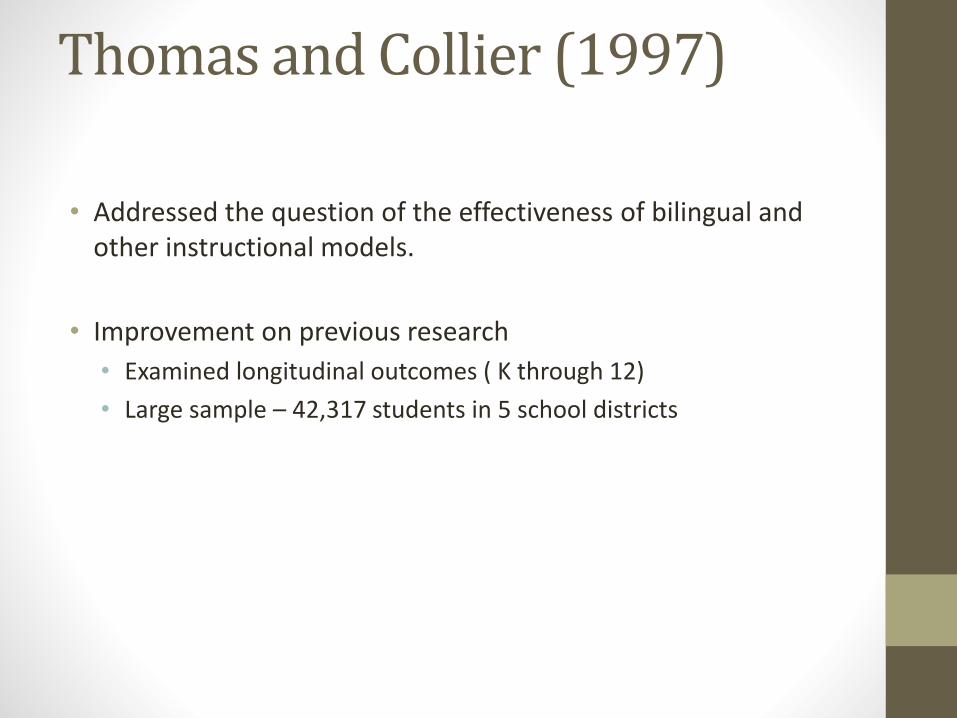
Thomas and Collier (1997)
• Addressed the question of the effectiveness of bilingual and other instructional models.
• Improvement on previous research
• Examined longitudinal outcomes ( K through 12)
• Large sample – 42,317 students in 5 school districts
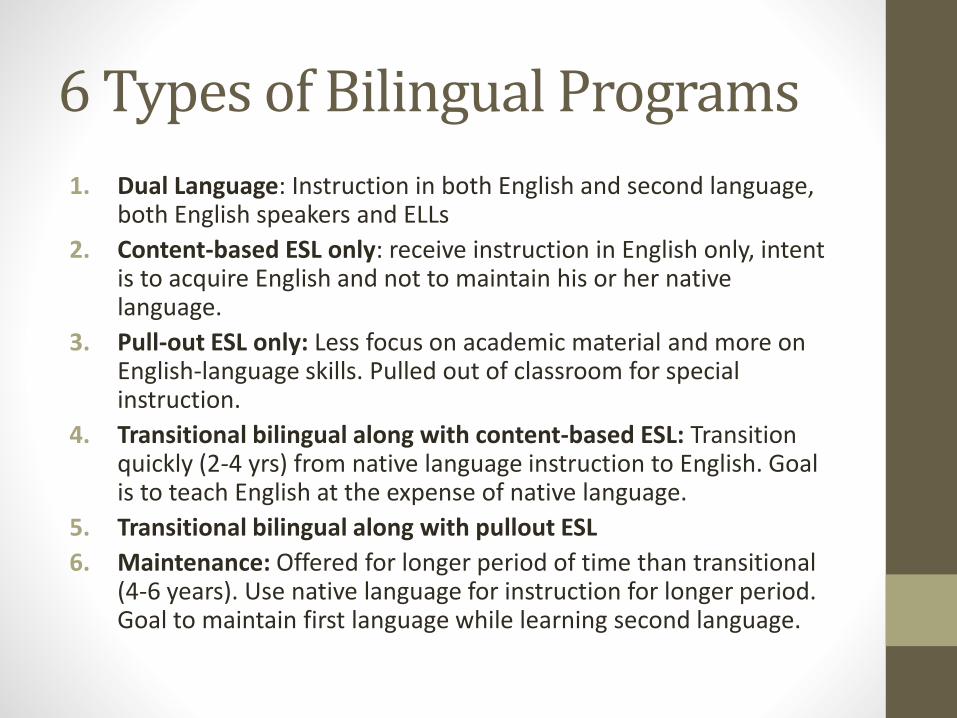
6 Types of Bilingual Programs
1. Dual Language: Instruction in both English and second language, both English speakers and ELLs
2. Content-based ESL only: receive instruction in English only, intent is to acquire English and not to maintain his or her native language.
3. Pull-out ESL only: Less focus on academic material and more on English-language skills. Pulled out of classroom for special instruction.
4. Transitional bilingual along with content-based ESL: Transition quickly (2-4 yrs) from native language instruction to English. Goal is to teach English at the expense of native language.
5. Transitional bilingual along with pullout ESL
6. Maintenance: Offered for longer period of time than transitional (4-6 years). Use native language for instruction for longer period. Goal to maintain first language while learning second language.
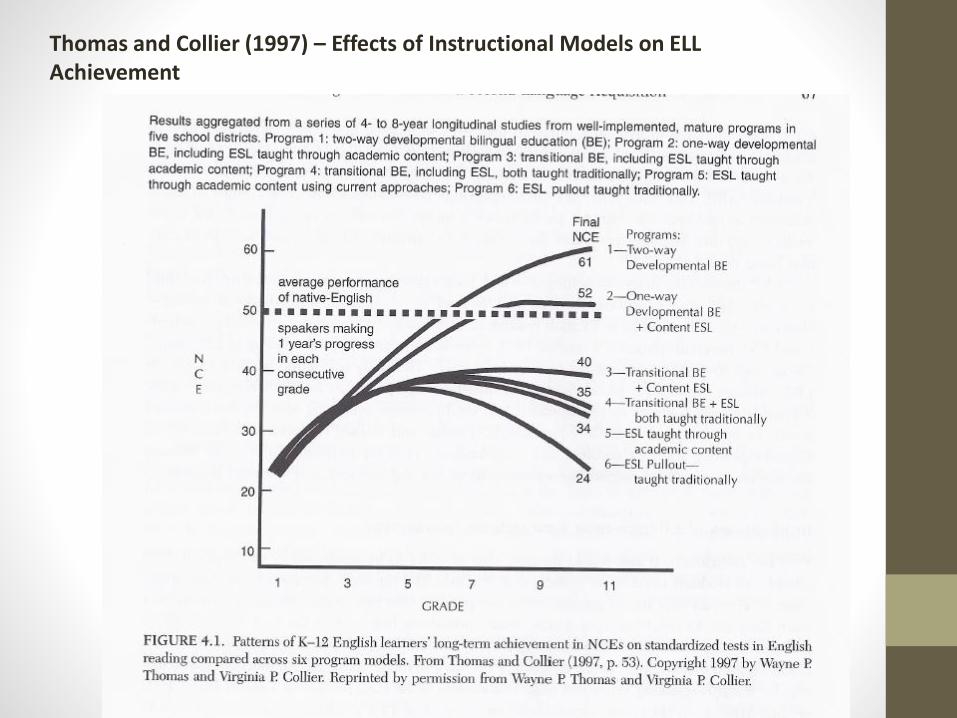
Thomas and Collier (1997) – Effects of Instructional Models on ELL Achievement
Disproportionality (Sullivan, 2013)
• In general, large variation in special education identification rates across the country. Little research on identification rates for ELL’s because that hasn’t traditionally been a category that was reported.
• Samson & Lesaux (2009) – for SLD, found that ELLs were underrepresented in the primary grades and overrepresented beginning in 3rd grade. May be due to lack of services for ELLs with disabilities and teacher reluctance to refer in early grades.
• Wagner (2005) – litigation has made districts wary of referring to stay out of trouble. ELLs begin receiving services 2 to 3 years later than average for ELs.
Research on ELP, Reading Performance and Reading Growth
• Question: How does English language proficiency impact subsequent reading growth?
• For typical progression based on ELP (Gutierrez & Vanderwood, 2013; Keiffer, 2008; Keiffer, 2011; Keiffer, 2012)
• For ELP and growth in interventions: Few studies to date
• Burns et al. (2017)

What do we know about relationship between ELP and reading in native English speakers?
• Meta-analysis of literacy research literature • National Early Literacy Panel (2008). Developing early literacy: Report of the National Early Literacy Panel.
Washington, DC: National Institute of Literacy.
• OLP in kindergarten a moderate correlate of later decoding and later reading comprehension
• Differences in predictive validity of individual language skills
• Overall composite measures stronger than individual skills (vocabulary, syntax, listening comprehension)
• Early OLP also predictive of reading comprehension in later grades (4-10).
How about for ELLs?
• Relationship between ELP and reading growth may differ for ELLs.• Language proficiency now relevant for two languages
• ELP often confounded with SES
• Findings from the research literature (Kieffer, 2012)
• Early ELP predicts later English reading
• English productive vocabulary is a better predictor of later reading for ELLs than for monolinguals
• Early oral language (either English or Spanish) did not predict later rates of growth between 3rd and 8th grade. • ELP necessary but not sufficient for later growth in reading
achievement
Literacy and ELLs – General Trends
• “Word-level” literacy skills of ELLs (decoding, spelling) are much more likely to be at levels equal to monolingual English speakers
• Caveat – ASSUMING GOOD INSTRUCTIONAL SETTING
• “Text-level” literacy skills (reading comprehension, writing). These skills rarely reach levels equal to monolingual English speakers.
What do we know about Reading Impairment in ELL’s (Paredis et al., 2011)?
• Very little research on reading impairment in L2 learners
• Few statistics on reading impairment in ELL’s
• Some studies suggest ELL’s can reach average levels of word reading, but still struggle with comprehension. WHY?
• No reason to believe the rate of reading impairment would be higher in L2 children vs. L1 children.
• L2 or bilingual status in itself not a risk factor for reading impairment.
Reading Acquisition in Native English Speakers• Phonological awareness causally related to word reading
ability
• For reading comprehension, different constellations of skills are important at different times. Demands of reading are different at different levels.
• Different risk profiles
• Decoding difficulties high cognitive resources for decoding
• Comprehension difficulties may be linked to more general language deficits (overlap between “language” and “reading” disorders)
Similarities:Learning to read in L2 and learning to
read in L1 (August & Shanahan, 2008)
• Predictors of word decoding ability in L1 readers are also significant predictors of L2 word decoding ability.
• Similarities between L2 and L1 reading comprehension at a general level.
• L2 and L1 readers who are at risk demonstrate similar weaknesses

Differences:In what ways are L2 reading acquisition and
L1 reading acquisition different?
• Students learning to read in an L2 usually come from different sociocultural backgrounds.
• Know and use another language.• Cross-Language Transfer: May make “transfer” errors – be careful
not to interpret these as signs of reading impairment
• They are still learning L2
All 3 of these factors influence speed, fluency, and accuracy with reading, and can
result in poor test performance.
Common Issue:
• Do schools need to wait until adequate English proficiency until beginning reading interventions?
• Some schools focus on language first rather than begin reading interventions (Burns et al., 2017)
OLP and Growth in Reading Interventions (Burns et al., 2017)
• Purpose: Examine the relationship between English language proficiency and growth during reading intervention for ELLs
• (201 2nd and 3rd graders; 37% Somali, 35% Hispanic (Spanish speaking), 20% Asian (mostly Hmong), 8% other languages)
• Three research questions:
• To what extent does language proficiency relate to reading growth during interventions?
• To what extent does language proficiency predict reading growth during interventions?
• What are the differential reading growth rates according to language proficiency groups?
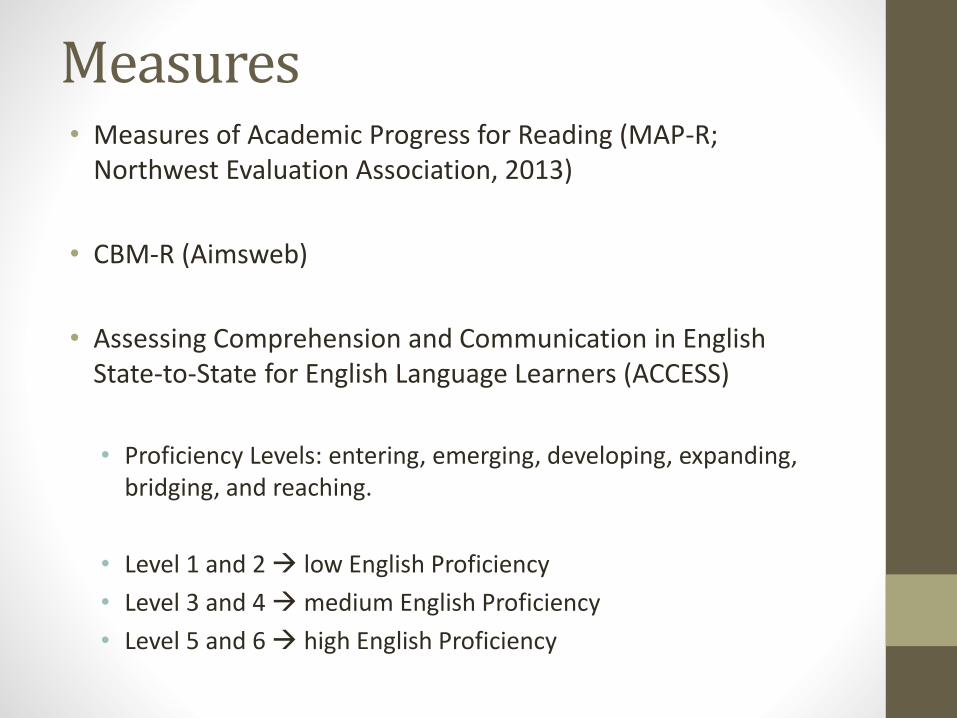
Measures• Measures of Academic Progress for Reading (MAP-R;
Northwest Evaluation Association, 2013)
• CBM-R (Aimsweb)
• Assessing Comprehension and Communication in English State-to-State for English Language Learners (ACCESS)
• Proficiency Levels: entering, emerging, developing, expanding, bridging, and reaching.
• Level 1 and 2 low English Proficiency
• Level 3 and 4 medium English Proficiency
• Level 5 and 6 high English Proficiency

Interventions
• Used standard protocol
• Phonics Interventions
• Fluency Interventions
• Vocabulary Interventions

Research Question 1• To what extent does language proficiency relate to reading
growth during interventions?
Little correlation between language scores and reading growth from
interventions
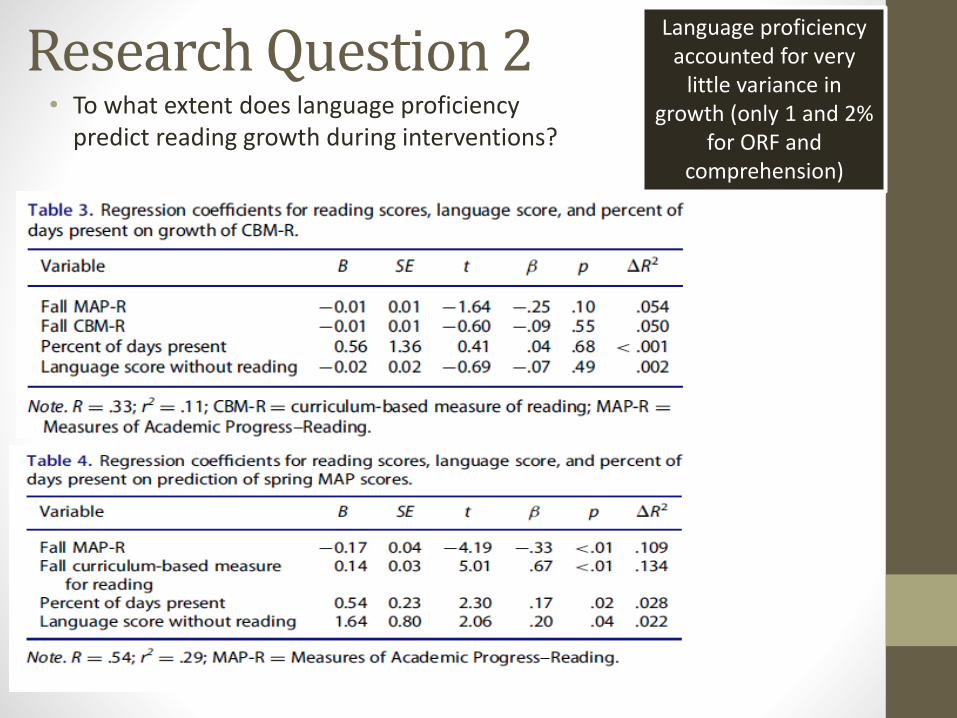
Research Question 2• To what extent does language proficiency
predict reading growth during interventions?
Language proficiency accounted for very
little variance in growth (only 1 and 2%
for ORF and comprehension)
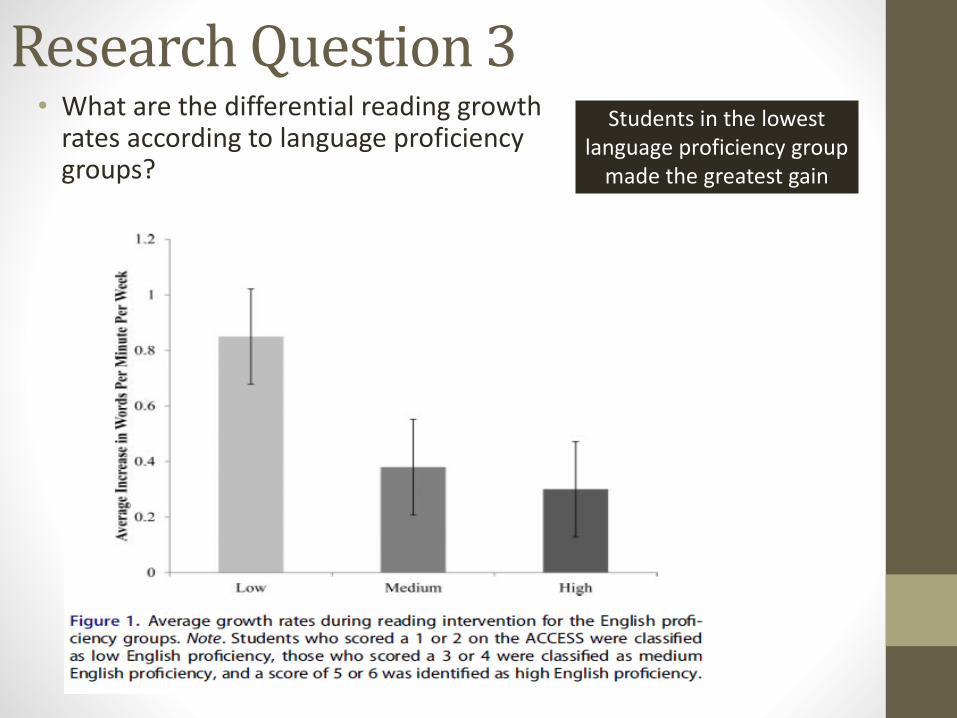
Research Question 3• What are the differential reading growth
rates according to language proficiency groups?
Students in the lowest language proficiency group
made the greatest gain

3. Interpreting Data on English Language Proficiency and Reading Growth
• How can we use data to better understanding whether an achievement delay is linked to ELL status or to some underlying disability?

Where we’re at
Need to focus on the diversity WITHIN ELLs,
rather than just think of ELLs as one big group
Level of ELP may contribute to different learning outcomes, so should take level of ELP
into account when reviewing data
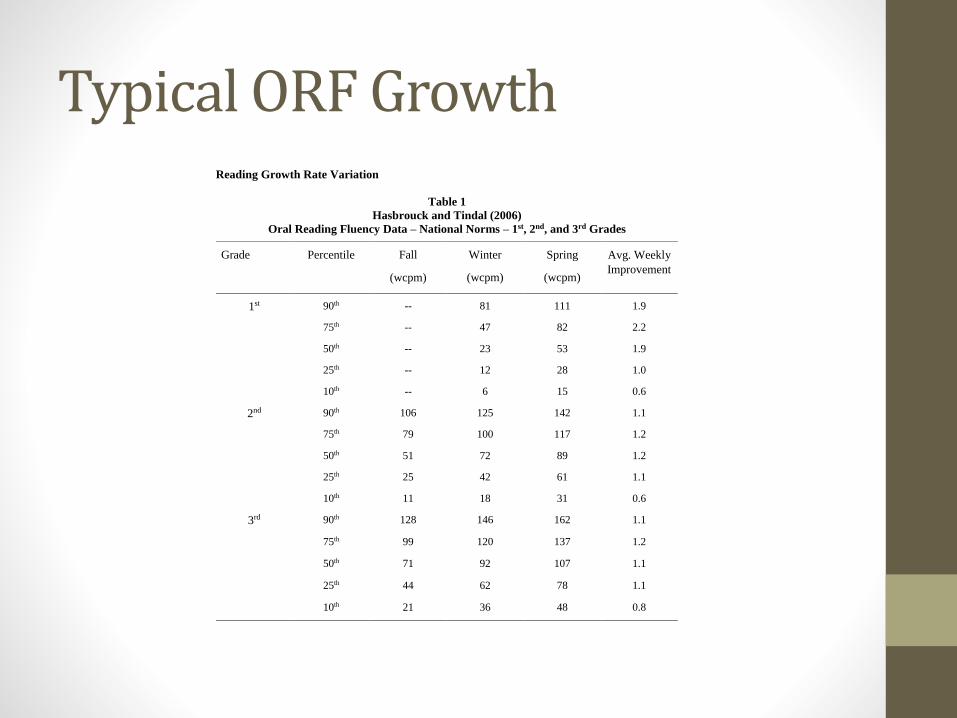
Typical ORF GrowthReading Growth Rate Variation
Table 1
Hasbrouck and Tindal (2006)
Oral Reading Fluency Data – National Norms – 1st, 2nd, and 3rd Grades
Grade Percentile Fall
(wcpm)
Winter
(wcpm)
Spring
(wcpm)
Avg. Weekly
Improvement
1st 90th -- 81 111 1.9
75th -- 47 82 2.2
50th -- 23 53 1.9
25th -- 12 28 1.0
10th -- 6 15 0.6
2nd 90th 106 125 142 1.1
75th 79 100 117 1.2
50th 51 72 89 1.2
25th 25 42 61 1.1
10th 11 18 31 0.6
3rd 90th 128 146 162 1.1
75th 99 120 137 1.2
50th 71 92 107 1.1
25th 44 62 78 1.1
10th 21 36 48 0.8

Growth for ELLs???Most of the research has focused on native Els vs ELLsWhat about growth rates for ELLs at various levels of English Proficiency?
HLM results:Significant differences between Beg Level and Early Advanced and Advanced ELP growth rates. Similar findings for Phonological Awareness and letter-sound correspondence (NWF).
Table 1
Gutierez and Vanderwood (2013)
Oral Reading Fluency Data – 2nd Grade ELLs
Grade English Language
Proficiency
Fall
(wcpm)
Winter
(wcpm)
Spring
(wcpm)
Weekly
Growth Rates
2nd Level 1
Beginning (n = 49)
30 36 46 .82
Level 2
Early Intermediate (n = 90)
43 53 63 .95
Level 3
Intermediate (n = 81)
58 68 78 .97
Level 4
Early Advanced (n = 30)
78 88 100 1.1
Level 5
Advanced (n = 10)
84 101 110 1.3
Rates for Early Advanced and
Advanced were similar to English-
proficient and native English
speaking students
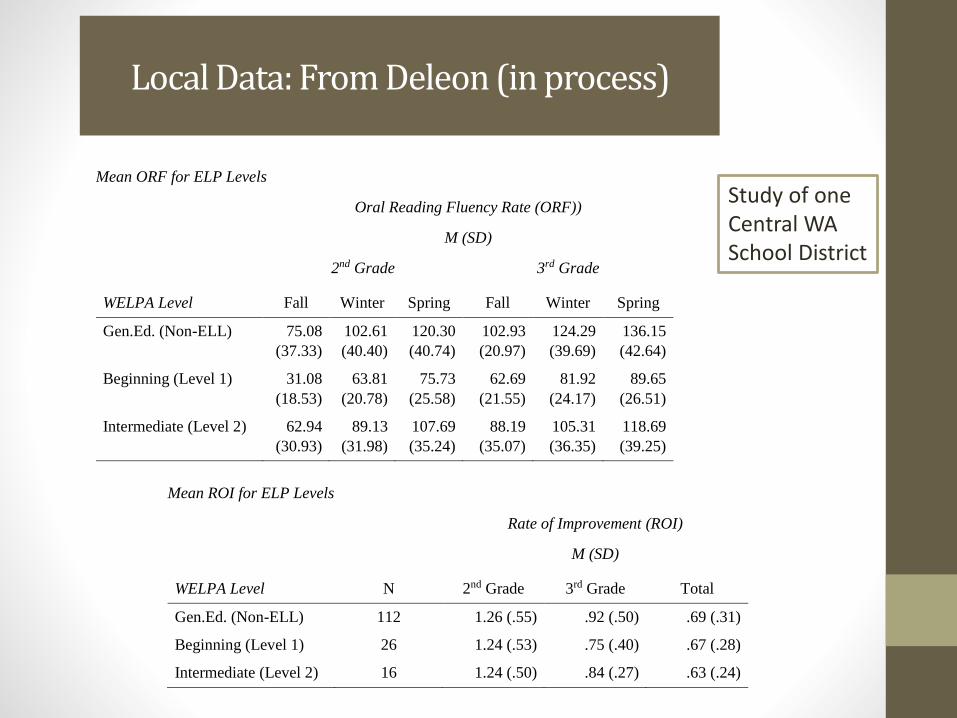
Local Data: From Deleon (in process)
Mean ROI for ELP Levels
Rate of Improvement (ROI)
M (SD)
WELPA Level N 2nd Grade 3rd Grade Total
Gen.Ed. (Non-ELL) 112 1.26 (.55) .92 (.50) .69 (.31)
Beginning (Level 1) 26 1.24 (.53) .75 (.40) .67 (.28)
Intermediate (Level 2) 16 1.24 (.50) .84 (.27) .63 (.24)
Mean ORF for ELP Levels
Oral Reading Fluency Rate (ORF))
M (SD)
2nd Grade 3rd Grade
WELPA Level Fall Winter Spring Fall Winter Spring
Gen.Ed. (Non-ELL) 75.08
(37.33)
102.61
(40.40)
120.30
(40.74)
102.93
(20.97)
124.29
(39.69)
136.15
(42.64)
Beginning (Level 1) 31.08
(18.53)
63.81
(20.78)
75.73
(25.58)
62.69
(21.55)
81.92
(24.17)
89.65
(26.51)
Intermediate (Level 2) 62.94
(30.93)
89.13
(31.98)
107.69
(35.24)
88.19
(35.07)
105.31
(36.35)
118.69
(39.25)
Study of one Central WA School District
BIG IDEA•Multi-tiered Systems of Support for ELLs
What we know about good screening and progress monitoring for native English speakers also applies to
English Language Learners (Gersten et al., 2007).
Research
• Issue identified in previous research: Confusion of teachers about when to refer – don’t want to refer too early because of concerns about overidentification (Klinger, 2005)
• Importance of clear referral processes – advantage of universal screening
• Referral does not have to mean referral to special ed, but does mean need for some type of intervention
Multi-tiered approach with ELLs (Fien et al., 2011)
• Goal of Multi-tiered approach: Increase reading achievement of ELLs and decrease misidentification.
• Key features:
• Provide differentiated instruction through manipulation of instructional intensity based on student need.
• Use screening and progress monitoring data to determine instructional need and responsiveness to manipulations of instructional intensity.
• Use evidence-based teaching programs and practices to ensure effective instruction.
• Make data-based decisions about effectiveness with attention to small group and individual benefit.

Fien et al., 2011
• BIG QUESTION: Are screeners appropriate for use with English speakers (DIBELS, easyCBM, etc.) also appropriate for use with ELLs?
• Emerging Research –• Project at Wisconsin Center for Educational Research
• Nonsense Word Fluency (NWF)• 19 of 24 correlations between NWF and a standardized reading achievement test
demonstrated no significant differences between English speakers and ELLs (Fien, 2011). Fluency, pseudoword reading can be a valuable screening for ELLs also.
• Oral Reading Fluency (ORF)• ORF predicted overall proficiency for both English speakers and ELLs at a similar rate
(Baker & Good, 1995).
Progress Monitoring (Fien et al. 2011)
• Oral Reading Fluency• Assessed English speakers on ORF in English and ELLs on ORF in English
and Spanish in grades 1 to 5. English speakers demonstrated greater growth in early grades, but received more instructional time. In later grades, when they had similar instructional
May be important to consider ELP level when giving and interpreting DIBELS screening results (Gutierrez & Vanderwood, 2013)