Embed Size (px)
Citation preview

1
Engineering Tripos Part IA First Year
Paper 2 - MATERIALS
HANDOUT 5
8. Manufacturing Processes, Process Selection
8.1 Hierarchy of Manufacturing Processes8.2 Process Selection
Process AttributesProcedure for preliminary process selection
9. Environmental Impact of Materials
Life Cycle Assessment
This handout covers the material for Examples Paper 4, Q.8-10
H.R. [email protected] March 2014
References/software:
Materials: Engineering, Science, Processing and Design – Chapters 2, 18, 20 Ashby MF, Shercliff HR and Cebon D(Butterworth-Heinemann, 1st, 2nd or 3rd edition)
Cambridge Engineering Selector (CES) – downloadable(Process images and descriptions)
CD: Material Selection and Processing – on PWF(Animations of manufacturing processes)
8. MANUFACTURING PROCESSES, PROCESS SELECTION
8.1 Hierarchy of Manufacturing Processes
Manufacturing processes are classified by:
• the function they provide
• the underlying physics of how they work.
Top level hierarchy of process functions:
Primary shaping: turn raw material into componentsSecondary processes: add features to components; modify bulk propertiesJoining: assemble components into productsSurface treatment: modify surface properties
How do the processes work?
Engineers need a working knowledge of the main manufacturing processes.
There is no shortage of information to find this out (textbooks, Web, CES); even better: go and see manufacturing in action for yourself.
Blow mouldingBlow moulding
It is straightforward to summarise the physical basis of the different process families.
e.g. primary shaping:
casting: pour liquid (metal), solidify and cool, remove mould
forming: plastically deform solid (metal) to shape (hot or cold)
powder: fill die with powder (ceramic, metal) and hot press
moulding: viscous flow of molten polymer (or glass)
Choice of shaping process can be strongly influenced by geometric characteristics of the components being shaped.
2
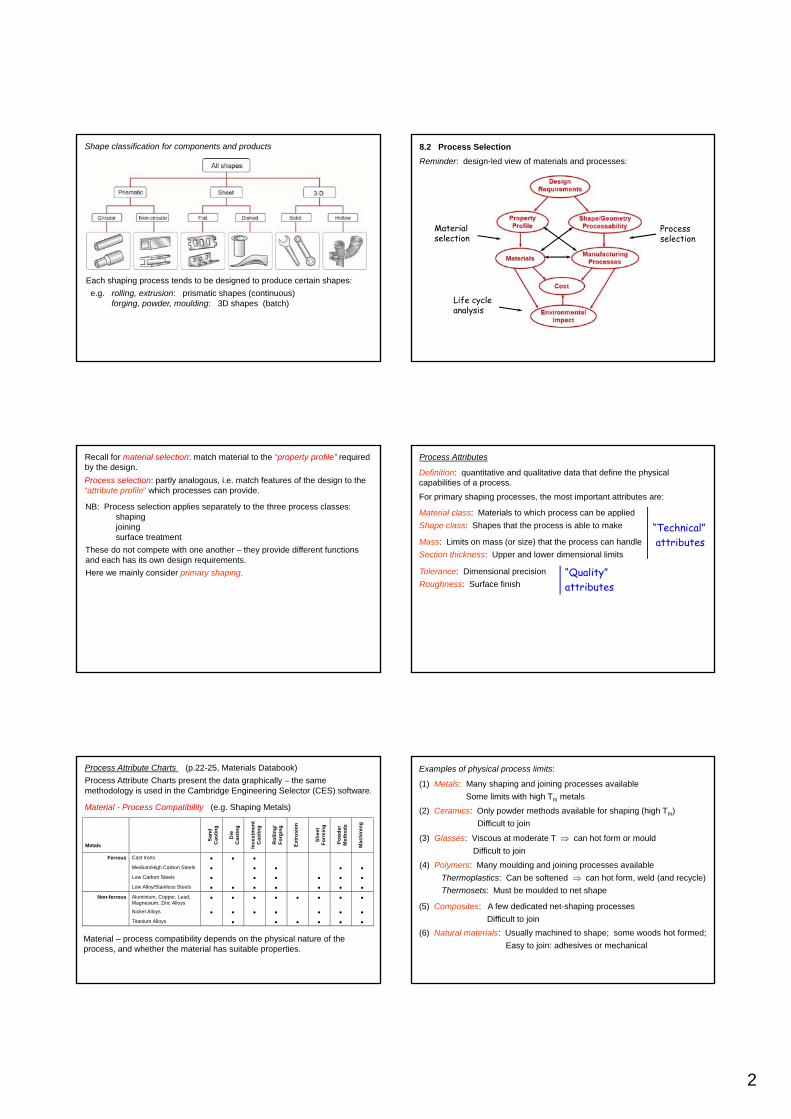
Shape classification for components and products
Each shaping process tends to be designed to produce certain shapes:
e.g. rolling, extrusion: prismatic shapes (continuous)forging, powder, moulding: 3D shapes (batch)
Materialselection
Processselection
Life cycle analysis
8.2 Process Selection
Reminder: design-led view of materials and processes:
Recall for material selection: match material to the “property profile” required by the design.
NB: Process selection applies separately to the three process classes: shapingjoiningsurface treatment
These do not compete with one another – they provide different functions and each has its own design requirements.
Here we mainly consider primary shaping.
Process selection: partly analogous, i.e. match features of the design to the “attribute profile" which processes can provide.
Process Attributes
Definition: quantitative and qualitative data that define the physical capabilities of a process.
For primary shaping processes, the most important attributes are:
Material class: Materials to which process can be applied
Shape class: Shapes that the process is able to make
Mass: Limits on mass (or size) that the process can handle
Section thickness: Upper and lower dimensional limits
Tolerance: Dimensional precision
Roughness: Surface finish
“Technical”attributes
“Quality”attributes
Process Attribute Charts (p.22-25, Materials Databook)
Process Attribute Charts present the data graphically – the same methodology is used in the Cambridge Engineering Selector (CES) software.
Material - Process Compatibility (e.g. Shaping Metals)
Metals
San
d
Cas
tin
g
Die
C
asti
ng
Inv
estm
ent
Cas
tin
g
Ro
llin
g/
Fo
rgin
g
Ext
rusi
on
Sh
eet
Fo
rmin
g
Po
wd
er
Me
tho
ds
Ma
chin
ing
Ferrous Cast Irons
Medium/High Carbon Steels Low Carbon Steels Low Alloy/Stainless Steels
Non-ferrous Aluminium, Copper, Lead, Magnesium, Zinc Alloys
Nickel Alloys Titanium Alloys
Material – process compatibility depends on the physical nature of the process, and whether the material has suitable properties.
Examples of physical process limits:
(1) Metals: Many shaping and joining processes available
Some limits with high Tm metals
(2) Ceramics: Only powder methods available for shaping (high Tm)
Difficult to join
(3) Glasses: Viscous at moderate T can hot form or mould
Difficult to join
(4) Polymers: Many moulding and joining processes available
Thermoplastics: Can be softened can hot form, weld (and recycle)
Thermosets: Must be moulded to net shape
(5) Composites: A few dedicated net-shaping processes
Difficult to join
(6) Natural materials: Usually machined to shape; some woods hot formed;
Easy to join: adhesives or mechanical
3
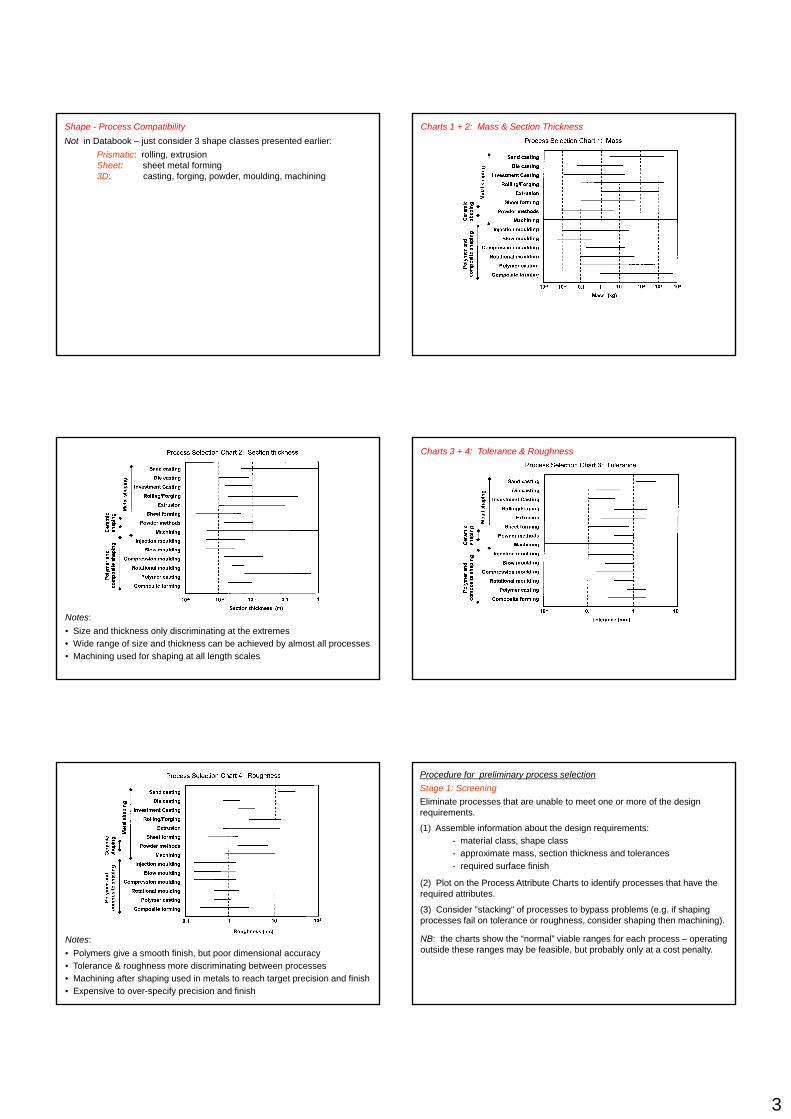
Shape - Process Compatibility
Not in Databook – just consider 3 shape classes presented earlier:
Prismatic: rolling, extrusionSheet: sheet metal forming 3D: casting, forging, powder, moulding, machining
Charts 1 + 2: Mass & Section Thickness
Notes:
• Size and thickness only discriminating at the extremes
• Wide range of size and thickness can be achieved by almost all processes
• Machining used for shaping at all length scales
Charts 3 + 4: Tolerance & Roughness
Notes:
• Polymers give a smooth finish, but poor dimensional accuracy
• Tolerance & roughness more discriminating between processes
• Machining after shaping used in metals to reach target precision and finish
• Expensive to over-specify precision and finish
Procedure for preliminary process selection
Stage 1: Screening
Eliminate processes that are unable to meet one or more of the design requirements.
(1) Assemble information about the design requirements:
- material class, shape class
- approximate mass, section thickness and tolerances
- required surface finish
(2) Plot on the Process Attribute Charts to identify processes that have the(2) Plot on the Process Attribute Charts to identify processes that have the required attributes.
(3) Consider "stacking" of processes to bypass problems (e.g. if shaping processes fail on tolerance or roughness, consider shaping then machining).
NB: the charts show the “normal” viable ranges for each process – operating outside these ranges may be feasible, but probably only at a cost penalty.

4
Example: Process selection for a connecting rod
Assume preliminary material selection has been made, based on:
• resistance to buckling
• fatigue strength, at minimum weight
• specified length and approximate cross-sectiondimensions
Chosen material: Medium carbon steelProcess route?
Shape:
Mass (from approx. dimensions, and density):
Minimum section thickness:
Tolerance:
Surface roughness:
500g10mm
+ 0.25 mm ( + 0.02 mm )< 5 m
(or better)
Complex 3D shape
Material - Process Compatibility
Most metal shaping processes OK: eliminate die casting and extrusion.
Shape - Process Compatibility
3D shape: eliminate prismatic processes (rolling, extrusion) & sheet forming.
Chart 1: Mass 500g
Sand casting: outside normal viable range
Chart 2: Section Thickness 10mm
Die casting: outside normal viable range
Investment casting/powder methods: on limit of normal range
Chart 3: Tolerance 0.02mm 0.25mm
Sand casting/forging/powder: unable to achieve target tolerance of 0.25mm- must follow by machining
To achieve bore hole tolerance of 0.02mm – must use machining
Chart 4: Roughness 5m
Sand casting: unable to achieve target roughness of 5m- must follow by machining
5
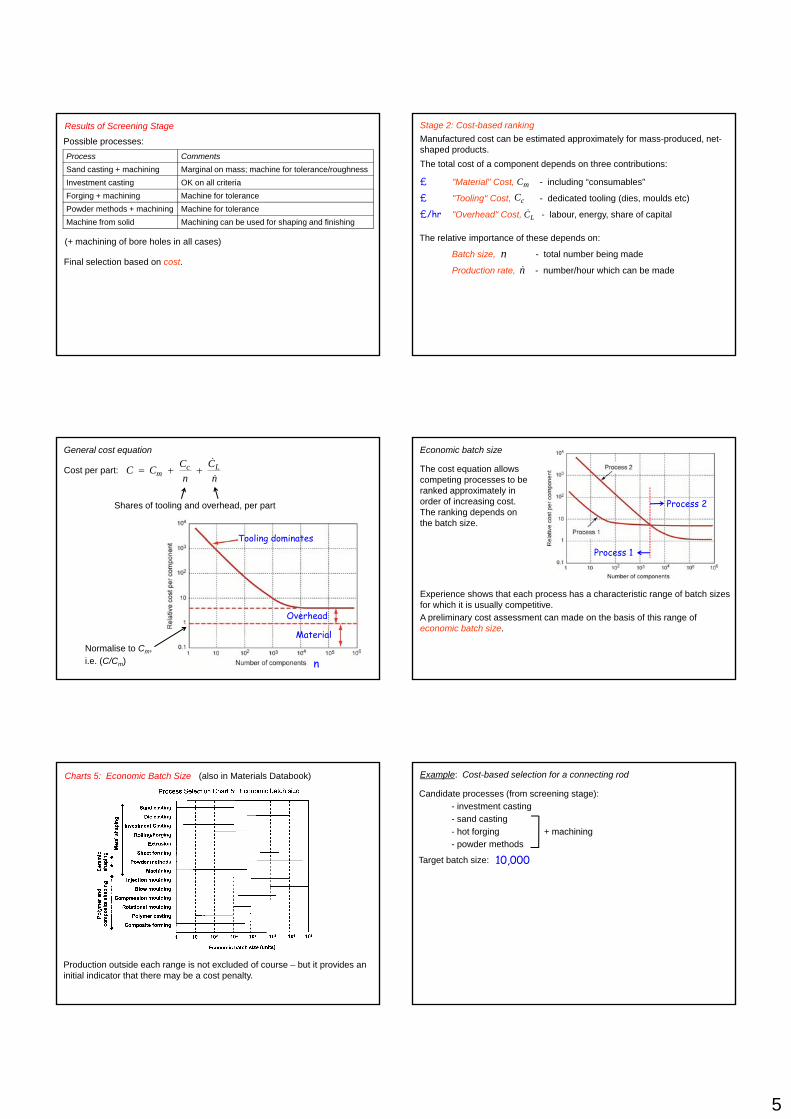
Results of Screening Stage
Possible processes:
Process Comments
Sand casting + machining Marginal on mass; machine for tolerance/roughness
Investment casting OK on all criteria
Forging + machining Machine for tolerance
Powder methods + machining Machine for tolerance
Machine from solid Machining can be used for shaping and finishing
(+ machining of bore holes in all cases)
Final selection based on cost.
Stage 2: Cost-based ranking
Manufactured cost can be estimated approximately for mass-produced, net-shaped products.
The total cost of a component depends on three contributions:
"Material" Cost, - including “consumables”
"Tooling" Cost, - dedicated tooling (dies, moulds etc)
"Overhead" Cost, - labour, energy, share of capital
£
£
£/hr
mC
cC
LC
The relative importance of these depends on:
Batch size, - total number being made
Production rate, - number/hour which can be made
n
n
General cost equation
Cost per part:n
C
n
CCC Lc
m
Shares of tooling and overhead, per part
Tooling dominates
Normalise to Cm,
i.e. (C/Cm)
Overhead
Material
n
Economic batch size
The cost equation allows competing processes to be ranked approximately in order of increasing cost. The ranking depends on the batch size.
Process 2
Process 1
Experience shows that each process has a characteristic range of batch sizes for which it is usually competitive.
A preliminary cost assessment can made on the basis of this range of economic batch size.
Charts 5: Economic Batch Size (also in Materials Databook)
Production outside each range is not excluded of course – but it provides an initial indicator that there may be a cost penalty.
Example: Cost-based selection for a connecting rod
Candidate processes (from screening stage):
- investment casting
- sand casting
- hot forging + machining
- powder methods
10,000Target batch size:

6
(1) Preliminary assessment: Economic batch size
10,000
Sand casting/investment casting: usually economic for smaller batches
Forging/powder methods: both OK
(2) Detailed cost analysis: Cost equation
Compare Forging, Powder Methods and one casting option, Sand Casting.
Sand Casting Hot Forging Powder Methods
Material Cost, Cm 1 1 1
Tooling Cost, Cc 6,000 30,000 60,000
Overhead Cost, (hr-1) 60 30 10
Production rate, (hr-1) 10 200 50nLC
Substitute into cost equation, and plot cost per part against batch size nSubstitute into cost equation, and plot cost per part against batch size n
10
100
1000
10000
100000
co
st
per
part
Sand casting
Hot forging
Powder methods
Hot forging
Sand casting
Cost ranking for target batch size of 10,000 (cheapest first):
Choose Hot forging
1
1 10 100 1000 10000 100000 1000000
batch size
g
Hot forging
Powder methods
Sand casting
1
© MFA/HRS 2014
University of Cambridge
Paper 2: Materials
Environmental Impact of Materials,
Life Cycle Assessment
Engineering Tripos, Part IA
March 2014
M.F. Ashby
H.R. Shercliff
HANDOUT 5
1
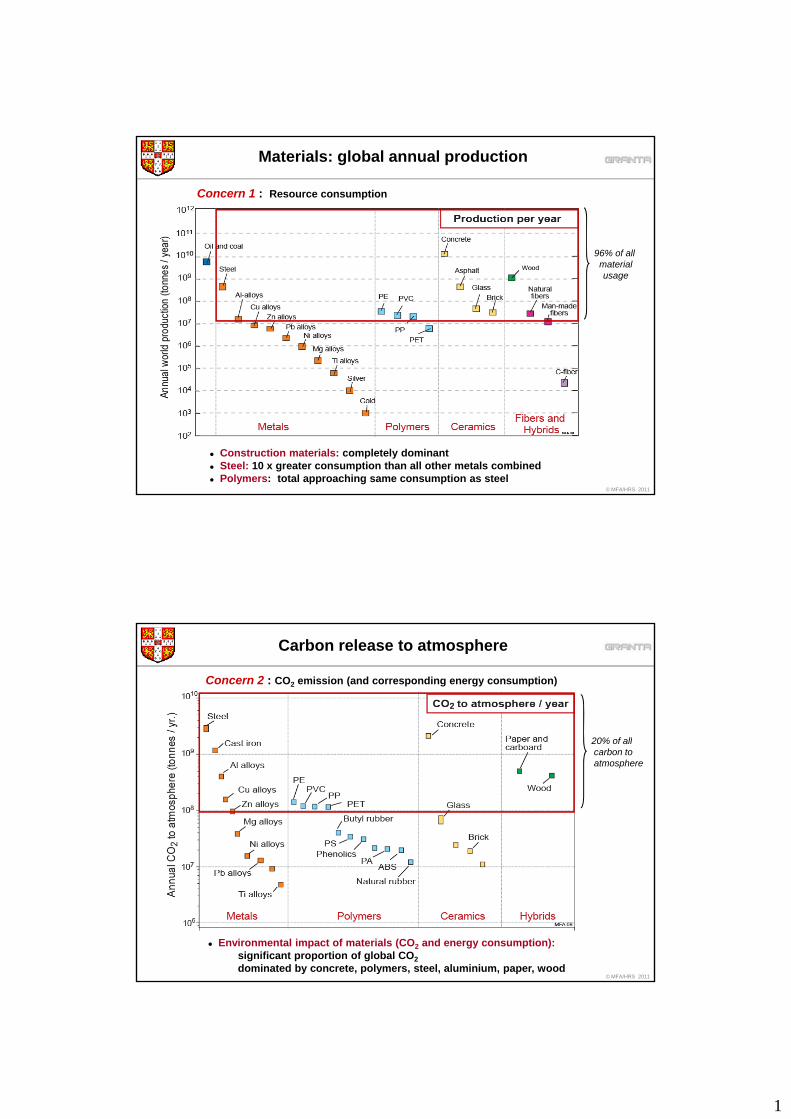
Concern 1 : Resource consumption
96% of all
Materials: global annual production
96% of all material usage
© MFA/HRS 2011
Construction materials: completely dominant Steel: 10 x greater consumption than all other metals combined Polymers: total approaching same consumption as steel
Carbon release to atmosphere
Concern 2 : CO2 emission (and corresponding energy consumption)
20% of all20% of allcarbon toatmosphere
© MFA/HRS 2011
Environmental impact of materials (CO2 and energy consumption): significant proportion of global CO2
dominated by concrete, polymers, steel, aluminium, paper, wood
2
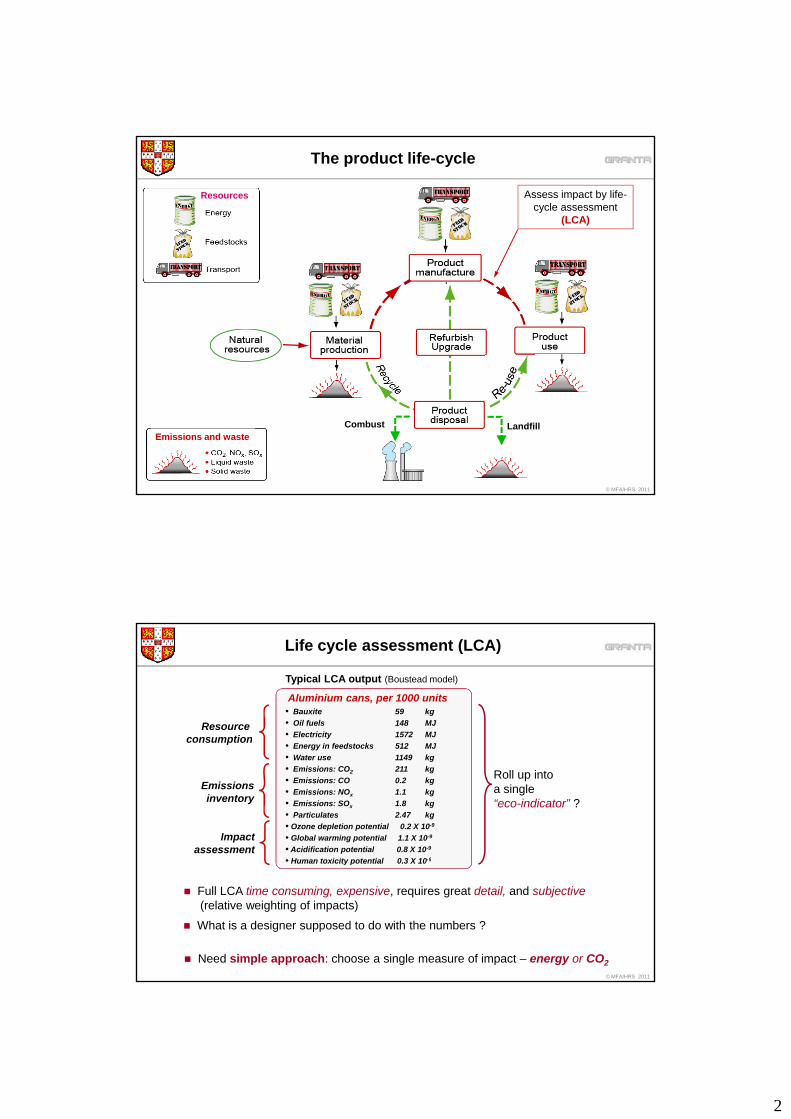
The product life-cycle
Assess impact by life-cycle assessment
(LCA)
Resources
© MFA/HRS 2011
LandfillCombustEmissions and waste
Typical LCA output (Boustead model)
Aluminium cans, per 1000 units• Bauxite 59 kg
• Oil fuels 148 MJ
• Electricity 1572 MJ
Life cycle assessment (LCA)
Resource consumption
• Energy in feedstocks 512 MJ
• Water use 1149 kg
• Emissions: CO2 211 kg
• Emissions: CO 0.2 kg
• Emissions: NOx 1.1 kg
• Emissions: SOx 1.8 kg
• Particulates 2.47 kg
• Ozone depletion potential 0.2 X 10⁻⁹
• Global warming potential 1.1 X 10⁻⁹
• Acidification potential 0.8 X 10⁻⁹
• Human toxicity potential 0 3 X 10⁻⁹
Roll up intoa single“eco-indicator” ?
consumption
Emissionsinventory
Impactassessment
© MFA/HRS 2011
Human toxicity potential 0.3 X 10
Full LCA time consuming, expensive, requires great detail, and subjective (relative weighting of impacts)
Need simple approach: choose a single measure of impact – energy or CO2
What is a designer supposed to do with the numbers ?
3
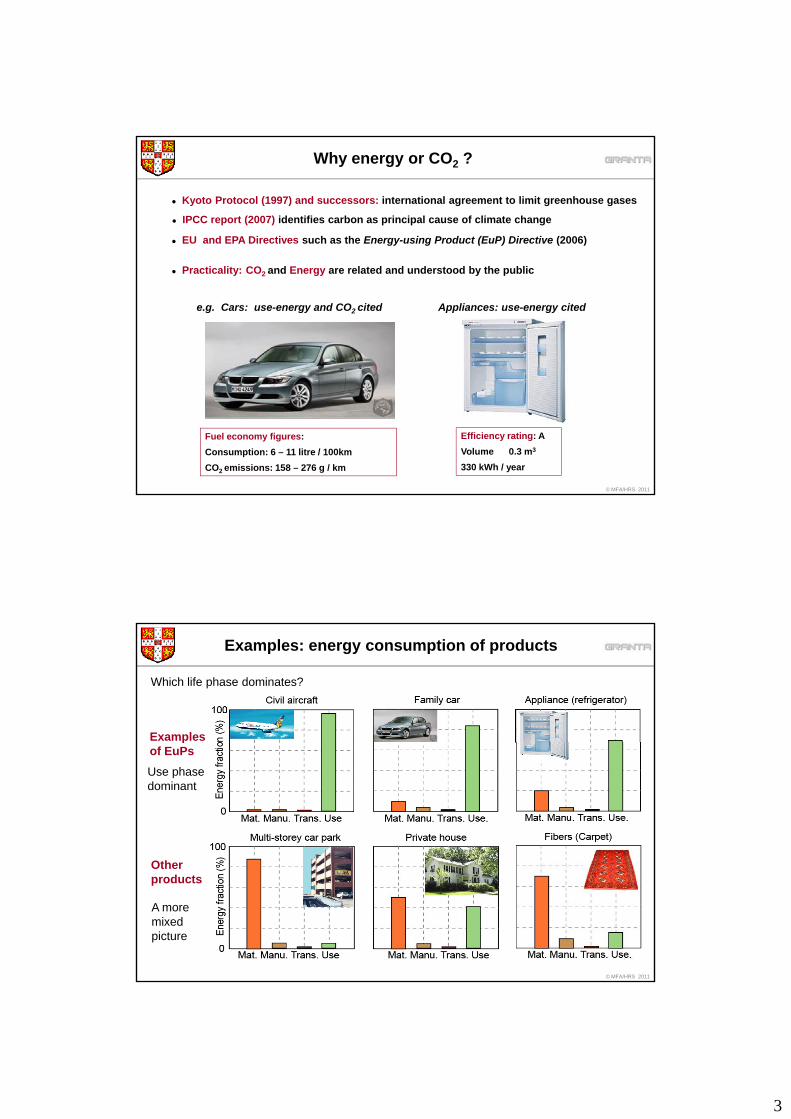
Why energy or CO2 ?
Kyoto Protocol (1997) and successors: international agreement to limit greenhouse gases
EU and EPA Directives such as the Energy-using Product (EuP) Directive (2006)
IPCC report (2007) identifies carbon as principal cause of climate change
Practicality: CO2 and Energy are related and understood by the public
e.g. Cars: use-energy and CO2 cited Appliances: use-energy cited
© MFA/HRS 2011
Fuel economy figures:
Consumption: 6 – 11 litre / 100km
CO2 emissions: 158 – 276 g / km
Efficiency rating: A
Volume 0.3 m3
330 kWh / year
Examples: energy consumption of products
Which life phase dominates?
Examplespof EuPs
Use phasedominant
Oth
© MFA/HRS 2011
Otherproducts
A more mixed picture
4
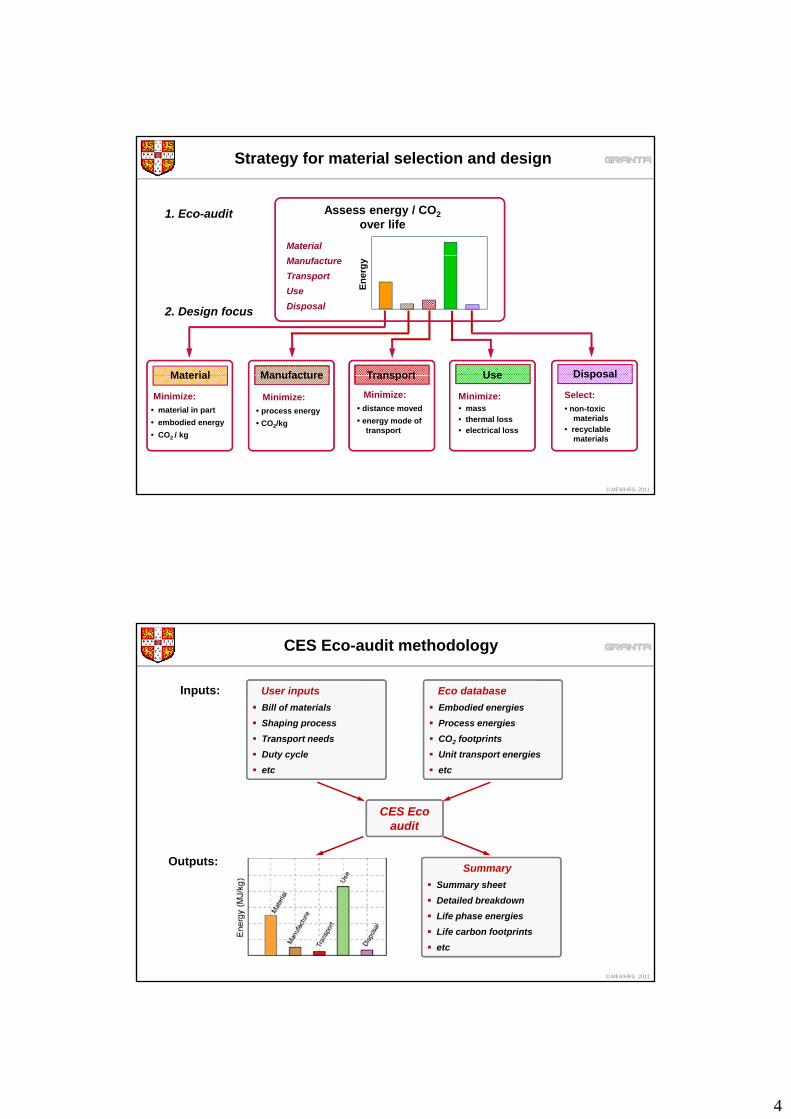
Material
Assess energy / CO2
over life
Strategy for material selection and design
1. Eco-audit
Manufacture
Transport
Use
Disposal
En
erg
y
Use DisposalManufacture
2. Design focus
Material Transport
© MFA/HRS 2011
Minimize:• mass• thermal loss• electrical loss
Use Disposal
Select:
• non-toxicmaterials
• recyclable materials
Minimize:
• process energy
• CO2/kg
ManufactureMaterial
Minimize:
• material in part
• embodied energy
• CO2 / kg
Minimize:
• distance moved
• energy mode oftransport
Transport
CES Eco-audit methodology
Eco database
Embodied energies
Process energies
CO2 footprints
User inputs
Bill of materials
Shaping process
Transport needs
Inputs:
2 p
Unit transport energies
etc
p
Duty cycle
etc
CES Eco audit
Outputs:
© MFA/HRS 2011
Outputs:Summary
Summary sheet
Detailed breakdown
Life phase energies
Life carbon footprints
etc
5
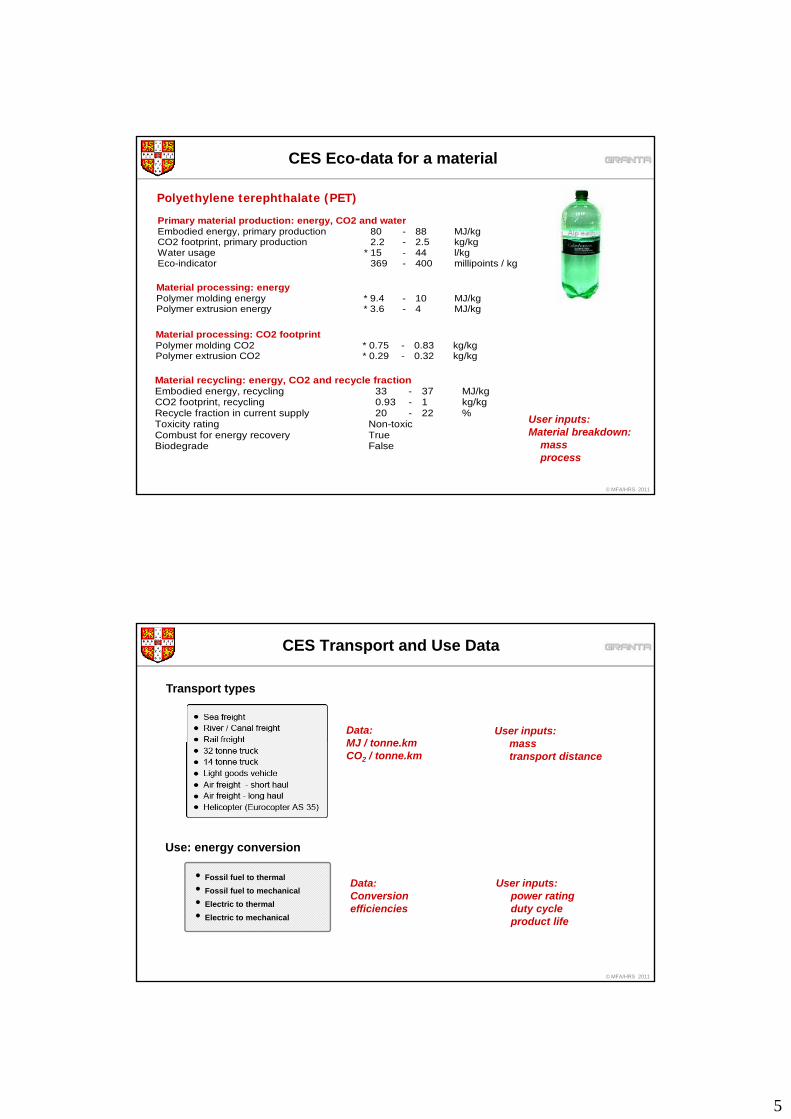
CES Eco-data for a material
Primary material production: energy, CO2 and waterEmbodied energy, primary production 80 - 88 MJ/kg CO2 footprint, primary production 2.2 - 2.5 kg/kg Water usage * 15 - 44 l/kg
Polyethylene terephthalate (PET)
Water usage 15 44 l/kgEco-indicator 369 - 400 millipoints / kg
Material processing: energy Polymer molding energy * 9.4 - 10 MJ/kg Polymer extrusion energy * 3.6 - 4 MJ/kg
Material processing: CO2 footprint Polymer molding CO2 * 0.75 - 0.83 kg/kg Polymer extrusion CO2 * 0.29 - 0.32 kg/kg
© MFA/HRS 2011
Material recycling: energy, CO2 and recycle fractionEmbodied energy, recycling 33 - 37 MJ/kg CO2 footprint, recycling 0.93 - 1 kg/kg Recycle fraction in current supply 20 - 22 % Toxicity rating Non-toxic Combust for energy recovery True Biodegrade False
User inputs:Material breakdown:
massprocess
CES Transport and Use Data
Transport types
Data:MJ / tonne km
User inputs:massMJ / tonne.km
CO2 / tonne.km
Use: energy conversion
mass transport distance
© MFA/HRS 2011
• Fossil fuel to thermal
• Fossil fuel to mechanical
• Electric to thermal
• Electric to mechanical
Data:Conversionefficiencies
User inputs:power rating duty cycleproduct life
6
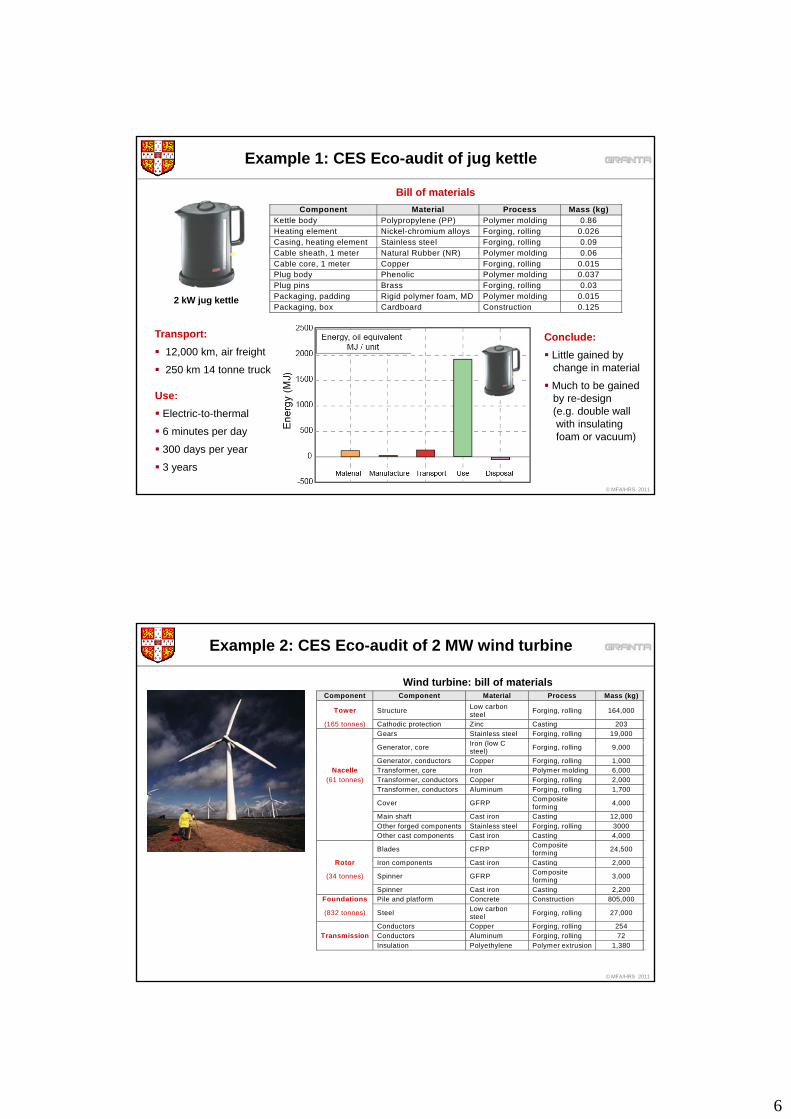
Example 1: CES Eco-audit of jug kettle
Component Material Process Mass (kg) Kettle body Polypropylene (PP) Polymer molding 0.86 Heating element Nickel-chromium alloys Forging, rolling 0.026 Casing, heating element Stainless steel Forging, rolling 0.09 Cable sheath, 1 meter Natural Rubber (NR) Polymer molding 0.06
Bill of materials
Cable sheath, 1 meter Natural Rubber (NR) Polymer molding 0.06 Cable core, 1 meter Copper Forging, rolling 0.015 Plug body Phenolic Polymer molding 0.037 Plug pins Brass Forging, rolling 0.03 Packaging, padding Rigid polymer foam, MD Polymer molding 0.015 Packaging, box Cardboard Construction 0.125
2 kW jug kettle
Transport:
12,000 km, air freight
250 km 14 tonne truck
Conclude:
Little gained bychange in material
© MFA/HRS 2011
Use:
Electric-to-thermal
6 minutes per day
300 days per year
3 years
Much to be gainedby re-design(e.g. double wall with insulating foam or vacuum)
Example 2: CES Eco-audit of 2 MW wind turbine
Component Component Material Process Mass (kg)
Tower Structure Low carbon steel
Forging, rolling 164,000
(165 tonnes) Cathodic protection Zinc Casting 203 Gears Stainless steel Forging, rolling 19,000
Iron (low C
Wind turbine: bill of materials
Generator, core Iron (low C steel)
Forging, rolling 9,000
Generator, conductors Copper Forging, rolling 1,000 Nacelle Transformer, core Iron Polymer molding 6,000
(61 tonnes) Transformer, conductors Copper Forging, rolling 2,000 Transformer, conductors Aluminum Forging, rolling 1,700
Cover GFRP Composite forming
4,000
Main shaft Cast iron Casting 12,000
Other forged components Stainless steel Forging, rolling 3000 Other cast components Cast iron Casting 4,000
Blades CFRP Composite forming
24,500
Rotor Iron components Cast iron Casting 2 000
© MFA/HRS 2011
Rotor Iron components Cast iron Casting 2,000
(34 tonnes) Spinner GFRP Composite forming
3,000
Spinner Cast iron Casting 2,200 Foundations Pile and platform Concrete Construction 805,000
(832 tonnes) Steel Low carbon steel
Forging, rolling 27,000
Conductors Copper Forging, rolling 254 Transmission Conductors Aluminum Forging, rolling 72
Insulation Polyethylene Polymer extrusion 1,380
7
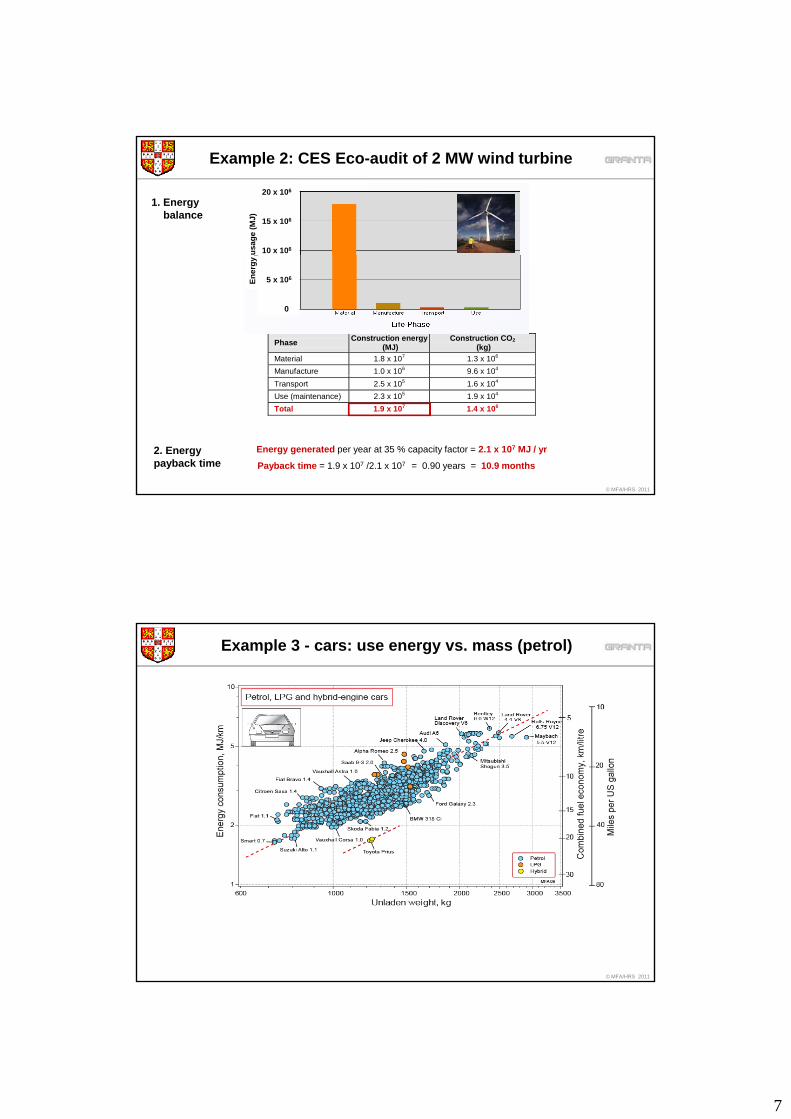
1. Energy balance
Example 2: CES Eco-audit of 2 MW wind turbine
20 x 106
15 x 106
10 x 106us
ag
e (
MJ
)
Phase Construction energy
(MJ) Construction CO2
(kg)
Material 1.8 x 10⁷ 1.3 x 10⁶
Manufacture 1.0 x 10⁶ 9.6 x 10⁴
5 x 10⁶
0
En
erg
y
© MFA/HRS 2011
2. Energy payback time
Energy generated per year at 35 % capacity factor = 2.1 x 10⁷ MJ / yr
Payback time = 1.9 x 10⁷ /2.1 x 107 = 0.90 years = 10.9 months
Transport 2.5 x 10⁵ 1.6 x 10⁴
Use (maintenance) 2.3 x 10⁵ 1.9 x 10⁴
Total 1.9 x 10⁷ 1.4 x 10⁶
Example 3 - cars: use energy vs. mass (petrol)
© MFA/HRS 2011
8
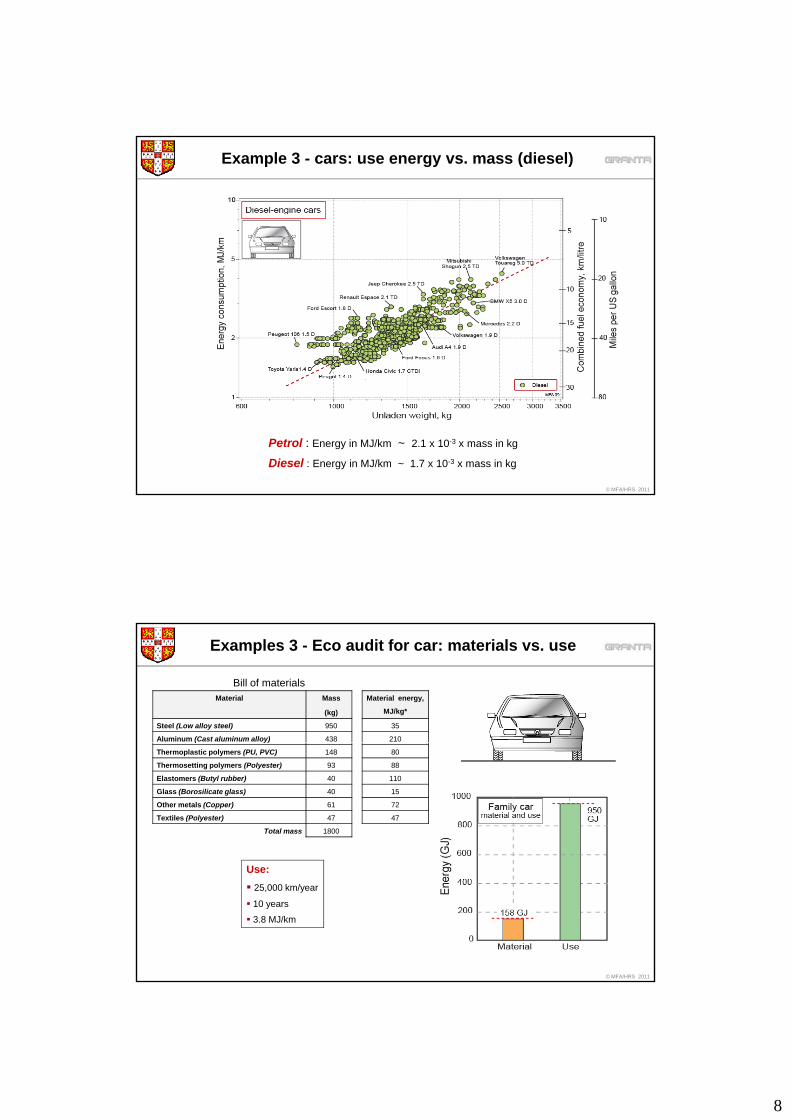
Example 3 - cars: use energy vs. mass (diesel)
© MFA/HRS 2011
Petrol : Energy in MJ/km ~ 2.1 x 10⁻³ x mass in kg
Diesel : Energy in MJ/km ~ 1.7 x 10⁻³ x mass in kg
Examples 3 - Eco audit for car: materials vs. use
Material Mass
(kg)
Material energy,
MJ/kg*
Steel (Low alloy steel) 950 35
Aluminum (Cast aluminum alloy) 438 210
Bill of materials
( y)
Thermoplastic polymers (PU, PVC) 148 80
Thermosetting polymers (Polyester) 93 88
Elastomers (Butyl rubber) 40 110
Glass (Borosilicate glass) 40 15
Other metals (Copper) 61 72
Textiles (Polyester) 47 47
Total mass 1800
© MFA/HRS 2011
Use:
25,000 km/year
10 years
3.8 MJ/km
1
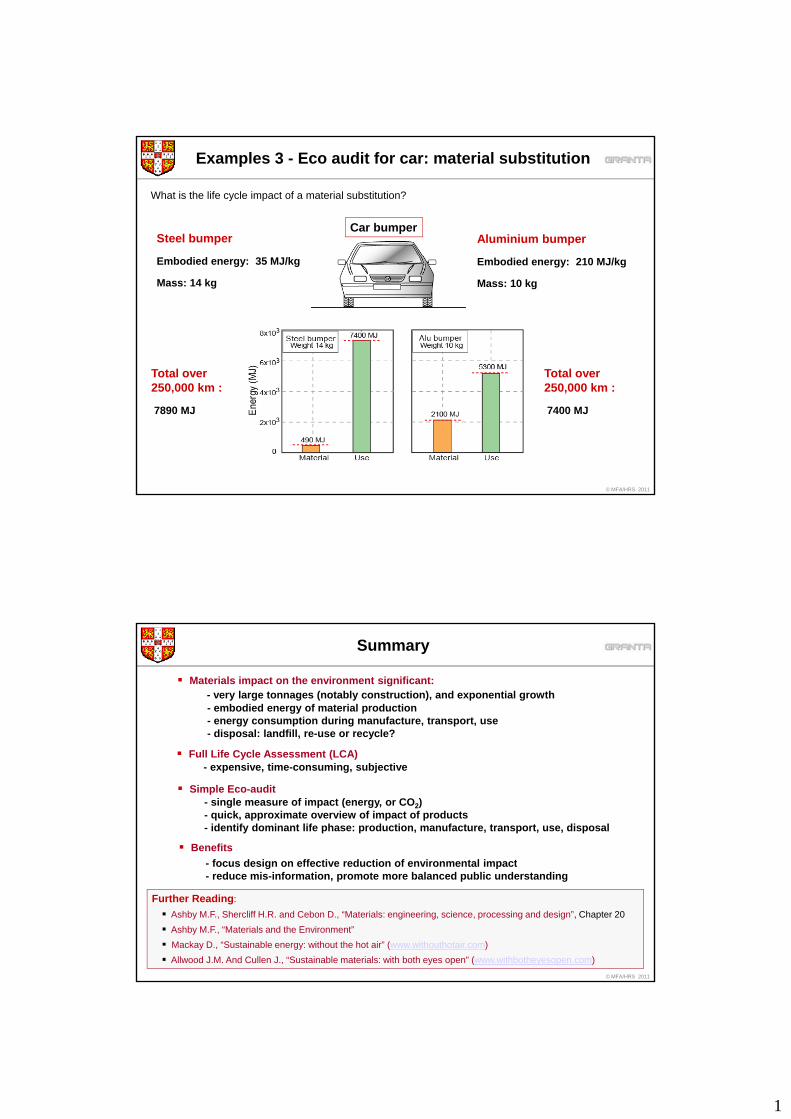
Examples 3 - Eco audit for car: material substitution
Car bumperSteel bumper Aluminium bumper
What is the life cycle impact of a material substitution?
Embodied energy: 35 MJ/kg
Mass: 14 kg
Embodied energy: 210 MJ/kg
Mass: 10 kg
Total over Total over
© MFA/HRS 2011
Total over 250,000 km :
7890 MJ
Total over 250,000 km :
7400 MJ
Summary
Materials impact on the environment significant:- very large tonnages (notably construction), and exponential growth- embodied energy of material production - energy consumption during manufacture, transport, use- disposal: landfill, re-use or recycle?
Full Life Cycle Assessment (LCA)- expensive, time-consuming, subjective
Simple Eco-audit- single measure of impact (energy, or CO2)- quick, approximate overview of impact of products- identify dominant life phase: production, manufacture, transport, use, disposal
Benefits
focus design on effective reduction of environmental impact
© MFA/HRS 2011
- focus design on effective reduction of environmental impact- reduce mis-information, promote more balanced public understanding
Further Reading:
Ashby M.F., Shercliff H.R. and Cebon D., “Materials: engineering, science, processing and design”, Chapter 20
Ashby M.F., “Materials and the Environment”
Mackay D., “Sustainable energy: without the hot air” (www.withouthotair.com)
Allwood J.M. And Cullen J., “Sustainable materials: with both eyes open” (www.withbotheyesopen.com)