Embed Size (px)
Citation preview
Engaging Minds, Exchanging Ideas
ENGAGING MINDS, EXCHANGING IDEAS
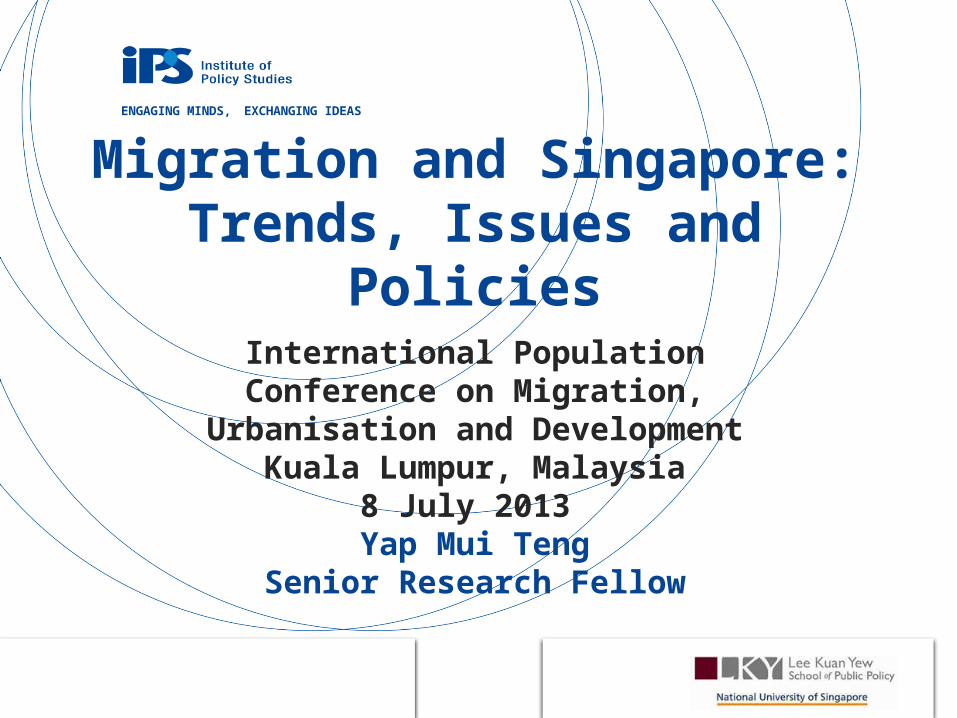
Migration and Singapore: Trends, Issues and Policies
International Population Conference on Migration, Urbanisation and Development
Kuala Lumpur, Malaysia8 July 2013
Yap Mui TengSenior Research Fellow
Engaging Minds, Exchanging Ideas
Introduction
• Immigration highly topical and highly controversial issue in recent years
• “Angst and anxieties”• Immigration in GE2011• The level of unhappiness expressed has been
unprecedented – the trigger appears to be the influx of foreigners allowed into the country for employment and residence in the second half of the decade of the 2000s.
Engaging Minds, Exchanging Ideas
ENGAGING MINDS, EXCHANGING IDEAS
Trends
Engaging Minds, Exchanging Ideas
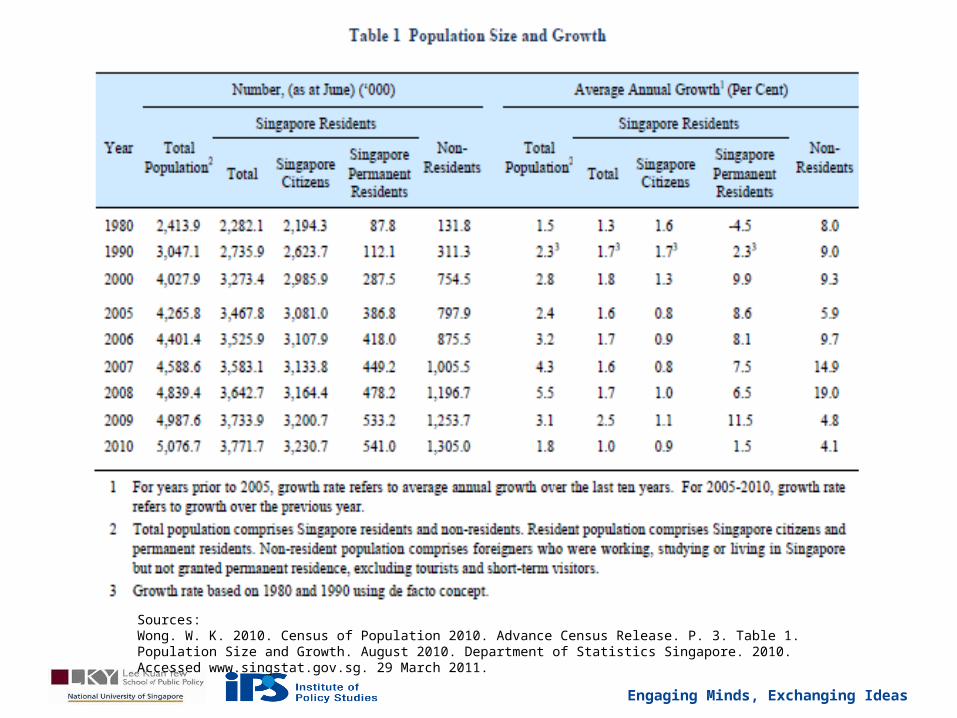
Wong. W. K. 2010. Census of Population 2010. Advance Census Release. P. 3. Table 1. Population Size and Growth. August 2010. Department of Statistics Singapore. 2010. Accessed www.singstat.gov.sg. 29 March 2011.
Sources:
Engaging Minds, Exchanging Ideas
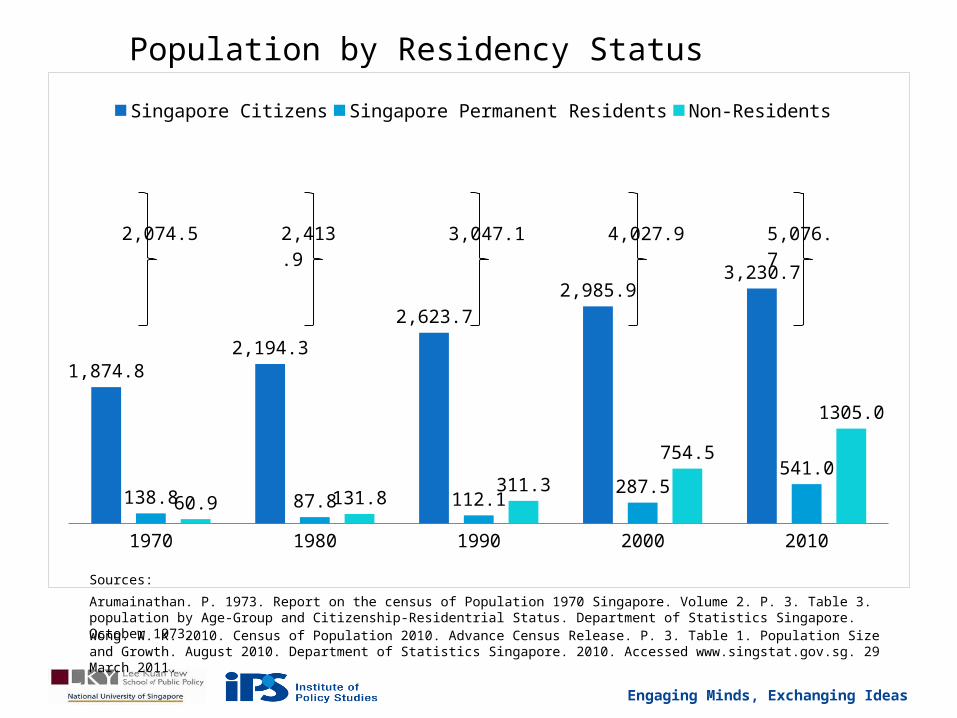
1970 1980 1990 2000 2010
1,874.82,194.3
2,623.7
2,985.93,230.7
138.8 87.8 112.1287.5
541.0
60.9 131.8311.3
754.5
1305.0
Singapore Citizens Singapore Permanent Residents Non-Residents
2,074.5 2,413.9
3,047.1 4,027.9 5,076.7
Population by Residency Status
Arumainathan. P. 1973. Report on the census of Population 1970 Singapore. Volume 2. P. 3. Table 3. population by Age-Group and Citizenship-Residentrial Status. Department of Statistics Singapore. October 1973.Wong. W. K. 2010. Census of Population 2010. Advance Census Release. P. 3. Table 1. Population Size and Growth. August 2010. Department of Statistics Singapore. 2010. Accessed www.singstat.gov.sg. 29 March 2011.
Sources:
Engaging Minds, Exchanging Ideas
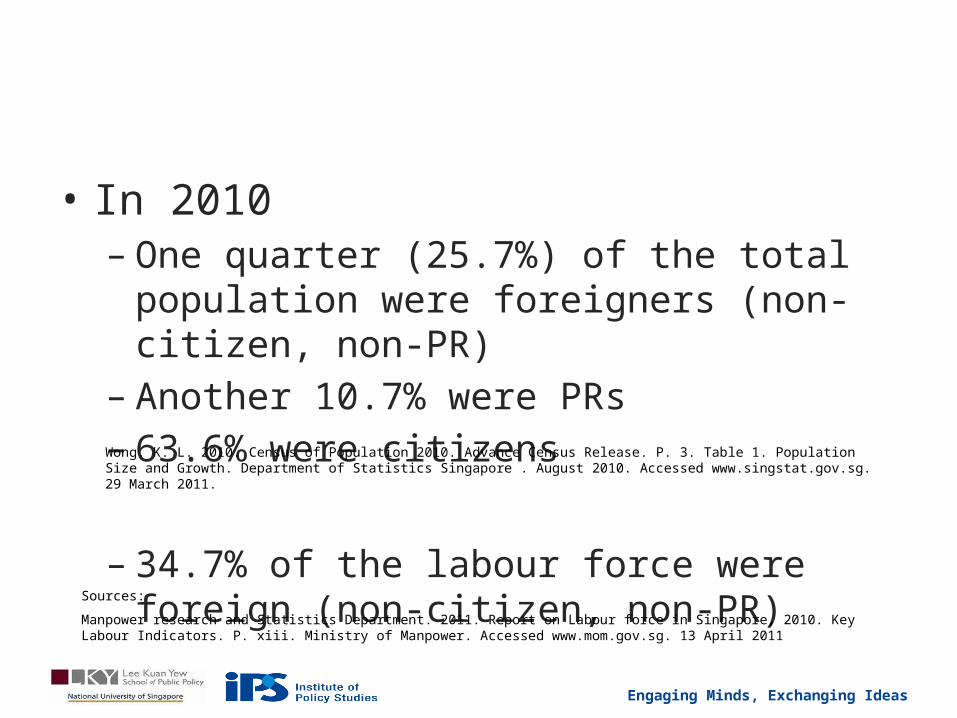
• In 2010– One quarter (25.7%) of the total population were
foreigners (non-citizen, non-PR)– Another 10.7% were PRs– 63.6% were citizens
– 34.7% of the labour force were foreign (non-citizen, non-PR)
Manpower research and Statistics Department. 2011. Report on Labour force in Singapore, 2010. Key Labour Indicators. P. xiii. Ministry of Manpower. Accessed www.mom.gov.sg. 13 April 2011
Wong. K. L. 2010. Census of Population 2010. Advance Census Release. P. 3. Table 1. Population Size and Growth. Department of Statistics Singapore . August 2010. Accessed www.singstat.gov.sg. 29 March 2011.
Sources:
Engaging Minds, Exchanging Ideas
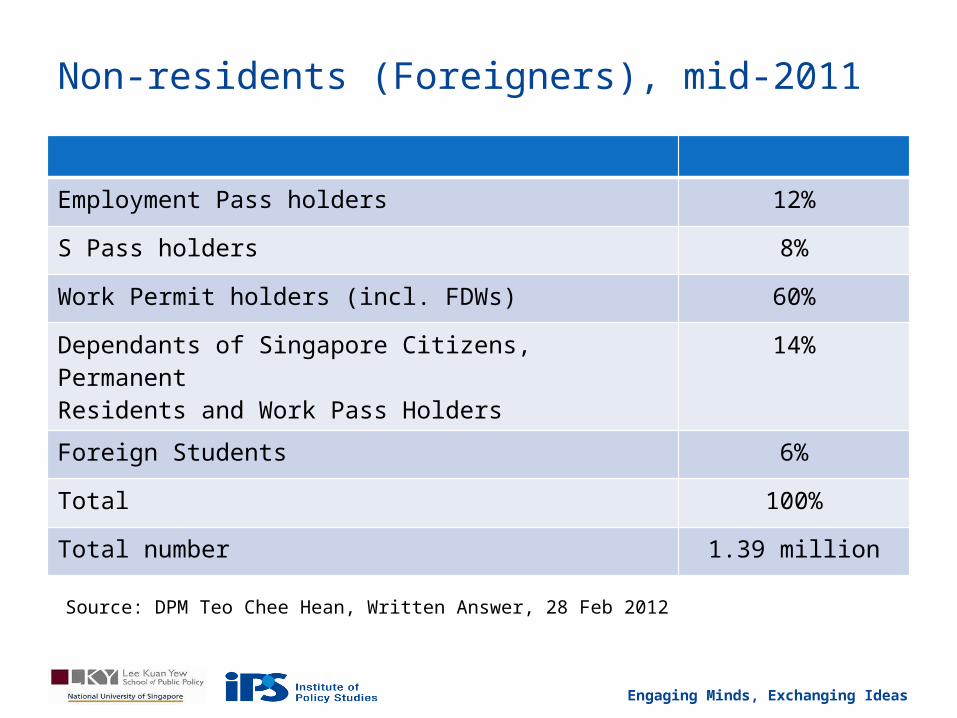
Non-residents (Foreigners), mid-2011
Employment Pass holders 12%
S Pass holders 8%
Work Permit holders (incl. FDWs) 60%
Dependants of Singapore Citizens, PermanentResidents and Work Pass Holders
14%
Foreign Students 6%
Total 100%
Total number 1.39 million
Source: DPM Teo Chee Hean, Written Answer, 28 Feb 2012
Engaging Minds, Exchanging Ideas
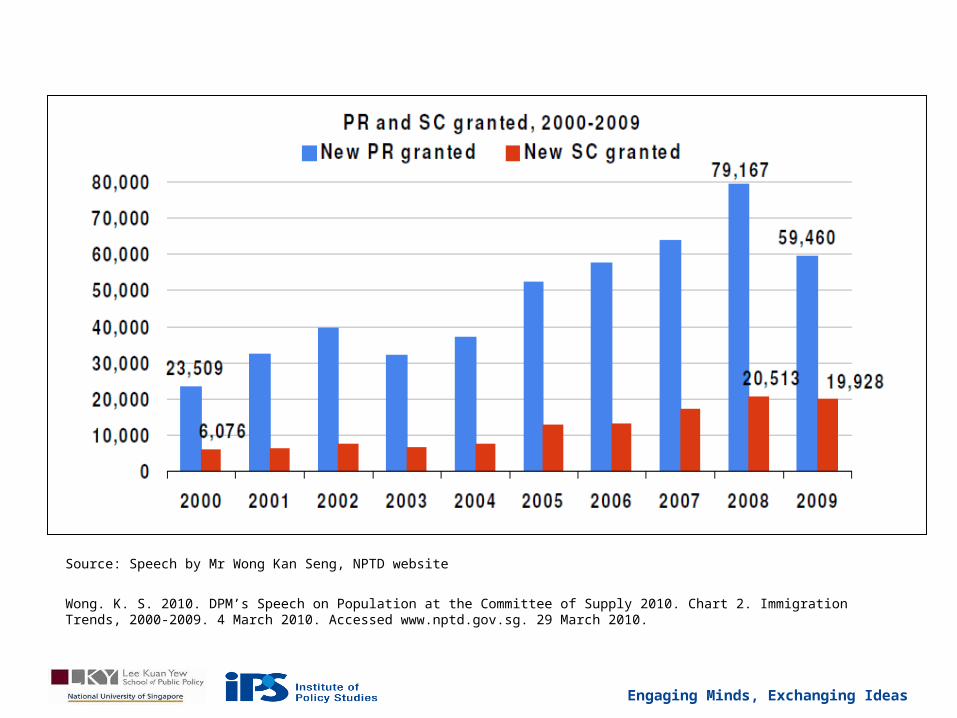
Source: Speech by Mr Wong Kan Seng, NPTD website
Wong. K. S. 2010. DPM’s Speech on Population at the Committee of Supply 2010. Chart 2. Immigration Trends, 2000-2009. 4 March 2010. Accessed www.nptd.gov.sg. 29 March 2010.
Engaging Minds, Exchanging Ideas
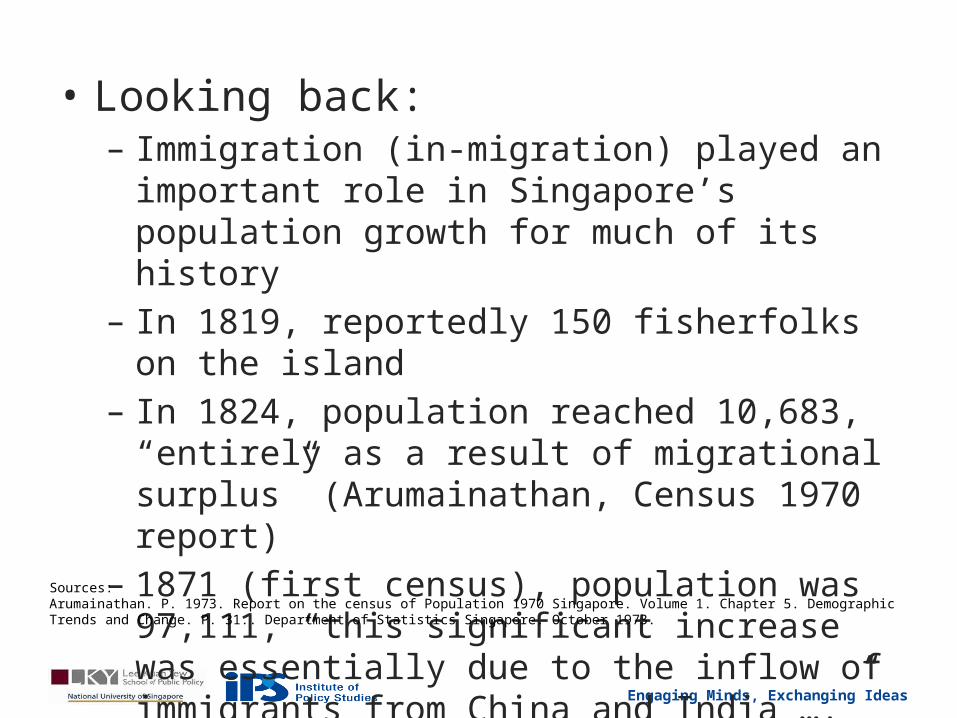
• Looking back:– Immigration (in-migration) played an important role in
Singapore’s population growth for much of its history– In 1819, reportedly 150 fisherfolks on the island– In 1824, population reached 10,683, “entirely as a
result of migrational surplus” (Arumainathan, Census 1970 report)
– 1871 (first census), population was 97,111, “this significant increase was essentially due to the inflow of immigrants from China and India ….”
Arumainathan. P. 1973. Report on the census of Population 1970 Singapore. Volume 1. Chapter 5. Demographic Trends and Change. P. 31.. Department of Statistics Singapore. October 1973.
Sources:
Engaging Minds, Exchanging Ideas
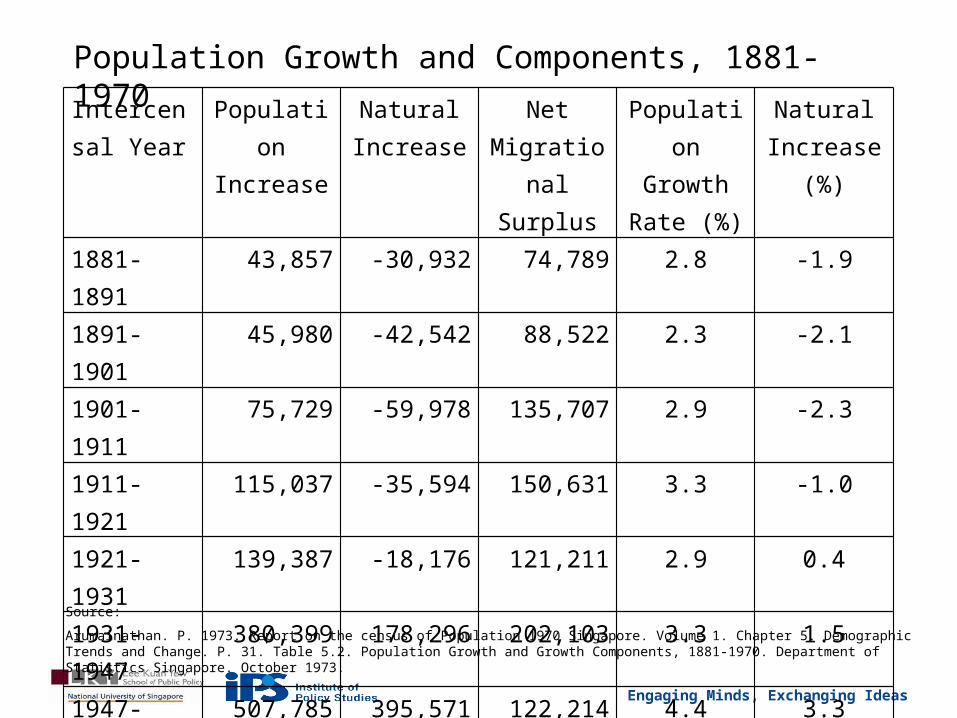
Intercensal Year
Population Increase
Natural Increase
Net Migrational
Surplus
Population Growth
Rate (%)
Natural Increase
(%)1881-1891 43,857 -30,932 74,789 2.8 -1.9
1891-1901 45,980 -42,542 88,522 2.3 -2.1
1901-1911 75,729 -59,978 135,707 2.9 -2.3
1911-1921 115,037 -35,594 150,631 3.3 -1.0
1921-1931 139,387 -18,176 121,211 2.9 0.4
1931-1947 380,399 178,296 202,103 3.3 1.5
1947-1957 507,785 395,571 122,214 4.4 3.3
1957-1970 628,578 595,614 32,964 2.8 2.6
Population Growth and Components, 1881-1970
Source:
Arumainathan. P. 1973. Report on the census of Population 1970 Singapore. Volume 1. Chapter 5. Demographic Trends and Change. P. 31. Table 5.2. Population Growth and Growth Components, 1881-1970. Department of Statistics Singapore. October 1973.
Engaging Minds, Exchanging Ideas
1931
1941
1951
1961
1971
1981
1991
2001
2011
0
2
4
6
8
10
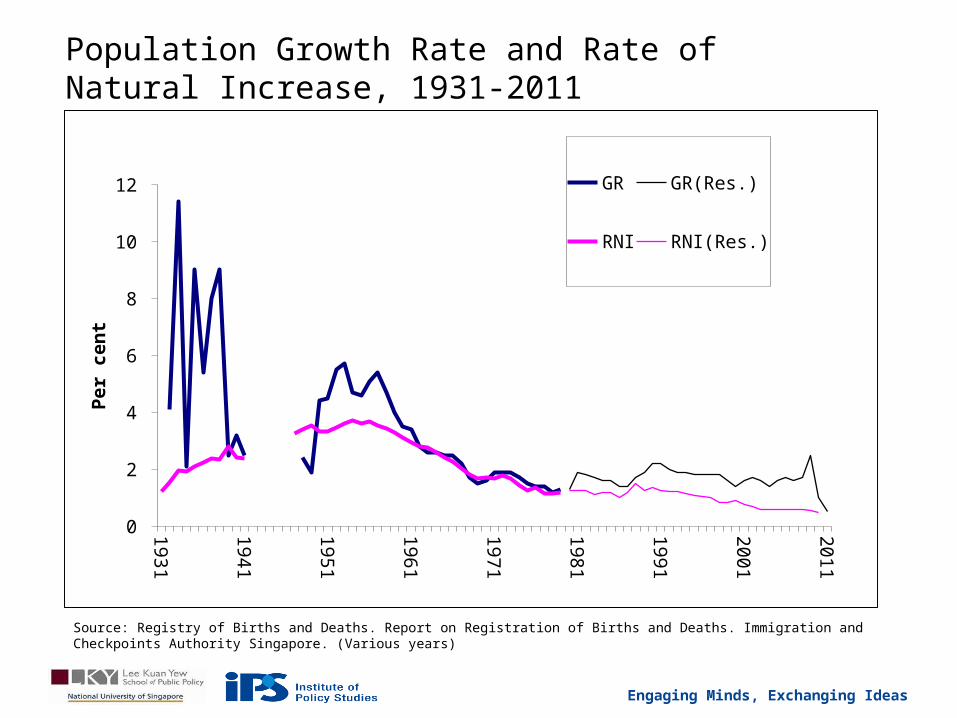
12 GR GR(Res.)
RNI RNI(Res.)
Pe
r c
en
t
Population Growth Rate and Rate of Natural Increase, 1931-2011
Source: Registry of Births and Deaths. Report on Registration of Births and Deaths. Immigration and Checkpoints Authority Singapore. (Various years)
Engaging Minds, Exchanging Ideas
ENGAGING MINDS, EXCHANGING IDEAS
Rationale for Immigration : Demographic
Engaging Minds, Exchanging Ideas
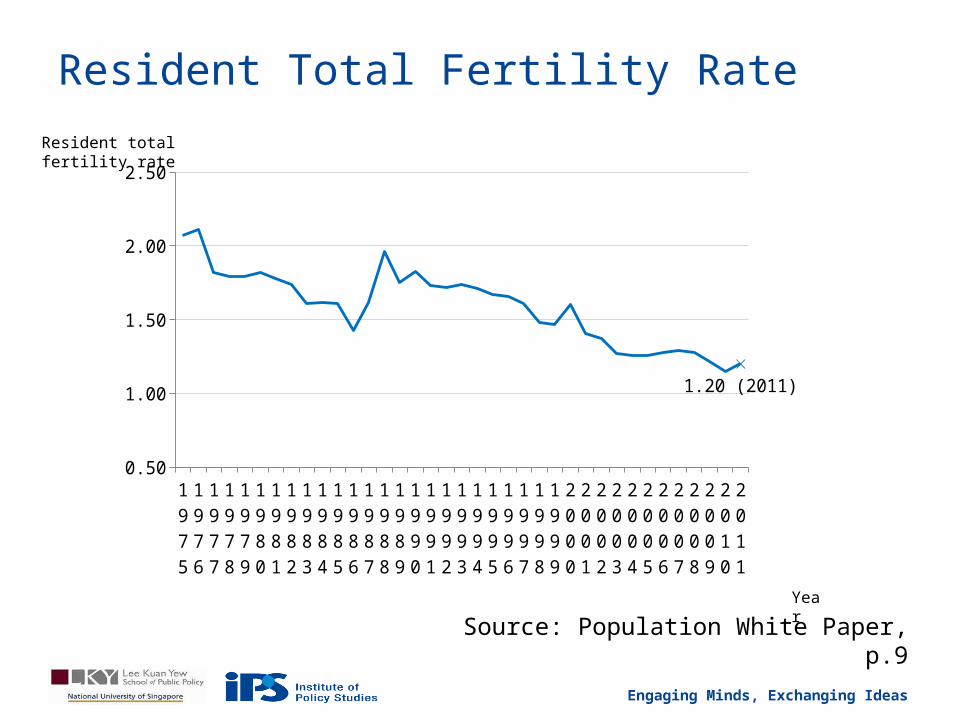
Resident Total Fertility Rate
1975
1976
1977
1978
1979
1980
1981
1982
1983
1984
1985
1986
1987
1988
1989
1990
1991
1992
1993
1994
1995
1996
1997
1998
1999
2000
2001
2002
2003
2004
2005
2006
2007
2008
2009
2010
2011
0.50
1.00
1.50
2.00
2.50
1.20 (2011)
Source: Population White Paper, p.9
Resident total fertility rate
Year
Engaging Minds, Exchanging Ideas
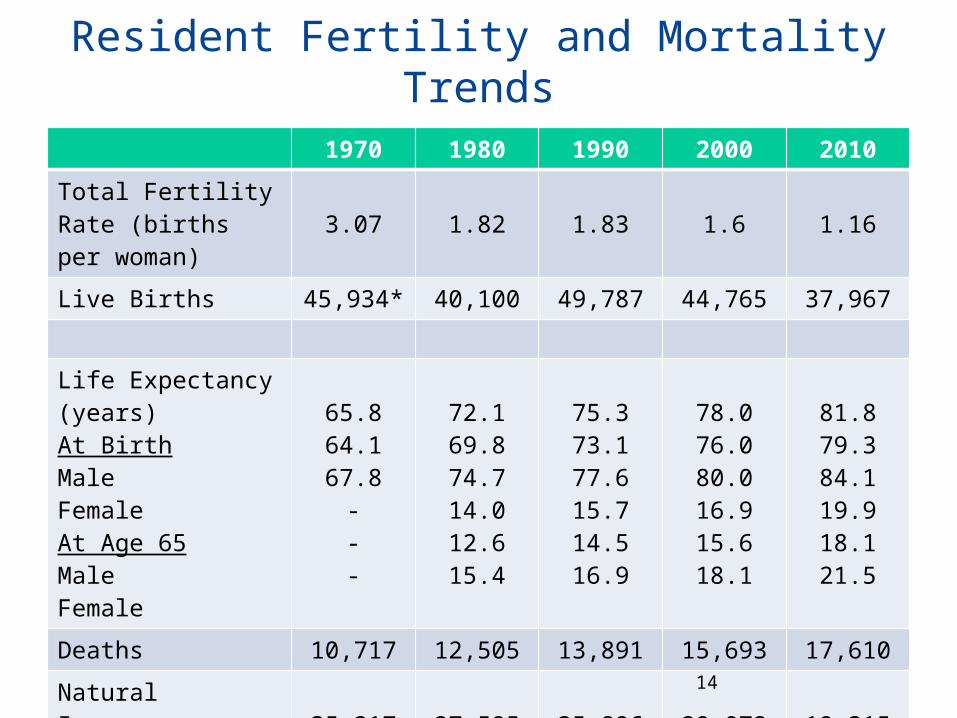
Resident Fertility and Mortality Trends
1970 1980 1990 2000 2010
Total Fertility Rate (births per woman) 3.07 1.82 1.83 1.6 1.16Live Births 45,934* 40,100 49,787 44,765 37,967
Life Expectancy (years)At BirthMaleFemaleAt Age 65MaleFemale
65.864.167.8
---
72.169.874.714.012.615.4
75.373.177.615.714.516.9
78.076.080.016.915.618.1
81.879.384.119.918.121.5
Deaths 10,717 12,505 13,891 15,693 17,610
Natural Increase (Births-Deaths) 35,217 27,595 35,896 29,072 19,315Source: Dept of Statistics
* All births
14
Engaging Minds, Exchanging Ideas
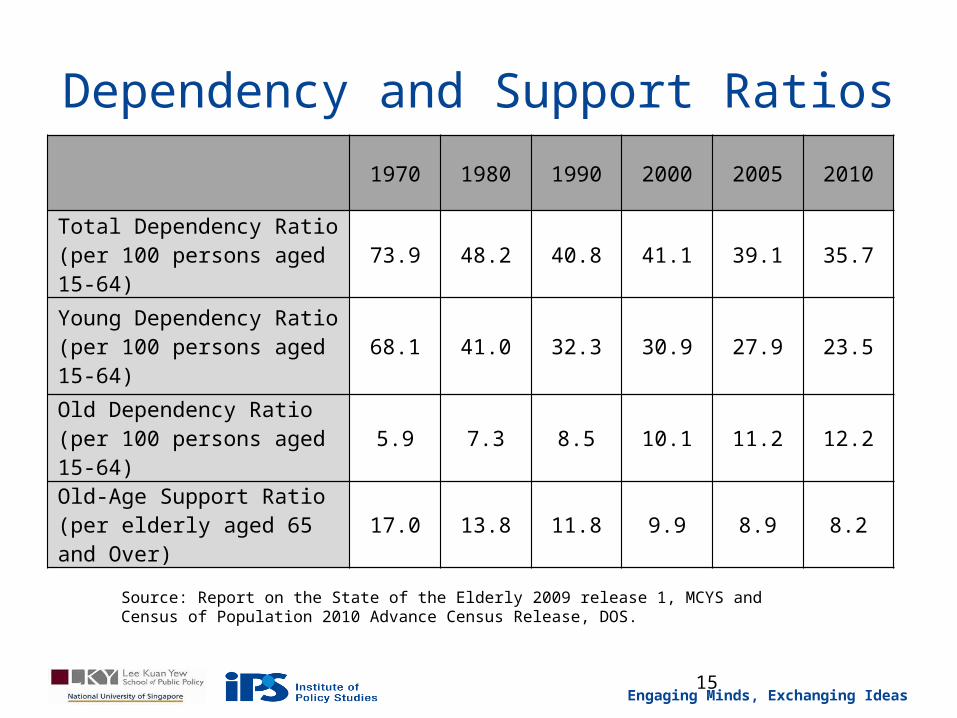
Dependency and Support Ratios
1970 1980 1990 2000 2005 2010
Total Dependency Ratio (per 100 persons aged 15-64) 73.9 48.2 40.8 41.1 39.1 35.7
Young Dependency Ratio (per 100 persons aged 15-64) 68.1 41.0 32.3 30.9 27.9 23.5
Old Dependency Ratio (per 100 persons aged 15-64) 5.9 7.3 8.5 10.1 11.2 12.2
Old-Age Support Ratio (per elderly aged 65 and Over) 17.0 13.8 11.8 9.9 8.9 8.2
Source: Report on the State of the Elderly 2009 release 1, MCYS and Census of Population 2010 Advance Census Release, DOS.
15
Engaging Minds, Exchanging Ideas
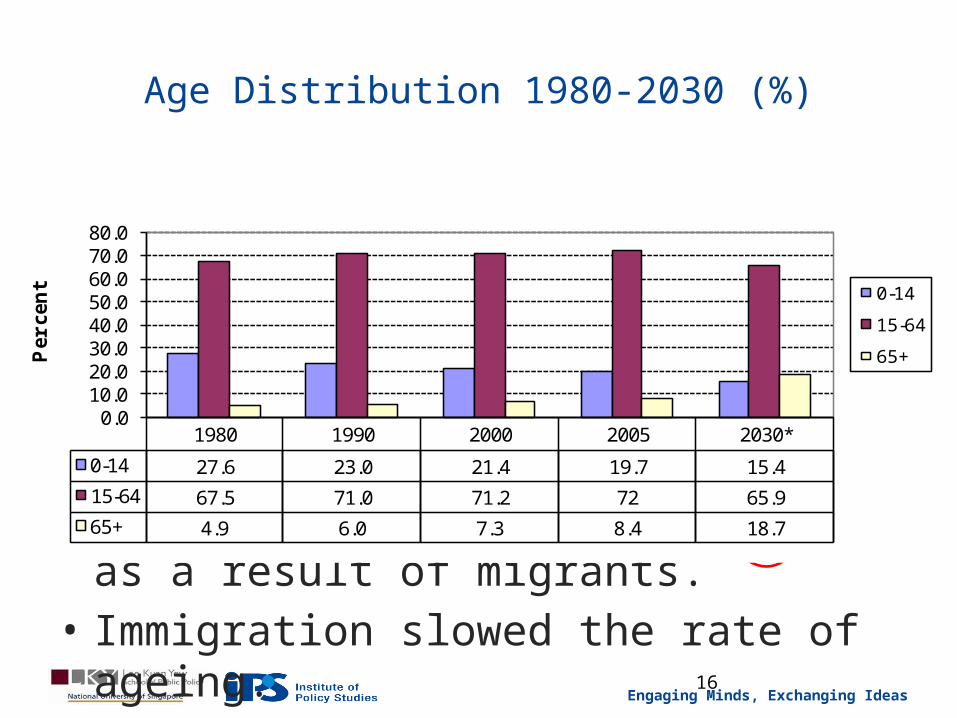
Age Distribution 1980-2030 (%)
• A decline in proportion of young (0-14 years)
• A rise in proportion of old (65+ years)• Proportion of middle age band (15-64
years) continued to grow as a result of migrants.
• Immigration slowed the rate of ageing.
1980 1990 2000 2005 2030*
0-14 27.6 23.0 21.4 19.7 15.4
15-64 67.5 71.0 71.2 72 65.9
65+ 4.9 6.0 7.3 8.4 18.7
0.010.020.030.040.050.060.070.080.0
Per
cen
t 0-14
15-64
65+
16
Engaging Minds, Exchanging Ideas
ENGAGING MINDS, EXCHANGING IDEAS
Rationale : Economic
Engaging Minds, Exchanging Ideas
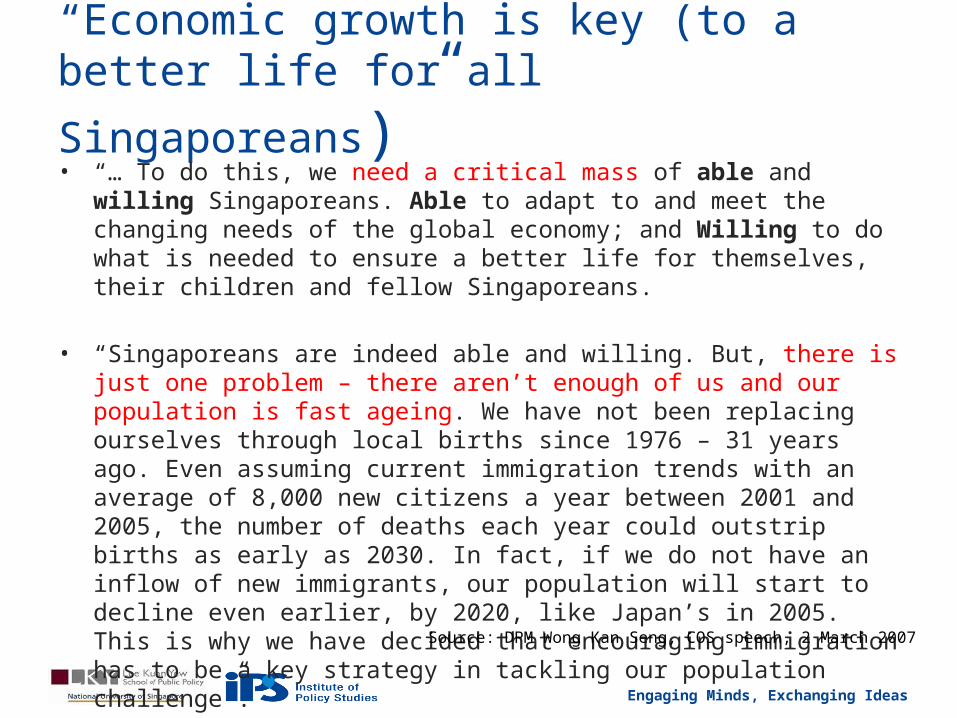
“Economic growth is key (to a better life for
all Singaporeans)”• “… To do this, we need a critical mass of able and willing Singaporeans.
Able to adapt to and meet the changing needs of the global economy; and Willing to do what is needed to ensure a better life for themselves, their children and fellow Singaporeans.
• “Singaporeans are indeed able and willing. But, there is just one problem – there aren’t enough of us and our population is fast ageing. We have not been replacing ourselves through local births since 1976 – 31 years ago. Even assuming current immigration trends with an average of 8,000 new citizens a year between 2001 and 2005, the number of deaths each year could outstrip births as early as 2030. In fact, if we do not have an inflow of new immigrants, our population will start to decline even earlier, by 2020, like Japan’s in 2005. This is why we have decided that encouraging immigration has to be a key strategy in tackling our population challenge”.
Source: DPM Wong Kan Seng, COS speech, 2 March 2007
Engaging Minds, Exchanging Ideas
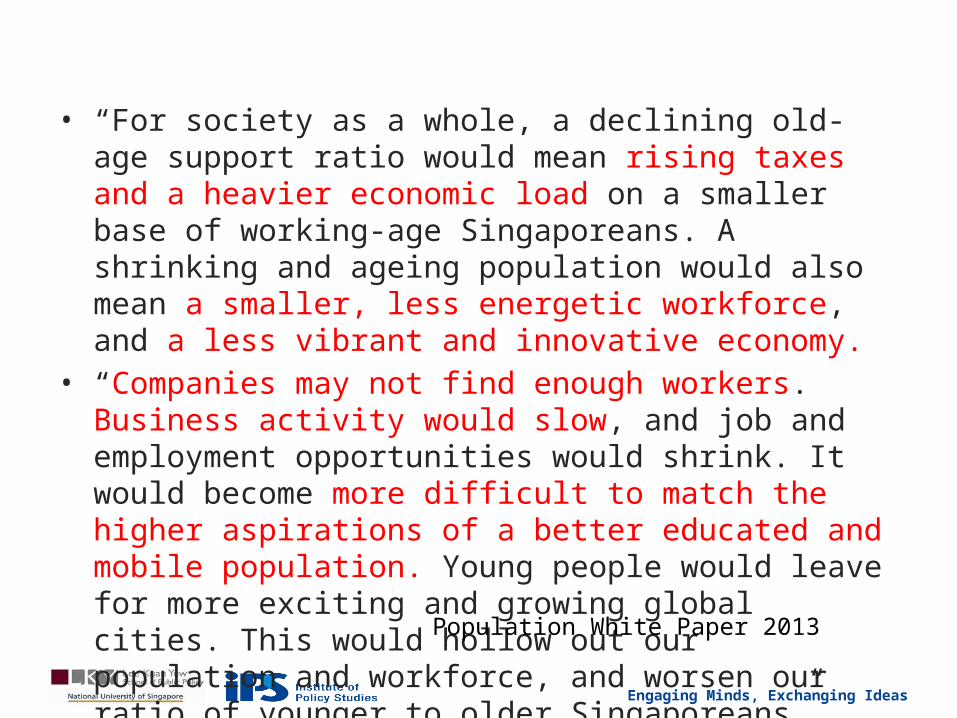
• “For society as a whole, a declining old-age support ratio would mean rising taxes and a heavier economic load on a smaller base of working-age Singaporeans. A shrinking and ageing population would also mean a smaller, less energetic workforce, and a less vibrant and innovative economy.
• “Companies may not find enough workers. Business activity would slow, and job and employment opportunities would shrink. It would become more difficult to match the higher aspirations of a better educated and mobile population. Young people would leave for more exciting and growing global cities. This would hollow out our population and workforce, and worsen our ratio of younger to older Singaporeans”
Population White Paper 2013
Engaging Minds, Exchanging Ideas
ENGAGING MINDS, EXCHANGING IDEAS
Issues: Physical / Infrastructural
Engaging Minds, Exchanging Ideas
1901 1911 1921 1931 1947 1957 1970 1980 1990 2000 20100
1,000
2,000
3,000
4,000
5,000
6,000
7,000
8,000Pe
rson
s per
sq k
m
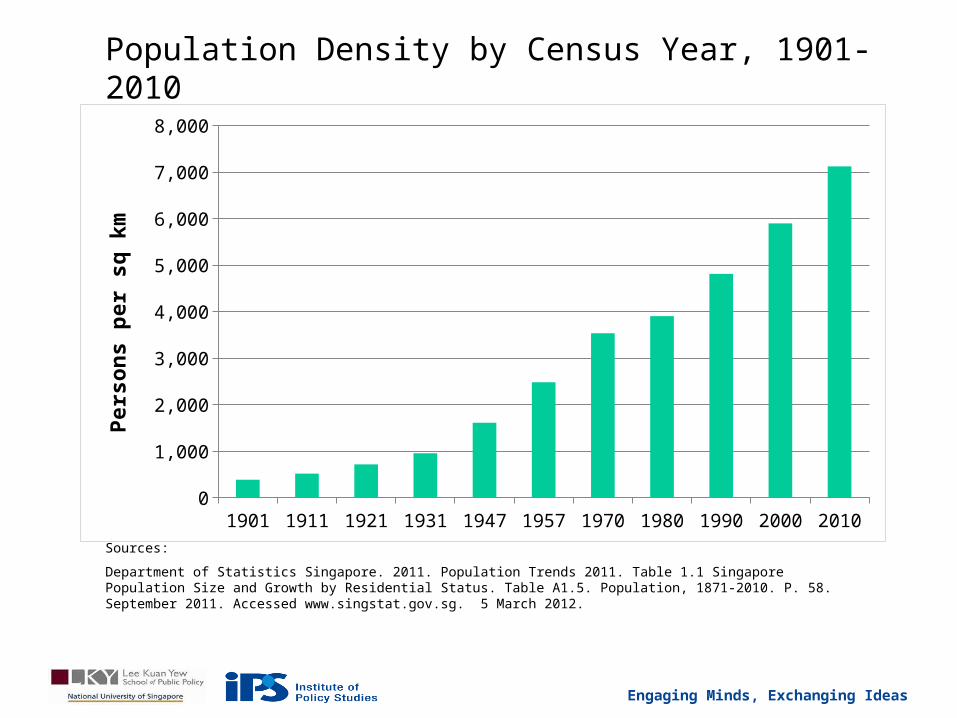
Population Density by Census Year, 1901-2010
Department of Statistics Singapore. 2011. Population Trends 2011. Table 1.1 Singapore Population Size and Growth by Residential Status. Table A1.5. Population, 1871-2010. P. 58. September 2011. Accessed www.singstat.gov.sg. 5 March 2012.
Sources:
Engaging Minds, Exchanging Ideas
ENGAGING MINDS, EXCHANGING IDEAS
Issues: Integration / Identity
Engaging Minds, Exchanging Ideas
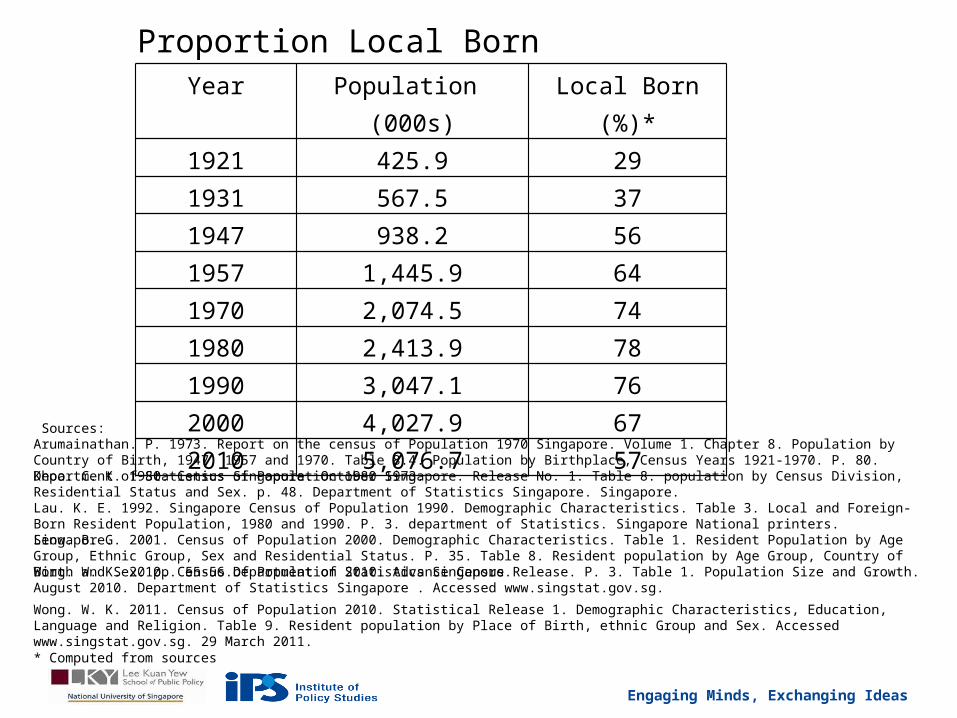
Year Population (000s)
Local Born (%)*
1921 425.9 291931 567.5 371947 938.2 561957 1,445.9 641970 2,074.5 741980 2,413.9 781990 3,047.1 762000 4,027.9 672010 5,076.7 57
Proportion Local Born
Arumainathan. P. 1973. Report on the census of Population 1970 Singapore. Volume 1. Chapter 8. Population by Country of Birth, 1947, 1957 and 1970. Table 8.4. Population by Birthplace, Census Years 1921-1970. P. 80. Department of Statistics Singapore. October 1973.
Lau. K. E. 1992. Singapore Census of Population 1990. Demographic Characteristics. Table 3. Local and Foreign-Born Resident Population, 1980 and 1990. P. 3. department of Statistics. Singapore National printers. Singapore.
Khoo. C. K. 1980. Census of Population 1980 Singapore. Release No. 1. Table 8. population by Census Division, Residential Status and Sex. p. 48. Department of Statistics Singapore. Singapore.
Leow. B. G. 2001. Census of Population 2000. Demographic Characteristics. Table 1. Resident Population by Age Group, Ethnic Group, Sex and Residential Status. P. 35. Table 8. Resident population by Age Group, Country of Birth and Sex. pp. 55-56.Department of Statistics Singapore.
Wong. W. K. 2011. Census of Population 2010. Statistical Release 1. Demographic Characteristics, Education, Language and Religion. Table 9. Resident population by Place of Birth, ethnic Group and Sex. Accessed www.singstat.gov.sg. 29 March 2011.
Wong. W. K. 2010. Census of Population 2010. Advance Census Release. P. 3. Table 1. Population Size and Growth. August 2010. Department of Statistics Singapore . Accessed www.singstat.gov.sg.
Sources:
* Computed from sources
Engaging Minds, Exchanging Ideas
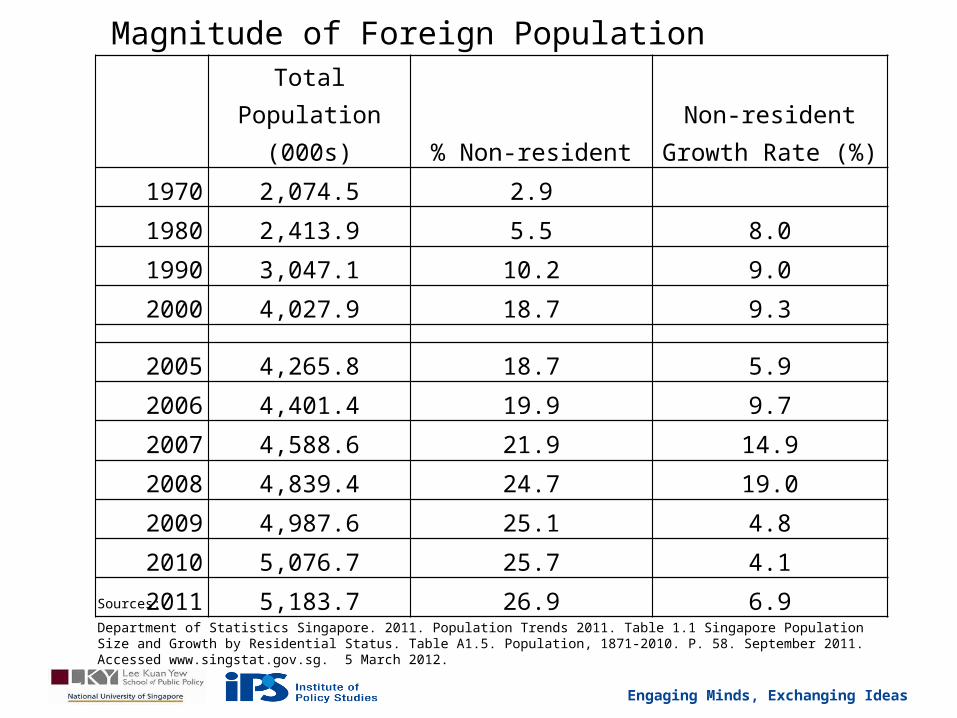
Total Population (000s) % Non-resident
Non-resident Growth Rate (%)
1970 2,074.5 2.9
1980 2,413.9 5.5 8.0
1990 3,047.1 10.2 9.0
2000 4,027.9 18.7 9.3
2005 4,265.8 18.7 5.9
2006 4,401.4 19.9 9.7
2007 4,588.6 21.9 14.9
2008 4,839.4 24.7 19.0
2009 4,987.6 25.1 4.8
2010 5,076.7 25.7 4.1
2011 5,183.7 26.9 6.9
Magnitude of Foreign Population
Department of Statistics Singapore. 2011. Population Trends 2011. Table 1.1 Singapore Population Size and Growth by Residential Status. Table A1.5. Population, 1871-2010. P. 58. September 2011. Accessed www.singstat.gov.sg. 5 March 2012.
Sources:
Engaging Minds, Exchanging Ideas
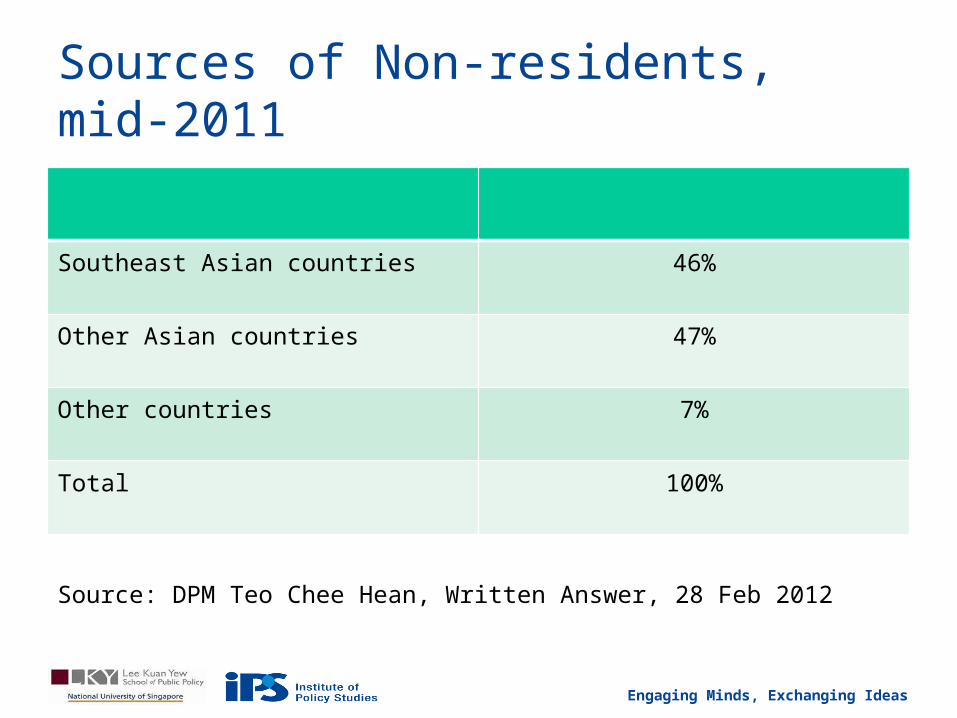
Sources of Non-residents, mid-2011
Southeast Asian countries 46%
Other Asian countries 47%
Other countries 7%
Total 100%
Source: DPM Teo Chee Hean, Written Answer, 28 Feb 2012
Engaging Minds, Exchanging Ideas
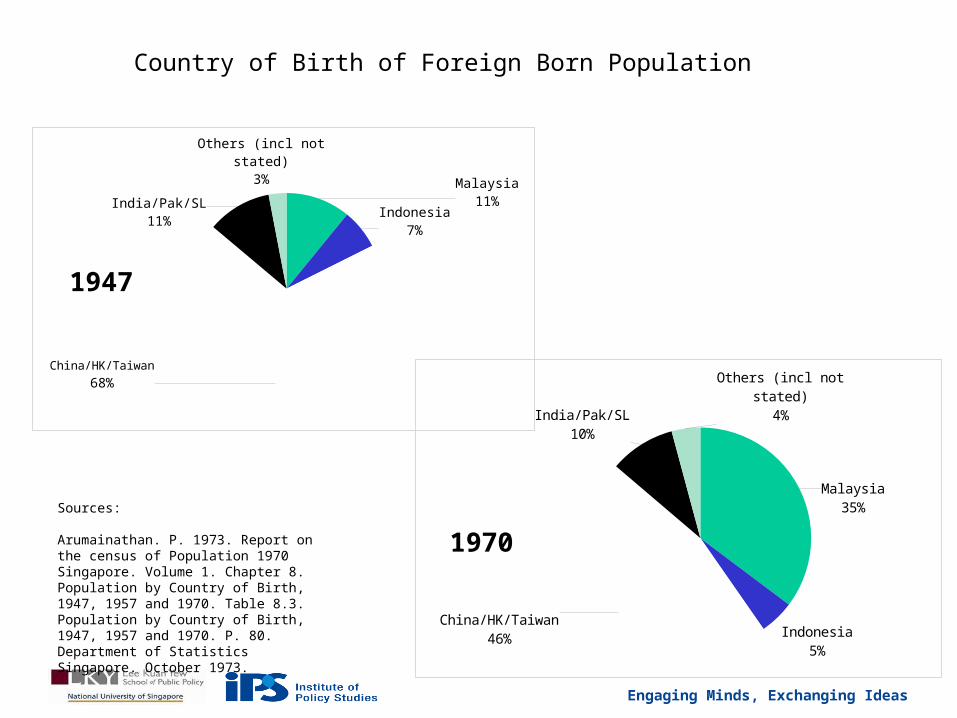
Malaysia11%
Indonesia7%
China/HK/Taiwan68%
India/Pak/SL11%
Others (incl not stated)3%
1947
Malaysia35%
Indonesia5%
China/HK/Taiwan
46%
India/Pak/SL10%
Others (incl not stated)4%
1970
Country of Birth of Foreign Born Population
Arumainathan. P. 1973. Report on the census of Population 1970 Singapore. Volume 1. Chapter 8. Population by Country of Birth, 1947, 1957 and 1970. Table 8.3. Population by Country of Birth, 1947, 1957 and 1970. P. 80. Department of Statistics Singapore. October 1973.
Sources:
Engaging Minds, Exchanging Ideas
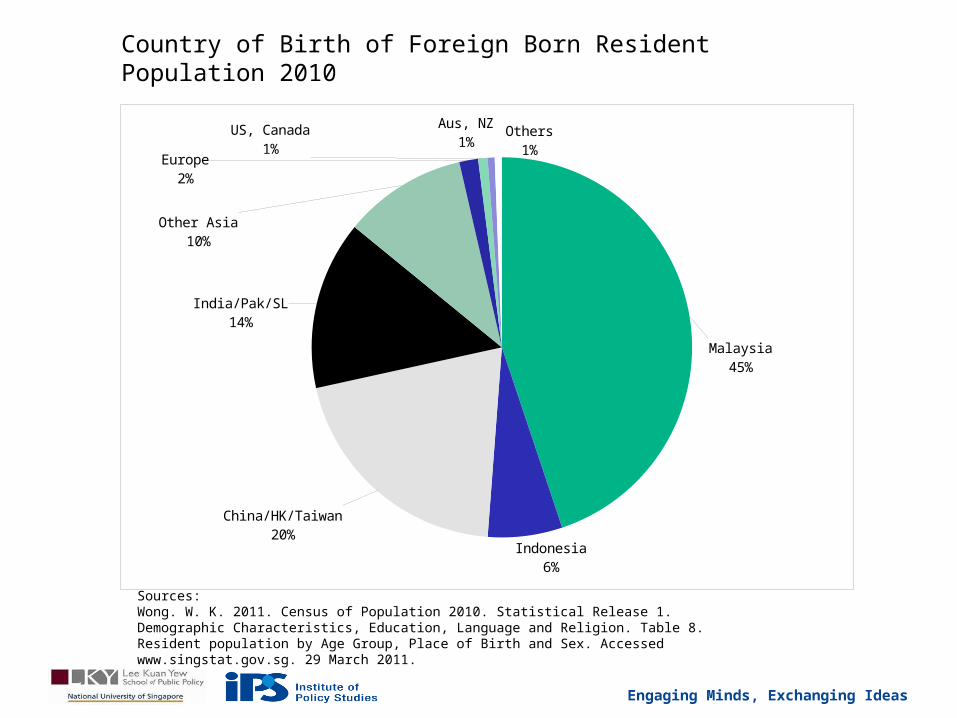
Malaysia45%
Indonesia6%
China/HK/Taiwan20%
India/Pak/SL14%
Other Asia10%
Europe2%
US, Canada1%
Aus, NZ1%
Others1%
Country of Birth of Foreign Born Resident Population 2010
Wong. W. K. 2011. Census of Population 2010. Statistical Release 1. Demographic Characteristics, Education, Language and Religion. Table 8. Resident population by Age Group, Place of Birth and Sex. Accessed www.singstat.gov.sg. 29 March 2011.
Sources:
Engaging Minds, Exchanging Ideas
ENGAGING MINDS, EXCHANGING IDEAS
Work Pass Framework
Engaging Minds, Exchanging Ideas
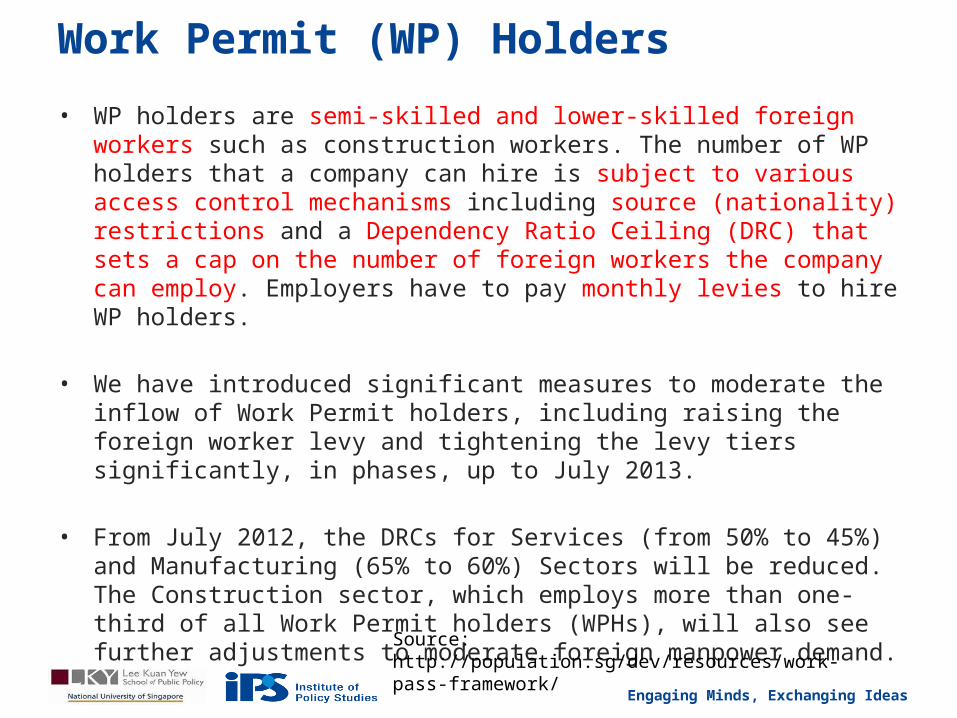
Work Permit (WP) Holders
• WP holders are semi-skilled and lower-skilled foreign workers such as construction workers. The number of WP holders that a company can hire is subject to various access control mechanisms including source (nationality) restrictions and a Dependency Ratio Ceiling (DRC) that sets a cap on the number of foreign workers the company can employ. Employers have to pay monthly levies to hire WP holders.
• We have introduced significant measures to moderate the inflow of Work Permit holders, including raising the foreign worker levy and tightening the levy tiers significantly, in phases, up to July 2013.
• From July 2012, the DRCs for Services (from 50% to 45%) and Manufacturing (65% to 60%) Sectors will be reduced. The Construction sector, which employs more than one-third of all Work Permit holders (WPHs), will also see further adjustments to moderate foreign manpower demand.
Source: http://population.sg/dev/resources/work-pass-framework/
Engaging Minds, Exchanging Ideas
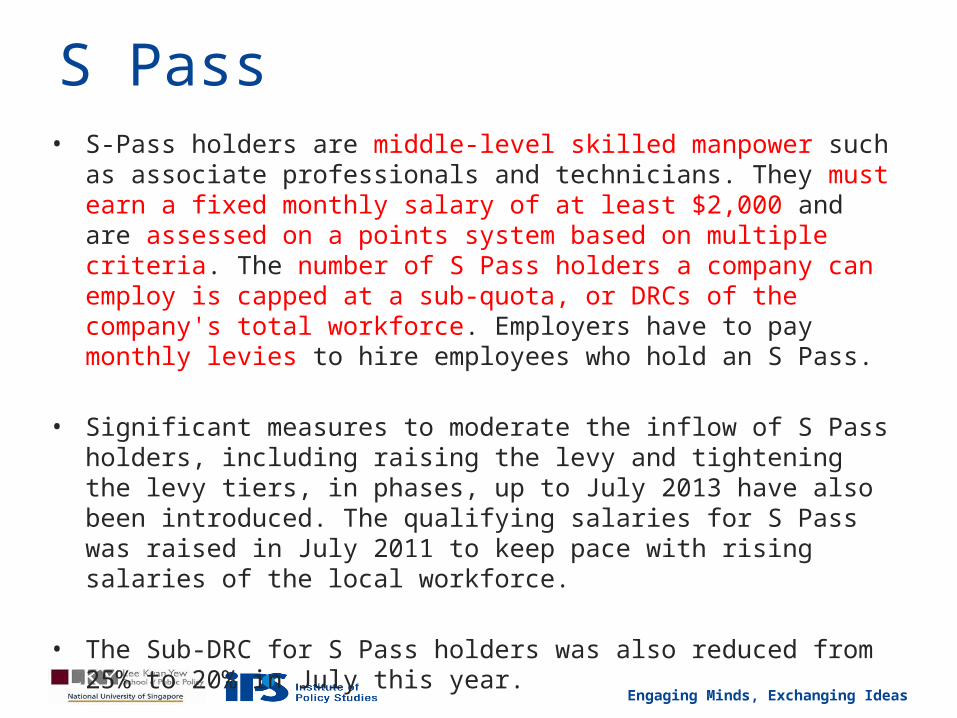
S Pass• S-Pass holders are middle-level skilled manpower such as associate
professionals and technicians. They must earn a fixed monthly salary of at least $2,000 and are assessed on a points system based on multiple criteria. The number of S Pass holders a company can employ is capped at a sub-quota, or DRCs of the company's total workforce. Employers have to pay monthly levies to hire employees who hold an S Pass.
• Significant measures to moderate the inflow of S Pass holders, including raising the levy and tightening the levy tiers, in phases, up to July 2013 have also been introduced. The qualifying salaries for S Pass was raised in July 2011 to keep pace with rising salaries of the local workforce.
• The Sub-DRC for S Pass holders was also reduced from 25% to 20% in July this year.
Engaging Minds, Exchanging Ideas
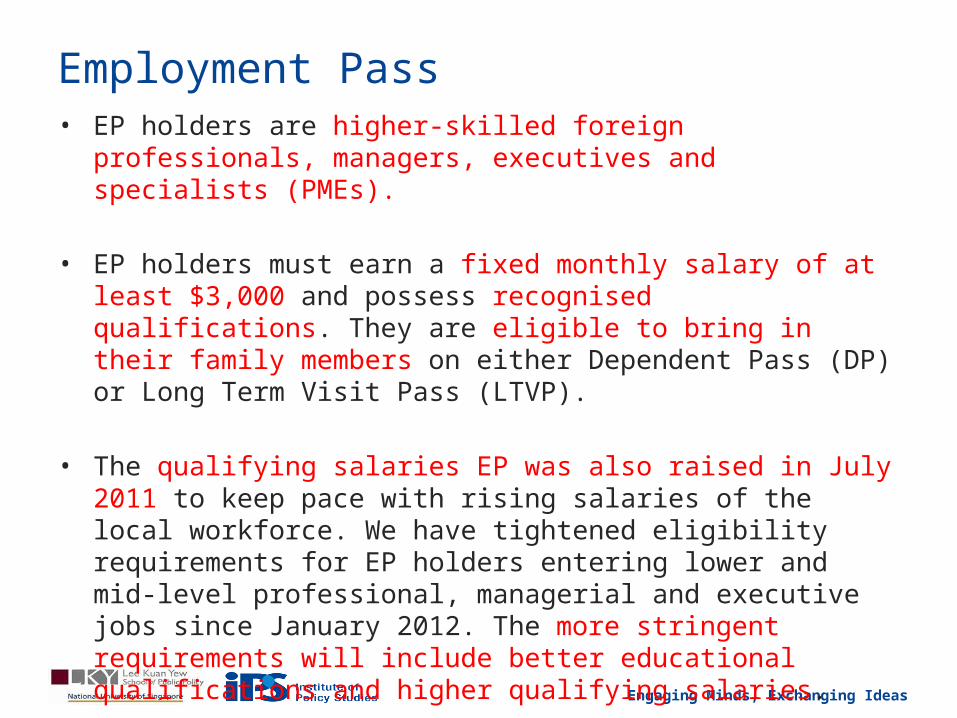
Employment Pass• EP holders are higher-skilled foreign professionals, managers,
executives and specialists (PMEs).
• EP holders must earn a fixed monthly salary of at least $3,000 and possess recognised qualifications. They are eligible to bring in their family members on either Dependent Pass (DP) or Long Term Visit Pass (LTVP).
• The qualifying salaries EP was also raised in July 2011 to keep pace with rising salaries of the local workforce. We have tightened eligibility requirements for EP holders entering lower and mid-level professional, managerial and executive jobs since January 2012. The more stringent requirements will include better educational qualifications and higher qualifying salaries.
Engaging Minds, Exchanging Ideas
ENGAGING MINDS, EXCHANGING IDEAS
Immigration Framework
Engaging Minds, Exchanging Ideas
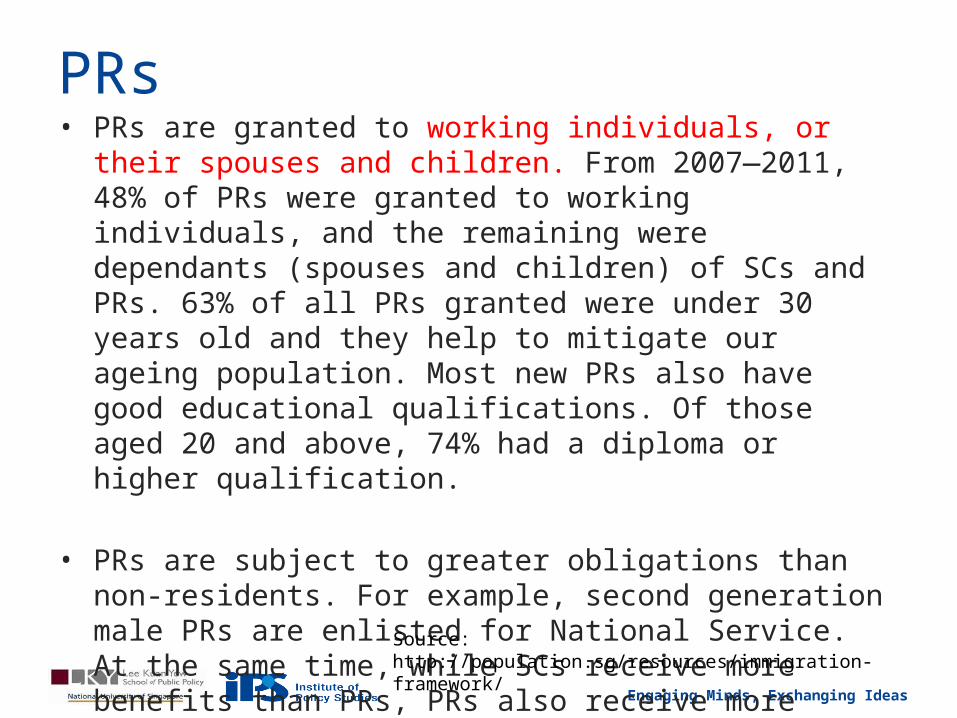
PRs• PRs are granted to working individuals, or their spouses and
children. From 2007—2011, 48% of PRs were granted to working individuals, and the remaining were dependants (spouses and children) of SCs and PRs. 63% of all PRs granted were under 30 years old and they help to mitigate our ageing population. Most new PRs also have good educational qualifications. Of those aged 20 and above, 74% had a diploma or higher qualification.
• PRs are subject to greater obligations than non-residents. For example, second generation male PRs are enlisted for National Service. At the same time, while SCs receive more benefits than PRs, PRs also receive more benefits than non-residents, such as subsidies at restructured hospitals.
Source: http://population.sg/resources/immigration-framework/
Engaging Minds, Exchanging Ideas
Citizenship• Like PR applications, citizenship applications are subject
to a holistic and thorough assessment process. PRs are granted citizenship only after they have completed the Singapore Citizenship Journey and renounced their foreign citizenships.
• From 2007—2011, 38% of new SCs were granted to working individuals, while 62% were dependents. Like new PRs, new citizens are generally young and have good educational qualifications. 53% were under 30 years old, and of those over 20 years old, 61% had a diploma or higher qualification.
Engaging Minds, Exchanging Ideas
Going forward (White Paper 2013)Populationi. Encourage Marriage and Parenthood –
To create a family-friendly environment supported by the Government’s Marriage & Parenthood Package …
ii. Remain Open to Immigration – To stop our citizen population from shrinking and sustain the citizen population with a stable age distribution, we will take in between 15,000 and 25,000 new citizens each year. The citizen population could be between 3.5 and 3.6 million in 2020, and between 3.6 and 3.8 million in 2030. We will grant about 30,000 PRs each year, in order to maintain the PR population at between 0.5 and 0.6 million for a stream of good quality candidates for citizenship;
iii. Enhance Integration Efforts – To help new immigrants adapt to our local way of life and to reinforce our values and sense of belonging.
Engaging Minds, Exchanging Ideas
Economyi. Create Good Jobs for Singaporean Core in Workforce – To support a more qualified and skilled Singaporean workforce in a dynamic economy where two out of three Singaporeans are in Professional, Managerial, Executive and Technical (PMET) jobs in 2030 compared to about one in two today;
ii. Complement Singaporean Core with Foreign Workforce – To have an overall workforce structure that serves our economic, social and infrastructure needs;
iii. Moderate Overall Workforce Growth Rates to 1% to 2% per year up to 2020, and about 1% per year up to 2030 – To drive the necessary restructuring and productivity improvements, and to ensure that growth is sustainable and does not outpace our infrastructure development.
Engaging Minds, Exchanging Ideas
Living Environmenti. Plan and Invest in Infrastructure Ahead of Demand – To create high quality urban spaces and ensure that our infrastructure can support a range of population trajectories with a total population of about 5.8 to 6.0 million in 2020, and 6.5 to 6.9 million in 2030;
ii. Implement Infrastructure Programmes – To expand our transport network, build more public housing, health and community facilities, and create new parks and interconnected green spaces all around Singapore;
iii. Explore New Technology and Innovative Solutions – To expand and optimise our land use, create new land capacity, and make use of space more efficiently and effectively to enhance liveability and support longer-term needs.
Engaging Minds, Exchanging Ideas
White Paper hotly debated, particularly with regard to immigration and projected increase in population.
Not cast in stone – depends on future development regarding marriage and childbearing, productivity improvements, etc.
Engaging Minds, Exchanging Ideas
END