Embed Size (px)
Citation preview
© OECD/IEA 2016© OECD/IEA 2016
GBEP Bioenergy Week
Budapest, 21 June 2016
Simone LandolinaActing Head
International Partnerships and Initiatives Unit
Energy Technology Perspectives and Bioenergy Policy at Global and
Local Level
© OECD/IEA 2016
First clear signs of decoupling of CO2 emissions and GDP
Global energy-related CO2 emissions remained flat in 2015 for the second year in a row
Renewable power capacity at record high with over 150 GW installed in 2015
COP21 provided a historic push for clean energy
Start of a new era of collaboration: Country-based approaches preferred to top-down regulation
New goals put forward – going beyond what everyone already considered challenging when IEA’s first ETP was released in 2006
Growing recognition that greater innovation is essential to meet ambitious climate goals
Context
© OECD/IEA 2016
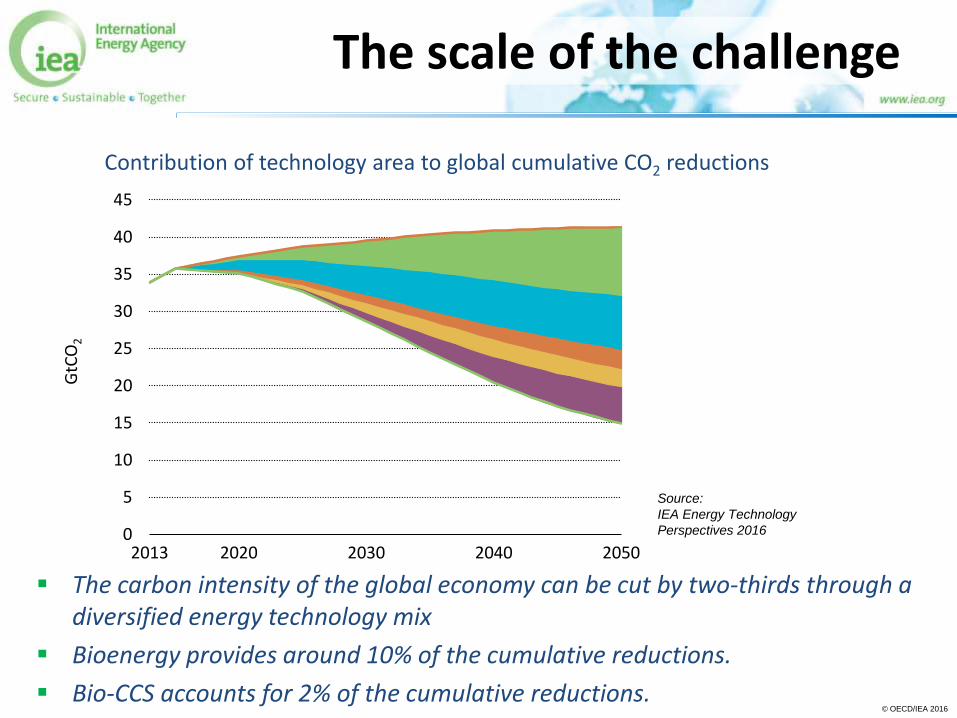
Contribution of technology area to global cumulative CO2 reductions
The scale of the challenge
0
5
10
15
20
25
30
35
40
45
2013 2020 2030 2040 2050
GtC
O2
Renewables 32%
Energy efficiency 32%
Fuel switching 10%
Nuclear 11%
CCS 15%2DS
4DS
Source:
IEA Energy Technology
Perspectives 2016
The carbon intensity of the global economy can be cut by two-thirds through a diversified energy technology mix
Bioenergy provides around 10% of the cumulative reductions.
Bio-CCS accounts for 2% of the cumulative reductions.
© OECD/IEA 2016
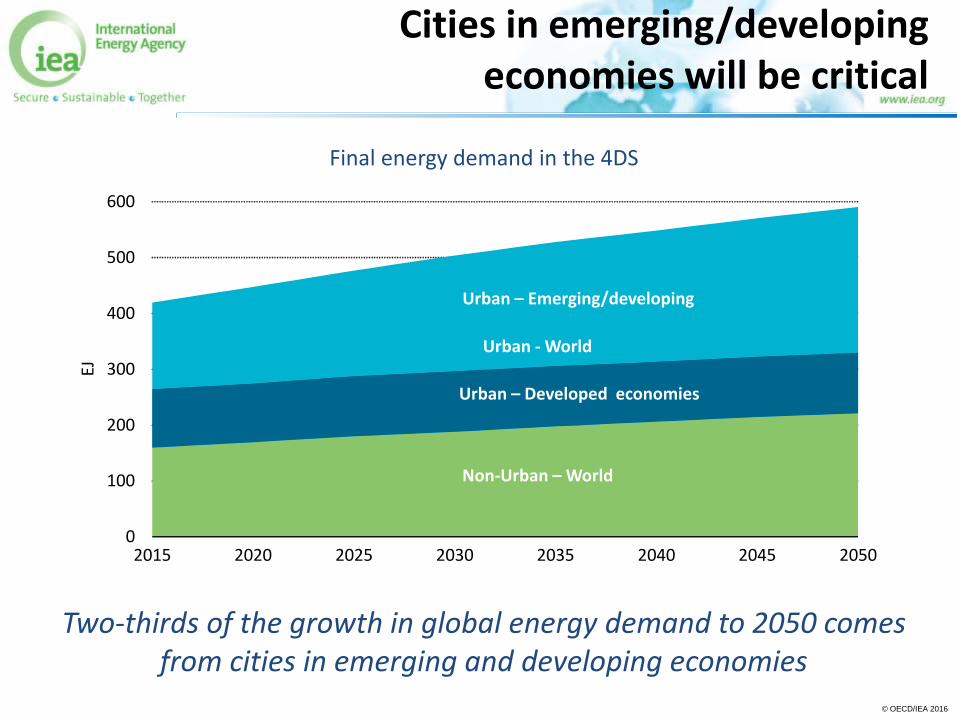
Cities in emerging/developing economies will be critical
Two-thirds of the growth in global energy demand to 2050 comes from cities in emerging and developing economies
Final energy demand in the 4DS
Urban non-OECD
Urban OECD
0
100
200
300
400
500
600
2015 2020 2025 2030 2035 2040 2045 2050
EJ
Urban OECD
Urban – Emerging/developing
Urban - World
Non-Urban – World
Urban – Developed economies
© OECD/IEA 2016
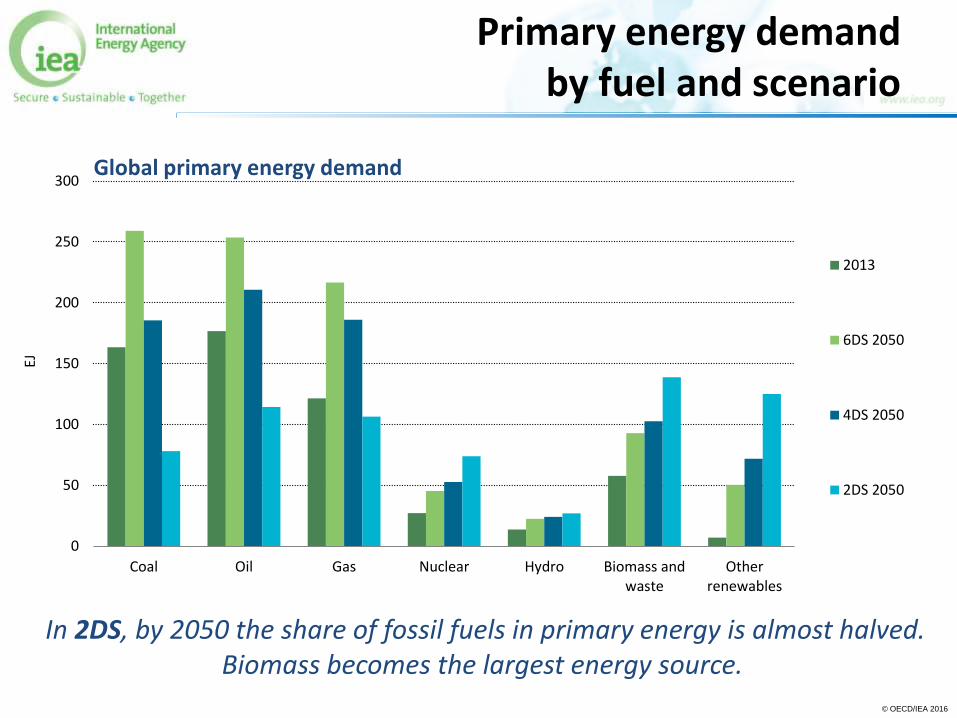
Primary energy demand by fuel and scenario
0
50
100
150
200
250
300
Coal Oil Gas Nuclear Hydro Biomass andwaste
Otherrenewables
EJ
2013
6DS 2050
4DS 2050
2DS 2050
In 2DS, by 2050 the share of fossil fuels in primary energy is almost halved. Biomass becomes the largest energy source.
Global primary energy demand
© OECD/IEA 2016
Other renewable power
Buildings
Nuclear
Transport
Appliances and lighting
Energy storage
Industry
Biofuels
Carbon capture and storage
More efficient coal-fired power
Electric vehicles
Solar PV and onshore wind
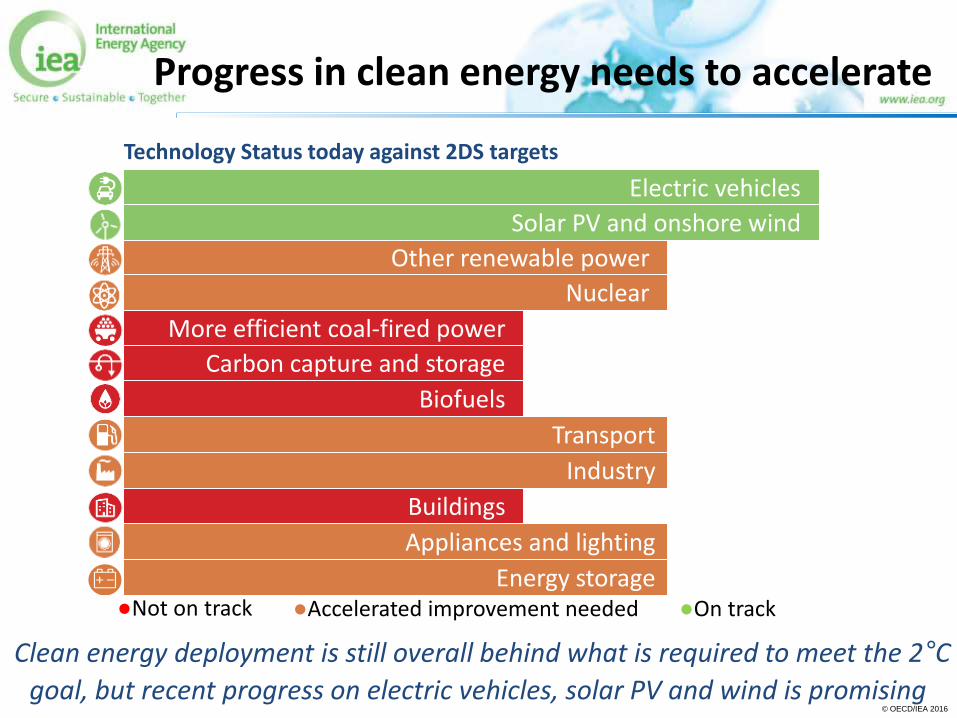
Technology Status today against 2DS targets
●Not on track ●Accelerated improvement needed ●On track
Clean energy deployment is still overall behind what is required to meet the 2°C
goal, but recent progress on electric vehicles, solar PV and wind is promising
Progress in clean energy needs to accelerate
© OECD/IEA 2016
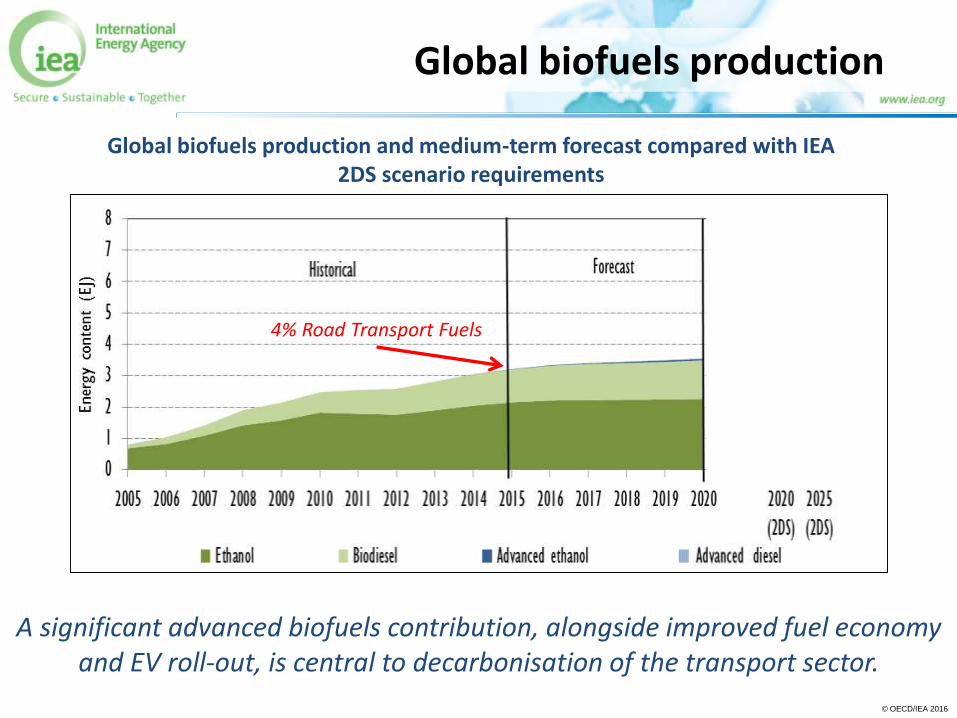
Global biofuels production
Global biofuels production and medium-term forecast compared with IEA 2DS scenario requirements
A significant advanced biofuels contribution, alongside improved fuel economy and EV roll-out, is central to decarbonisation of the transport sector.
4% Road Transport Fuels
© OECD/IEA 2016
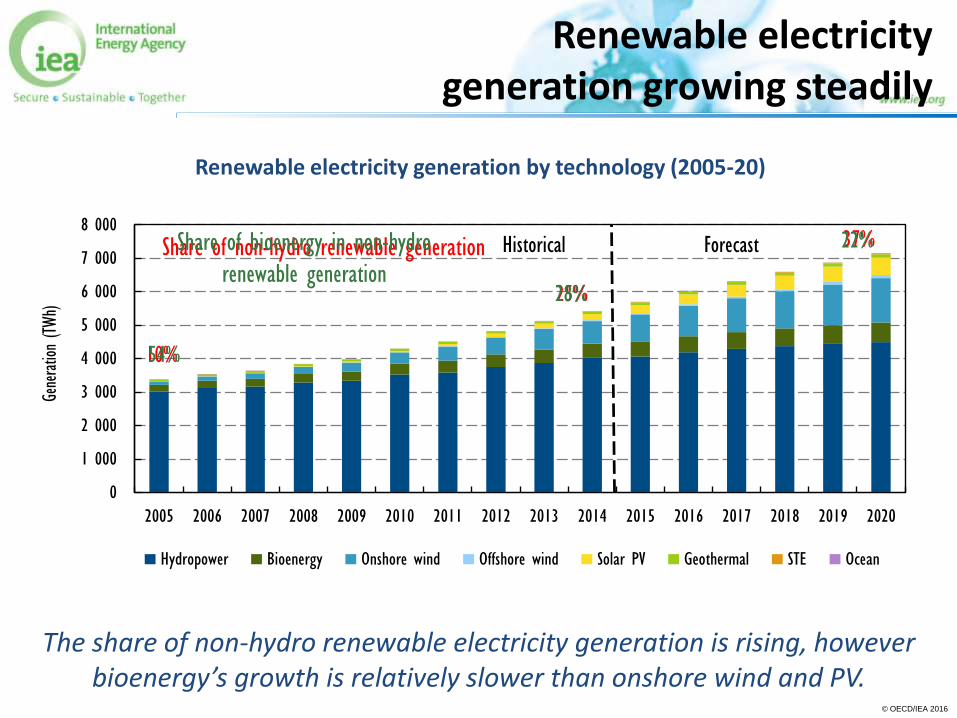
The share of non-hydro renewable electricity generation is rising, however bioenergy’s growth is relatively slower than onshore wind and PV.
Renewable electricity generation growing steadily
Renewable electricity generation by technology (2005-20)
0
1 000
2 000
3 000
4 000
5 000
6 000
7 000
8 000
2005 2006 2007 2008 2009 2010 2011 2012 2013 2014 2015 2016 2017 2018 2019 2020
Gene
ratio
n (TWh)
Hydropower Bioenergy Onshore wind Offshore wind Solar PV Geothermal STE Ocean
10%
25%
37%Share of non-hydro renewable generation
54%
28%
22%Share of bioenergy in non-hydro
renewable generationForecastHistorical
© OECD/IEA 2016
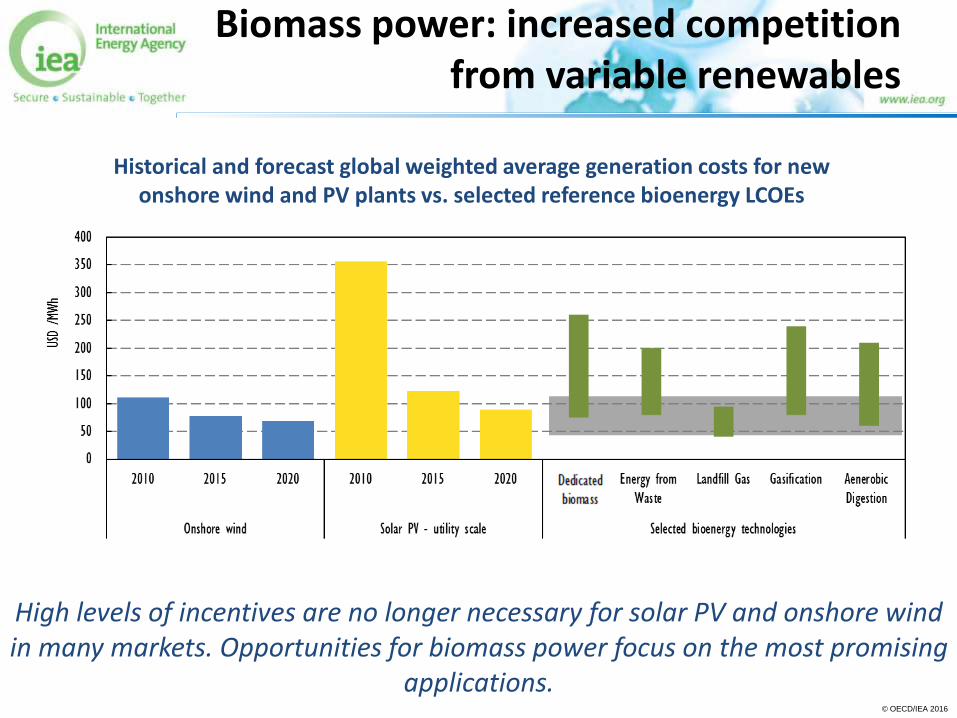
Biomass power: increased competition from variable renewables
Historical and forecast global weighted average generation costs for new onshore wind and PV plants vs. selected reference bioenergy LCOEs
High levels of incentives are no longer necessary for solar PV and onshore wind in many markets. Opportunities for biomass power focus on the most promising
applications.
© OECD/IEA 2016
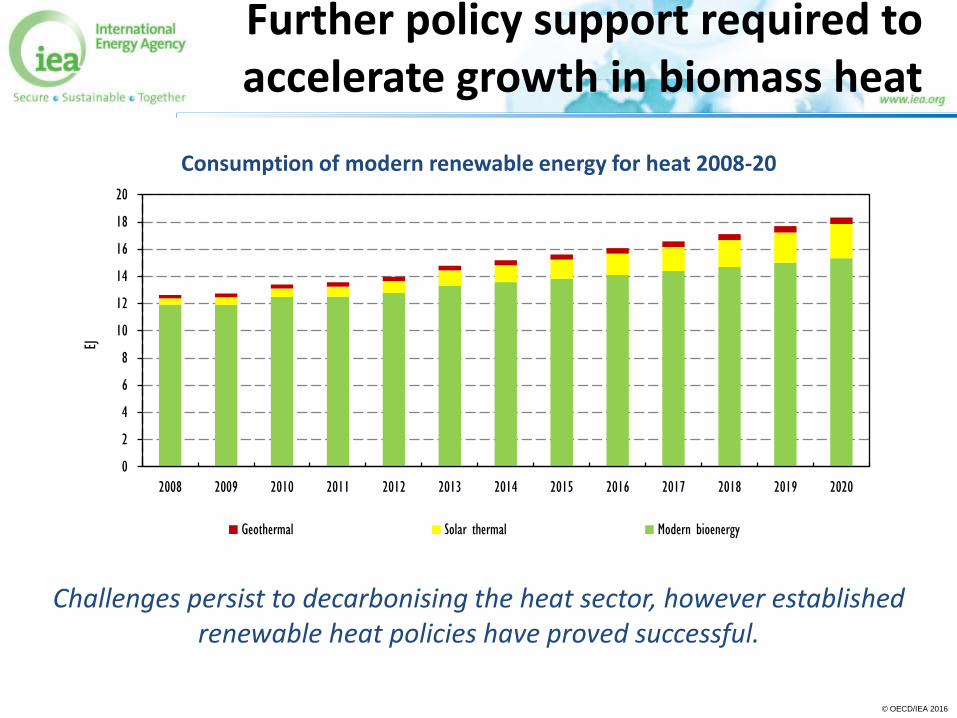
Further policy support required to accelerate growth in biomass heat
Consumption of modern renewable energy for heat 2008-20
Challenges persist to decarbonising the heat sector, however established renewable heat policies have proved successful.
0
2
4
6
8
10
12
14
16
18
20
2008 2009 2010 2011 2012 2013 2014 2015 2016 2017 2018 2019 2020
EJ
Geothermal Solar thermal Modern bioenergy
© OECD/IEA 2016
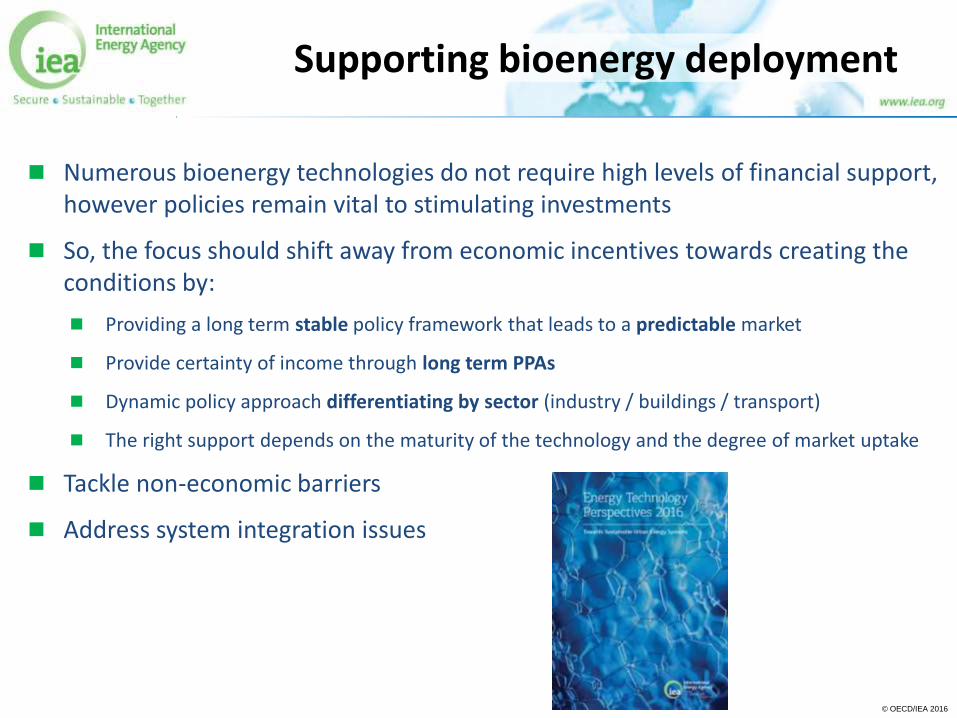
Numerous bioenergy technologies do not require high levels of financial support, however policies remain vital to stimulating investments
So, the focus should shift away from economic incentives towards creating the conditions by:
Providing a long term stable policy framework that leads to a predictable market
Provide certainty of income through long term PPAs
Dynamic policy approach differentiating by sector (industry / buildings / transport)
The right support depends on the maturity of the technology and the degree of market uptake
Tackle non-economic barriers
Address system integration issues
Supporting bioenergy deployment
© OECD/IEA 2016
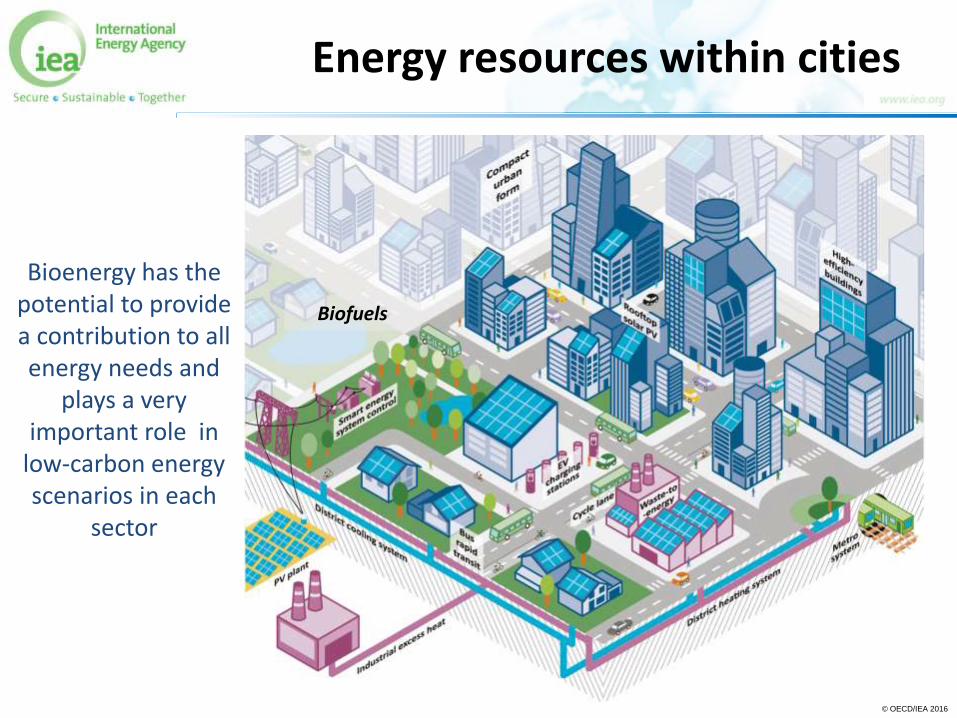
Energy resources within cities
Biofuels
Bioenergy has the potential to provide a contribution to all energy needs and
plays a very important role in
low-carbon energy scenarios in each
sector
© OECD/IEA 2016
With cost reductions in onshore wind and PV systems, biomass power applications focus on the most promising technology under local conditions.
Further policy action is needed for heat and biofuel sectors, in the face of structural challenges (low oil price environment). Wavering policy commitments risk undermining investor confidence and market growth.
COP21 was historic and a catalyst for more innovation, research and investment in clean energy technologies
Acting together with industry, national and local governments can drive innovation through international co-operation
Closing remarks
© OECD/IEA 2016© OECD/IEA 2015
Thank you for your attention!
© OECD/IEA 2016
Additional material
© OECD/IEA 2016
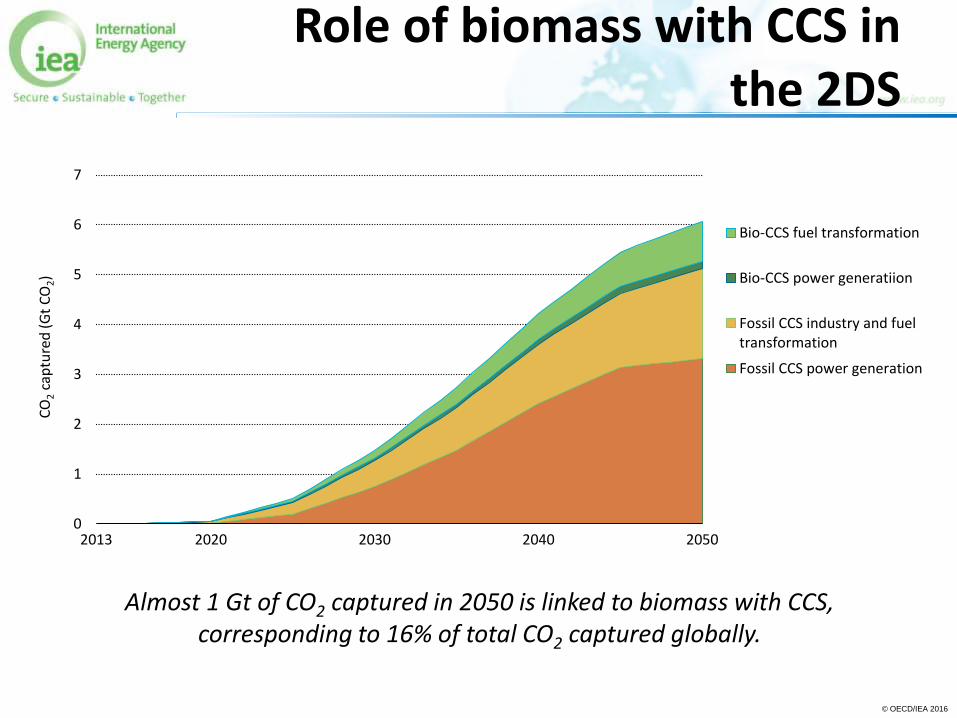
Role of biomass with CCS in the 2DS
Almost 1 Gt of CO2 captured in 2050 is linked to biomass with CCS, corresponding to 16% of total CO2 captured globally.
0
1
2
3
4
5
6
7
2013 2020 2030 2040 2050
CO
2ca
ptu
red
(G
t C
O2)
Bio-CCS fuel transformation
Bio-CCS power generatiion
Fossil CCS industry and fueltransformation
Fossil CCS power generation
© OECD/IEA 2016
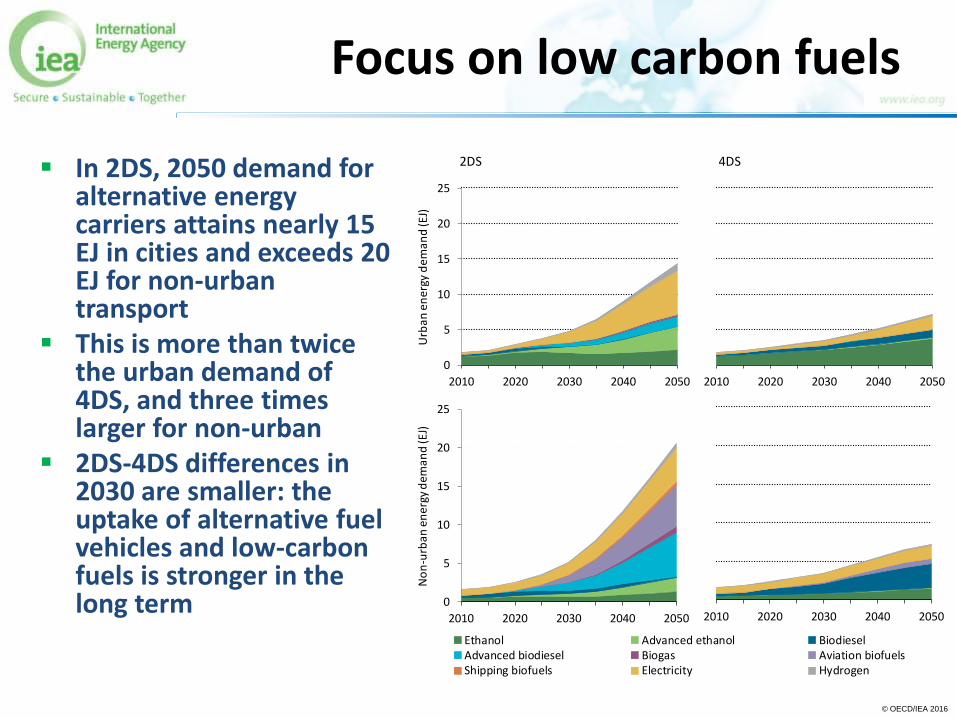
Focus on low carbon fuels
In 2DS, 2050 demand for alternative energy carriers attains nearly 15 EJ in cities and exceeds 20 EJ for non-urban transport
This is more than twice the urban demand of 4DS, and three times larger for non-urban
2DS-4DS differences in 2030 are smaller: the uptake of alternative fuel vehicles and low-carbon fuels is stronger in the long term
2DS 4DS
0
5
10
15
20
25
2010 2020 2030 2040 2050
No
n-u
rban
en
ergy
dem
an
d (E
J)
Ethanol Advanced ethanol BiodieselAdvanced biodiesel Biogas Aviation biofuelsShipping biofuels Electricity Hydrogen
0
5
10
15
20
25
2010 2020 2030 2040 2050
Urb
an e
ner
gy d
ema
nd
(EJ)
2010 2020 2030 2040 2050 2010
2010 2020 2030 2040 2050 2010
© OECD/IEA 2016
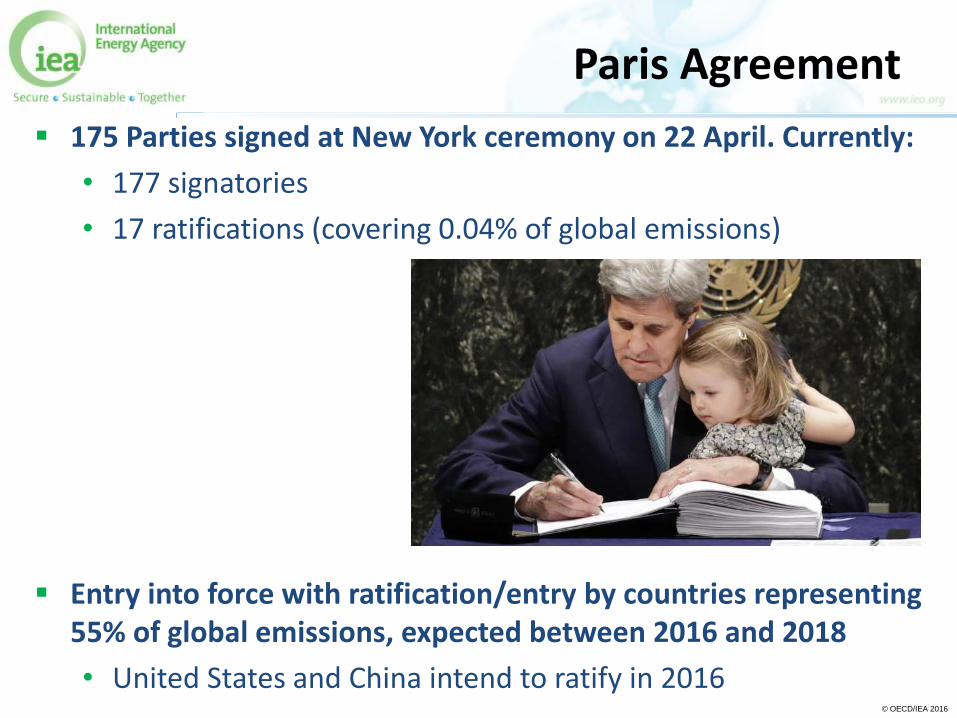
Paris Agreement
175 Parties signed at New York ceremony on 22 April. Currently:
• 177 signatories
• 17 ratifications (covering 0.04% of global emissions)
Entry into force with ratification/entry by countries representing 55% of global emissions, expected between 2016 and 2018
• United States and China intend to ratify in 2016