Embed Size (px)
Citation preview
Energy System Transition: Megatrends, disruptors, future markets and business models
Pre- feasibility Study on Business Opportunities for Women in a Changing Energy Value Chain in West Africa
Situation Analysis Report
DRAFT
With technical assistance from: Azam Pasha, CEO, Jadenex Technologies FZCO
With funding from:

Page 1 of 137
“The next technology revolution is set to happen in the clean energy sector. If the existing barriers
are not addressed now, and women given the support to be engaged in the sector, it would be a
missed opportunity not just for women but for the achievement of an inclusive and sustainable
development.”
Mahama Kappiah, Executive Director ECREEE, Foreword from ‘Situation Analysis Report on
Gender and Energy Issues in the ECOWAS Member States (2015)
Page 2 of 137
Table of Contents
Acknowledgments .................................................................................................................................. 4
List of Abbreviations and Acronyms ................................................................................................... 8
List of Figures ......................................................................................................................................... 9
List of Tables ........................................................................................................................................ 11
Executive Summary ............................................................................................................................. 12
1. Introduction .................................................................................................................................. 14
2. Methodology & Plan ..................................................................................................................... 16
16
2.1. Research Design......................................................................................................................... 17
2.2. Sampling ...................................................................................................................................... 17
2.2.1. Country selection .................................................................................................................. 17
2.2.2. Stakeholder selection ............................................................................................................ 20
2.3. Questionnaire Design ................................................................................................................ 20
3. Market Research and Analysis ................................................................................................... 21
3.1. Data Collection ............................................................................................................................. 21
3.2. Data Analysis & Interpretation .................................................................................................... 23
3.3. Presentation and generating the report ..................................................................................... 23
3.4. Limitations .................................................................................................................................... 23
4. Energy System Transition in West Africa .................................................................................. 24
4.1. Megatrends in the Energy Sector ............................................................................................... 24
4.1.1. Technological breakthrough ................................................................................................ 24
4.1.1.1. Electrification ..................................................................................................................... 25
4.1.1.2. Decentralization ................................................................................................................. 27
4.1.1.3. Digitalization Infrastructure .............................................................................................. 31
4.1.1.4. Innovation .......................................................................................................................... 33
4.1.2. Climate change and resource scarcity ............................................................................... 37
4.1.3. Demographic changes .......................................................................................................... 47
4.1.4. The shift in economic power ................................................................................................ 49
4.1.5. Accelerating urbanization .................................................................................................... 56
4.2. Disruption Factors ....................................................................................................................... 57
4.2.1. Customer behavior ................................................................................................................ 57
4.2.2. Competition ............................................................................................................................ 59
Figure 58: Global Primary Energy Supply (Biomass) ....................................................................... 59
4.2.3. Production Service Model .................................................................................................... 62
4.2.4. Distribution channels ............................................................................................................ 64
4.2.5. Government & regulation ..................................................................................................... 65
4.3. Future market models .................................................................................................................. 67
4.3.1. Green command and control ............................................................................................... 68
4.3.2. Ultra-distributed generation ................................................................................................. 72
Page 3 of 137
4.3.3. Local energy systems ........................................................................................................... 73
4.3.4. Regional super grid ............................................................................................................... 75
4.4. Inferences from the Secondary Research and Analysis .......................................................... 75
5. Primary Research and Analysis ................................................................................................. 77
5.1. Purpose ......................................................................................................................................... 79
5.2. Business Model ............................................................................................................................ 88
Figure 97: Gender Gap Ranking (Africa) ............................................................................................ 94
5.3. Operating model/capabilities ...................................................................................................... 95
5.4. Human resources model ............................................................................................................. 96
5.5. Financial performance ................................................................................................................. 98
5.6. Business Model Evolution ........................................................................................................ 110
5.7. Transformations necessary for Women Entrepreneurs......................................................... 114
6. Recommendations ..................................................................................................................... 118
7. Selection of Four Feasibility Studies ....................................................................................... 120
References .......................................................................................................................................... 127
13. Appendices ................................................................................................................................. 131
Annex-1: Questionnaire ..................................................................................................................... 131
Annex-2: Energy Production & Consumption, 2017 ....................................................................... 134
Annex-3: Total Installed Cost for Utility Scale Solar PV Projects and the global average, 2010-2017
135
Annex-4: Total Installed cost ranges and weighted averages for on-shore wind farms (by
country/region, 2010-2016) ................................................................................................................ 136
Annex-5: Total installed costs of bio-mass-fired generation technologies (by country/region)136
Annex-6: Levelized cost of electricity by capacity factor of bio-energy fired projects (2000-2016)137
Annex-7: Cost of Various Cooking Technologies by source ........................................................ 137
Page 4 of 137
Acknowledgments
The ECOWAS Centre for Renewable Energy and Energy Efficiency (ECREEE) would like to acknowledge the invaluable support of the African Development Bank Group (AfDB) and the New Partnership for Africa’s Development (NEPAD) Infrastructure Project Preparatory Facility (IPPF) Special Fund in the development of this situation analysis report on the ‘Pre-feasibility Study on Business Opportunities for Women in a Changing Energy Value Chain in West Africa’, which presents an overview of the state of women’s entrepreneurship across the energy value chain in West Africa. ECREEE would like to extend its sincere gratitude to Geraldine Fraser-Moleketi (Former AfDB Special Envoy on Gender) for her role during the formative stages of the project and to Dana El Hassan (Senior Gender Specialist) and Victoria Flattau (Country Program Coordinator, RDVP), the AfDB task managers of this project, Shem Simuyemba (Manager of the NEPAD-IPPF Special Fund) and Sohna Aminatta Ngum (Consultant – Gender Specialist at the AfDB) for the diverse support provided throughout the development process of the report. Azam Pasha is the lead author of this report, which was completed under the direction and guidance of Monica Maduekwe (the Project Manager, ECREEE). The report benefited from the support of several others. Some of the women entrepreneurs from across the region were identified with the help of Rachel Mahmud (Program Manager, the Global Alliance for Clean Cookstoves - United Nations Foundation), Raihan Elahi (Lead Energy Specialist, World Bank), Michael Ehst (Private Sector Specialist, World Bank), Yuri Lima Handem (Prosper Coordinator, ECREEE), Linda Davis (Director of Strategic Partnerships, Hub Partnership on Women's Entrepreneurship in Renewables – wPower), Maria T. Prebble (Global Gender Office, International Union for Conservation of Nature (IUCN)), Ralph OLAYÉ (Director, Business Development and Project Management from Eranove), Aich Blegbo (Lead Researcher for Cote d’Ivoire Funds and Projects Coordinator), Wisdom Ahiataku-Togobo (Director, Renewable & Alternate Energy), Denise Mortimer (Policy Analyst and Gender Advisor from POWER AFRICA), Billy Yarro (West Africa Energy Lead, Practical Action), Priscilla Achakpa (Executive Director, Women Environmental Programme) and Charlotte Benedicta Ntim (Private Sector Consultant, World Bank). During the country visits, logistical support was provided by (in alphabetical order) - Alice Adedayo (Renewable Energy Focal Point at UNEP and member of the African Energy Advocacy Initiative), Amadou SOW (ICT Specialist/Business Intelligence, United Nations Development Programme), Awa Thiaka DIENG (Assistant, Ministry of Energy and Renewable Energy Development, Senegal), Fatou Thiam SOW (Coordinator, Research and Planning Unit, Ministry of Energy and the Renewable Energy Development, Senegal), Kofi A. Agyarko (Director of Renewable Energy and Energy Efficiency, Energy Commission of Ghana), Kwabena Ampadu Otu-Danquah (Chief/Head of Renewable Energy Division, Energy Commission of Ghana), Michael Kofi Abrokwa (Energy Officer, Energy Commission of Ghana), Paula E Edze (SEforALL National Coordinator, Ghana) and Segun Adaju (Chief Energizing Officer, Consistent Energy Limited). We are grateful to the 37 women entrepreneurs who openly shared their experiences, challenges, and aspirations to help make this study possible. The names of these enterprising women are mentioned below (in alphabetical order):
Aisha Marinho CEO Naturegrid Lagos
Aissatou Diagne Deme Director Free Work Services
Dakar
Ali Habiba Managing Director Sosai Renewable Energies Company
Kaduna
Annick Tanoh CEO GREEN ENERGY
Abidjan
Arlinda Peixoto CEO ISONE – ICT Company
Praia
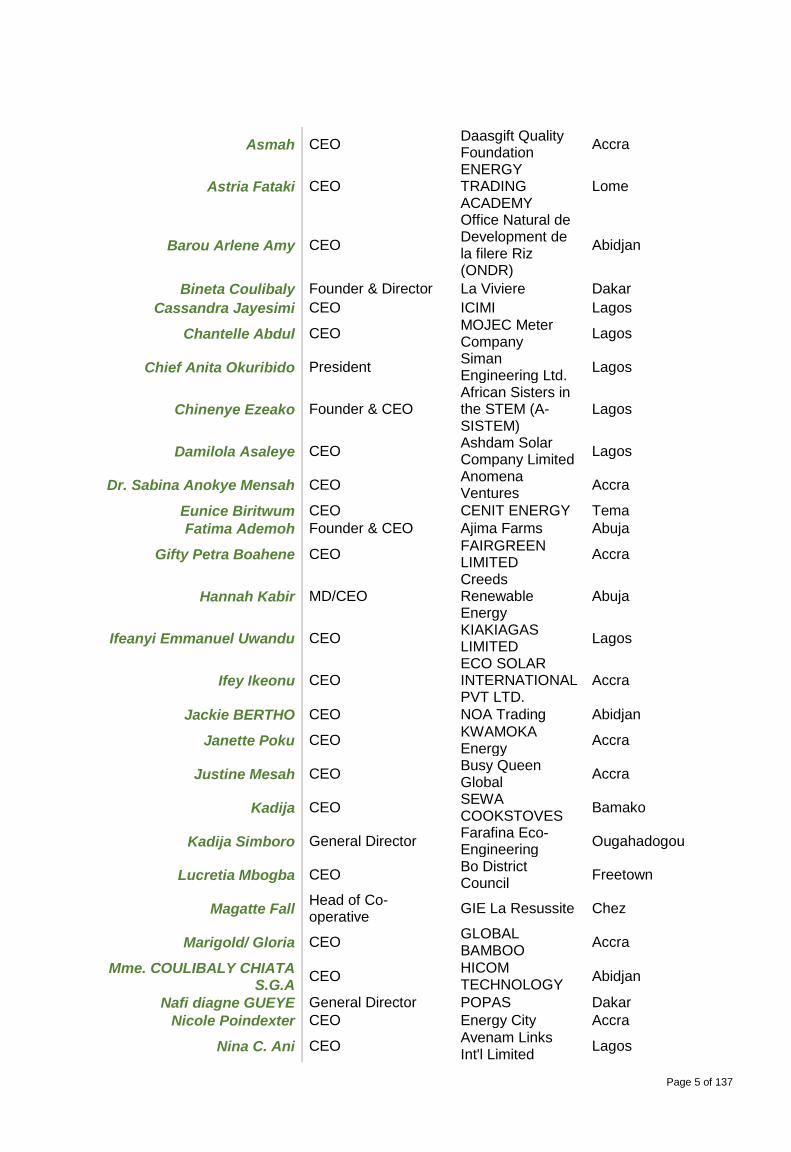
Page 5 of 137
Asmah CEO Daasgift Quality Foundation
Accra
Astria Fataki CEO ENERGY TRADING ACADEMY
Lome
Barou Arlene Amy CEO
Office Natural de Development de la filere Riz (ONDR)
Abidjan
Bineta Coulibaly Founder & Director La Viviere Dakar
Cassandra Jayesimi CEO ICIMI Lagos
Chantelle Abdul CEO MOJEC Meter Company
Lagos
Chief Anita Okuribido President Siman Engineering Ltd.
Lagos
Chinenye Ezeako Founder & CEO African Sisters in the STEM (A-SISTEM)
Lagos
Damilola Asaleye CEO Ashdam Solar Company Limited
Lagos
Dr. Sabina Anokye Mensah CEO Anomena Ventures
Accra
Eunice Biritwum CEO CENIT ENERGY Tema
Fatima Ademoh Founder & CEO Ajima Farms Abuja
Gifty Petra Boahene CEO FAIRGREEN LIMITED
Accra
Hannah Kabir MD/CEO Creeds Renewable Energy
Abuja
Ifeanyi Emmanuel Uwandu CEO KIAKIAGAS LIMITED
Lagos
Ifey Ikeonu CEO ECO SOLAR INTERNATIONAL PVT LTD.
Accra
Jackie BERTHO CEO NOA Trading Abidjan
Janette Poku CEO KWAMOKA Energy
Accra
Justine Mesah CEO Busy Queen Global
Accra
Kadija CEO SEWA COOKSTOVES
Bamako
Kadija Simboro General Director Farafina Eco-Engineering
Ougahadogou
Lucretia Mbogba CEO Bo District Council
Freetown
Magatte Fall Head of Co-operative
GIE La Resussite Chez
Marigold/ Gloria CEO GLOBAL BAMBOO
Accra
Mme. COULIBALY CHIATA S.G.A
CEO HICOM TECHNOLOGY
Abidjan
Nafi diagne GUEYE General Director POPAS Dakar
Nicole Poindexter CEO Energy City Accra
Nina C. Ani CEO Avenam Links Int'l Limited
Lagos
Page 6 of 137
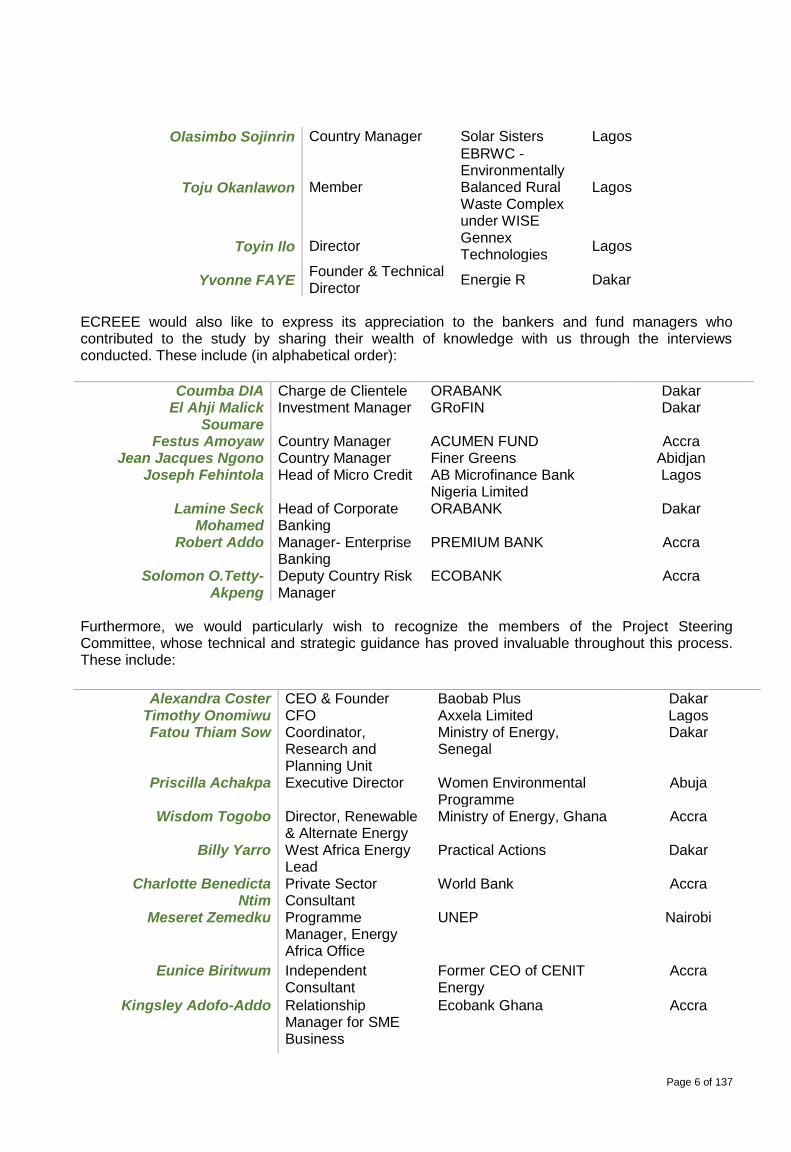
Olasimbo Sojinrin Country Manager Solar Sisters Lagos
Toju Okanlawon Member
EBRWC - Environmentally Balanced Rural Waste Complex under WISE
Lagos
Toyin Ilo Director Gennex Technologies
Lagos
Yvonne FAYE Founder & Technical Director
Energie R Dakar
ECREEE would also like to express its appreciation to the bankers and fund managers who contributed to the study by sharing their wealth of knowledge with us through the interviews conducted. These include (in alphabetical order):
Coumba DIA Charge de Clientele ORABANK Dakar El Ahji Malick
Soumare Investment Manager GRoFIN Dakar
Festus Amoyaw Country Manager ACUMEN FUND Accra Jean Jacques Ngono Country Manager Finer Greens Abidjan
Joseph Fehintola Head of Micro Credit AB Microfinance Bank Nigeria Limited
Lagos
Lamine Seck Mohamed
Head of Corporate Banking
ORABANK Dakar
Robert Addo Manager- Enterprise Banking
PREMIUM BANK Accra
Solomon O.Tetty-Akpeng
Deputy Country Risk Manager
ECOBANK Accra
Furthermore, we would particularly wish to recognize the members of the Project Steering Committee, whose technical and strategic guidance has proved invaluable throughout this process. These include:
Alexandra Coster CEO & Founder Baobab Plus Dakar Timothy Onomiwu CFO Axxela Limited Lagos Fatou Thiam Sow Coordinator,
Research and Planning Unit
Ministry of Energy, Senegal
Dakar
Priscilla Achakpa Executive Director Women Environmental Programme
Abuja
Wisdom Togobo Director, Renewable & Alternate Energy
Ministry of Energy, Ghana Accra
Billy Yarro West Africa Energy Lead
Practical Actions Dakar
Charlotte Benedicta Ntim
Private Sector Consultant
World Bank Accra
Meseret Zemedku
Programme Manager, Energy Africa Office
UNEP Nairobi
Eunice Biritwum
Independent Consultant
Former CEO of CENIT Energy
Accra
Kingsley Adofo-Addo
Relationship Manager for SME Business
Ecobank Ghana Accra
Page 7 of 137
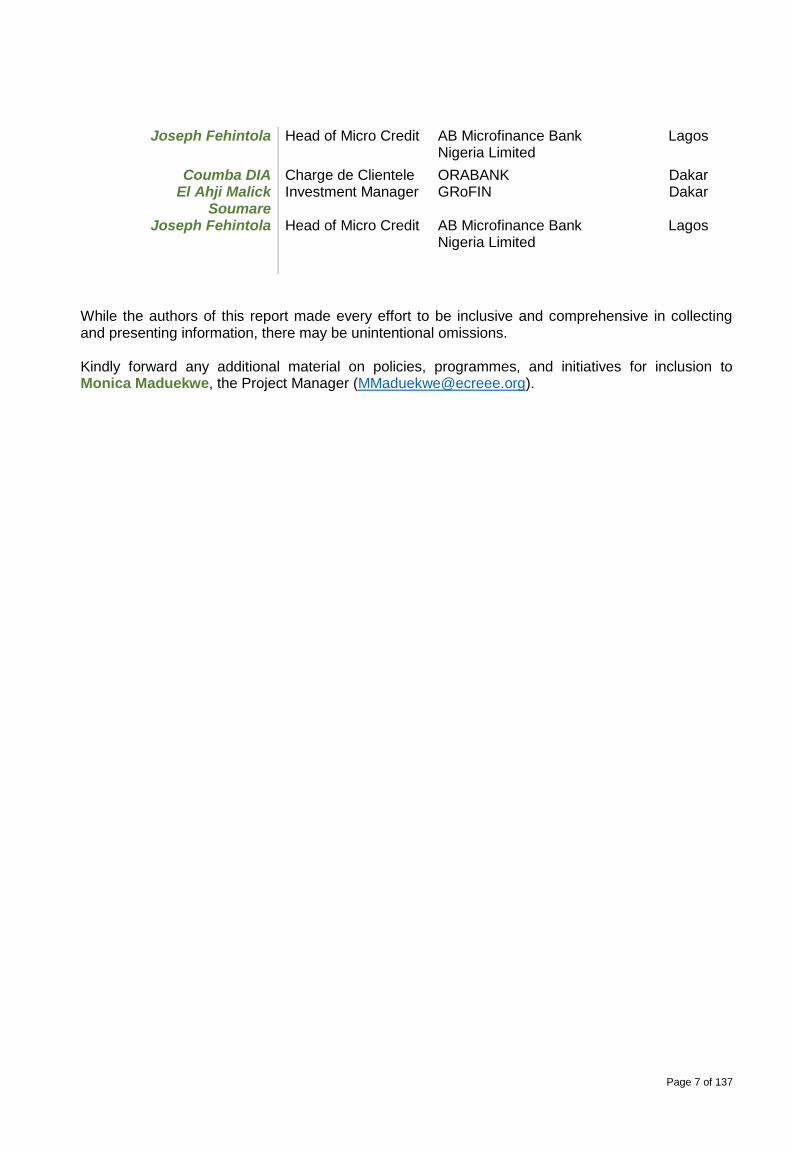
Joseph Fehintola Head of Micro Credit AB Microfinance Bank Nigeria Limited
Lagos
Coumba DIA Charge de Clientele ORABANK Dakar El Ahji Malick
Soumare Investment Manager GRoFIN Dakar
Joseph Fehintola Head of Micro Credit AB Microfinance Bank Nigeria Limited
Lagos
While the authors of this report made every effort to be inclusive and comprehensive in collecting and presenting information, there may be unintentional omissions. Kindly forward any additional material on policies, programmes, and initiatives for inclusion to Monica Maduekwe, the Project Manager ([email protected]).
Page 8 of 137
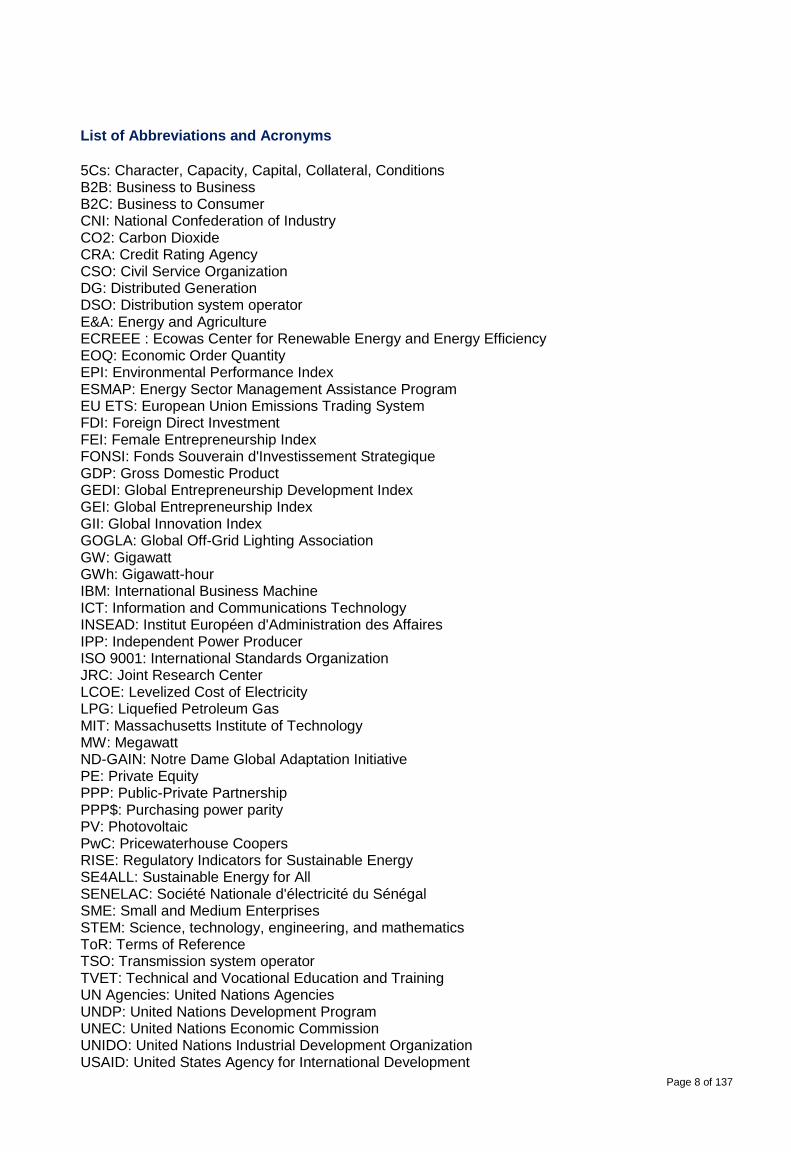
List of Abbreviations and Acronyms 5Cs: Character, Capacity, Capital, Collateral, Conditions B2B: Business to Business B2C: Business to Consumer CNI: National Confederation of Industry CO2: Carbon Dioxide CRA: Credit Rating Agency CSO: Civil Service Organization DG: Distributed Generation DSO: Distribution system operator E&A: Energy and Agriculture ECREEE : Ecowas Center for Renewable Energy and Energy Efficiency EOQ: Economic Order Quantity EPI: Environmental Performance Index ESMAP: Energy Sector Management Assistance Program EU ETS: European Union Emissions Trading System FDI: Foreign Direct Investment FEI: Female Entrepreneurship Index FONSI: Fonds Souverain d'Investissement Strategique GDP: Gross Domestic Product GEDI: Global Entrepreneurship Development Index GEI: Global Entrepreneurship Index GII: Global Innovation Index GOGLA: Global Off-Grid Lighting Association GW: Gigawatt GWh: Gigawatt-hour IBM: International Business Machine ICT: Information and Communications Technology INSEAD: Institut Européen d'Administration des Affaires IPP: Independent Power Producer ISO 9001: International Standards Organization JRC: Joint Research Center LCOE: Levelized Cost of Electricity LPG: Liquefied Petroleum Gas MIT: Massachusetts Institute of Technology MW: Megawatt ND-GAIN: Notre Dame Global Adaptation Initiative PE: Private Equity PPP: Public-Private Partnership PPP$: Purchasing power parity PV: Photovoltaic PwC: Pricewaterhouse Coopers RISE: Regulatory Indicators for Sustainable Energy SE4ALL: Sustainable Energy for All SENELAC: Société Nationale d'électricité du Sénégal SME: Small and Medium Enterprises STEM: Science, technology, engineering, and mathematics ToR: Terms of Reference TSO: Transmission system operator TVET: Technical and Vocational Education and Training UN Agencies: United Nations Agencies UNDP: United Nations Development Program UNEC: United Nations Economic Commission UNIDO: United Nations Industrial Development Organization USAID: United States Agency for International Development
Page 9 of 137
VC: Venture Capital WAPP: West Africa Power Pool WEF: World Economic Forum WER: World Energy Resources WIPO: World Intellectual Property Organization
List of Figures
Figure 1: PwC Energy Transformation Framework ....................................................................................... 14 Figure 2: The energy value chain .................................................................................................................... 15 Figure 3: Modified Energy Transformation Framework ................................................................................ 15 Figure 4: Pre-feasibility Study Activities Flow ............................................................................................... 16 Figure 5: Proven Oil Reserves (selected 4 countries) ................................................................................... 18 Figure 6: Impact of Air Pollution on Population in West Africa ................................................................... 18 Figure 7: Deal Activity in West Africa ............................................................................................................. 19 Figure 8: Start-up Hubs and Subscriber base in selected 4 countries ........................................................ 19 Figure 9: Ease of Doing Business Rankings .................................................................................................. 20 Figure 10: Market Research and Analysis Process ....................................................................................... 21 Figure 11: Grid Edge Transformations
18 ......................................................................................................... 24
Figure 12: Electrification Profile ...................................................................................................................... 25 Figure 13: Regulatory Indicators for Sustainable Energy (out of 100) ........................................................ 27 Figure 14: Frameworks for Decentralization (out of 100) .............................................................................. 28 Figure 15: Low-scalability Products (unit sales per annum) ........................................................................ 28 Figure 16: High-scalability Products (unit sales per annum) ....................................................................... 28 Figure 17: Additional population gaining access and additional investment in the Energy for All Case
relative to the New Policies Scenario, 2017-2030 .......................................................................................... 29 Figure 18: Off-Grid Population ......................................................................................................................... 30 Figure 19: Size of Off-Grid Capacity (in kWp) ................................................................................................ 30 Figure 20: Rural Population served by decentralized renewable energy sources (mini-grids/standalone)
............................................................................................................................................................................. 31 Figure 21: Digitalization Infrastructure-1 (out of 100) ................................................................................... 32 Figure 22: Digitalization Infrastructure-2 ........................................................................................................ 32 Figure 23: Digitalization Infrastructure-3 ........................................................................................................ 33 Figure 24: Innovation Achievers in Sub-Saharan Africa ............................................................................... 34 Figure 25: Innovation Profile (rankings out of 127) ....................................................................................... 35 Figure 26: Global Trends in Renewable Energy Investment 2017 ............................................................... 36 Figure 27: Global Average Net Capacity by Energy Source Type................................................................ 36 Figure 28: Global Patents in Renewable Energy Technologies ................................................................... 37 Figure 29: Notre Dam Adaptation Index .......................................................................................................... 38 Figure 30: Evolution of Countries on Vulnerability and Readiness over last 10 years
29 ........................... 39
Figure 31: Time series plot of selected 4 countries on Notre Dam Adaptation Index ............................... 39 Figure 32: EPI Ranks of selected 4 countries (out of 180) ............................................................................ 40 Figure 33: EPI Comparison of selected 4 countries in West Africa ............................................................. 41 Figure 34: Global Carbon Emissions
30 ............................................................................................................ 42
Figure 35: CO2 Emissions Profile .................................................................................................................... 42 Figure 36: Trends in Renewable Energy Source Type (in selected 4 countries)........................................ 43 Figure 37: Power Generation Capacities across West Africa....................................................................... 43 Figure 38: Electricity Production & Consumption ......................................................................................... 44 Figure 39: Future Power Generation Capacity Projects across West Africa .............................................. 45 Figure 40: Global Renewable Energy Consumption and Generation Trends ............................................. 45 Figure 41: Electricity Generation by Fuel Type and Primary Energy Fuel (Africa) .................................... 46 Figure 42: Future Evolution of Energy Generation by Fuel Type ................................................................ 46 Figure 43: Electricity Access & Population Growth Rates ........................................................................... 47 Figure 44: Youth and Female Population ....................................................................................................... 48 Figure 45: Expected Access to Electricity by 2030 (as per AA) ................................................................... 48
Page 10 of 137
Figure 46: Economy, Growth rate, and Consumer Prices Index .................................................................. 49 Figure 47: Commercial Bank Branches, Depositors, Borrowers and Private Sector Credit ..................... 50 Figure 48: FDI Equity, Debt and Development Assistance Flows ................................................................ 51 Figure 49: Source of Financing for Renewable Energy Projects ................................................................. 52 Figure 50: Public Investments in Renewable Energy by source .................................................................. 52 Figure 51: Private Investments in Renewable Energy by source
40 .............................................................. 53
Figure 52: Global Electricity Investments by Region and Technology Type .............................................. 54 Figure 53: Global Trends in Renewable Energy Investments by Investor Type......................................... 55 Figure 54: Start-Up Entrepreneurs across West Africa (as listed on vc4a.com) ........................................ 55 Figure 55: Urban Population (%) and Rate of Urbanization (%) ................................................................... 56 Figure 56: Consumer Types and their interaction with Utility Providers .................................................... 58 Figure 57: Porter's Five Forces Model ............................................................................................................ 59 Figure 59: Evolution of LCOE over time ......................................................................................................... 60 Figure 60: Number of Mini-Grids ..................................................................................................................... 61 Figure 61: Off-grid Renewable Energy based capacities through pure RE Mini-grids, Hybrid Mini-grids
and Rural PV or Pico-Hydro Systems ............................................................................................................. 61 Figure 62: Convergence of IT and OT in Future Energy Markets ................................................................. 62 Figure 63: Grid Edge Technologies Adoption Curve compared with other Technologies ....................... 63 Figure 64: Future Utility Industry Models ....................................................................................................... 64 Figure 65: Evolving electricity value chain..................................................................................................... 64 Figure 66: Investments in of Pay-As-You-Go Payment cum Distribution Model ....................................... 65 Figure 67: Financial Structuring of Santhiou Mekhe Project in Senegal
61 .................................................. 66
Figure 68: Global Green Bond Issuance over time ........................................................................................ 67 Figure 69: Policies, Tools, and Instruments to mitigate Renewable Energy Project Risks ...................... 67 Figure 70: Nigeria renewable energy policies ................................................................................................ 70 Figure 71: Ghana renewable energy policies ................................................................................................. 71 Figure 72: Senegal renewable energy policies .............................................................................................. 72 Figure 73: Estimates of Renewable Energy Potential in West Africa .......................................................... 73 Figure 74: Technical Potential of Solar PV (Off-grid)
66 .................................................................................. 74
Figure 75: Technical Potential for Wind Energy (Off-grid)66
......................................................................... 74 Figure 76: Regional Integration Comparisons across Africa ....................................................................... 75 Figure 77: Women Entrepreneur Geographic Representation (Interviewed) .............................................. 78 Figure 78: Period of Existence ......................................................................................................................... 79 Figure 79: Product & Service Profile (present) .............................................................................................. 80 Figure 80: Energy sectors of Women Entrepreneurs (present) ................................................................... 81 Figure 81: Climate and Health Impact of different cooking technologies ................................................... 81 Figure 82: Access to Clean Cooking ............................................................................................................... 82 Figure 83: Current access to Efficient Stoves ............................................................................................... 82 Figure 84: Share of Population Using Efficient Cooking .............................................................................. 83 Figure 85: Efficient Cooking Targets (% of Population) ................................................................................ 83 Figure 86: Targets for Efficient Cookstoves (% of Population) .................................................................... 84 Figure 87: Targets for Alternative Fuels (% of Population) .......................................................................... 84 Figure 88: Energy sector (Future) of Women Entrepreneurs ....................................................................... 85 Figure 89: Future Geographical Expansion.................................................................................................... 86 Figure 90: Future Product & Service Expansion ........................................................................................... 87 Figure 91: Reasons for Future Expansion ...................................................................................................... 88 Figure 92: Value Addition Activities ................................................................................................................ 89 Figure 93: Market-size (in number of customers and/or consumers) ......................................................... 90 Figure 94: Market-size (in value US$) .............................................................................................................. 90 Figure 95: Market-share of Women Entrepreneurs ....................................................................................... 91 Figure 96: Margins in Women-owned businesses ......................................................................................... 92 Figure 97: Reason for less Women Entrepreneurs ....................................................................................... 93 Figure 98: Profitability Drivers for Women Entrepreneurs ........................................................................... 95 Figure 99: Operational Challenges for Women Entrepreneurs .................................................................... 95 Figure 100: Employee Profile of Women-owned businesses ....................................................................... 96 Figure 101: Women Employees in Women-owned businesses ................................................................... 97 Figure 102: Labor Challenges for Women Entrepreneurs ............................................................................ 98
Page 11 of 137
Figure 103: Cost drivers for Women-owned businesses .............................................................................. 99 Figure 104: Working Capital Cycle (Composition) ...................................................................................... 101 Figure 105: Average Working Capital Cycle ................................................................................................. 101 Figure 106: Financing of Women-owned businesses ................................................................................. 102 Figure 107: Women Entrepreneurs and Access to Finance from Financial Institutions (Nigeria) ......... 103 Figure 108: Challenges for accessing finance by Women Entrepreneurs ................................................ 103 Figure 109: Desired Financing Types ........................................................................................................... 105 Figure 110: Impact of Cost of Borrowing on LCOE of Project ................................................................... 105 Figure 111: Trends in Asset Finance Investment in Renewable Energy by Security and Sector .......... 106 Figure 112: Working Capital Requirements.................................................................................................. 106 Figure 113: Project Finance Requirements .................................................................................................. 107 Figure 114: Trend of VC and PE Investments into Renewable Energy
101 ................................................. 107
Figure 115: Entrepreneurial Ecosystem for innovative technologies in West Africa103
.......................... 108 Figure 116: Risks in Women-owned businesses ......................................................................................... 109 Figure 117: Factors influencing Biomass Prices ......................................................................................... 109 Figure 118: Current roles for Women Entrepreneurs on the energy value chain .................................... 110 Figure 119: Future Digital Technologies ....................................................................................................... 111 Figure 120: Best fit for Women Entrepreneurs in West Africa in future energy value chains and
business models ............................................................................................................................................. 112 Figure 121: Partner of Partners Business Model ......................................................................................... 113 Figure 122: Product Innovators Business Model ........................................................................................ 113 Figure 123: Grid Developer Business Model ................................................................................................ 114 Figure 124: Merchant Business Model .......................................................................................................... 114 Figure 125: The New Market Paradigm and role of women entrepreneurs as agents of change ........... 115 Figure 126: The new electricity value chain ................................................................................................. 115 Figure 127: Annual Investments in Off-grid Solar over time ...................................................................... 122 Figure 128: Estimated sales and revenues across OGS segments ........................................................... 122 Figure 129: Solar Panel Imports from China in thousand units (Q42016-Q32017)................................... 123 Figure 130: Survey of Key Barriers to growth of OGS industry ................................................................. 123 Figure 131: Installed Off-grid Capacities and CMGs in West Africa .......................................................... 124 Figure 132: Fastest growing tech hubs in West Africa (2018) .................................................................... 126
List of Tables Table 1: Future growth areas by Energy source .............................................................................. 85
Table 2: Number of Women Entrepreneurs based on prioritization for Future Geographical
Expansion ........................................................................................................................................ 86
Table 3: Future growth areas on products and services ................................................................... 87
Table 4: Number of Women Entrepreneurs citing their past and future business growth.................. 92
Table 5: Proportion of Women Employees in Female/Male owned/led businesses-1 ....................... 97
Table 6: Proportion of Women Employees in Female/Male owned/led businesses-2 ....................... 97
Page 12 of 137
Executive Summary
The essence of this situation analysis report on the ‘Pre-feasibility study of Business Opportunities for Women in a Changing Energy Value Chain in West Africa’ is to identify barriers and challenges to promoting women’s entrepreneurship in the energy sector across West Africa, and using this information to develop a gender responsive, regional energy market development strategy that taps into the innate entrepreneurial capacity of ECOWAS women. This pre-feasibility study is part of the ECOWAS Centre for Renewable Energy and Energy Efficiency (ECREEE) project entitled: Feasibility Study on Business Opportunities for Women in a Changing Energy Value Chain in West Africa, which is funded by the New Partnership for Africa’s Development Infrastructure Project Preparation Facility (NEPAD-IPPF), a multi-donor Special Fund hosted by the African Development Bank Group (AfDB). The project seeks to ensure that the region meets its goal of universal energy access for its over 300 million people by harnessing West African womens’ entrepreneurial capacity towards increasing the establishment of energy businesses and deployment of energy technologies to meet the energy needs of the region’s largely unserved population. In line with this objective, the project focuses on regional energy infrastructure development and business opportunities for women-owned businesses in four countries of ECOWAS. As a precursor to the feasibility studies, the pre-feasibility study aims to identify opportunities in the underfinanced small to medium sized women-owned energy businesses in West Africa, having the potential to encourage economic growth in the ECOWAS region. The project on ‘Feasibility Study on Business Opportunities for Women in a Changing Energy Value Chain in West Africa’ is a product of the ECOWAS Policy for Gender Mainstreaming in Energy Access which aims, among others, to increase women participation in energy-related fields in the private sector by 25% by 2020 and 50% by 2030. This study is in line with sustainable development goals numbers 5 (achieve gender equality and empower all women and girls) and 7 (ensure access to affordable, reliable, sustainable and modern energy for all) promulgated by the United Nations. The pre-feasibility study employed the energy transformation framework from the 2014 PricewaterhouseCoopers (‘PwC’) report on ‘The road ahead: Gaining momentum from energy transformation’. The study applies that framework to evaluate the West African entrepreneurial ecosystem (in Nigeria, Ghana, Senegal and Cote d’Ivoire) as it concerns women entrepreneurs. It analyses the megatrends that are impacting the West African energy sector, the disruption factors that are changing the sector, ways through which the current energy market is evolving, ways by which women entrepreneurs are adapting and transforming their business models in order to sustain profitability and longevity.
Results from the study show two types of forces impacting business models and transformations in energy-based businesses which are – external forces (i.e. changing energy generation, transmission, storage and distribution dynamics), and internal forces (i.e. a company’s strategic capabilities which include its operational, human resource and financial dynamics). Both external and internal forces are drivers of change in the energy value chain which bring about changes in market models in the locality, country or region. The women entrepreneurs act as agents of change on the energy value chain, capitalizing on the changes that happen in the energy market to deliver benefits – in the form of better products and services to consumers (‘beneficiaries of change’) creating both economic and social impact. The women entrepreneurs, acting as agents of change, are required to undergo certain transformations in their business models in order to adjust to the changing market models. The continuous pressure to adapt due to both external and internal forces is a dynamic process, and those women entrepreneurs who are able to adapt are those that are better suited to reap the maximum profitability from the opportunities these evolving markets provide them. However, for these women entrepreneurs to capitalize on these new opportunities, they need the support of other stakeholders namely – government agencies, commercial banks, funds, regulatory agencies, and developmental organizations. We have evaluated the drivers of change not
Page 13 of 137
only through secondary data (collected from study reports and data collected from agencies) but also primary data (collected through in-field interviews with women entrepreneurs).
The overall evaluation of our research pointed out that the energy value chain in West Africa is fast evolving due to diffusion of global advances in sustainable energy technologies and women entrepreneurs have already started transforming their business models to adapt to these changes. The challenges that exist for women entrepreneurs range from handling operational complexities, technological ability, employee training and development, recruitment challenges to financial prudence. The requirement to balance personal and business responsibilities, dealing with cultural stigma and lack of technical (and or operational) and financial expertise exerts pressure and restricts the growth of women-owned business, hence there is an urgent need to address their business challenges to help them thrive and succeed in the face of West Africa’s energy transition.
Some of the key achievements of this assignment have been:
a) Identification and formalization of the first-ever database of women entrepreneurs involved in the energy value chain across the four largest countries in West Africa
b) Gaining a comprehensive understanding of women-owned businesses regarding their operational, commercial, technological, labor, legal & regulatory and financial circumstances
c) Gaining insight into the operational, labor and financial challenges faced by women entrepreneurs and simultaneous identification of tactical and strategic solutions to address those challenges
d) Collection of formal field research data on women-led entrepreneurship on the energy value chain that can be processed for supporting other women entrepreneurial policy developments
e) Identification of feasibilities studies that will become templates for expansion and diversification of women entrepreneurs across the West African region
f) Provide banks and funds with an understanding of the operational and financial profile of women owned businesses and to help them estimate the value, tenor, and pricing of products that may fit women entrepreneurs’ business requirements
g) Providing multi-lateral agencies and government institutions perspective for mainstreaming women entrepreneurs on the fast-changing energy value chain
h) Providing women entrepreneurs an insightful perspective of their businesses, identify areas for improvements and identify new opportunities for growth and development
i) Bringing women entrepreneurs and all stakeholder of the women entrepreneurial ecosystem together to network, discuss and resolve issues that can help women entrepreneurs grow their businesses
Page 14 of 137
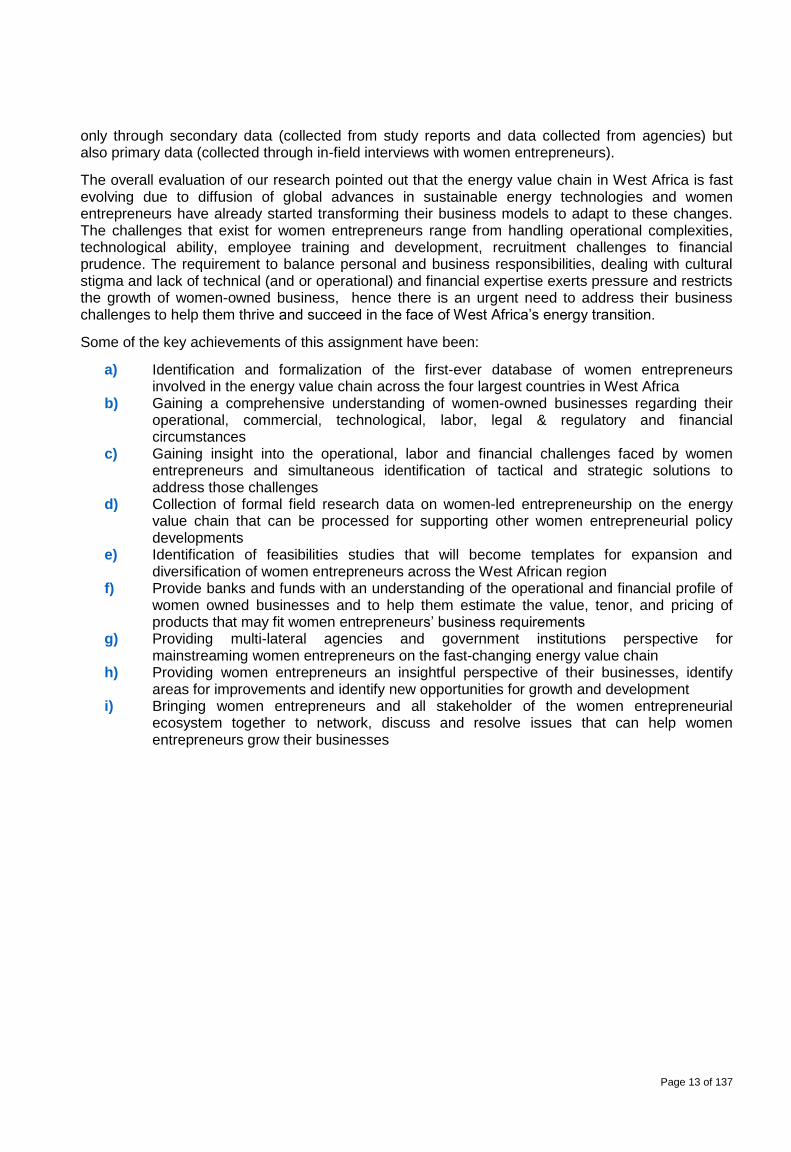
Figure 1: PwC Energy Transformation Framework
1. Introduction This situation analysis report presents the findings of the pre-feasibility study undertaken across the selected four countries which are Nigeria, Ghana, Cote d’Ivoire and Senegal in West Africa1. The prime focus of this assignment was to identify and evaluate the businesses of women entrepreneurs involved with renewable energy and energy efficiency products and services with the goal of providing recommendations on how they may transform and capitalize on the changing energy value chain and, thus, enhance and sustain the profitability and longevity of their businesses. The study followed the energy system transition analytical framework proposed by ECREEE and
conceptualized by Price waterhouse Coopers (PwC) in the report ‘The road ahead - Gaining
momentum from energy transformation’ which looks innovatively into the structure and
transformation of the energy value chain. The report identifies five global megatrends that are
shaping the energy sector and opening opportunities for market creation and development. The five
disruption factors resulting from these megatrends are impacting the energy markets at one level
(i.e. market models) and the business operations (i.e. business models) of energy companies at
another level. These megatrends are changing and shaping the future of the energy value chain and
will lead to the emergence of new roles concerning participants in the energy value chain that
includes – energy generation, transmission, storage, distribution, and consumption.
The pre-feasibility study adapted and employed this framework, as shown in Figure 1, to analyze West Africa’s women entrepreneurial ecosystem, looking at the current state2 and possible changes that may occur in the short term. The study covered the whole energy value chain, identified businesses owned by women, their explicit and implicit challenges, and proposed recommendations which would enable women entrepreneurs in the region adopt new business models for transformation to responsive and larger sized businesses.
1 Women entrepreneurs from other West African countries like Burkina Faso, Mali, Togo, and Sierra Leone
were also interviewed in order to document some of the exceptional work being doing by women entrepreneurs in these countries. 2 This assignment doesn’t go into predictive modelling but only focuses on identifying strategic capabilities of
women-owned businesses and qualitatively determining their adaptability to change
Page 15 of 137
How are megatrends affecting the
energy sector?
What are the disruption
factors impacting the power sector?
What could this mean for future market models?
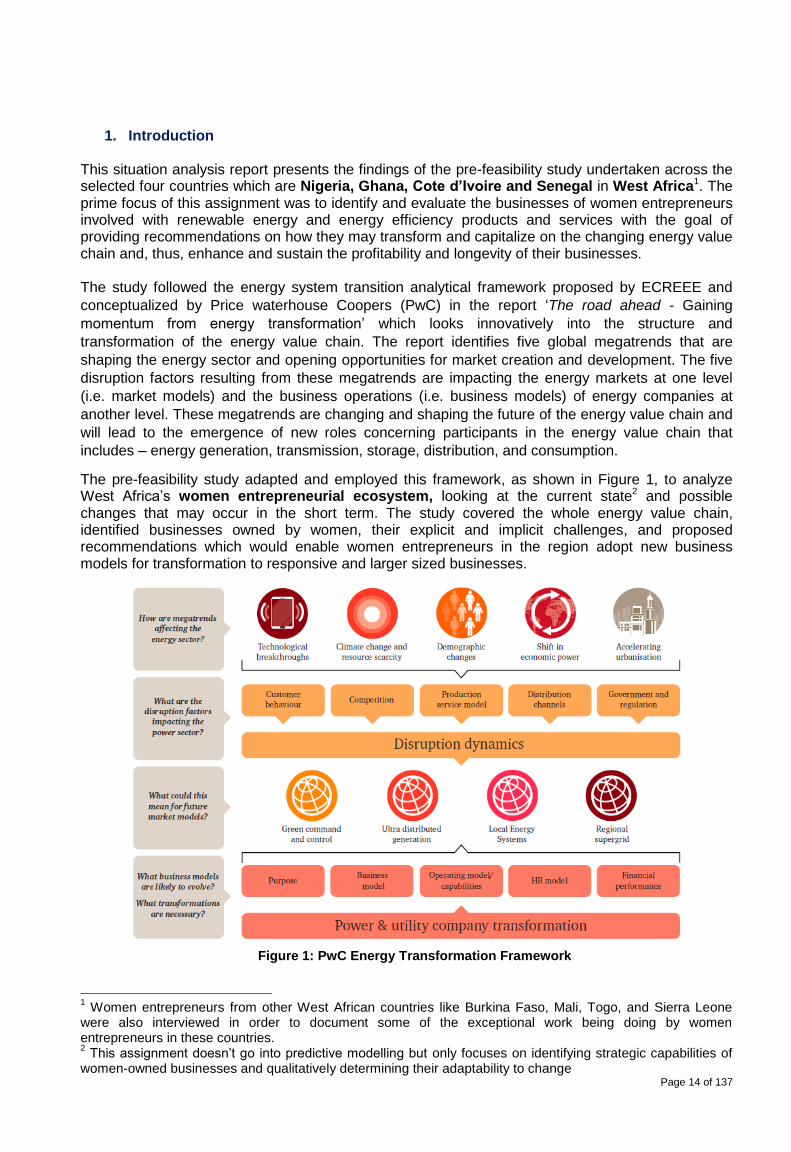
Figure 2: The energy value chain
This study has looked at the complete energy value chain from energy generation, transmission, storage, distribution to consumption with focus on renewable energy and energy efficient energy sources and products and services provided and consumed across this energy value chain.
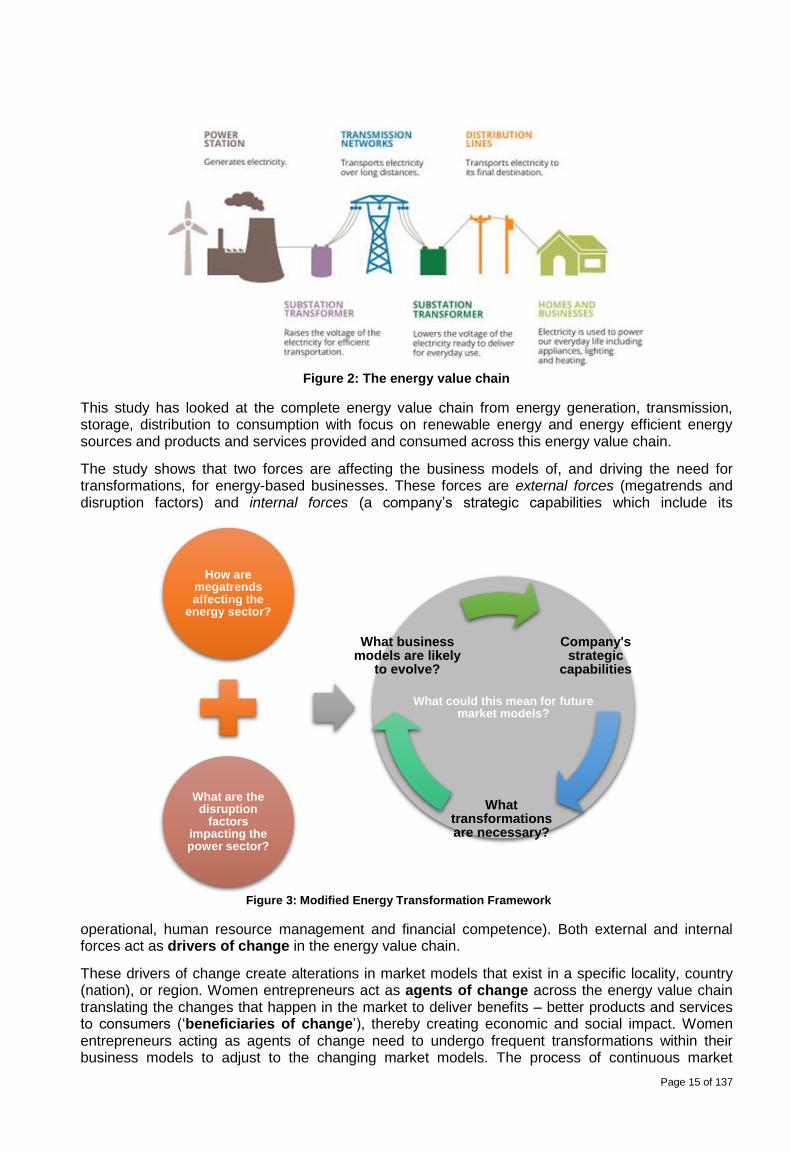
The study shows that two forces are affecting the business models of, and driving the need for transformations, for energy-based businesses. These forces are external forces (megatrends and disruption factors) and internal forces (a company’s strategic capabilities which include its
operational, human resource management and financial competence). Both external and internal forces act as drivers of change in the energy value chain.
These drivers of change create alterations in market models that exist in a specific locality, country (nation), or region. Women entrepreneurs act as agents of change across the energy value chain translating the changes that happen in the market to deliver benefits – better products and services to consumers (‘beneficiaries of change’), thereby creating economic and social impact. Women entrepreneurs acting as agents of change need to undergo frequent transformations within their business models to adjust to the changing market models. The process of continuous market
Company's strategic
capabilities
What transformations are necessary?
What business models are likely
to evolve?
Figure 3: Modified Energy Transformation Framework
Page 16 of 137
Meth
odolo
gy &
Pla
n
Research Design
Sampling
Questionnaire Research
Mark
et R
esearc
h
Data Collection
Data Analysis & Interpretation
Reports Infe
rences
Challenges & Solutions
Project Indentification -4
ToR for 4 selected projects
Work
shop
Feedbacks
Recom
mendations
Present
Future
Ideas
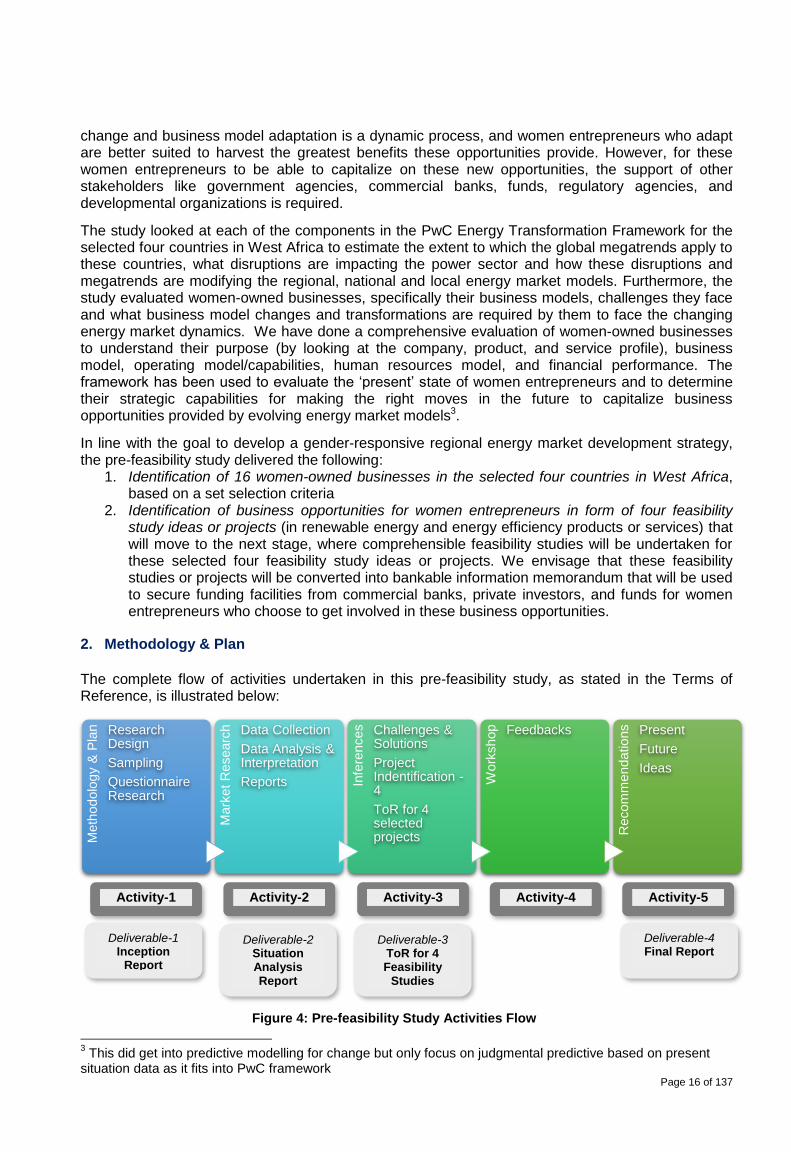
Figure 4: Pre-feasibility Study Activities Flow
change and business model adaptation is a dynamic process, and women entrepreneurs who adapt are better suited to harvest the greatest benefits these opportunities provide. However, for these women entrepreneurs to be able to capitalize on these new opportunities, the support of other stakeholders like government agencies, commercial banks, funds, regulatory agencies, and developmental organizations is required.
The study looked at each of the components in the PwC Energy Transformation Framework for the selected four countries in West Africa to estimate the extent to which the global megatrends apply to these countries, what disruptions are impacting the power sector and how these disruptions and megatrends are modifying the regional, national and local energy market models. Furthermore, the study evaluated women-owned businesses, specifically their business models, challenges they face and what business model changes and transformations are required by them to face the changing energy market dynamics. We have done a comprehensive evaluation of women-owned businesses to understand their purpose (by looking at the company, product, and service profile), business model, operating model/capabilities, human resources model, and financial performance. The framework has been used to evaluate the ‘present’ state of women entrepreneurs and to determine their strategic capabilities for making the right moves in the future to capitalize business opportunities provided by evolving energy market models3.
In line with the goal to develop a gender-responsive regional energy market development strategy, the pre-feasibility study delivered the following:
1. Identification of 16 women-owned businesses in the selected four countries in West Africa, based on a set selection criteria
2. Identification of business opportunities for women entrepreneurs in form of four feasibility study ideas or projects (in renewable energy and energy efficiency products or services) that will move to the next stage, where comprehensible feasibility studies will be undertaken for these selected four feasibility study ideas or projects. We envisage that these feasibility studies or projects will be converted into bankable information memorandum that will be used to secure funding facilities from commercial banks, private investors, and funds for women entrepreneurs who choose to get involved in these business opportunities.
2. Methodology & Plan
The complete flow of activities undertaken in this pre-feasibility study, as stated in the Terms of Reference, is illustrated below:
3 This did get into predictive modelling for change but only focus on judgmental predictive based on present
situation data as it fits into PwC framework
Deliverable-2 Situation Analysis Report
Activity-1 Activity-2 Activity-3 Activity-5
Deliverable-1 Inception
Report
Deliverable-3 ToR for 4 Feasibility
Studies
Deliverable-4 Final Report
Activity-4
Page 17 of 137
2.1. Research Design The research design involved laying down the basic foundation of how the research needs to be
undertaken in compliance with the PwC Energy Transformation Framework. The four components of
the framework were divided based on quality and quantity of data that can be collected and the level
of complex analysis that is required in order to deliver the scope of this pre-feasibility study.
The first three components of the PwC energy transformation framework (i.e. megatrends in the
energy sector, disruption factors, and future market models), which we categorized as external
forces, were evaluated primarily through secondary research and analysis. The fourth
component (business model evolution and transformations necessary), which we categorized as
internal forces (determined by a company’s strategic capabilities), was evaluated through primary
research and analysis.
2.2. Sampling Sampling was done on a judgmental basis to cover diverse elements of this pre-feasibility study, while retaining the depth of feedback that was needed to be achieved interviewing the respondents. Sampling was done on two parameters which were: country selection (i.e. the four pilot countries selected for the study) and stakeholder selection (i.e. women entrepreneurs and other participants that make up the renewable energy and energy efficiency entrepreneurial ecosystem).
2.2.1. Country selection4
Four countries were selected to represent the 15 countries in West Africa (ECOWAS), which were: a) Nigeria - Lagos b) Ghana - Accra c) Cote d’Ivoire - Abidjan d) Senegal - Dakar The selection logic for the selected four countries is based on secondary data analysis and discussions with stakeholders of renewable energy and energy efficiency in the region. The rationale for selection of these four countries was:
a) Market Size (economy and population sizes) b) High per-capita use of electricity on a proportionately larger population size (compared with
an average per capita for West African countries) c) Pressure to diversify: Due to increasing oil consumption (and depleting reserves), there is
increasing pressure to diversify sources of energy (to renewable energy and energy efficient sources)5
4 We added other countries in the region in our survey as there were examples of successful women
entrepreneurs – e.g. in Burkina Faso, Mali, Togo, and Sierra Leone 5 ECOWAS (2014) ‘ECOWAS Renewable Energy and Energy Efficiency Status report 2014’, The American
journal of nursing, 81(7), p. 1297.

Page 18 of 137
Figure 5: Proven Oil Reserves (selected 4 countries)
d) Regionally balanced representation: A balanced representation of Anglophone and Francophone economies in West Africa (with regards to population size, GDP size and electricity generation and consumption).
e) Significant impact on human lives due to household air pollution, hence a high pressure on renewable energy and energy efficient sources based energy generation
Figure 6: Impact of Air Pollution on Population in West Africa
f) Diffusers of technology in the region – the selected four countries have diverse energy mix hence allowing for renewable energy and energy efficient based technology diffusion across the West African region – ‘A diverse energy mix increases the probability of renewable energy technology adoption.’6
g) Trade hubs of the region – presence of the West African region’s largest and busiest Ports and Airports
h) Producers of significantly higher renewable resources (in volume, not in percentage of total energy produced) in the region when compared to other West African countries.
i) Agriculture based economies with significant value of GDP coming from agricultural resources. Traditional biomass is used the most in the rural areas, particularly the residential areas, for cooking. Biomass is also used in traditional agricultural processing and manufacturing industries to produce heat (for cooking and drying). Biomass forms include
6 Birte Pfeiffer and Peter Mulder, ‘Energy Economics’, Volume-40, November 2013, Pages 285-296
Page 19 of 137
firewood, charcoal etc. Dependence on these low efficiency fuels, i.e. traditional biomass, is limiting the industrialization potential of the agricultural sector and contributes to deforestation.
j) All these countries are a major part of the West African ‘Solar Corridor’ and ‘2GW renewable energy corridor.’
k) These selected four countries have relatively larger entrepreneurial populations to interview women entrepreneurs for research purposes7
l) A significant cluster of commercial banks with international banking relationships to facilitate local and international banking instruments, terms, and rates
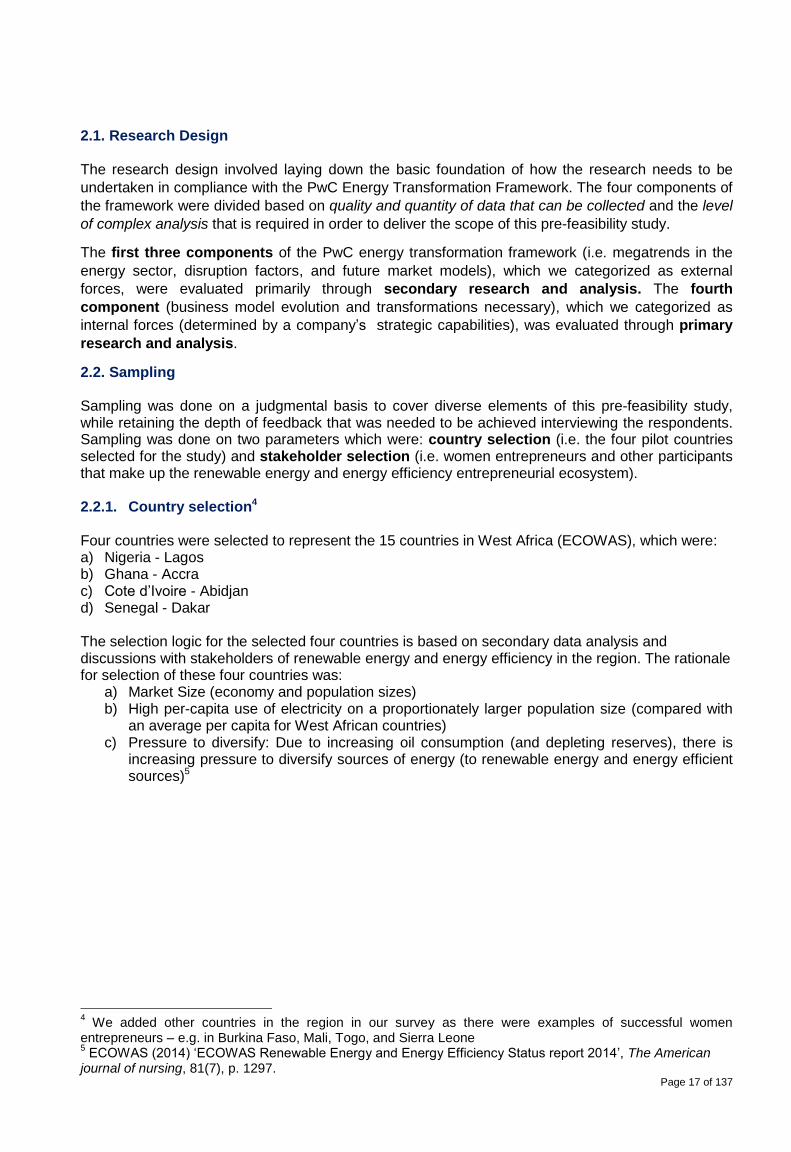
m) Increased Private Equity (PE ) /Venture Capital (VC) deal activity in these countries8
Figure 7: Deal Activity in West Africa
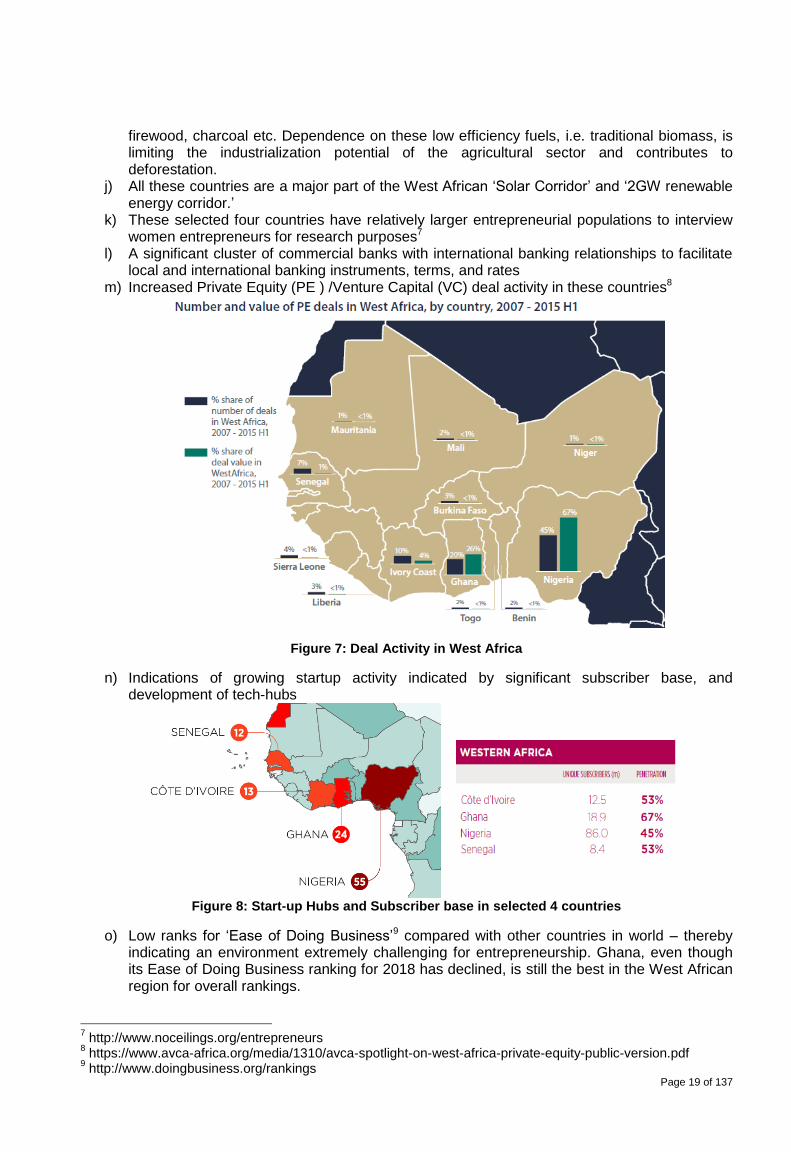
n) Indications of growing startup activity indicated by significant subscriber base, and development of tech-hubs
Figure 8: Start-up Hubs and Subscriber base in selected 4 countries
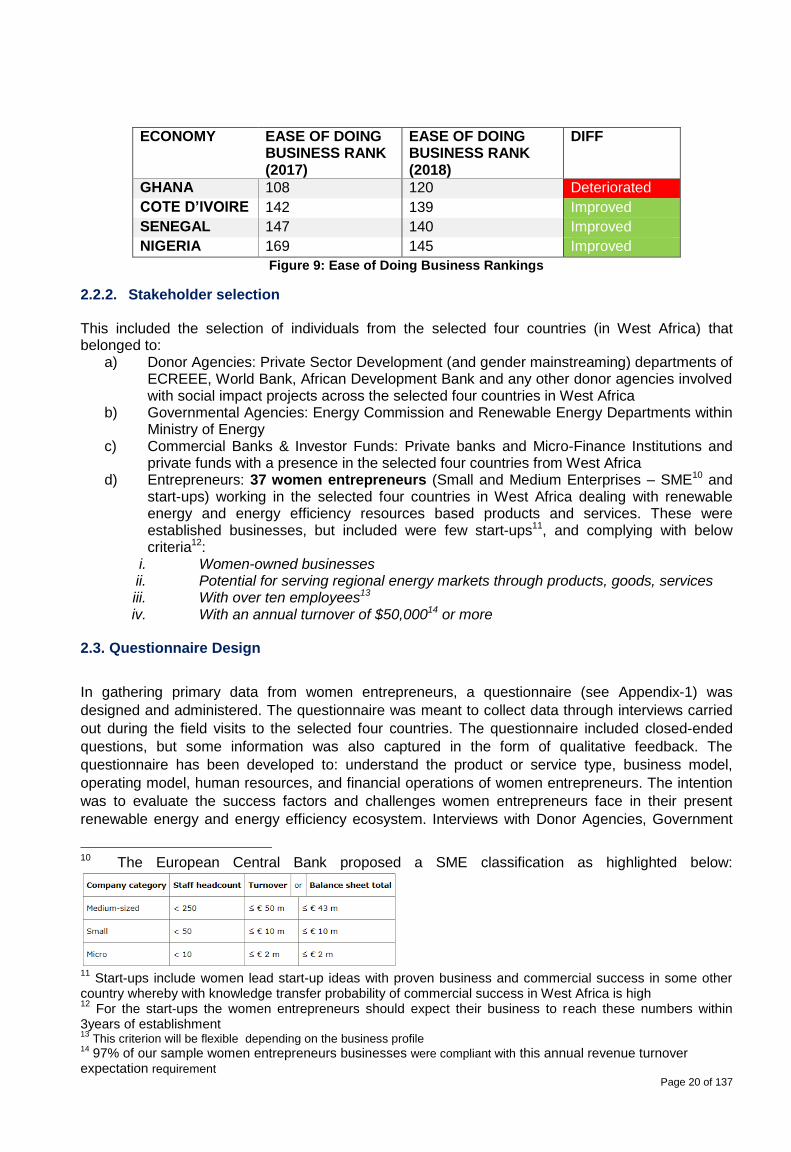
o) Low ranks for ‘Ease of Doing Business’9 compared with other countries in world – thereby indicating an environment extremely challenging for entrepreneurship. Ghana, even though its Ease of Doing Business ranking for 2018 has declined, is still the best in the West African region for overall rankings.
7 http://www.noceilings.org/entrepreneurs
8 https://www.avca-africa.org/media/1310/avca-spotlight-on-west-africa-private-equity-public-version.pdf
9 http://www.doingbusiness.org/rankings
Page 20 of 137
ECONOMY EASE OF DOING BUSINESS RANK (2017)
EASE OF DOING BUSINESS RANK (2018)
DIFF
GHANA 108 120 Deteriorated
COTE D’IVOIRE 142 139 Improved
SENEGAL 147 140 Improved
NIGERIA 169 145 Improved
Figure 9: Ease of Doing Business Rankings
2.2.2. Stakeholder selection
This included the selection of individuals from the selected four countries (in West Africa) that belonged to:
a) Donor Agencies: Private Sector Development (and gender mainstreaming) departments of ECREEE, World Bank, African Development Bank and any other donor agencies involved with social impact projects across the selected four countries in West Africa
b) Governmental Agencies: Energy Commission and Renewable Energy Departments within Ministry of Energy
c) Commercial Banks & Investor Funds: Private banks and Micro-Finance Institutions and private funds with a presence in the selected four countries from West Africa
d) Entrepreneurs: 37 women entrepreneurs (Small and Medium Enterprises – SME10 and start-ups) working in the selected four countries in West Africa dealing with renewable energy and energy efficiency resources based products and services. These were established businesses, but included were few start-ups11, and complying with below criteria12:
i. Women-owned businesses ii. Potential for serving regional energy markets through products, goods, services iii. With over ten employees13 iv. With an annual turnover of $50,00014 or more
2.3. Questionnaire Design
In gathering primary data from women entrepreneurs, a questionnaire (see Appendix-1) was
designed and administered. The questionnaire was meant to collect data through interviews carried
out during the field visits to the selected four countries. The questionnaire included closed-ended
questions, but some information was also captured in the form of qualitative feedback. The
questionnaire has been developed to: understand the product or service type, business model,
operating model, human resources, and financial operations of women entrepreneurs. The intention
was to evaluate the success factors and challenges women entrepreneurs face in their present
renewable energy and energy efficiency ecosystem. Interviews with Donor Agencies, Government
10 The European Central Bank proposed a SME classification as highlighted below:
11
Start-ups include women lead start-up ideas with proven business and commercial success in some other country whereby with knowledge transfer probability of commercial success in West Africa is high 12
For the start-ups the women entrepreneurs should expect their business to reach these numbers within 3years of establishment 13
This criterion will be flexible depending on the business profile 14
97% of our sample women entrepreneurs businesses were compliant with this annual revenue turnover expectation requirement
Page 21 of 137
Agencies, Commercial Banks, and Funds were obtained as qualitative feedback (not by application
of structured questionnaire but through formal discussion sessions) as most of the data from these
agencies is available through secondary sources. The whole focus of this project was to identify,
evaluate and drive women entrepreneurs towards higher profitability, size, and sustainability
3. Market Research and Analysis
Three sub-activities were undertaken under Market Research and Analysis, with the objective to
collect, analyze and interpret data and, to present the data in a way that helps stakeholders make
meaningful decisions.
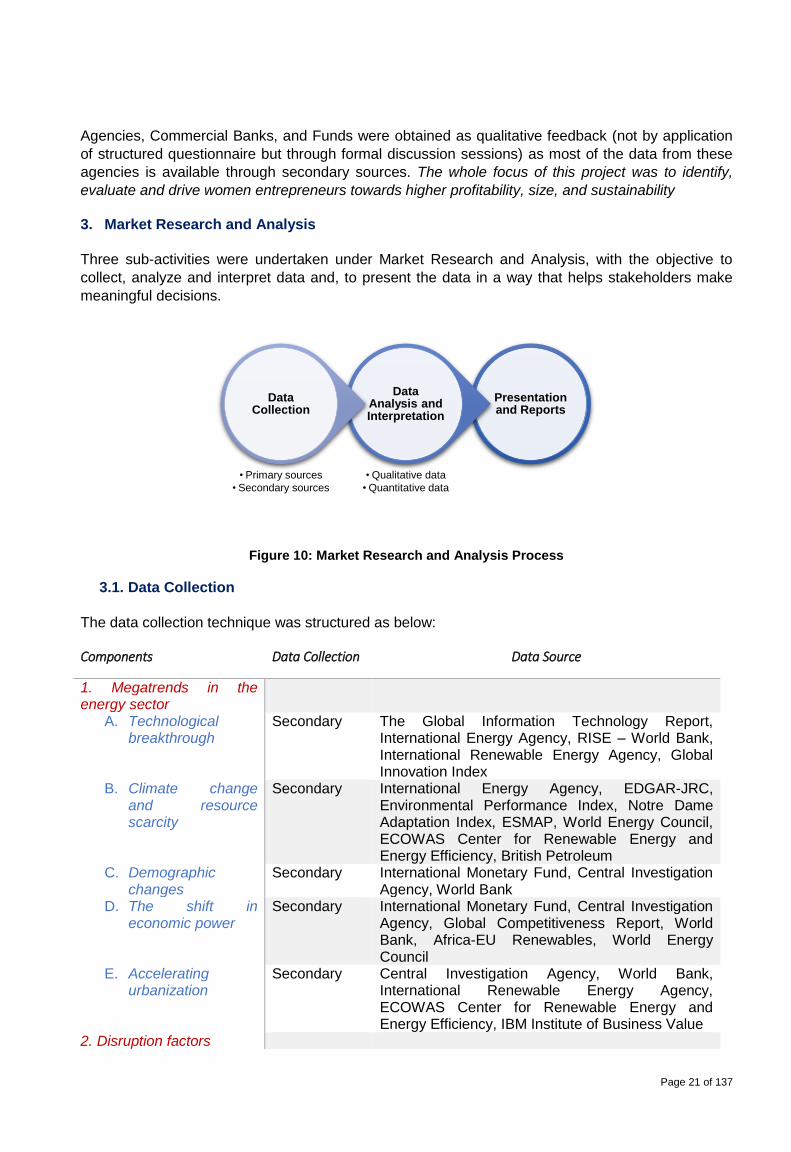
Figure 10: Market Research and Analysis Process
3.1. Data Collection
The data collection technique was structured as below: Components Data Collection Data Source
1. Megatrends in the energy sector
A. Technological breakthrough
Secondary The Global Information Technology Report, International Energy Agency, RISE – World Bank, International Renewable Energy Agency, Global Innovation Index
B. Climate change and resource scarcity
Secondary International Energy Agency, EDGAR-JRC, Environmental Performance Index, Notre Dame Adaptation Index, ESMAP, World Energy Council, ECOWAS Center for Renewable Energy and Energy Efficiency, British Petroleum
C. Demographic changes
Secondary International Monetary Fund, Central Investigation Agency, World Bank
D. The shift in economic power
Secondary International Monetary Fund, Central Investigation Agency, Global Competitiveness Report, World Bank, Africa-EU Renewables, World Energy Council
E. Accelerating urbanization
Secondary Central Investigation Agency, World Bank, International Renewable Energy Agency, ECOWAS Center for Renewable Energy and Energy Efficiency, IBM Institute of Business Value
2. Disruption factors
Presentation and Reports
Data Analysis and Interpretation
• Qualitative data
• Quantitative data
Data Collection
• Primary sources
• Secondary sources
Page 22 of 137
A. Customer behavior Secondary ECOWAS Center for Renewable Energy and Energy Efficiency, IBM Institute of Business Value
B. Competition Secondary World Bio-energy Association, International Renewable Energy Agency, ECOWREX, IBM Institute of Business Value, World Economic Forum
C. Production service model
Secondary International Renewable Energy Agency, ECOWREX, IBM Institute of Business Value, World Economic Forum
D. Distribution channels
Secondary + Primary
International Renewable Energy Agency, World Economic Forum, interview with women entrepreneurs (this included energy products, production, transmission, distribution, and consumption companies)
E. Government and regulation
Secondary ECOWAS Center for Renewable Energy and Energy Efficiency, Bloomberg Energy Finance, International Renewable Energy Agency
3. Future market models A. Green command
and control Secondary+ Primary
PricewaterhouseCoopers, International Renewable Energy Agency, West African Power Pool, United Nations Economic Commission for Africa
B. Ultra-distributed generation
Secondary+ Primary
PricewaterhouseCoopers, International Renewable Energy Agency, West African Power Pool, United Nations Economic Commission for Africa
C. Local energy systems
Secondary+ Primary
PricewaterhouseCoopers, International Renewable Energy Agency, West African Power Pool, United Nations Economic Commission for Africa
D. Regional super grid Secondary+ Primary
PricewaterhouseCoopers, International Renewable Energy Agency, West African Power Pool, United Nations Economic Commission for Africa
4. Evolving business models
A. Purpose Primary Interview with women entrepreneurs (this included energy products, production, transmission, distribution, and consumption companies)
B. Business model Primary Interview with women entrepreneurs (this included energy products, production, transmission, distribution, and consumption companies)
C. Operating model/capabilities
Primary Interview with women entrepreneurs (this included energy products, production, transmission, distribution, and consumption companies)
D. HR model Primary Interview with women entrepreneurs (this included energy products, production, transmission, distribution, and consumption companies)
E. Financial performance
Primary Interview with women entrepreneurs (this included energy products, production, transmission, distribution, and consumption companies), and Commercial Banks and Fund Managers
Primary data collection involved meetings – primarily, with women entrepreneurs, secondarily with representatives of donor institutions, government agencies involved in renewable energy and energy efficiency sector and, thirdly with banking institutions and funds involved in financing women entrepreneurs. Secondary data collection was done from:
Page 23 of 137
a) Reports, case studies and databases that are publicly available from entities like International Energy Agency, EDGAR-JRC, Environmental Performance Index, Notre Dam Adaptation Index, ESMAP, World Energy Council, ECOWAS Center for Renewable Energy and Energy Efficiency, British Petroleum, International Monetary Fund, World Bank, etc.
b) Study and database review of non-public sources like ECREEE, Rural Electric Agencies, World Bank, and UN Agencies
3.2. Data Analysis & Interpretation
Data Analysis and Interpretation included analysis of data gathered in the data collection phase and
transforming that data into information that can help infer and deliver the objectives of this study. The
analyzed data was a mix of qualitative and quantitative data. Most of the data collected through
primary research via a questionnaire, had closed-ended questions and qualified as quantitative data.
The variables for testing that were included in the questionnaire were identified during exploratory
research that involved secondary data analysis and discussions with stakeholders in the renewable
energy and energy efficiency sector.
The information collected was analyzed by deploying statistical tools to interpret and represent the
information in a way that is easy to understand, usable for deriving inferences and can be presented
to a wider audience that has little or no background in statistical analysis to help them understand
the data and its conclusions.
3.3. Presentation and generating the report
The analysis of the information collected has been provided by using statistical graphs and tables,
which present data analysis illustrations and help provide conclusive thoughts about the objectives
of this pre-feasibility study.
3.4. Limitations
There were certain limitations based on the data that could be collected with the limited resources
and within the time at disposal. Hence this assignment was re-shaped (by precise sampling, concise
secondary data collection and simplified analytics) to get the most comprehensive perspective and
provide recommendations that are practically viable, emphatic, and fast to execute.
The adjustments included modifying the Pricewatehouse Coopers energy transformation framework
to fit the women entrepreneur and the regional energy market profile. Quantification of the PwC
energy transformation framework involved:
1. identification of right indicators (relevance and credibility)
2. collating the latest data for the selected four countries
3. alignment of secondary and primary data
On the primary data side – the identification of women entrepreneurs that complied to the project
selection criteria was challenging – primarily because there was no existing structured database of
women entrepreneurs in the energy sector, the data resided with different sources. Furthermore
there are not that many women involved in the energy sector and most of them were scattered in the
region dwelling in rural areas and running small sized business, well below the project’s required
business turnover criteria as mentioned in section 3.2.2. of this report.
Page 24 of 137
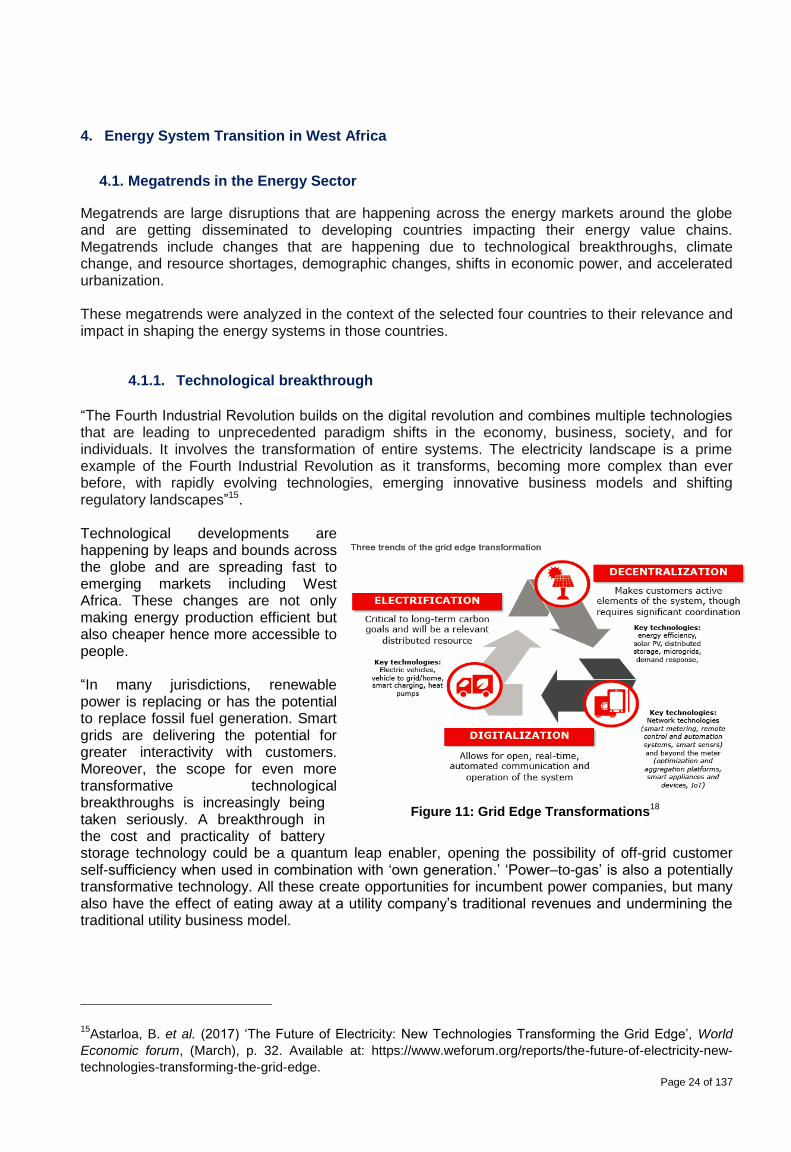
Figure 11: Grid Edge Transformations18
4. Energy System Transition in West Africa
4.1. Megatrends in the Energy Sector
Megatrends are large disruptions that are happening across the energy markets around the globe and are getting disseminated to developing countries impacting their energy value chains. Megatrends include changes that are happening due to technological breakthroughs, climate change, and resource shortages, demographic changes, shifts in economic power, and accelerated urbanization. These megatrends were analyzed in the context of the selected four countries to their relevance and impact in shaping the energy systems in those countries.
4.1.1. Technological breakthrough
“The Fourth Industrial Revolution builds on the digital revolution and combines multiple technologies that are leading to unprecedented paradigm shifts in the economy, business, society, and for individuals. It involves the transformation of entire systems. The electricity landscape is a prime example of the Fourth Industrial Revolution as it transforms, becoming more complex than ever before, with rapidly evolving technologies, emerging innovative business models and shifting regulatory landscapes”15. Technological developments are happening by leaps and bounds across the globe and are spreading fast to emerging markets including West Africa. These changes are not only making energy production efficient but also cheaper hence more accessible to people. “In many jurisdictions, renewable power is replacing or has the potential to replace fossil fuel generation. Smart grids are delivering the potential for greater interactivity with customers. Moreover, the scope for even more transformative technological breakthroughs is increasingly being taken seriously. A breakthrough in the cost and practicality of battery storage technology could be a quantum leap enabler, opening the possibility of off-grid customer self-sufficiency when used in combination with ‘own generation.’ ‘Power–to-gas’ is also a potentially transformative technology. All these create opportunities for incumbent power companies, but many also have the effect of eating away at a utility company’s traditional revenues and undermining the traditional utility business model.
15Astarloa, B. et al. (2017) ‘The Future of Electricity: New Technologies Transforming the Grid Edge’, World
Economic forum, (March), p. 32. Available at: https://www.weforum.org/reports/the-future-of-electricity-new-
technologies-transforming-the-grid-edge.
Page 25 of 137
Other technologies, notably the combination of the internet, mobile devices, data analytics and cloud
computing with smart grids and smart metering, present opportunities for utility companies to get
closer to the customer, play an enhanced ‘energy partner’ role and exploit data opportunities”.16
One important implication of technological advancement has been availability and access to energy
to areas that are off-grid. As consumers come closer to controlling and managing their consumption
patterns, grid edge technologies are transforming the complete energy value chain. Moreover, the
three trends that are bringing about grid edge transformations include – decentralization,
digitalization, and electrification.
In order to evaluate the technological breakthroughs happening in the selected four countries there
needed to be indicators that point out to direct technological breakthroughs that are happening in the
energy value chain and indirect technological breakthroughs that are happening across supportive
technological ecosystem (these in turn support technologies that either exist or can exist for
digitalization). We looked at several indicators and found four indicators that indicate technological
breakthroughs that are happening across the selected four countries, namely: electrification,
decentralization, digitalization infrastructure and innovation. The first two indicators show a
direct disruption of energy markets while the other two indicate indirect technological disruptions
which are facilitating new ICT based technologies to diffuse into the 4 selected countries’ energy
value chain. These four indicators demonstrate the evolving technological landscape that is driving
and will drive energy entrepreneurship in the region
4.1.1.1. Electrification
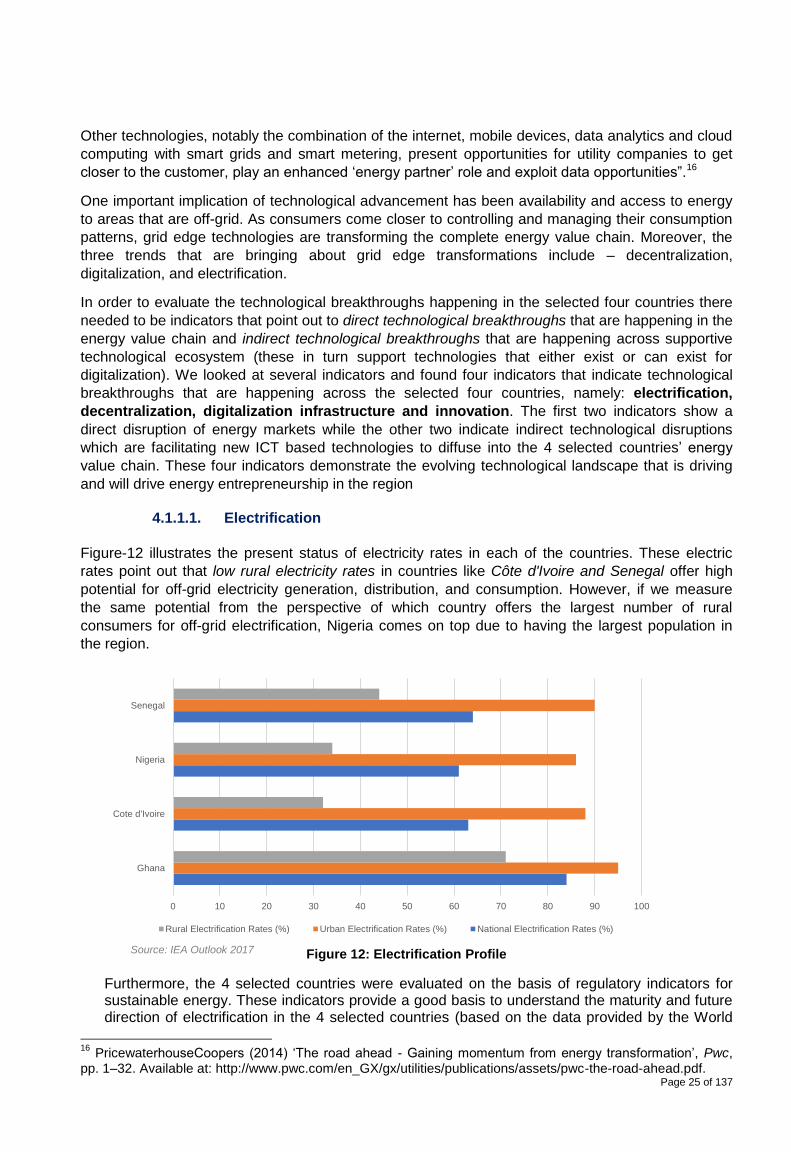
Figure-12 illustrates the present status of electricity rates in each of the countries. These electric
rates point out that low rural electricity rates in countries like Côte d'Ivoire and Senegal offer high
potential for off-grid electricity generation, distribution, and consumption. However, if we measure
the same potential from the perspective of which country offers the largest number of rural
consumers for off-grid electrification, Nigeria comes on top due to having the largest population in
the region.
Figure 12: Electrification Profile
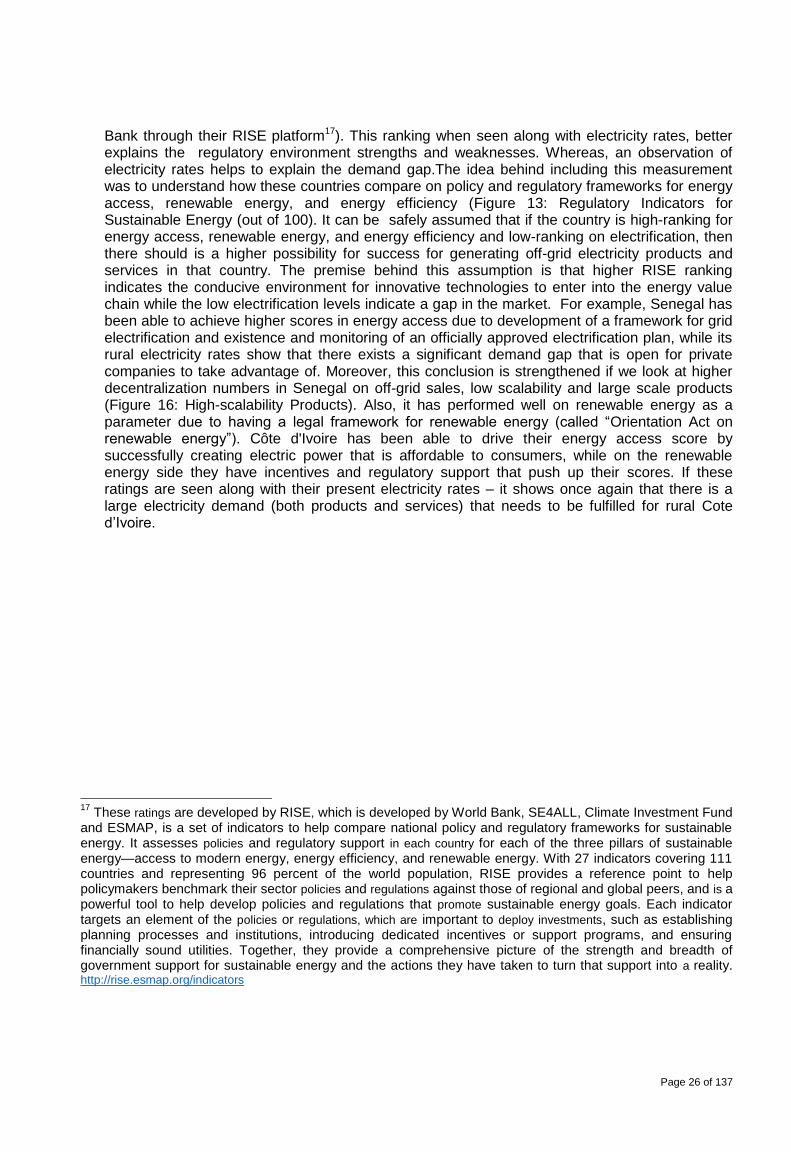
Furthermore, the 4 selected countries were evaluated on the basis of regulatory indicators for sustainable energy. These indicators provide a good basis to understand the maturity and future direction of electrification in the 4 selected countries (based on the data provided by the World
16
PricewaterhouseCoopers (2014) ‘The road ahead - Gaining momentum from energy transformation’, Pwc, pp. 1–32. Available at: http://www.pwc.com/en_GX/gx/utilities/publications/assets/pwc-the-road-ahead.pdf.
0 10 20 30 40 50 60 70 80 90 100
Ghana
Cote d'Ivoire
Nigeria
Senegal
Rural Electrification Rates (%) Urban Electrification Rates (%) National Electrification Rates (%)
Source: IEA Outlook 2017
Page 26 of 137
Bank through their RISE platform17). This ranking when seen along with electricity rates, better explains the regulatory environment strengths and weaknesses. Whereas, an observation of electricity rates helps to explain the demand gap.The idea behind including this measurement was to understand how these countries compare on policy and regulatory frameworks for energy access, renewable energy, and energy efficiency (Figure 13: Regulatory Indicators for Sustainable Energy (out of 100). It can be safely assumed that if the country is high-ranking for energy access, renewable energy, and energy efficiency and low-ranking on electrification, then there should is a higher possibility for success for generating off-grid electricity products and services in that country. The premise behind this assumption is that higher RISE ranking indicates the conducive environment for innovative technologies to enter into the energy value chain while the low electrification levels indicate a gap in the market. For example, Senegal has been able to achieve higher scores in energy access due to development of a framework for grid electrification and existence and monitoring of an officially approved electrification plan, while its rural electricity rates show that there exists a significant demand gap that is open for private companies to take advantage of. Moreover, this conclusion is strengthened if we look at higher decentralization numbers in Senegal on off-grid sales, low scalability and large scale products (Figure 16: High-scalability Products). Also, it has performed well on renewable energy as a parameter due to having a legal framework for renewable energy (called “Orientation Act on renewable energy”). Côte d'Ivoire has been able to drive their energy access score by successfully creating electric power that is affordable to consumers, while on the renewable energy side they have incentives and regulatory support that push up their scores. If these ratings are seen along with their present electricity rates – it shows once again that there is a large electricity demand (both products and services) that needs to be fulfilled for rural Cote d’Ivoire.
17
These ratings are developed by RISE, which is developed by World Bank, SE4ALL, Climate Investment Fund and ESMAP, is a set of indicators to help compare national policy and regulatory frameworks for sustainable energy. It assesses policies and regulatory support in each country for each of the three pillars of sustainable energy—access to modern energy, energy efficiency, and renewable energy. With 27 indicators covering 111 countries and representing 96 percent of the world population, RISE provides a reference point to help policymakers benchmark their sector policies and regulations against those of regional and global peers, and is a powerful tool to help develop policies and regulations that promote sustainable energy goals. Each indicator targets an element of the policies or regulations, which are important to deploy investments, such as establishing planning processes and institutions, introducing dedicated incentives or support programs, and ensuring financially sound utilities. Together, they provide a comprehensive picture of the strength and breadth of government support for sustainable energy and the actions they have taken to turn that support into a reality. http://rise.esmap.org/indicators
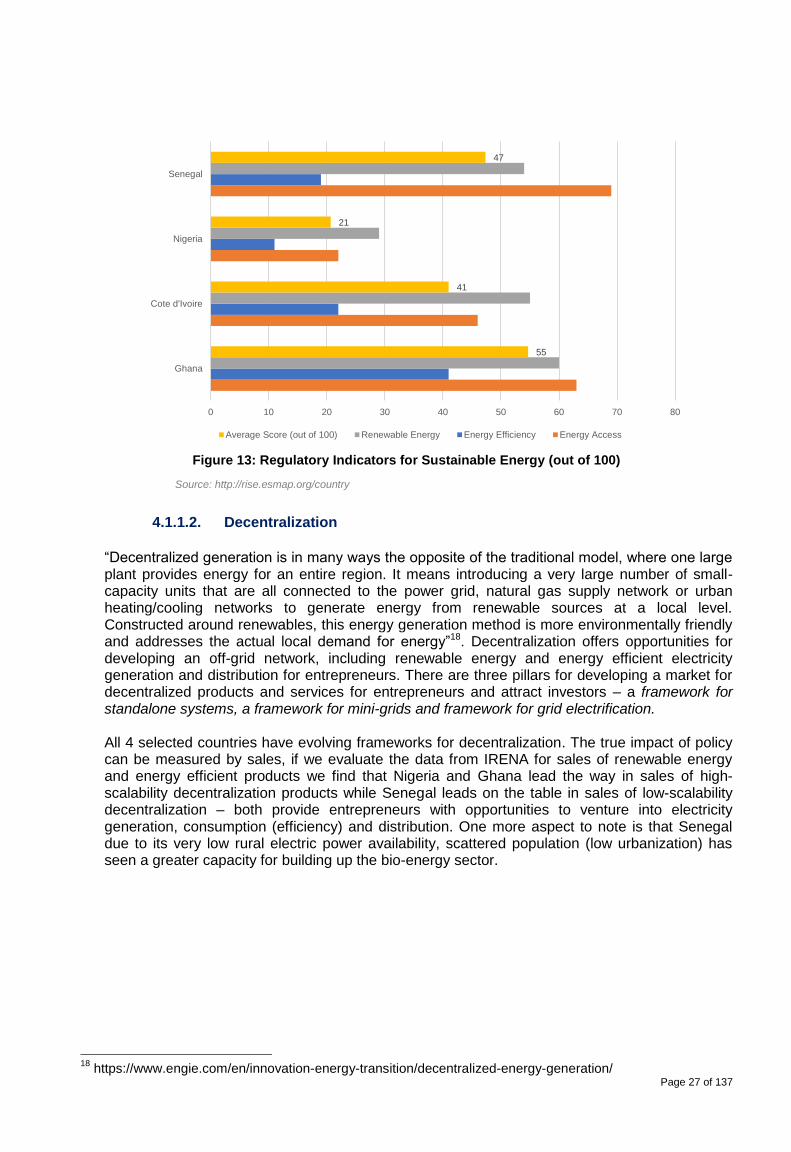
Page 27 of 137
Figure 13: Regulatory Indicators for Sustainable Energy (out of 100)
4.1.1.2. Decentralization
“Decentralized generation is in many ways the opposite of the traditional model, where one large plant provides energy for an entire region. It means introducing a very large number of small-capacity units that are all connected to the power grid, natural gas supply network or urban heating/cooling networks to generate energy from renewable sources at a local level. Constructed around renewables, this energy generation method is more environmentally friendly and addresses the actual local demand for energy”18. Decentralization offers opportunities for developing an off-grid network, including renewable energy and energy efficient electricity generation and distribution for entrepreneurs. There are three pillars for developing a market for decentralized products and services for entrepreneurs and attract investors – a framework for standalone systems, a framework for mini-grids and framework for grid electrification. All 4 selected countries have evolving frameworks for decentralization. The true impact of policy can be measured by sales, if we evaluate the data from IRENA for sales of renewable energy and energy efficient products we find that Nigeria and Ghana lead the way in sales of high-scalability decentralization products while Senegal leads on the table in sales of low-scalability decentralization – both provide entrepreneurs with opportunities to venture into electricity generation, consumption (efficiency) and distribution. One more aspect to note is that Senegal due to its very low rural electric power availability, scattered population (low urbanization) has seen a greater capacity for building up the bio-energy sector.
18
https://www.engie.com/en/innovation-energy-transition/decentralized-energy-generation/
55
41
21
47
0 10 20 30 40 50 60 70 80
Ghana
Cote d'Ivoire
Nigeria
Senegal
Average Score (out of 100) Renewable Energy Energy Efficiency Energy Access
Source: http://rise.esmap.org/country
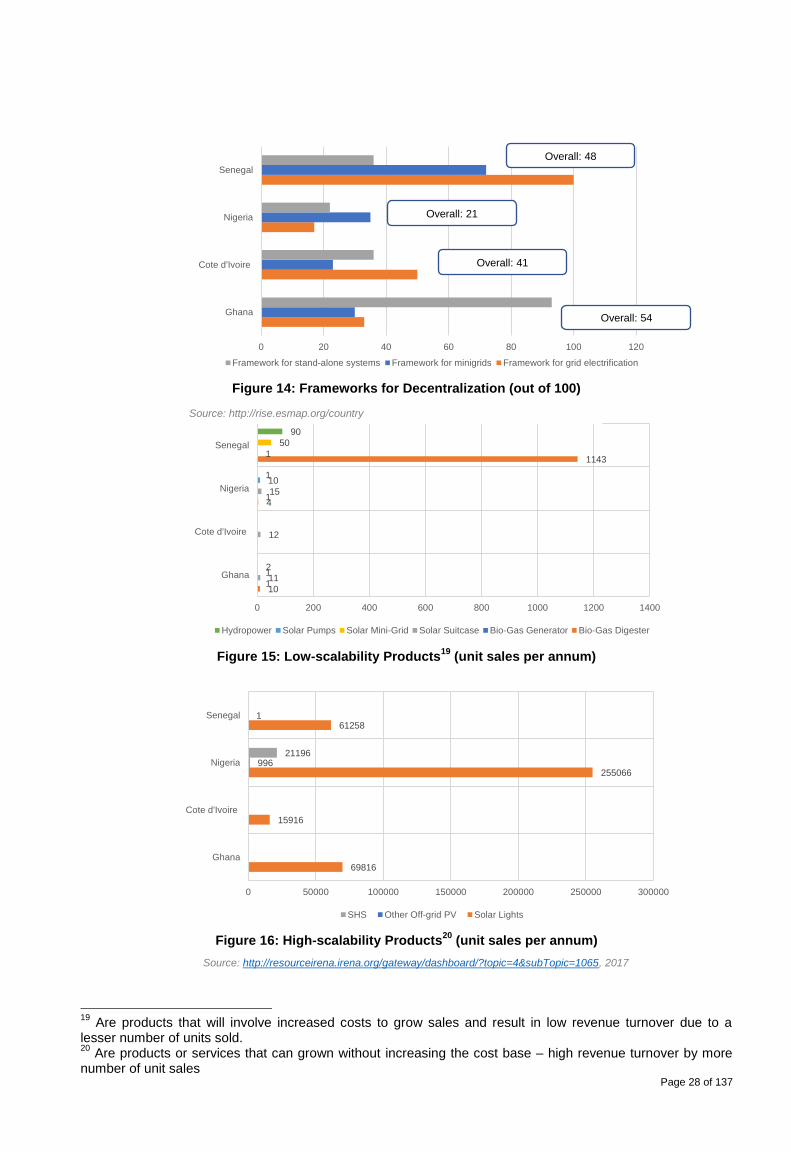
Page 28 of 137
Figure 14: Frameworks for Decentralization (out of 100)
Figure 15: Low-scalability Products
19 (unit sales per annum)
Figure 16: High-scalability Products
20 (unit sales per annum)
19
Are products that will involve increased costs to grow sales and result in low revenue turnover due to a lesser number of units sold. 20
Are products or services that can grown without increasing the cost base – high revenue turnover by more number of unit sales
0 20 40 60 80 100 120
Ghana
Cote d'Ivoire
Nigeria
Senegal
Framework for stand-alone systems Framework for minigrids Framework for grid electrification
10
4
1143
1
1
1
11
12
15
1
50
2
10 1
90
0 200 400 600 800 1000 1200 1400
Ghana
Cote d'Ivoire
Nigeria
Senegal
Hydropower Solar Pumps Solar Mini-Grid Solar Suitcase Bio-Gas Generator Bio-Gas Digester
69816
15916
255066
61258
996
1
21196
0 50000 100000 150000 200000 250000 300000
Ghana
Cote d'Ivoire
Nigeria
Senegal
SHS Other Off-grid PV Solar Lights
Source: http://rise.esmap.org/country
Source: http://resourceirena.irena.org/gateway/dashboard/?topic=4&subTopic=1065, 2017
Overall: 21
Overall: 54
Overall: 41
Overall: 48
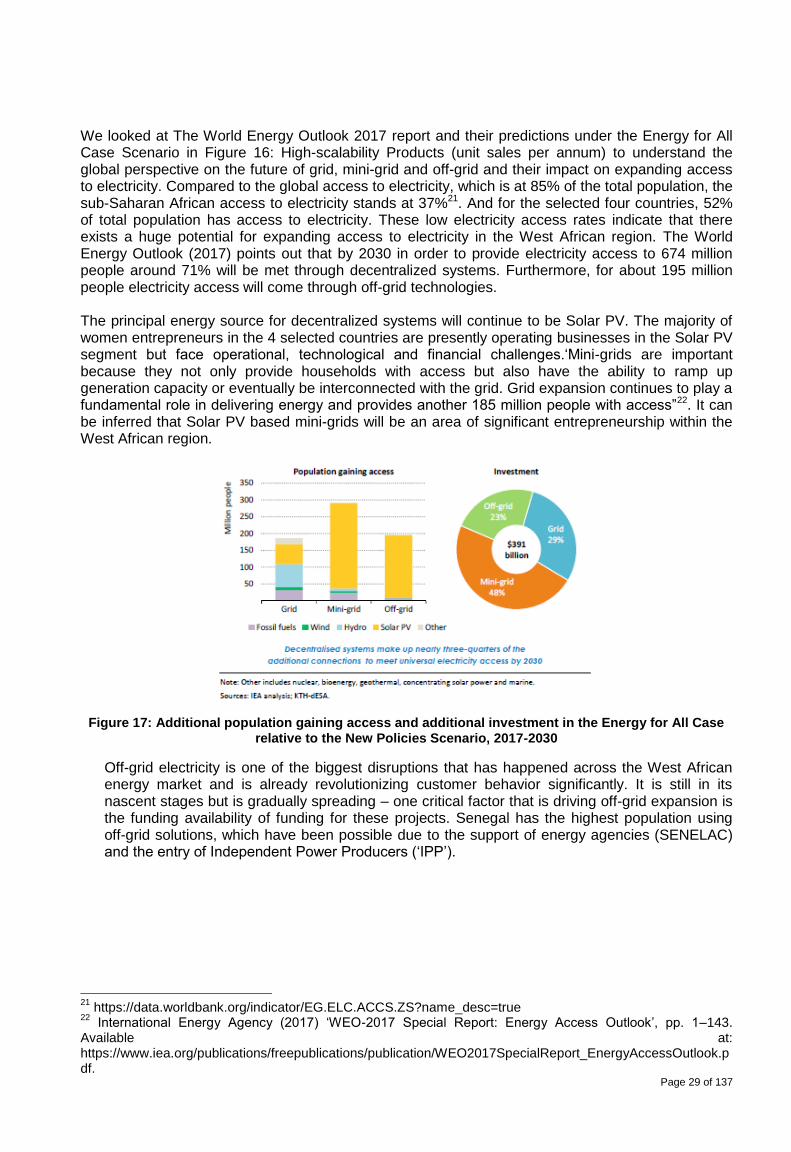
Page 29 of 137
We looked at The World Energy Outlook 2017 report and their predictions under the Energy for All Case Scenario in Figure 16: High-scalability Products (unit sales per annum) to understand the global perspective on the future of grid, mini-grid and off-grid and their impact on expanding access to electricity. Compared to the global access to electricity, which is at 85% of the total population, the sub-Saharan African access to electricity stands at 37%21. And for the selected four countries, 52% of total population has access to electricity. These low electricity access rates indicate that there exists a huge potential for expanding access to electricity in the West African region. The World Energy Outlook (2017) points out that by 2030 in order to provide electricity access to 674 million people around 71% will be met through decentralized systems. Furthermore, for about 195 million people electricity access will come through off-grid technologies.
The principal energy source for decentralized systems will continue to be Solar PV. The majority of women entrepreneurs in the 4 selected countries are presently operating businesses in the Solar PV segment but face operational, technological and financial challenges.‘Mini-grids are important because they not only provide households with access but also have the ability to ramp up generation capacity or eventually be interconnected with the grid. Grid expansion continues to play a fundamental role in delivering energy and provides another 185 million people with access”22. It can be inferred that Solar PV based mini-grids will be an area of significant entrepreneurship within the West African region.
Figure 17: Additional population gaining access and additional investment in the Energy for All Case relative to the New Policies Scenario, 2017-2030
Off-grid electricity is one of the biggest disruptions that has happened across the West African energy market and is already revolutionizing customer behavior significantly. It is still in its nascent stages but is gradually spreading – one critical factor that is driving off-grid expansion is the funding availability of funding for these projects. Senegal has the highest population using off-grid solutions, which have been possible due to the support of energy agencies (SENELAC) and the entry of Independent Power Producers (‘IPP’).
21
https://data.worldbank.org/indicator/EG.ELC.ACCS.ZS?name_desc=true 22
International Energy Agency (2017) ‘WEO-2017 Special Report: Energy Access Outlook’, pp. 1–143. Available at: https://www.iea.org/publications/freepublications/publication/WEO2017SpecialReport_EnergyAccessOutlook.pdf.
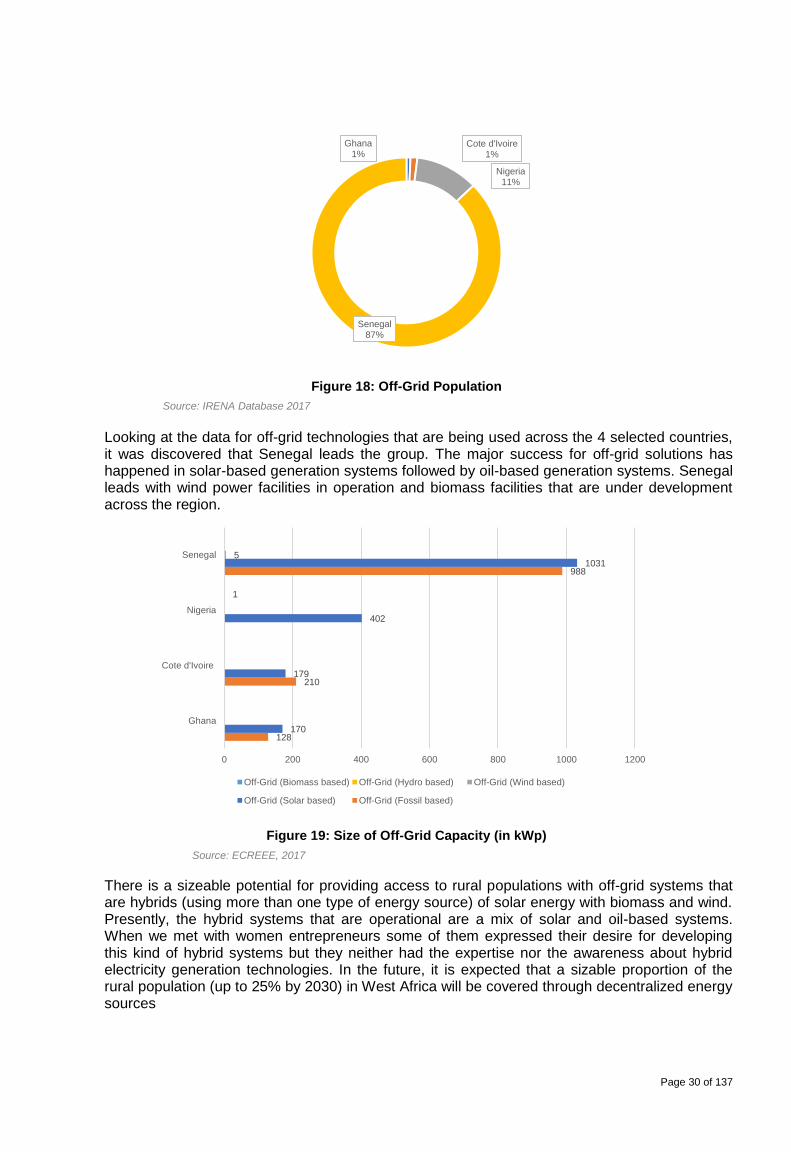
Page 30 of 137
Figure 18: Off-Grid Population
Looking at the data for off-grid technologies that are being used across the 4 selected countries, it was discovered that Senegal leads the group. The major success for off-grid solutions has happened in solar-based generation systems followed by oil-based generation systems. Senegal leads with wind power facilities in operation and biomass facilities that are under development across the region.
Figure 19: Size of Off-Grid Capacity (in kWp)
There is a sizeable potential for providing access to rural populations with off-grid systems that are hybrids (using more than one type of energy source) of solar energy with biomass and wind. Presently, the hybrid systems that are operational are a mix of solar and oil-based systems. When we met with women entrepreneurs some of them expressed their desire for developing this kind of hybrid systems but they neither had the expertise nor the awareness about hybrid electricity generation technologies. In the future, it is expected that a sizable proportion of the rural population (up to 25% by 2030) in West Africa will be covered through decentralized energy sources
Ghana 1%
Cote d'Ivoire 1%
Nigeria 11%
Senegal 87%
128
210
988
170
179
402
1031 5
1
0 200 400 600 800 1000 1200
Ghana
Cote d'Ivoire
Nigeria
Senegal
Off-Grid (Biomass based) Off-Grid (Hydro based) Off-Grid (Wind based)
Off-Grid (Solar based) Off-Grid (Fossil based)
Source: IRENA Database 2017
Source: ECREEE, 2017
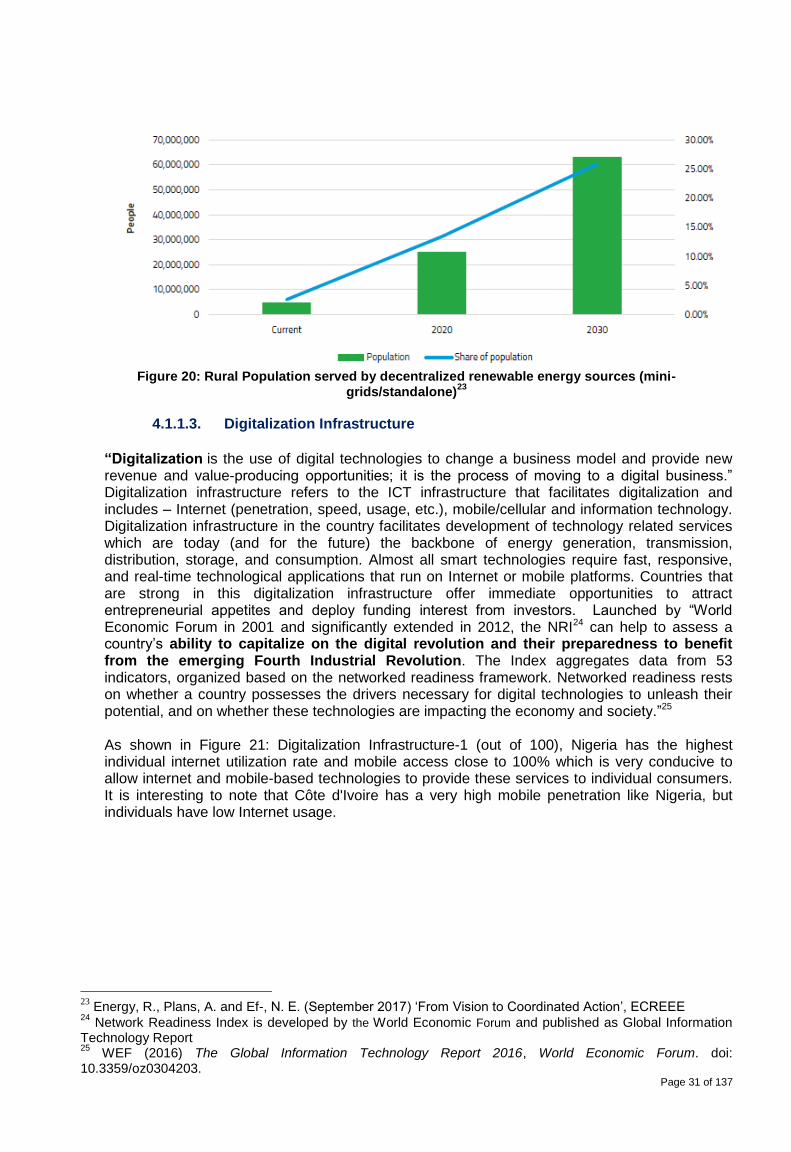
Page 31 of 137
Figure 20: Rural Population served by decentralized renewable energy sources (mini-
grids/standalone)23
4.1.1.3. Digitalization Infrastructure
“Digitalization is the use of digital technologies to change a business model and provide new revenue and value-producing opportunities; it is the process of moving to a digital business.” Digitalization infrastructure refers to the ICT infrastructure that facilitates digitalization and includes – Internet (penetration, speed, usage, etc.), mobile/cellular and information technology. Digitalization infrastructure in the country facilitates development of technology related services which are today (and for the future) the backbone of energy generation, transmission, distribution, storage, and consumption. Almost all smart technologies require fast, responsive, and real-time technological applications that run on Internet or mobile platforms. Countries that are strong in this digitalization infrastructure offer immediate opportunities to attract entrepreneurial appetites and deploy funding interest from investors. Launched by “World Economic Forum in 2001 and significantly extended in 2012, the NRI24 can help to assess a country’s ability to capitalize on the digital revolution and their preparedness to benefit from the emerging Fourth Industrial Revolution. The Index aggregates data from 53 indicators, organized based on the networked readiness framework. Networked readiness rests on whether a country possesses the drivers necessary for digital technologies to unleash their potential, and on whether these technologies are impacting the economy and society.”25
As shown in Figure 21: Digitalization Infrastructure-1 (out of 100), Nigeria has the highest individual internet utilization rate and mobile access close to 100% which is very conducive to allow internet and mobile-based technologies to provide these services to individual consumers. It is interesting to note that Côte d'Ivoire has a very high mobile penetration like Nigeria, but individuals have low Internet usage.
23
Energy, R., Plans, A. and Ef-, N. E. (September 2017) ‘From Vision to Coordinated Action’, ECREEE 24
Network Readiness Index is developed by the World Economic Forum and published as Global Information Technology Report 25
WEF (2016) The Global Information Technology Report 2016, World Economic Forum. doi: 10.3359/oz0304203.
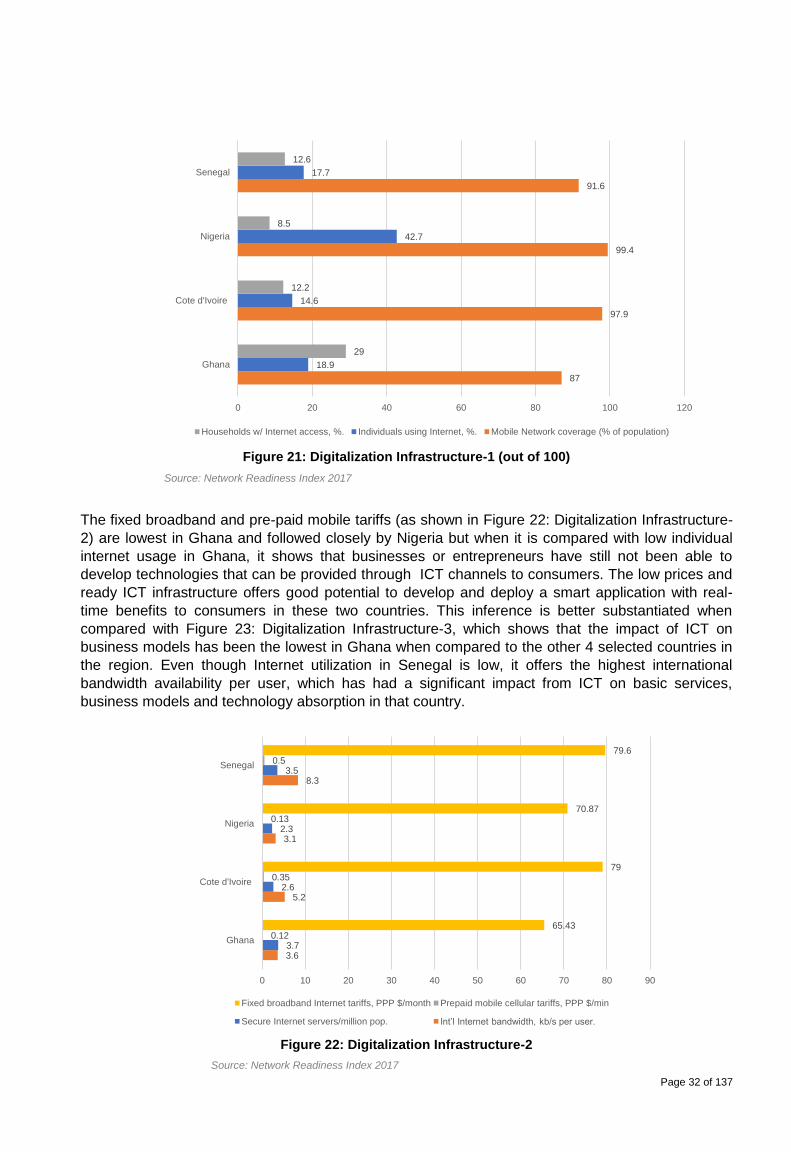
Page 32 of 137
Figure 21: Digitalization Infrastructure-1 (out of 100)
The fixed broadband and pre-paid mobile tariffs (as shown in Figure 22: Digitalization Infrastructure-
2) are lowest in Ghana and followed closely by Nigeria but when it is compared with low individual
internet usage in Ghana, it shows that businesses or entrepreneurs have still not been able to
develop technologies that can be provided through ICT channels to consumers. The low prices and
ready ICT infrastructure offers good potential to develop and deploy a smart application with real-
time benefits to consumers in these two countries. This inference is better substantiated when
compared with Figure 23: Digitalization Infrastructure-3, which shows that the impact of ICT on
business models has been the lowest in Ghana when compared to the other 4 selected countries in
the region. Even though Internet utilization in Senegal is low, it offers the highest international
bandwidth availability per user, which has had a significant impact from ICT on basic services,
business models and technology absorption in that country.
Figure 22: Digitalization Infrastructure-2
87
97.9
99.4
91.6
18.9
14.6
42.7
17.7
29
12.2
8.5
12.6
0 20 40 60 80 100 120
Ghana
Cote d'Ivoire
Nigeria
Senegal
Households w/ Internet access, %. Individuals using Internet, %. Mobile Network coverage (% of population)
3.6
5.2
3.1
8.3
3.7
2.6
2.3
3.5
0.12
0.35
0.13
0.5
65.43
79
70.87
79.6
0 10 20 30 40 50 60 70 80 90
Ghana
Cote d'Ivoire
Nigeria
Senegal
Fixed broadband Internet tariffs, PPP $/month Prepaid mobile cellular tariffs, PPP $/min
Secure Internet servers/million pop. Int’l Internet bandwidth, kb/s per user.
Source: Network Readiness Index 2017
Source: Network Readiness Index 2017
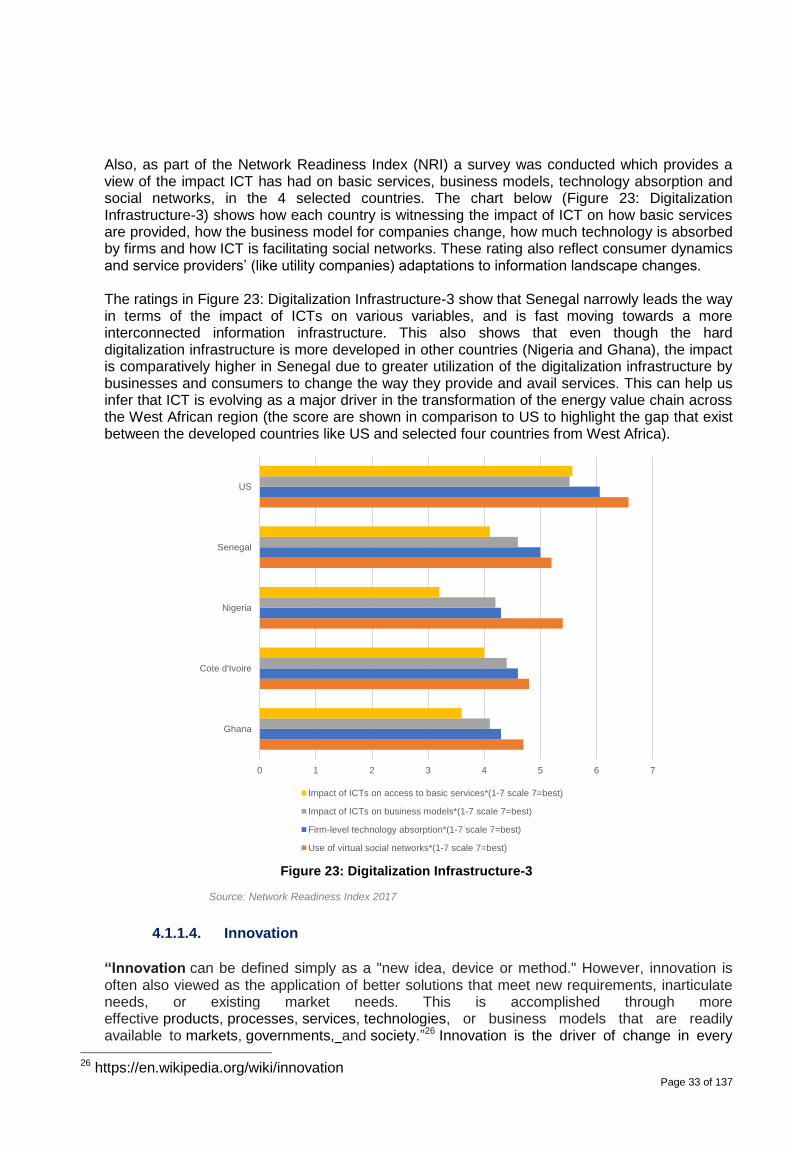
Page 33 of 137
Also, as part of the Network Readiness Index (NRI) a survey was conducted which provides a view of the impact ICT has had on basic services, business models, technology absorption and social networks, in the 4 selected countries. The chart below (Figure 23: Digitalization Infrastructure-3) shows how each country is witnessing the impact of ICT on how basic services are provided, how the business model for companies change, how much technology is absorbed by firms and how ICT is facilitating social networks. These rating also reflect consumer dynamics and service providers’ (like utility companies) adaptations to information landscape changes.
The ratings in Figure 23: Digitalization Infrastructure-3 show that Senegal narrowly leads the way in terms of the impact of ICTs on various variables, and is fast moving towards a more interconnected information infrastructure. This also shows that even though the hard digitalization infrastructure is more developed in other countries (Nigeria and Ghana), the impact is comparatively higher in Senegal due to greater utilization of the digitalization infrastructure by businesses and consumers to change the way they provide and avail services. This can help us infer that ICT is evolving as a major driver in the transformation of the energy value chain across the West African region (the score are shown in comparison to US to highlight the gap that exist between the developed countries like US and selected four countries from West Africa).
Figure 23: Digitalization Infrastructure-3
4.1.1.4. Innovation
“Innovation can be defined simply as a "new idea, device or method." However, innovation is often also viewed as the application of better solutions that meet new requirements, inarticulate needs, or existing market needs. This is accomplished through more effective products, processes, services, technologies, or business models that are readily available to markets, governments, and society.”26 Innovation is the driver of change in every
26 https://en.wikipedia.org/wiki/innovation
0 1 2 3 4 5 6 7
Ghana
Cote d'Ivoire
Nigeria
Senegal
US
Impact of ICTs on access to basic services*(1-7 scale 7=best)
Impact of ICTs on business models*(1-7 scale 7=best)
Firm-level technology absorption*(1-7 scale 7=best)
Use of virtual social networks*(1-7 scale 7=best)
Source: Network Readiness Index 2017
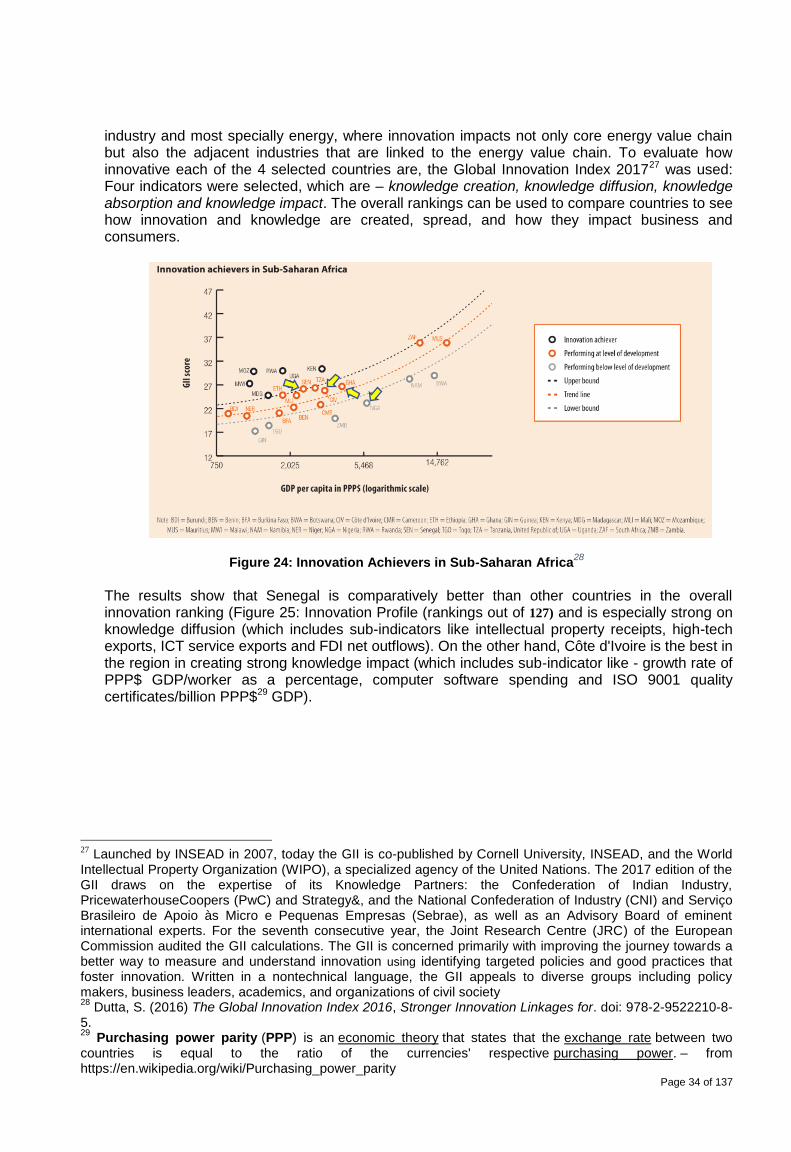
Page 34 of 137
industry and most specially energy, where innovation impacts not only core energy value chain but also the adjacent industries that are linked to the energy value chain. To evaluate how innovative each of the 4 selected countries are, the Global Innovation Index 201727 was used: Four indicators were selected, which are – knowledge creation, knowledge diffusion, knowledge absorption and knowledge impact. The overall rankings can be used to compare countries to see how innovation and knowledge are created, spread, and how they impact business and consumers.
Figure 24: Innovation Achievers in Sub-Saharan Africa28
The results show that Senegal is comparatively better than other countries in the overall innovation ranking (Figure 25: Innovation Profile (rankings out of 127) and is especially strong on knowledge diffusion (which includes sub-indicators like intellectual property receipts, high-tech exports, ICT service exports and FDI net outflows). On the other hand, Côte d'Ivoire is the best in the region in creating strong knowledge impact (which includes sub-indicator like - growth rate of PPP$ GDP/worker as a percentage, computer software spending and ISO 9001 quality certificates/billion PPP$29 GDP).
27
Launched by INSEAD in 2007, today the GII is co-published by Cornell University, INSEAD, and the World Intellectual Property Organization (WIPO), a specialized agency of the United Nations. The 2017 edition of the GII draws on the expertise of its Knowledge Partners: the Confederation of Indian Industry, PricewaterhouseCoopers (PwC) and Strategy&, and the National Confederation of Industry (CNI) and Serviço Brasileiro de Apoio às Micro e Pequenas Empresas (Sebrae), as well as an Advisory Board of eminent international experts. For the seventh consecutive year, the Joint Research Centre (JRC) of the European Commission audited the GII calculations. The GII is concerned primarily with improving the journey towards a better way to measure and understand innovation using identifying targeted policies and good practices that foster innovation. Written in a nontechnical language, the GII appeals to diverse groups including policy makers, business leaders, academics, and organizations of civil society 28
Dutta, S. (2016) The Global Innovation Index 2016, Stronger Innovation Linkages for. doi: 978-2-9522210-8-5. 29
Purchasing power parity (PPP) is an economic theory that states that the exchange rate between two countries is equal to the ratio of the currencies' respective purchasing power. – from https://en.wikipedia.org/wiki/Purchasing_power_parity
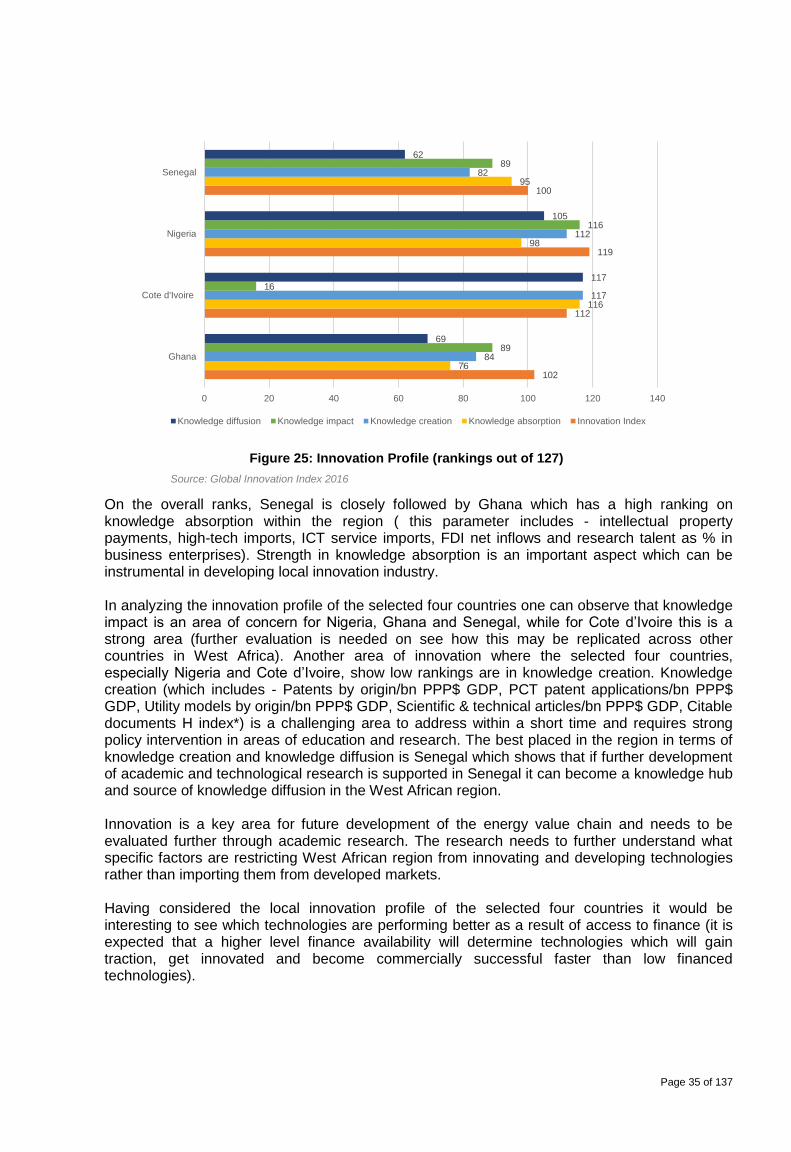
Page 35 of 137
Figure 25: Innovation Profile (rankings out of 127)
On the overall ranks, Senegal is closely followed by Ghana which has a high ranking on knowledge absorption within the region ( this parameter includes - intellectual property payments, high-tech imports, ICT service imports, FDI net inflows and research talent as % in business enterprises). Strength in knowledge absorption is an important aspect which can be instrumental in developing local innovation industry. In analyzing the innovation profile of the selected four countries one can observe that knowledge impact is an area of concern for Nigeria, Ghana and Senegal, while for Cote d’Ivoire this is a strong area (further evaluation is needed on see how this may be replicated across other countries in West Africa). Another area of innovation where the selected four countries, especially Nigeria and Cote d’Ivoire, show low rankings are in knowledge creation. Knowledge creation (which includes - Patents by origin/bn PPP$ GDP, PCT patent applications/bn PPP$ GDP, Utility models by origin/bn PPP$ GDP, Scientific & technical articles/bn PPP$ GDP, Citable documents H index*) is a challenging area to address within a short time and requires strong policy intervention in areas of education and research. The best placed in the region in terms of knowledge creation and knowledge diffusion is Senegal which shows that if further development of academic and technological research is supported in Senegal it can become a knowledge hub and source of knowledge diffusion in the West African region.
Innovation is a key area for future development of the energy value chain and needs to be evaluated further through academic research. The research needs to further understand what specific factors are restricting West African region from innovating and developing technologies rather than importing them from developed markets. Having considered the local innovation profile of the selected four countries it would be interesting to see which technologies are performing better as a result of access to finance (it is expected that a higher level finance availability will determine technologies which will gain traction, get innovated and become commercially successful faster than low financed technologies).
102
112
119
100
76
116
98
95
84
117
112
82
89
16
116
89
69
117
105
62
0 20 40 60 80 100 120 140
Ghana
Cote d'Ivoire
Nigeria
Senegal
Knowledge diffusion Knowledge impact Knowledge creation Knowledge absorption Innovation Index
Source: Global Innovation Index 2016
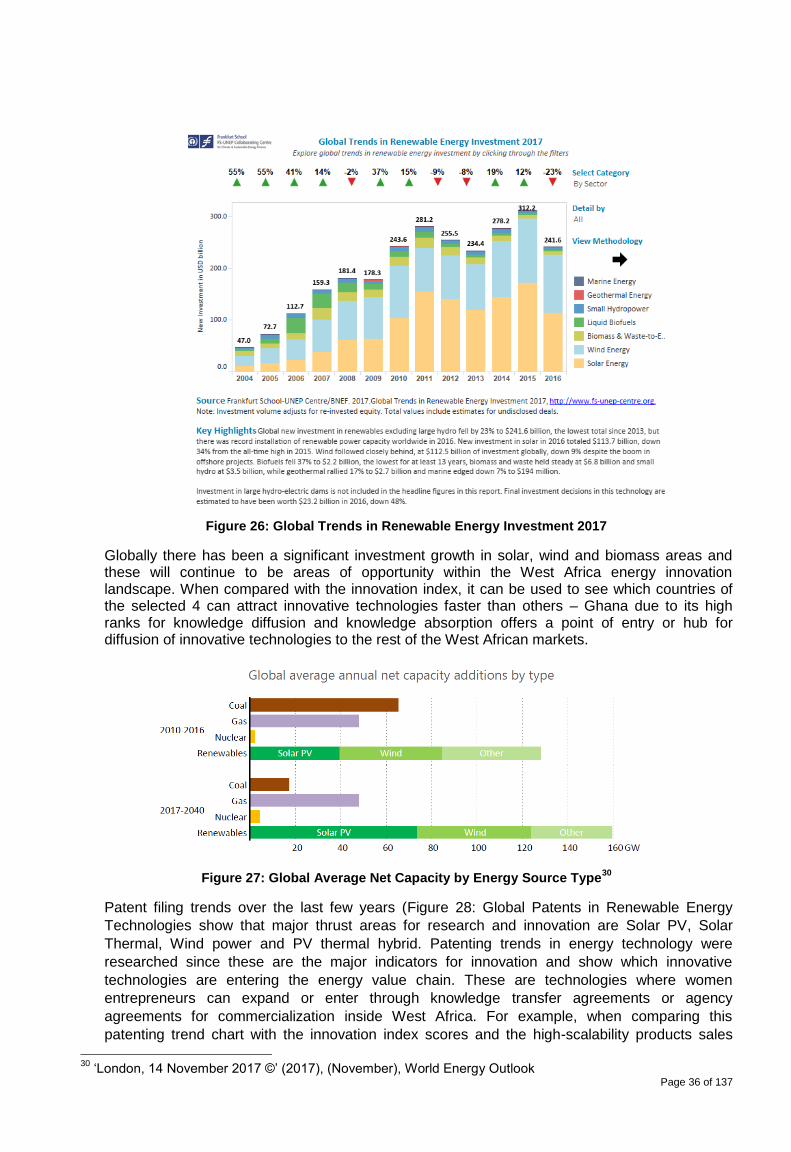
Page 36 of 137
Figure 26: Global Trends in Renewable Energy Investment 2017
Globally there has been a significant investment growth in solar, wind and biomass areas and these will continue to be areas of opportunity within the West Africa energy innovation landscape. When compared with the innovation index, it can be used to see which countries of the selected 4 can attract innovative technologies faster than others – Ghana due to its high ranks for knowledge diffusion and knowledge absorption offers a point of entry or hub for diffusion of innovative technologies to the rest of the West African markets.
Figure 27: Global Average Net Capacity by Energy Source Type30
Patent filing trends over the last few years (Figure 28: Global Patents in Renewable Energy
Technologies show that major thrust areas for research and innovation are Solar PV, Solar
Thermal, Wind power and PV thermal hybrid. Patenting trends in energy technology were
researched since these are the major indicators for innovation and show which innovative
technologies are entering the energy value chain. These are technologies where women
entrepreneurs can expand or enter through knowledge transfer agreements or agency
agreements for commercialization inside West Africa. For example, when comparing this
patenting trend chart with the innovation index scores and the high-scalability products sales
30
‘London, 14 November 2017 ©’ (2017), (November), World Energy Outlook
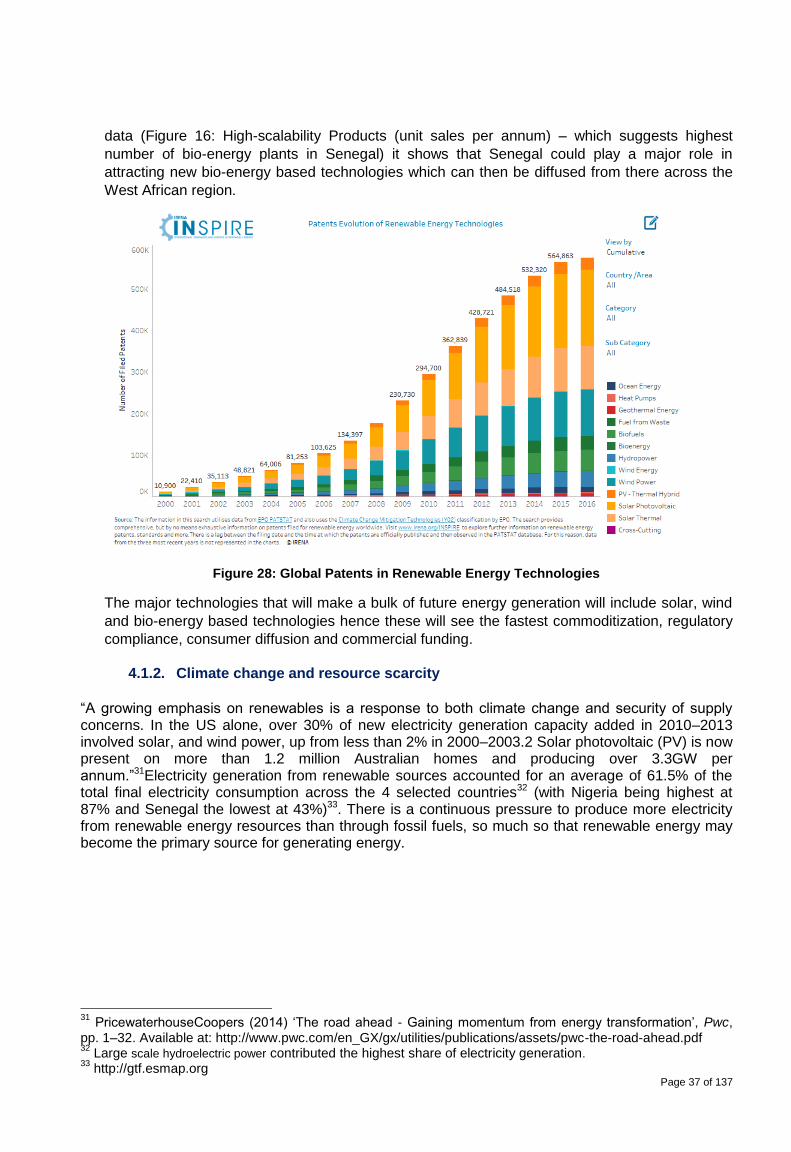
Page 37 of 137
data (Figure 16: High-scalability Products (unit sales per annum) – which suggests highest
number of bio-energy plants in Senegal) it shows that Senegal could play a major role in
attracting new bio-energy based technologies which can then be diffused from there across the
West African region.
Figure 28: Global Patents in Renewable Energy Technologies
The major technologies that will make a bulk of future energy generation will include solar, wind
and bio-energy based technologies hence these will see the fastest commoditization, regulatory
compliance, consumer diffusion and commercial funding.
4.1.2. Climate change and resource scarcity
“A growing emphasis on renewables is a response to both climate change and security of supply concerns. In the US alone, over 30% of new electricity generation capacity added in 2010–2013 involved solar, and wind power, up from less than 2% in 2000–2003.2 Solar photovoltaic (PV) is now present on more than 1.2 million Australian homes and producing over 3.3GW per annum.”31Electricity generation from renewable sources accounted for an average of 61.5% of the total final electricity consumption across the 4 selected countries32 (with Nigeria being highest at 87% and Senegal the lowest at 43%)33. There is a continuous pressure to produce more electricity from renewable energy resources than through fossil fuels, so much so that renewable energy may become the primary source for generating energy.
31
PricewaterhouseCoopers (2014) ‘The road ahead - Gaining momentum from energy transformation’, Pwc, pp. 1–32. Available at: http://www.pwc.com/en_GX/gx/utilities/publications/assets/pwc-the-road-ahead.pdf 32
Large scale hydroelectric power contributed the highest share of electricity generation. 33
http://gtf.esmap.org
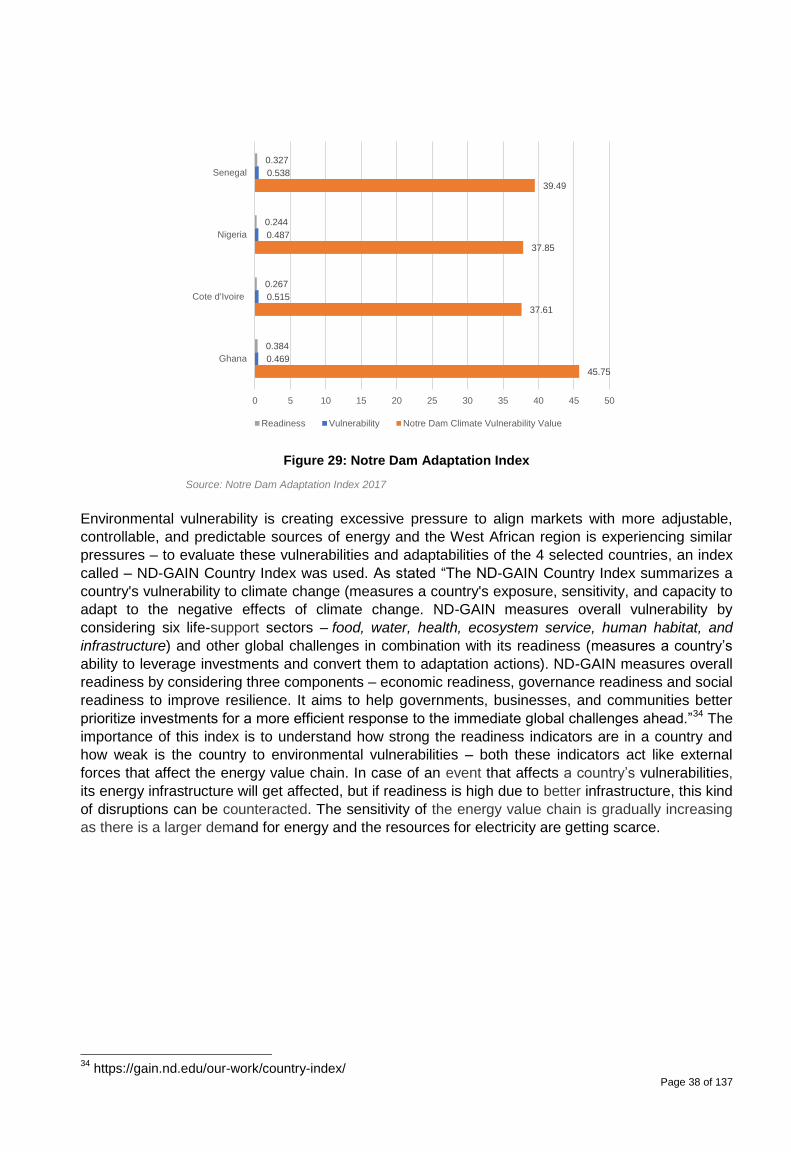
Page 38 of 137
Figure 29: Notre Dam Adaptation Index
Environmental vulnerability is creating excessive pressure to align markets with more adjustable,
controllable, and predictable sources of energy and the West African region is experiencing similar
pressures – to evaluate these vulnerabilities and adaptabilities of the 4 selected countries, an index
called – ND-GAIN Country Index was used. As stated “The ND-GAIN Country Index summarizes a
country's vulnerability to climate change (measures a country's exposure, sensitivity, and capacity to
adapt to the negative effects of climate change. ND-GAIN measures overall vulnerability by
considering six life-support sectors – food, water, health, ecosystem service, human habitat, and
infrastructure) and other global challenges in combination with its readiness (measures a country’s
ability to leverage investments and convert them to adaptation actions). ND-GAIN measures overall
readiness by considering three components – economic readiness, governance readiness and social
readiness to improve resilience. It aims to help governments, businesses, and communities better
prioritize investments for a more efficient response to the immediate global challenges ahead.”34 The
importance of this index is to understand how strong the readiness indicators are in a country and
how weak is the country to environmental vulnerabilities – both these indicators act like external
forces that affect the energy value chain. In case of an event that affects a country’s vulnerabilities,
its energy infrastructure will get affected, but if readiness is high due to better infrastructure, this kind
of disruptions can be counteracted. The sensitivity of the energy value chain is gradually increasing
as there is a larger demand for energy and the resources for electricity are getting scarce.
34
https://gain.nd.edu/our-work/country-index/
45.75
37.61
37.85
39.49
0.469
0.515
0.487
0.538
0.384
0.267
0.244
0.327
0 5 10 15 20 25 30 35 40 45 50
Ghana
Cote d'Ivoire
Nigeria
Senegal
Readiness Vulnerability Notre Dam Climate Vulnerability Value
Source: Notre Dam Adaptation Index 2017
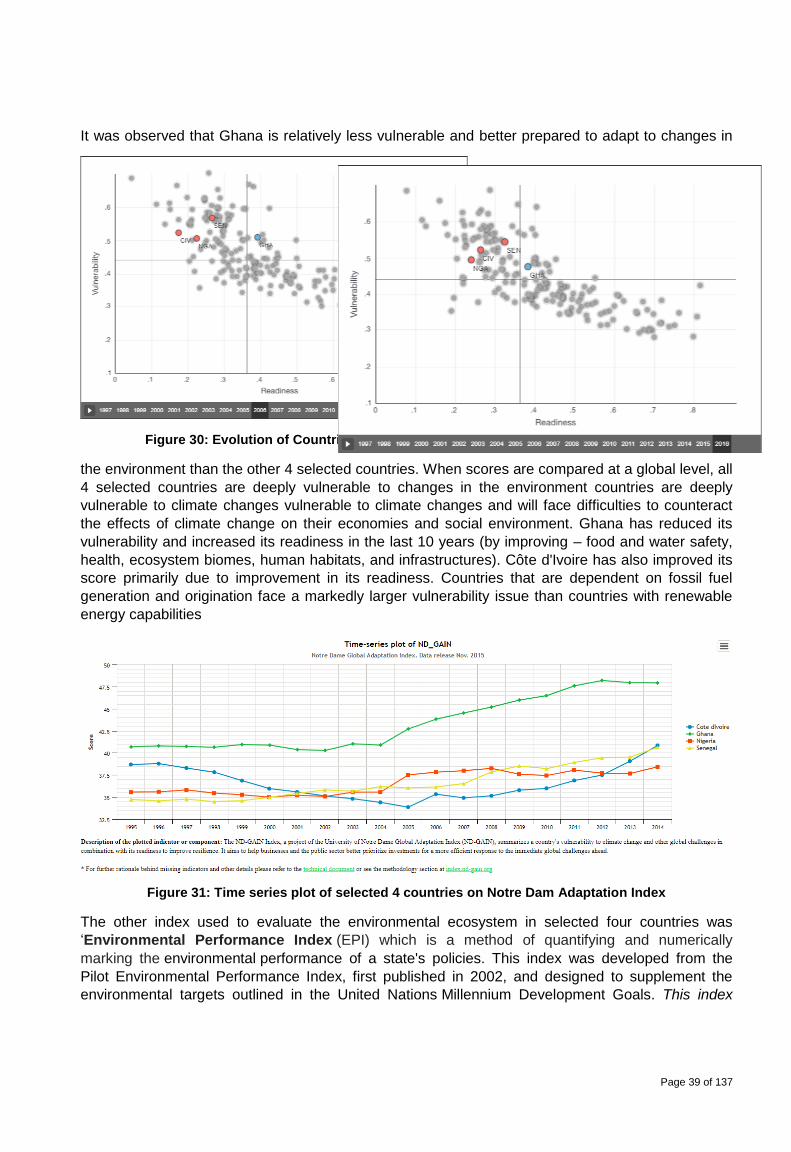
Page 39 of 137
It was observed that Ghana is relatively less vulnerable and better prepared to adapt to changes in
the environment than the other 4 selected countries. When scores are compared at a global level, all
4 selected countries are deeply vulnerable to changes in the environment countries are deeply
vulnerable to climate changes vulnerable to climate changes and will face difficulties to counteract
the effects of climate change on their economies and social environment. Ghana has reduced its
vulnerability and increased its readiness in the last 10 years (by improving – food and water safety,
health, ecosystem biomes, human habitats, and infrastructures). Côte d'Ivoire has also improved its
score primarily due to improvement in its readiness. Countries that are dependent on fossil fuel
generation and origination face a markedly larger vulnerability issue than countries with renewable
energy capabilities
Figure 31: Time series plot of selected 4 countries on Notre Dam Adaptation Index
The other index used to evaluate the environmental ecosystem in selected four countries was
‘Environmental Performance Index (EPI) which is a method of quantifying and numerically
marking the environmental performance of a state's policies. This index was developed from the
Pilot Environmental Performance Index, first published in 2002, and designed to supplement the
environmental targets outlined in the United Nations Millennium Development Goals. This index
Figure 30: Evolution of Countries on Vulnerability and Readiness over last 10 years29
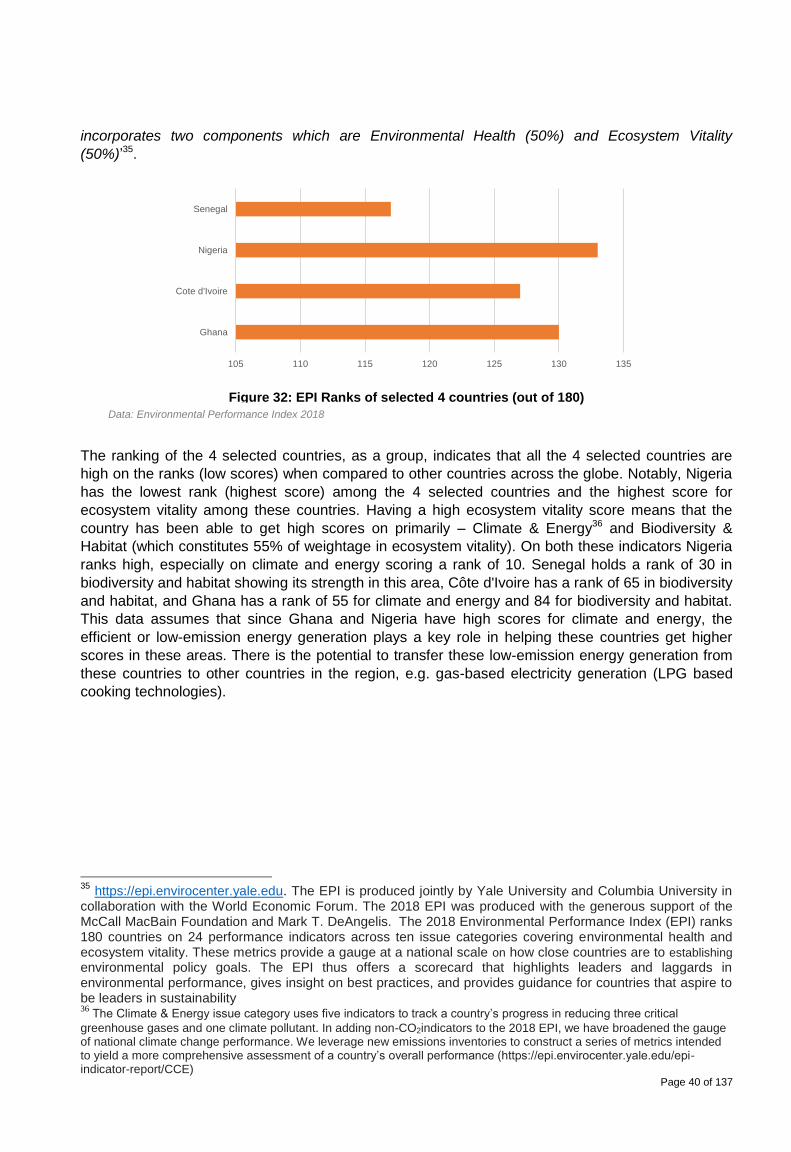
Page 40 of 137
incorporates two components which are Environmental Health (50%) and Ecosystem Vitality
(50%)’35.
Figure 32: EPI Ranks of selected 4 countries (out of 180)
The ranking of the 4 selected countries, as a group, indicates that all the 4 selected countries are
high on the ranks (low scores) when compared to other countries across the globe. Notably, Nigeria
has the lowest rank (highest score) among the 4 selected countries and the highest score for
ecosystem vitality among these countries. Having a high ecosystem vitality score means that the
country has been able to get high scores on primarily – Climate & Energy36 and Biodiversity &
Habitat (which constitutes 55% of weightage in ecosystem vitality). On both these indicators Nigeria
ranks high, especially on climate and energy scoring a rank of 10. Senegal holds a rank of 30 in
biodiversity and habitat showing its strength in this area, Côte d'Ivoire has a rank of 65 in biodiversity
and habitat, and Ghana has a rank of 55 for climate and energy and 84 for biodiversity and habitat.
This data assumes that since Ghana and Nigeria have high scores for climate and energy, the
efficient or low-emission energy generation plays a key role in helping these countries get higher
scores in these areas. There is the potential to transfer these low-emission energy generation from
these countries to other countries in the region, e.g. gas-based electricity generation (LPG based
cooking technologies).
35
https://epi.envirocenter.yale.edu. The EPI is produced jointly by Yale University and Columbia University in collaboration with the World Economic Forum. The 2018 EPI was produced with the generous support of the McCall MacBain Foundation and Mark T. DeAngelis. The 2018 Environmental Performance Index (EPI) ranks 180 countries on 24 performance indicators across ten issue categories covering environmental health and ecosystem vitality. These metrics provide a gauge at a national scale on how close countries are to establishing environmental policy goals. The EPI thus offers a scorecard that highlights leaders and laggards in environmental performance, gives insight on best practices, and provides guidance for countries that aspire to be leaders in sustainability 36
The Climate & Energy issue category uses five indicators to track a country’s progress in reducing three critical
greenhouse gases and one climate pollutant. In adding non-CO2indicators to the 2018 EPI, we have broadened the gauge of national climate change performance. We leverage new emissions inventories to construct a series of metrics intended to yield a more comprehensive assessment of a country’s overall performance (https://epi.envirocenter.yale.edu/epi-indicator-report/CCE)
105 110 115 120 125 130 135
Ghana
Cote d'Ivoire
Nigeria
Senegal
Data: Environmental Performance Index 2018
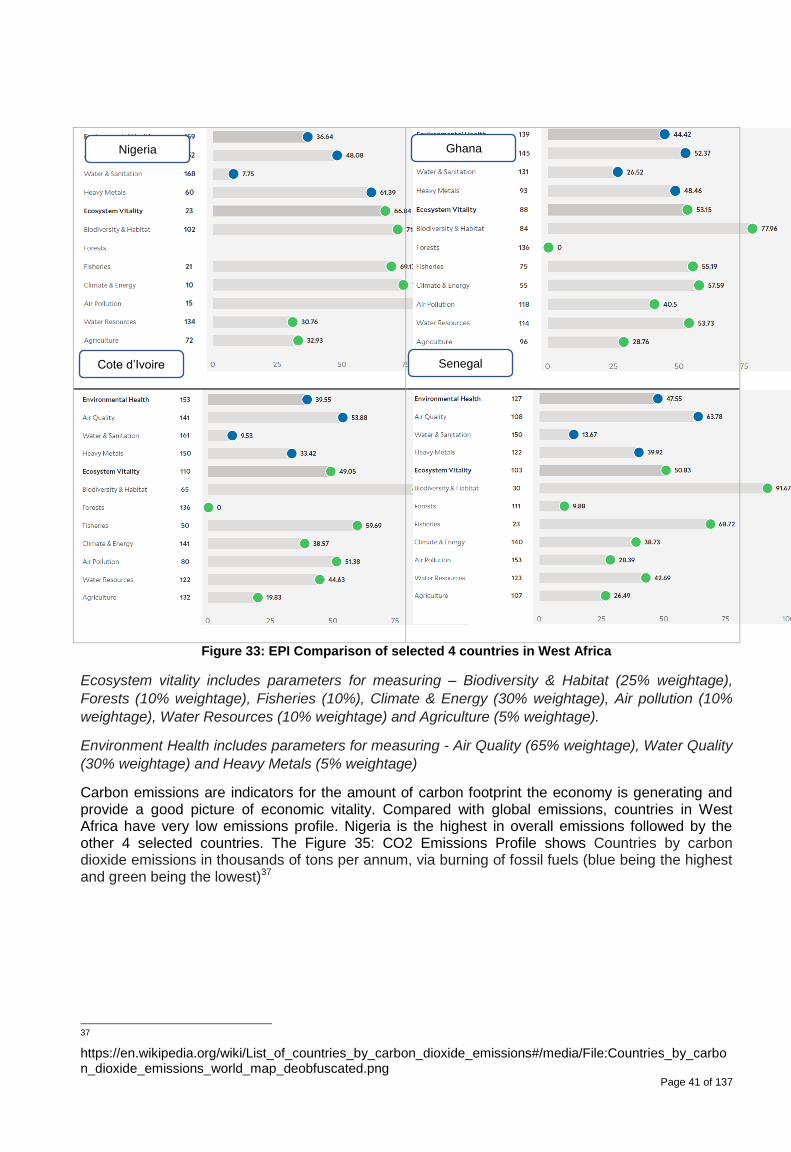
Page 41 of 137
Figure 33: EPI Comparison of selected 4 countries in West Africa
Ecosystem vitality includes parameters for measuring – Biodiversity & Habitat (25% weightage),
Forests (10% weightage), Fisheries (10%), Climate & Energy (30% weightage), Air pollution (10%
weightage), Water Resources (10% weightage) and Agriculture (5% weightage).
Environment Health includes parameters for measuring - Air Quality (65% weightage), Water Quality
(30% weightage) and Heavy Metals (5% weightage)
Carbon emissions are indicators for the amount of carbon footprint the economy is generating and provide a good picture of economic vitality. Compared with global emissions, countries in West Africa have very low emissions profile. Nigeria is the highest in overall emissions followed by the other 4 selected countries. The Figure 35: CO2 Emissions Profile shows Countries by carbon dioxide emissions in thousands of tons per annum, via burning of fossil fuels (blue being the highest and green being the lowest)37
37
https://en.wikipedia.org/wiki/List_of_countries_by_carbon_dioxide_emissions#/media/File:Countries_by_carbon_dioxide_emissions_world_map_deobfuscated.png
Nigeria Ghana
Cote d’Ivoire Senegal
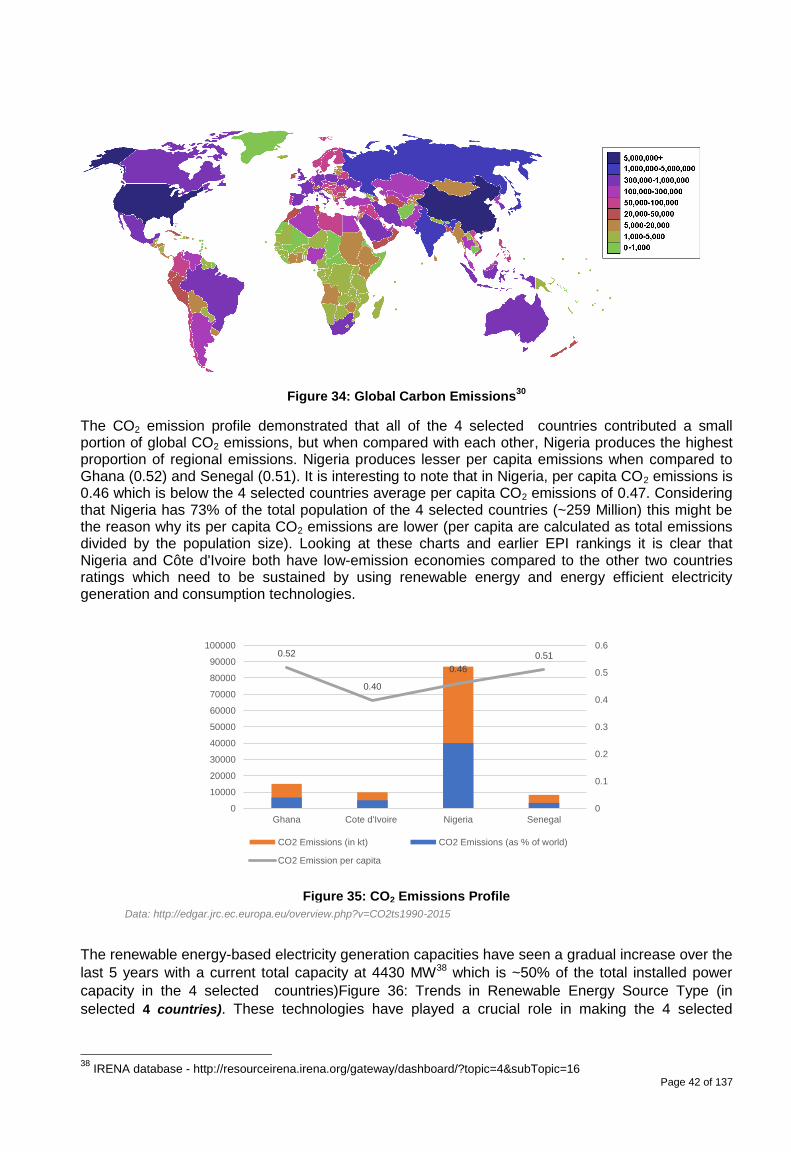
Page 42 of 137
Figure 34: Global Carbon Emissions30
The CO2 emission profile demonstrated that all of the 4 selected countries contributed a small portion of global CO2 emissions, but when compared with each other, Nigeria produces the highest proportion of regional emissions. Nigeria produces lesser per capita emissions when compared to Ghana (0.52) and Senegal (0.51). It is interesting to note that in Nigeria, per capita CO2 emissions is 0.46 which is below the 4 selected countries average per capita CO2 emissions of 0.47. Considering that Nigeria has 73% of the total population of the 4 selected countries (~259 Million) this might be the reason why its per capita CO2 emissions are lower (per capita are calculated as total emissions divided by the population size). Looking at these charts and earlier EPI rankings it is clear that Nigeria and Côte d'Ivoire both have low-emission economies compared to the other two countries ratings which need to be sustained by using renewable energy and energy efficient electricity generation and consumption technologies.
Figure 35: CO2 Emissions Profile
The renewable energy-based electricity generation capacities have seen a gradual increase over the
last 5 years with a current total capacity at 4430 MW38 which is ~50% of the total installed power
capacity in the 4 selected countries)Figure 36: Trends in Renewable Energy Source Type (in
selected 4 countries). These technologies have played a crucial role in making the 4 selected
38
IRENA database - http://resourceirena.irena.org/gateway/dashboard/?topic=4&subTopic=16
0.52
0.40
0.46
0.51
0
0.1
0.2
0.3
0.4
0.5
0.6
0
10000
20000
30000
40000
50000
60000
70000
80000
90000
100000
Ghana Cote d'Ivoire Nigeria Senegal
CO2 Emissions (in kt) CO2 Emissions (as % of world)
CO2 Emission per capita
Data: http://edgar.jrc.ec.europa.eu/overview.php?v=CO2ts1990-2015
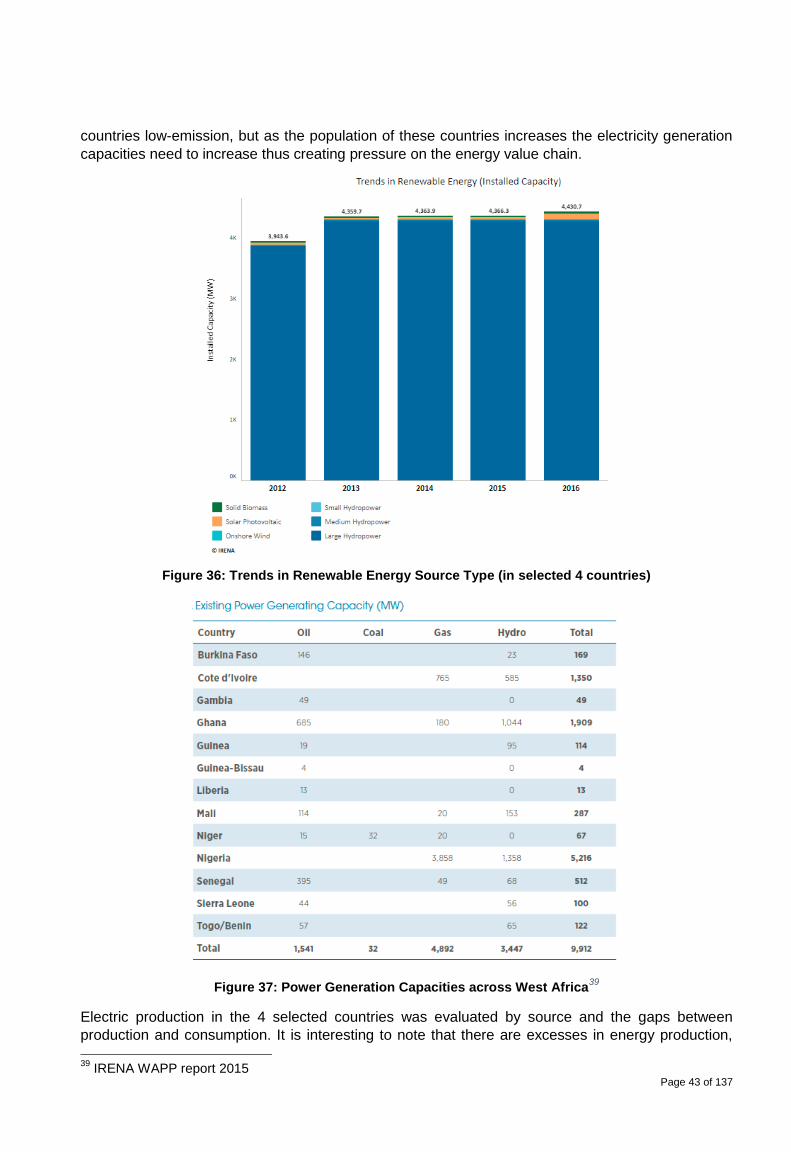
Page 43 of 137
countries low-emission, but as the population of these countries increases the electricity generation
capacities need to increase thus creating pressure on the energy value chain.
Figure 36: Trends in Renewable Energy Source Type (in selected 4 countries)
Figure 37: Power Generation Capacities across West Africa39
Electric production in the 4 selected countries was evaluated by source and the gaps between
production and consumption. It is interesting to note that there are excesses in energy production,
39
IRENA WAPP report 2015
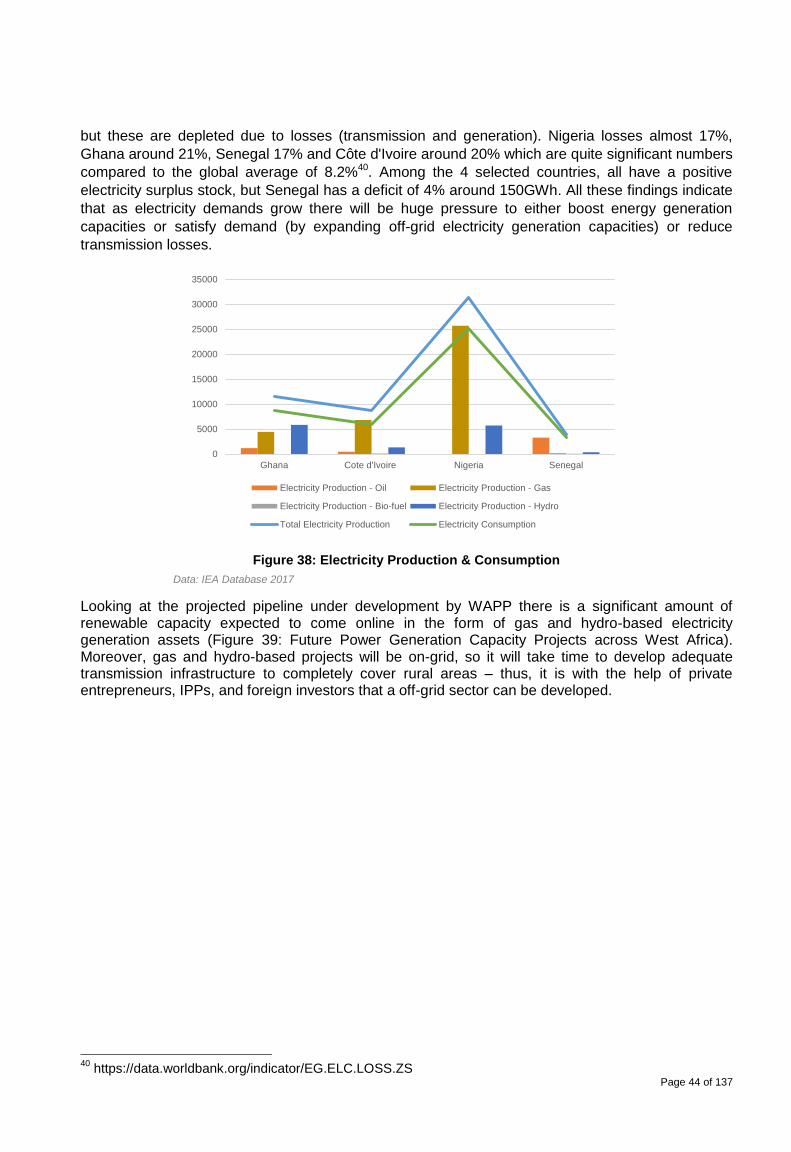
Page 44 of 137
but these are depleted due to losses (transmission and generation). Nigeria losses almost 17%,
Ghana around 21%, Senegal 17% and Côte d'Ivoire around 20% which are quite significant numbers
compared to the global average of 8.2%40. Among the 4 selected countries, all have a positive
electricity surplus stock, but Senegal has a deficit of 4% around 150GWh. All these findings indicate
that as electricity demands grow there will be huge pressure to either boost energy generation
capacities or satisfy demand (by expanding off-grid electricity generation capacities) or reduce
transmission losses.
Figure 38: Electricity Production & Consumption
Looking at the projected pipeline under development by WAPP there is a significant amount of renewable capacity expected to come online in the form of gas and hydro-based electricity generation assets (Figure 39: Future Power Generation Capacity Projects across West Africa). Moreover, gas and hydro-based projects will be on-grid, so it will take time to develop adequate transmission infrastructure to completely cover rural areas – thus, it is with the help of private entrepreneurs, IPPs, and foreign investors that a off-grid sector can be developed.
40
https://data.worldbank.org/indicator/EG.ELC.LOSS.ZS
0
5000
10000
15000
20000
25000
30000
35000
Ghana Cote d'Ivoire Nigeria Senegal
Electricity Production - Oil Electricity Production - Gas
Electricity Production - Bio-fuel Electricity Production - Hydro
Total Electricity Production Electricity Consumption
Data: IEA Database 2017
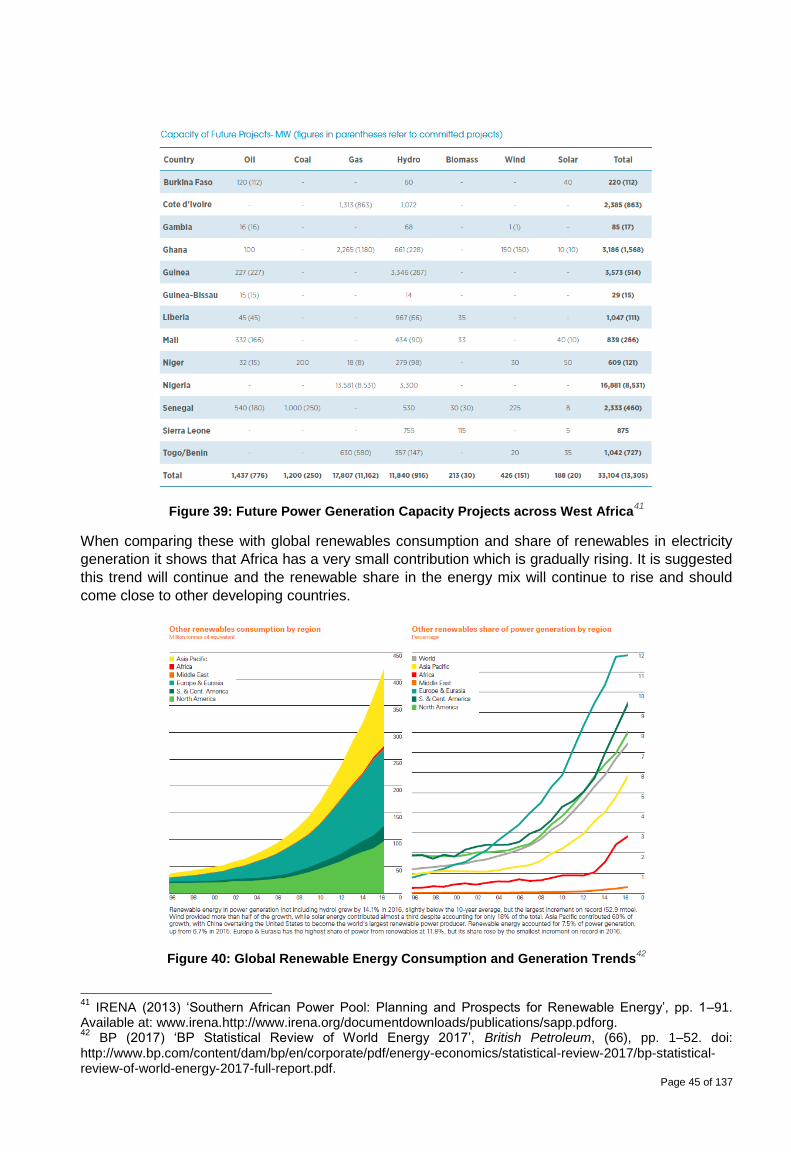
Page 45 of 137
Figure 39: Future Power Generation Capacity Projects across West Africa41
When comparing these with global renewables consumption and share of renewables in electricity
generation it shows that Africa has a very small contribution which is gradually rising. It is suggested
this trend will continue and the renewable share in the energy mix will continue to rise and should
come close to other developing countries.
Figure 40: Global Renewable Energy Consumption and Generation Trends42
41
IRENA (2013) ‘Southern African Power Pool: Planning and Prospects for Renewable Energy’, pp. 1–91. Available at: www.irena.http://www.irena.org/documentdownloads/publications/sapp.pdforg. 42
BP (2017) ‘BP Statistical Review of World Energy 2017’, British Petroleum, (66), pp. 1–52. doi: http://www.bp.com/content/dam/bp/en/corporate/pdf/energy-economics/statistical-review-2017/bp-statistical-review-of-world-energy-2017-full-report.pdf.
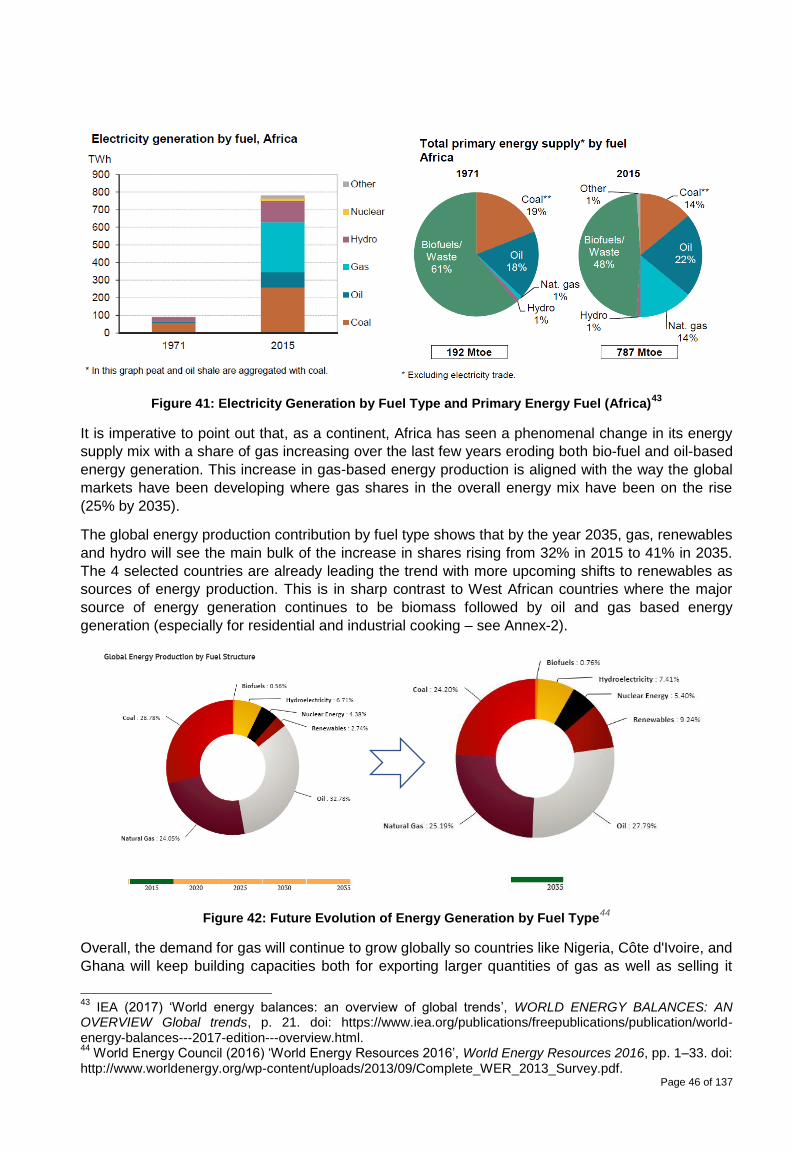
Page 46 of 137
Figure 41: Electricity Generation by Fuel Type and Primary Energy Fuel (Africa)43
It is imperative to point out that, as a continent, Africa has seen a phenomenal change in its energy
supply mix with a share of gas increasing over the last few years eroding both bio-fuel and oil-based
energy generation. This increase in gas-based energy production is aligned with the way the global
markets have been developing where gas shares in the overall energy mix have been on the rise
(25% by 2035).
The global energy production contribution by fuel type shows that by the year 2035, gas, renewables
and hydro will see the main bulk of the increase in shares rising from 32% in 2015 to 41% in 2035.
The 4 selected countries are already leading the trend with more upcoming shifts to renewables as
sources of energy production. This is in sharp contrast to West African countries where the major
source of energy generation continues to be biomass followed by oil and gas based energy
generation (especially for residential and industrial cooking – see Annex-2).
Figure 42: Future Evolution of Energy Generation by Fuel Type44
Overall, the demand for gas will continue to grow globally so countries like Nigeria, Côte d'Ivoire, and
Ghana will keep building capacities both for exporting larger quantities of gas as well as selling it
43
IEA (2017) ‘World energy balances: an overview of global trends’, WORLD ENERGY BALANCES: AN OVERVIEW Global trends, p. 21. doi: https://www.iea.org/publications/freepublications/publication/world-energy-balances---2017-edition---overview.html. 44
World Energy Council (2016) ‘World Energy Resources 2016’, World Energy Resources 2016, pp. 1–33. doi: http://www.worldenergy.org/wp-content/uploads/2013/09/Complete_WER_2013_Survey.pdf.
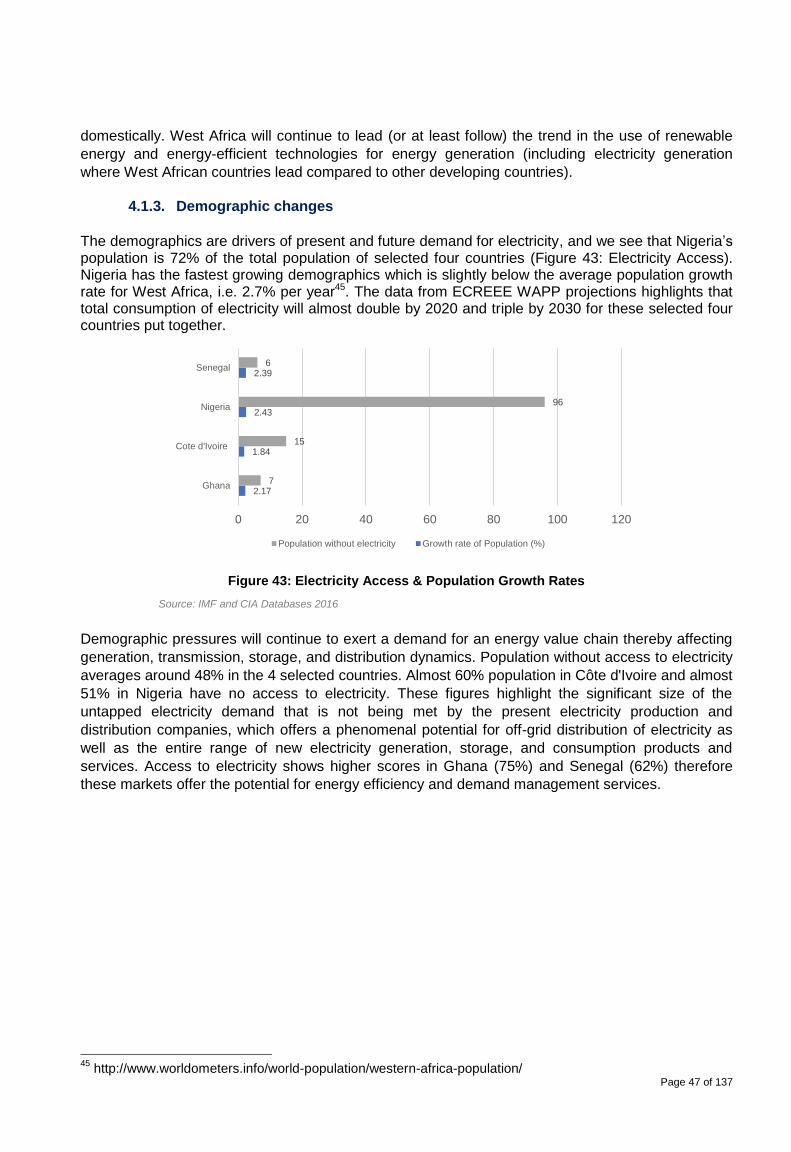
Page 47 of 137
domestically. West Africa will continue to lead (or at least follow) the trend in the use of renewable
energy and energy-efficient technologies for energy generation (including electricity generation
where West African countries lead compared to other developing countries).
4.1.3. Demographic changes
The demographics are drivers of present and future demand for electricity, and we see that Nigeria’s population is 72% of the total population of selected four countries (Figure 43: Electricity Access). Nigeria has the fastest growing demographics which is slightly below the average population growth rate for West Africa, i.e. 2.7% per year45. The data from ECREEE WAPP projections highlights that total consumption of electricity will almost double by 2020 and triple by 2030 for these selected four countries put together.
Figure 43: Electricity Access & Population Growth Rates
Demographic pressures will continue to exert a demand for an energy value chain thereby affecting
generation, transmission, storage, and distribution dynamics. Population without access to electricity
averages around 48% in the 4 selected countries. Almost 60% population in Côte d'Ivoire and almost
51% in Nigeria have no access to electricity. These figures highlight the significant size of the
untapped electricity demand that is not being met by the present electricity production and
distribution companies, which offers a phenomenal potential for off-grid distribution of electricity as
well as the entire range of new electricity generation, storage, and consumption products and
services. Access to electricity shows higher scores in Ghana (75%) and Senegal (62%) therefore
these markets offer the potential for energy efficiency and demand management services.
45
http://www.worldometers.info/world-population/western-africa-population/
2.17
1.84
2.43
2.39
7
15
96
6
0 20 40 60 80 100 120
Ghana
Cote d'Ivoire
Nigeria
Senegal
Population without electricity Growth rate of Population (%)
Source: IMF and CIA Databases 2016
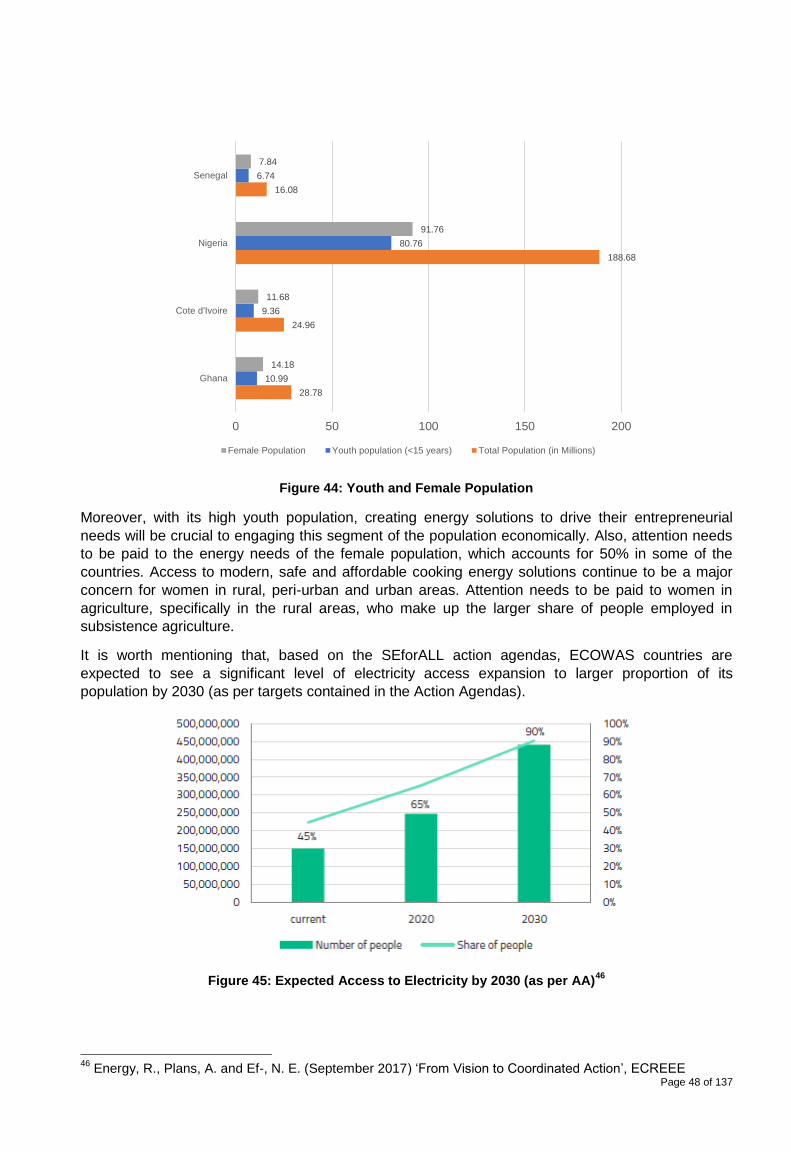
Page 48 of 137
Figure 44: Youth and Female Population
Moreover, with its high youth population, creating energy solutions to drive their entrepreneurial
needs will be crucial to engaging this segment of the population economically. Also, attention needs
to be paid to the energy needs of the female population, which accounts for 50% in some of the
countries. Access to modern, safe and affordable cooking energy solutions continue to be a major
concern for women in rural, peri-urban and urban areas. Attention needs to be paid to women in
agriculture, specifically in the rural areas, who make up the larger share of people employed in
subsistence agriculture.
It is worth mentioning that, based on the SEforALL action agendas, ECOWAS countries are
expected to see a significant level of electricity access expansion to larger proportion of its
population by 2030 (as per targets contained in the Action Agendas).
Figure 45: Expected Access to Electricity by 2030 (as per AA)46
46
Energy, R., Plans, A. and Ef-, N. E. (September 2017) ‘From Vision to Coordinated Action’, ECREEE
28.78
24.96
188.68
16.08
10.99
9.36
80.76
6.74
14.18
11.68
91.76
7.84
0 50 100 150 200
Ghana
Cote d'Ivoire
Nigeria
Senegal
Female Population Youth population (<15 years) Total Population (in Millions)
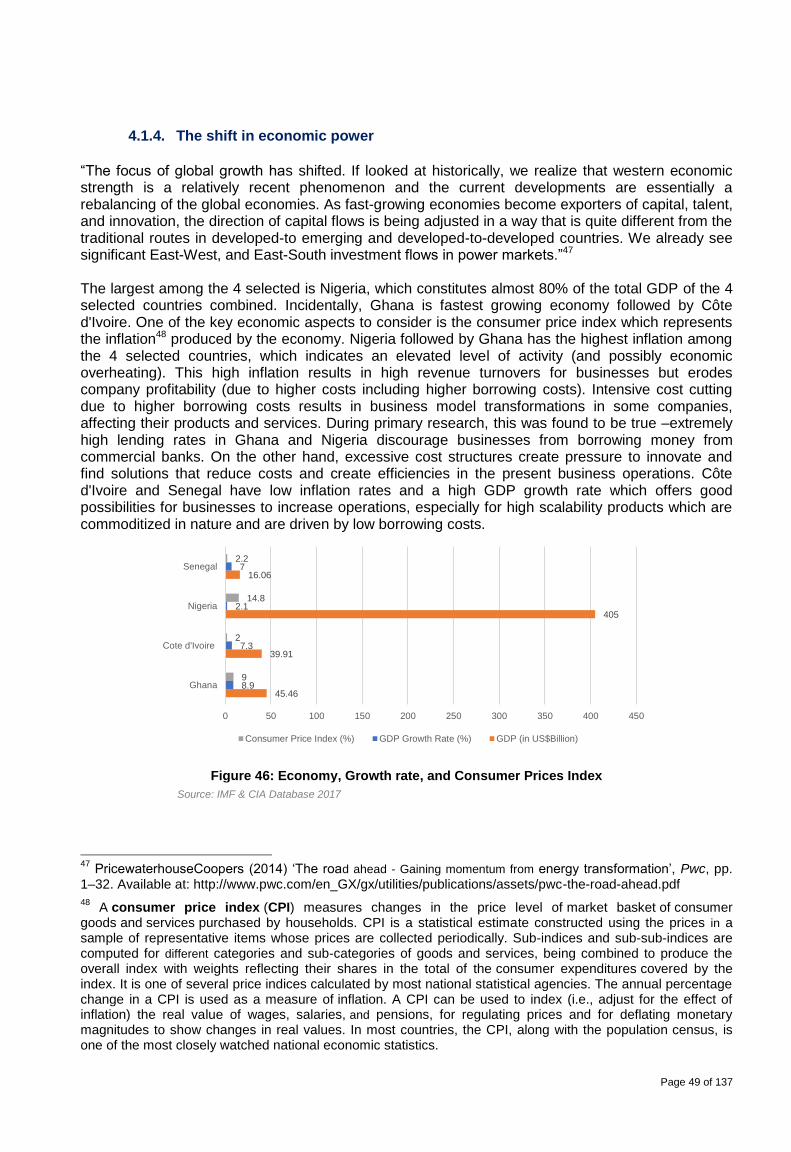
Page 49 of 137
4.1.4. The shift in economic power
“The focus of global growth has shifted. If looked at historically, we realize that western economic strength is a relatively recent phenomenon and the current developments are essentially a rebalancing of the global economies. As fast-growing economies become exporters of capital, talent, and innovation, the direction of capital flows is being adjusted in a way that is quite different from the traditional routes in developed-to emerging and developed-to-developed countries. We already see significant East-West, and East-South investment flows in power markets.”47 The largest among the 4 selected is Nigeria, which constitutes almost 80% of the total GDP of the 4 selected countries combined. Incidentally, Ghana is fastest growing economy followed by Côte d'Ivoire. One of the key economic aspects to consider is the consumer price index which represents the inflation48 produced by the economy. Nigeria followed by Ghana has the highest inflation among the 4 selected countries, which indicates an elevated level of activity (and possibly economic overheating). This high inflation results in high revenue turnovers for businesses but erodes company profitability (due to higher costs including higher borrowing costs). Intensive cost cutting due to higher borrowing costs results in business model transformations in some companies, affecting their products and services. During primary research, this was found to be true –extremely high lending rates in Ghana and Nigeria discourage businesses from borrowing money from commercial banks. On the other hand, excessive cost structures create pressure to innovate and find solutions that reduce costs and create efficiencies in the present business operations. Côte d'Ivoire and Senegal have low inflation rates and a high GDP growth rate which offers good possibilities for businesses to increase operations, especially for high scalability products which are commoditized in nature and are driven by low borrowing costs.
Figure 46: Economy, Growth rate, and Consumer Prices Index
47
PricewaterhouseCoopers (2014) ‘The road ahead - Gaining momentum from energy transformation’, Pwc, pp. 1–32. Available at: http://www.pwc.com/en_GX/gx/utilities/publications/assets/pwc-the-road-ahead.pdf
48 A consumer price index (CPI) measures changes in the price level of market basket of consumer
goods and services purchased by households. CPI is a statistical estimate constructed using the prices in a sample of representative items whose prices are collected periodically. Sub-indices and sub-sub-indices are computed for different categories and sub-categories of goods and services, being combined to produce the overall index with weights reflecting their shares in the total of the consumer expenditures covered by the index. It is one of several price indices calculated by most national statistical agencies. The annual percentage change in a CPI is used as a measure of inflation. A CPI can be used to index (i.e., adjust for the effect of inflation) the real value of wages, salaries, and pensions, for regulating prices and for deflating monetary magnitudes to show changes in real values. In most countries, the CPI, along with the population census, is one of the most closely watched national economic statistics.
45.46
39.91
405
16.06
8.9
7.3
2.1
7
9
2
14.8
2.2
0 50 100 150 200 250 300 350 400 450
Ghana
Cote d'Ivoire
Nigeria
Senegal
Consumer Price Index (%) GDP Growth Rate (%) GDP (in US$Billion)
Source: IMF & CIA Database 2017
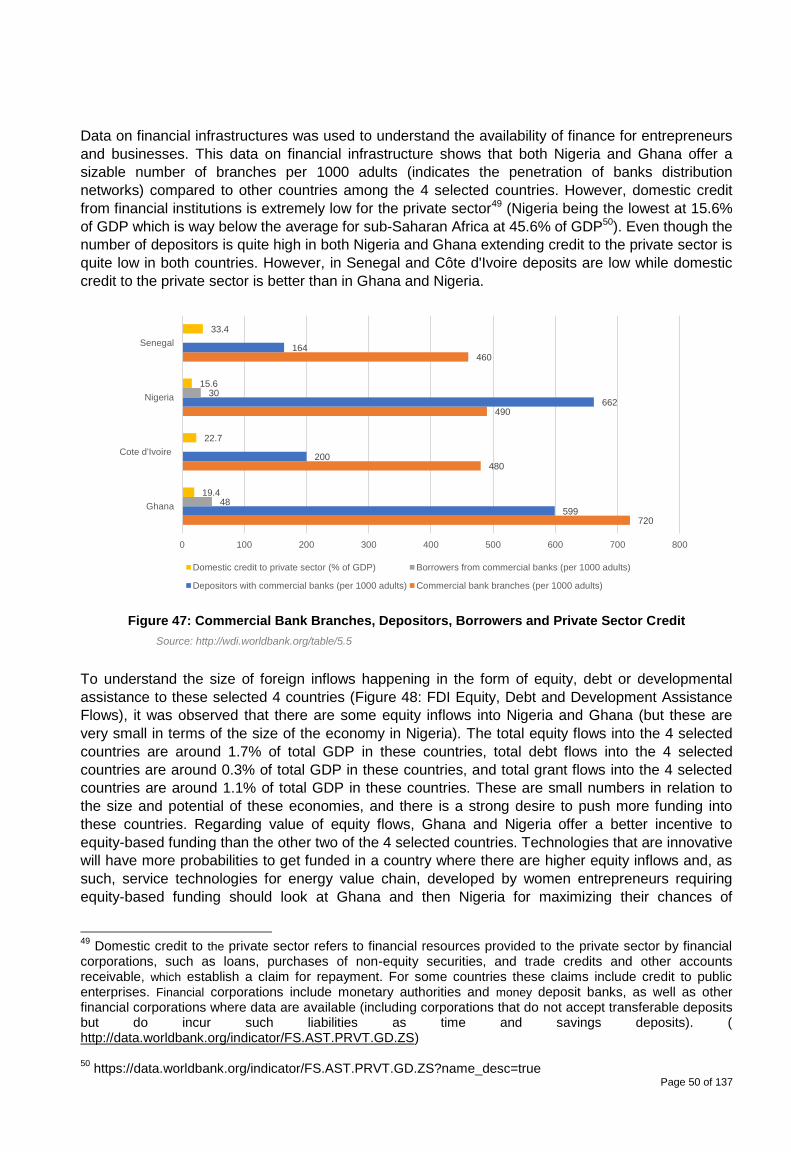
Page 50 of 137
Data on financial infrastructures was used to understand the availability of finance for entrepreneurs
and businesses. This data on financial infrastructure shows that both Nigeria and Ghana offer a
sizable number of branches per 1000 adults (indicates the penetration of banks distribution
networks) compared to other countries among the 4 selected countries. However, domestic credit
from financial institutions is extremely low for the private sector49 (Nigeria being the lowest at 15.6%
of GDP which is way below the average for sub-Saharan Africa at 45.6% of GDP50). Even though the
number of depositors is quite high in both Nigeria and Ghana extending credit to the private sector is
quite low in both countries. However, in Senegal and Côte d'Ivoire deposits are low while domestic
credit to the private sector is better than in Ghana and Nigeria.
Figure 47: Commercial Bank Branches, Depositors, Borrowers and Private Sector Credit
To understand the size of foreign inflows happening in the form of equity, debt or developmental
assistance to these selected 4 countries (Figure 48: FDI Equity, Debt and Development Assistance
Flows), it was observed that there are some equity inflows into Nigeria and Ghana (but these are
very small in terms of the size of the economy in Nigeria). The total equity flows into the 4 selected
countries are around 1.7% of total GDP in these countries, total debt flows into the 4 selected
countries are around 0.3% of total GDP in these countries, and total grant flows into the 4 selected
countries are around 1.1% of total GDP in these countries. These are small numbers in relation to
the size and potential of these economies, and there is a strong desire to push more funding into
these countries. Regarding value of equity flows, Ghana and Nigeria offer a better incentive to
equity-based funding than the other two of the 4 selected countries. Technologies that are innovative
will have more probabilities to get funded in a country where there are higher equity inflows and, as
such, service technologies for energy value chain, developed by women entrepreneurs requiring
equity-based funding should look at Ghana and then Nigeria for maximizing their chances of
49
Domestic credit to the private sector refers to financial resources provided to the private sector by financial corporations, such as loans, purchases of non-equity securities, and trade credits and other accounts receivable, which establish a claim for repayment. For some countries these claims include credit to public enterprises. Financial corporations include monetary authorities and money deposit banks, as well as other financial corporations where data are available (including corporations that do not accept transferable deposits but do incur such liabilities as time and savings deposits). ( http://data.worldbank.org/indicator/FS.AST.PRVT.GD.ZS) 50
https://data.worldbank.org/indicator/FS.AST.PRVT.GD.ZS?name_desc=true
720
480
490
460
599
200
662
164
48
30
19.4
22.7
15.6
33.4
0 100 200 300 400 500 600 700 800
Ghana
Cote d'Ivoire
Nigeria
Senegal
Domestic credit to private sector (% of GDP) Borrowers from commercial banks (per 1000 adults)
Depositors with commercial banks (per 1000 adults) Commercial bank branches (per 1000 adults)
Source: http://wdi.worldbank.org/table/5.5
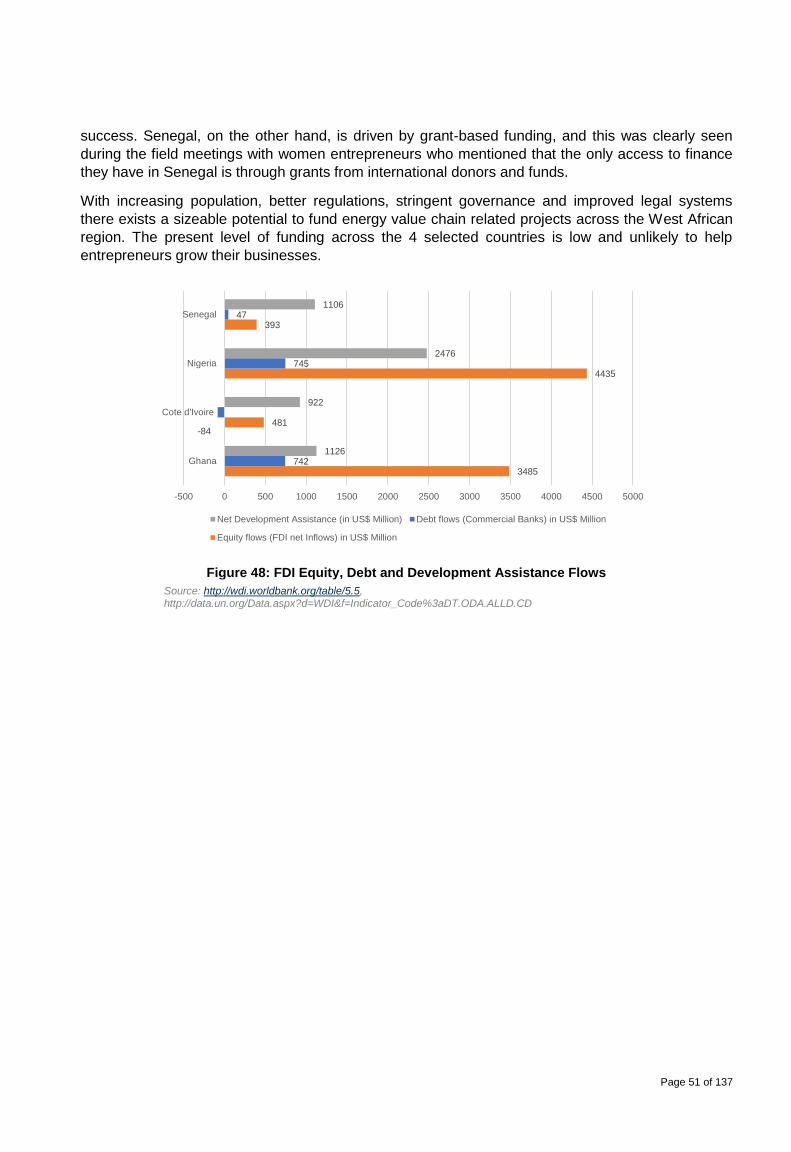
Page 51 of 137
success. Senegal, on the other hand, is driven by grant-based funding, and this was clearly seen
during the field meetings with women entrepreneurs who mentioned that the only access to finance
they have in Senegal is through grants from international donors and funds.
With increasing population, better regulations, stringent governance and improved legal systems
there exists a sizeable potential to fund energy value chain related projects across the West African
region. The present level of funding across the 4 selected countries is low and unlikely to help
entrepreneurs grow their businesses.
Figure 48: FDI Equity, Debt and Development Assistance Flows
3485
481
4435
393
742
-84
745
47
1126
922
2476
1106
-500 0 500 1000 1500 2000 2500 3000 3500 4000 4500 5000
Ghana
Cote d'Ivoire
Nigeria
Senegal
Net Development Assistance (in US$ Million) Debt flows (Commercial Banks) in US$ Million
Equity flows (FDI net Inflows) in US$ Million
Source: http://wdi.worldbank.org/table/5.5, http://data.un.org/Data.aspx?d=WDI&f=Indicator_Code%3aDT.ODA.ALLD.CD
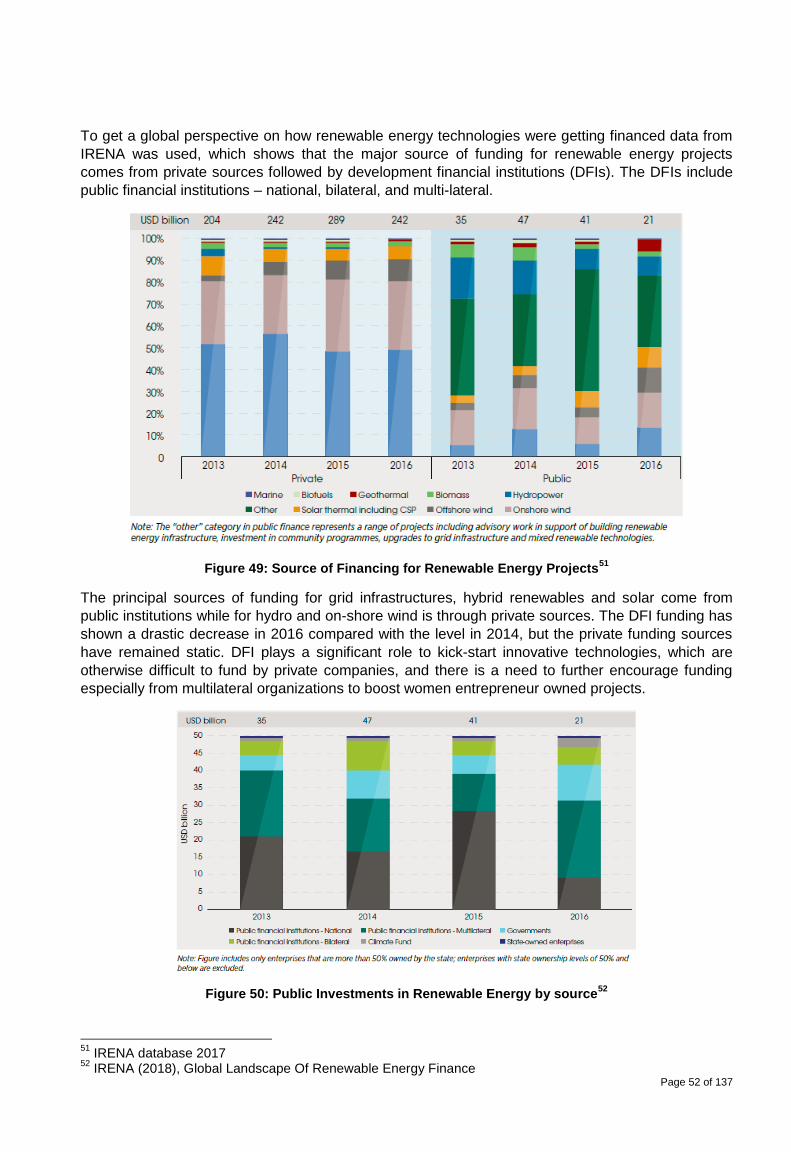
Page 52 of 137
To get a global perspective on how renewable energy technologies were getting financed data from
IRENA was used, which shows that the major source of funding for renewable energy projects
comes from private sources followed by development financial institutions (DFIs). The DFIs include
public financial institutions – national, bilateral, and multi-lateral.
Figure 49: Source of Financing for Renewable Energy Projects51
The principal sources of funding for grid infrastructures, hybrid renewables and solar come from
public institutions while for hydro and on-shore wind is through private sources. The DFI funding has
shown a drastic decrease in 2016 compared with the level in 2014, but the private funding sources
have remained static. DFI plays a significant role to kick-start innovative technologies, which are
otherwise difficult to fund by private companies, and there is a need to further encourage funding
especially from multilateral organizations to boost women entrepreneur owned projects.
Figure 50: Public Investments in Renewable Energy by source52
51
IRENA database 2017 52
IRENA (2018), Global Landscape Of Renewable Energy Finance
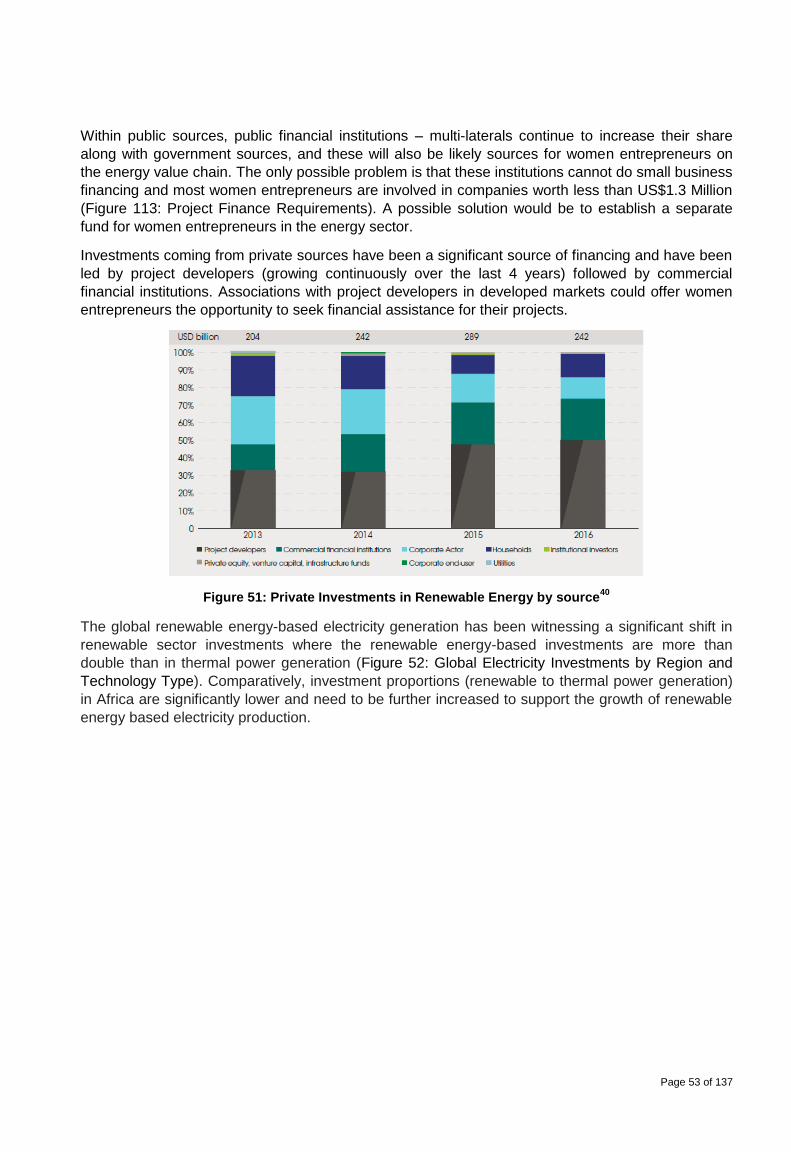
Page 53 of 137
Within public sources, public financial institutions – multi-laterals continue to increase their share
along with government sources, and these will also be likely sources for women entrepreneurs on
the energy value chain. The only possible problem is that these institutions cannot do small business
financing and most women entrepreneurs are involved in companies worth less than US$1.3 Million
(Figure 113: Project Finance Requirements). A possible solution would be to establish a separate
fund for women entrepreneurs in the energy sector.
Investments coming from private sources have been a significant source of financing and have been
led by project developers (growing continuously over the last 4 years) followed by commercial
financial institutions. Associations with project developers in developed markets could offer women
entrepreneurs the opportunity to seek financial assistance for their projects.
Figure 51: Private Investments in Renewable Energy by source40
The global renewable energy-based electricity generation has been witnessing a significant shift in
renewable sector investments where the renewable energy-based investments are more than
double than in thermal power generation (Figure 52: Global Electricity Investments by Region and
Technology Type). Comparatively, investment proportions (renewable to thermal power generation)
in Africa are significantly lower and need to be further increased to support the growth of renewable
energy based electricity production.
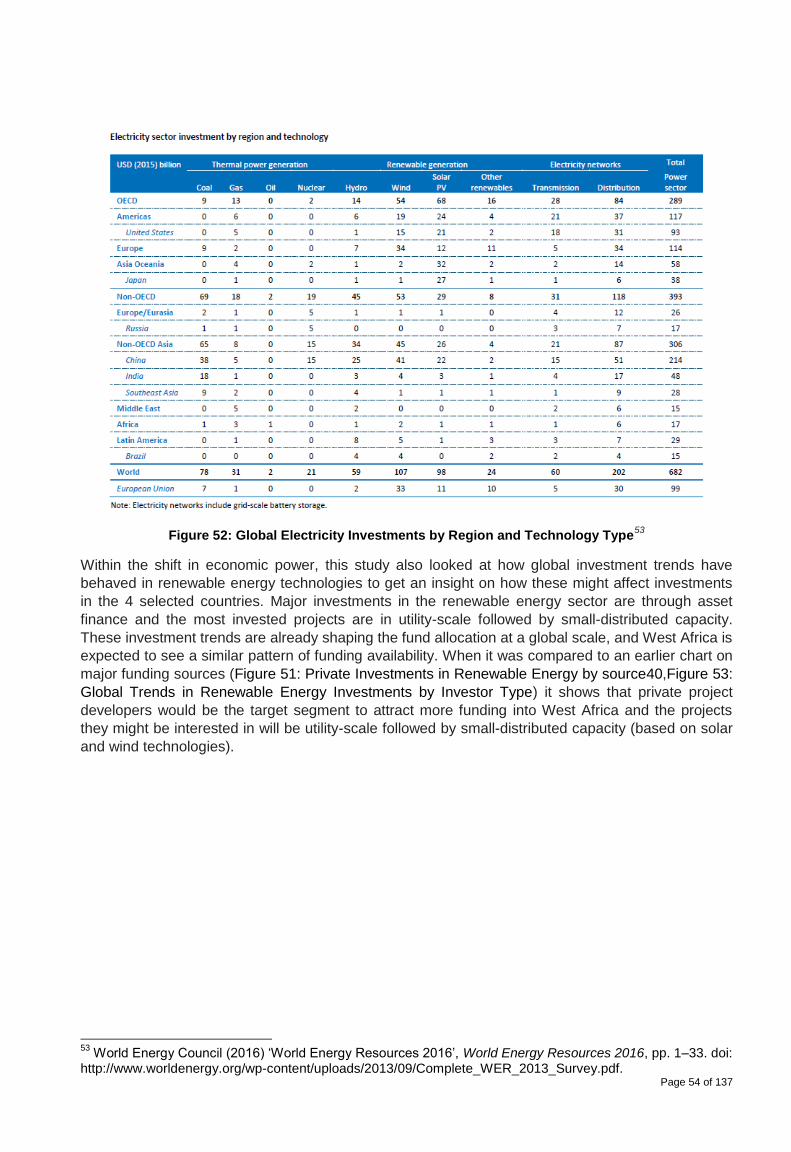
Page 54 of 137
Figure 52: Global Electricity Investments by Region and Technology Type53
Within the shift in economic power, this study also looked at how global investment trends have
behaved in renewable energy technologies to get an insight on how these might affect investments
in the 4 selected countries. Major investments in the renewable energy sector are through asset
finance and the most invested projects are in utility-scale followed by small-distributed capacity.
These investment trends are already shaping the fund allocation at a global scale, and West Africa is
expected to see a similar pattern of funding availability. When it was compared to an earlier chart on
major funding sources (Figure 51: Private Investments in Renewable Energy by source40,Figure 53:
Global Trends in Renewable Energy Investments by Investor Type) it shows that private project
developers would be the target segment to attract more funding into West Africa and the projects
they might be interested in will be utility-scale followed by small-distributed capacity (based on solar
and wind technologies).
53
World Energy Council (2016) ‘World Energy Resources 2016’, World Energy Resources 2016, pp. 1–33. doi: http://www.worldenergy.org/wp-content/uploads/2013/09/Complete_WER_2013_Survey.pdf.
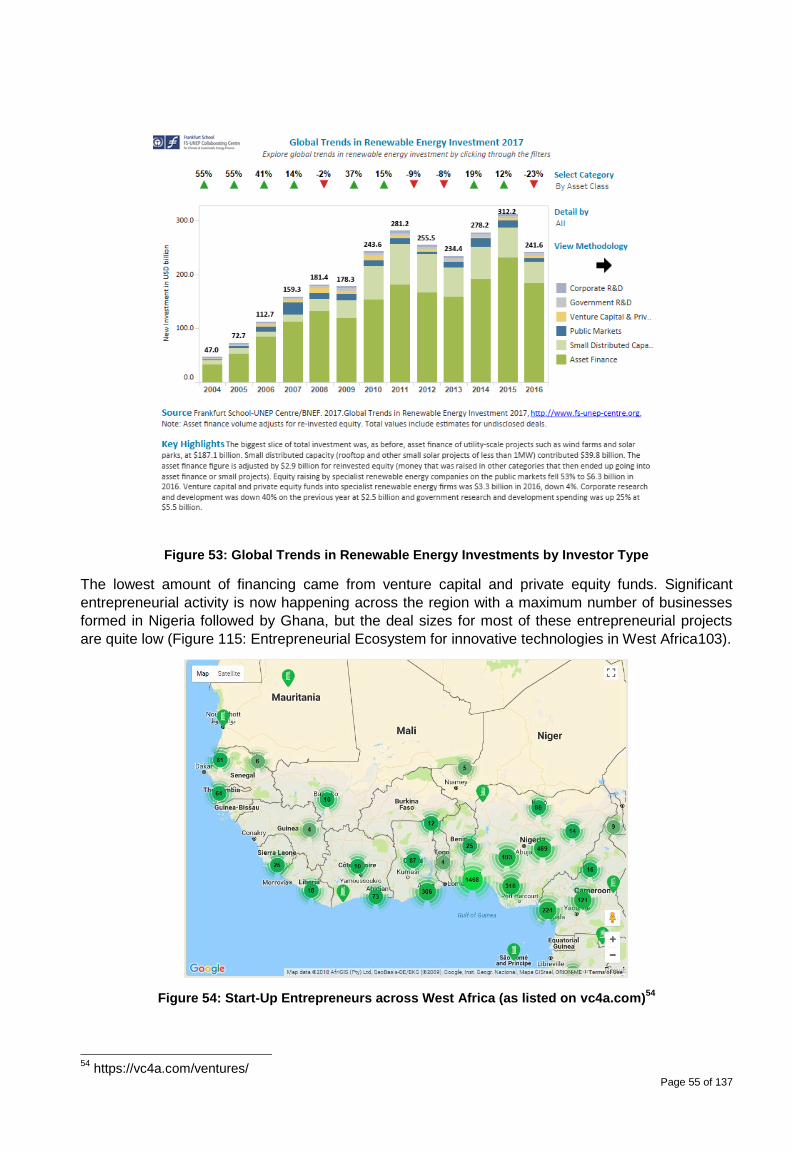
Page 55 of 137
Figure 53: Global Trends in Renewable Energy Investments by Investor Type
The lowest amount of financing came from venture capital and private equity funds. Significant
entrepreneurial activity is now happening across the region with a maximum number of businesses
formed in Nigeria followed by Ghana, but the deal sizes for most of these entrepreneurial projects
are quite low (Figure 115: Entrepreneurial Ecosystem for innovative technologies in West Africa103).
Figure 54: Start-Up Entrepreneurs across West Africa (as listed on vc4a.com)54
54
https://vc4a.com/ventures/
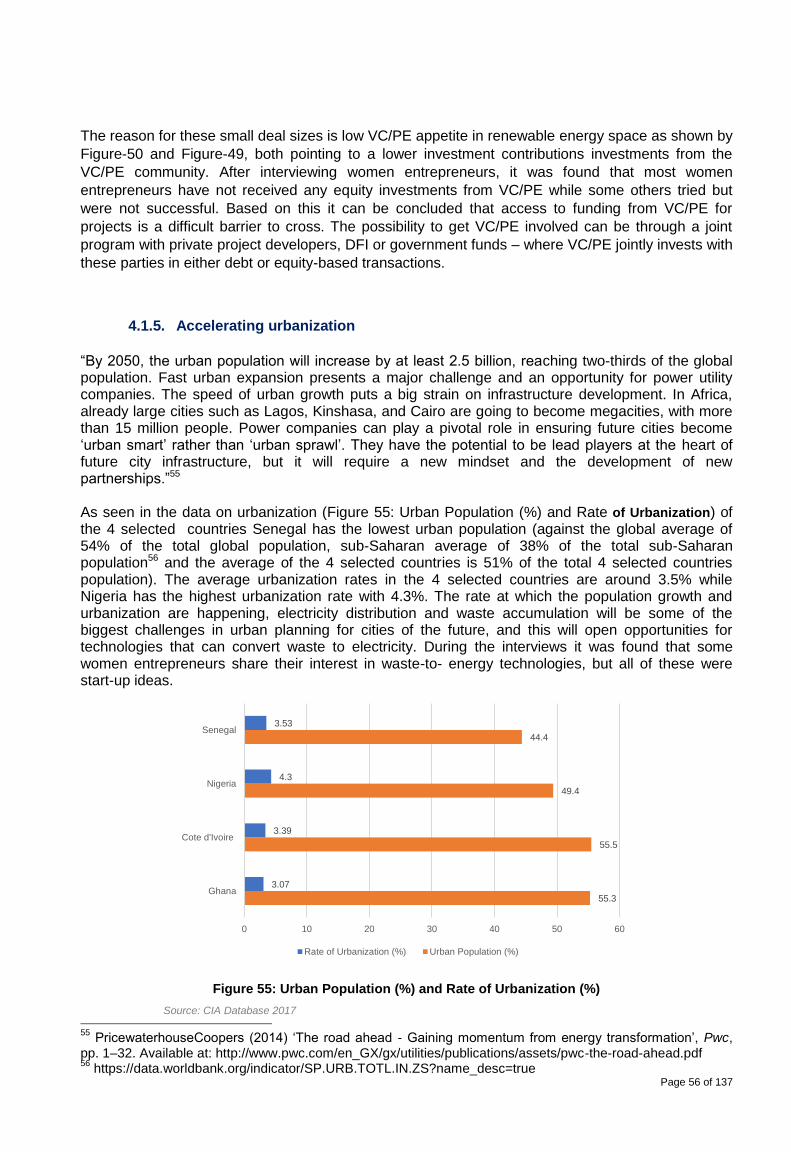
Page 56 of 137
The reason for these small deal sizes is low VC/PE appetite in renewable energy space as shown by
Figure-50 and Figure-49, both pointing to a lower investment contributions investments from the
VC/PE community. After interviewing women entrepreneurs, it was found that most women
entrepreneurs have not received any equity investments from VC/PE while some others tried but
were not successful. Based on this it can be concluded that access to funding from VC/PE for
projects is a difficult barrier to cross. The possibility to get VC/PE involved can be through a joint
program with private project developers, DFI or government funds – where VC/PE jointly invests with
these parties in either debt or equity-based transactions.
4.1.5. Accelerating urbanization
“By 2050, the urban population will increase by at least 2.5 billion, reaching two-thirds of the global population. Fast urban expansion presents a major challenge and an opportunity for power utility companies. The speed of urban growth puts a big strain on infrastructure development. In Africa, already large cities such as Lagos, Kinshasa, and Cairo are going to become megacities, with more than 15 million people. Power companies can play a pivotal role in ensuring future cities become ‘urban smart’ rather than ‘urban sprawl’. They have the potential to be lead players at the heart of future city infrastructure, but it will require a new mindset and the development of new partnerships.”55 As seen in the data on urbanization (Figure 55: Urban Population (%) and Rate of Urbanization) of the 4 selected countries Senegal has the lowest urban population (against the global average of 54% of the total global population, sub-Saharan average of 38% of the total sub-Saharan population56 and the average of the 4 selected countries is 51% of the total 4 selected countries population). The average urbanization rates in the 4 selected countries are around 3.5% while Nigeria has the highest urbanization rate with 4.3%. The rate at which the population growth and urbanization are happening, electricity distribution and waste accumulation will be some of the biggest challenges in urban planning for cities of the future, and this will open opportunities for technologies that can convert waste to electricity. During the interviews it was found that some women entrepreneurs share their interest in waste-to- energy technologies, but all of these were start-up ideas.
Figure 55: Urban Population (%) and Rate of Urbanization (%)
55
PricewaterhouseCoopers (2014) ‘The road ahead - Gaining momentum from energy transformation’, Pwc, pp. 1–32. Available at: http://www.pwc.com/en_GX/gx/utilities/publications/assets/pwc-the-road-ahead.pdf 56
https://data.worldbank.org/indicator/SP.URB.TOTL.IN.ZS?name_desc=true
55.3
55.5
49.4
44.4
3.07
3.39
4.3
3.53
0 10 20 30 40 50 60
Ghana
Cote d'Ivoire
Nigeria
Senegal
Rate of Urbanization (%) Urban Population (%)
Source: CIA Database 2017
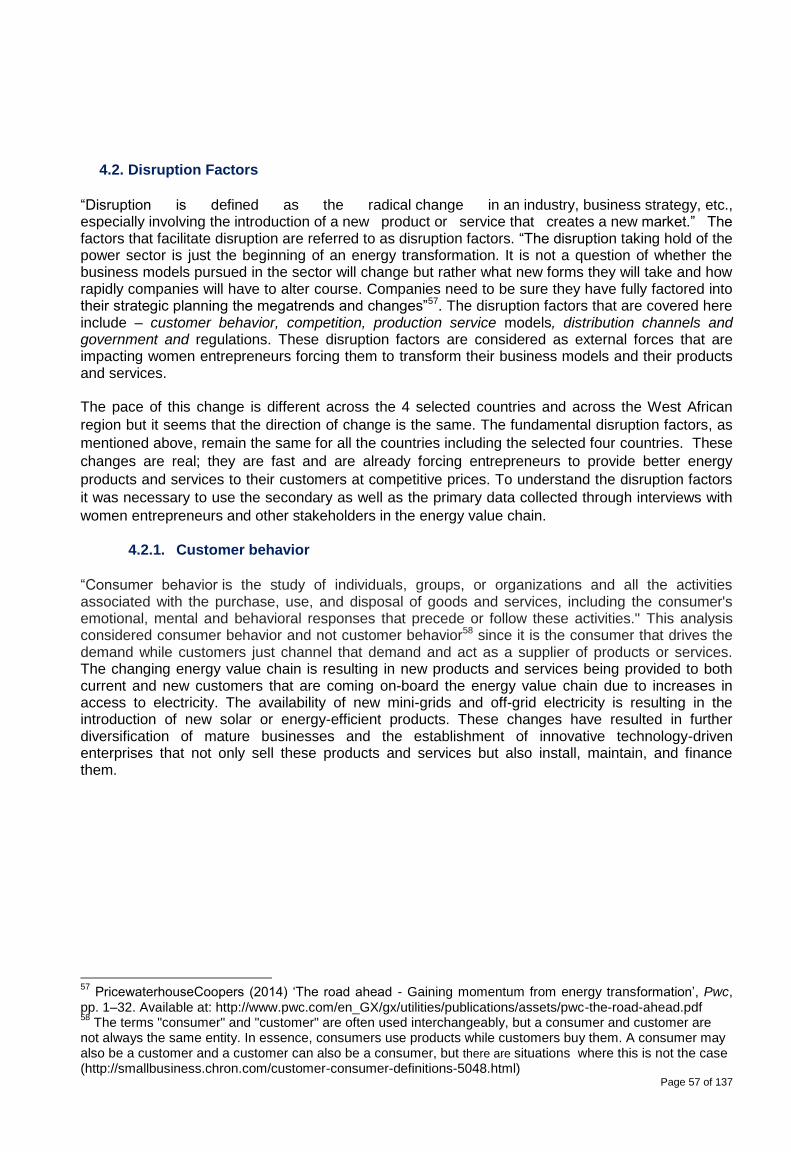
Page 57 of 137
4.2. Disruption Factors
“Disruption is defined as the radical change in an industry, business strategy, etc., especially involving the introduction of a new product or service that creates a new market.” The factors that facilitate disruption are referred to as disruption factors. “The disruption taking hold of the power sector is just the beginning of an energy transformation. It is not a question of whether the business models pursued in the sector will change but rather what new forms they will take and how rapidly companies will have to alter course. Companies need to be sure they have fully factored into their strategic planning the megatrends and changes”57. The disruption factors that are covered here include – customer behavior, competition, production service models, distribution channels and government and regulations. These disruption factors are considered as external forces that are impacting women entrepreneurs forcing them to transform their business models and their products and services. The pace of this change is different across the 4 selected countries and across the West African
region but it seems that the direction of change is the same. The fundamental disruption factors, as
mentioned above, remain the same for all the countries including the selected four countries. These
changes are real; they are fast and are already forcing entrepreneurs to provide better energy
products and services to their customers at competitive prices. To understand the disruption factors
it was necessary to use the secondary as well as the primary data collected through interviews with
women entrepreneurs and other stakeholders in the energy value chain.
4.2.1. Customer behavior
“Consumer behavior is the study of individuals, groups, or organizations and all the activities associated with the purchase, use, and disposal of goods and services, including the consumer's emotional, mental and behavioral responses that precede or follow these activities." This analysis considered consumer behavior and not customer behavior58 since it is the consumer that drives the demand while customers just channel that demand and act as a supplier of products or services. The changing energy value chain is resulting in new products and services being provided to both current and new customers that are coming on-board the energy value chain due to increases in access to electricity. The availability of new mini-grids and off-grid electricity is resulting in the introduction of new solar or energy-efficient products. These changes have resulted in further diversification of mature businesses and the establishment of innovative technology-driven enterprises that not only sell these products and services but also install, maintain, and finance them.
57
PricewaterhouseCoopers (2014) ‘The road ahead - Gaining momentum from energy transformation’, Pwc, pp. 1–32. Available at: http://www.pwc.com/en_GX/gx/utilities/publications/assets/pwc-the-road-ahead.pdf 58
The terms "consumer" and "customer" are often used interchangeably, but a consumer and customer are not always the same entity. In essence, consumers use products while customers buy them. A consumer may also be a customer and a customer can also be a consumer, but there are situations where this is not the case (http://smallbusiness.chron.com/customer-consumer-definitions-5048.html)
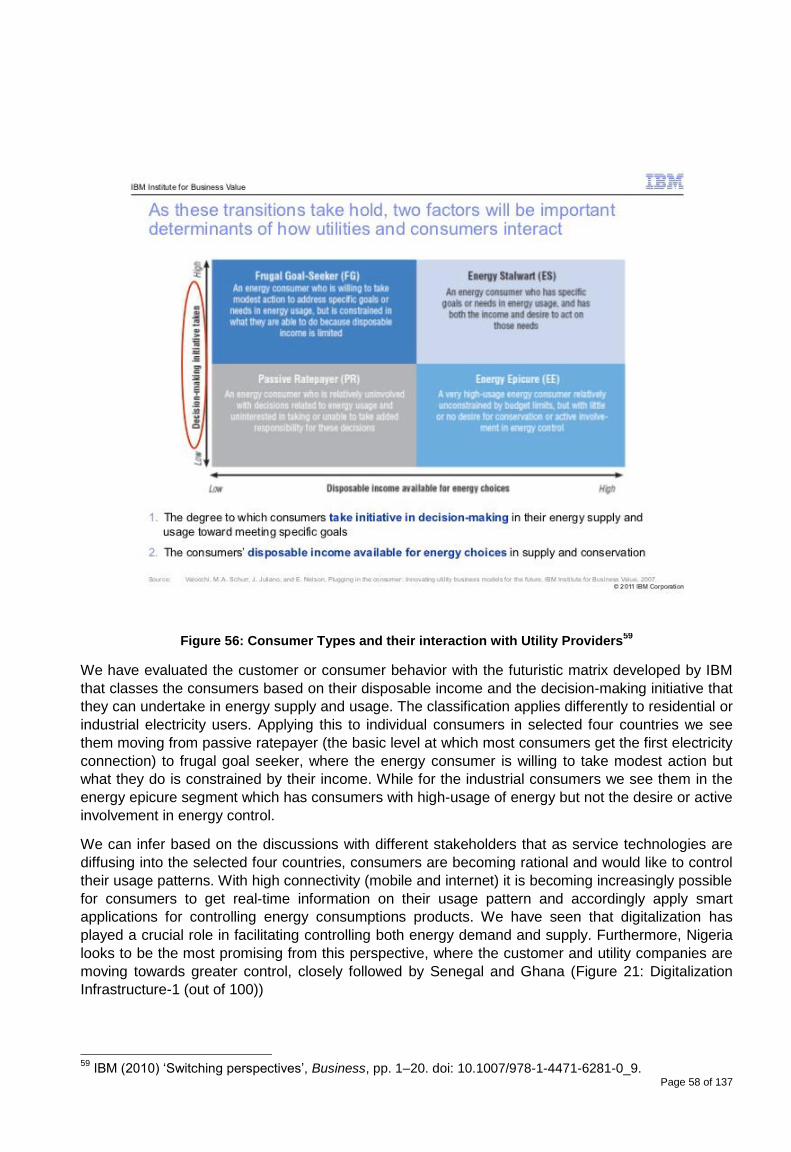
Page 58 of 137
Figure 56: Consumer Types and their interaction with Utility Providers
59
We have evaluated the customer or consumer behavior with the futuristic matrix developed by IBM
that classes the consumers based on their disposable income and the decision-making initiative that
they can undertake in energy supply and usage. The classification applies differently to residential or
industrial electricity users. Applying this to individual consumers in selected four countries we see
them moving from passive ratepayer (the basic level at which most consumers get the first electricity
connection) to frugal goal seeker, where the energy consumer is willing to take modest action but
what they do is constrained by their income. While for the industrial consumers we see them in the
energy epicure segment which has consumers with high-usage of energy but not the desire or active
involvement in energy control.
We can infer based on the discussions with different stakeholders that as service technologies are
diffusing into the selected four countries, consumers are becoming rational and would like to control
their usage patterns. With high connectivity (mobile and internet) it is becoming increasingly possible
for consumers to get real-time information on their usage pattern and accordingly apply smart
applications for controlling energy consumptions products. We have seen that digitalization has
played a crucial role in facilitating controlling both energy demand and supply. Furthermore, Nigeria
looks to be the most promising from this perspective, where the customer and utility companies are
moving towards greater control, closely followed by Senegal and Ghana (Figure 21: Digitalization
Infrastructure-1 (out of 100))
59
IBM (2010) ‘Switching perspectives’, Business, pp. 1–20. doi: 10.1007/978-1-4471-6281-0_9.
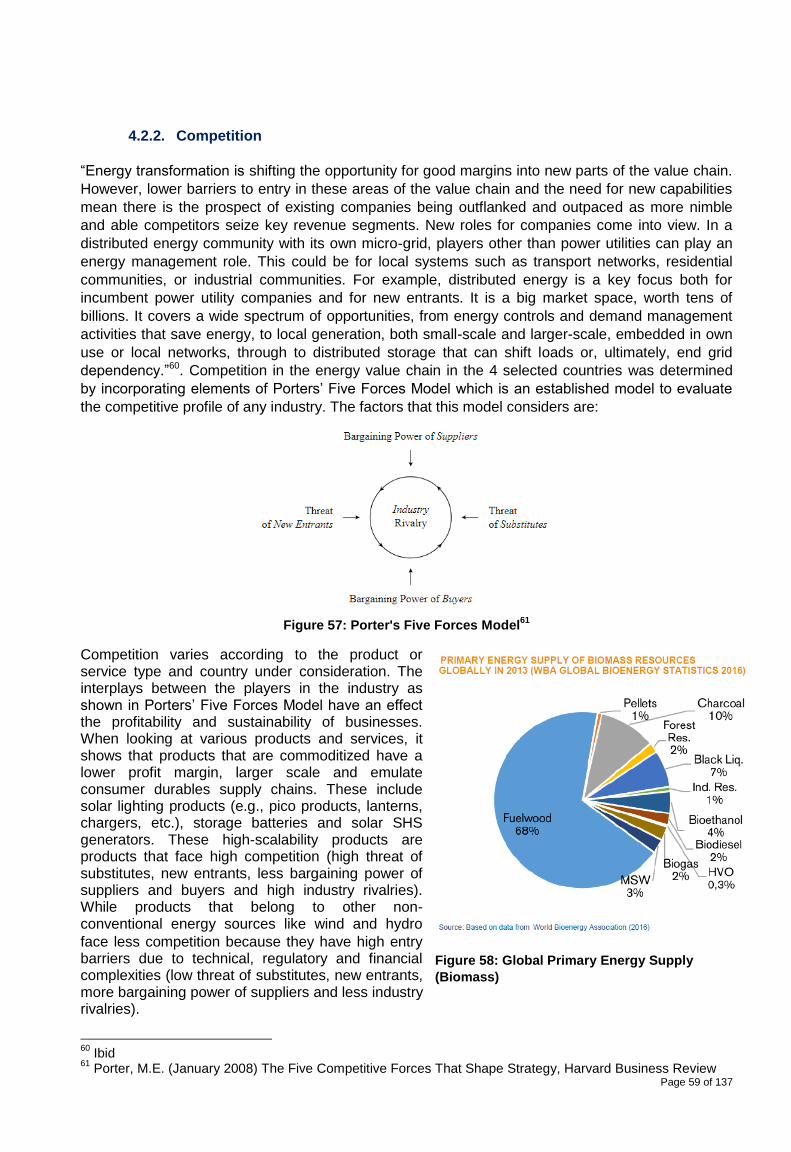
Page 59 of 137
4.2.2. Competition
“Energy transformation is shifting the opportunity for good margins into new parts of the value chain.
However, lower barriers to entry in these areas of the value chain and the need for new capabilities
mean there is the prospect of existing companies being outflanked and outpaced as more nimble
and able competitors seize key revenue segments. New roles for companies come into view. In a
distributed energy community with its own micro-grid, players other than power utilities can play an
energy management role. This could be for local systems such as transport networks, residential
communities, or industrial communities. For example, distributed energy is a key focus both for
incumbent power utility companies and for new entrants. It is a big market space, worth tens of
billions. It covers a wide spectrum of opportunities, from energy controls and demand management
activities that save energy, to local generation, both small-scale and larger-scale, embedded in own
use or local networks, through to distributed storage that can shift loads or, ultimately, end grid
dependency.”60. Competition in the energy value chain in the 4 selected countries was determined
by incorporating elements of Porters’ Five Forces Model which is an established model to evaluate
the competitive profile of any industry. The factors that this model considers are:
Figure 57: Porter's Five Forces Model
61
Competition varies according to the product or service type and country under consideration. The interplays between the players in the industry as shown in Porters’ Five Forces Model have an effect the profitability and sustainability of businesses. When looking at various products and services, it shows that products that are commoditized have a lower profit margin, larger scale and emulate consumer durables supply chains. These include solar lighting products (e.g., pico products, lanterns, chargers, etc.), storage batteries and solar SHS generators. These high-scalability products are products that face high competition (high threat of substitutes, new entrants, less bargaining power of suppliers and buyers and high industry rivalries). While products that belong to other non-conventional energy sources like wind and hydro
face less competition because they have high entry barriers due to technical, regulatory and financial complexities (low threat of substitutes, new entrants, more bargaining power of suppliers and less industry rivalries).
60
Ibid 61
Porter, M.E. (January 2008) The Five Competitive Forces That Shape Strategy, Harvard Business Review
Figure 58: Global Primary Energy Supply
(Biomass)
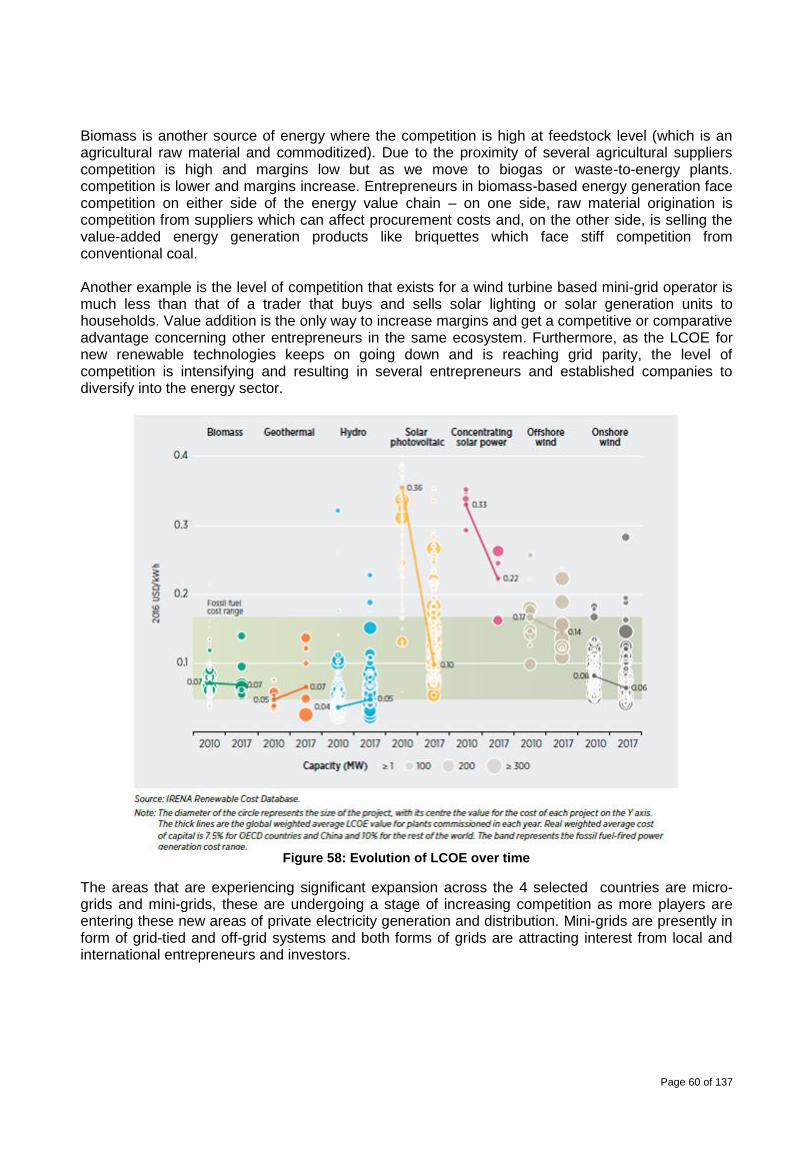
Page 60 of 137
Biomass is another source of energy where the competition is high at feedstock level (which is an agricultural raw material and commoditized). Due to the proximity of several agricultural suppliers competition is high and margins low but as we move to biogas or waste-to-energy plants. competition is lower and margins increase. Entrepreneurs in biomass-based energy generation face competition on either side of the energy value chain – on one side, raw material origination is competition from suppliers which can affect procurement costs and, on the other side, is selling the value-added energy generation products like briquettes which face stiff competition from conventional coal. Another example is the level of competition that exists for a wind turbine based mini-grid operator is much less than that of a trader that buys and sells solar lighting or solar generation units to households. Value addition is the only way to increase margins and get a competitive or comparative advantage concerning other entrepreneurs in the same ecosystem. Furthermore, as the LCOE for new renewable technologies keeps on going down and is reaching grid parity, the level of competition is intensifying and resulting in several entrepreneurs and established companies to diversify into the energy sector.
Figure 58: Evolution of LCOE over time
The areas that are experiencing significant expansion across the 4 selected countries are micro-grids and mini-grids, these are undergoing a stage of increasing competition as more players are entering these new areas of private electricity generation and distribution. Mini-grids are presently in form of grid-tied and off-grid systems and both forms of grids are attracting interest from local and international entrepreneurs and investors.
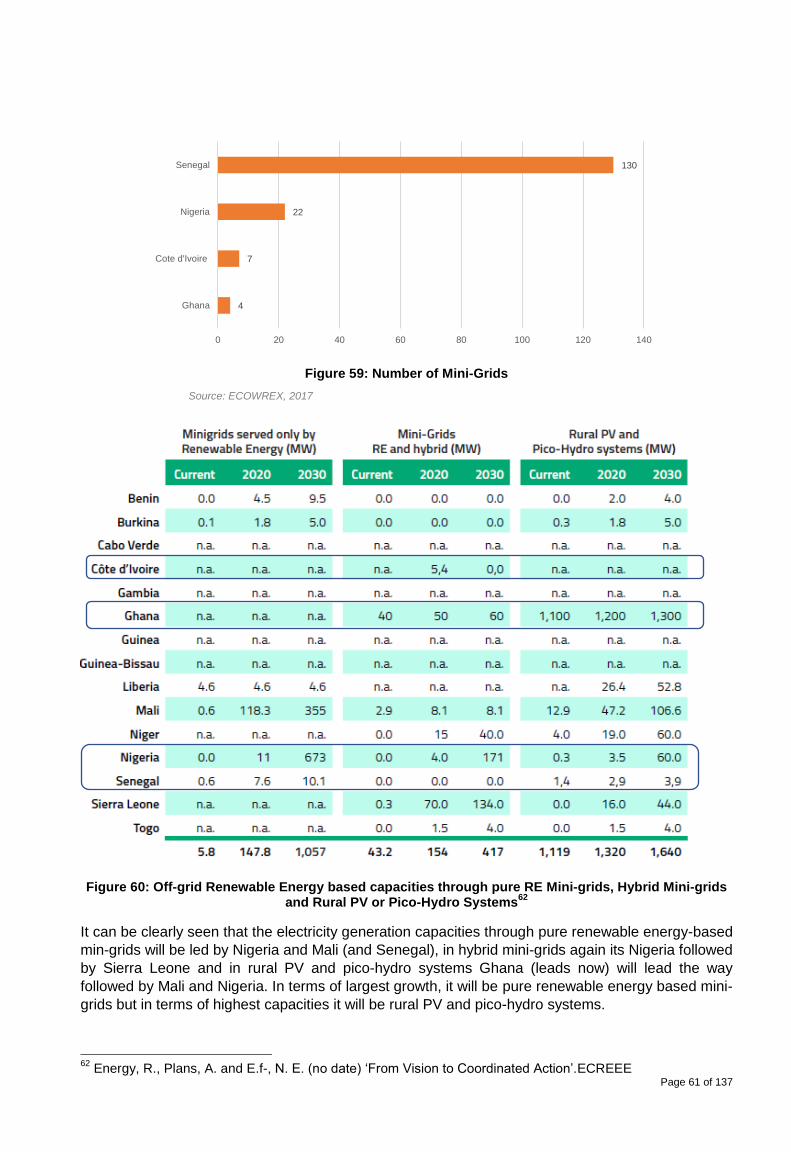
Page 61 of 137
Figure 59: Number of Mini-Grids
Figure 60: Off-grid Renewable Energy based capacities through pure RE Mini-grids, Hybrid Mini-grids and Rural PV or Pico-Hydro Systems
62
It can be clearly seen that the electricity generation capacities through pure renewable energy-based
min-grids will be led by Nigeria and Mali (and Senegal), in hybrid mini-grids again its Nigeria followed
by Sierra Leone and in rural PV and pico-hydro systems Ghana (leads now) will lead the way
followed by Mali and Nigeria. In terms of largest growth, it will be pure renewable energy based mini-
grids but in terms of highest capacities it will be rural PV and pico-hydro systems.
62
Energy, R., Plans, A. and E.f-, N. E. (no date) ‘From Vision to Coordinated Action’.ECREEE
4
7
22
130
0 20 40 60 80 100 120 140
Ghana
Cote d'Ivoire
Nigeria
Senegal
Source: ECOWREX, 2017
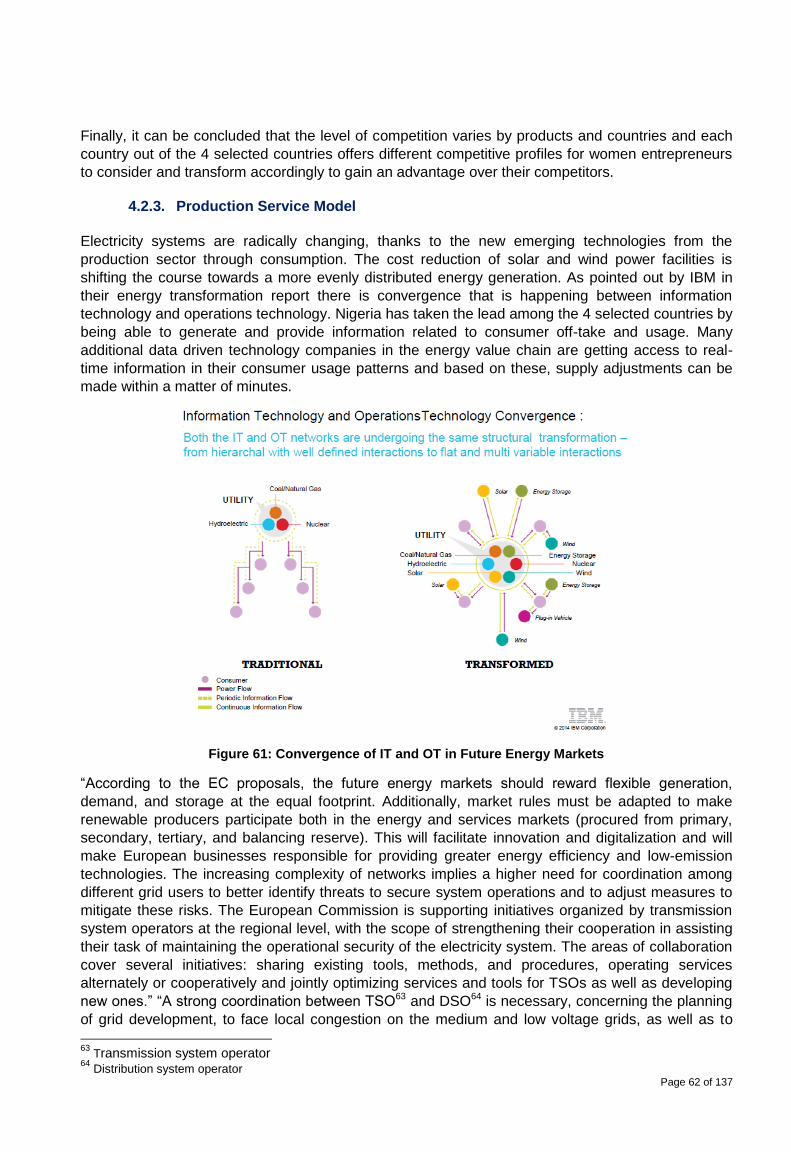
Page 62 of 137
Finally, it can be concluded that the level of competition varies by products and countries and each
country out of the 4 selected countries offers different competitive profiles for women entrepreneurs
to consider and transform accordingly to gain an advantage over their competitors.
4.2.3. Production Service Model
Electricity systems are radically changing, thanks to the new emerging technologies from the
production sector through consumption. The cost reduction of solar and wind power facilities is
shifting the course towards a more evenly distributed energy generation. As pointed out by IBM in
their energy transformation report there is convergence that is happening between information
technology and operations technology. Nigeria has taken the lead among the 4 selected countries by
being able to generate and provide information related to consumer off-take and usage. Many
additional data driven technology companies in the energy value chain are getting access to real-
time information in their consumer usage patterns and based on these, supply adjustments can be
made within a matter of minutes.
Figure 61: Convergence of IT and OT in Future Energy Markets
“According to the EC proposals, the future energy markets should reward flexible generation,
demand, and storage at the equal footprint. Additionally, market rules must be adapted to make
renewable producers participate both in the energy and services markets (procured from primary,
secondary, tertiary, and balancing reserve). This will facilitate innovation and digitalization and will
make European businesses responsible for providing greater energy efficiency and low-emission
technologies. The increasing complexity of networks implies a higher need for coordination among
different grid users to better identify threats to secure system operations and to adjust measures to
mitigate these risks. The European Commission is supporting initiatives organized by transmission
system operators at the regional level, with the scope of strengthening their cooperation in assisting
their task of maintaining the operational security of the electricity system. The areas of collaboration
cover several initiatives: sharing existing tools, methods, and procedures, operating services
alternately or cooperatively and jointly optimizing services and tools for TSOs as well as developing
new ones.” “A strong coordination between TSO63 and DSO64 is necessary, concerning the planning
of grid development, to face local congestion on the medium and low voltage grids, as well as to
63
Transmission system operator 64
Distribution system operator
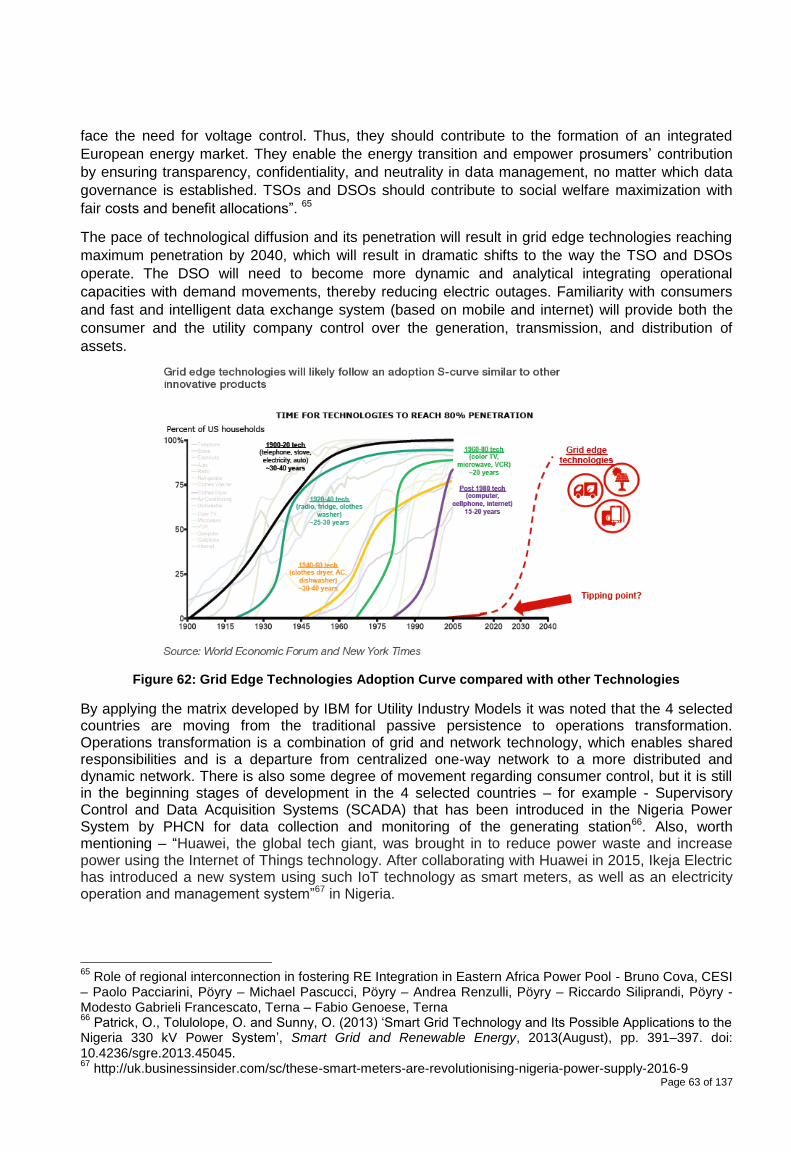
Page 63 of 137
face the need for voltage control. Thus, they should contribute to the formation of an integrated
European energy market. They enable the energy transition and empower prosumers’ contribution
by ensuring transparency, confidentiality, and neutrality in data management, no matter which data
governance is established. TSOs and DSOs should contribute to social welfare maximization with
fair costs and benefit allocations”. 65
The pace of technological diffusion and its penetration will result in grid edge technologies reaching
maximum penetration by 2040, which will result in dramatic shifts to the way the TSO and DSOs
operate. The DSO will need to become more dynamic and analytical integrating operational
capacities with demand movements, thereby reducing electric outages. Familiarity with consumers
and fast and intelligent data exchange system (based on mobile and internet) will provide both the
consumer and the utility company control over the generation, transmission, and distribution of
assets.
Figure 62: Grid Edge Technologies Adoption Curve compared with other Technologies
By applying the matrix developed by IBM for Utility Industry Models it was noted that the 4 selected countries are moving from the traditional passive persistence to operations transformation. Operations transformation is a combination of grid and network technology, which enables shared responsibilities and is a departure from centralized one-way network to a more distributed and dynamic network. There is also some degree of movement regarding consumer control, but it is still in the beginning stages of development in the 4 selected countries – for example - Supervisory Control and Data Acquisition Systems (SCADA) that has been introduced in the Nigeria Power System by PHCN for data collection and monitoring of the generating station66. Also, worth mentioning – “Huawei, the global tech giant, was brought in to reduce power waste and increase power using the Internet of Things technology. After collaborating with Huawei in 2015, Ikeja Electric has introduced a new system using such IoT technology as smart meters, as well as an electricity operation and management system”67 in Nigeria.
65
Role of regional interconnection in fostering RE Integration in Eastern Africa Power Pool - Bruno Cova, CESI – Paolo Pacciarini, Pöyry – Michael Pascucci, Pöyry – Andrea Renzulli, Pöyry – Riccardo Siliprandi, Pöyry - Modesto Gabrieli Francescato, Terna – Fabio Genoese, Terna 66
Patrick, O., Tolulolope, O. and Sunny, O. (2013) ‘Smart Grid Technology and Its Possible Applications to the Nigeria 330 kV Power System’, Smart Grid and Renewable Energy, 2013(August), pp. 391–397. doi: 10.4236/sgre.2013.45045. 67
http://uk.businessinsider.com/sc/these-smart-meters-are-revolutionising-nigeria-power-supply-2016-9
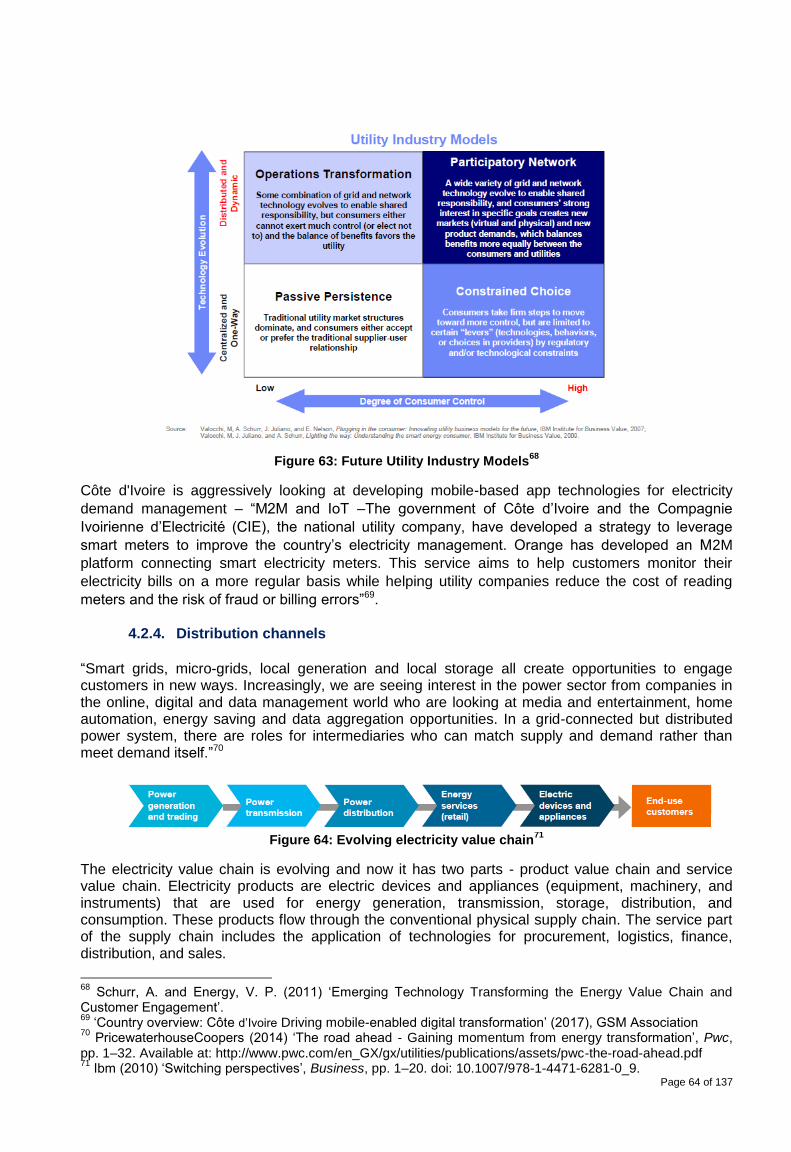
Page 64 of 137
Figure 63: Future Utility Industry Models68
Côte d'Ivoire is aggressively looking at developing mobile-based app technologies for electricity
demand management – “M2M and IoT –The government of Côte d’Ivoire and the Compagnie
Ivoirienne d’Electricité (CIE), the national utility company, have developed a strategy to leverage
smart meters to improve the country’s electricity management. Orange has developed an M2M
platform connecting smart electricity meters. This service aims to help customers monitor their
electricity bills on a more regular basis while helping utility companies reduce the cost of reading
meters and the risk of fraud or billing errors”69.
4.2.4. Distribution channels
“Smart grids, micro-grids, local generation and local storage all create opportunities to engage customers in new ways. Increasingly, we are seeing interest in the power sector from companies in the online, digital and data management world who are looking at media and entertainment, home automation, energy saving and data aggregation opportunities. In a grid-connected but distributed power system, there are roles for intermediaries who can match supply and demand rather than meet demand itself.”70
Figure 64: Evolving electricity value chain
71
The electricity value chain is evolving and now it has two parts - product value chain and service value chain. Electricity products are electric devices and appliances (equipment, machinery, and instruments) that are used for energy generation, transmission, storage, distribution, and consumption. These products flow through the conventional physical supply chain. The service part of the supply chain includes the application of technologies for procurement, logistics, finance, distribution, and sales.
68
Schurr, A. and Energy, V. P. (2011) ‘Emerging Technology Transforming the Energy Value Chain and Customer Engagement’. 69
‘Country overview: Côte d’Ivoire Driving mobile-enabled digital transformation’ (2017), GSM Association 70
PricewaterhouseCoopers (2014) ‘The road ahead - Gaining momentum from energy transformation’, Pwc, pp. 1–32. Available at: http://www.pwc.com/en_GX/gx/utilities/publications/assets/pwc-the-road-ahead.pdf 71
Ibm (2010) ‘Switching perspectives’, Business, pp. 1–20. doi: 10.1007/978-1-4471-6281-0_9.
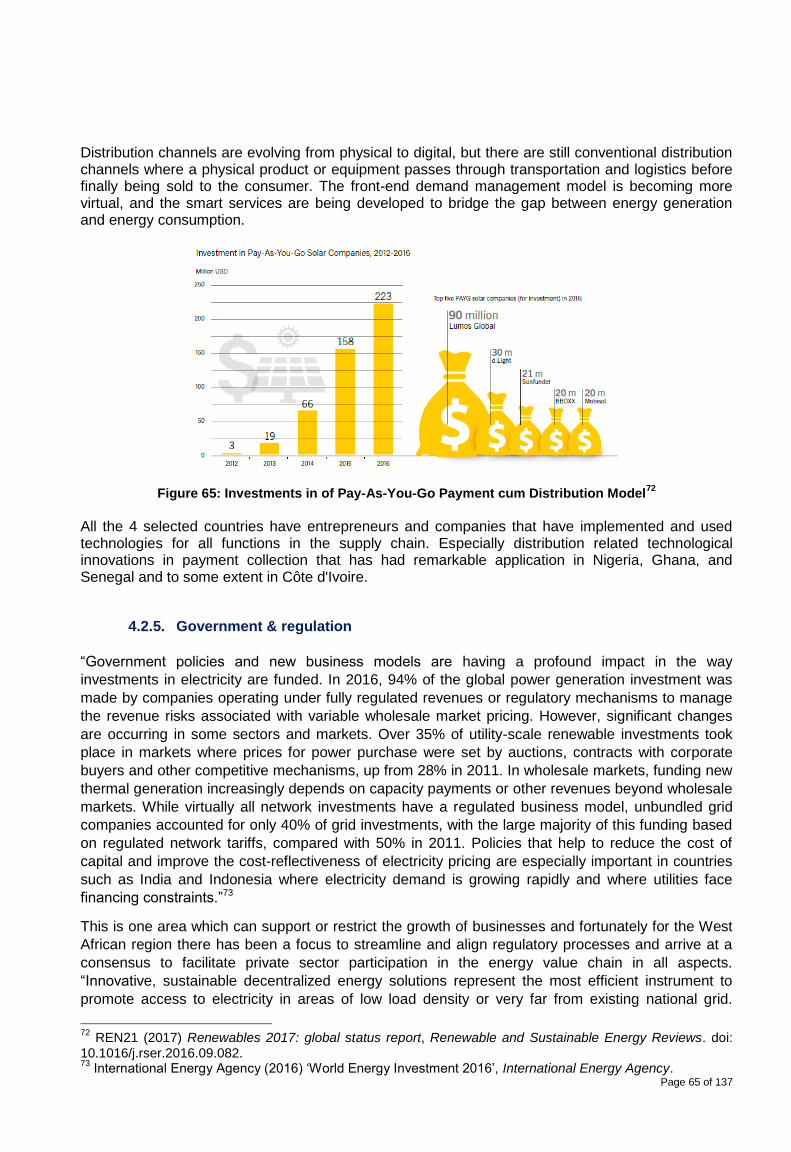
Page 65 of 137
Distribution channels are evolving from physical to digital, but there are still conventional distribution channels where a physical product or equipment passes through transportation and logistics before finally being sold to the consumer. The front-end demand management model is becoming more virtual, and the smart services are being developed to bridge the gap between energy generation and energy consumption.
Figure 65: Investments in of Pay-As-You-Go Payment cum Distribution Model72
All the 4 selected countries have entrepreneurs and companies that have implemented and used technologies for all functions in the supply chain. Especially distribution related technological innovations in payment collection that has had remarkable application in Nigeria, Ghana, and Senegal and to some extent in Côte d'Ivoire.
4.2.5. Government & regulation
“Government policies and new business models are having a profound impact in the way
investments in electricity are funded. In 2016, 94% of the global power generation investment was
made by companies operating under fully regulated revenues or regulatory mechanisms to manage
the revenue risks associated with variable wholesale market pricing. However, significant changes
are occurring in some sectors and markets. Over 35% of utility-scale renewable investments took
place in markets where prices for power purchase were set by auctions, contracts with corporate
buyers and other competitive mechanisms, up from 28% in 2011. In wholesale markets, funding new
thermal generation increasingly depends on capacity payments or other revenues beyond wholesale
markets. While virtually all network investments have a regulated business model, unbundled grid
companies accounted for only 40% of grid investments, with the large majority of this funding based
on regulated network tariffs, compared with 50% in 2011. Policies that help to reduce the cost of
capital and improve the cost-reflectiveness of electricity pricing are especially important in countries
such as India and Indonesia where electricity demand is growing rapidly and where utilities face
financing constraints.”73
This is one area which can support or restrict the growth of businesses and fortunately for the West
African region there has been a focus to streamline and align regulatory processes and arrive at a
consensus to facilitate private sector participation in the energy value chain in all aspects.
“Innovative, sustainable decentralized energy solutions represent the most efficient instrument to
promote access to electricity in areas of low load density or very far from existing national grid.
72
REN21 (2017) Renewables 2017: global status report, Renewable and Sustainable Energy Reviews. doi: 10.1016/j.rser.2016.09.082. 73
International Energy Agency (2016) ‘World Energy Investment 2016’, International Energy Agency.
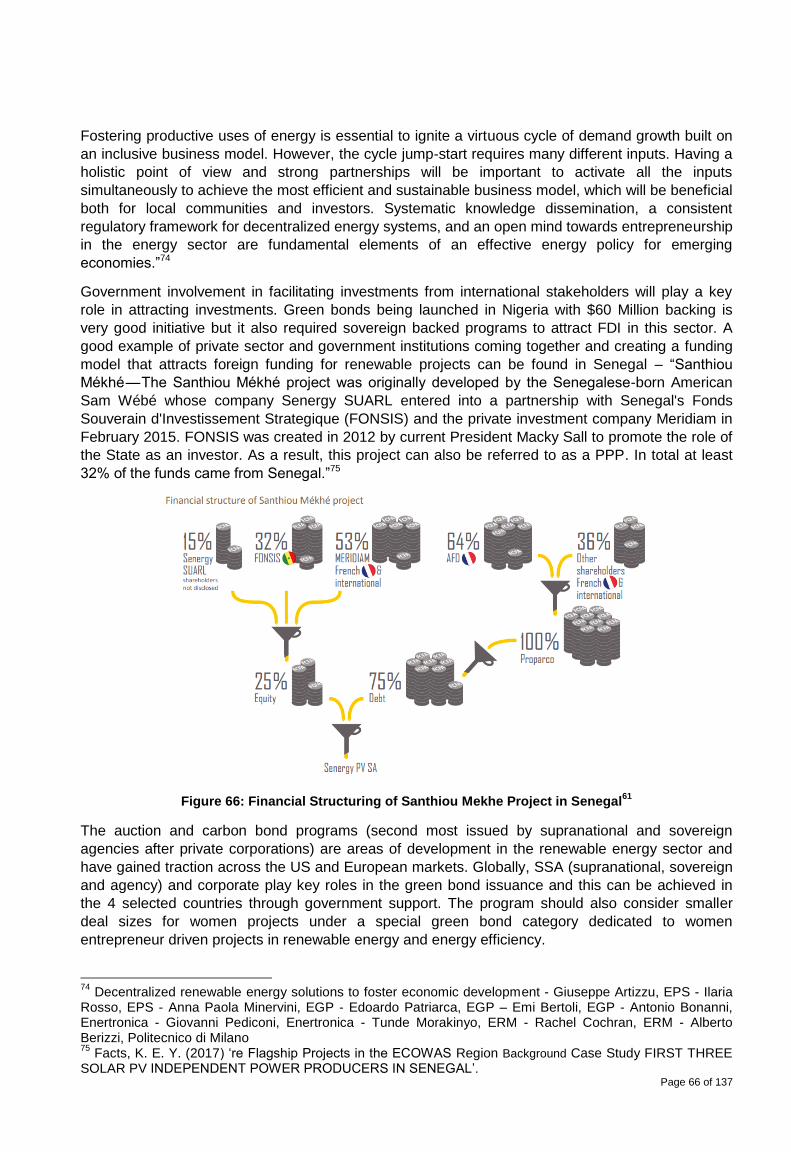
Page 66 of 137
Fostering productive uses of energy is essential to ignite a virtuous cycle of demand growth built on
an inclusive business model. However, the cycle jump-start requires many different inputs. Having a
holistic point of view and strong partnerships will be important to activate all the inputs
simultaneously to achieve the most efficient and sustainable business model, which will be beneficial
both for local communities and investors. Systematic knowledge dissemination, a consistent
regulatory framework for decentralized energy systems, and an open mind towards entrepreneurship
in the energy sector are fundamental elements of an effective energy policy for emerging
economies.”74
Government involvement in facilitating investments from international stakeholders will play a key
role in attracting investments. Green bonds being launched in Nigeria with $60 Million backing is
very good initiative but it also required sovereign backed programs to attract FDI in this sector. A
good example of private sector and government institutions coming together and creating a funding
model that attracts foreign funding for renewable projects can be found in Senegal – “Santhiou
Mékhé — The Santhiou Mékhé project was originally developed by the Senegalese-born American
Sam Wébé whose company Senergy SUARL entered into a partnership with Senegal's Fonds
Souverain d'Investissement Strategique (FONSIS) and the private investment company Meridiam in
February 2015. FONSIS was created in 2012 by current President Macky Sall to promote the role of
the State as an investor. As a result, this project can also be referred to as a PPP. In total at least
32% of the funds came from Senegal.”75
Figure 66: Financial Structuring of Santhiou Mekhe Project in Senegal61
The auction and carbon bond programs (second most issued by supranational and sovereign
agencies after private corporations) are areas of development in the renewable energy sector and
have gained traction across the US and European markets. Globally, SSA (supranational, sovereign
and agency) and corporate play key roles in the green bond issuance and this can be achieved in
the 4 selected countries through government support. The program should also consider smaller
deal sizes for women projects under a special green bond category dedicated to women
entrepreneur driven projects in renewable energy and energy efficiency.
74
Decentralized renewable energy solutions to foster economic development - Giuseppe Artizzu, EPS - Ilaria Rosso, EPS - Anna Paola Minervini, EGP - Edoardo Patriarca, EGP – Emi Bertoli, EGP - Antonio Bonanni, Enertronica - Giovanni Pediconi, Enertronica - Tunde Morakinyo, ERM - Rachel Cochran, ERM - Alberto Berizzi, Politecnico di Milano 75
Facts, K. E. Y. (2017) ‘re Flagship Projects in the ECOWAS Region Background Case Study FIRST THREE SOLAR PV INDEPENDENT POWER PRODUCERS IN SENEGAL’.
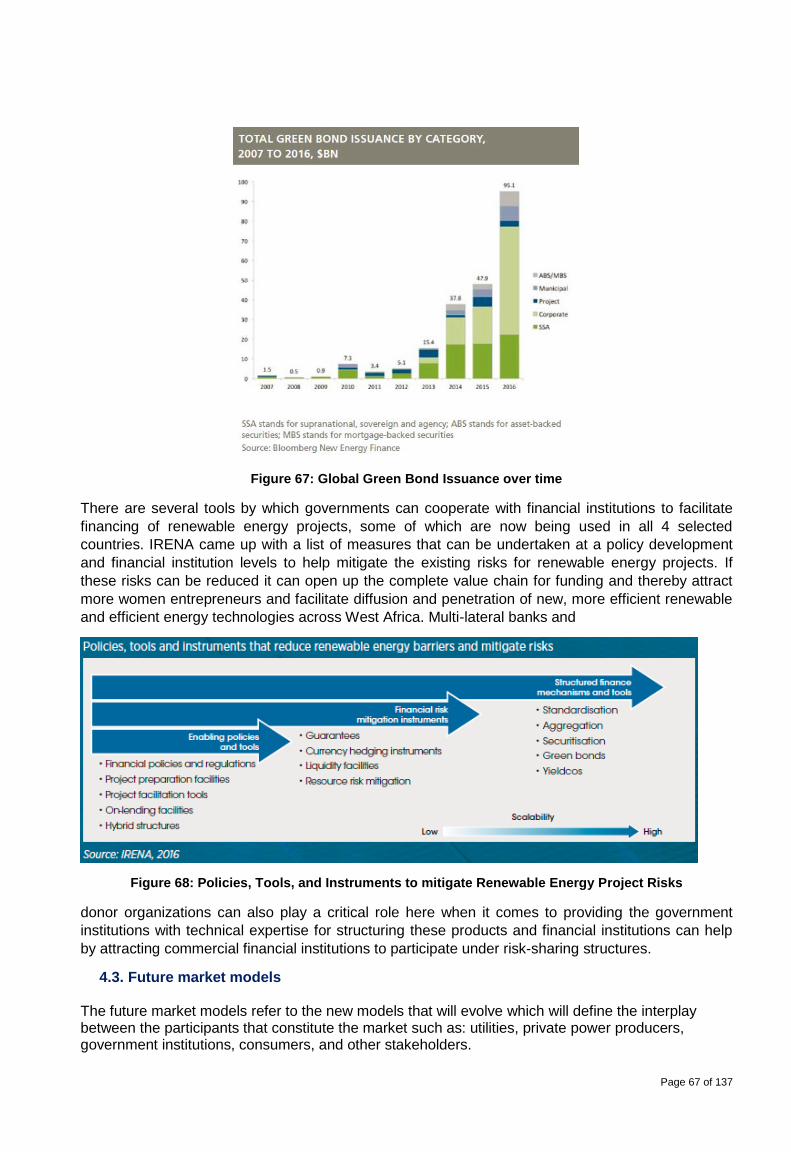
Page 67 of 137
Figure 67: Global Green Bond Issuance over time
There are several tools by which governments can cooperate with financial institutions to facilitate
financing of renewable energy projects, some of which are now being used in all 4 selected
countries. IRENA came up with a list of measures that can be undertaken at a policy development
and financial institution levels to help mitigate the existing risks for renewable energy projects. If
these risks can be reduced it can open up the complete value chain for funding and thereby attract
more women entrepreneurs and facilitate diffusion and penetration of new, more efficient renewable
and efficient energy technologies across West Africa. Multi-lateral banks and
Figure 68: Policies, Tools, and Instruments to mitigate Renewable Energy Project Risks
donor organizations can also play a critical role here when it comes to providing the government
institutions with technical expertise for structuring these products and financial institutions can help
by attracting commercial financial institutions to participate under risk-sharing structures.
4.3. Future market models The future market models refer to the new models that will evolve which will define the interplay between the participants that constitute the market such as: utilities, private power producers, government institutions, consumers, and other stakeholders.
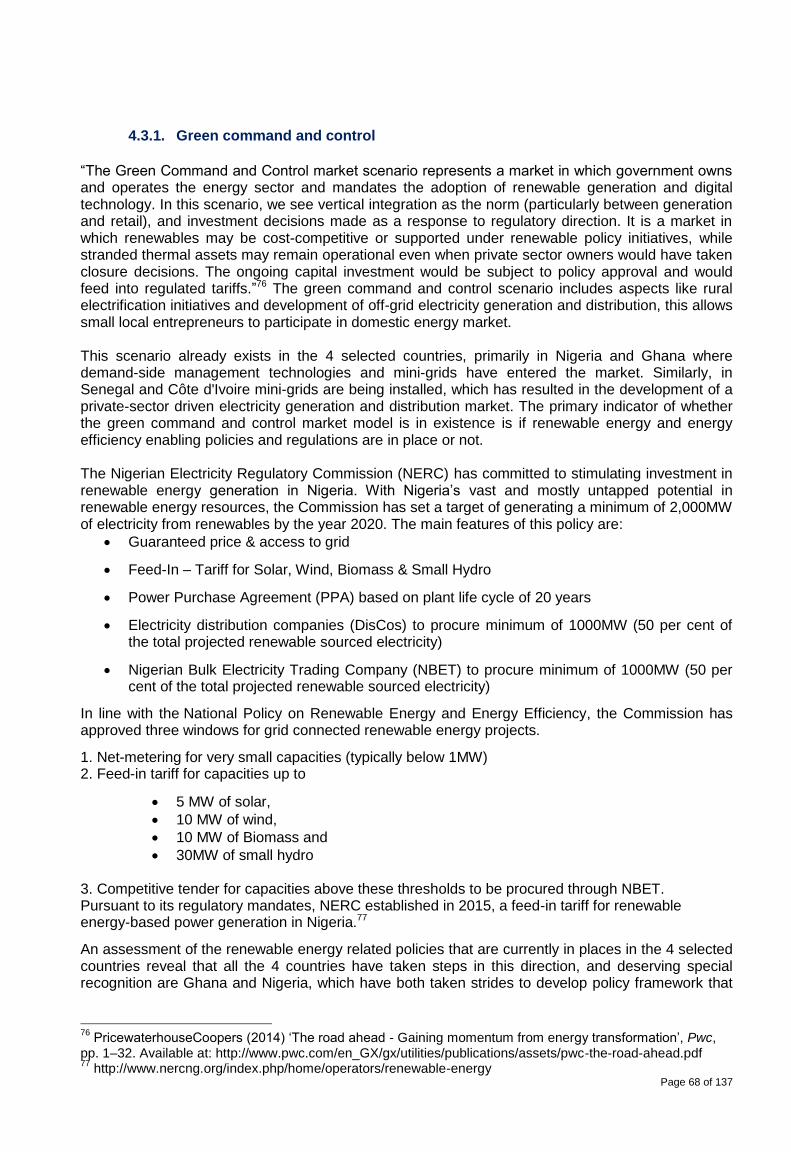
Page 68 of 137
4.3.1. Green command and control
“The Green Command and Control market scenario represents a market in which government owns and operates the energy sector and mandates the adoption of renewable generation and digital technology. In this scenario, we see vertical integration as the norm (particularly between generation and retail), and investment decisions made as a response to regulatory direction. It is a market in which renewables may be cost-competitive or supported under renewable policy initiatives, while stranded thermal assets may remain operational even when private sector owners would have taken closure decisions. The ongoing capital investment would be subject to policy approval and would feed into regulated tariffs.”76 The green command and control scenario includes aspects like rural electrification initiatives and development of off-grid electricity generation and distribution, this allows small local entrepreneurs to participate in domestic energy market. This scenario already exists in the 4 selected countries, primarily in Nigeria and Ghana where demand-side management technologies and mini-grids have entered the market. Similarly, in Senegal and Côte d'Ivoire mini-grids are being installed, which has resulted in the development of a private-sector driven electricity generation and distribution market. The primary indicator of whether the green command and control market model is in existence is if renewable energy and energy efficiency enabling policies and regulations are in place or not. The Nigerian Electricity Regulatory Commission (NERC) has committed to stimulating investment in renewable energy generation in Nigeria. With Nigeria’s vast and mostly untapped potential in renewable energy resources, the Commission has set a target of generating a minimum of 2,000MW of electricity from renewables by the year 2020. The main features of this policy are:
Guaranteed price & access to grid
Feed-In – Tariff for Solar, Wind, Biomass & Small Hydro
Power Purchase Agreement (PPA) based on plant life cycle of 20 years
Electricity distribution companies (DisCos) to procure minimum of 1000MW (50 per cent of the total projected renewable sourced electricity)
Nigerian Bulk Electricity Trading Company (NBET) to procure minimum of 1000MW (50 per cent of the total projected renewable sourced electricity)
In line with the National Policy on Renewable Energy and Energy Efficiency, the Commission has approved three windows for grid connected renewable energy projects.
1. Net-metering for very small capacities (typically below 1MW) 2. Feed-in tariff for capacities up to
5 MW of solar,
10 MW of wind,
10 MW of Biomass and
30MW of small hydro 3. Competitive tender for capacities above these thresholds to be procured through NBET. Pursuant to its regulatory mandates, NERC established in 2015, a feed-in tariff for renewable energy-based power generation in Nigeria.77
An assessment of the renewable energy related policies that are currently in places in the 4 selected countries reveal that all the 4 countries have taken steps in this direction, and deserving special recognition are Ghana and Nigeria, which have both taken strides to develop policy framework that
76
PricewaterhouseCoopers (2014) ‘The road ahead - Gaining momentum from energy transformation’, Pwc, pp. 1–32. Available at: http://www.pwc.com/en_GX/gx/utilities/publications/assets/pwc-the-road-ahead.pdf 77
http://www.nercng.org/index.php/home/operators/renewable-energy
Page 69 of 137
facilitates private sector participation. Cote d’Ivoire has taken some steps but does lag behind the other countries.
These policies are presented below:
Title Year Policy Status
Policy Type Policy Target
Rural Electrification Strategy and Implementation Plan of Nigeria
2006 In Force
Policy Support>Strategic planning
Multiple RE Sources>Power
Nigerian Electricity Regulatory Commission Mini-Grid Regulation 2016
2016 In Force
Regulatory Instruments Multiple RE Sources>Power
Nigeria Renewable Energy Master Plan
2011 In Force
Economic Instruments>Direct investment>Infrastructure investments, Economic Instruments>Fiscal/financial incentives>Tax relief, Policy Support>Strategic planning
Wind, Bioenergy>Biomass for power, Solar>Solar photovoltaic, Hydropower, Multiple RE Sources
Nigeria Feed-in Tariff for Renewable Energy Sourced Electricity
2016 (Feb)
In Force
Economic Instruments>Fiscal/financial incentives>Feed-in tariffs/premiums
Bioenergy, Solar, Wind
National Renewable Energy and Energy Efficiency Policy for Nigeria
2015 Planned
Policy Support>Strategic planning
Multiple RE Sources>All
Multi-Year Tariff Order (MYTO) II (2012-2017)
2012 (June 1st)
Superseded
Economic Instruments>Fiscal/financial incentives>Feed-in tariffs/premiums
Multiple RE Sources>Power, Multiple RE Sources, Wind>Onshore, Solar>Solar photovoltaic, Hydropower, Bioenergy>Biomass for power
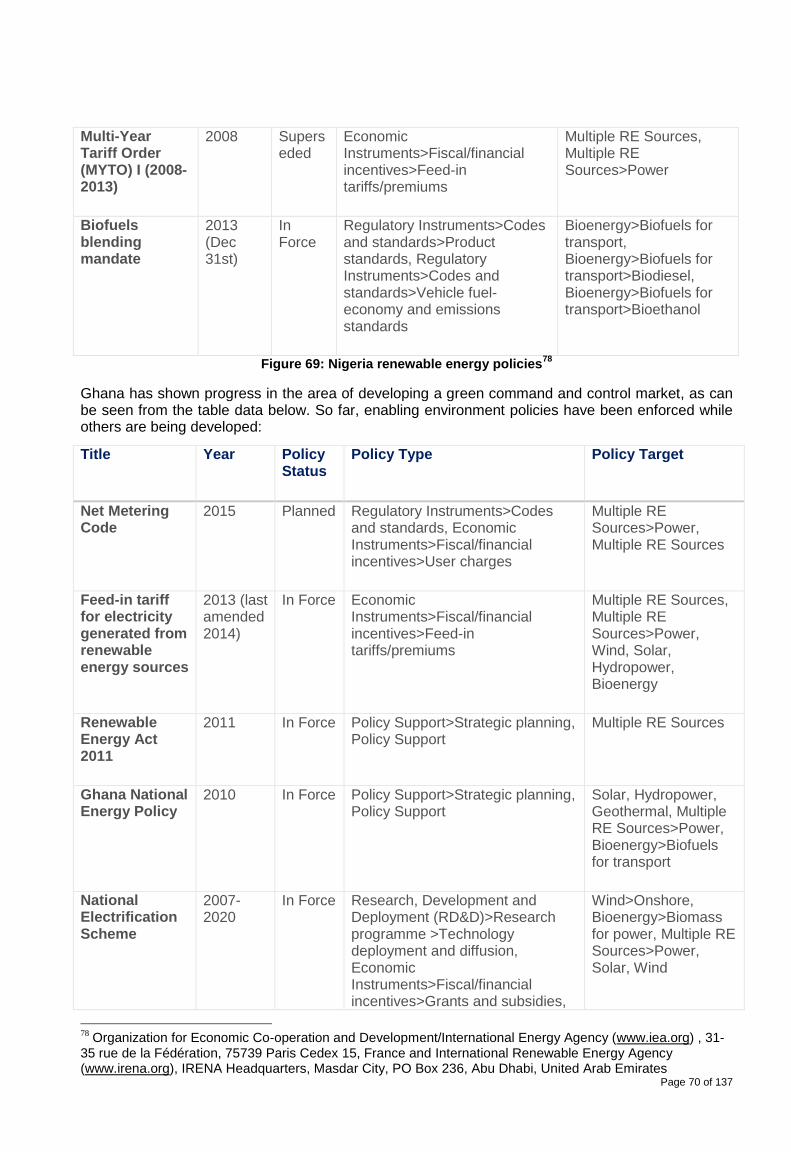
Page 70 of 137
Multi-Year Tariff Order (MYTO) I (2008-2013)
2008 Superseded
Economic Instruments>Fiscal/financial incentives>Feed-in tariffs/premiums
Multiple RE Sources, Multiple RE Sources>Power
Biofuels blending mandate
2013 (Dec 31st)
In Force
Regulatory Instruments>Codes and standards>Product standards, Regulatory Instruments>Codes and standards>Vehicle fuel-economy and emissions standards
Bioenergy>Biofuels for transport, Bioenergy>Biofuels for transport>Biodiesel, Bioenergy>Biofuels for transport>Bioethanol
Figure 69: Nigeria renewable energy policies78
Ghana has shown progress in the area of developing a green command and control market, as can be seen from the table data below. So far, enabling environment policies have been enforced while others are being developed:
Title Year Policy Status
Policy Type Policy Target
Net Metering Code
2015 Planned Regulatory Instruments>Codes and standards, Economic Instruments>Fiscal/financial incentives>User charges
Multiple RE Sources>Power, Multiple RE Sources
Feed-in tariff for electricity generated from renewable energy sources
2013 (last amended 2014)
In Force Economic Instruments>Fiscal/financial incentives>Feed-in tariffs/premiums
Multiple RE Sources, Multiple RE Sources>Power, Wind, Solar, Hydropower, Bioenergy
Renewable Energy Act 2011
2011 In Force Policy Support>Strategic planning, Policy Support
Multiple RE Sources
Ghana National Energy Policy
2010 In Force Policy Support>Strategic planning, Policy Support
Solar, Hydropower, Geothermal, Multiple RE Sources>Power, Bioenergy>Biofuels for transport
National Electrification Scheme
2007-2020
In Force Research, Development and Deployment (RD&D)>Research programme >Technology deployment and diffusion, Economic Instruments>Fiscal/financial incentives>Grants and subsidies,
Wind>Onshore, Bioenergy>Biomass for power, Multiple RE Sources>Power, Solar, Wind
78
Organization for Economic Co-operation and Development/International Energy Agency (www.iea.org) , 31-35 rue de la Fédération, 75739 Paris Cedex 15, France and International Renewable Energy Agency (www.irena.org), IRENA Headquarters, Masdar City, PO Box 236, Abu Dhabi, United Arab Emirates
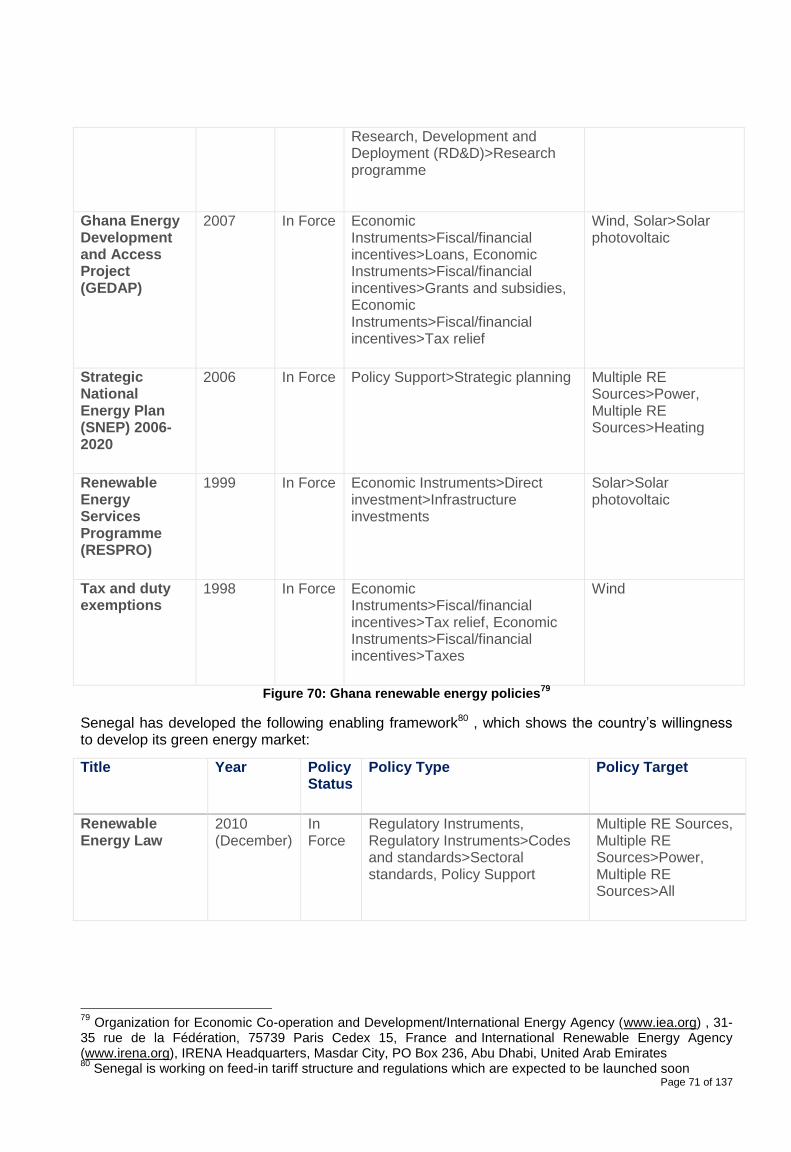
Page 71 of 137
Research, Development and Deployment (RD&D)>Research programme
Ghana Energy Development and Access Project (GEDAP)
2007 In Force Economic Instruments>Fiscal/financial incentives>Loans, Economic Instruments>Fiscal/financial incentives>Grants and subsidies, Economic Instruments>Fiscal/financial incentives>Tax relief
Wind, Solar>Solar photovoltaic
Strategic National Energy Plan (SNEP) 2006-2020
2006 In Force Policy Support>Strategic planning Multiple RE Sources>Power, Multiple RE Sources>Heating
Renewable Energy Services Programme (RESPRO)
1999 In Force Economic Instruments>Direct investment>Infrastructure investments
Solar>Solar photovoltaic
Tax and duty exemptions
1998 In Force Economic Instruments>Fiscal/financial incentives>Tax relief, Economic Instruments>Fiscal/financial incentives>Taxes
Wind
Figure 70: Ghana renewable energy policies79
Senegal has developed the following enabling framework80 , which shows the country’s willingness to develop its green energy market:
Title Year Policy Status
Policy Type Policy Target
Renewable Energy Law
2010 (December)
In Force
Regulatory Instruments, Regulatory Instruments>Codes and standards>Sectoral standards, Policy Support
Multiple RE Sources, Multiple RE Sources>Power, Multiple RE Sources>All
79
Organization for Economic Co-operation and Development/International Energy Agency (www.iea.org) , 31-35 rue de la Fédération, 75739 Paris Cedex 15, France and International Renewable Energy Agency (www.irena.org), IRENA Headquarters, Masdar City, PO Box 236, Abu Dhabi, United Arab Emirates 80
Senegal is working on feed-in tariff structure and regulations which are expected to be launched soon
Page 72 of 137
Senegalese National Biogas Programme Phase I
2009 In Force
Economic Instruments>Direct investment>Infrastructure investments, Economic Instruments>Fiscal/financial incentives>Grants and subsidies, Policy Support>Institutional creation
Bioenergy>Biomass for power, Bioenergy>Biomass for heat
2007-2012 Special Programme for Biofuels
2007 In Force
Economic Instruments>Direct investment>Infrastructure investments, Policy Support>Institutional creation
Bioenergy>Biomass for power, Bioenergy, Bioenergy>Biofuels for transport
Program for the promotion of renewable energies, rural electrification and sustainable supply in domestic fuel (PERACOD)
2004-2015 In Force
Economic Instruments>Fiscal/financial incentives>Grants and subsidies
Solar, Multiple RE Sources, Multiple RE Sources>All
Figure 71: Senegal renewable energy policies81
In Cote d’Ivoire the renewable energy policy82 was adopted in 2013 and is in effect, with the following three objectives:
Increase renewable energy share in the national energy mix from 1% in 2015 to 16% in 2030 Diversify energy production sources from 80 % fossil fuel and 20 % renewables in 2015, to 66 %
fossil fuel and 34 % renewable in 2020
4.3.2. Ultra-distributed generation
“The Ultra Distributed Generation (DG) market scenario represents a market in which generators have invested in distributed renewable generation, with investment decisions based on policy incentives and economic business cases. It is a market with full unbundling and strong customer engagement, both in retail and as micro-generators. Market operation becomes more complex for both transmission and distribution operators, given the increased volume of distributed and renewable generation and the continued operation of large-scale thermal generation, but remains centrally operated and does not fragment. Regulatory oversight and revenue price controls are likely to address the efficiency of system operation and equitable treatment of generation in dispatch and system support. Determining which market participants pay for the central transmission grid becomes a critical regulatory question.”83
It shows that there exists significant potential (Figure 72: Estimates of Renewable Energy Potential in West Africa) to develop renewable projects over and above the present large capacities in West Africa. It is worthwhile to note that there are countries within each renewable energy technology type 81
Organization for Economic Co-operation and Development/International Energy Agency (www.iea.org) , 31-
35 rue de la Fédération, 75739 Paris Cedex 15, France and International Renewable Energy Agency (www.irena.org), IRENA Headquarters, Masdar City, PO Box 236, Abu Dhabi, United Arab Emirates 82
http://www.africabv.com/blog/starting-as-an-independent-power-producer-in-cote-divoire/ 83
PricewaterhouseCoopers (2014) ‘The road ahead - Gaining momentum from energy transformation’, Pwc,
pp. 1–32. Available at: http://www.pwc.com/en_GX/gx/utilities/publications/assets/pwc-the-road-ahead.pdf 83
http://www.nercng.org/index.php/home/operators/renewable-energy
Page 73 of 137
that have the potential for development. When looking at the 4 selected 4 countries – Nigeria offers potential in almost all renewable technologies, Ghana in solar PV and wind, Côte d'Ivoire in mini-hydro, biomass, and wind and Senegal in wind, solar PV and biomass. With these new potential areas identified the prospect for developing ultra-distributed generation capacities seem to be very achievable within a brief period.
Figure 72: Estimates of Renewable Energy Potential in West Africa
84
4.3.3. Local energy systems
“The Local Energy Systems market scenario represents a market in which we see significant fragmentation of the existing transmission and distribution grids and local communities demand greater control over their energy supply or a market in which a local approach is adopted for serving remote communities. The development of local energy systems depends on the local potential of renewable resources that can be used to produce electricity”85 It is well understood that the 4 selected countries have good potential for solar and wind potential: the charts show clearly that Nigeria offers immense potential for both off-grid solar and wind technologies with Senegal following closely.
84
IRENA (2013) ‘Southern African Power Pool: Planning and Prospects for Renewable Energy’, pp. 1–91. Available at: www.irena.http://www.irena.org/documentdownloads/publications/sapp.pdforg. 85
PricewaterhouseCoopers (2014) ‘The road ahead - Gaining momentum from energy transformation’, Pwc, pp. 1–32. Available at: http://www.pwc.com/en_GX/gx/utilities/publications/assets/pwc-the-road-ahead.pdf
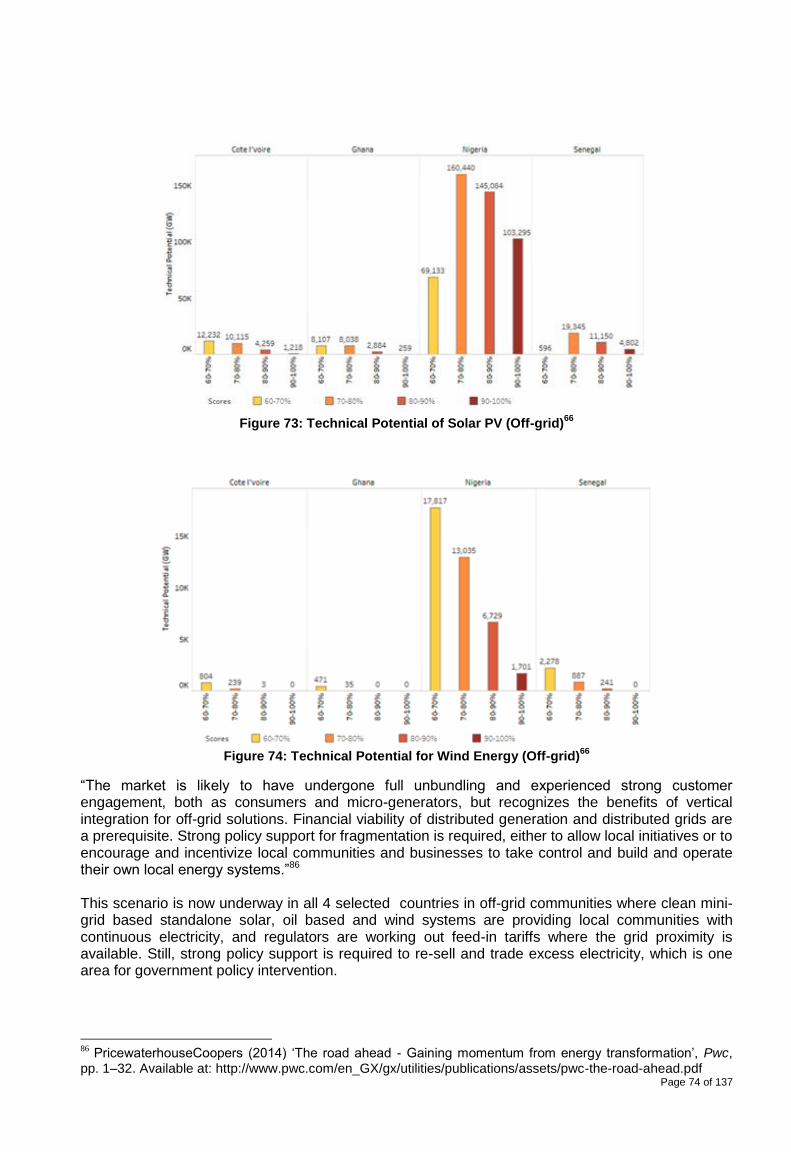
Page 74 of 137
Figure 73: Technical Potential of Solar PV (Off-grid)
66
Figure 74: Technical Potential for Wind Energy (Off-grid)
66
“The market is likely to have undergone full unbundling and experienced strong customer engagement, both as consumers and micro-generators, but recognizes the benefits of vertical integration for off-grid solutions. Financial viability of distributed generation and distributed grids are a prerequisite. Strong policy support for fragmentation is required, either to allow local initiatives or to encourage and incentivize local communities and businesses to take control and build and operate their own local energy systems.”86 This scenario is now underway in all 4 selected countries in off-grid communities where clean mini-grid based standalone solar, oil based and wind systems are providing local communities with continuous electricity, and regulators are working out feed-in tariffs where the grid proximity is available. Still, strong policy support is required to re-sell and trade excess electricity, which is one area for government policy intervention.
86
PricewaterhouseCoopers (2014) ‘The road ahead - Gaining momentum from energy transformation’, Pwc, pp. 1–32. Available at: http://www.pwc.com/en_GX/gx/utilities/publications/assets/pwc-the-road-ahead.pdf
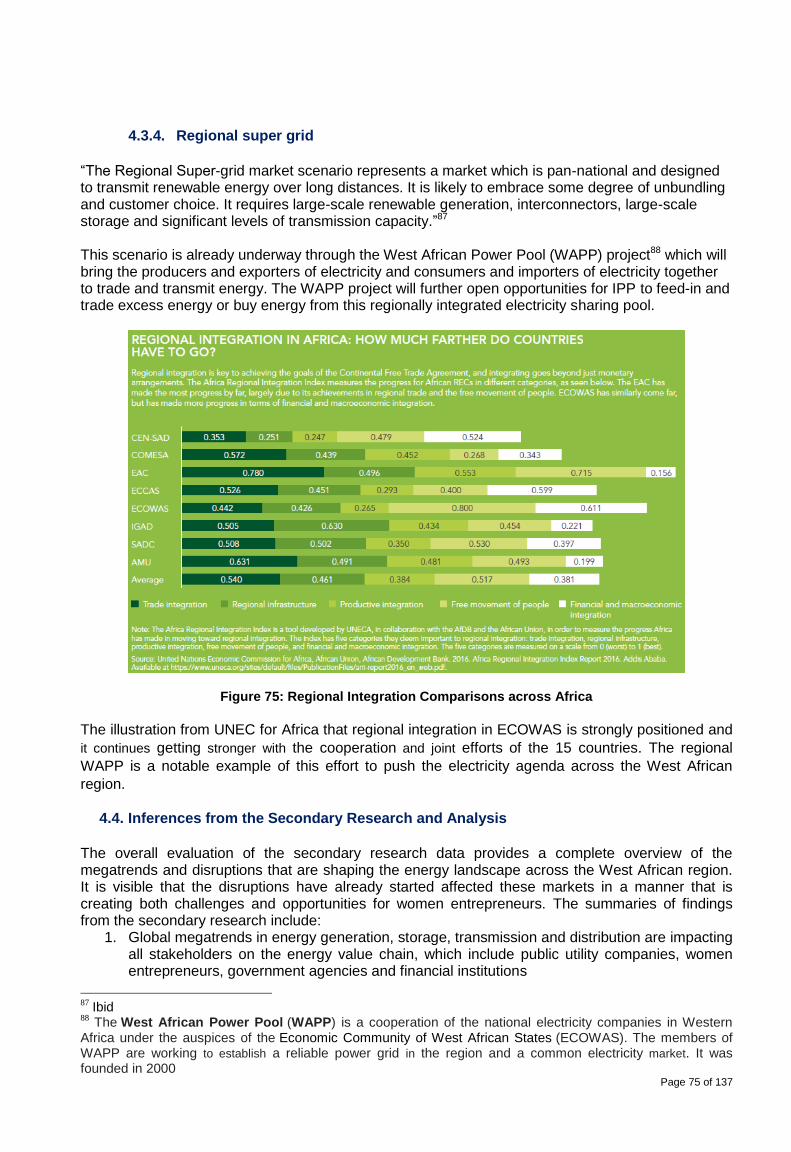
Page 75 of 137
4.3.4. Regional super grid
“The Regional Super-grid market scenario represents a market which is pan-national and designed to transmit renewable energy over long distances. It is likely to embrace some degree of unbundling and customer choice. It requires large-scale renewable generation, interconnectors, large-scale storage and significant levels of transmission capacity.”87 This scenario is already underway through the West African Power Pool (WAPP) project88 which will bring the producers and exporters of electricity and consumers and importers of electricity together to trade and transmit energy. The WAPP project will further open opportunities for IPP to feed-in and trade excess energy or buy energy from this regionally integrated electricity sharing pool.
Figure 75: Regional Integration Comparisons across Africa
The illustration from UNEC for Africa that regional integration in ECOWAS is strongly positioned and
it continues getting stronger with the cooperation and joint efforts of the 15 countries. The regional
WAPP is a notable example of this effort to push the electricity agenda across the West African
region.
4.4. Inferences from the Secondary Research and Analysis
The overall evaluation of the secondary research data provides a complete overview of the megatrends and disruptions that are shaping the energy landscape across the West African region. It is visible that the disruptions have already started affected these markets in a manner that is creating both challenges and opportunities for women entrepreneurs. The summaries of findings from the secondary research include:
1. Global megatrends in energy generation, storage, transmission and distribution are impacting all stakeholders on the energy value chain, which include public utility companies, women entrepreneurs, government agencies and financial institutions
87
Ibid 88
The West African Power Pool (WAPP) is a cooperation of the national electricity companies in Western Africa under the auspices of the Economic Community of West African States (ECOWAS). The members of WAPP are working to establish a reliable power grid in the region and a common electricity market. It was founded in 2000
Page 76 of 137
2. The disruptions are happening across the energy supply chain i.e. upstream, midstream and downstream, affecting how energy is produced and consumed.
3. Low rural electrification rates in countries like Cote d’Ivoire and Senegal offer high potential for off-grid electricity generation, distribution, and consumption.
4. Nigeria and Ghana are leading the way in sales of high-scalability products for decentralization while Senegal leads on the chart in sales of low-scalability products for decentralization.
5. For off-grid technologies that are being used across the 4 selected countries, Senegal leads the group. We see that big wins for off-grid solutions has happened in solar-based generation systems followed by oil-based generation systems (in kWp- kilowattpeak) resulting in development of hybrid systems.
6. Senegal and Cote d’Ivoire are gradually moving towards ‘innovation achiever’ levels within Sub-Saharan Africa and leading the West African region.
7. Globally there has been a significant investment growth in solar, wind and biomass areas and these will continue to be areas of opportunity within the West Africa energy innovation landscape.
8. Technologies that will make the bulk of future energy generation will include solar, wind and bio-energy based technologies, hence these will see the fastest commoditization, regulatory compliance, consumer diffusion and commercial funding.
9. The CO2 emission profile demonstrated that all the 4 selected countries contributed a small portion of global CO2 emissions, but compared with each other Nigeria produces the highest proportion of the regional emissions
10. Demographics are drivers of present and future demand for electricity, and we see that Nigeria’s population is 72% of the total population of the 4 countries selected.
11. Nigeria has the largest economy, constituting almost 80% of the total GDP of the 4 selected countries while Ghana is the fastest growing economy followed by Cote d’Ivoire.
12. Nigeria and Ghana offered the lowest domestic credit at 15.6% of GDP which is way below the average for sub-Saharan Africa at 45.6% of GDP
13. Ghana and Nigeria offer a better route to equity-based funding than in the other two of the 4 selected countries
14. We see that globally: a. The major chunk of funding for grid infrastructure, hybrid renewable and solar comes
from public institutions while for hydro and on-shore wind is through private sources b. Within public sources, i.e. public financial institutions – multi-laterals continue to
increase their share along with government sources, and these are also likely sources for women entrepreneurs on the energy value chain
c. Knowledge Tie-ups with project developers in developed markets could offer women entrepreneurs the opportunity to establish as well as finance their projects
d. The lowest sources of financing in renewable energy projects comes from venture capital and private equity funds
15. The rate of population growth and urbanization means that universal electricity access and waste accumulation will be some of the biggest challenges in urban planning for cities of the future, and this will open opportunities for technologies that can convert waste to electricity.
16. Individual consumers in the 4 selected countries are moving from passive ratepayer (the basic level at which most consumers get the first electricity connection) to frugal goal seeker, where the energy consumer is willing to take modest action, but how much they do is constrained by their income
17. Products that are commoditized have a lower profit margin, larger scale and imitate consumer durable type supply chains. These include solar lighting products (e.g., pico-products, lanterns, chargers, etc.), storage batteries and solar SHS generators
18. High-scalability products are products that face high competition (high threat of substitution, new entrants, less bargaining power of suppliers and buyers and high industry rivalry).
19. Products that belong to other non-conventional energy sources like wind and hydro face less competition because they have high entry barriers` due to technical, regulatory and financial complexities (low threat of substitutes, new entrants, more bargaining power of suppliers and less industry rivalry).
Page 77 of 137
20. Biomass is another source of energy where the competition is high at feedstock level (which is an agricultural raw material and commoditized). Due to proximity to several agricultural suppliers the competition is high and margins low but as we move to biogas or waste to electricity plants the competition reduces, and margins increase.
21. LCOE for new renewable technologies is gradually decreasing which is attracting more competition (Hydro<Onshore Wind<Geothermal<Solar & Biomass)
22. A convergence is happening between information technology and operations technology. Nigeria has taken the lead among the 4 selected countries by being able to generate and provide information related to consumer electricity offtake and usage.
23. The 4 selected countries show that their utility industry model is moving from the traditional passive persistence to operations transformation.
24. Distribution channels are evolving from physical to digital, but there is still the conventional distribution channel where a physical product or equipment passes through transportation and logistics before finally being sold to the consumer.
25. The front-end demand management model is becoming more virtual, and smart services are being developed to bridge the gap between energy generation, payment, and energy consumption.
26. There are several tools by which governments can collaborate with financial institutions to facilitate financing of renewable energy projects, some of which are now being used in all the 4 selected countries, these include Financial policies and regulations, guarantees, hybrid structures for project funding, green bonds, etc.
27. The green command and control market model is already in existence in the selected countries with predominance in Nigeria and Ghana where demand-side management technologies and mini-grids have entered the market. Similarly, in Senegal and Cote d’Ivoire mini-grids are increasingly being installed, resulting in development of a private-sector led electricity generation and distribution market.
28. It is worth mentioning that there are countries, within each renewable energy technology type, that have the potential for development into ultra-distributed system – especially for off-grid.
29. Nigeria has potential in all renewable technologies, Ghana in solar PV and wind, Cote d’Ivoire in mini-hydro, biomass, and wind and Senegal in the wind, solar PV and biomass.
30. The Local Energy Systems market model is also present to some extent – i.e. which is a situation where there is significant fragmentation of the existing transmission and distribution grids and local communities demand greater control over their energy supply or a market in which a local approach is adopted for serving remote communities.
31. We are seeing off-grid communities where clean mini-grid based standalone solar or oil based as well as wind systems are providing local communities with control over their energy generation.
32. We observe a growing regional Super-grid market model via WAPP. This is a market which is pan-regional and designed to transmit renewable energy over long distances. It is likely to embrace some degree of unbundling and customer choice. It needs large-scale renewable generation, interconnectors, large-scale storage and significant levels of transmission capacity.
5. Primary Research and Analysis
This assignment is part of a project which seeks to ensure that the region meets its goal of universal energy access for over 300 million people, by developing a high quality, gender responsive, regional energy market development strategy that taps into the innate entrepreneurial capacity of ECOWAS women. Harnessing this capacity to increase the establishment of energy businesses and deployment of energy technologies to meet the energy needs of the region’s largely unserved population. The Project on Feasibility Study on Business Opportunities for Women in a Changing Energy Value Chain in West Africa is a product of the ECOWAS Policy for Gender Mainstreaming in Energy Access which aims, among other things, to increase women participation in energy-related fields in the private sector by 25% by 2020 and 50% by 2030.
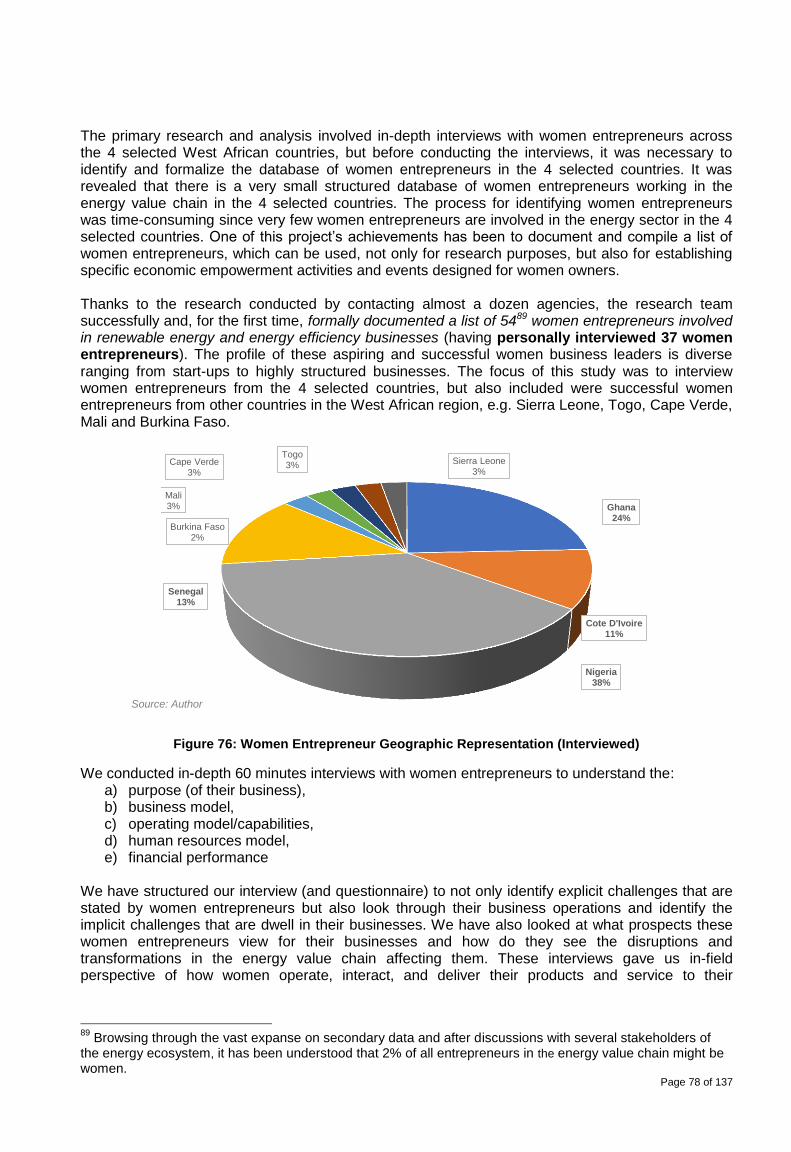
Page 78 of 137
The primary research and analysis involved in-depth interviews with women entrepreneurs across the 4 selected West African countries, but before conducting the interviews, it was necessary to identify and formalize the database of women entrepreneurs in the 4 selected countries. It was revealed that there is a very small structured database of women entrepreneurs working in the energy value chain in the 4 selected countries. The process for identifying women entrepreneurs was time-consuming since very few women entrepreneurs are involved in the energy sector in the 4 selected countries. One of this project’s achievements has been to document and compile a list of women entrepreneurs, which can be used, not only for research purposes, but also for establishing specific economic empowerment activities and events designed for women owners. Thanks to the research conducted by contacting almost a dozen agencies, the research team successfully and, for the first time, formally documented a list of 5489 women entrepreneurs involved in renewable energy and energy efficiency businesses (having personally interviewed 37 women entrepreneurs). The profile of these aspiring and successful women business leaders is diverse ranging from start-ups to highly structured businesses. The focus of this study was to interview women entrepreneurs from the 4 selected countries, but also included were successful women entrepreneurs from other countries in the West African region, e.g. Sierra Leone, Togo, Cape Verde, Mali and Burkina Faso.
Figure 76: Women Entrepreneur Geographic Representation (Interviewed)
We conducted in-depth 60 minutes interviews with women entrepreneurs to understand the: a) purpose (of their business), b) business model, c) operating model/capabilities, d) human resources model, e) financial performance
We have structured our interview (and questionnaire) to not only identify explicit challenges that are stated by women entrepreneurs but also look through their business operations and identify the implicit challenges that are dwell in their businesses. We have also looked at what prospects these women entrepreneurs view for their businesses and how do they see the disruptions and transformations in the energy value chain affecting them. These interviews gave us in-field perspective of how women operate, interact, and deliver their products and service to their
89
Browsing through the vast expanse on secondary data and after discussions with several stakeholders of the energy ecosystem, it has been understood that 2% of all entrepreneurs in the energy value chain might be women.
Ghana 24%
Cote D'Ivoire 11%
Nigeria 38%
Senegal 13%
Burkina Faso 2%
Mali 3%
Cape Verde 3%
Togo 3% Sierra Leone
3%
Source: Author
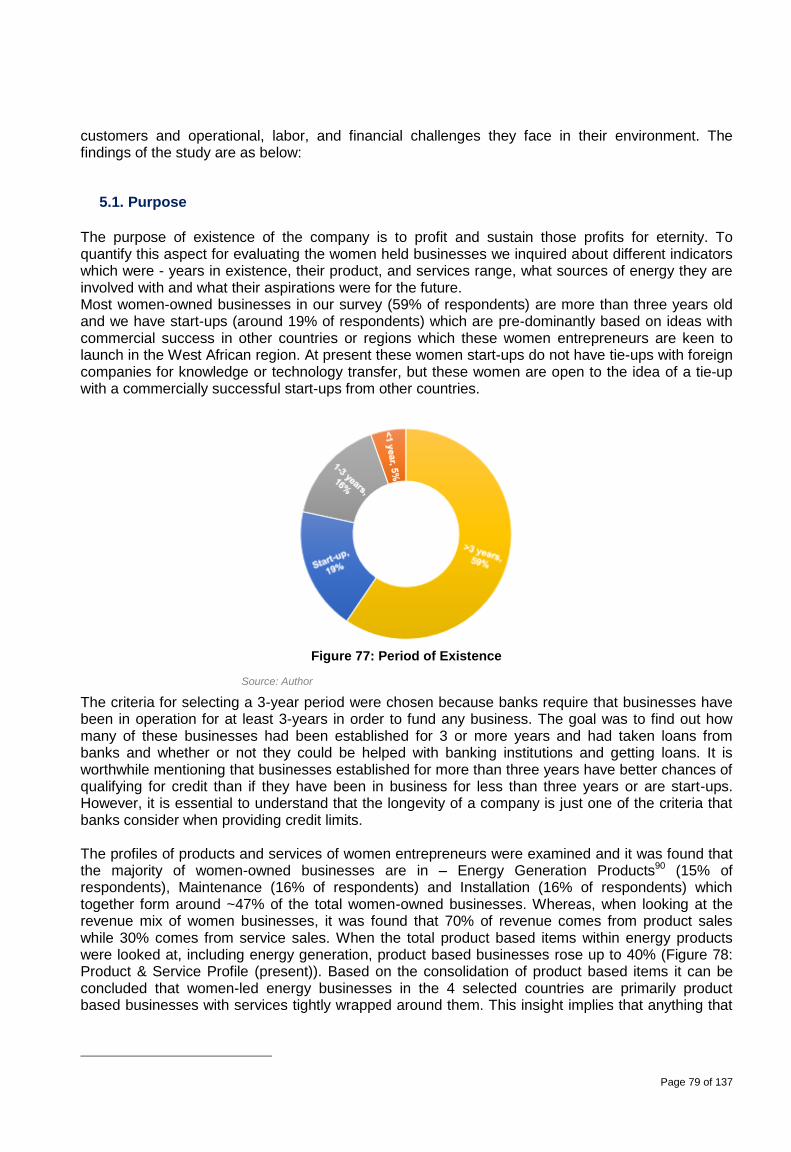
Page 79 of 137
customers and operational, labor, and financial challenges they face in their environment. The findings of the study are as below:
5.1. Purpose
The purpose of existence of the company is to profit and sustain those profits for eternity. To quantify this aspect for evaluating the women held businesses we inquired about different indicators which were - years in existence, their product, and services range, what sources of energy they are involved with and what their aspirations were for the future. Most women-owned businesses in our survey (59% of respondents) are more than three years old and we have start-ups (around 19% of respondents) which are pre-dominantly based on ideas with commercial success in other countries or regions which these women entrepreneurs are keen to launch in the West African region. At present these women start-ups do not have tie-ups with foreign companies for knowledge or technology transfer, but these women are open to the idea of a tie-up with a commercially successful start-ups from other countries.
Figure 77: Period of Existence
The criteria for selecting a 3-year period were chosen because banks require that businesses have been in operation for at least 3-years in order to fund any business. The goal was to find out how many of these businesses had been established for 3 or more years and had taken loans from banks and whether or not they could be helped with banking institutions and getting loans. It is worthwhile mentioning that businesses established for more than three years have better chances of qualifying for credit than if they have been in business for less than three years or are start-ups. However, it is essential to understand that the longevity of a company is just one of the criteria that banks consider when providing credit limits. The profiles of products and services of women entrepreneurs were examined and it was found that the majority of women-owned businesses are in – Energy Generation Products90 (15% of respondents), Maintenance (16% of respondents) and Installation (16% of respondents) which together form around ~47% of the total women-owned businesses. Whereas, when looking at the revenue mix of women businesses, it was found that 70% of revenue comes from product sales while 30% comes from service sales. When the total product based items within energy products were looked at, including energy generation, product based businesses rose up to 40% (Figure 78: Product & Service Profile (present)). Based on the consolidation of product based items it can be concluded that women-led energy businesses in the 4 selected countries are primarily product based businesses with services tightly wrapped around them. This insight implies that anything that
Source: Author
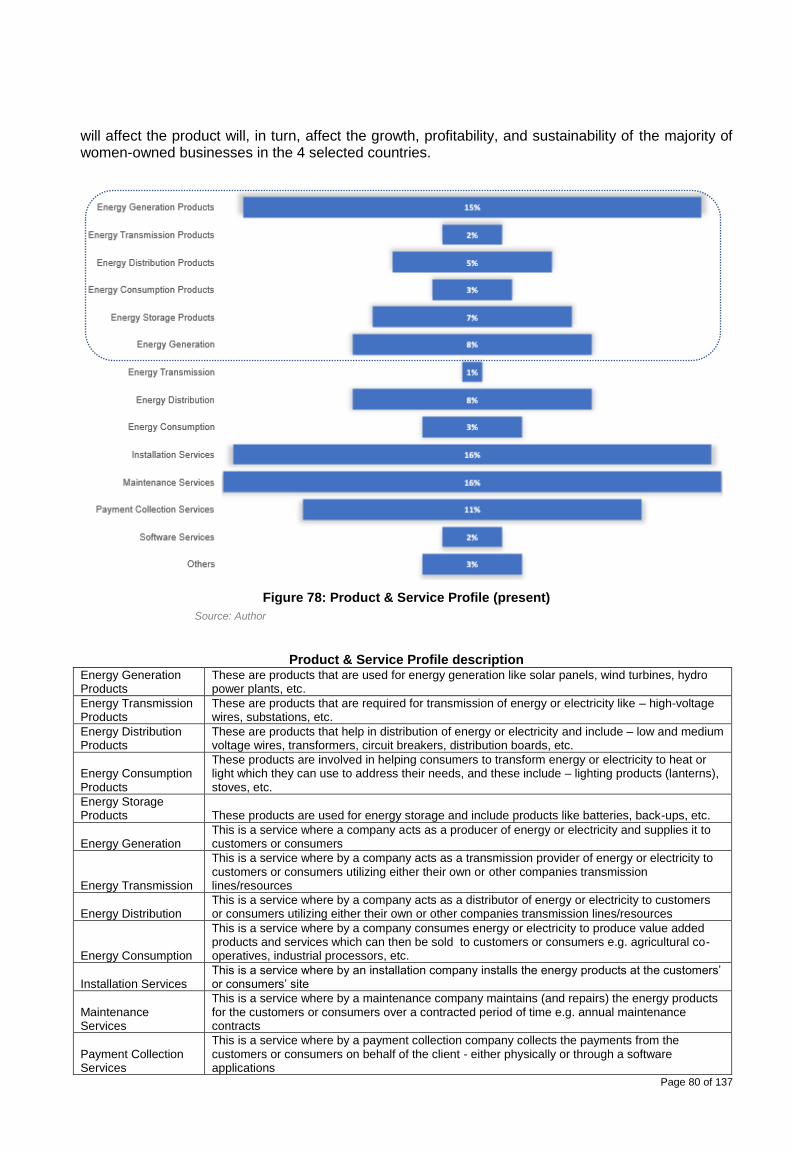
Page 80 of 137
will affect the product will, in turn, affect the growth, profitability, and sustainability of the majority of women-owned businesses in the 4 selected countries.
Figure 78: Product & Service Profile (present)
Product & Service Profile description Energy Generation Products
These are products that are used for energy generation like solar panels, wind turbines, hydro power plants, etc.
Energy Transmission Products
These are products that are required for transmission of energy or electricity like – high-voltage wires, substations, etc.
Energy Distribution Products
These are products that help in distribution of energy or electricity and include – low and medium voltage wires, transformers, circuit breakers, distribution boards, etc.
Energy Consumption Products
These products are involved in helping consumers to transform energy or electricity to heat or light which they can use to address their needs, and these include – lighting products (lanterns), stoves, etc.
Energy Storage Products These products are used for energy storage and include products like batteries, back-ups, etc.
Energy Generation This is a service where a company acts as a producer of energy or electricity and supplies it to customers or consumers
Energy Transmission
This is a service where by a company acts as a transmission provider of energy or electricity to customers or consumers utilizing either their own or other companies transmission lines/resources
Energy Distribution This is a service where by a company acts as a distributor of energy or electricity to customers or consumers utilizing either their own or other companies transmission lines/resources
Energy Consumption
This is a service where by a company consumes energy or electricity to produce value added products and services which can then be sold to customers or consumers e.g. agricultural co-operatives, industrial processors, etc.
Installation Services This is a service where by an installation company installs the energy products at the customers’ or consumers’ site
Maintenance Services
This is a service where by a maintenance company maintains (and repairs) the energy products for the customers or consumers over a contracted period of time e.g. annual maintenance contracts
Payment Collection Services
This is a service where by a payment collection company collects the payments from the customers or consumers on behalf of the client - either physically or through a software applications
Source: Author
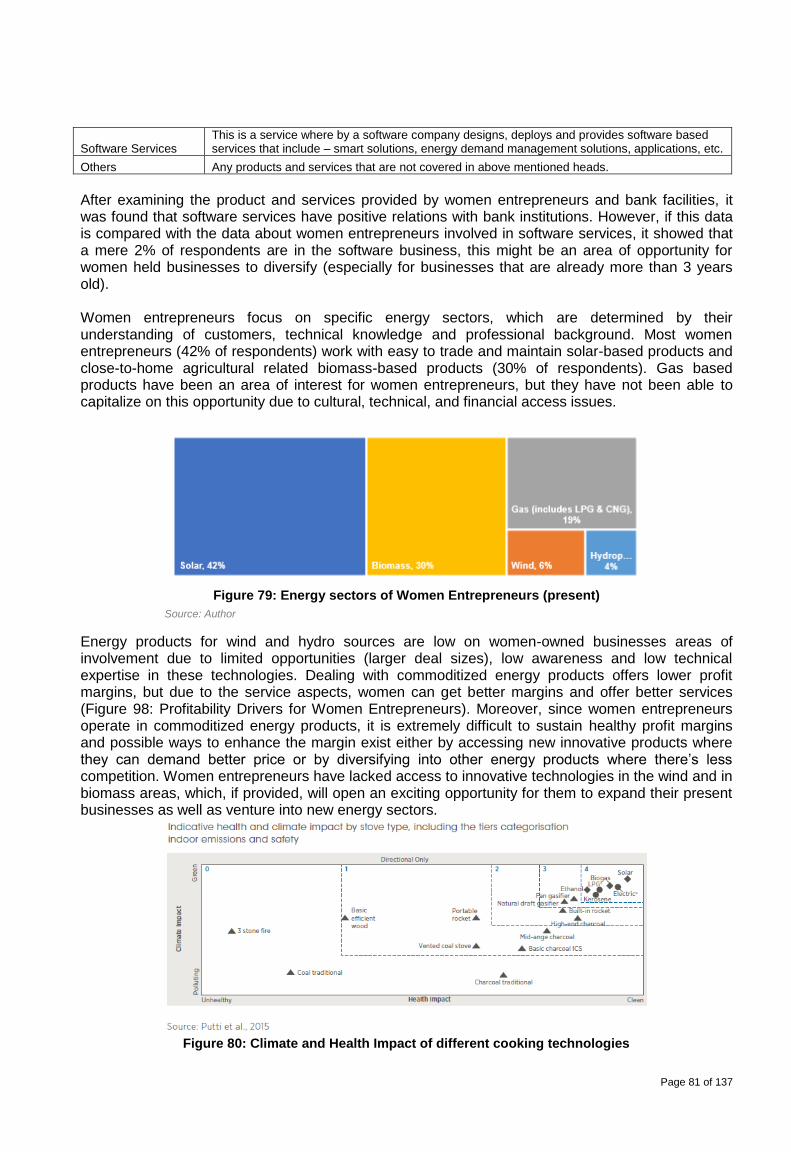
Page 81 of 137
Software Services This is a service where by a software company designs, deploys and provides software based services that include – smart solutions, energy demand management solutions, applications, etc.
Others Any products and services that are not covered in above mentioned heads.
After examining the product and services provided by women entrepreneurs and bank facilities, it was found that software services have positive relations with bank institutions. However, if this data is compared with the data about women entrepreneurs involved in software services, it showed that a mere 2% of respondents are in the software business, this might be an area of opportunity for women held businesses to diversify (especially for businesses that are already more than 3 years old). Women entrepreneurs focus on specific energy sectors, which are determined by their understanding of customers, technical knowledge and professional background. Most women entrepreneurs (42% of respondents) work with easy to trade and maintain solar-based products and close-to-home agricultural related biomass-based products (30% of respondents). Gas based products have been an area of interest for women entrepreneurs, but they have not been able to capitalize on this opportunity due to cultural, technical, and financial access issues.
Figure 79: Energy sectors of Women Entrepreneurs (present)
Energy products for wind and hydro sources are low on women-owned businesses areas of involvement due to limited opportunities (larger deal sizes), low awareness and low technical expertise in these technologies. Dealing with commoditized energy products offers lower profit margins, but due to the service aspects, women can get better margins and offer better services (Figure 98: Profitability Drivers for Women Entrepreneurs). Moreover, since women entrepreneurs operate in commoditized energy products, it is extremely difficult to sustain healthy profit margins and possible ways to enhance the margin exist either by accessing new innovative products where they can demand better price or by diversifying into other energy products where there’s less competition. Women entrepreneurs have lacked access to innovative technologies in the wind and in biomass areas, which, if provided, will open an exciting opportunity for them to expand their present businesses as well as venture into new energy sectors.
Figure 80: Climate and Health Impact of different cooking technologies
Source: Author
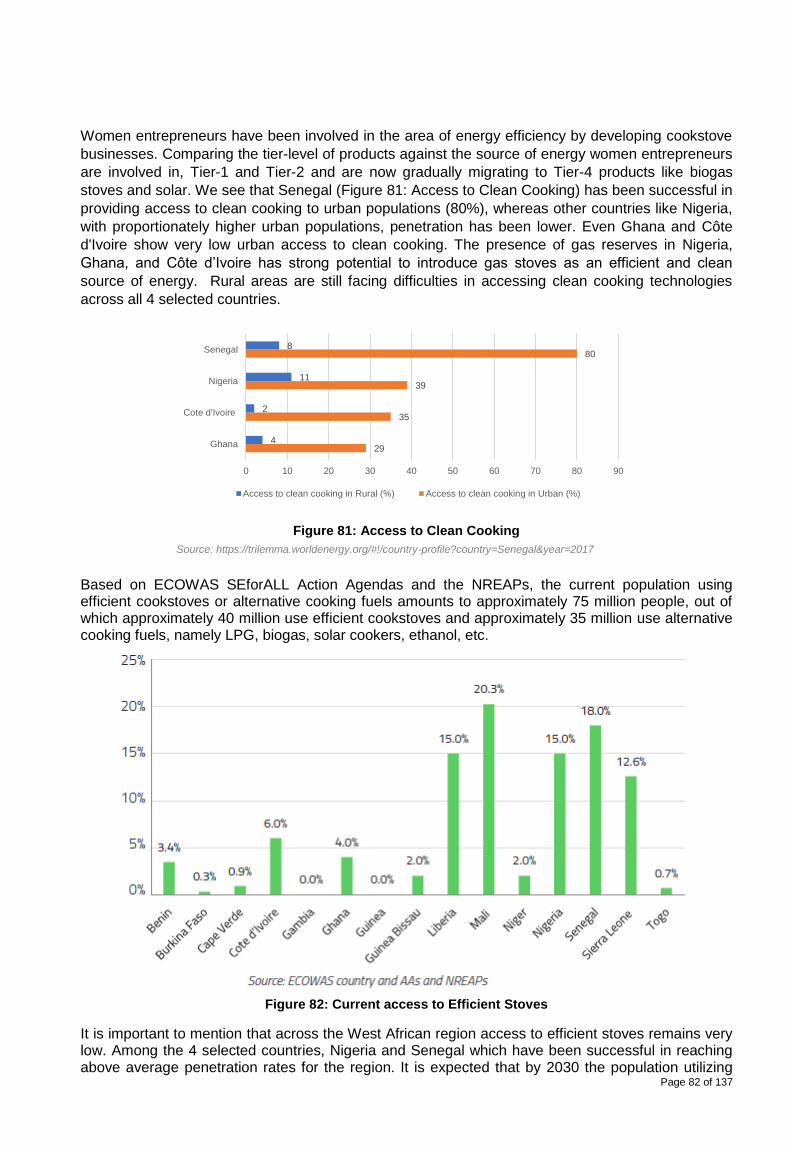
Page 82 of 137
Women entrepreneurs have been involved in the area of energy efficiency by developing cookstove
businesses. Comparing the tier-level of products against the source of energy women entrepreneurs
are involved in, Tier-1 and Tier-2 and are now gradually migrating to Tier-4 products like biogas
stoves and solar. We see that Senegal (Figure 81: Access to Clean Cooking) has been successful in
providing access to clean cooking to urban populations (80%), whereas other countries like Nigeria,
with proportionately higher urban populations, penetration has been lower. Even Ghana and Côte
d'Ivoire show very low urban access to clean cooking. The presence of gas reserves in Nigeria,
Ghana, and Côte d’Ivoire has strong potential to introduce gas stoves as an efficient and clean
source of energy. Rural areas are still facing difficulties in accessing clean cooking technologies
across all 4 selected countries.
Figure 81: Access to Clean Cooking
Based on ECOWAS SEforALL Action Agendas and the NREAPs, the current population using efficient cookstoves or alternative cooking fuels amounts to approximately 75 million people, out of which approximately 40 million use efficient cookstoves and approximately 35 million use alternative cooking fuels, namely LPG, biogas, solar cookers, ethanol, etc.
Figure 82: Current access to Efficient Stoves
It is important to mention that across the West African region access to efficient stoves remains very low. Among the 4 selected countries, Nigeria and Senegal which have been successful in reaching above average penetration rates for the region. It is expected that by 2030 the population utilizing
29
35
39
80
4
2
11
8
0 10 20 30 40 50 60 70 80 90
Ghana
Cote d'Ivoire
Nigeria
Senegal
Access to clean cooking in Rural (%) Access to clean cooking in Urban (%)
Source: https://trilemma.worldenergy.org/#!/country-profile?country=Senegal&year=2017
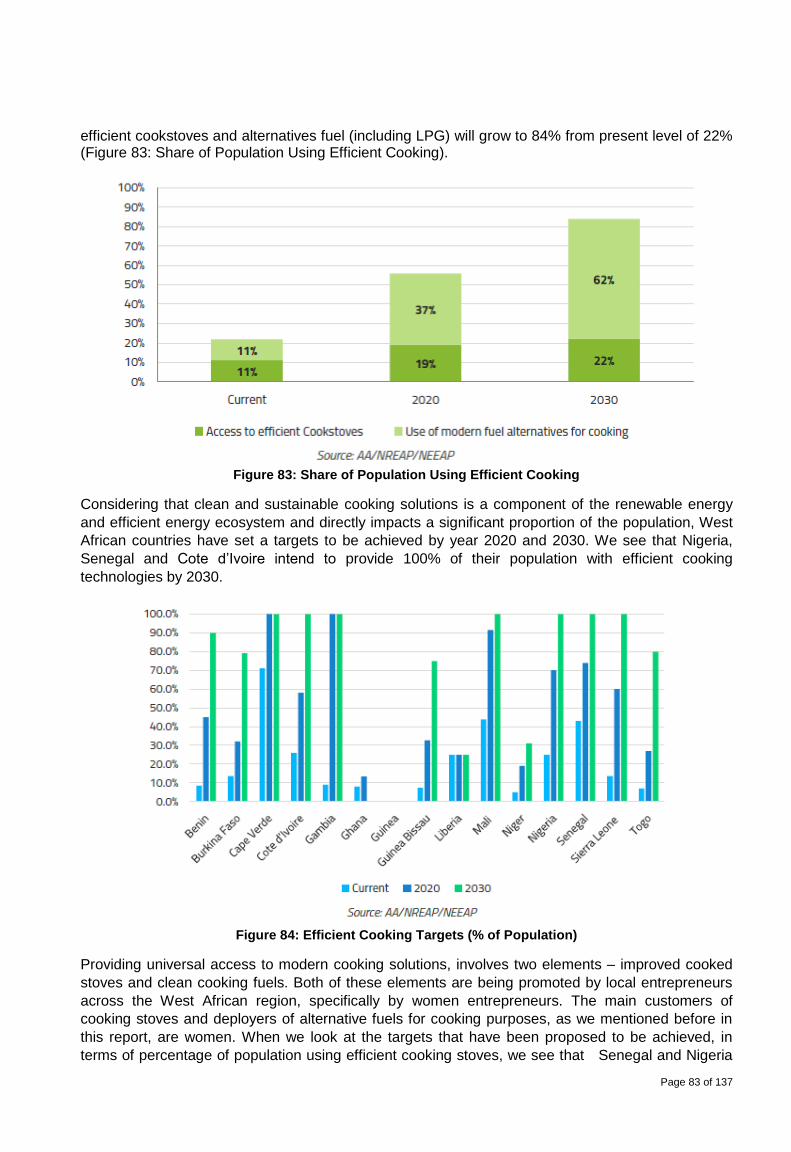
Page 83 of 137
efficient cookstoves and alternatives fuel (including LPG) will grow to 84% from present level of 22% (Figure 83: Share of Population Using Efficient Cooking).
Figure 83: Share of Population Using Efficient Cooking
Considering that clean and sustainable cooking solutions is a component of the renewable energy
and efficient energy ecosystem and directly impacts a significant proportion of the population, West
African countries have set a targets to be achieved by year 2020 and 2030. We see that Nigeria,
Senegal and Cote d’Ivoire intend to provide 100% of their population with efficient cooking
technologies by 2030.
Figure 84: Efficient Cooking Targets (% of Population)
Providing universal access to modern cooking solutions, involves two elements – improved cooked
stoves and clean cooking fuels. Both of these elements are being promoted by local entrepreneurs
across the West African region, specifically by women entrepreneurs. The main customers of
cooking stoves and deployers of alternative fuels for cooking purposes, as we mentioned before in
this report, are women. When we look at the targets that have been proposed to be achieved, in
terms of percentage of population using efficient cooking stoves, we see that Senegal and Nigeria
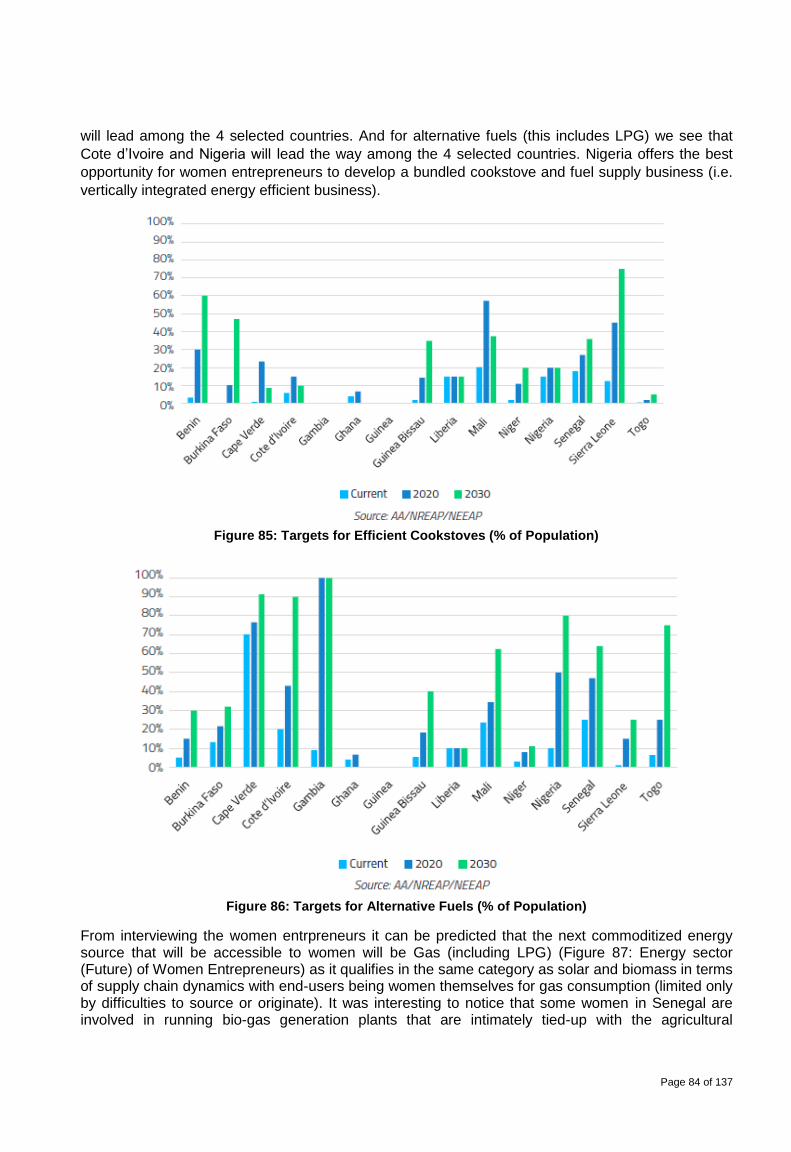
Page 84 of 137
will lead among the 4 selected countries. And for alternative fuels (this includes LPG) we see that
Cote d’Ivoire and Nigeria will lead the way among the 4 selected countries. Nigeria offers the best
opportunity for women entrepreneurs to develop a bundled cookstove and fuel supply business (i.e.
vertically integrated energy efficient business).
Figure 85: Targets for Efficient Cookstoves (% of Population)
Figure 86: Targets for Alternative Fuels (% of Population)
From interviewing the women entrpreneurs it can be predicted that the next commoditized energy source that will be accessible to women will be Gas (including LPG) (Figure 87: Energy sector (Future) of Women Entrepreneurs) as it qualifies in the same category as solar and biomass in terms of supply chain dynamics with end-users being women themselves for gas consumption (limited only by difficulties to source or originate). It was interesting to notice that some women in Senegal are involved in running bio-gas generation plants that are intimately tied-up with the agricultural
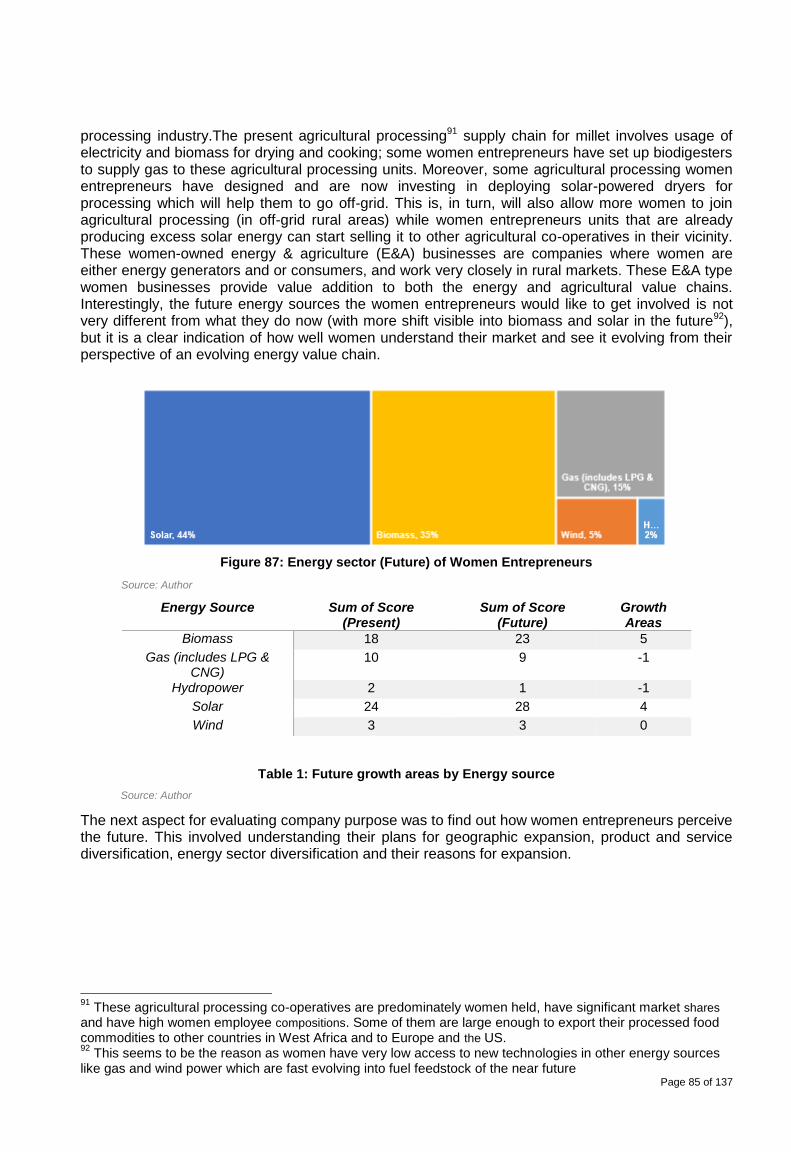
Page 85 of 137
processing industry.The present agricultural processing91 supply chain for millet involves usage of electricity and biomass for drying and cooking; some women entrepreneurs have set up biodigesters to supply gas to these agricultural processing units. Moreover, some agricultural processing women entrepreneurs have designed and are now investing in deploying solar-powered dryers for processing which will help them to go off-grid. This is, in turn, will also allow more women to join agricultural processing (in off-grid rural areas) while women entrepreneurs units that are already producing excess solar energy can start selling it to other agricultural co-operatives in their vicinity. These women-owned energy & agriculture (E&A) businesses are companies where women are either energy generators and or consumers, and work very closely in rural markets. These E&A type women businesses provide value addition to both the energy and agricultural value chains. Interestingly, the future energy sources the women entrepreneurs would like to get involved is not very different from what they do now (with more shift visible into biomass and solar in the future92), but it is a clear indication of how well women understand their market and see it evolving from their perspective of an evolving energy value chain.
Figure 87: Energy sector (Future) of Women Entrepreneurs
Energy Source Sum of Score
(Present) Sum of Score
(Future) Growth Areas
Biomass 18 23 5
Gas (includes LPG & CNG)
10 9 -1
Hydropower 2 1 -1
Solar 24 28 4
Wind 3 3 0
Table 1: Future growth areas by Energy source
The next aspect for evaluating company purpose was to find out how women entrepreneurs perceive the future. This involved understanding their plans for geographic expansion, product and service diversification, energy sector diversification and their reasons for expansion.
91
These agricultural processing co-operatives are predominately women held, have significant market shares and have high women employee compositions. Some of them are large enough to export their processed food commodities to other countries in West Africa and to Europe and the US. 92
This seems to be the reason as women have very low access to new technologies in other energy sources like gas and wind power which are fast evolving into fuel feedstock of the near future
Source: Author
Source: Author
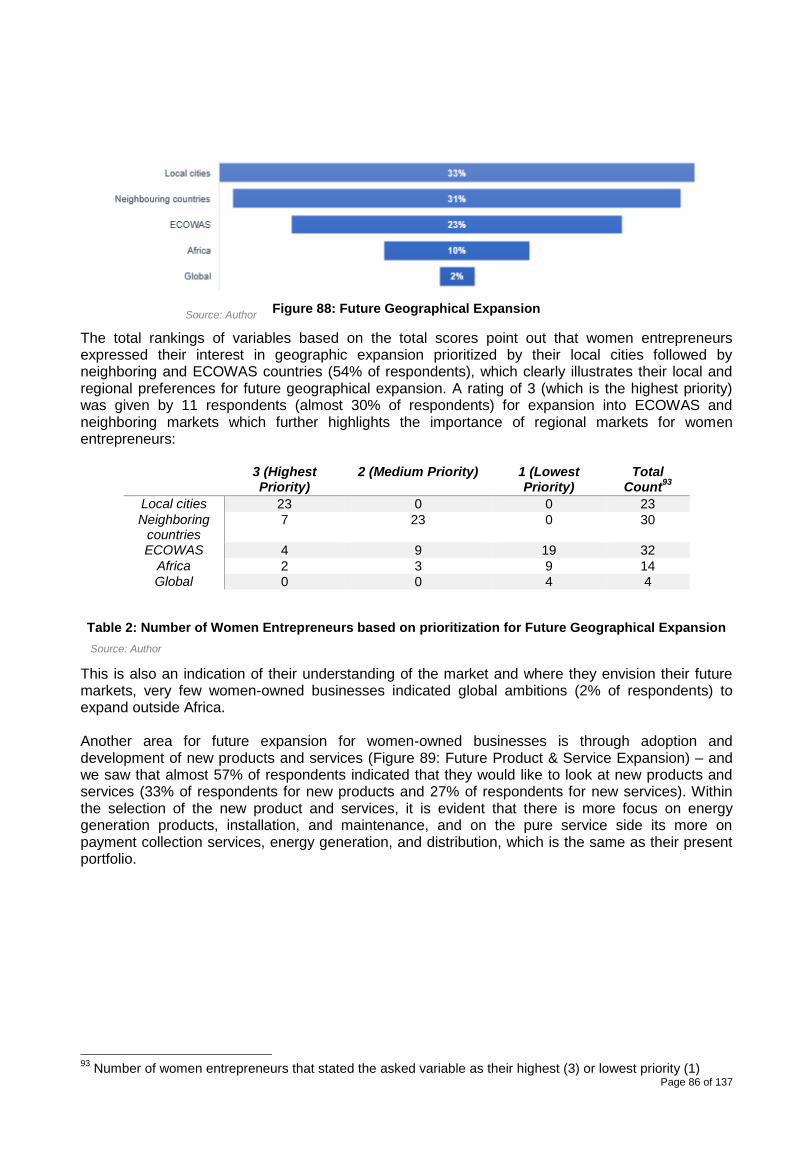
Page 86 of 137
Figure 88: Future Geographical Expansion
The total rankings of variables based on the total scores point out that women entrepreneurs expressed their interest in geographic expansion prioritized by their local cities followed by neighboring and ECOWAS countries (54% of respondents), which clearly illustrates their local and regional preferences for future geographical expansion. A rating of 3 (which is the highest priority) was given by 11 respondents (almost 30% of respondents) for expansion into ECOWAS and neighboring markets which further highlights the importance of regional markets for women entrepreneurs:
3 (Highest
Priority) 2 (Medium Priority) 1 (Lowest
Priority) Total
Count93
Local cities 23 0 0 23
Neighboring countries
7 23 0 30
ECOWAS 4 9 19 32
Africa 2 3 9 14 Global 0 0 4 4
Table 2: Number of Women Entrepreneurs based on prioritization for Future Geographical Expansion
This is also an indication of their understanding of the market and where they envision their future markets, very few women-owned businesses indicated global ambitions (2% of respondents) to expand outside Africa. Another area for future expansion for women-owned businesses is through adoption and development of new products and services (Figure 89: Future Product & Service Expansion) – and we saw that almost 57% of respondents indicated that they would like to look at new products and services (33% of respondents for new products and 27% of respondents for new services). Within the selection of the new product and services, it is evident that there is more focus on energy generation products, installation, and maintenance, and on the pure service side its more on payment collection services, energy generation, and distribution, which is the same as their present portfolio.
93
Number of women entrepreneurs that stated the asked variable as their highest (3) or lowest priority (1)
Source: Author
Source: Author
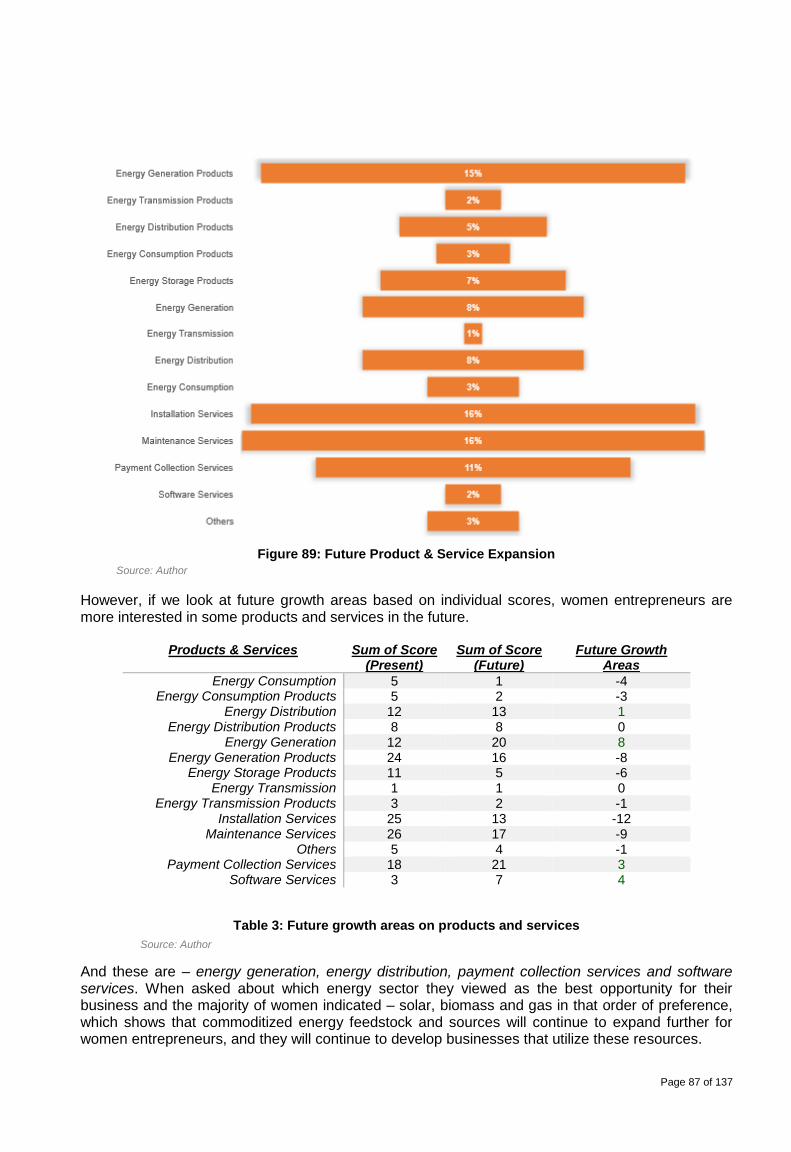
Page 87 of 137
Figure 89: Future Product & Service Expansion
However, if we look at future growth areas based on individual scores, women entrepreneurs are more interested in some products and services in the future.
Products & Services Sum of Score (Present)
Sum of Score (Future)
Future Growth Areas
Energy Consumption 5 1 -4 Energy Consumption Products 5 2 -3
Energy Distribution 12 13 1 Energy Distribution Products 8 8 0
Energy Generation 12 20 8 Energy Generation Products 24 16 -8
Energy Storage Products 11 5 -6 Energy Transmission 1 1 0
Energy Transmission Products 3 2 -1 Installation Services 25 13 -12
Maintenance Services 26 17 -9 Others 5 4 -1
Payment Collection Services 18 21 3 Software Services 3 7 4
Table 3: Future growth areas on products and services
And these are – energy generation, energy distribution, payment collection services and software services. When asked about which energy sector they viewed as the best opportunity for their business and the majority of women indicated – solar, biomass and gas in that order of preference, which shows that commoditized energy feedstock and sources will continue to expand further for women entrepreneurs, and they will continue to develop businesses that utilize these resources.
Source: Author
Source: Author
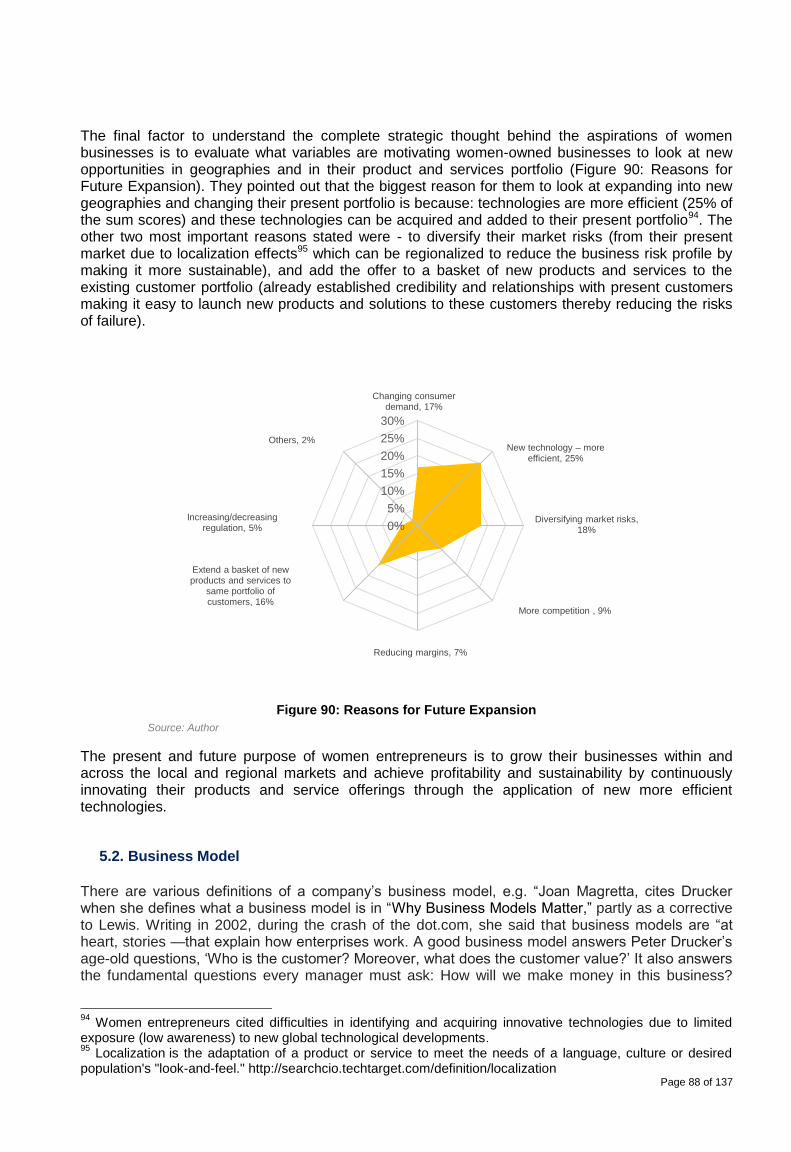
Page 88 of 137
The final factor to understand the complete strategic thought behind the aspirations of women businesses is to evaluate what variables are motivating women-owned businesses to look at new opportunities in geographies and in their product and services portfolio (Figure 90: Reasons for Future Expansion). They pointed out that the biggest reason for them to look at expanding into new geographies and changing their present portfolio is because: technologies are more efficient (25% of the sum scores) and these technologies can be acquired and added to their present portfolio94. The other two most important reasons stated were - to diversify their market risks (from their present market due to localization effects95 which can be regionalized to reduce the business risk profile by making it more sustainable), and add the offer to a basket of new products and services to the existing customer portfolio (already established credibility and relationships with present customers making it easy to launch new products and solutions to these customers thereby reducing the risks of failure).
Figure 90: Reasons for Future Expansion
The present and future purpose of women entrepreneurs is to grow their businesses within and across the local and regional markets and achieve profitability and sustainability by continuously innovating their products and service offerings through the application of new more efficient technologies.
5.2. Business Model
There are various definitions of a company’s business model, e.g. “Joan Magretta, cites Drucker when she defines what a business model is in “Why Business Models Matter,” partly as a corrective to Lewis. Writing in 2002, during the crash of the dot.com, she said that business models are “at heart, stories —that explain how enterprises work. A good business model answers Peter Drucker’s age-old questions, ‘Who is the customer? Moreover, what does the customer value?’ It also answers the fundamental questions every manager must ask: How will we make money in this business?
94
Women entrepreneurs cited difficulties in identifying and acquiring innovative technologies due to limited exposure (low awareness) to new global technological developments. 95
Localization is the adaptation of a product or service to meet the needs of a language, culture or desired population's "look-and-feel." http://searchcio.techtarget.com/definition/localization
Changing consumer demand, 17%
New technology – more efficient, 25%
Diversifying market risks, 18%
More competition , 9%
Reducing margins, 7%
Extend a basket of new products and services to
same portfolio of customers, 16%
Increasing/decreasing regulation, 5%
Others, 2%
0%
5%
10%
15%
20%
25%
30%
Source: Author
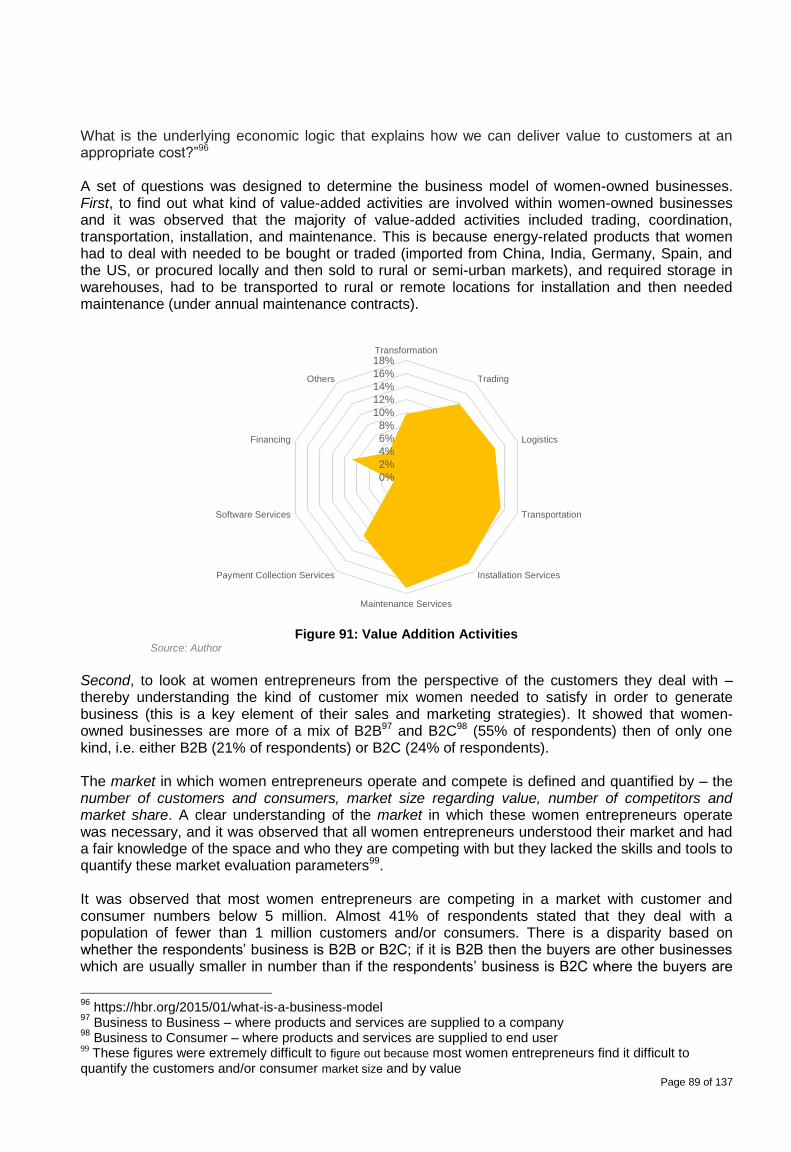
Page 89 of 137
What is the underlying economic logic that explains how we can deliver value to customers at an appropriate cost?”96 A set of questions was designed to determine the business model of women-owned businesses. First, to find out what kind of value-added activities are involved within women-owned businesses and it was observed that the majority of value-added activities included trading, coordination, transportation, installation, and maintenance. This is because energy-related products that women had to deal with needed to be bought or traded (imported from China, India, Germany, Spain, and the US, or procured locally and then sold to rural or semi-urban markets), and required storage in warehouses, had to be transported to rural or remote locations for installation and then needed maintenance (under annual maintenance contracts).
Figure 91: Value Addition Activities
Second, to look at women entrepreneurs from the perspective of the customers they deal with – thereby understanding the kind of customer mix women needed to satisfy in order to generate business (this is a key element of their sales and marketing strategies). It showed that women-owned businesses are more of a mix of B2B97 and B2C98 (55% of respondents) then of only one kind, i.e. either B2B (21% of respondents) or B2C (24% of respondents). The market in which women entrepreneurs operate and compete is defined and quantified by – the number of customers and consumers, market size regarding value, number of competitors and market share. A clear understanding of the market in which these women entrepreneurs operate was necessary, and it was observed that all women entrepreneurs understood their market and had a fair knowledge of the space and who they are competing with but they lacked the skills and tools to quantify these market evaluation parameters99. It was observed that most women entrepreneurs are competing in a market with customer and consumer numbers below 5 million. Almost 41% of respondents stated that they deal with a population of fewer than 1 million customers and/or consumers. There is a disparity based on whether the respondents’ business is B2B or B2C; if it is B2B then the buyers are other businesses which are usually smaller in number than if the respondents’ business is B2C where the buyers are
96
https://hbr.org/2015/01/what-is-a-business-model 97
Business to Business – where products and services are supplied to a company 98
Business to Consumer – where products and services are supplied to end user 99
These figures were extremely difficult to figure out because most women entrepreneurs find it difficult to quantify the customers and/or consumer market size and by value
0%
2%
4%
6%
8%
10%
12%
14%
16%
18%Transformation
Trading
Logistics
Transportation
Installation Services
Maintenance Services
Payment Collection Services
Software Services
Financing
Others
Source: Author
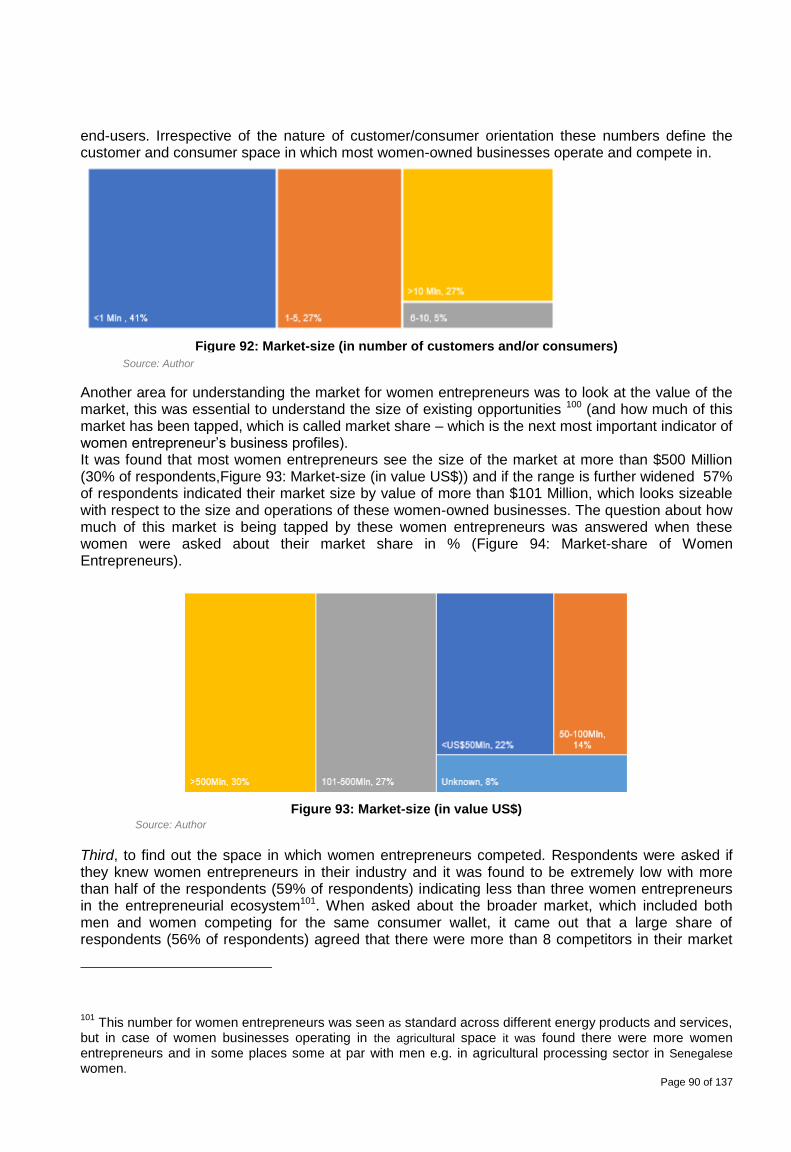
Page 90 of 137
end-users. Irrespective of the nature of customer/consumer orientation these numbers define the customer and consumer space in which most women-owned businesses operate and compete in.
Figure 92: Market-size (in number of customers and/or consumers)
Another area for understanding the market for women entrepreneurs was to look at the value of the market, this was essential to understand the size of existing opportunities 100 (and how much of this market has been tapped, which is called market share – which is the next most important indicator of women entrepreneur’s business profiles). It was found that most women entrepreneurs see the size of the market at more than $500 Million (30% of respondents,Figure 93: Market-size (in value US$)) and if the range is further widened 57% of respondents indicated their market size by value of more than $101 Million, which looks sizeable with respect to the size and operations of these women-owned businesses. The question about how much of this market is being tapped by these women entrepreneurs was answered when these women were asked about their market share in % (Figure 94: Market-share of Women Entrepreneurs).
Figure 93: Market-size (in value US$)
Third, to find out the space in which women entrepreneurs competed. Respondents were asked if they knew women entrepreneurs in their industry and it was found to be extremely low with more than half of the respondents (59% of respondents) indicating less than three women entrepreneurs in the entrepreneurial ecosystem101. When asked about the broader market, which included both men and women competing for the same consumer wallet, it came out that a large share of respondents (56% of respondents) agreed that there were more than 8 competitors in their market
101
This number for women entrepreneurs was seen as standard across different energy products and services, but in case of women businesses operating in the agricultural space it was found there were more women entrepreneurs and in some places some at par with men e.g. in agricultural processing sector in Senegalese women.
Source: Author
Source: Author
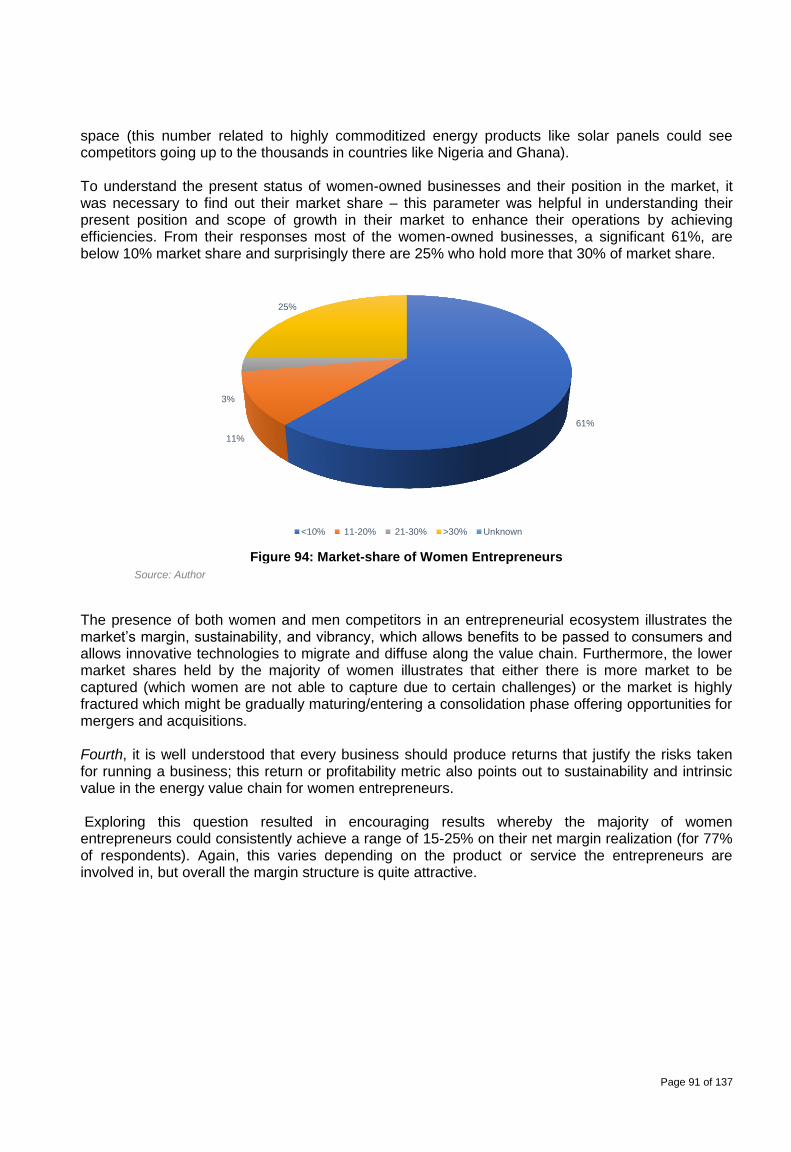
Page 91 of 137
space (this number related to highly commoditized energy products like solar panels could see competitors going up to the thousands in countries like Nigeria and Ghana). To understand the present status of women-owned businesses and their position in the market, it was necessary to find out their market share – this parameter was helpful in understanding their present position and scope of growth in their market to enhance their operations by achieving efficiencies. From their responses most of the women-owned businesses, a significant 61%, are below 10% market share and surprisingly there are 25% who hold more that 30% of market share.
Figure 94: Market-share of Women Entrepreneurs
The presence of both women and men competitors in an entrepreneurial ecosystem illustrates the market’s margin, sustainability, and vibrancy, which allows benefits to be passed to consumers and allows innovative technologies to migrate and diffuse along the value chain. Furthermore, the lower market shares held by the majority of women illustrates that either there is more market to be captured (which women are not able to capture due to certain challenges) or the market is highly fractured which might be gradually maturing/entering a consolidation phase offering opportunities for mergers and acquisitions. Fourth, it is well understood that every business should produce returns that justify the risks taken for running a business; this return or profitability metric also points out to sustainability and intrinsic value in the energy value chain for women entrepreneurs. Exploring this question resulted in encouraging results whereby the majority of women entrepreneurs could consistently achieve a range of 15-25% on their net margin realization (for 77% of respondents). Again, this varies depending on the product or service the entrepreneurs are involved in, but overall the margin structure is quite attractive.
61%
11%
3%
25%
<10% 11-20% 21-30% >30% Unknown
Source: Author
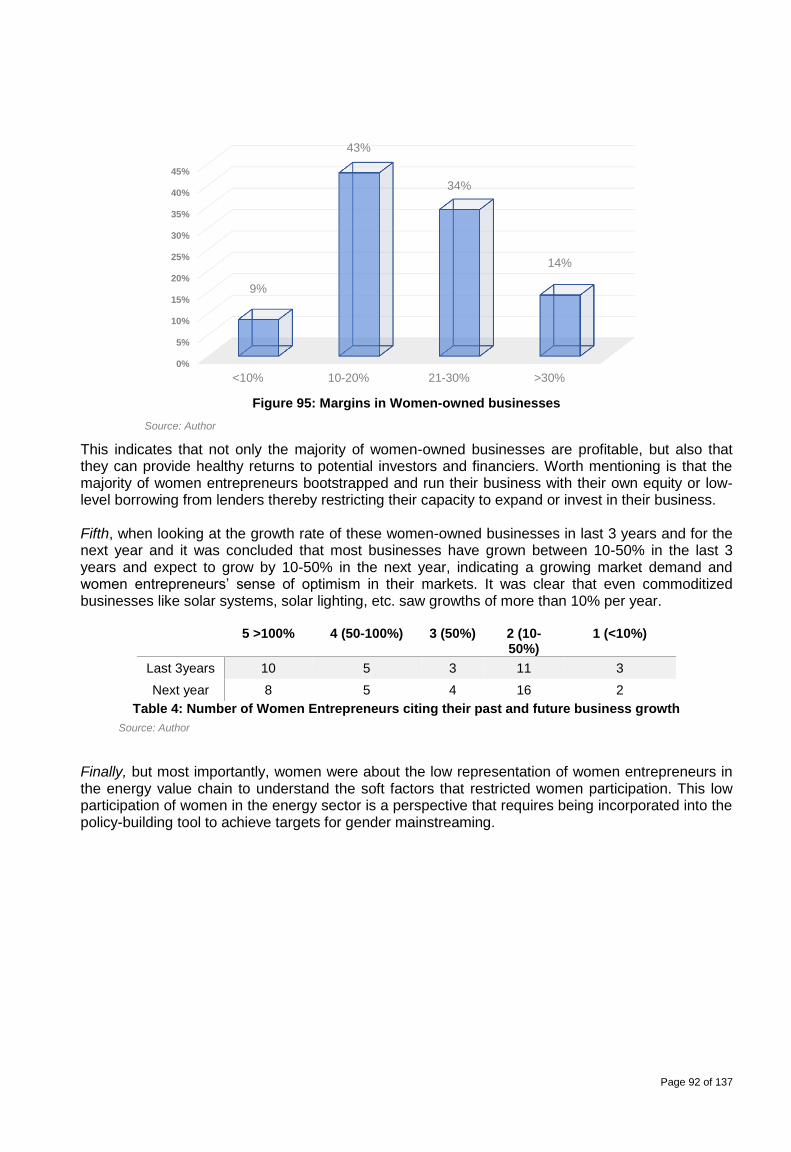
Page 92 of 137
Figure 95: Margins in Women-owned businesses
This indicates that not only the majority of women-owned businesses are profitable, but also that they can provide healthy returns to potential investors and financiers. Worth mentioning is that the majority of women entrepreneurs bootstrapped and run their business with their own equity or low-level borrowing from lenders thereby restricting their capacity to expand or invest in their business. Fifth, when looking at the growth rate of these women-owned businesses in last 3 years and for the next year and it was concluded that most businesses have grown between 10-50% in the last 3 years and expect to grow by 10-50% in the next year, indicating a growing market demand and women entrepreneurs’ sense of optimism in their markets. It was clear that even commoditized businesses like solar systems, solar lighting, etc. saw growths of more than 10% per year.
5 >100% 4 (50-100%) 3 (50%) 2 (10-50%)
1 (<10%)
Last 3years 10 5 3 11 3
Next year 8 5 4 16 2
Table 4: Number of Women Entrepreneurs citing their past and future business growth
Finally, but most importantly, women were about the low representation of women entrepreneurs in the energy value chain to understand the soft factors that restricted women participation. This low participation of women in the energy sector is a perspective that requires being incorporated into the policy-building tool to achieve targets for gender mainstreaming.
0%
5%
10%
15%
20%
25%
30%
35%
40%
45%
<10% 10-20% 21-30% >30%
9%
43%
34%
14%
Source: Author
Source: Author
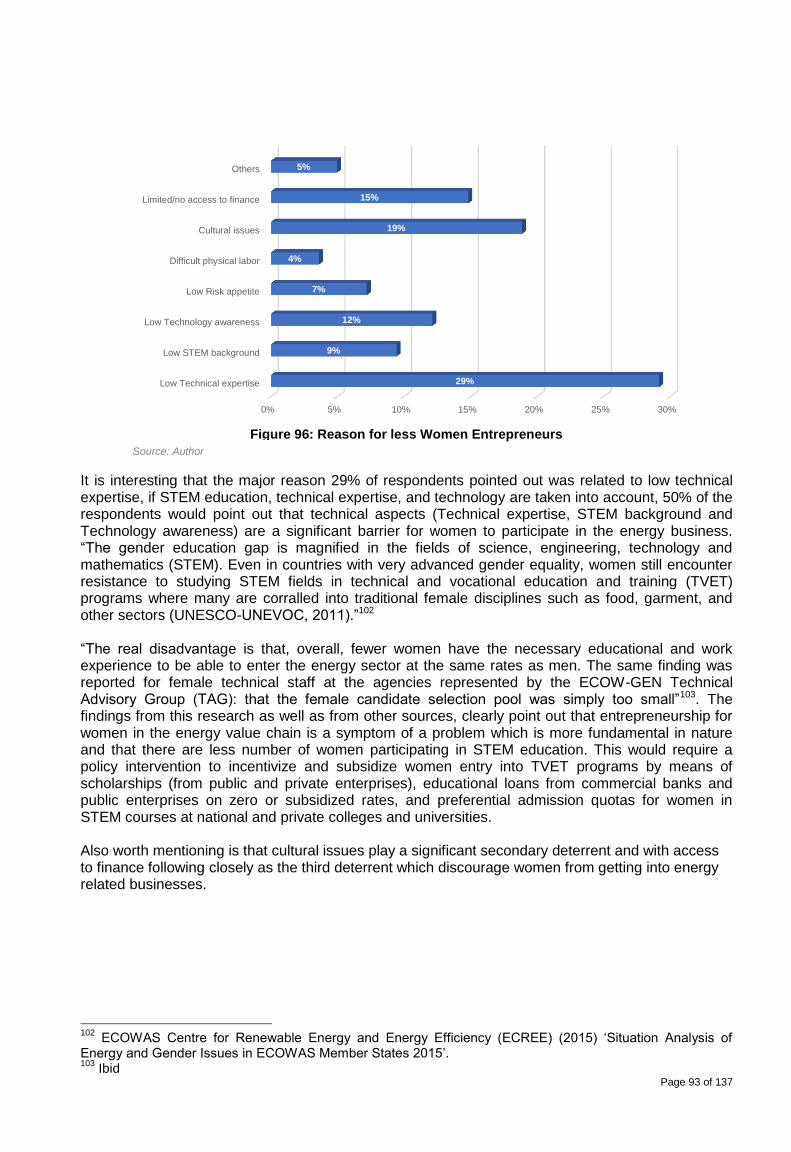
Page 93 of 137
Figure 96: Reason for less Women Entrepreneurs
It is interesting that the major reason 29% of respondents pointed out was related to low technical expertise, if STEM education, technical expertise, and technology are taken into account, 50% of the respondents would point out that technical aspects (Technical expertise, STEM background and Technology awareness) are a significant barrier for women to participate in the energy business. “The gender education gap is magnified in the fields of science, engineering, technology and mathematics (STEM). Even in countries with very advanced gender equality, women still encounter resistance to studying STEM fields in technical and vocational education and training (TVET) programs where many are corralled into traditional female disciplines such as food, garment, and other sectors (UNESCO-UNEVOC, 2011).”102 “The real disadvantage is that, overall, fewer women have the necessary educational and work experience to be able to enter the energy sector at the same rates as men. The same finding was reported for female technical staff at the agencies represented by the ECOW-GEN Technical Advisory Group (TAG): that the female candidate selection pool was simply too small”103. The findings from this research as well as from other sources, clearly point out that entrepreneurship for women in the energy value chain is a symptom of a problem which is more fundamental in nature and that there are less number of women participating in STEM education. This would require a policy intervention to incentivize and subsidize women entry into TVET programs by means of scholarships (from public and private enterprises), educational loans from commercial banks and public enterprises on zero or subsidized rates, and preferential admission quotas for women in STEM courses at national and private colleges and universities. Also worth mentioning is that cultural issues play a significant secondary deterrent and with access to finance following closely as the third deterrent which discourage women from getting into energy related businesses.
102
ECOWAS Centre for Renewable Energy and Energy Efficiency (ECREE) (2015) ‘Situation Analysis of Energy and Gender Issues in ECOWAS Member States 2015’. 103
Ibid
0% 5% 10% 15% 20% 25% 30%
Low Technical expertise
Low STEM background
Low Technology awareness
Low Risk appetite
Difficult physical labor
Cultural issues
Limited/no access to finance
Others
29%
9%
12%
7%
4%
19%
15%
5%
Source: Author
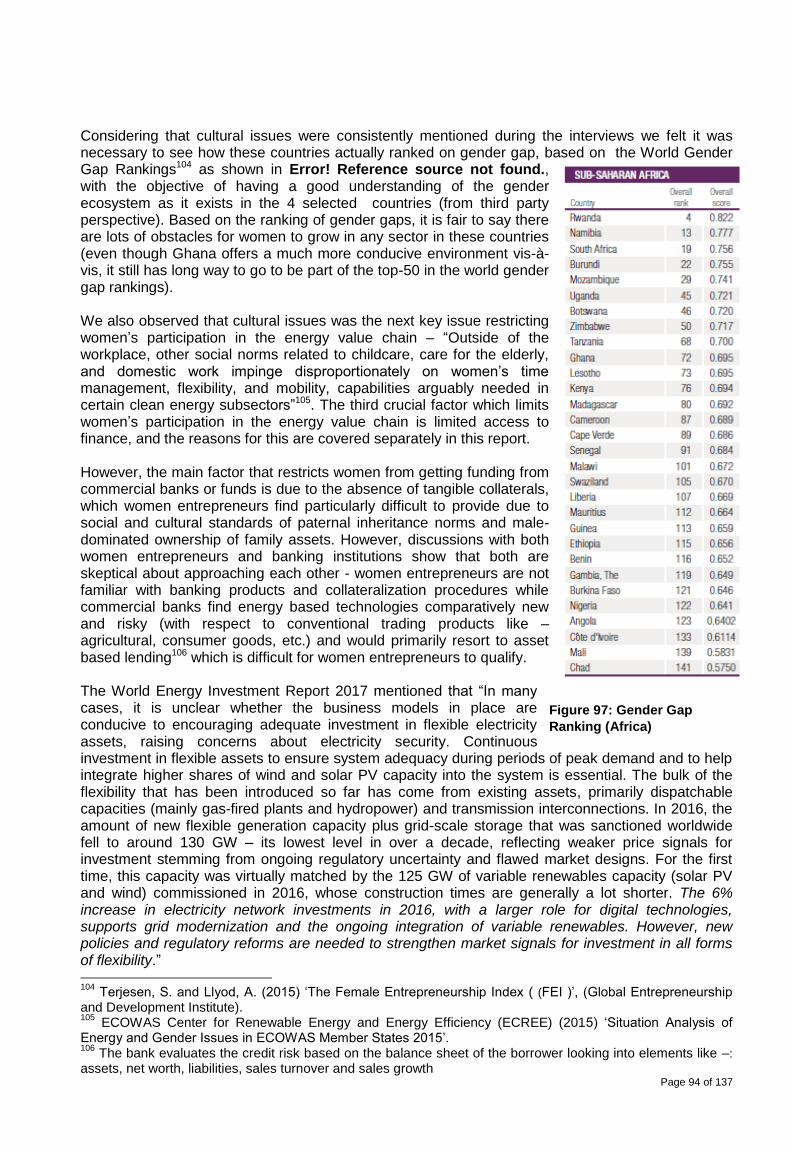
Page 94 of 137
Considering that cultural issues were consistently mentioned during the interviews we felt it was necessary to see how these countries actually ranked on gender gap, based on the World Gender Gap Rankings104 as shown in Error! Reference source not found., with the objective of having a good understanding of the gender ecosystem as it exists in the 4 selected countries (from third party perspective). Based on the ranking of gender gaps, it is fair to say there are lots of obstacles for women to grow in any sector in these countries (even though Ghana offers a much more conducive environment vis-à-vis, it still has long way to go to be part of the top-50 in the world gender gap rankings). We also observed that cultural issues was the next key issue restricting women’s participation in the energy value chain – “Outside of the workplace, other social norms related to childcare, care for the elderly, and domestic work impinge disproportionately on women’s time management, flexibility, and mobility, capabilities arguably needed in certain clean energy subsectors”105. The third crucial factor which limits women’s participation in the energy value chain is limited access to finance, and the reasons for this are covered separately in this report. However, the main factor that restricts women from getting funding from commercial banks or funds is due to the absence of tangible collaterals, which women entrepreneurs find particularly difficult to provide due to social and cultural standards of paternal inheritance norms and male-dominated ownership of family assets. However, discussions with both women entrepreneurs and banking institutions show that both are skeptical about approaching each other - women entrepreneurs are not familiar with banking products and collateralization procedures while commercial banks find energy based technologies comparatively new and risky (with respect to conventional trading products like – agricultural, consumer goods, etc.) and would primarily resort to asset based lending106 which is difficult for women entrepreneurs to qualify. The World Energy Investment Report 2017 mentioned that “In many cases, it is unclear whether the business models in place are conducive to encouraging adequate investment in flexible electricity assets, raising concerns about electricity security. Continuous investment in flexible assets to ensure system adequacy during periods of peak demand and to help integrate higher shares of wind and solar PV capacity into the system is essential. The bulk of the flexibility that has been introduced so far has come from existing assets, primarily dispatchable capacities (mainly gas-fired plants and hydropower) and transmission interconnections. In 2016, the amount of new flexible generation capacity plus grid-scale storage that was sanctioned worldwide fell to around 130 GW – its lowest level in over a decade, reflecting weaker price signals for investment stemming from ongoing regulatory uncertainty and flawed market designs. For the first time, this capacity was virtually matched by the 125 GW of variable renewables capacity (solar PV and wind) commissioned in 2016, whose construction times are generally a lot shorter. The 6% increase in electricity network investments in 2016, with a larger role for digital technologies, supports grid modernization and the ongoing integration of variable renewables. However, new policies and regulatory reforms are needed to strengthen market signals for investment in all forms of flexibility.” 104
Terjesen, S. and Llyod, A. (2015) ‘The Female Entrepreneurship Index ( (FEI )’, (Global Entrepreneurship and Development Institute). 105
ECOWAS Center for Renewable Energy and Energy Efficiency (ECREE) (2015) ‘Situation Analysis of Energy and Gender Issues in ECOWAS Member States 2015’. 106
The bank evaluates the credit risk based on the balance sheet of the borrower looking into elements like –: assets, net worth, liabilities, sales turnover and sales growth
Figure 97: Gender Gap
Ranking (Africa)

Page 95 of 137
Overall, the business model of women entrepreneurs can be summed up to be ‘product-based innovative service delivery model’ that charges premiums to customers for providing them access to these products and services in their area.
5.3. Operating model/capabilities
Company operations involve daily business functions, tactical maneuvers, commercial contracting, and overall supply chain challenges. We tried to evaluate this aspect by looking at business to identify both explicit and implicit challenges, and strengths in women-led businesses. Most respondents highlighted that top drivers of their business were – a strong relationship with buyers and suppliers, innovative products, and innovative service. These three aspects allowed women entrepreneurs to drive their profitability and allowed them to access a pool of suppliers and buyers that offered them a premium for their products and services.
Figure 98: Profitability Drivers for Women Entrepreneurs
Even though these women entrepreneurs have tried to overcome the hurdles and are established and continue to grow their businesses, they face external hardships that are not allowing them to grow. The main challenges that affect women entrepreneurs are: access to finance, supply chain management, and labor availability.
Figure 99: Operational Challenges for Women Entrepreneurs
Access to finance – this challenge has been very difficult for women entrepreneurs, and they find it increasingly difficult to tackle. This is driven by both, the lending institutions (banks and funds), as well as the women entrepreneurs themselves. The comprehensive understanding of this aspect is discussed in detail under the financial challenges section in this report Figure 108: Challenges for accessing finance by Women Entrepreneurs.
Source: Author
Source: Author
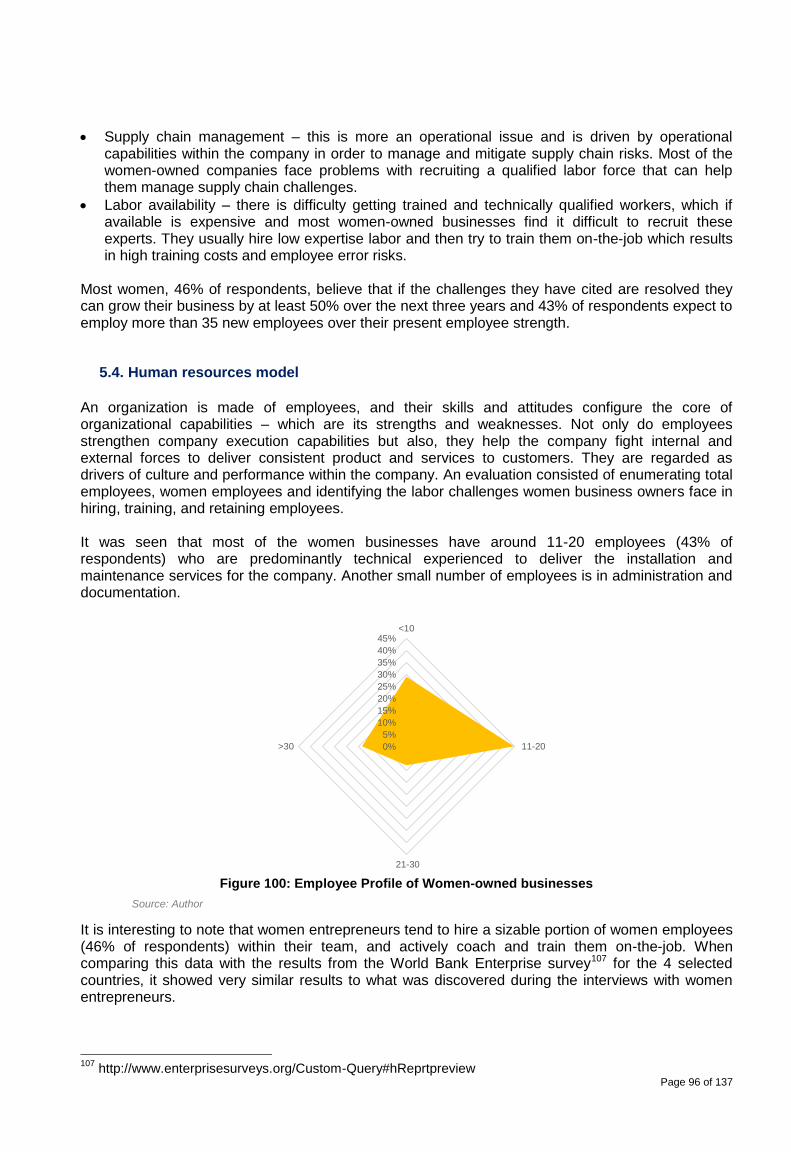
Page 96 of 137
Supply chain management – this is more an operational issue and is driven by operational capabilities within the company in order to manage and mitigate supply chain risks. Most of the women-owned companies face problems with recruiting a qualified labor force that can help them manage supply chain challenges.
Labor availability – there is difficulty getting trained and technically qualified workers, which if available is expensive and most women-owned businesses find it difficult to recruit these experts. They usually hire low expertise labor and then try to train them on-the-job which results in high training costs and employee error risks.
Most women, 46% of respondents, believe that if the challenges they have cited are resolved they can grow their business by at least 50% over the next three years and 43% of respondents expect to employ more than 35 new employees over their present employee strength.
5.4. Human resources model
An organization is made of employees, and their skills and attitudes configure the core of organizational capabilities – which are its strengths and weaknesses. Not only do employees strengthen company execution capabilities but also, they help the company fight internal and external forces to deliver consistent product and services to customers. They are regarded as drivers of culture and performance within the company. An evaluation consisted of enumerating total employees, women employees and identifying the labor challenges women business owners face in hiring, training, and retaining employees. It was seen that most of the women businesses have around 11-20 employees (43% of respondents) who are predominantly technical experienced to deliver the installation and maintenance services for the company. Another small number of employees is in administration and documentation.
Figure 100: Employee Profile of Women-owned businesses
It is interesting to note that women entrepreneurs tend to hire a sizable portion of women employees (46% of respondents) within their team, and actively coach and train them on-the-job. When comparing this data with the results from the World Bank Enterprise survey107 for the 4 selected countries, it showed very similar results to what was discovered during the interviews with women entrepreneurs.
107
http://www.enterprisesurveys.org/Custom-Query#hReprtpreview
0%
5%
10%
15%
20%
25%
30%
35%
40%
45%<10
11-20
21-30
>30
Source: Author
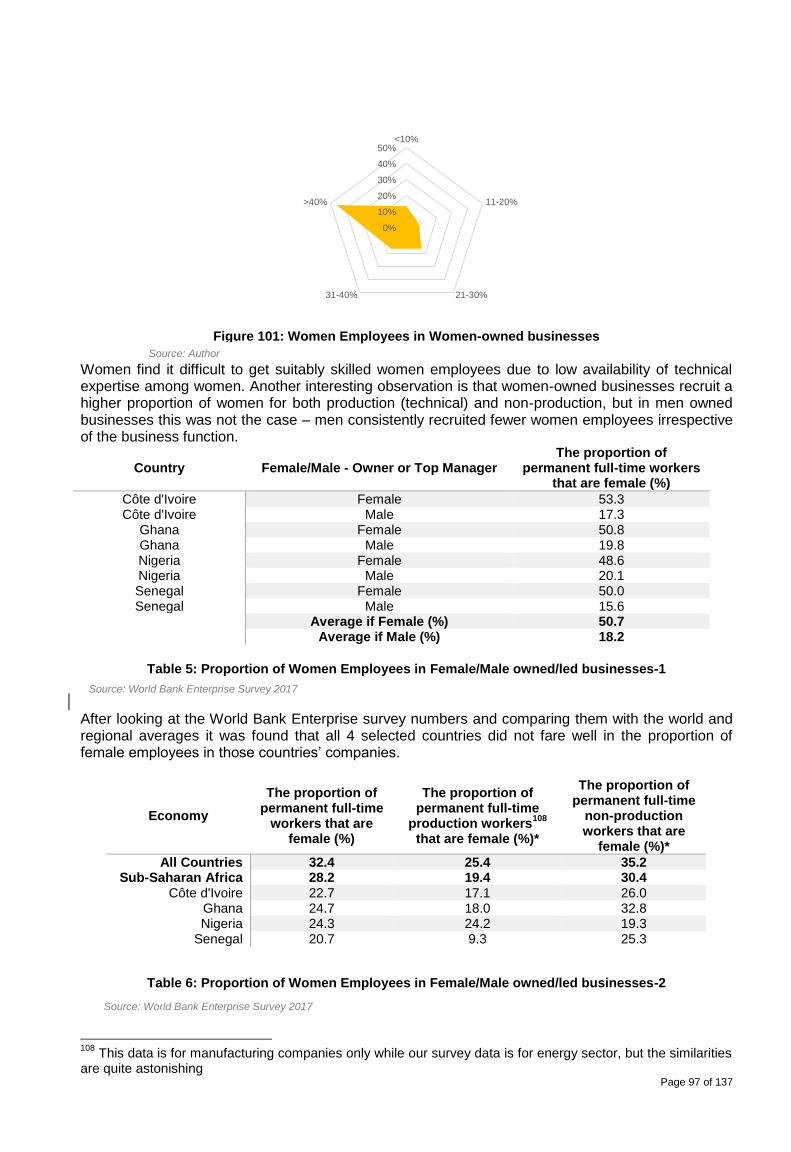
Page 97 of 137
Figure 101: Women Employees in Women-owned businesses
Women find it difficult to get suitably skilled women employees due to low availability of technical expertise among women. Another interesting observation is that women-owned businesses recruit a higher proportion of women for both production (technical) and non-production, but in men owned businesses this was not the case – men consistently recruited fewer women employees irrespective of the business function.
Country Female/Male - Owner or Top Manager The proportion of
permanent full-time workers that are female (%)
Côte d'Ivoire Female 53.3 Côte d'Ivoire Male 17.3
Ghana Female 50.8 Ghana Male 19.8 Nigeria Female 48.6 Nigeria Male 20.1 Senegal Female 50.0 Senegal Male 15.6
Average if Female (%) 50.7 Average if Male (%) 18.2
Table 5: Proportion of Women Employees in Female/Male owned/led businesses-1
After looking at the World Bank Enterprise survey numbers and comparing them with the world and regional averages it was found that all 4 selected countries did not fare well in the proportion of female employees in those countries’ companies.
Economy
The proportion of permanent full-time
workers that are female (%)
The proportion of permanent full-time
production workers108
that are female (%)*
The proportion of permanent full-time
non-production workers that are
female (%)*
All Countries 32.4 25.4 35.2 Sub-Saharan Africa 28.2 19.4 30.4
Côte d'Ivoire 22.7 17.1 26.0 Ghana 24.7 18.0 32.8 Nigeria 24.3 24.2 19.3
Senegal 20.7 9.3 25.3
Table 6: Proportion of Women Employees in Female/Male owned/led businesses-2
108
This data is for manufacturing companies only while our survey data is for energy sector, but the similarities are quite astonishing
0%
10%
20%
30%
40%
50%<10%
11-20%
21-30%31-40%
>40%
Source: Author
Source: World Bank Enterprise Survey 2017
Source: World Bank Enterprise Survey 2017
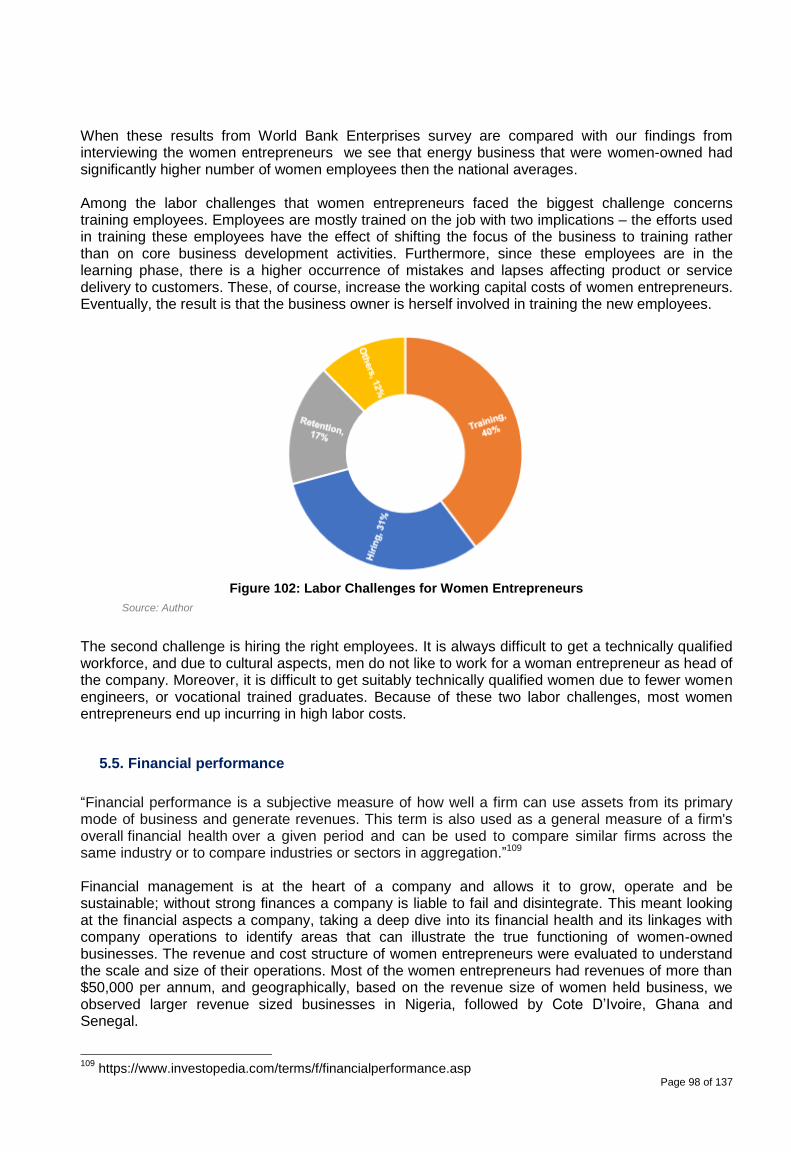
Page 98 of 137
When these results from World Bank Enterprises survey are compared with our findings from interviewing the women entrepreneurs we see that energy business that were women-owned had significantly higher number of women employees then the national averages. Among the labor challenges that women entrepreneurs faced the biggest challenge concerns training employees. Employees are mostly trained on the job with two implications – the efforts used in training these employees have the effect of shifting the focus of the business to training rather than on core business development activities. Furthermore, since these employees are in the learning phase, there is a higher occurrence of mistakes and lapses affecting product or service delivery to customers. These, of course, increase the working capital costs of women entrepreneurs. Eventually, the result is that the business owner is herself involved in training the new employees.
Figure 102: Labor Challenges for Women Entrepreneurs
The second challenge is hiring the right employees. It is always difficult to get a technically qualified workforce, and due to cultural aspects, men do not like to work for a woman entrepreneur as head of the company. Moreover, it is difficult to get suitably technically qualified women due to fewer women engineers, or vocational trained graduates. Because of these two labor challenges, most women entrepreneurs end up incurring in high labor costs.
5.5. Financial performance
“Financial performance is a subjective measure of how well a firm can use assets from its primary mode of business and generate revenues. This term is also used as a general measure of a firm's overall financial health over a given period and can be used to compare similar firms across the same industry or to compare industries or sectors in aggregation.”109 Financial management is at the heart of a company and allows it to grow, operate and be sustainable; without strong finances a company is liable to fail and disintegrate. This meant looking at the financial aspects a company, taking a deep dive into its financial health and its linkages with company operations to identify areas that can illustrate the true functioning of women-owned businesses. The revenue and cost structure of women entrepreneurs were evaluated to understand the scale and size of their operations. Most of the women entrepreneurs had revenues of more than $50,000 per annum, and geographically, based on the revenue size of women held business, we observed larger revenue sized businesses in Nigeria, followed by Cote D’Ivoire, Ghana and Senegal.
109
https://www.investopedia.com/terms/f/financialperformance.asp
Source: Author

Page 99 of 137
While evaluating the costs, it was found that 78% of the women-owned businesses have costs of more than US$50,000 per year so a lower profit scale would have a detrimental effect on their margins. This is also clear from the fact that the larger costs are in inventory (42% of the total according to respondents) and other significant costs are in labor and transportation.
Figure 103: Cost drivers for Women-owned businesses
“Inventory costs are the costs associated with the procurement, storage, and management of inventory. It includes costs like ordering costs, carrying costs and shortage/stock out costs. Inventory costs can be categorized into three sub-headings-
a) Ordering cost of inventory refers to the cost incurred for procuring inventory. It includes the cost of purchase and the cost of inbound coordination. To minimize the ordering cost of inventory this study used of the concept of EOQ or Economic Order Quantity110.
b) Carrying cost of inventory refers to the cost incurred towards inventory storage and maintenance. Inventory storage costs typically include the cost of renting a building and other infrastructures that are needed to preserve inventory. The inventory carrying cost is dependent and varies with management’s decision to manage inventory in-house or through outsourced vendors and third-party service providers.
c) Shortage or stock out costs and cost of replenishment are the costs incurred due to unusual circumstances. They usually form a very small part of the total inventory cost”111
Being a product-driven business, a huge amount of women’s business capital is stuck with inventory that is either stored or transported which means high inventory costs.
Solutions: Ways to reduce inventory costs involve – 1. better sales forecasting, 2. supplier tie-ups for extended payments and no or low advance payments, 3. just in time inventory levels, 4. reducing inventory by faster sales liquidation of finished goods from a warehouse or in-
transit sales The second major cost is labor cost (26% of the total according to respondents) which is: wages paid to workers during an accounting period on daily, weekly, monthly, or job basis, plus payroll and related taxes and benefits (if any).112
Solutions: Ways to reduce labor costs involve – 1. proper labor allocation,
110
economic order quantity (EOQ) is the order quantity that minimizes the total holding and ordering costs. It is one of the oldest traditional production scheduling models. 111
https://www.mbaskool.com/business-concepts/operations-logistics-supply-chain-terms/15039-inventory-costs.html 112
http://www.businessdictionary.com/definition/labor-cost.html
Source: Author
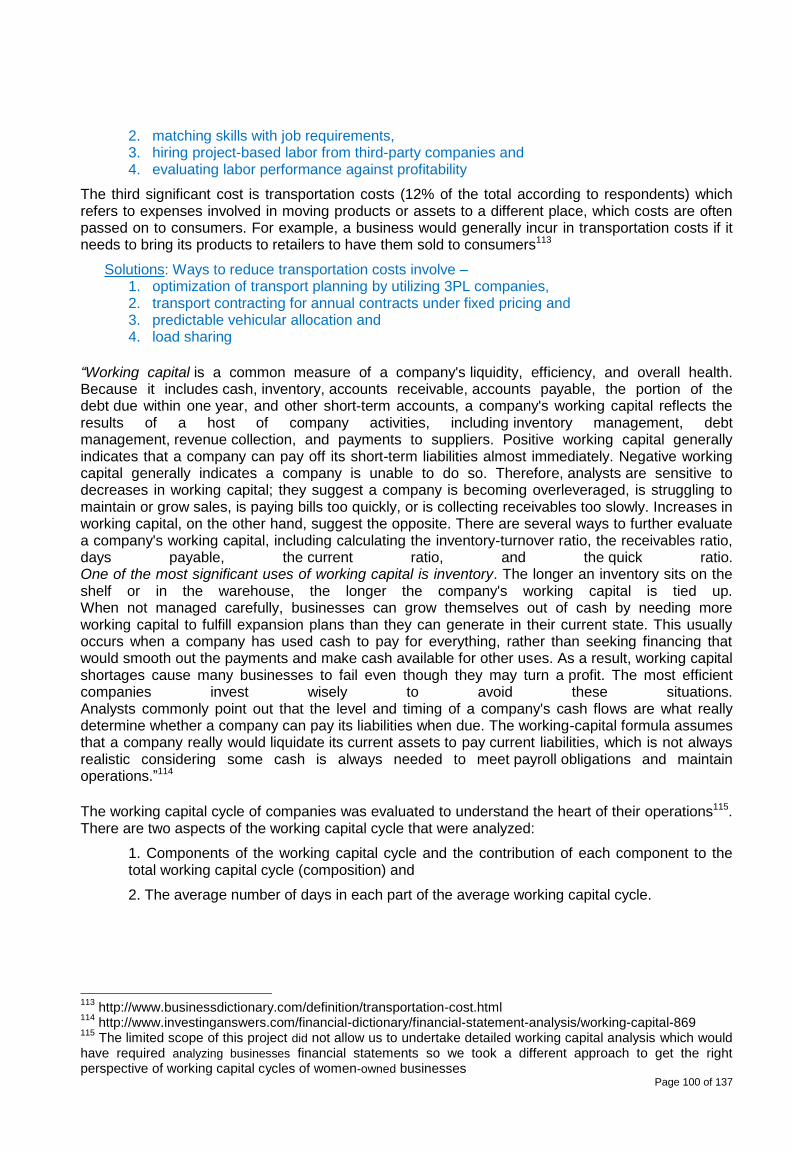
Page 100 of 137
2. matching skills with job requirements, 3. hiring project-based labor from third-party companies and 4. evaluating labor performance against profitability
The third significant cost is transportation costs (12% of the total according to respondents) which refers to expenses involved in moving products or assets to a different place, which costs are often passed on to consumers. For example, a business would generally incur in transportation costs if it needs to bring its products to retailers to have them sold to consumers113
Solutions: Ways to reduce transportation costs involve – 1. optimization of transport planning by utilizing 3PL companies, 2. transport contracting for annual contracts under fixed pricing and 3. predictable vehicular allocation and 4. load sharing
“Working capital is a common measure of a company's liquidity, efficiency, and overall health. Because it includes cash, inventory, accounts receivable, accounts payable, the portion of the debt due within one year, and other short-term accounts, a company's working capital reflects the results of a host of company activities, including inventory management, debt management, revenue collection, and payments to suppliers. Positive working capital generally indicates that a company can pay off its short-term liabilities almost immediately. Negative working capital generally indicates a company is unable to do so. Therefore, analysts are sensitive to decreases in working capital; they suggest a company is becoming overleveraged, is struggling to maintain or grow sales, is paying bills too quickly, or is collecting receivables too slowly. Increases in working capital, on the other hand, suggest the opposite. There are several ways to further evaluate a company's working capital, including calculating the inventory-turnover ratio, the receivables ratio, days payable, the current ratio, and the quick ratio. One of the most significant uses of working capital is inventory. The longer an inventory sits on the shelf or in the warehouse, the longer the company's working capital is tied up. When not managed carefully, businesses can grow themselves out of cash by needing more working capital to fulfill expansion plans than they can generate in their current state. This usually occurs when a company has used cash to pay for everything, rather than seeking financing that would smooth out the payments and make cash available for other uses. As a result, working capital shortages cause many businesses to fail even though they may turn a profit. The most efficient companies invest wisely to avoid these situations. Analysts commonly point out that the level and timing of a company's cash flows are what really determine whether a company can pay its liabilities when due. The working-capital formula assumes that a company really would liquidate its current assets to pay current liabilities, which is not always realistic considering some cash is always needed to meet payroll obligations and maintain operations.”114
The working capital cycle of companies was evaluated to understand the heart of their operations115. There are two aspects of the working capital cycle that were analyzed:
1. Components of the working capital cycle and the contribution of each component to the total working capital cycle (composition) and
2. The average number of days in each part of the average working capital cycle.
113
http://www.businessdictionary.com/definition/transportation-cost.html 114
http://www.investinganswers.com/financial-dictionary/financial-statement-analysis/working-capital-869 115
The limited scope of this project did not allow us to undertake detailed working capital analysis which would have required analyzing businesses financial statements so we took a different approach to get the right perspective of working capital cycles of women-owned businesses
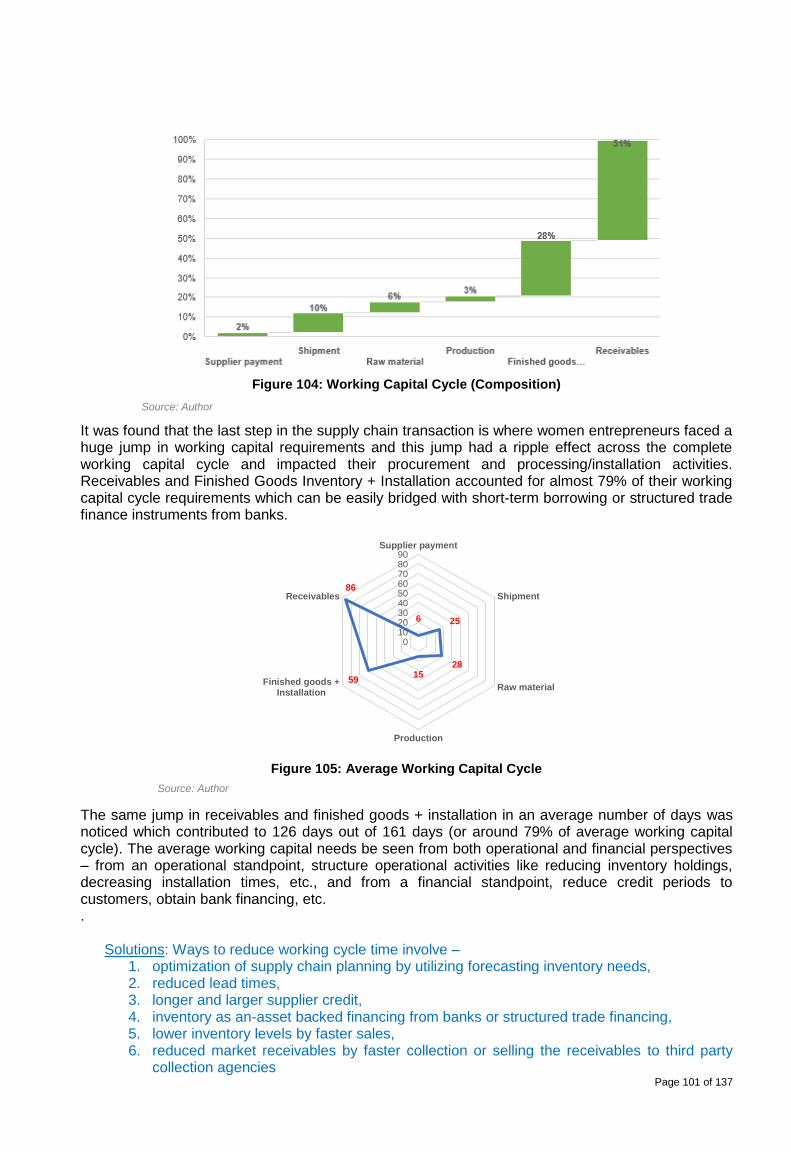
Page 101 of 137
Figure 104: Working Capital Cycle (Composition)
It was found that the last step in the supply chain transaction is where women entrepreneurs faced a huge jump in working capital requirements and this jump had a ripple effect across the complete working capital cycle and impacted their procurement and processing/installation activities. Receivables and Finished Goods Inventory + Installation accounted for almost 79% of their working capital cycle requirements which can be easily bridged with short-term borrowing or structured trade finance instruments from banks.
Figure 105: Average Working Capital Cycle
The same jump in receivables and finished goods + installation in an average number of days was noticed which contributed to 126 days out of 161 days (or around 79% of average working capital cycle). The average working capital needs be seen from both operational and financial perspectives – from an operational standpoint, structure operational activities like reducing inventory holdings, decreasing installation times, etc., and from a financial standpoint, reduce credit periods to customers, obtain bank financing, etc. .
Solutions: Ways to reduce working cycle time involve – 1. optimization of supply chain planning by utilizing forecasting inventory needs, 2. reduced lead times, 3. longer and larger supplier credit, 4. inventory as an-asset backed financing from banks or structured trade financing, 5. lower inventory levels by faster sales, 6. reduced market receivables by faster collection or selling the receivables to third party
collection agencies
6 25
28 15
59
86
0102030405060708090
Supplier payment
Shipment
Raw material
Production
Finished goods +Installation
Receivables
Source: Author Source: ECREEE, 2018
Source: Author
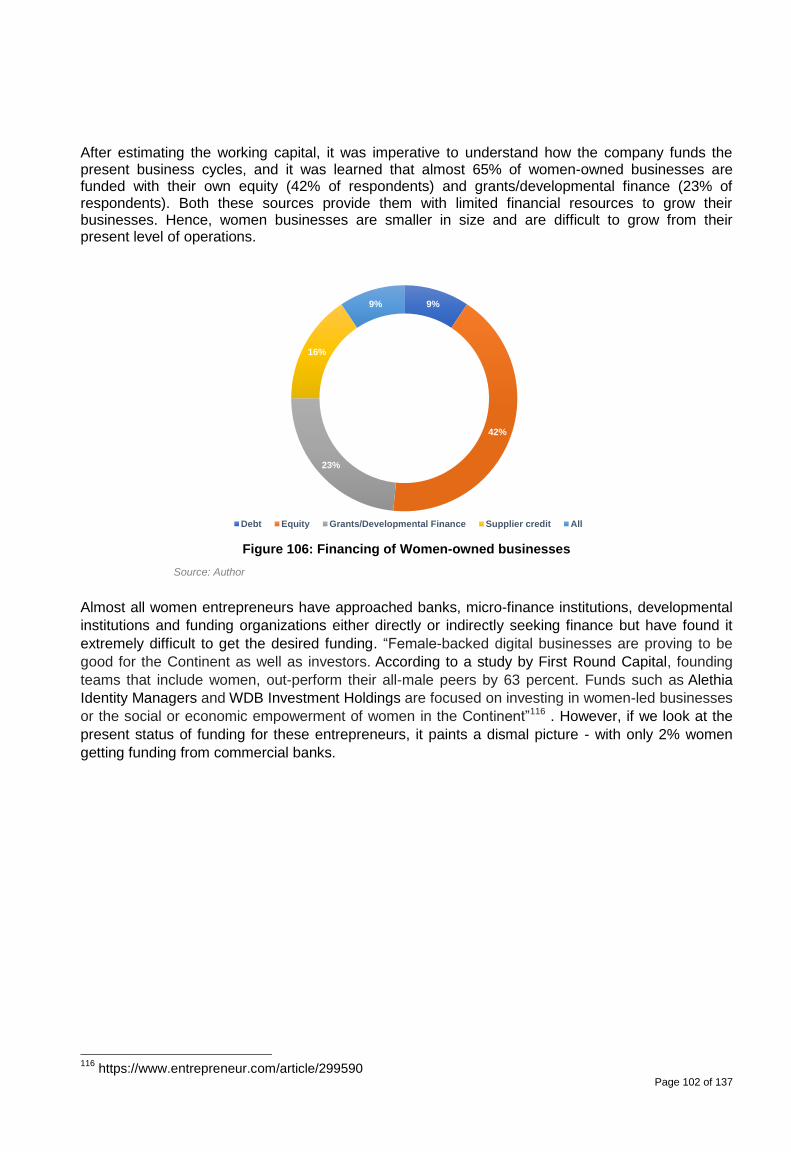
Page 102 of 137
After estimating the working capital, it was imperative to understand how the company funds the present business cycles, and it was learned that almost 65% of women-owned businesses are funded with their own equity (42% of respondents) and grants/developmental finance (23% of respondents). Both these sources provide them with limited financial resources to grow their businesses. Hence, women businesses are smaller in size and are difficult to grow from their present level of operations.
Figure 106: Financing of Women-owned businesses
Almost all women entrepreneurs have approached banks, micro-finance institutions, developmental
institutions and funding organizations either directly or indirectly seeking finance but have found it
extremely difficult to get the desired funding. “Female-backed digital businesses are proving to be
good for the Continent as well as investors. According to a study by First Round Capital, founding
teams that include women, out-perform their all-male peers by 63 percent. Funds such as Alethia
Identity Managers and WDB Investment Holdings are focused on investing in women-led businesses
or the social or economic empowerment of women in the Continent”116 . However, if we look at the
present status of funding for these entrepreneurs, it paints a dismal picture - with only 2% women
getting funding from commercial banks.
116
https://www.entrepreneur.com/article/299590
9%
42%
23%
16%
9%
Debt Equity Grants/Developmental Finance Supplier credit All
Source: Author
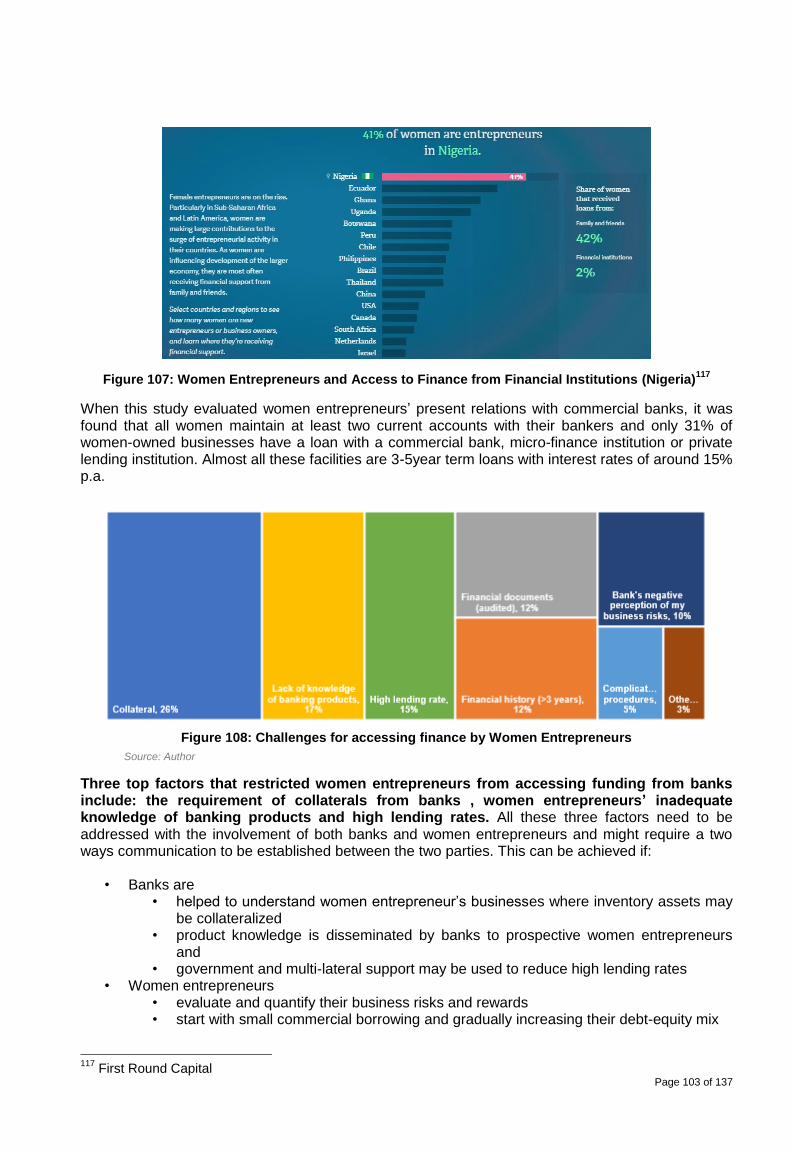
Page 103 of 137
Figure 107: Women Entrepreneurs and Access to Finance from Financial Institutions (Nigeria)117
When this study evaluated women entrepreneurs’ present relations with commercial banks, it was found that all women maintain at least two current accounts with their bankers and only 31% of women-owned businesses have a loan with a commercial bank, micro-finance institution or private lending institution. Almost all these facilities are 3-5year term loans with interest rates of around 15% p.a.
Figure 108: Challenges for accessing finance by Women Entrepreneurs
Three top factors that restricted women entrepreneurs from accessing funding from banks include: the requirement of collaterals from banks , women entrepreneurs’ inadequate knowledge of banking products and high lending rates. All these three factors need to be addressed with the involvement of both banks and women entrepreneurs and might require a two ways communication to be established between the two parties. This can be achieved if:
• Banks are • helped to understand women entrepreneur’s businesses where inventory assets may
be collateralized • product knowledge is disseminated by banks to prospective women entrepreneurs
and • government and multi-lateral support may be used to reduce high lending rates
• Women entrepreneurs • evaluate and quantify their business risks and rewards • start with small commercial borrowing and gradually increasing their debt-equity mix
117
First Round Capital
Source: Author
Page 104 of 137
• partner with investors that provide them with exposure and credibility to borrow and get trained in managing working and financial capital
Furthermore, they need to understand bank requirements to be able to approach them with the right type of information in order to get credit approval. As discussed with bankers in the four countries it was clear that they follow the 5C principles for credit evaluation - character, capacity, capital, collateral, and conditions. “The five C's of credit is a system used by lenders to gauge the creditworthiness of potential borrowers. The system weighs five characteristics of the borrower and conditions of the loan, attempting to estimate the chance of default. The five C's of credit method of evaluating a borrower incorporates both qualitative and quantitative measures. Lenders look at a borrower's credit reports, credit score, income statements and other documents relevant to the borrower's financial situation, and they also consider information about the loan itself. a) Character
Sometimes called credit history, the first C refers to a borrower's reputation or record of accomplishment for repaying debts. This information appears on the borrower's credit reports these credit reports contain detailed information about how much an applicant has borrowed in the past and whether he has repaid his loans on time. These reports also contain information on collection accounts, judgments, liens, and bankruptcies
b) Capacity Capacity measures a borrower's ability to repay a loan by comparing income against recurring debts and assessing the borrower's debt-to-income (DTI) ratio. In addition to examining income, lenders look at the length of time an applicant has been at his job and job stability.
c) Capital Lenders also consider any capital the borrower puts toward a potential investment. A large contribution by the borrower decreases the chance of default. Down payments indicate the borrower's level of seriousness, which can make lenders more comfortable in extending credit.
d) Collateral Collateral can help a secure borrower loans. It assures the lender that if the borrower defaults on the loan, the lender can repossess the collateral. For example, car loans are secured by cars, and mortgages are secured by homes.
e) Conditions The conditions of the loan, such as its interest rate and amount of principal, influence the lender's desire to finance the borrower. Conditions refer to how a borrower intends to use the money. For example, if a borrower applies for a car loan or a home improvement loan, a lender may be more likely to approve those loans because of their specific purpose, rather than a signature loan that could be used for anything.”118
Out of the 5C’s listed above most women entrepreneurs will not be able to qualify for all factors except a few women entrepreneurs who have the financial credit history, capital, and collateral to borrow. When looking at the collaterals (tangible) women entrepreneurs are able to provide – 29% can provide land, 19% can provide building, 29% can provide movables and the remaining 23% can provide deposits. It is rare to find women entrepreneurs who can provide all of these collaterals; mostly they can only provide one. Another requirement that banks usually require is a personal guarantee, which is quite difficult to estimate and exercise, and the majority of women entrepreneurs do not wish to provide such a document as they do not understand the consequences and fear getting in problems. Because of the limitations of bank funding, most women entrepreneurs would like to have a mix of all types of funding options (50% of respondents) to create a diversified financing pool.
118
https://www.investopedia.com/terms/f/five-c-credit.asp
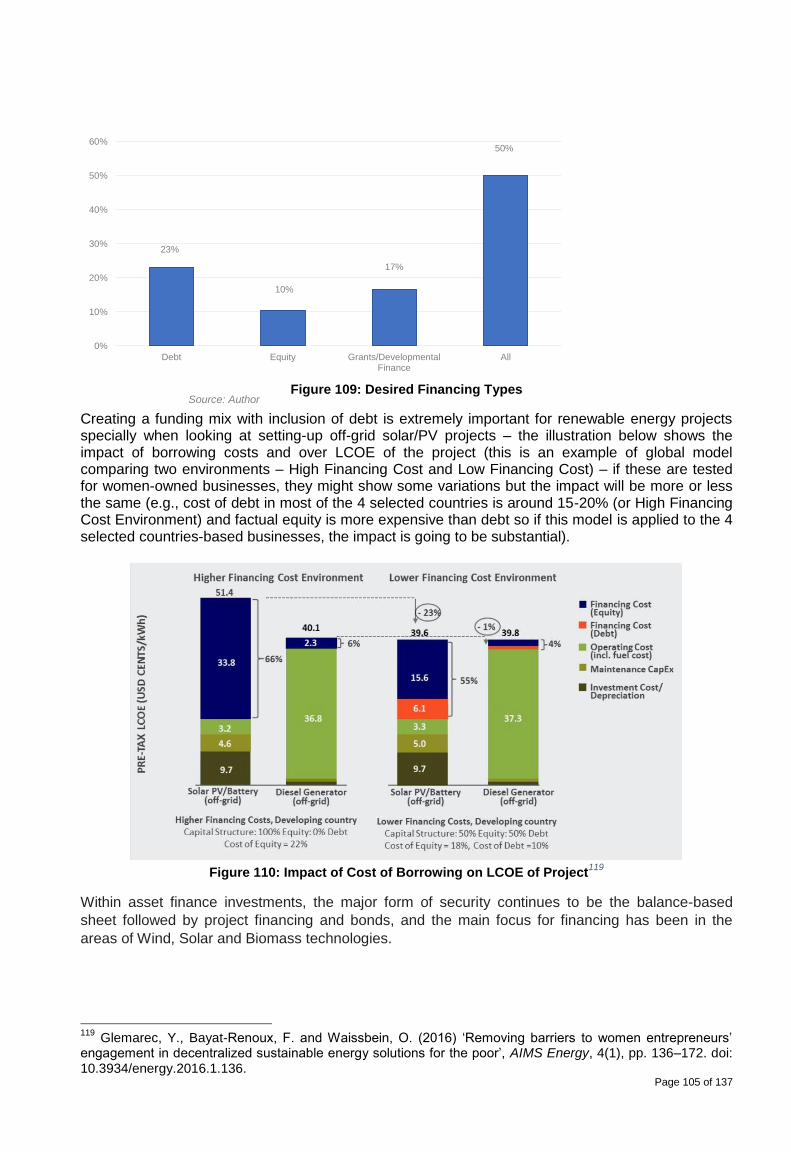
Page 105 of 137
Figure 109: Desired Financing Types
Creating a funding mix with inclusion of debt is extremely important for renewable energy projects specially when looking at setting-up off-grid solar/PV projects – the illustration below shows the impact of borrowing costs and over LCOE of the project (this is an example of global model comparing two environments – High Financing Cost and Low Financing Cost) – if these are tested for women-owned businesses, they might show some variations but the impact will be more or less the same (e.g., cost of debt in most of the 4 selected countries is around 15-20% (or High Financing Cost Environment) and factual equity is more expensive than debt so if this model is applied to the 4 selected countries-based businesses, the impact is going to be substantial).
Figure 110: Impact of Cost of Borrowing on LCOE of Project
119
Within asset finance investments, the major form of security continues to be the balance-based
sheet followed by project financing and bonds, and the main focus for financing has been in the
areas of Wind, Solar and Biomass technologies.
119
Glemarec, Y., Bayat-Renoux, F. and Waissbein, O. (2016) ‘Removing barriers to women entrepreneurs’ engagement in decentralized sustainable energy solutions for the poor’, AIMS Energy, 4(1), pp. 136–172. doi: 10.3934/energy.2016.1.136.
23%
10%
17%
50%
0%
10%
20%
30%
40%
50%
60%
Debt Equity Grants/DevelopmentalFinance
All
Source: Author
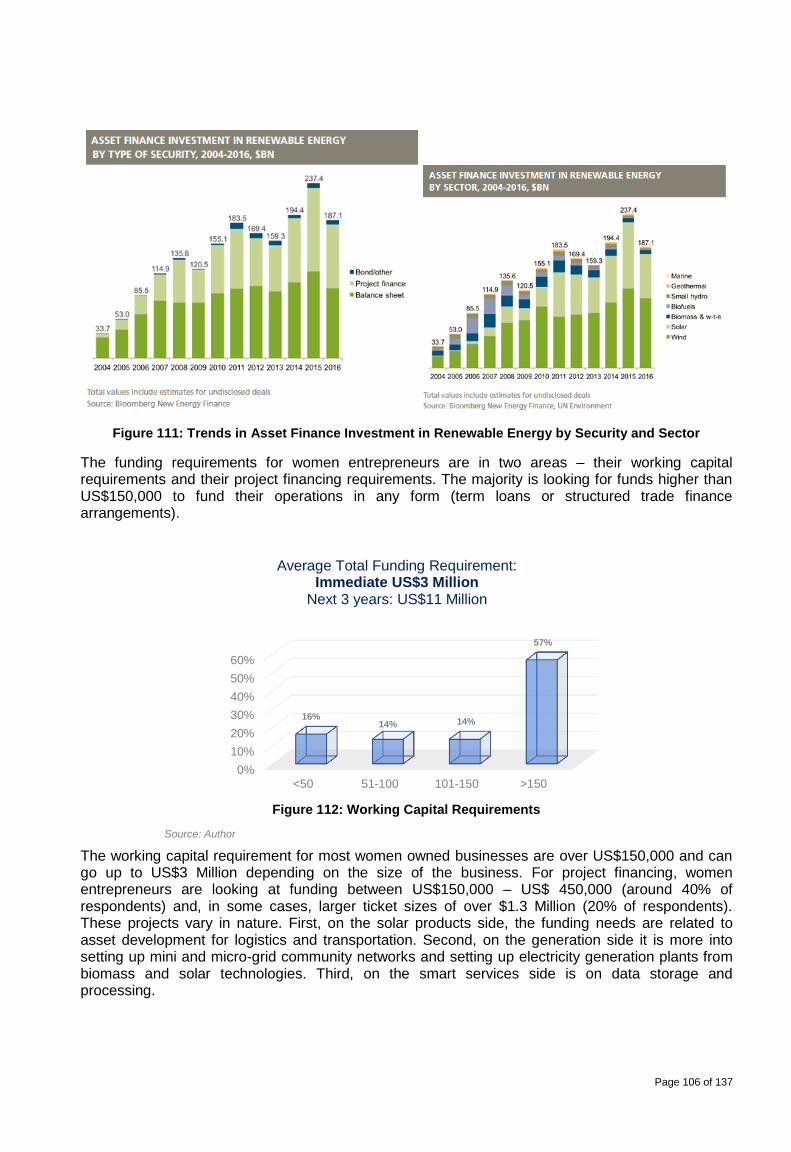
Page 106 of 137
Figure 111: Trends in Asset Finance Investment in Renewable Energy by Security and Sector
The funding requirements for women entrepreneurs are in two areas – their working capital requirements and their project financing requirements. The majority is looking for funds higher than US$150,000 to fund their operations in any form (term loans or structured trade finance arrangements).
Figure 112: Working Capital Requirements
The working capital requirement for most women owned businesses are over US$150,000 and can go up to US$3 Million depending on the size of the business. For project financing, women entrepreneurs are looking at funding between US$150,000 – US$ 450,000 (around 40% of respondents) and, in some cases, larger ticket sizes of over $1.3 Million (20% of respondents). These projects vary in nature. First, on the solar products side, the funding needs are related to asset development for logistics and transportation. Second, on the generation side it is more into setting up mini and micro-grid community networks and setting up electricity generation plants from biomass and solar technologies. Third, on the smart services side is on data storage and processing.
0%
10%
20%
30%
40%
50%
60%
<50 51-100 101-150 >150
16% 14% 14%
57%
Source: Author Source: ECREEE, 2018
Source: ECREEE, 2018
Average Total Funding Requirement: Immediate US$3 Million
Next 3 years: US$11 Million
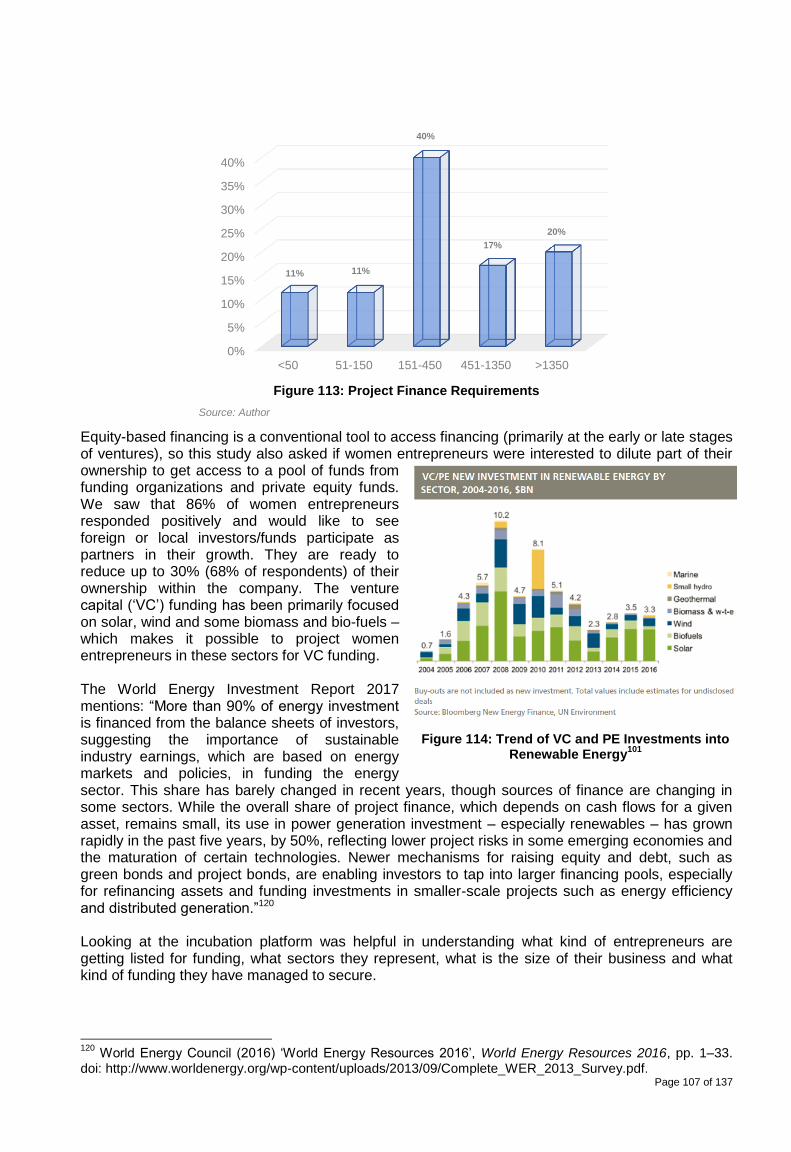
Page 107 of 137
Figure 114: Trend of VC and PE Investments into Renewable Energy
101
Figure 113: Project Finance Requirements
Equity-based financing is a conventional tool to access financing (primarily at the early or late stages of ventures), so this study also asked if women entrepreneurs were interested to dilute part of their ownership to get access to a pool of funds from funding organizations and private equity funds. We saw that 86% of women entrepreneurs responded positively and would like to see foreign or local investors/funds participate as partners in their growth. They are ready to reduce up to 30% (68% of respondents) of their ownership within the company. The venture capital (‘VC’) funding has been primarily focused on solar, wind and some biomass and bio-fuels – which makes it possible to project women entrepreneurs in these sectors for VC funding. The World Energy Investment Report 2017 mentions: “More than 90% of energy investment is financed from the balance sheets of investors, suggesting the importance of sustainable industry earnings, which are based on energy markets and policies, in funding the energy sector. This share has barely changed in recent years, though sources of finance are changing in some sectors. While the overall share of project finance, which depends on cash flows for a given asset, remains small, its use in power generation investment – especially renewables – has grown rapidly in the past five years, by 50%, reflecting lower project risks in some emerging economies and the maturation of certain technologies. Newer mechanisms for raising equity and debt, such as green bonds and project bonds, are enabling investors to tap into larger financing pools, especially for refinancing assets and funding investments in smaller-scale projects such as energy efficiency and distributed generation.”120 Looking at the incubation platform was helpful in understanding what kind of entrepreneurs are getting listed for funding, what sectors they represent, what is the size of their business and what kind of funding they have managed to secure.
120
World Energy Council (2016) ‘World Energy Resources 2016’, World Energy Resources 2016, pp. 1–33. doi: http://www.worldenergy.org/wp-content/uploads/2013/09/Complete_WER_2013_Survey.pdf.
0%
5%
10%
15%
20%
25%
30%
35%
40%
<50 51-150 151-450 451-1350 >1350
11% 11%
40%
17%
20%
Source: Author Source:
ECREEE, 2018
Source:
ECREEE, 2018
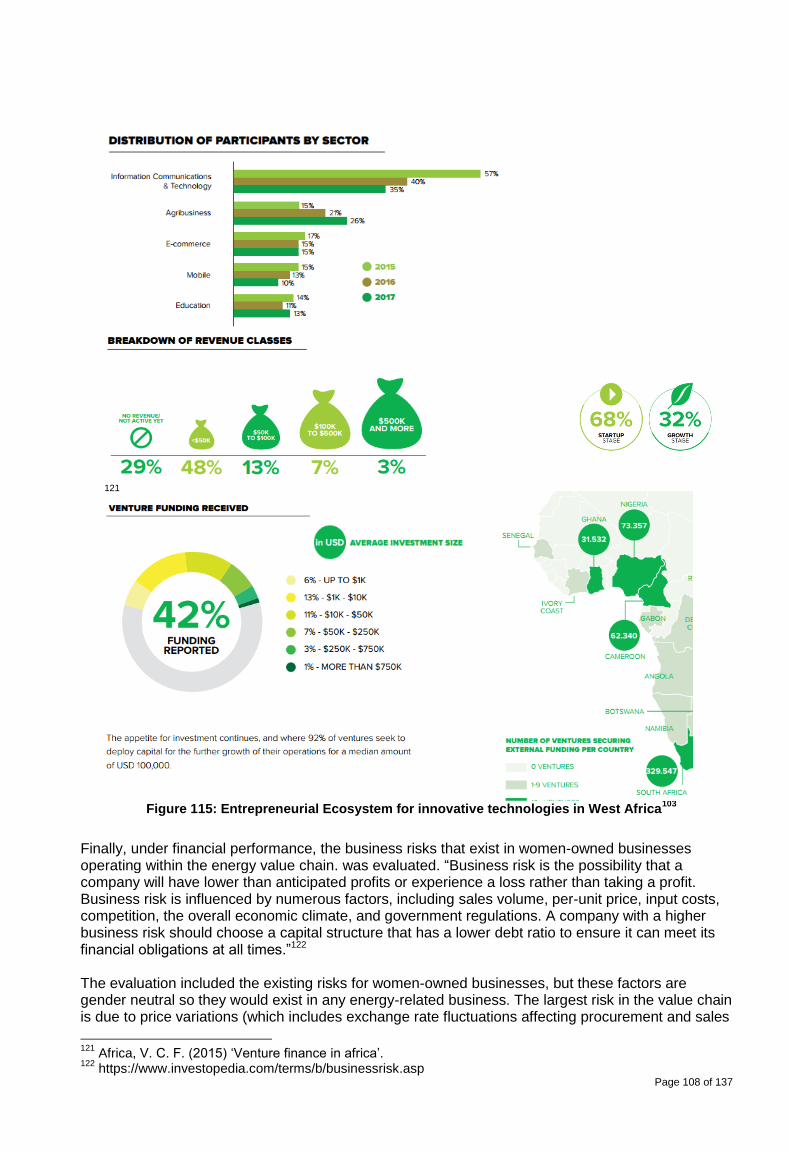
Page 108 of 137
121
Finally, under financial performance, the business risks that exist in women-owned businesses operating within the energy value chain. was evaluated. “Business risk is the possibility that a company will have lower than anticipated profits or experience a loss rather than taking a profit. Business risk is influenced by numerous factors, including sales volume, per-unit price, input costs, competition, the overall economic climate, and government regulations. A company with a higher business risk should choose a capital structure that has a lower debt ratio to ensure it can meet its financial obligations at all times.”122 The evaluation included the existing risks for women-owned businesses, but these factors are gender neutral so they would exist in any energy-related business. The largest risk in the value chain is due to price variations (which includes exchange rate fluctuations affecting procurement and sales
121
Africa, V. C. F. (2015) ‘Venture finance in africa’. 122
https://www.investopedia.com/terms/b/businessrisk.asp
Figure 115: Entrepreneurial Ecosystem for innovative technologies in West Africa103
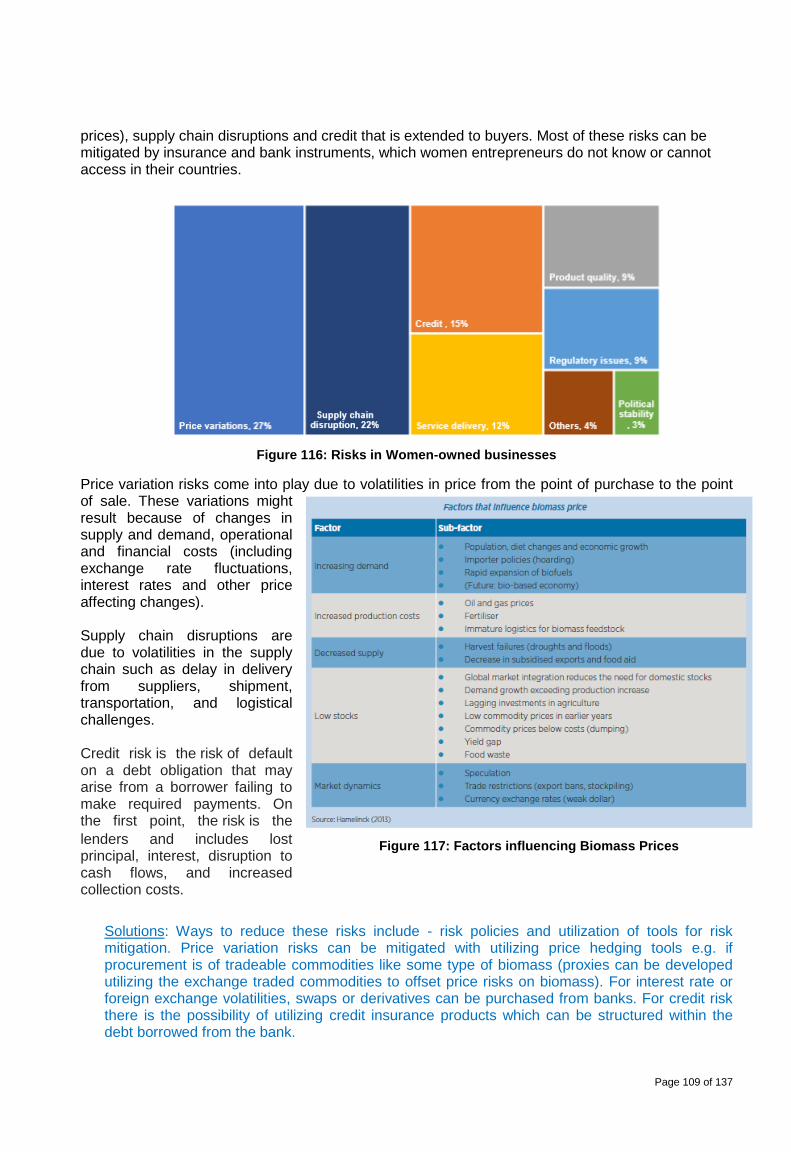
Page 109 of 137
Figure 117: Factors influencing Biomass Prices
prices), supply chain disruptions and credit that is extended to buyers. Most of these risks can be mitigated by insurance and bank instruments, which women entrepreneurs do not know or cannot access in their countries.
Figure 116: Risks in Women-owned businesses
Price variation risks come into play due to volatilities in price from the point of purchase to the point of sale. These variations might result because of changes in supply and demand, operational and financial costs (including exchange rate fluctuations, interest rates and other price affecting changes). Supply chain disruptions are due to volatilities in the supply chain such as delay in delivery from suppliers, shipment, transportation, and logistical challenges. Credit risk is the risk of default on a debt obligation that may arise from a borrower failing to make required payments. On the first point, the risk is the
lenders and includes lost principal, interest, disruption to cash flows, and increased collection costs.
Solutions: Ways to reduce these risks include - risk policies and utilization of tools for risk mitigation. Price variation risks can be mitigated with utilizing price hedging tools e.g. if procurement is of tradeable commodities like some type of biomass (proxies can be developed utilizing the exchange traded commodities to offset price risks on biomass). For interest rate or foreign exchange volatilities, swaps or derivatives can be purchased from banks. For credit risk there is the possibility of utilizing credit insurance products which can be structured within the debt borrowed from the bank.
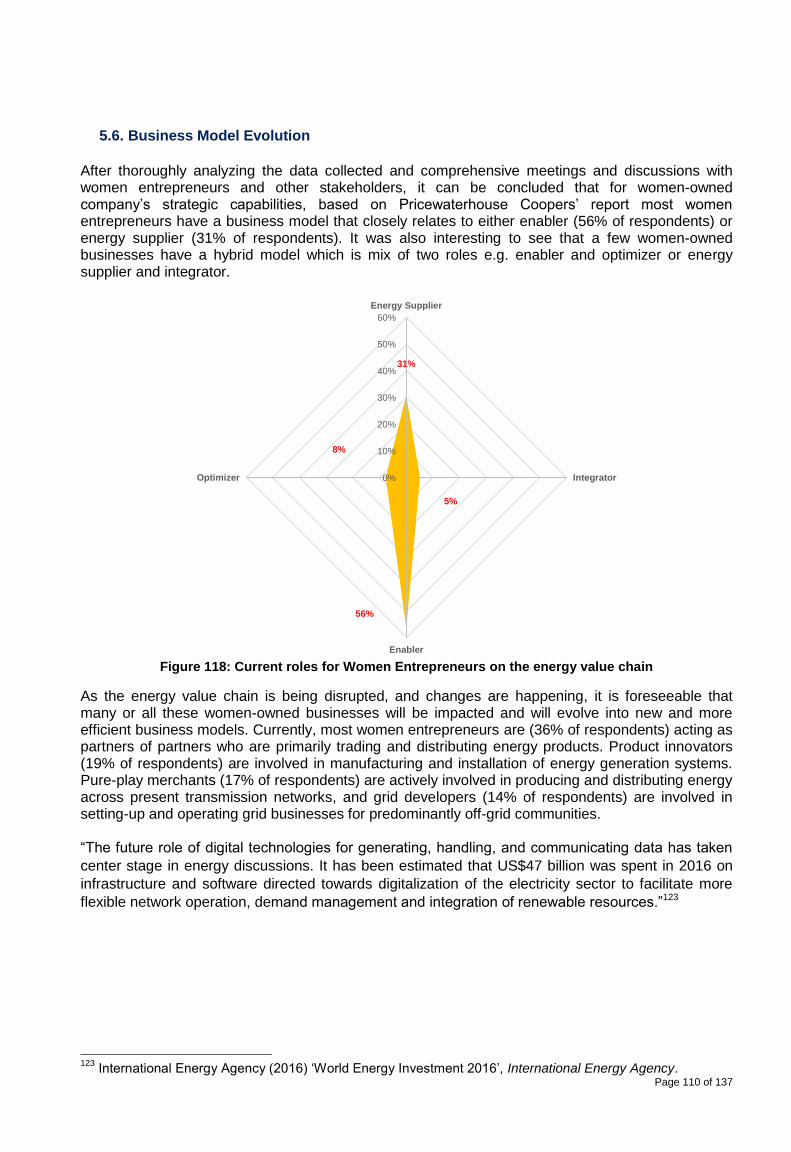
Page 110 of 137
5.6. Business Model Evolution
After thoroughly analyzing the data collected and comprehensive meetings and discussions with women entrepreneurs and other stakeholders, it can be concluded that for women-owned company’s strategic capabilities, based on Pricewaterhouse Coopers’ report most women entrepreneurs have a business model that closely relates to either enabler (56% of respondents) or energy supplier (31% of respondents). It was also interesting to see that a few women-owned businesses have a hybrid model which is mix of two roles e.g. enabler and optimizer or energy supplier and integrator.
Figure 118: Current roles for Women Entrepreneurs on the energy value chain
As the energy value chain is being disrupted, and changes are happening, it is foreseeable that many or all these women-owned businesses will be impacted and will evolve into new and more efficient business models. Currently, most women entrepreneurs are (36% of respondents) acting as partners of partners who are primarily trading and distributing energy products. Product innovators (19% of respondents) are involved in manufacturing and installation of energy generation systems. Pure-play merchants (17% of respondents) are actively involved in producing and distributing energy across present transmission networks, and grid developers (14% of respondents) are involved in setting-up and operating grid businesses for predominantly off-grid communities. “The future role of digital technologies for generating, handling, and communicating data has taken
center stage in energy discussions. It has been estimated that US$47 billion was spent in 2016 on
infrastructure and software directed towards digitalization of the electricity sector to facilitate more
flexible network operation, demand management and integration of renewable resources.”123
123
International Energy Agency (2016) ‘World Energy Investment 2016’, International Energy Agency.
31%
5%
56%
8%
0%
10%
20%
30%
40%
50%
60%
Energy Supplier
Integrator
Enabler
Optimizer
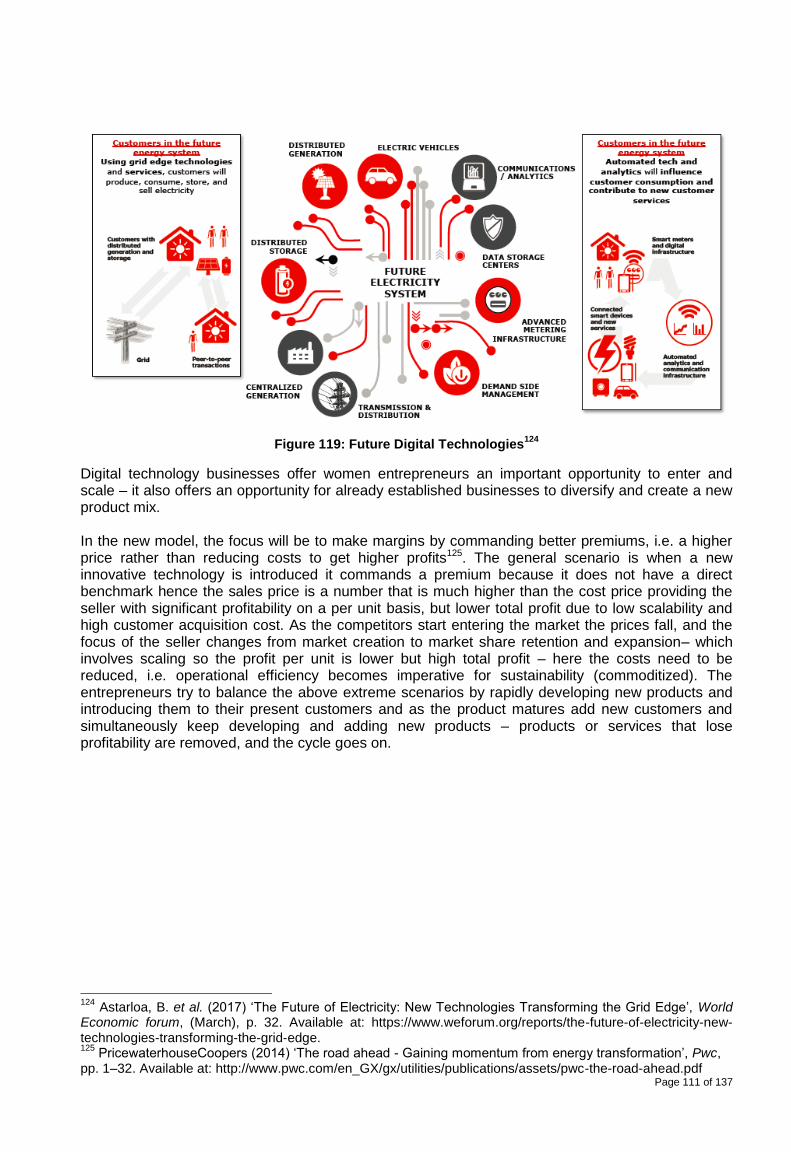
Page 111 of 137
Figure 119: Future Digital Technologies124
Digital technology businesses offer women entrepreneurs an important opportunity to enter and scale – it also offers an opportunity for already established businesses to diversify and create a new product mix. In the new model, the focus will be to make margins by commanding better premiums, i.e. a higher price rather than reducing costs to get higher profits125. The general scenario is when a new innovative technology is introduced it commands a premium because it does not have a direct benchmark hence the sales price is a number that is much higher than the cost price providing the seller with significant profitability on a per unit basis, but lower total profit due to low scalability and high customer acquisition cost. As the competitors start entering the market the prices fall, and the focus of the seller changes from market creation to market share retention and expansion– which involves scaling so the profit per unit is lower but high total profit – here the costs need to be reduced, i.e. operational efficiency becomes imperative for sustainability (commoditized). The entrepreneurs try to balance the above extreme scenarios by rapidly developing new products and introducing them to their present customers and as the product matures add new customers and simultaneously keep developing and adding new products – products or services that lose profitability are removed, and the cycle goes on.
124
Astarloa, B. et al. (2017) ‘The Future of Electricity: New Technologies Transforming the Grid Edge’, World Economic forum, (March), p. 32. Available at: https://www.weforum.org/reports/the-future-of-electricity-new-technologies-transforming-the-grid-edge. 125
PricewaterhouseCoopers (2014) ‘The road ahead - Gaining momentum from energy transformation’, Pwc, pp. 1–32. Available at: http://www.pwc.com/en_GX/gx/utilities/publications/assets/pwc-the-road-ahead.pdf
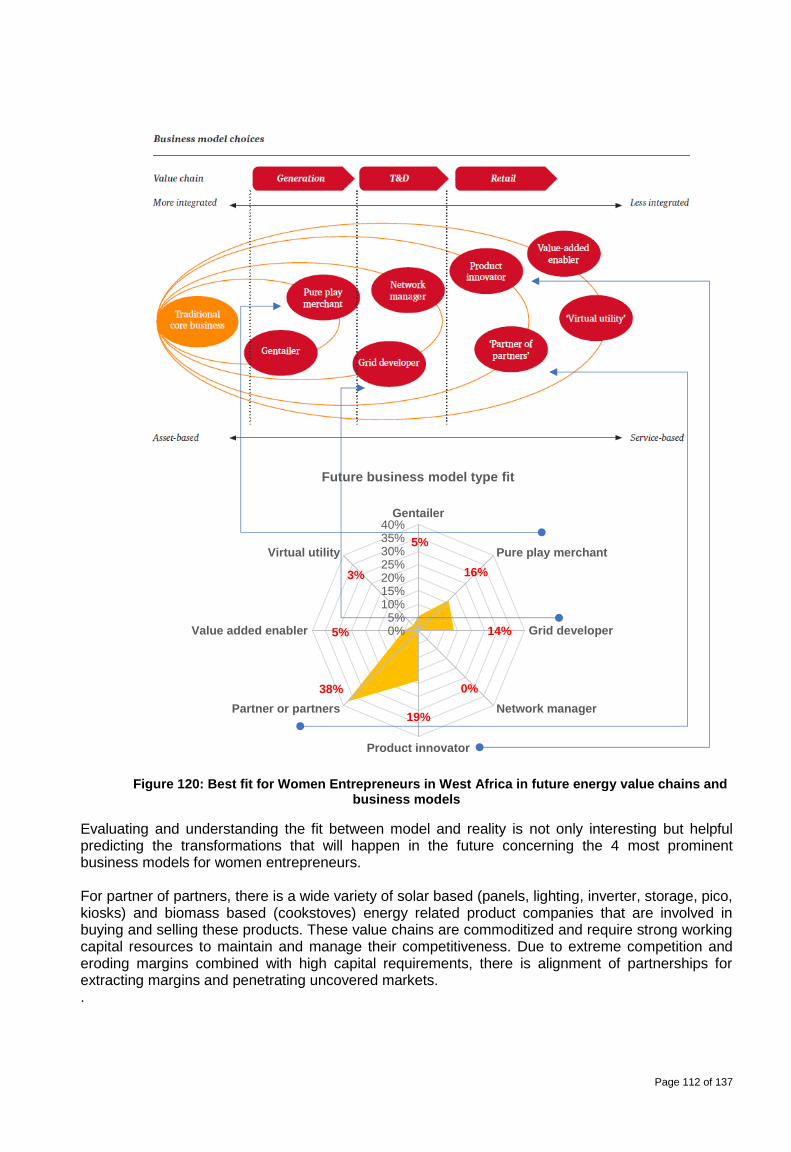
Page 112 of 137
Figure 120: Best fit for Women Entrepreneurs in West Africa in future energy value chains and
business models
Evaluating and understanding the fit between model and reality is not only interesting but helpful predicting the transformations that will happen in the future concerning the 4 most prominent business models for women entrepreneurs. For partner of partners, there is a wide variety of solar based (panels, lighting, inverter, storage, pico, kiosks) and biomass based (cookstoves) energy related product companies that are involved in buying and selling these products. These value chains are commoditized and require strong working capital resources to maintain and manage their competitiveness. Due to extreme competition and eroding margins combined with high capital requirements, there is alignment of partnerships for extracting margins and penetrating uncovered markets. .
5%
16%
14%
0%
19%
38%
5%
3%
0%5%
10%15%20%25%30%35%40%
Gentailer
Pure play merchant
Grid developer
Network manager
Product innovator
Partner or partners
Value added enabler
Virtual utility
Future business model type fit
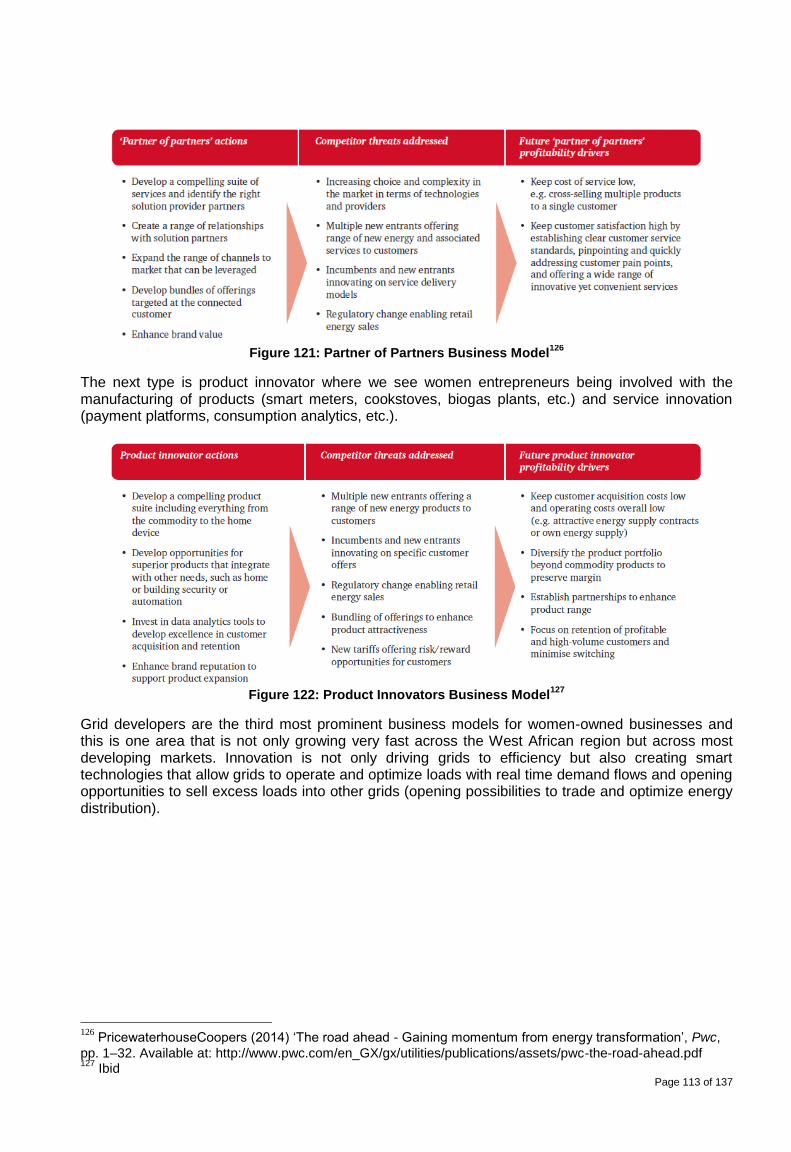
Page 113 of 137
Figure 121: Partner of Partners Business Model
126
The next type is product innovator where we see women entrepreneurs being involved with the manufacturing of products (smart meters, cookstoves, biogas plants, etc.) and service innovation (payment platforms, consumption analytics, etc.).
Figure 122: Product Innovators Business Model
127
Grid developers are the third most prominent business models for women-owned businesses and this is one area that is not only growing very fast across the West African region but across most developing markets. Innovation is not only driving grids to efficiency but also creating smart technologies that allow grids to operate and optimize loads with real time demand flows and opening opportunities to sell excess loads into other grids (opening possibilities to trade and optimize energy distribution).
126
PricewaterhouseCoopers (2014) ‘The road ahead - Gaining momentum from energy transformation’, Pwc,
pp. 1–32. Available at: http://www.pwc.com/en_GX/gx/utilities/publications/assets/pwc-the-road-ahead.pdf 127
Ibid
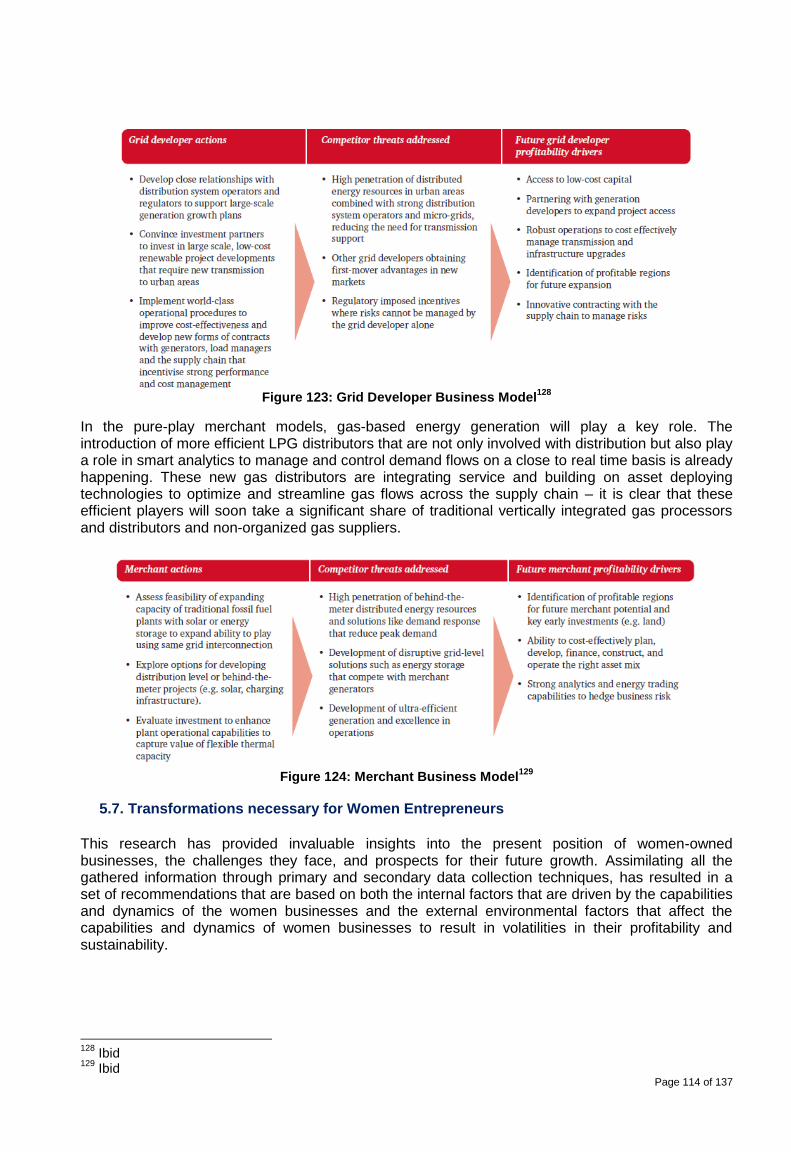
Page 114 of 137
Figure 123: Grid Developer Business Model
128
In the pure-play merchant models, gas-based energy generation will play a key role. The introduction of more efficient LPG distributors that are not only involved with distribution but also play a role in smart analytics to manage and control demand flows on a close to real time basis is already happening. These new gas distributors are integrating service and building on asset deploying technologies to optimize and streamline gas flows across the supply chain – it is clear that these efficient players will soon take a significant share of traditional vertically integrated gas processors and distributors and non-organized gas suppliers.
Figure 124: Merchant Business Model
129
5.7. Transformations necessary for Women Entrepreneurs
This research has provided invaluable insights into the present position of women-owned businesses, the challenges they face, and prospects for their future growth. Assimilating all the gathered information through primary and secondary data collection techniques, has resulted in a set of recommendations that are based on both the internal factors that are driven by the capabilities and dynamics of the women businesses and the external environmental factors that affect the capabilities and dynamics of women businesses to result in volatilities in their profitability and sustainability.
128
Ibid 129
Ibid
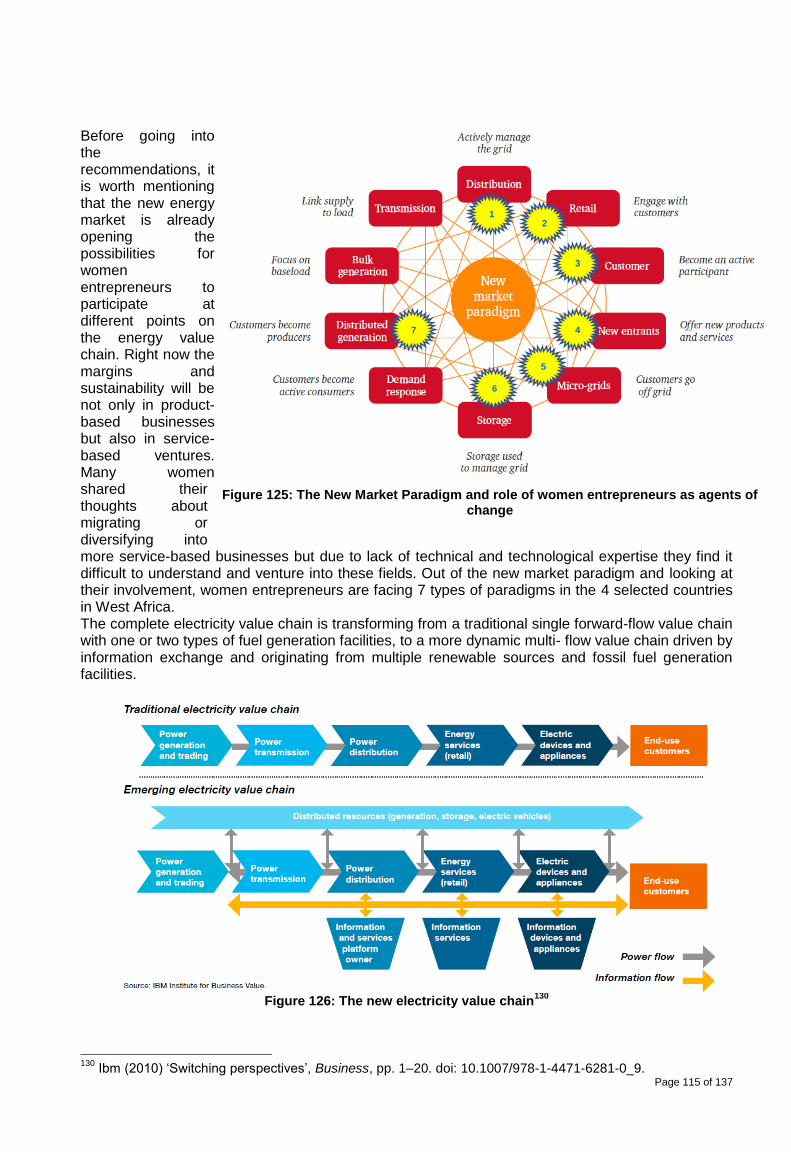
Page 115 of 137
Figure 125: The New Market Paradigm and role of women entrepreneurs as agents of change
Before going into the recommendations, it is worth mentioning that the new energy market is already opening the possibilities for women entrepreneurs to participate at different points on the energy value chain. Right now the margins and sustainability will be not only in product-based businesses but also in service-based ventures. Many women shared their thoughts about migrating or diversifying into more service-based businesses but due to lack of technical and technological expertise they find it difficult to understand and venture into these fields. Out of the new market paradigm and looking at their involvement, women entrepreneurs are facing 7 types of paradigms in the 4 selected countries in West Africa. The complete electricity value chain is transforming from a traditional single forward-flow value chain with one or two types of fuel generation facilities, to a more dynamic multi- flow value chain driven by information exchange and originating from multiple renewable sources and fossil fuel generation facilities.
Figure 126: The new electricity value chain
130
130
Ibm (2010) ‘Switching perspectives’, Business, pp. 1–20. doi: 10.1007/978-1-4471-6281-0_9.
1 2
3
4
5
6
7
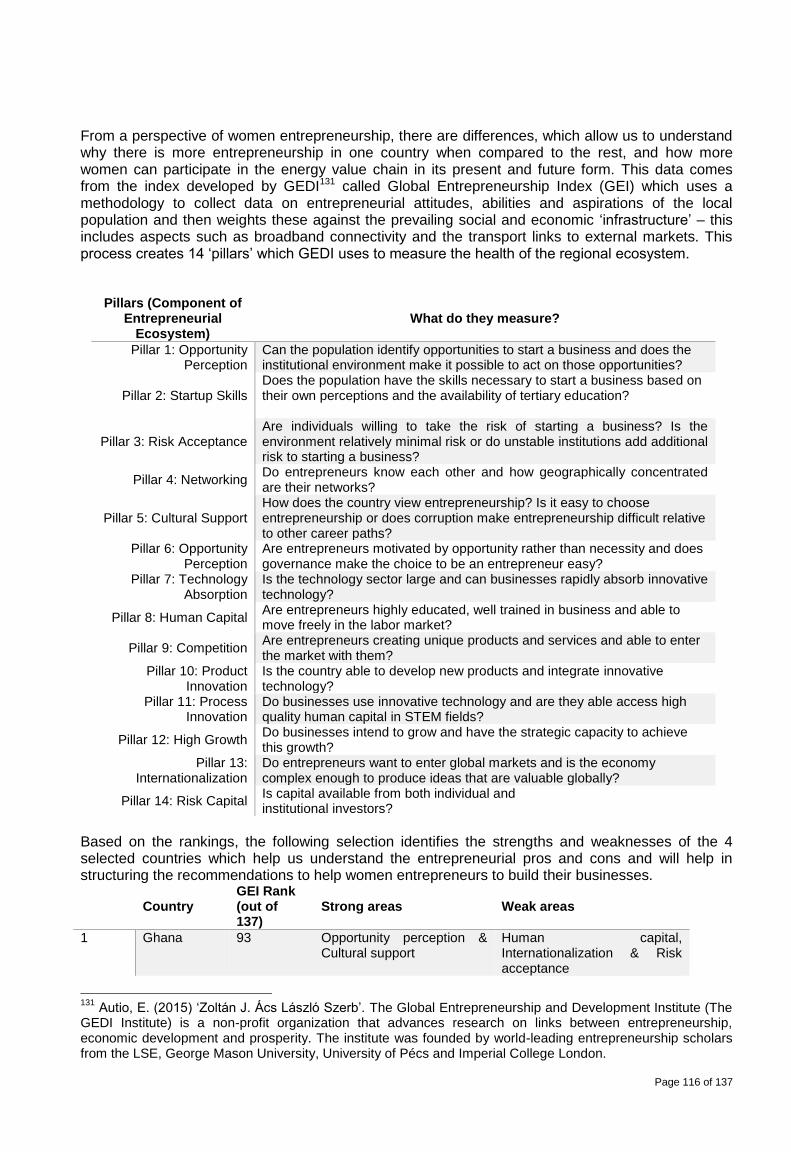
Page 116 of 137
From a perspective of women entrepreneurship, there are differences, which allow us to understand why there is more entrepreneurship in one country when compared to the rest, and how more women can participate in the energy value chain in its present and future form. This data comes from the index developed by GEDI131 called Global Entrepreneurship Index (GEI) which uses a methodology to collect data on entrepreneurial attitudes, abilities and aspirations of the local population and then weights these against the prevailing social and economic ‘infrastructure’ – this includes aspects such as broadband connectivity and the transport links to external markets. This process creates 14 ‘pillars’ which GEDI uses to measure the health of the regional ecosystem.
Pillars (Component of Entrepreneurial
Ecosystem) What do they measure?
Pillar 1: Opportunity Perception
Can the population identify opportunities to start a business and does the institutional environment make it possible to act on those opportunities?
Pillar 2: Startup Skills Does the population have the skills necessary to start a business based on their own perceptions and the availability of tertiary education?
Pillar 3: Risk Acceptance Are individuals willing to take the risk of starting a business? Is the environment relatively minimal risk or do unstable institutions add additional risk to starting a business?
Pillar 4: Networking Do entrepreneurs know each other and how geographically concentrated are their networks?
Pillar 5: Cultural Support How does the country view entrepreneurship? Is it easy to choose entrepreneurship or does corruption make entrepreneurship difficult relative to other career paths?
Pillar 6: Opportunity Perception
Are entrepreneurs motivated by opportunity rather than necessity and does governance make the choice to be an entrepreneur easy?
Pillar 7: Technology Absorption
Is the technology sector large and can businesses rapidly absorb innovative technology?
Pillar 8: Human Capital Are entrepreneurs highly educated, well trained in business and able to move freely in the labor market?
Pillar 9: Competition Are entrepreneurs creating unique products and services and able to enter the market with them?
Pillar 10: Product Innovation
Is the country able to develop new products and integrate innovative technology?
Pillar 11: Process Innovation
Do businesses use innovative technology and are they able access high quality human capital in STEM fields?
Pillar 12: High Growth Do businesses intend to grow and have the strategic capacity to achieve this growth?
Pillar 13: Internationalization
Do entrepreneurs want to enter global markets and is the economy complex enough to produce ideas that are valuable globally?
Pillar 14: Risk Capital Is capital available from both individual and institutional investors?
Based on the rankings, the following selection identifies the strengths and weaknesses of the 4 selected countries which help us understand the entrepreneurial pros and cons and will help in structuring the recommendations to help women entrepreneurs to build their businesses.
Country GEI Rank (out of 137)
Strong areas Weak areas
1 Ghana 93 Opportunity perception & Cultural support
Human capital, Internationalization & Risk acceptance
131
Autio, E. (2015) ‘Zoltán J. Ács László Szerb’. The Global Entrepreneurship and Development Institute (The GEDI Institute) is a non-profit organization that advances research on links between entrepreneurship, economic development and prosperity. The institute was founded by world-leading entrepreneurship scholars from the LSE, George Mason University, University of Pécs and Imperial College London.
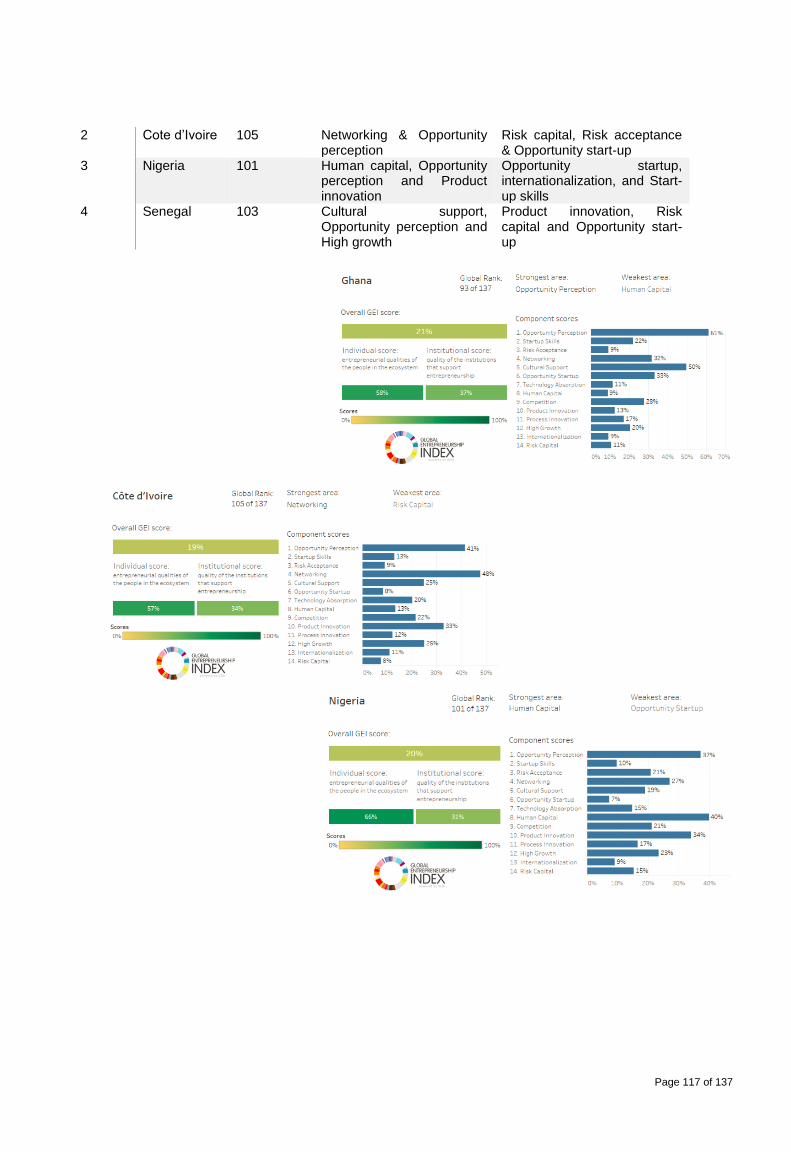
Page 117 of 137
2 Cote d’Ivoire 105 Networking & Opportunity perception
Risk capital, Risk acceptance & Opportunity start-up
3 Nigeria 101 Human capital, Opportunity perception and Product innovation
Opportunity startup, internationalization, and Start-up skills
4 Senegal 103 Cultural support, Opportunity perception and High growth
Product innovation, Risk capital and Opportunity start-up
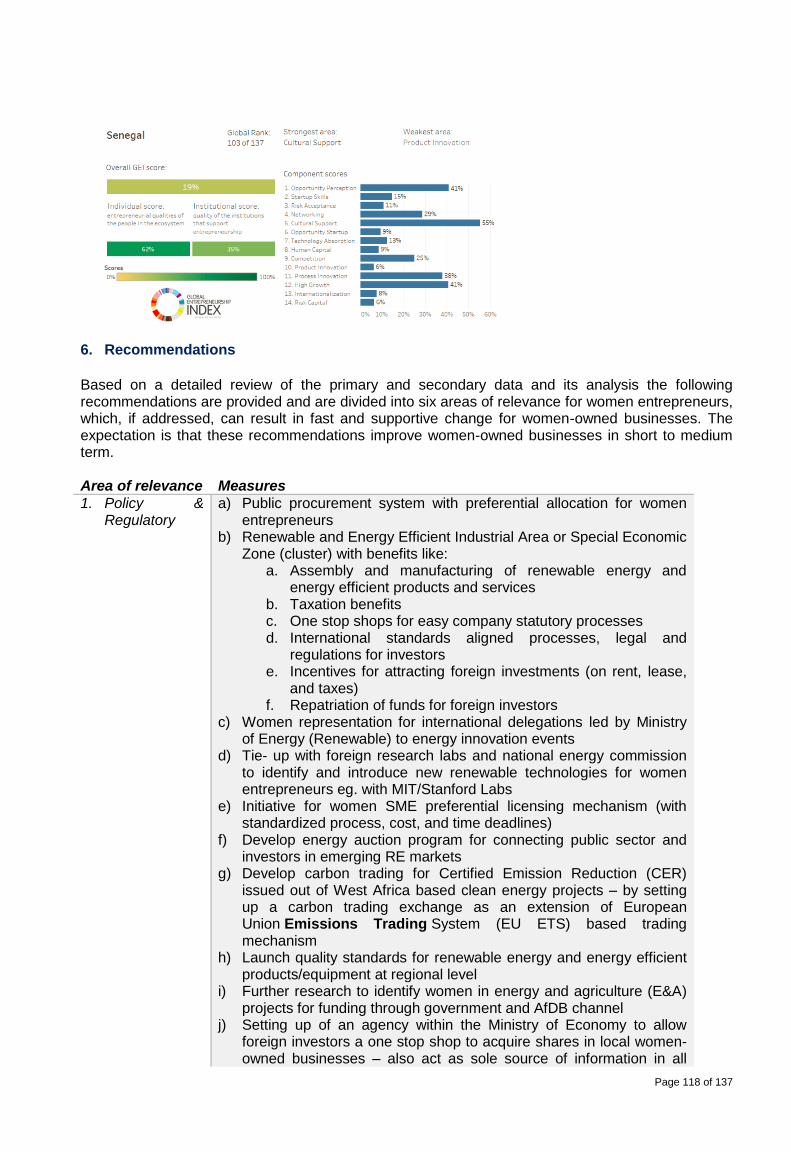
Page 118 of 137
6. Recommendations
Based on a detailed review of the primary and secondary data and its analysis the following recommendations are provided and are divided into six areas of relevance for women entrepreneurs, which, if addressed, can result in fast and supportive change for women-owned businesses. The expectation is that these recommendations improve women-owned businesses in short to medium term.
Area of relevance Measures
1. Policy & Regulatory
a) Public procurement system with preferential allocation for women entrepreneurs
b) Renewable and Energy Efficient Industrial Area or Special Economic Zone (cluster) with benefits like:
a. Assembly and manufacturing of renewable energy and energy efficient products and services
b. Taxation benefits c. One stop shops for easy company statutory processes d. International standards aligned processes, legal and
regulations for investors e. Incentives for attracting foreign investments (on rent, lease,
and taxes) f. Repatriation of funds for foreign investors
c) Women representation for international delegations led by Ministry of Energy (Renewable) to energy innovation events
d) Tie- up with foreign research labs and national energy commission to identify and introduce new renewable technologies for women entrepreneurs eg. with MIT/Stanford Labs
e) Initiative for women SME preferential licensing mechanism (with standardized process, cost, and time deadlines)
f) Develop energy auction program for connecting public sector and investors in emerging RE markets
g) Develop carbon trading for Certified Emission Reduction (CER) issued out of West Africa based clean energy projects – by setting up a carbon trading exchange as an extension of European Union Emissions Trading System (EU ETS) based trading mechanism
h) Launch quality standards for renewable energy and energy efficient products/equipment at regional level
i) Further research to identify women in energy and agriculture (E&A) projects for funding through government and AfDB channel
j) Setting up of an agency within the Ministry of Economy to allow foreign investors a one stop shop to acquire shares in local women-owned businesses – also act as sole source of information in all

Page 119 of 137
issues related to foreign investments in local companies
2. Operational a) Supply chain related training program for women entrepreneurs b) Provide supply chain software/s at subsidized prices for women
entrepreneurs c) Develop an operating manual for women business that can offer a
blueprint of operations and can be used to train employees
3. Commercial a) Contracting and public vendor participation training b) Comprehensive training on legal aspects of company operations –
registration, operation, franchising/agency, and financials c) Training on tax planning for SMEs
4. Technological a) Setting up an energy focused incubation center with a regional and women focus
b) International tie-ups to knowledge transfer private commercialized technologies
c) Setting up of stringent patent regime to allow women entrepreneurs to register patents
5. Human Resource
a) Technical training on different energy system – installation and maintenance
b) Financial training on managing financial accounts c) Create entrepreneurial universities focusing on women in energy
and adjacent other sectors (like smart technologies, software, e-commerce, etc.)
d) Peer to peer mentorship program can be launched whereby some successful women entrepreneurs can act as mentors to other women entrepreneurs
6. Financial a) Set-up a quarterly bank and women entrepreneurs network event b) Banks to provide training on banking products and their application
to women-owned businesses c) Provide multi-lateral banks backed facility to commercial banks for
risk shared provisions (AfDB/bi-lateral or multi-lateral bank backed facility)
d) Provide structured products that can lift the risk from balance sheet to inventory and receivables
e) Set-up credit rating agency (CRA) for energy related companies f) Create a partnership of local commercial banks with export credit
agency in the exporting country focused at women-owned businesses
g) Commercial banks may open specialized women banking branch to focus and extend funding solutions created for women entrepreneurs132
132
https://www.abl.com/personal-banking/theme-branches/women-banking/, https://www.rblbank.com/category/Small-Business-Loans, http://www.womensbank.co.tz, http://www.covenantbank.co.tz/bank/about, http://www.akdn.org/press-release/first-microfinance-bank-fmfb-opens-branch-women-only-first-country, https://www.sewabank.com, https://www.kwftbank.com, http://www.wwbg.com.gh/products.php
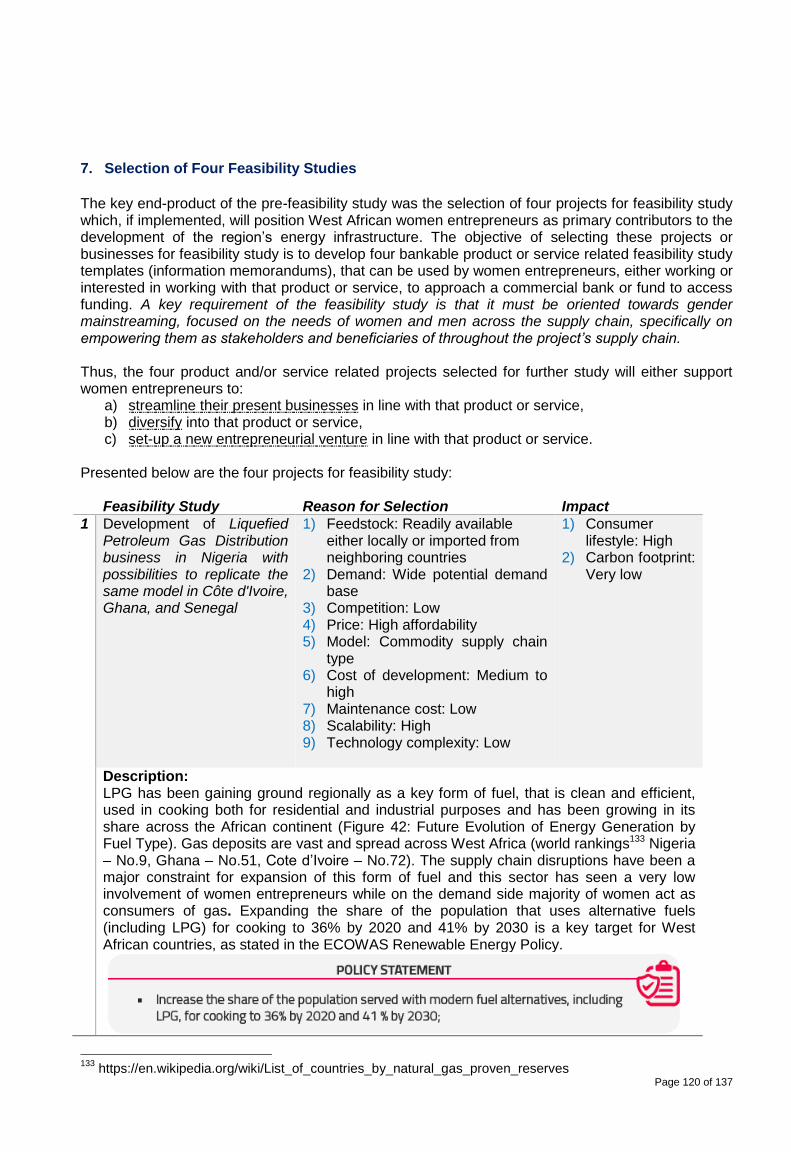
Page 120 of 137
7. Selection of Four Feasibility Studies
The key end-product of the pre-feasibility study was the selection of four projects for feasibility study which, if implemented, will position West African women entrepreneurs as primary contributors to the development of the region’s energy infrastructure. The objective of selecting these projects or businesses for feasibility study is to develop four bankable product or service related feasibility study templates (information memorandums), that can be used by women entrepreneurs, either working or interested in working with that product or service, to approach a commercial bank or fund to access funding. A key requirement of the feasibility study is that it must be oriented towards gender mainstreaming, focused on the needs of women and men across the supply chain, specifically on empowering them as stakeholders and beneficiaries of throughout the project’s supply chain. Thus, the four product and/or service related projects selected for further study will either support women entrepreneurs to:
a) streamline their present businesses in line with that product or service, b) diversify into that product or service, c) set-up a new entrepreneurial venture in line with that product or service.
Presented below are the four projects for feasibility study: Feasibility Study Reason for Selection Impact
1 Development of Liquefied Petroleum Gas Distribution business in Nigeria with possibilities to replicate the same model in Côte d'Ivoire, Ghana, and Senegal
1) Feedstock: Readily available either locally or imported from neighboring countries
2) Demand: Wide potential demand base
3) Competition: Low 4) Price: High affordability 5) Model: Commodity supply chain
type 6) Cost of development: Medium to
high 7) Maintenance cost: Low 8) Scalability: High 9) Technology complexity: Low
1) Consumer lifestyle: High
2) Carbon footprint: Very low
Description: LPG has been gaining ground regionally as a key form of fuel, that is clean and efficient, used in cooking both for residential and industrial purposes and has been growing in its share across the African continent (Figure 42: Future Evolution of Energy Generation by Fuel Type). Gas deposits are vast and spread across West Africa (world rankings133 Nigeria – No.9, Ghana – No.51, Cote d’Ivoire – No.72). The supply chain disruptions have been a major constraint for expansion of this form of fuel and this sector has seen a very low involvement of women entrepreneurs while on the demand side majority of women act as consumers of gas. Expanding the share of the population that uses alternative fuels (including LPG) for cooking to 36% by 2020 and 41% by 2030 is a key target for West African countries, as stated in the ECOWAS Renewable Energy Policy.
133
https://en.wikipedia.org/wiki/List_of_countries_by_natural_gas_proven_reserves

Page 121 of 137
The primary research at the pre-feasibility stage shows that women are interested in developing LPG businesses (with it being the third preferable energy source) but are not aware of the operational, technological and financial challenges associated with the business. There are also women entrepreneurs that have already ventured into manufacturing LPG stoves and participating (at a limited scale) in LPG distribution. These women and others see a business opportunity in the vertical integration of LPG into their present LPG stove distribution business. Already working closely with the primary present and future consumers of LPG, which are also women, these women entrepreneurs are well-equipped to understand the consumer demand. However, they need support in managing the intricacies of an LPG distribution business. Scope: The scope of this feasibility study is to evaluate the complete supply chain of LPG from production to distribution. This will involve in-depth profiling of product, supply chain, margins, business model, organizational capabilities and structure, complexities, investment opportunities on the supply chain, risks, and financials for setting up and running an LPG distribution business. The geographic focus of the study will be Nigeria (as Nigeria is presently the largest producer, exporter, and consumer of gas in the West African region with the highest potential for demand growth) but it should also look into how similar businesses can be replicated in the other three countries, i.e. Senegal, Ghana, and Cote d’Ivoire. The study should also look at possibilities of expanding into the selling of gas stoves and gas cylinders alongwith gas filling. On the project development side it should look at investments for setting up gas filling and storage sites. Deliverable: A bankable document - ‘Information Memorandum’ that can be presented to banks or funds for lending or participation.
Feasibility Study Reason for Selection Impact
2 Development of a Solar based electricity generation system and solar lighting product distribution business in Ghana with possibilities to replicate in Nigeria, Cote d’Ivoire, and Senegal
1) Product: Import 2) Demand: Wide potential demand
base 3) Competition: High 4) Price: High affordability 5) Model: Commodity supply chain
type 6) Cost of development: Low 7) Maintenance cost: Low 8) Scalability: High 9) Technology complexity: Low
1) Consumer lifestyle: Medium
2) Carbon footprint: Very low
Description: Solar based electricity generation systems (solar panels, storage batteries, inverters and converters) and solar lighting has been gaining ground regionally as a key form of renewable energy source, that is freely and widely available, used for both electricity generation and lighting across residential and industrial purposes (Figure 72: Estimates of Renewable Energy Potential in West Africa). Solar based electricity generation systems and solar lighting products have been gaining imports and penetrated across West Africa providing the best off-grid and on-grid electricity.
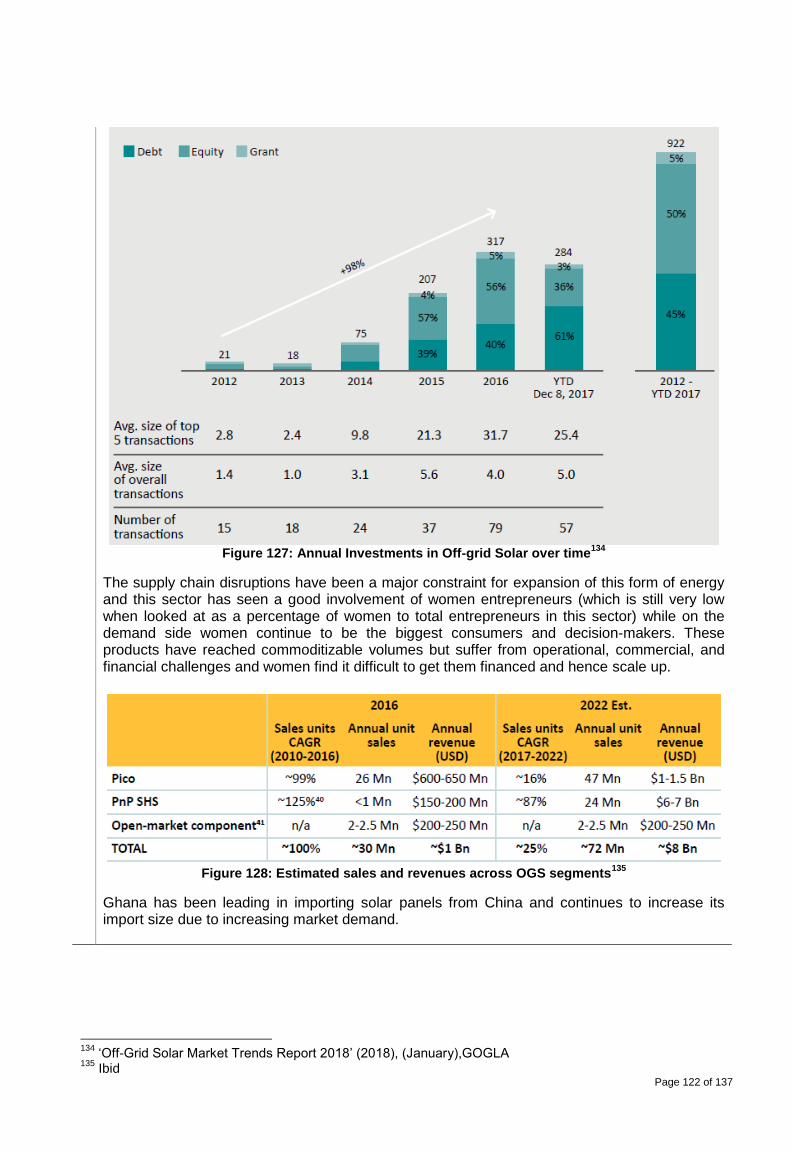
Page 122 of 137
Figure 127: Annual Investments in Off-grid Solar over time
134
The supply chain disruptions have been a major constraint for expansion of this form of energy and this sector has seen a good involvement of women entrepreneurs (which is still very low when looked at as a percentage of women to total entrepreneurs in this sector) while on the demand side women continue to be the biggest consumers and decision-makers. These products have reached commoditizable volumes but suffer from operational, commercial, and financial challenges and women find it difficult to get them financed and hence scale up.
Figure 128: Estimated sales and revenues across OGS segments
135
Ghana has been leading in importing solar panels from China and continues to increase its import size due to increasing market demand.
134
‘Off-Grid Solar Market Trends Report 2018’ (2018), (January),GOGLA 135
Ibid

Page 123 of 137
Figure 129: Solar Panel Imports from China in thousand units (Q42016-Q32017)
Figure 130: Survey of Key Barriers to growth of OGS industry
136
Scope:
The scope of this feasibility study is to evaluate the complete supply chain of solar based electricity production systems and solar lighting products from manufacturing, import, storage to distribution. This will involve in-depth profiling of product, supply chain, margins, business model, organizational capabilities and structure, complexities, investment opportunities on the supply chain (including assembly facilities within Ghana), risks and financials for setting up and running a Solar based electricity generation systems and solar lighting products distribution business. The geographic focus of the study will be Ghana. However the study will also look into how similar businesses can be replicated in the other three countries i.e. Senegal, Nigeria, and Cote d’Ivoire. Deliverable: A bankable document - ‘Information Memorandum’ that can be presented to banks or funds for lending or participation.
136
‘Off-Grid Solar Market Trends Report 2018’ (2018), (January),GOGLA
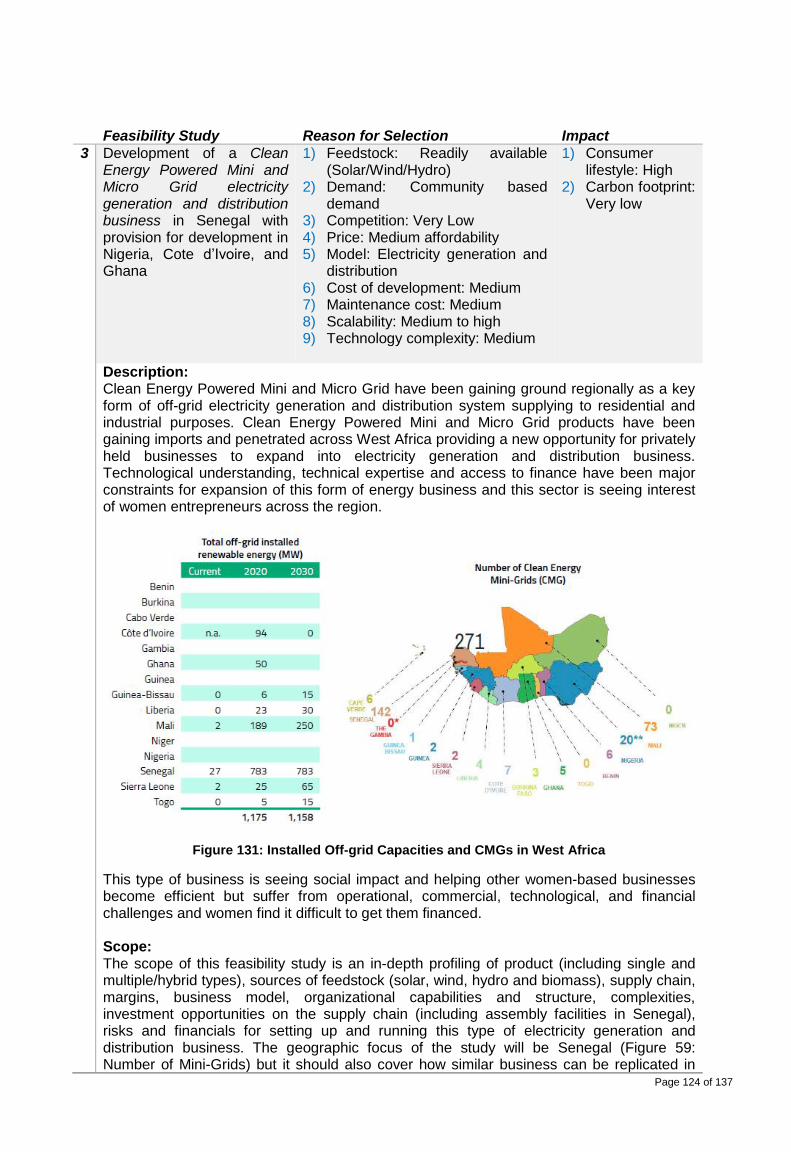
Page 124 of 137
Feasibility Study Reason for Selection Impact
3 Development of a Clean Energy Powered Mini and Micro Grid electricity generation and distribution business in Senegal with provision for development in Nigeria, Cote d’Ivoire, and Ghana
1) Feedstock: Readily available (Solar/Wind/Hydro)
2) Demand: Community based demand
3) Competition: Very Low 4) Price: Medium affordability 5) Model: Electricity generation and
distribution 6) Cost of development: Medium 7) Maintenance cost: Medium 8) Scalability: Medium to high 9) Technology complexity: Medium
1) Consumer lifestyle: High
2) Carbon footprint: Very low
Description: Clean Energy Powered Mini and Micro Grid have been gaining ground regionally as a key form of off-grid electricity generation and distribution system supplying to residential and industrial purposes. Clean Energy Powered Mini and Micro Grid products have been gaining imports and penetrated across West Africa providing a new opportunity for privately held businesses to expand into electricity generation and distribution business. Technological understanding, technical expertise and access to finance have been major constraints for expansion of this form of energy business and this sector is seeing interest of women entrepreneurs across the region.
Figure 131: Installed Off-grid Capacities and CMGs in West Africa
This type of business is seeing social impact and helping other women-based businesses become efficient but suffer from operational, commercial, technological, and financial challenges and women find it difficult to get them financed. Scope: The scope of this feasibility study is an in-depth profiling of product (including single and multiple/hybrid types), sources of feedstock (solar, wind, hydro and biomass), supply chain, margins, business model, organizational capabilities and structure, complexities, investment opportunities on the supply chain (including assembly facilities in Senegal), risks and financials for setting up and running this type of electricity generation and distribution business. The geographic focus of the study will be Senegal (Figure 59: Number of Mini-Grids) but it should also cover how similar business can be replicated in
Page 125 of 137
other three countries i.e. Ghana, Nigeria and Cote d’Ivoire. Deliverable: A bankable document - ‘Information Memorandum’ that can be presented to banks or funds for lending or participation.
Feasibility Study Reason for Selection Impact
4 Identification and development of Smart Applications for Energy Consumers in Cote d’Ivoire with possibilities to replicate in Senegal, Nigeria, and Ghana
1) Product: Locally developed 2) Demand: Wide potential demand
base 3) Competition: Low 4) Price: High affordability 5) Model: Payment on transaction
and advertisement revenue 6) Cost of development: Low 7) Maintenance cost: Low 8) Scalability: High 9) Technology complexity: High
1) Consumer lifestyle: High
2) Carbon footprint: No
Description: Smart applications137 have been gaining ground as provider and integrator of value addition services between generation, transmission, storage, and distribution system involving residential and industrial customers. Smart applications are expanding very fast due to digitalization infrastructure growth and penetration (Figure 21: Digitalization Infrastructure-1 (out of 100)Figure 22: Digitalization Infrastructure-2Figure 23: Digitalization Infrastructure-3) across West Africa. There has been entry of technically sound and enterprising new generation of entrepreneurs (Figure 54: Start-Up Entrepreneurs across West Africa (as listed on vc4a.com)) and they are materializing opportunities on the energy value chain by utilizing ICT and impacting businesses
Figure 24: Innovation Achievers in Sub-Saharan Africa, Figure 25: Innovation Profile (rankings out of 127)) and electricity flows. These kind of smart applications are primarily structured around demand side of the energy value chain providing services like – data analytics, payment mechanics, electricity trading and demand planning. The business model of this kind of business will involve coding (developing), deploying and running a smart app or platform that will target either B2B customers like power distribution companies or B2C consumers that are residential and industrial electricity consumers.
137
The term smart process application was coined by analysts at Forrester Research Inc. As the demand for business
agility -- and therefore business process software -- increases, smart process applications are expected to change the way employees create, manage and interact with business rules.
To be considered a smart process application, the software must have five key attributes:
Imported or embedded awareness data relevant to the business activity.
A collaboration platform on which people can create content needed for the activity.
BPM tools for executing the steps involved in a business process.
Document capture, document output and document management capabilities.
Embedded analytical tools.

Page 126 of 137
Figure 132: Fastest growing tech hubs in West Africa (2018)
138
Abidjan in Cote d’Ivoire has gradually positioned itself as the new catalyst of innovation across Francophone Africa and has seen its number of active tech hubs double139. Since 2016, a number of new mobile operators-backed tech hubs were launched including MTN-Y’ello, an incubator programme active in Congo and Cote d’Ivoire, Orange Fabin Cote d’Ivoire and Orange–Start on in Morocco and Djezzy’s ENP Incubator in Algeria. This type of business is creating social impact and helping other women-based businesses become efficient but suffer from operational, commercial, technological, and financial challenges and women find it difficult to get them financed Table 3: Future growth areas on products and services. Scope: The scope of this feasibility study is an in-depth profiling of solutions (including types of smart applications – available and that can be migrated to the region from other developed markets), supply chain, margins, business model, organizational capabilities and structure, complexities, investment opportunities (including software development, archiving, processing, etc.), risks and financials for setting up and running this type of smart applications production and processing business. The geographic focus of the study will be Cote d’Ivoire, but it should also cover how similar business can be replicated in other three countries i.e. Ghana, Nigeria, and Senegal. Deliverable: A bankable document - ‘Information Memorandum’ that can be presented to banks or funds for lending or participation.
138
https://www.gsma.com/mobilefordevelopment/programme/ecosystem-accelerator/africa-a-look-at-the-442-active-tech-hubs-of-the-continent/ 139
Ibid
Page 127 of 137
References
1. ECOWAS (2014). ECOWAS Renewable Energy and Energy Efficiency Status Report 2014.The American journal of nursing, 81(7), p. 1297.Praia
2. Birte Pfeiffer and Peter Mulder (2013). Energy Economics, Volume-40, November 2013, Pages 285-296. Elsevier. Available at https://ideas.repec.org/a/eee/eneeco/v40y2013icp285-296.html. [Accessed on 10 Oct 2017]
3. Clinton Foundation (2017), 41% of women are entrepreneurs in Nigeria, www.nocielings.com. Available at: http://www.noceilings.org/entrepreneurs. [Accessed 09 May 2018]
4. AVCA (2016), Spotlight on West Africa Private Equity, www.avca-africa.org. Available at: https://www.avca-africa.org/media/1310/avca-spotlight-on-west-africa-private-equity-public-version.pdf. [Accessed 09 May 2018]
5. World Bank (2017), Doing Business, www.doingbusiness.org. Available at: http://www.doingbusiness.org/rankings. [Accessed 09 May 2018]
6. Astarloa, B. et al. (2017) ‘The Future of Electricity: New Technologies Transforming the Grid Edge’, World Economic forum, (March), p. 32. Available at: https://www.weforum.org/reports/the-future-of-electricity-new-technologies-transforming-the-grid-edge. [Accessed on 09 May 2018].
7. PricewaterhouseCoopers (2014) ‘The road ahead - Gaining momentum from energy transformation’, Pwc, pp. 1–32. Available at: http://www.pwc.com/en_GX/gx/utilities/publications/assets/pwc-the-road-ahead.pdf. [Accessed on 27 Sep 2017]
8. Wikipedia (2018). Electrification. www.wikipedia.com, Available at: https://en.wikipedia.org/wiki/Electrification. [Accessed on 09 May 2018]
9. Engie (2018). Decentralized Energy Generation. www.engie.com. Available at :https://www.engie.com/en/innovation-energy-transition/decentralized-energy-generation/. [Accessed 09 May 2018]
10. World Bank (2018). Access to Electricity (by %of Population). www.worldbank.com. Available at https://data.worldbank.org/indicator/EG.ELC.ACCS.ZS?name_desc=true. [Accessed on 09 May 2018]
11. International Energy Agency (2017) ‘WEO-2017 Special Report: Energy Access Outlook’, pp. 1–143. Available at: https://www.iea.org/publications/freepublications/publication/WEO2017SpecialReport_EnergyAccessOutlook.pdf. [Accessed on 09 May 2018]
12. ECREEE (2017). From Vision to Coordinated Action. Praia.
13. Network Readiness Index is developed by World Economic Form and published as Global Information Technology Report
14. WEF (2016). The Global Information Technology Report 2016. World Economic Forum.www.wef.com. Available at doi: 10.3359/oz0304203. [Accessed on 09 May 2018]
15. Wikipedia (2018). Innovation. www.wikipedia.com. Available at https://en.wikipedia.org/wiki/innovation. [Accessed on 09 May 2018]
16. Dutta, S. (2016).The Global Innovation Index 2016, Stronger Innovation Linkages for. Available at doi: 978-2-9522210-8-5. [Accessed on 10 Dec 2017]
17. WEF (2017). World Energy Outlook ‘London, 14 November 2017.www.iea.org. Available at www.iea.org/weo. [Accessed on 29 Jan 2018]
18. ESMAP (2018). Tracking SDG7. The Energy Progress Report. www.esmap.org. Available at http://gtf.esmap.org. [Accessed on 21 Dec 2017]
19. ND GAIN (2018). Country Index. Notre Dame Global Adaptation Initiative. www.gain.nd.edu. Available at https://gain.nd.edu/our-work/country-index/. [Accessed on 09 May 2018]
20. EPI (2018). Global Metrics for Environment. www.epi.envirocenter.yale.edu. Available at https://epi.envirocenter.yale.edu.[Accessed on 09 May 2018]
Page 128 of 137
21. Wikipedia (2018). List_of_countries_by_carbon_dioxide_emissions. www.wikipedia.com. Available at https://en.wikipedia.org/wiki/List_of_countries_by_carbon_dioxide_emissions#/media/File:Countries_by_carbon_dioxide_emissions_world_map_deobfuscated.png. [Accessed on 17 Feb 2018]
22. IRENA (2018). Featured Dashboard. www.irena.org. Available at - http://resourceirena.irena.org/gateway/dashboard/. [Acessed on 09 May 2018]
23. IRENA (2015). West Africa Power Pool – Planning and Prospects for Renewable Energy. IRENA. Available at http://www.irena.org/DocumentDownloads/Publications/WAPP.pdf. [Accessed on 24 Dec 2017]
24. World Bank (2018). Electric power transmission and distribution losses (% of output). www.worldbank.org. Available at https://data.worldbank.org/indicator/EG.ELC.LOSS.ZS. [Accessed on 09 May 2018]
25. BP (2017) ‘BP Statistical Review of World Energy 2017’, British Petroleum, (66), pp. 1–52. doi: http://www.bp.com/content/dam/bp/en/corporate/pdf/energy-economics/statistical-review-2017/bp-statistical-review-of-world-energy-2017-full-report.pdf. [Accessed on 16 Dec 2017]
26. IEA (2017) ‘World energy balances: an overview of global trends’, WORLD ENERGY BALANCES: AN OVERVIEW Global trends, p. 21. doi: https://www.iea.org/publications/freepublications/publication/world-energy-balances---2017-edition---overview.html. [Accessed on 02 Feb 2018]
27. World Energy Council (2016). World Energy Resources 2016, pp. 1–33. Available at doi: http://www.worldenergy.org/wp-content/uploads/2013/09/Complete_WER_2013_Survey.pdf.[Accessed on 02 May 2018]
28. Worldometers (2018). West African Population. www.worldometers.info. Available at http://www.worldometers.info/world-population/western-africa-population/. [Accessed on 02 Feb 2018]
29. World Bank (2018). Domestic credit to private sector (% of GDP). www.worldbank.com. Available at ( http://data.worldbank.org/indicator/FS.AST.PRVT.GD.ZS). [Accessed on 25 Mar 2018]
30. World Bank (2018). Domestic credit to private sector (% of GDP). www.worldbank.com. Available at https://data.worldbank.org/indicator/FS.AST.PRVT.GD.ZS?name_desc=true. [Accessed on 25 Mar 2018]
31. IRENA (2018). Global Landscape Of Renewable Energy Finance. www.irena.org. Available at : https://www.irena.org/-/media/Files/IRENA/Agency/Publication/2018/Jan/IRENA_Global_landscape_RE_finance_2018.pdf. [Accessed on 08 Mar 2018]
32. World Energy Council (2016). World Energy Resources 2016, pp. 1–33. Available at doi: http://www.worldenergy.org/wp-content/uploads/2013/09/Complete_WER_2013_Survey.pdf. [Accessed on 10 Feb 2018]
33. World Bank (2018). Urban population (% of total). www.worldbank.org. Available at https://data.worldbank.org/indicator/SP.URB.TOTL.IN.ZS?name_desc=true. [Accessed on 18 Mar 2018]
34. VC4A (2017). Explore all ventures. www.vc4a.com. Available at https://vc4a.com/ventures/. [Accessed on 15 Oct 2017)
35. Wikipedia (2018). Consumer behavior. www.wikipedia.com. Available at https://en.wikipedia.org/wiki/Consumer_behaviour. [Accessed on 12 April 2018]
36. Chris Joseph (2018). Customer and Consumer Definitions. http://smallbusiness.chron.com. Available at (http://smallbusiness.chron.com/customer-consumer-definitions-5048.html). [Accessed on 10 April 2018]
37. IBM (2010). ‘Switching perspectives’, Business, pp. 1–20. www.ibm.com. Available at doi: 10.1007/978-1-4471-6281-0_9.[Accessed on 14 Apr 2018]
38. Porter, M.E. (1979). Porter's five forces analysis. Harvard Business Review. www.wikipedia.com. Available at https://en.wikipedia.org/wiki/Porter%27s_five_forces_analysis. [Accessed on 17 April 2018]

Page 129 of 137
39. Bruno Cova et al. (2016). Role of regional interconnection in fostering RE Integration in Eastern Africa Power Pool. Poyri, Terna and CESI. Available at https://www.res4africa.org/wp-content/uploads/2018/01/PP-9-Role-of-interconnection-in-fostering-RE-integration-in-the-EAPP.pdf. [Accessed on 10 April 2018]
40. Patrick, O., Tolulolope, O. and Sunny, O. (2013). ‘Smart Grid Technology and Its Possible Applications to the Nigeria 330 kV Power System’, Smart Grid and Renewable Energy. Available at pp. 391–397. doi: 10.4236/sgre.2013.45045. [Accessed on 16 April 2018]
41. 1 Huawei (2018). These smart meters are revolutionizing Nigeria's power supply. Huawei. Available at http://uk.businessinsider.com/sc/these-smart-meters-are-revolutionising-nigeria-power-supply-2016-9. [Accessed on 10 Mar 2018)
42. Schurr, A. and Energy, V. P. (2011). Emerging Technology Transforming the Energy Value Chain and Customer Engagement. IBM. Available at http://cmua.org/documents/79thconference/Switching%20Perspectives%20MAIN%20EXEC%20CMUA%2003302011%20FINAL.pdf. [Accessed on 10 Feb 2018]
43. GSMA (2017). Country overview: Côte d ’ Ivoire Driving mobile-enabled digital transformation. GSM Association. London (UK)
44. IBM (2010). Switching perspectives, Business, pp. 1–20. www.ibm.com . Available at doi: 10.1007/978-1-4471-6281-0_9.[Accessed on 13 Mar 2018]
45. REN21 (2017). Renewables 2017: global status report, Renewable and Sustainable Energy Reviews. Available at doi: 10.1016/j.rser.2016.09.082.[Accessed on 08 Feb 2018]
46. Giuseppe Artizzu et al. (2017). Decentralized renewable energy solutions to foster economic development. EPS, Enel, Enertronica, ERM and Politecnica Milano. Available at https://www.res4africa.org/wp-content/uploads/2018/01/PP-4-Decentralised-renewable-energy-solutions-to-foster-economic-development-170915-PAPERANNEX-FINALE.pdf. [Accessed on 21 Feb 2018]
47. ECREEE (2017) .FIRST THREE SOLAR PV INDEPENDENT POWER PRODUCERS IN SENEGAL. Praia
48. NERC (2018). Renewable Energy Sourced Electricity . NERC,. Available at http://www.nercng.org/index.php/home/operators/renewable-energy. [Accessed on 09 May 2018]
49. International Energy Agency (2018). IEA/IRENA Joint Policies and Measures database. www.iea.org. Available at https://www.iea.org/policiesandmeasures/renewableenergy/?country=Senegal. [Accessed on 01 May 2018]
50. Sonia Galat (2018). Starting as an Independent Power Producer in Cote d’Ivoire. Africa BV. Available at http://www.africabv.com/blog/starting-as-an-independent-power-producer-in-cote-divoire/. [Accessed on 01 May 2018]
51. Andrea Ovans (2015). What Is a Business Model?.Harvard Business Review. Available at https://hbr.org/2015/01/what-is-a-business-model. [Accessed on 10 Feb 2018]
52. ECOWAS Centre for Renewable Energy and Energy Efficiency (ECREEE) (2015) ‘Situation Analysis of Energy and Gender Issues in ECOWAS Member States 2015’. Praia. [Accessed on 15 Mar 2018]
53. Terjesen, S. and Llyod, A. (2015) . The Female Entrepreneurship Index ( FEI ). Global Entrepreneurship and Development Institute. Washington (US). [Accessed on 14 Jan 2018]
54. World Bank (2018). Enterprise Surveys. www. worldbank.org. Available at http://www.enterprisesurveys.org/Custom-Query#hReprtpreview. [Accessed on 15 Mar 2018]
55. Investopedia (2018). Financial Performance. www. Investopedia.com. Available at https://www.investopedia.com/terms/f/financialperformance.asp. [Accessed on 10 Feb 2018]
56. MBASkool (2018). Inventory Costs. www.mbaskool.com. Available at https://www.mbaskool.com/business-concepts/operations-logistics-supply-chain-terms/15039-inventory-costs.html. [Accessed on 13 Feb 2018]
57. Businessdictionary (2018). Labor cost. www.businessdictionary.com. Available at http://www.businessdictionary.com/definition/labor-cost.html. [Accessed on 13 Feb 2018]
Page 130 of 137
58. Businessdictionary (2018). Transportation cost. www.businessdictionary.com. Available at http://www.businessdictionary.com/definition/transportation-cost.html. [Accessed on 13 Feb 2018]
59. Investinganswers (2018).Working capital. www.investinganswers.com. Aavailable at http://www.investinganswers.com/financial-dictionary/financial-statement-analysis/working-capital-869. [Accessed on 13 Feb 2018]
60. Lexi Novitske and Dale Mathias (2018). The Surprising Place That Promotes Women Entrepreneurs Better Than Silicon Valley.www.entrepreneur.com. Available at https://www.entrepreneur.com/article/299590. [Accessed on 10 Feb 2018]
61. Investopedia (2018). Five Cs of Credit. www. Investopedia.com. Available at https://www.investopedia.com/terms/f/five-c-credit.asp. [Accessed on 10 Feb 2018]
62. Glemarec, Y., Bayat-Renoux, F. and Waissbein, O. (2016). Removing barriers to women entrepreneurs’ engagement in decentralized sustainable energy solutions for the poor. AIMS Energy. 4(1), pp. 136–172. Available at doi: 10.3934/energy.2016.1.136. [Accessed on 20 Jan 2018]
63. World Energy Council (2016) . World Energy Resources 2016, pp. 1–33. Available at doi: http://www.worldenergy.org/wp-content/uploads/2013/09/Complete_WER_2013_Survey.pdf. [Accessed on 20 Jan 2018]
64. Africa, V. C. F. (2015). Venture finance in Africa. Venture Capital for Africa. Available at https://vc4a.com/venture-finance-in-africa/. [Accessed on 10 Feb 2018]
65. Investopedia (2018). Business Risks. www. Investopedia.com. Available at https://www.investopedia.com/terms/b/businessrisk.asp. [Accessed on 10 Feb 2018]
66. International Energy Agency (2016). World Energy Investment 2016. IEA. Available at https://www.iea.org/newsroom/news/2016/september/world-energy-investment-2016.html. [Accessed on 15 Feb 2018]
67. Allied Bank (2018). Women Banking. Allied Bank. Available at https://www.abl.com/personal-banking/theme-branches/women-banking/. [Accessed on 14 March 2018], Womens Bank (2018). Account Services. Tanzania Womens Bank PLC. Available at http://www.womensbank.co.tz. [Accessed on 14 March 2018]
68. Wikipedia (2018). List of countries by natural gas proven reserves. www.wikipedia.com. Available at https://en.wikipedia.org/wiki/List_of_countries_by_natural_gas_proven_reserves. [Accessed on 12 April 2018]
69. ECREEE (2016). Mapping and Assessment of Clean Energy Mini-grid experiences in West Africa.Pg.22. ECREEE. Praia
70. GOGLA (2018). Off-Grid Solar Market Trends Report 2018.World Bank Group.www.worldbank.com. Available at https://www.gogla.org/publications. [Accessed on 11 April 2018]
71. Dario Guilani (2018). Afr ica: a look at the 442 act ive tech hubs of the co nt inent . GSMA. Avai lable at https://www.gsma.com/mobilefordevelopment/programme/ecosystem-accelerator/africa-a-look-at-the-442-active-tech-hubs-of-the-continent/. [Accessed on 01 May 2018]
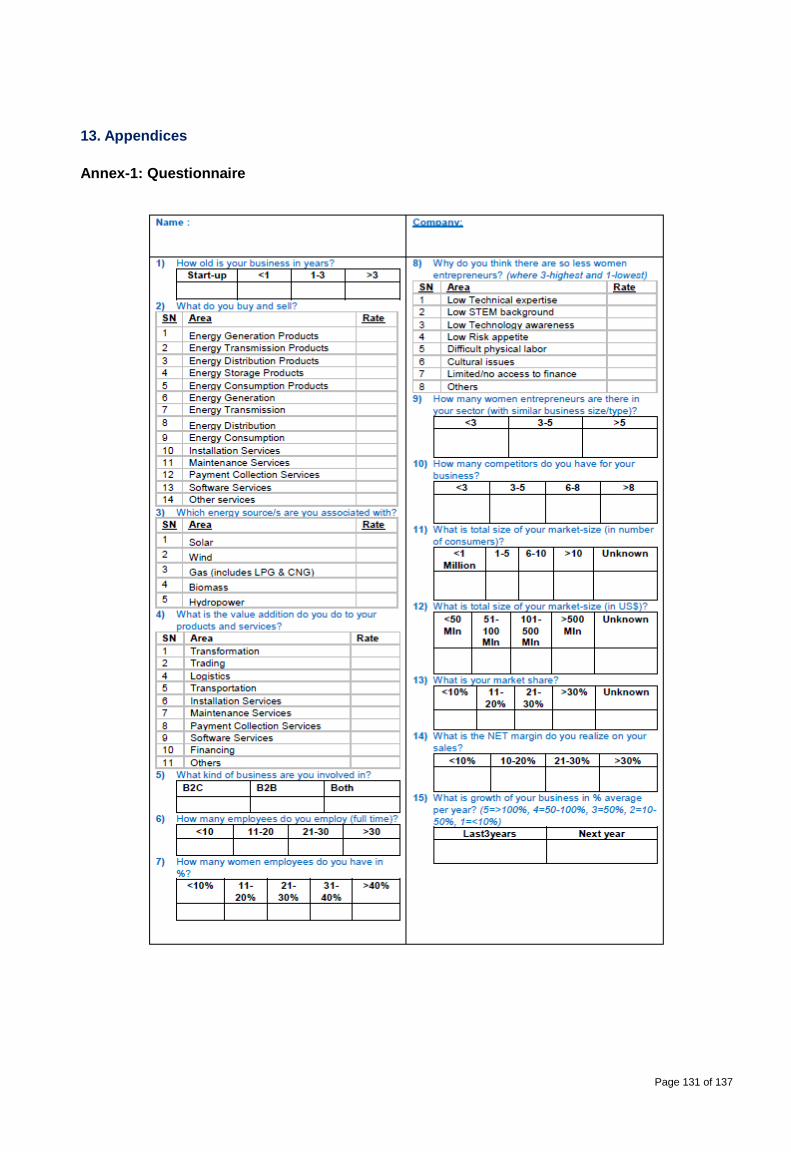
Page 131 of 137
13. Appendices
Annex-1: Questionnaire
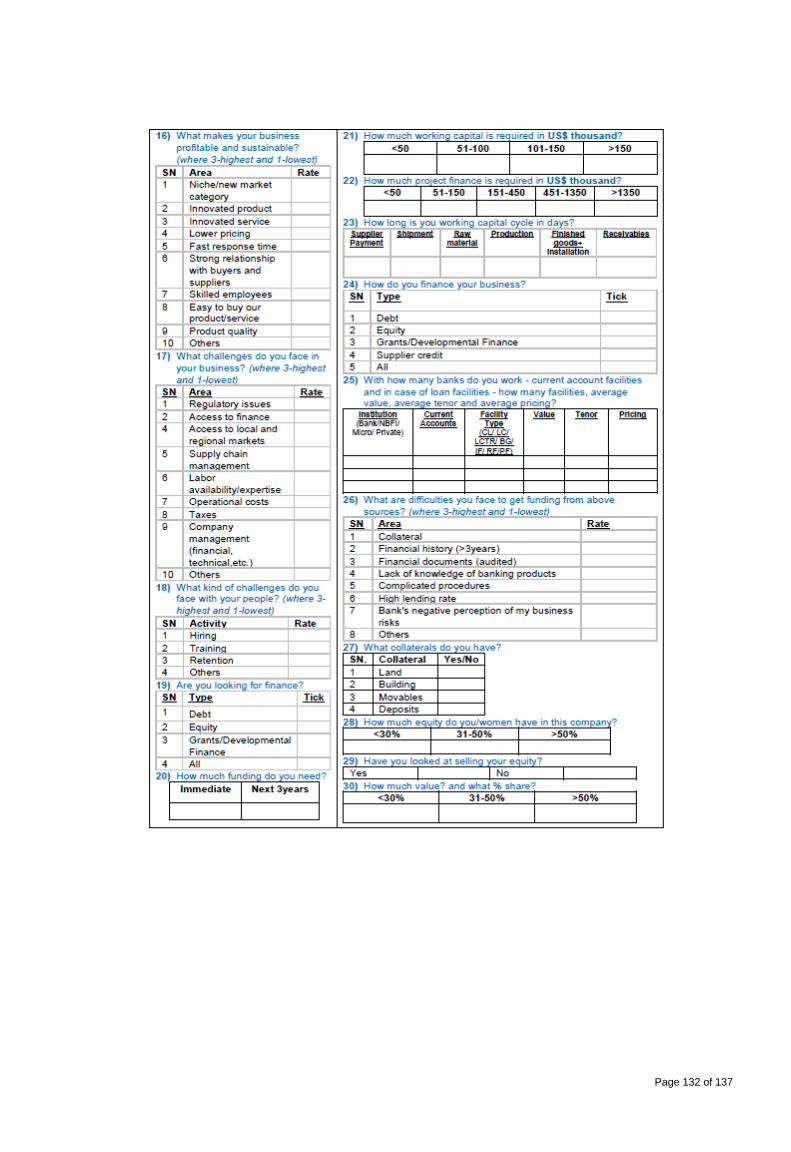
Page 132 of 137
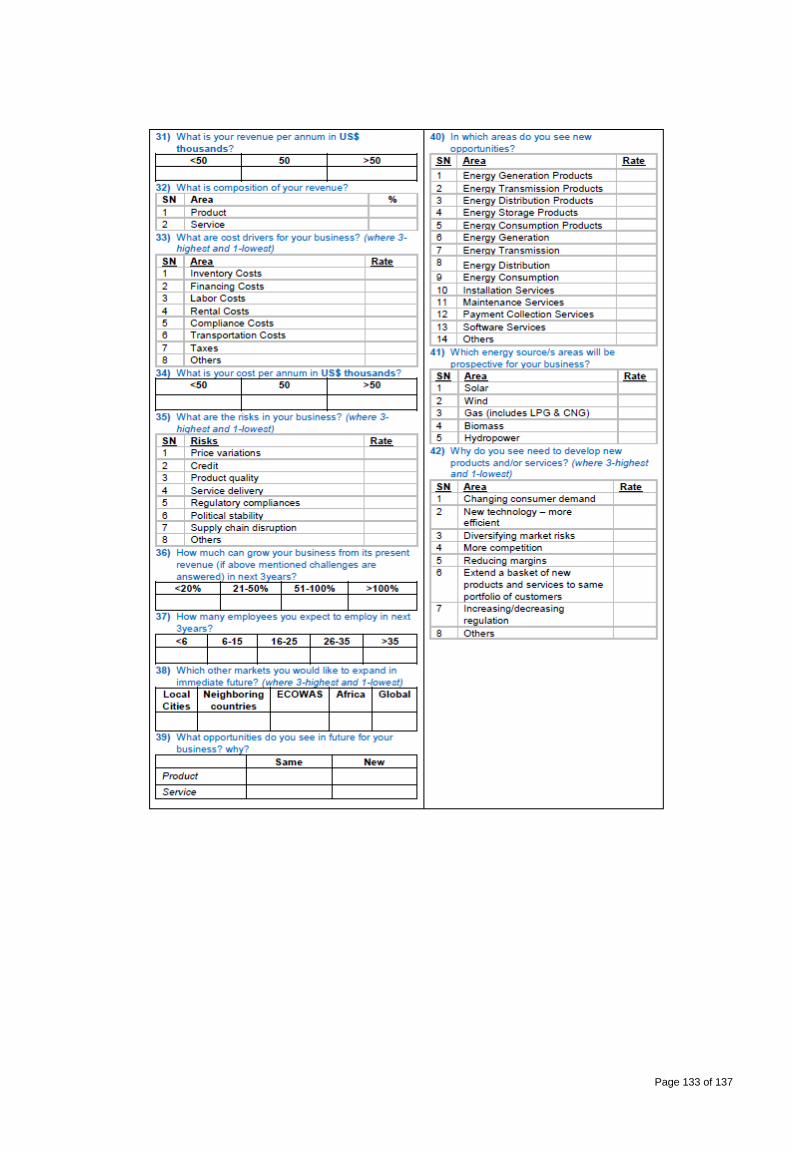
Page 133 of 137
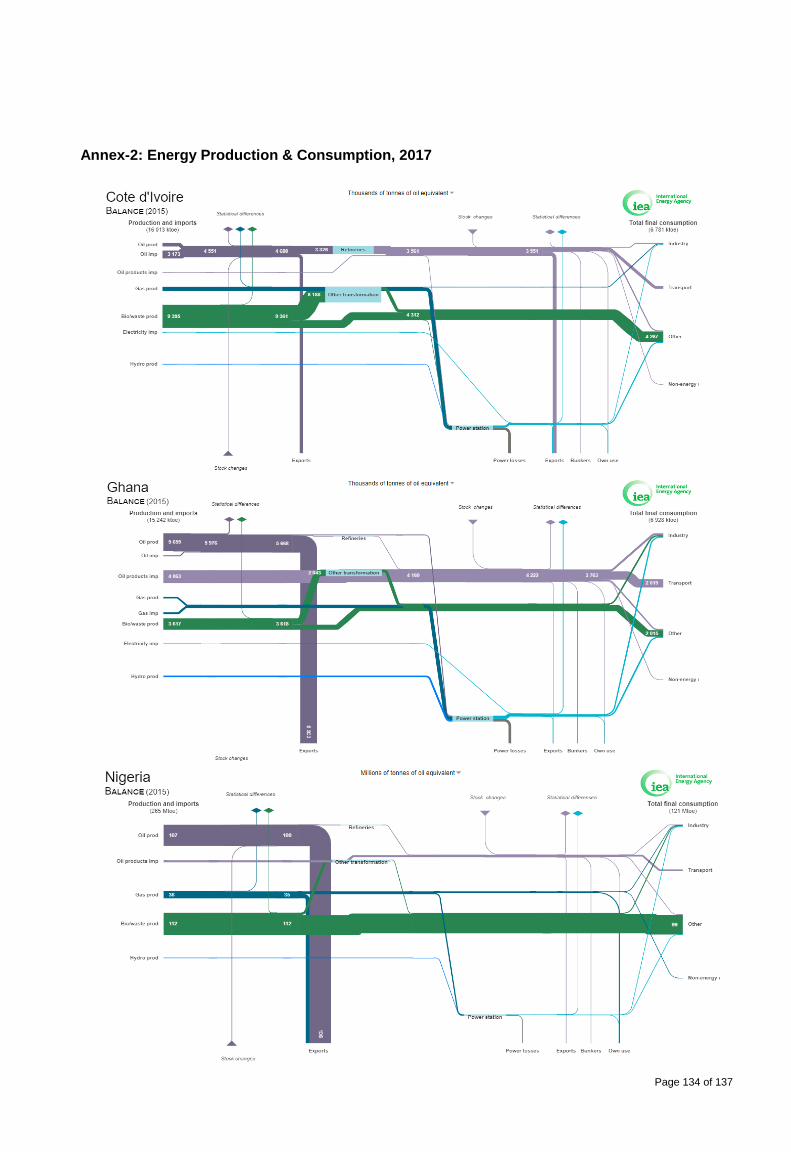
Page 134 of 137
Annex-2: Energy Production & Consumption, 2017
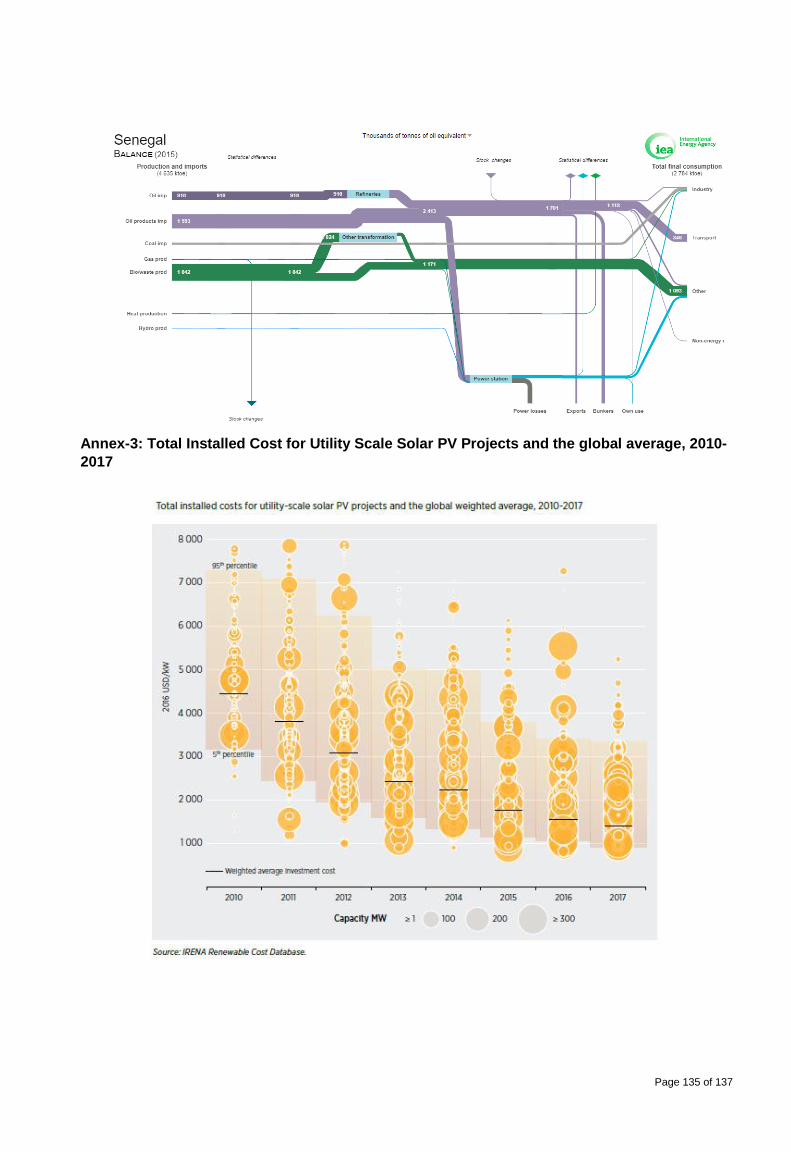
Page 135 of 137
Annex-3: Total Installed Cost for Utility Scale Solar PV Projects and the global average, 2010-
2017
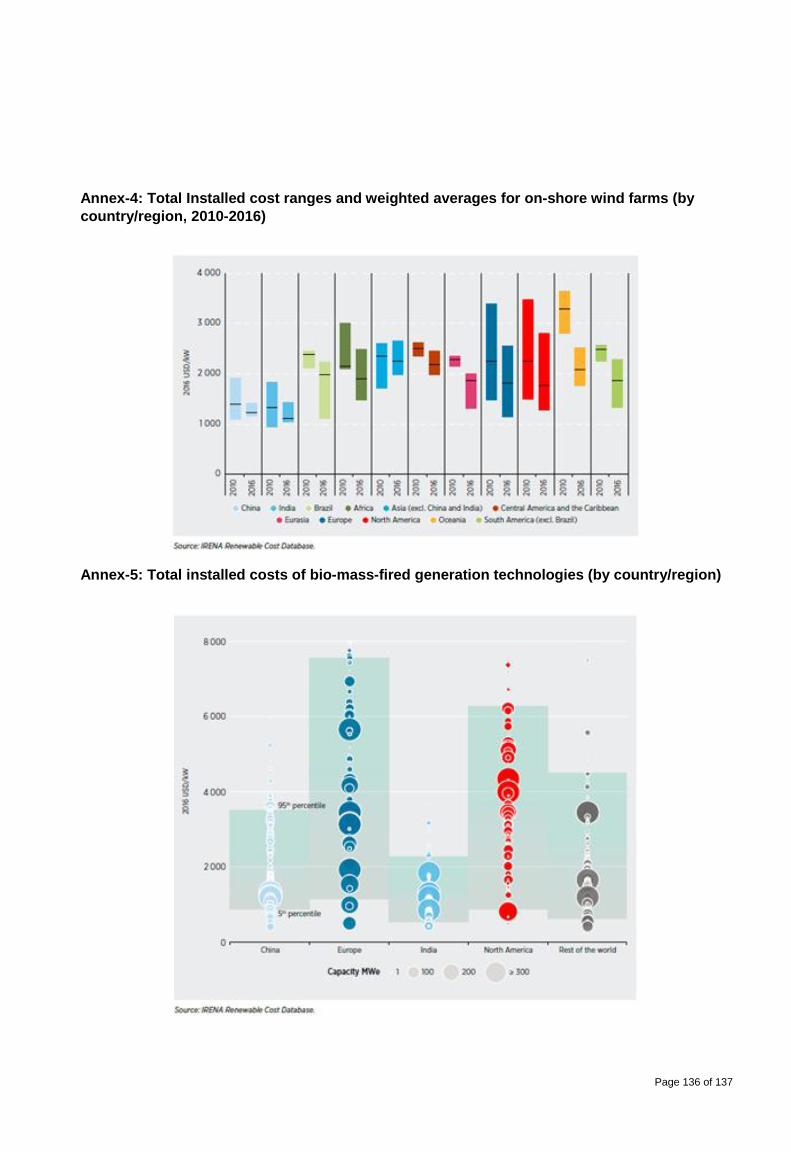
Page 136 of 137
Annex-4: Total Installed cost ranges and weighted averages for on-shore wind farms (by
country/region, 2010-2016)
Annex-5: Total installed costs of bio-mass-fired generation technologies (by country/region)

Page 137 of 137
Annex-6: Levelized cost of electricity by capacity factor of bio-energy fired projects (2000-
2016)
Annex-7: Cost of Various Cooking Technologies by source
140
140
http://www.ren21.net/status-of-renewables/global-status-report/