Embed Size (px)
Citation preview
Energy Recovery from Water Distribution Systems
Ilker Tonguc TelciGraduate Student
MESLSeptember 20 2010
Outline
Problem definition.
Pipe flow review, water distribution systems (constraints, problems and solutions).
Examples from literature.
Summary of literature and tentative solution method.
Preliminary analysis of Dover Township WDS.
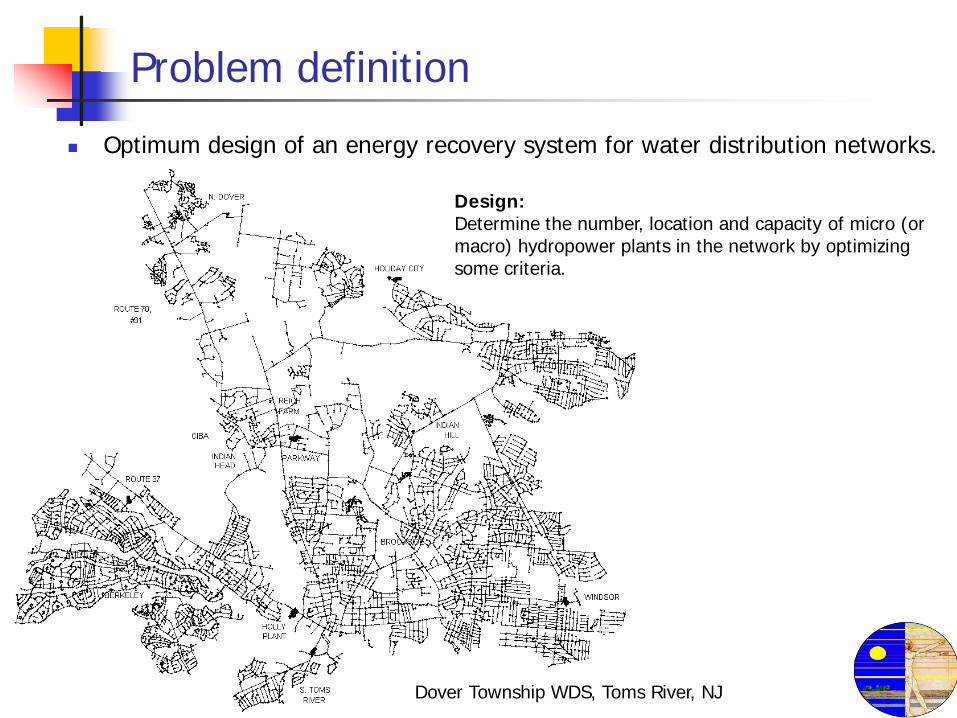
Problem definition
Design: Determine the number, location and capacity of micro (or macro) hydropower plants in the network by optimizing some criteria.
Dover Township WDS, Toms River, NJ
Optimum design of an energy recovery system for water distribution networks.
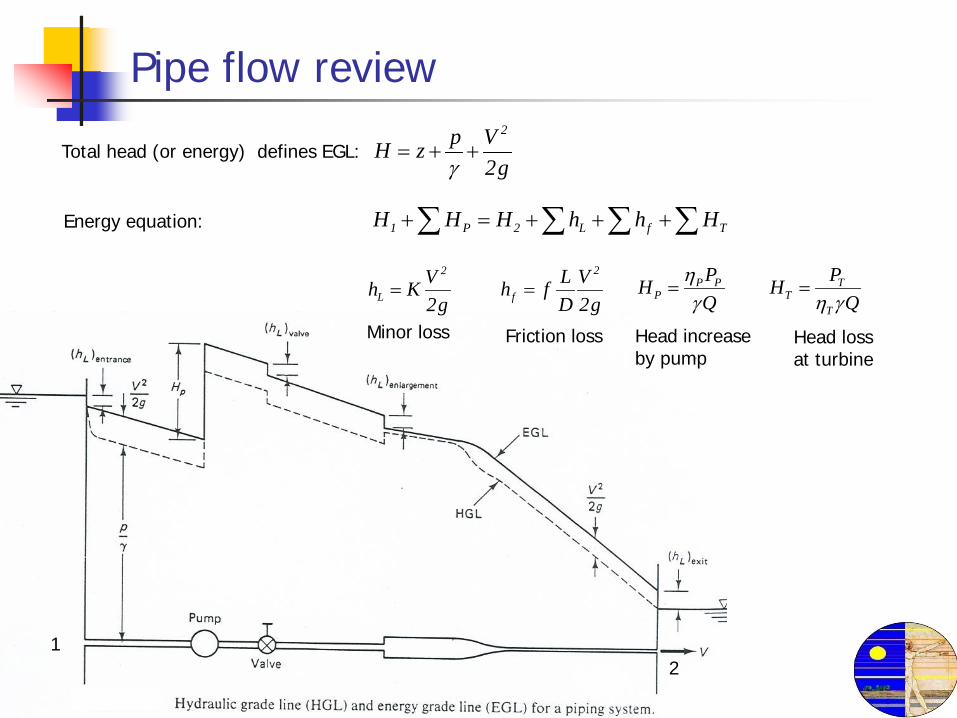
Pipe flow review2p VH z
2gγ= + +Total head (or energy) defines EGL:
1 P 2 L f TH H H h h H+ = + + +∑ ∑ ∑ ∑
12
Energy equation:
2
LVh K2g
=2
fL Vh fD 2g
= P P TP T
T
P PH HQ Q
ηγ η γ
= =
Minor loss Friction loss Head increase by pump
Head loss at turbine
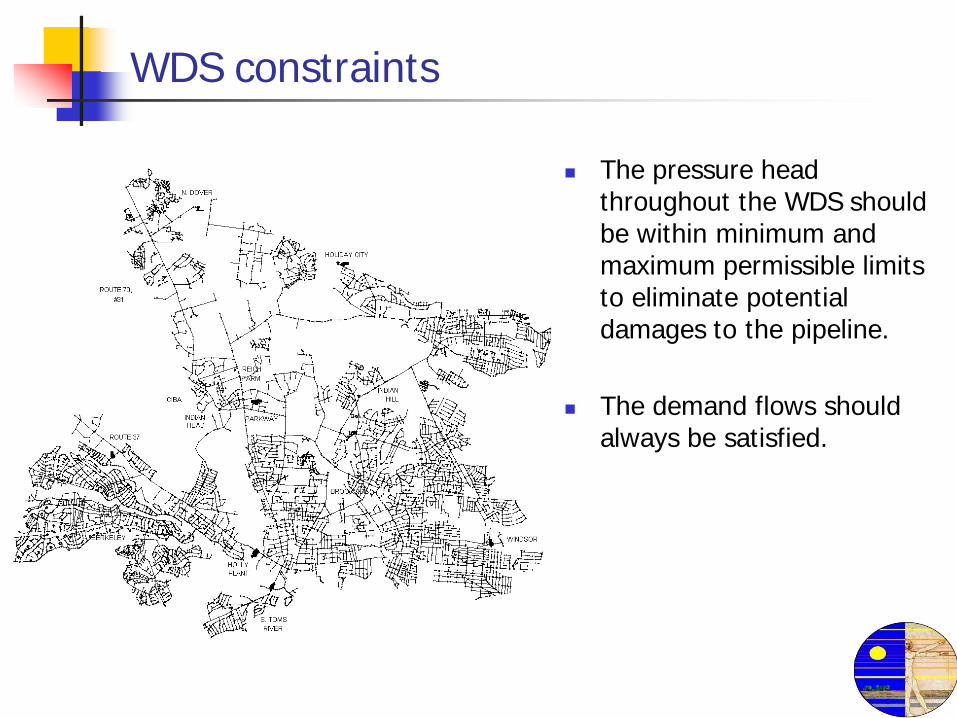
WDS constraints
The pressure head throughout the WDS should be within minimum and maximum permissible limits to eliminate potential damages to the pipeline.
The demand flows should always be satisfied.
Major problem in a WDS
Excessive pressure heads are the major problems in WDS.
Excessive pressure may cause: damage to the pipeline, leakage
Thus, excessive pressures should be minimized while customer demands are ensured to be satisfied at all times.
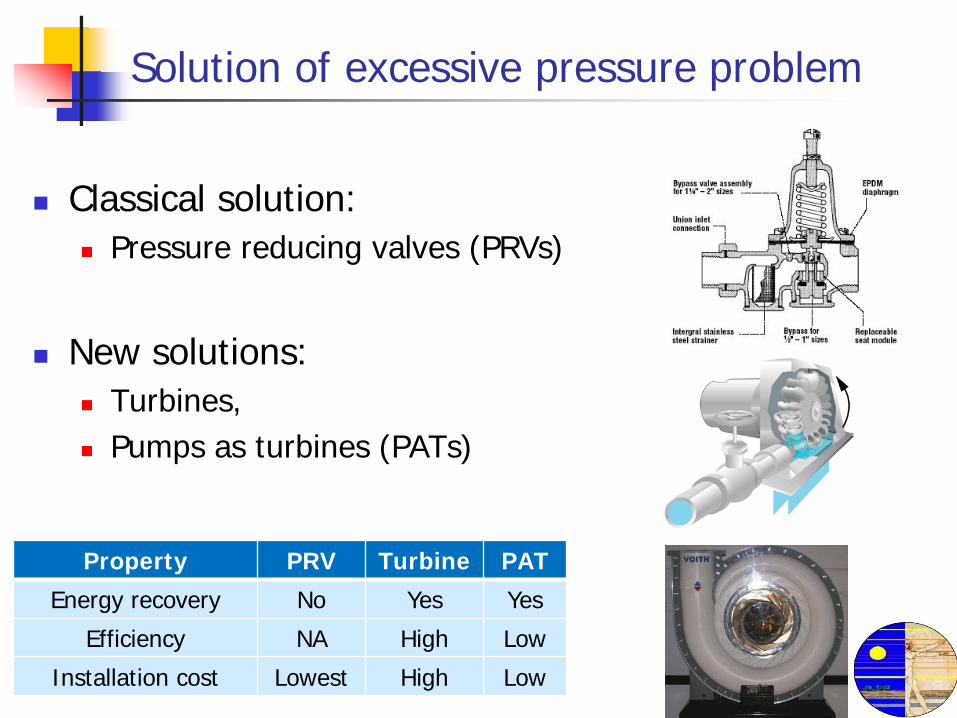
Solution of excessive pressure problem
Classical solution: Pressure reducing valves (PRVs)
New solutions: Turbines, Pumps as turbines (PATs)
Property PRV Turbine PAT
Energy recovery No Yes Yes
Efficiency NA High Low
Installation cost Lowest High Low
Examples from literature
Afshar, A., F. Benjemaa, et al. (1990). "OPTIMIZATION OF HYDROPOWER PLANT INTEGRATION IN WATER-SUPPLY SYSTEM." Journal of Water Resources Planning and Management-Asce 116(5): 665-675.
Ramos, H., D. Covas, et al. (2005). Available energy assessment in water supply systems. XXXI IAHR Congress. Seoul, Korea.
Giugni, M., N. Fontana, et al. (2009). Energy saving policy in water distribution networks. International Conference on Renewable Energies and Power Quality (ICREPQ’09). Valencia, Spain.
Liberatore, S. and G. M. Sechi (2009). "Location and Calibration of Valves in Water Distribution Networks Using a Scatter-Search Meta-heuristic Approach." Water Resources Management 23(8): 1479-1495.
Examples from literature (1)
Afshar, A., F. Benjemaa, et al. (1990). "OPTIMIZATION OF HYDROPOWER PLANT INTEGRATION IN WATER-SUPPLY SYSTEM." Journal of Water Resources Planning and Management-Asce 116(5): 665-675.
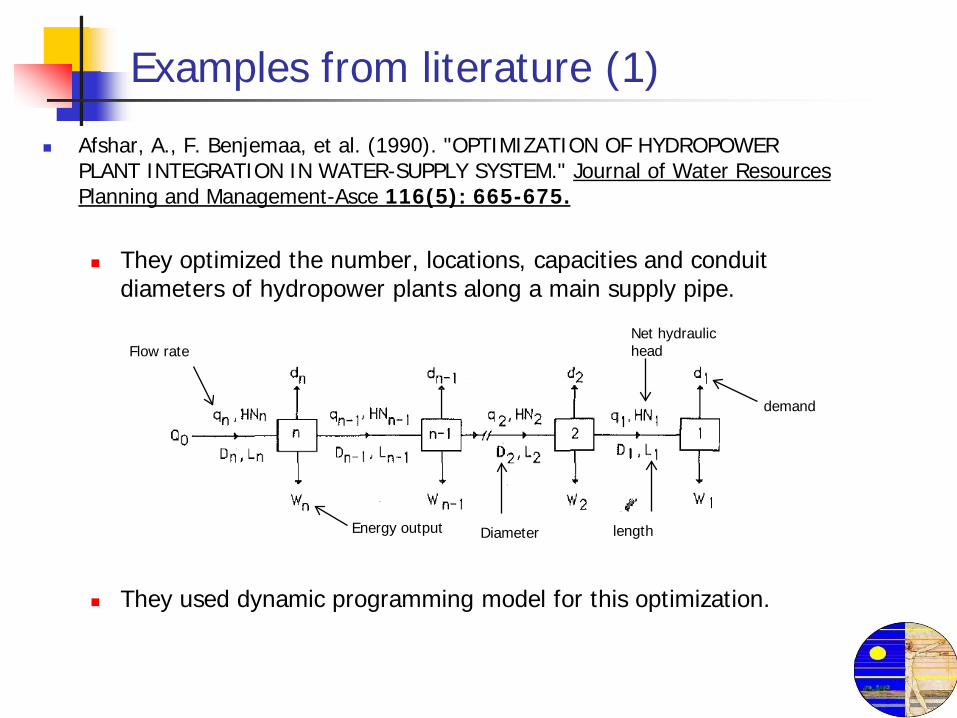
They optimized the number, locations, capacities and conduit diameters of hydropower plants along a main supply pipe.
They used dynamic programming model for this optimization.
Energy output Diameter length
demand
Net hydraulic headFlow rate
Examples from literature (1)
Afshar, A., F. Benjemaa, et al. (1990). "OPTIMIZATION OF HYDROPOWER PLANT INTEGRATION IN WATER-SUPPLY SYSTEM." Journal of Water Resources Planning and Management-Asce 116(5): 665-675.
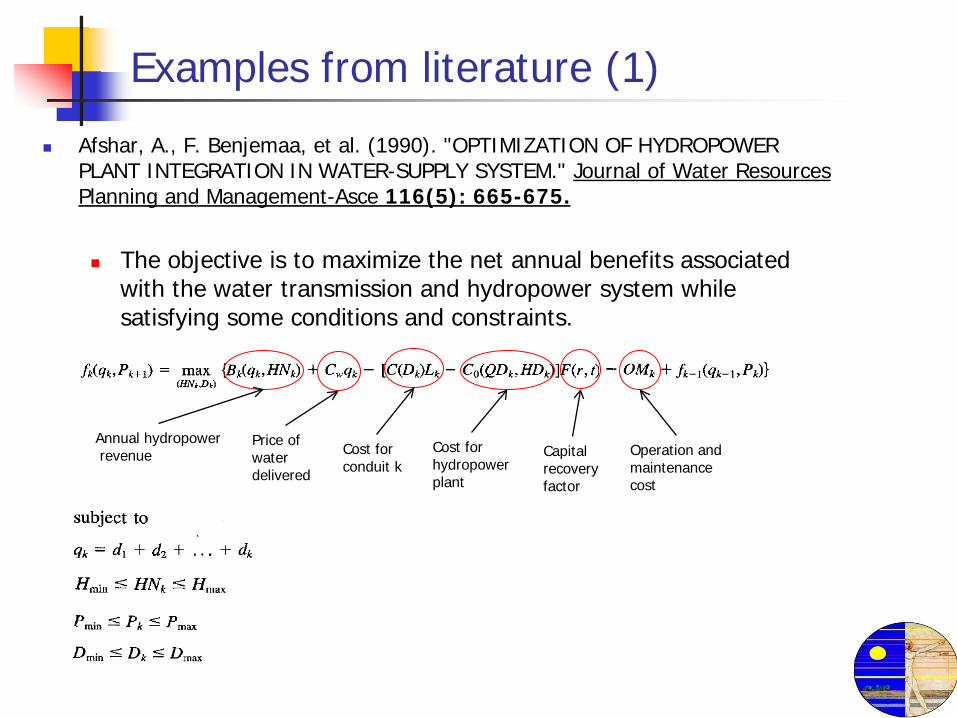
The objective is to maximize the net annual benefits associated with the water transmission and hydropower system while satisfying some conditions and constraints.
Annual hydropowerrevenue
Price of water delivered
Cost for conduit k
Cost for hydropower plant
Capital recovery factor
Operation and maintenance cost
Examples from literature (2)
Ramos, H., D. Covas, et al. (2005). Available energy assessment in water supply systems. XXXI IAHR Congress. Seoul, Korea.
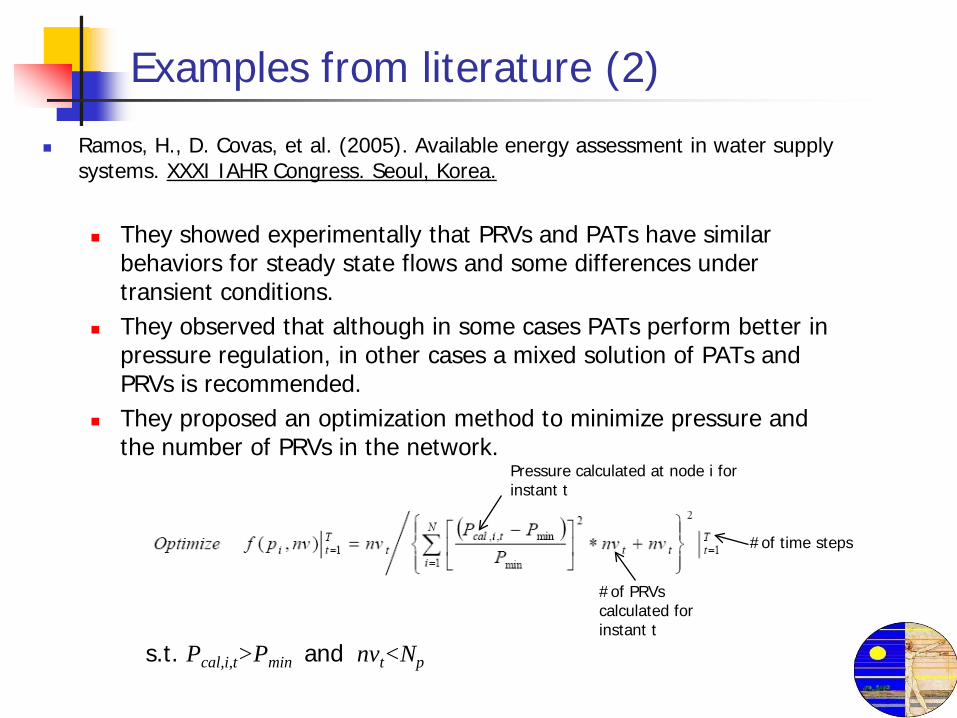
They showed experimentally that PRVs and PATs have similar behaviors for steady state flows and some differences under transient conditions.
They observed that although in some cases PATs perform better in pressure regulation, in other cases a mixed solution of PATs and PRVs is recommended.
They proposed an optimization method to minimize pressure and the number of PRVs in the network.
s.t. Pcal,i,t>Pmin and nvt<Np
#of PRVs calculated for instant t
#of time steps
Pressure calculated at node i for instant t
Examples from literature (3)
Giugni, M., N. Fontana, et al. (2009). Energy saving policy in water distribution networks. International Conference on Renewable Energies and Power Quality (ICREPQ’09). Valencia, Spain.
A simulation model based on a Genetic Algorithm is used to locate PRVs and optimize water system performance.
PRVs are substituted by PATs for renewable energy production.
PAT installation resulted in a similar leakage reduction as PRVs.
Economic analysis shows significant profits from energy production.
Examples from literature (4)
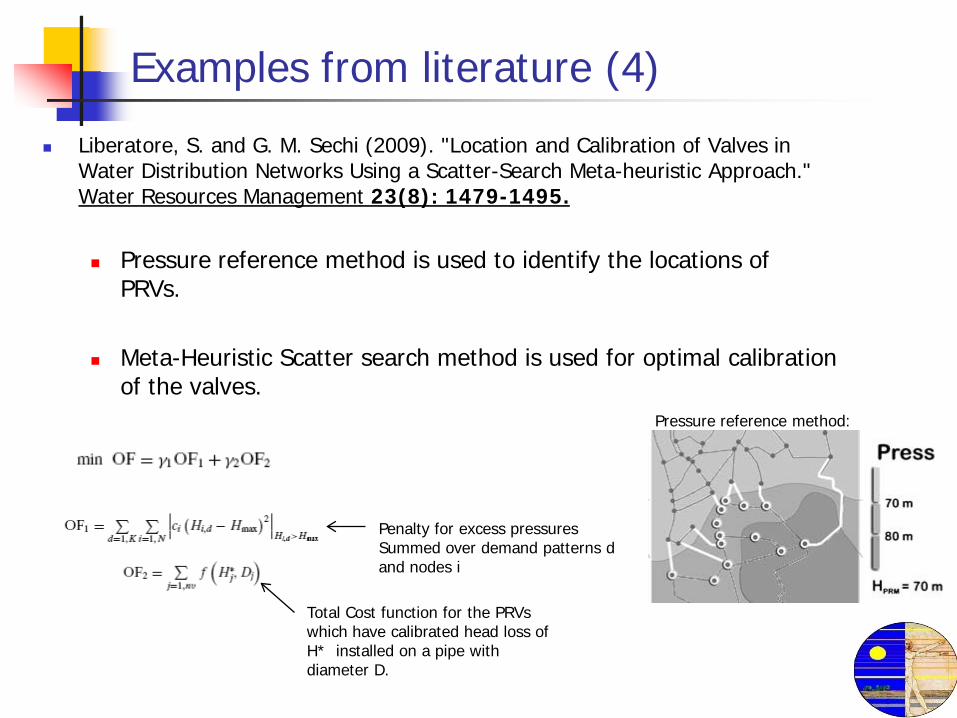
Liberatore, S. and G. M. Sechi (2009). "Location and Calibration of Valves in Water Distribution Networks Using a Scatter-Search Meta-heuristic Approach." Water Resources Management 23(8): 1479-1495.
Pressure reference method is used to identify the locations of PRVs.
Meta-Heuristic Scatter search method is used for optimal calibration of the valves.
Penalty for excess pressuresSummed over demand patterns d and nodes i
Total Cost function for the PRVs which have calibrated head loss of H* installed on a pipe with diameter D.
Pressure reference method:

Summary of literature (1)
Excess pressures are the main concern among hydraulic engineers.
Energy recovery has secondary importance.
The objective functions consider the pressure in the network (except Afshar, et.al (1990)) and installation costs.
First, locations of PRVs are determined, then replacement with a turbine (or PAT) is considered.
General considerations
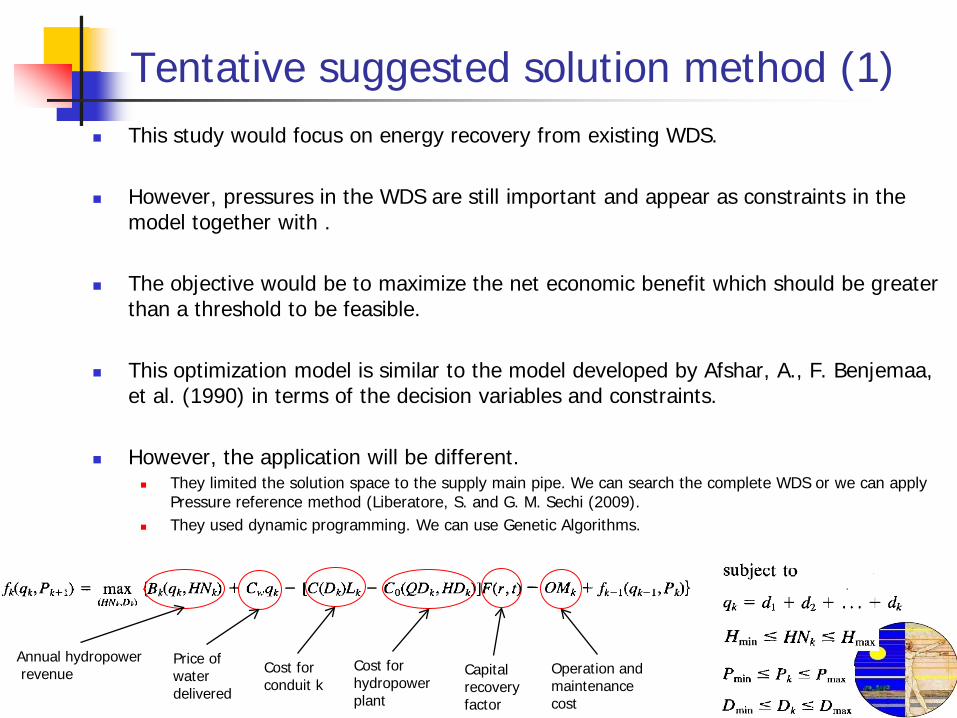
Tentative suggested solution method (1) This study would focus on energy recovery from existing WDS.
However, pressures in the WDS are still important and appear as constraints in the model together with .
The objective would be to maximize the net economic benefit which should be greater than a threshold to be feasible.
This optimization model is similar to the model developed by Afshar, A., F. Benjemaa, et al. (1990) in terms of the decision variables and constraints.
However, the application will be different. They limited the solution space to the supply main pipe. We can search the complete WDS or we can apply
Pressure reference method (Liberatore, S. and G. M. Sechi (2009). They used dynamic programming. We can use Genetic Algorithms.
Annual hydropowerrevenue
Price of water delivered
Cost for conduit k
Cost for hydropower plant
Capital recovery factor
Operation and maintenance cost
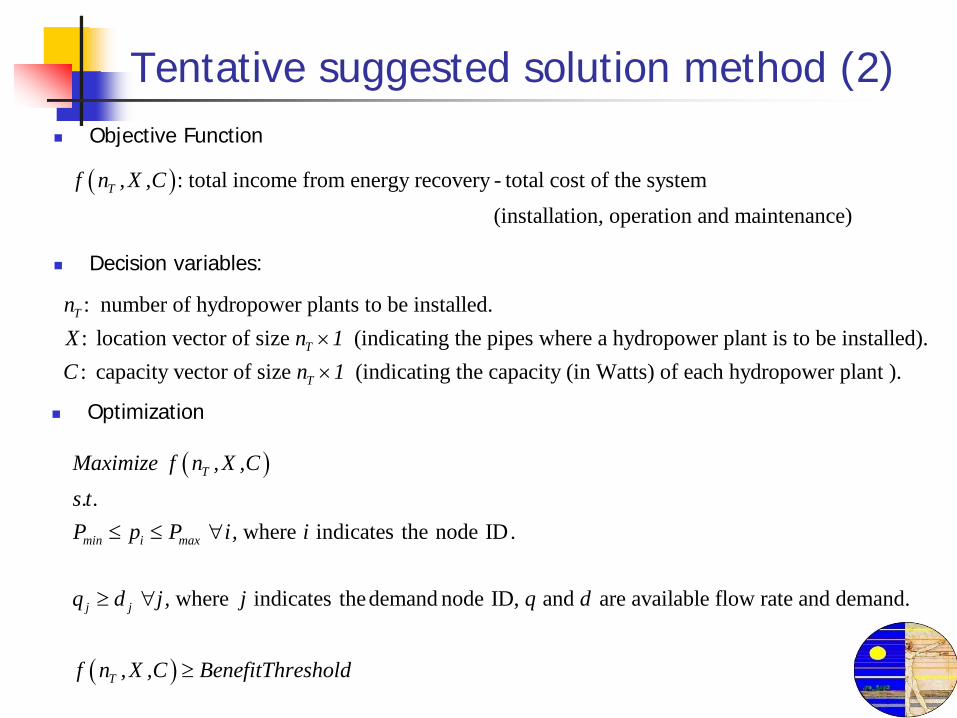
Tentative suggested solution method (2) Objective Function
( ): total income from energy recovery total cost of the system (installation, operation and maintenance)
Tf n ,X ,C -
Decision variables:
: number of hydropower plants to be installed.: location vector of size (indicating the pipes where a hydropower plant is to be installed).: capacity vector of size (indicating the cap
T
T
T
nX n 1C n 1
×× acity (in Watts) of each hydropower plant ).
( )
( )
where indicates the node ID
where indicates thedemand node ID, and are available flow rate and demand.
T
min i max
j j
T
Maximize f n ,X ,Cs.t.P p P i, i .
q d j, j q d
f n ,X ,C BenefitThreshold
≤ ≤ ∀
≥ ∀
≥
Optimization
Summary of literature (2)
According to Ramos, H., D. Covas, et al. (2005), high topographic gradients are favorable to adopt energy recovery using turbines (or PATs).
Giugni, M., N. Fontana, et al. (2009) sets a minimum pressure head of 25 m since there are 6 storey buildings in the WDS area.
If the distribution network is organized in urban districts, district method which involves inserting valves (as a consequence turbines for energy recovery) in all district supply pipes can be applied (Alonso et al., 2000).
Specific considerations about Dover Township WDS
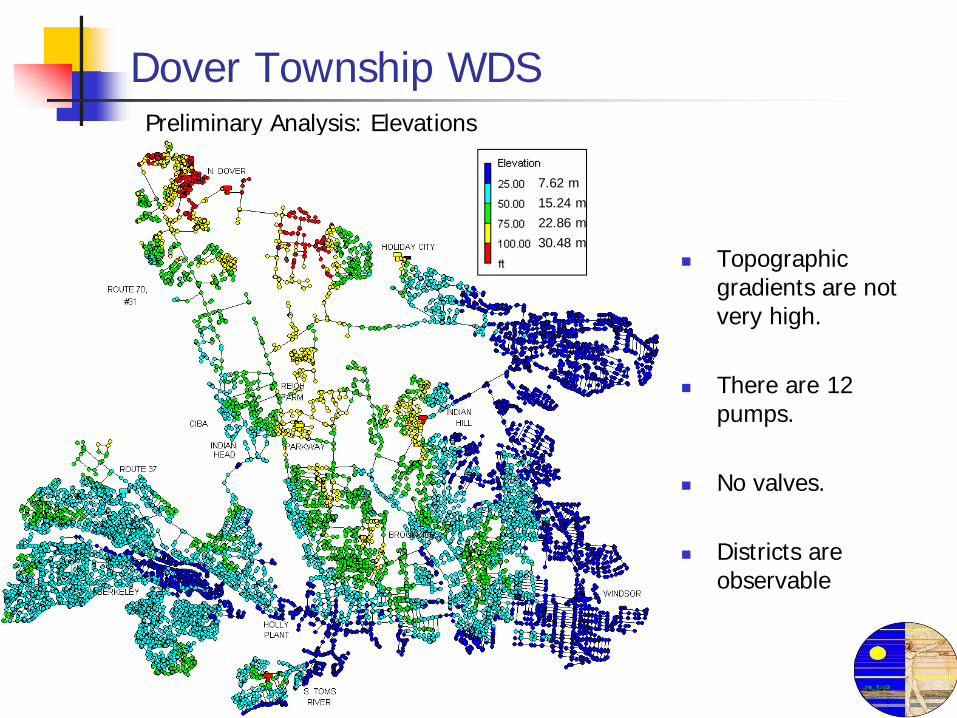
Dover Township WDS
Topographic gradients are not very high.
There are 12 pumps.
No valves.
Districts are observable
Preliminary Analysis: Elevations
7.62 m15.24 m22.86 m30.48 m
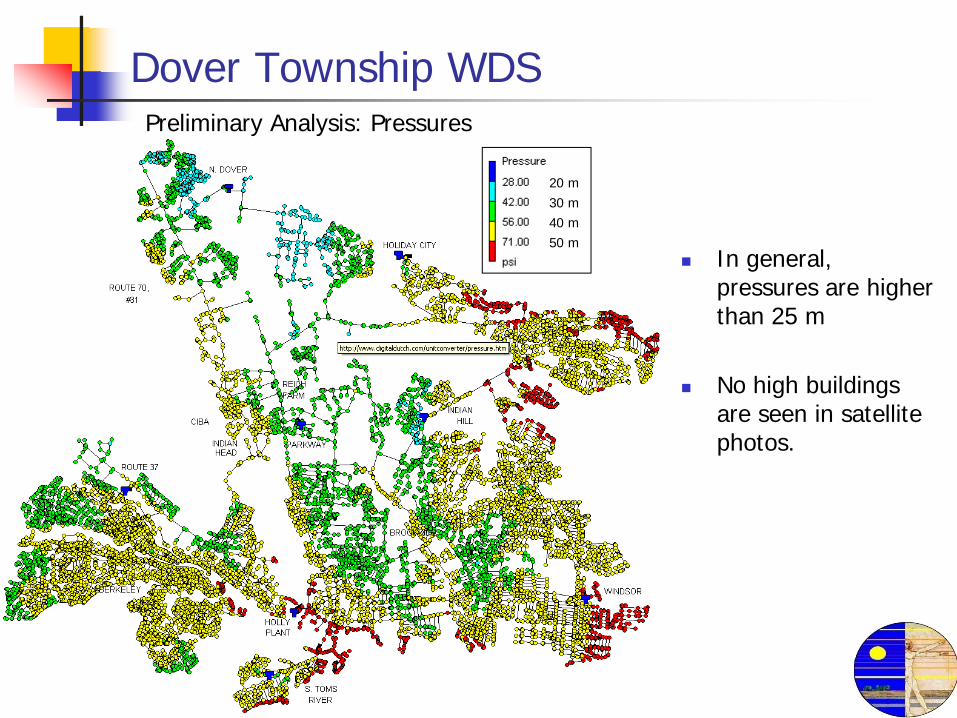
Dover Township WDSPreliminary Analysis: Pressures
20 m30 m40 m50 m
In general, pressures are higher than 25 m
No high buildings are seen in satellite photos.

Thank you…