Embed Size (px)
Citation preview

Energy-Efficiency Technologies and Benchmarking the Energy Intensity for the Textile Industry
Ali Hasanbeigi, Environmental Energy Technologies Division Lawrence Berkeley National Laboratory Abdollah Hasanabadi Isfahan University of Technology Mohamad Abdolrazaghi, Amirkabir University of Technology (Tehran Polytechnic) Reprint version of proceedings of the American Council for an Energy-Efficient Economy’s 2011 Summer Study on Energy Efficiency in Industry, held in Niagara Falls, New York, U.S.A., on July 26-29, 2011
June 2012
The empirical data collection of this study was funded by the Iranian Fuel Conservation Organization (IFCO) and was conducted by the authors under supervision of Shayanik Engineering Company.
ERNEST ORLANDO LAWRENCE BERKELEY NATIONAL LABORATORY
LBNL-5753E

Disclaimer
This document was prepared as an account of work sponsored by the United States Government. While this document is believed to contain correct information, neither the United States Government nor any agency thereof, nor The Regents of the University of California, nor any of their employees, makes any warranty, express or implied, or assumes any legal responsibility for the accuracy, completeness, or usefulness of any information, apparatus, product, or process disclosed, or represents that its use would not infringe privately owned rights. Reference herein to any specific commercial product, process, or service by its trade name, trademark, manufacturer, or otherwise, does not necessarily constitute or imply its endorsement, recommendation, or favoring by the United States Government or any agency thereof, or The Regents of the University of California. The views and opinions of authors expressed herein do not necessarily state or reflect those of the United States Government or any agency thereof, or The Regents of the University of California. Ernest Orlando Lawrence Berkeley National Laboratory is an equal opportunity employer.

1
Energy-Efficiency Technologies and Comparing the Energy
Intensity in the Textile Industry
Ali Hasanbeigi1, Abdollah Hasanabadi2, Mohamad Abdorrazaghi3,
1. Lawrence Berkeley National Laboratory; 2. Isfahan University of Technology; 3. Amirkabir University of Technology (Tehran Polytechnic)
Abstract
The textile industry is a complicated manufacturing industry because it is a fragmented and
heterogeneous sector dominated by small and medium enterprises (SMEs). Energy is one of the main
cost factors in the textile industry. In this study, thirteen textile plants from five major sub-sectors of the
textile industry in Iran, i.e. spinning, weaving, wet-processing, worsted fabric manufacturing, and carpet
manufacturing, were visited. The energy intensity of each plant was calculated and compared against
other plants within the same sub-sector. The results showed the range of energy intensities for plants in
each sub-sector. It also showed that energy saving/management efforts should be focused on motor-
driven systems in spinning plants, whereas in other textile sub-sectors thermal energy is the dominant
type of energy used and should be focused on. For conducting a fair and proper comparison/
benchmarking studies, factors that significantly influence the energy intensity across plants within each
textile sub-sector (explanatory variables) are explained. Finally, a list of energy efficiency improvement
measures observed during this study are presented.
1. Introduction
Although being an important industry sector with significant energy consumption, there are not many
scientific papers published to address the energy issues in the textile industry, especially when compared
to the energy-intensive industries. Ozturk (2005) reports on energy use and energy cost in the Turkish
textile industry based on conducted surveys. Martinez (2010) analyses the development of energy-
efficiency measures in the German and Colombian textile industries, using three alternative indicators to
measure energy-efficiency performance between 1998 and 2005. A recent study in Taiwan summarizes
the energy savings implemented by 303 firms in Taiwan’s textile industry from the on-line energy
Declaration System in 2008. It was found that the total implemented energy savings amounted to 1929
terajoules (Hong, et al. 2010). Zabaniotou and Andreou (2010) describe the development of alternative
energy in the textile industry by energy recovery from cotton ginning waste. Palanichamy and Sundar
Babu (2005) studied energy use in the Indian textile industry and present the energy-efficiency potential
availability. Hasanbeigi (2010) report is a comprehensive collection of around 190 sector-specific and
cross-cutting energy-efficiency measures and technologies for the textile industry.
This paper aims to contribute to the understanding of energy use in the textile industry by presenting the
energy use of textile plants in five major sub-sectors in Iran, i.e. spinning, weaving, wet-processing,
worsted fabric manufacturing, and carpet manufacturing. There are not many published papers that

2
cover the energy intensity of all of the above sub-sectors. The empirical data of this study was collected
from Iran’s textile industry in 2005. The complementary analysis of energy intensities and ways to
improve such analysis presented in this paper was done is 2010.
2. Methodology
Energy intensity analysis of a textile plant and comparing it with other plants and/or benchmarks enables
the top management as well as the energy manager of the plant to identify best practices of the plant or
other similar plants that can be replicated. Comparison of the energy intensities can be done in various
ways and for different purposes, and can be applied at many different scopes. However, there are certain
key issues and steps that should be considered while undertaking such comparison. Based on US EPA
(2007), the key steps in comparison/benchmarking include:
Determine the level of comparison/benchmarking: in this study the comparison was conducted
at the plant-level.
Develop metrics: in this study the energy intensity indicator was selected as the metric. The
energy intensities in this study are calculated based on the physical output of the plant to better
reflect the energy-efficiency. The electricity intensity and fuel intensities are calculated separately.
Conduct comparisons: This paper compares the energy intensities of plants in each textile sub-
sector.
Track performance over time: This step is necessary for plants to determine if energy
performance is improved or worsened over time in order to take the appropriate actions.
However, the plant performance monitoring was outside the scope of this study.
Five major textile sub-sectors are studied: 1) Spinning, 2) Weaving, 3) Wet-processing: Pretreatment,
dyeing, printing, and finishing of cotton or polyester fabrics or blended fabrics (cotton/polyester,
polyester/viscose, etc.), 4) Worsted fabric manufacturing, and 5) Carpet manufacturing. Within this
project, more than 20 textile plants from different sub-sectors were visited and walk-through audits were
conducted in each one. However, this paper presents the results for only 13 of these plants for which we
could get high quality data. For confidentiality reasons, no identifying information of the plants is
disclosed in this paper and the plants are identified only with alphabetical letters.
Fuel used in Iran’s textile industry is in the forms of fuel oil, gas oil, LPG, and natural gas mostly for steam
generation in steam boilers. Electricity is the common power source for machinery, air conditioning and
humidification systems, compressed air systems, lighting, office equipment, etc. Spinning, weaving and
wet-processing have the highest share of energy consumption in the textile industry worldwide. Spinning
plants mostly use electricity and only use fuel for producing steam used in the air conditioning systems in
cold seasons. If spinning plants have yarn dyeing section, then the steam is also used in the yarn dyeing
process. Similar to the spinning plants, weaving plants also use electricity in electric motor systems and
fuel is used for heating purpose in cold seasons. In addition, weaving plants usually have sizing process
which uses significant amount of steam for preparing the sizing material and also for drying the yarns
after sizing. The main type of energy used in wet-processing plants is the fuel use. This is because of

3
many high temperature processes that exist is wet-processing plants such as dyeing, printing, finishing,
and drying.
Three spinning plants were visited, two of which (plants A and B) were ring spinning and one (plant C)
was open-end spinning. Therefore, a comparison between energy consumption in ring and open end
spinning, which are the most common cotton-spinning systems in the textile industry, was conducted.
Two weaving plants with a production capacity of more than 6000 (ton/year) of cotton, polyester or
blended fabrics (cotton/polyester, polyester/viscose, etc.) were visited. Both of these plants have
preparation (warping and sizing of warp yarns) and weaving subsections. Three dyeing, printing, and
finishing plants which were processing cotton, polyester or blended fabrics (cotton/polyester,
polyester/viscose, etc.) were also studied. Two of them (factories F and G) have printing processes, while
another one (plant H) does not have a printing process. Furthermore, it should be highlighted that in
plants F and G the process of preparation and finishing on the fabric were more complete than those in
plant H. Hence, the quality and price of the final products of plant F and G are higher than those of for
plant H.
In the worsted fabric manufacturing sector of Iran’s textile industry, three plants were visited which are
among the largest worsted fabric manufacturing in Iran (plants I, J, K). All these plants were complex. In
other words, they all have spinning, weaving, dyeing, and finishing subsections. Also two carpet
manufacturing plants (plants L and M) were visited.
During the walk-through audits, which took one or two days per plant, the plant processes and energy
utilities were visited. No measurement was conducted during the visits and only existing data for
production and energy use (electricity and fuel) were collected. Based on the collected data, the energy
intensity of the plants was calculated for the year 2003 (both electricity and fuel intensities) using the
following formula:
Energy Intensity (MWh or GJ/unit of product) =
energy use (MWh or GJ) / production (unit of product)
3. Results and discussion
3.1. Spinning plants
Three spinning plants were studied, two of which were ring spinning (plants A, and B) and one was open-
end spinning (plant C). All of these plants have short staple spinning systems, which produce cotton yarn,
polyester yarn, or blended yarn (cotton/polyester, viscose/polyester, etc.). In all ring spinning plants, part
of the production was committed to double ply yarns. Doubling was being done by two-for-one (TFO)
machines. The production, energy use, and calculated energy intensities for these three spinning plants
are shown in Table 1.
As can be seen from Table 1, in all spinning plants, around 60% - 70% of the final energy is used as
electricity in machinery, humidification systems, compressed air systems, and lighting. Fossil fuels are

4
used for steam generation. The steam is used in the humidification system for heating purposes in cold
months.
Table 1. Production, energy use, and energy intensities for spinning plants in 2003
Plant Annual
Production
(tonne
yarn)
Annual
Electricity
consumption
(kWh)
Annual fuel
consumption
(GJ)
Electricity
Intensity
(MWh/tonne
yarn)
Fuel
Intensity
(GJ/tonne
yarn)
Total Final
Energy
Intensity
(GJ/tonne
yarn)
Total Primary
Energy Intensity
(GJ/tonne yarn) a
Plant A 2003 13,290,450 24,760 6.6 12.4 36.2 84.9
Plant B 8140 38,584,206 57,694 4.7 7.1 24.2 58.9
Plant C 2448 8,860,300 19,808 3.6 8.1 21.1 47.7
a In final energy, electricity use is equal to the electricity consumption at the end-use. In primary energy,
electricity use at the end-use is converted to the primary energy sources by taking into account the power
generation efficiency (average net heat rate of power plants) and transmission and distribution losses.
Table 1 also shows that specific electricity consumption in plant C is less than the other plants. The
reason could be that plant C has an open-end spinning system which has a shorter process in comparison
with ring spinning systems (plant A and B). In addition, the production capacity of an open-end spinning
machine is usually higher than that of a ring spinning machine. Also, because of the fact that in open-end
spinning system, the process is shorter with less machinery, the volume of the building which houses the
spinning unit requiring air conditioning is smaller. As a result, the load on the air conditioning system will
be less and the energy use is lower.
The specific fuel consumption in plant B is less than plant A and C. In addition to the differences in
efficiency, this could be because plant B is located in a city which has a hot climate and there is just four
cold months, but the other plants are located in cities which have about six cold months. As a result, in
plant B, steam is required for heating in a shorter period of time over a year.
3.2 Weaving plants
The two weaving plants studied were producing cotton, polyester or blended fabrics (cotton/polyester,
polyester/viscose, etc.) and both of them have preparation (warping and sizing of warp yarns) and
weaving subsections. Similar to spinning plants, in weaving plants the electricity us used mostly for
machinery, the humidification system, the compressed air system, and lighting. Fuels are used for
producing steam which is consumed in sizing machines and also in the humidification system in cold
months. The production, energy use, and calculated energy intensities for these two weaving plants are
shown in Table 2.

5
Table 2. Production, energy use, and energy intensities for weaving plants in 2003
Plant Annual
Production
(tonne
fabric)
Annual Electricity
consumption (kWh)
Annual fuel
consumption
(GJ)
Electricity
Intensity
(MWh/tonne
fabric)
Fuel
Intensity
(GJ/tonne
fabric)
Total Final
Energy
Intensity
(GJ/tonne
fabric)
Total
Primary
Energy
Intensity
(GJ/tonne
fabric)
Plant D 6027 1,329,0450 103,993 2.2 17.3 25.2 41.4
Plant E 6299 7,420,040 67,397 1.2 10.7 14.9 23.6
Table 2 shows that the specific electricity consumption in plant E is less than D. In addition to difference
in the energy efficiency in different plants studied, there are several other factors that cause the
differences observed in energy intensities. One factor could be that in plant E the weaving machines
were of the projectile type, which consumes less electricity compared to that of rapier weaving machines
used in plant D, assuming the same production conditions and product characteristics. In addition, it is
worth highlighting that although the efficiency of the weaving machines in plant D was higher than that
of in plant E, the production in plant E was higher. In plant E, the average width of fabrics produced on
weaving machines was greater than that of in plant D. This can cause a reduction in energy intensity since
a greater amount of fabric (in kilograms) is produced in the specific number of peaks on these weaving
machines. The specific fuel consumption in plant E is also less than D. In addition to higher energy-
efficiency in plant E, since there are fewer weaving machines in plant E and the production area is smaller,
less steam is required for the plant E air conditioning system for heating during cold months, compared
to that of plant D, which experiences a longer winter.
3.3 Wet-processing (pretreatment, dyeing/printing, and finishing) plants
For this textile sub-sector, three plants were visited and studied. The types of fabrics processed in these
plants were cotton, polyester or blended fabrics (cotton/polyester, polyester/viscose, etc.). Different
kinds of dyestuff and chemical auxiliaries and several types of machines were used in these plants. The
dominant type of energy used in wet-processing is fuel, as opposed to electricity. This is because of the
existence of many high-temperature processes in this sector which mainly require steam. Table 3 shows
the production, energy use, and calculated energy intensities for the three wet-processing plants studied.
Table 3. Production, energy use, and energy intensities for wet-processing plants in 2003
Plant
Annual
Production
(tonne
finished
fabric)
Annual
Electricity
consumption
(kWh)
Annual fuel
consumption
(GJ)
Electricity
Intensity
(MWh/tonne
finished fabric)
Fuel
Intensity
(GJ/tonne
finished
fabric)
Total Final
Energy
Intensity
(GJ/tonne
finished
fabric)
Total Primary
Energy
Intensity
(GJ/tonne
finished
fabric)
Plant F 3531 8,860,300 396,068 2.5 112.2 121.2 139.6
Plant G 2296 3,462,685 193,132 1.5 84.1 89.5 100.6
Plant H 1200 2,553,000 48,354 2.1 40.3 48.0 63.6

6
Plant F has the highest electricity intensity and plant G has the lowest (Table 3). In addition to difference
in the energy efficiency in different plants studied, there are several other factors that cause the
differences observed in energy intensities. Compared to other plants, the machines and equipment in
plant G were newer and most of the machine motors were energy-efficient motors and many of them
had inverters. However, Plant H had the lowest fuel intensity. As mentioned above, plants F and G include
a printing sub-process, while plant H does not have a printing sub-process. In addition, in plants F and G
the sub-processes of preparation and finishing are more comprehensive and complete than that of plant
H. As a result less thermal energy, which is the main type of energy consumed in wet-processing plants, is
required in plant H. In plant F, the average width of fabrics was less than that of in plant G and H. This
could result in energy waste in some machines, such as in cylinder dryers.
3.4 Worsted fabric manufacturing plants
In the worsted fabric manufacturing sub-sector three plants were studied. All of these plants were
complex; that is, they had spinning, weaving, dyeing, and finishing sub-processes in plant. The worsted
fabric typically contains 45% wool fiber and 55% polyester fiber. These two fibers are blended in the
spinning process.
The weaving machines in all plants were rapier type. There was a variety of machines in the dyeing and
finishing sub-processes of these plants, most using different technology providers. However, generally,
the dyeing and finishing machinery in plant “I” was more modern than that of the other plants. Contrarily,
the spinning and weaving machinery in plants J and K was newer than in plant I since the plant I owners
had reinstalled new machinery for these sections. Table 4 shows the production, energy use, and
calculated energy intensities for the three worsted fabric production plants.
Since spinning and weaving are the main electricity consumers in complex worsted fabric production
plants, and plants J and K have newer spinning and weaving machines, the electricity intensities of these
two plants are lower than that of plant I (Table 4). On the other hand, since in plant I the dyeing and
finishing machinery is modern, the fuel intensity of this plant is less than that of in the other two plants.
Plant K has the highest fuel intensity since machinery in the dyeing and finishing subsection of this plant
is very old compared to the other plants. In addition, the amount of redyeing done in plant K was
significantly high, as indicated by the plant’s records.
7
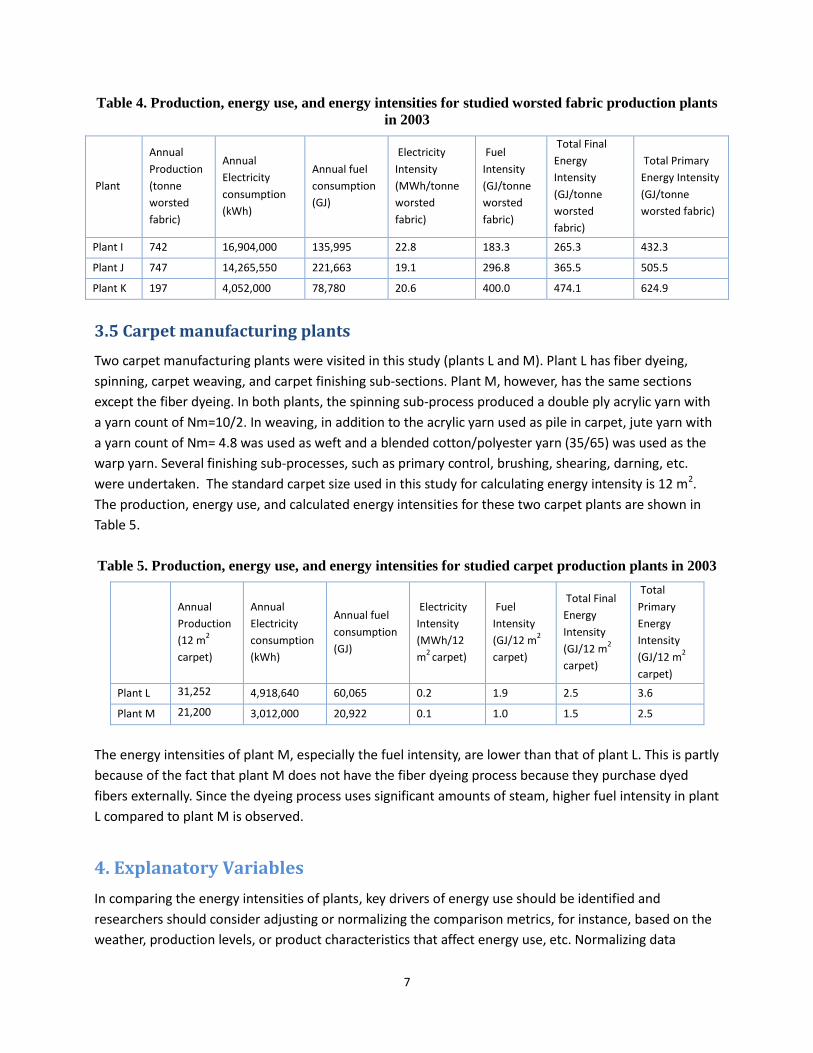
Table 4. Production, energy use, and energy intensities for studied worsted fabric production plants
in 2003
Plant
Annual
Production
(tonne
worsted
fabric)
Annual
Electricity
consumption
(kWh)
Annual fuel
consumption
(GJ)
Electricity
Intensity
(MWh/tonne
worsted
fabric)
Fuel
Intensity
(GJ/tonne
worsted
fabric)
Total Final
Energy
Intensity
(GJ/tonne
worsted
fabric)
Total Primary
Energy Intensity
(GJ/tonne
worsted fabric)
Plant I 742 16,904,000 135,995 22.8 183.3 265.3 432.3
Plant J 747 14,265,550 221,663 19.1 296.8 365.5 505.5
Plant K 197 4,052,000 78,780 20.6 400.0 474.1 624.9
3.5 Carpet manufacturing plants
Two carpet manufacturing plants were visited in this study (plants L and M). Plant L has fiber dyeing,
spinning, carpet weaving, and carpet finishing sub-sections. Plant M, however, has the same sections
except the fiber dyeing. In both plants, the spinning sub-process produced a double ply acrylic yarn with
a yarn count of Nm=10/2. In weaving, in addition to the acrylic yarn used as pile in carpet, jute yarn with
a yarn count of Nm= 4.8 was used as weft and a blended cotton/polyester yarn (35/65) was used as the
warp yarn. Several finishing sub-processes, such as primary control, brushing, shearing, darning, etc.
were undertaken. The standard carpet size used in this study for calculating energy intensity is 12 m2.
The production, energy use, and calculated energy intensities for these two carpet plants are shown in
Table 5.
Table 5. Production, energy use, and energy intensities for studied carpet production plants in 2003
Annual
Production
(12 m2
carpet)
Annual
Electricity
consumption
(kWh)
Annual fuel
consumption
(GJ)
Electricity
Intensity
(MWh/12
m2
carpet)
Fuel
Intensity
(GJ/12 m2
carpet)
Total Final
Energy
Intensity
(GJ/12 m2
carpet)
Total
Primary
Energy
Intensity
(GJ/12 m2
carpet)
Plant L 31,252 4,918,640 60,065 0.2 1.9 2.5 3.6
Plant M 21,200 3,012,000 20,922 0.1 1.0 1.5 2.5
The energy intensities of plant M, especially the fuel intensity, are lower than that of plant L. This is partly
because of the fact that plant M does not have the fiber dyeing process because they purchase dyed
fibers externally. Since the dyeing process uses significant amounts of steam, higher fuel intensity in plant
L compared to plant M is observed.
4. Explanatory Variables
In comparing the energy intensities of plants, key drivers of energy use should be identified and
researchers should consider adjusting or normalizing the comparison metrics, for instance, based on the
weather, production levels, or product characteristics that affect energy use, etc. Normalizing data

8
ensures better comparisons (US EPA, 2008). Within the scope of this study and the limited data available,
there were various constraints for complete normalization of the energy intensity of plants calculated
within each textile sub-sector. Plants were unwilling to provide detailed information about their product
portfolios and energy use because of confidentiality/competitiveness issues in the industry.
We tried to explain some of the explanatory variables mentioned below when analyzing and discussing
the energy intensity results given in previous section. We tried to choose plants with similar process
steps in each sub-sector, so they could be comparable, but none of the studied plants in each sub-sector
were completely identical in terms of process, equipment, capacity utilization, production characteristics,
etc. Also, the exclusive type of data collected in this study was the readily-available data in the plant
which only characterizes plants in the aggregate; i.e. at the plant level. This limitation limits opportunities
for detailed normalization of the energy intensities between non-identical plants. Some of the factors
that affect textile plant energy intensity and could be addressed during similar future studies are
explained below for each textile sub-sector studied.
Spinning: There are different factors that influence the energy intensity of cotton spinning plants, such as:
The type of spinning: whether the yarn spinning stage of the process is done on a ring frame, an
open-end machine, a compact spinning machine, or otherwise, could influence the energy
intensity per tonne of yarn produced. The most common cotton spinning systems are ring
spinning and open-end spinning systems. Since open-end spinning machines usually have a
higher production capacity and also the whole spinning process is shorter for open-end spinning
(because of the omission of roving and combing sub-processes), the energy intensity of open-end
spinning is usually lower than that of ring spinning. Therefore, in comparing the energy intensity
of spinning plants, it is important to consider the type of spinning being undertaken in each plant.
It also worth mentioning that many spinning plants have both ring and open-end spinning
machines. Therefore, special care should be given in comparing the energy intensity in such
plants.
Combed or carded yarn: in the production of cotton yarn a combing process is sometimes
applied to produce finer yarn. However, this process is not done on all yarns. Since combing is an
additional process, it increases energy intensity. Therefore, whether or not the yarn is combed
could also be consider in comparison.
Yarn count: yarn count is the metric that represents the fineness of the yarn (e.g. weight per
length). The finer the yarn, the more time it takes on the ring frame or open-end machines
(which are the bottle-neck of yarn production). In other words, the production of one tonne of
yarn with 30 tex1 takes more time on the ring frame than that of 20 tex. Hence, the energy
intensity of the production of finer yarn is higher. This is an important factor that could be
considered when comparing spinning plants, if the data is available.
Yarn twist: the number of twists per one meter of the yarn also influences energy intensity. The
number of twists in the yarn is defined by the final use of the yarn. For instance, yarns used in
weaving usually need more twists than yarns used in knitting. The higher the number of twists
1 Tex is one of the several systems to measure the yarn count (fineness). The tex count represents the weight in grams per 1
kilometer (1000 meters) of yarn. For example, a yarn numbered 20 tex weighs 20 grams per kilometer. The tex number increases with the size of the yarn.

9
per meter, the higher the time spent on the spinning machine; thus higher energy intensity.
Type of the fiber: The type of fibers used in spinning (cotton, polyester, viscose, or combination
of two of them) also influences energy intensity. Cotton usually needs more cleaning; thus it goes
through more cleaning sub-processes in the spinning process. This could slightly increase the
energy intensity of cotton yarns compared to that of polyester and viscose fiber yarns.
The climate: The condition of the air inside the spinning plants should be maintained at a fixed
level, which depends on the type of fibers being processed. Therefore, in different seasons
cooling and heating is applied in the humidification system of the plant. In areas with more
moderate climates, less energy is used for heating and/or cooling. Four-season climates or types
of extreme weather may result in the need for more heating and cooling which increases energy
intensity. This factor was considered while discussing the results of this paper.
Yarn finishing processes: Spinning plants commonly have additional processes after spinning such
as doubling, yarn singeing, mercerizing, dyeing, etc. The existence of any of these processes will
increase the plant’s energy use. Special care should be given to this issue while conducting
comparison between spinning plants in order to make sure identical processes are benchmarks.
Plants usually have only one electricity metering system and one system for measuring fuel use,
often reporting a single value of total energy use without separating calculating energy use for
each process. This issue was taken into account in this study, as each of the plants was visited in
person by the authors and the existence of finishing processes was assessed.
Weaving: Different factors that influence the energy intensity of weaving plants are:
The type of weaving machine (loom): loom type can significantly influence energy intensity.
Therefore, when comparing, the type of loom should be identified. However, it should be noted
that some looms can only produce fabrics with certain specifications and not all looms can
produce all types of fabrics. We explained the type of looms used in weaving plants surveyed
and their effect on the calculated energy intensities above.
The weight of the fabric: The weight of the fabric (g/m2) influences the amount of production (in
tonnes) and thus has an effect on energy intensity. This factor should be taken into account in the
normalization of weaving plant energy intensity.
The width of the fabric: If the width of the fabric is closer to the optimum width of the weaving
machine for which it is designed, energy intensity will be lower than for fabrics of shorter widths,
assuming both fabrics have similar weights in g/m2.
The sizing process: Some weaving plants do the sizing of the warp yarns onsite while some
purchase the sized yarn from outside. Sizing uses significant amounts of both electricity and
steam and has an effect on the final energy intensity of the plant.
The climate: The condition of the air inside the weaving plant should be maintained at a fixed
level depending on the type of fibers being processed. Therefore, for the same reasons explained
for spinning above, this will influence the energy intensity of weaving plants.
Wet-processing: Wet-processing of fabric comprises various processes and equipment. Different factors
can influence the energy intensity of wet-processing plants such as:

10
The preparation process: Depending on the type of fabric and the specifications of the final
products, some fabric may go through a greater number of preparation processes like washing.
This directly influences the energy intensity of the final products.
The final product: Depending on the specifications of the final products, some fabrics may go
through additional finishing processes, such as waterproofing, fireproofing, coating, softening,
etc. While such additional processes may increase the value of final products, they also increase
energy intensity.
Existence of printing sub-processes: Some fabric wet-processing plants have both printing and
dyeing sub-processes, while some others just have either one or the other.
Geographic location: The boiling point of water decreases with increases in altitude. Significant
amounts of steam are used in wet-processing plants; therefore, the geographic location of the
plant can influence energy intensity.
Worsted fabric manufacturing: The worsted fabric manufacturing plants surveyed in this study are all
complex plants with spinning, weaving and wet-processing; thus, all the issues mentioned above for the
spinning, weaving, and wet-processing sub-processes are applicable to them as well.
Carpet manufacturing: Colored acrylic fibers are used in carpet manufacturing. Some plants have a fiber
dyeing sub-process, while some others do not. The existence of a fiber dyeing sub-process significantly
influences the energy intensity of the plant.
In this study the unit of production examined is a 12 m2 carpet. This is because the 12 m2 carpet
is the most common carpet produced in Iran. However, it should be noted that the specific
weight (g/m2) of carpets this size can vary. This can have an effect on the energy intensity of the
product. In Iran, however, most 12m2 carpets have close specific weights,
Many researchers have compared the energy intensity of textile plants in different sub-sectors of the
textile industry together; in a few cases the energy intensity of the textile industry is represented by a
single number for the whole sector. Given the wide variety of substrates, processes, machinery and
components used, and finishing steps undertaken, this aggregated energy intensity measure and sub-
sectoral comparisons are of little or no use. Thus, for the textile industry and any other heterogeneous
industry, energy intensity should be calculated for each sub-sector separately, as it is done in this paper,
in order to have a better representation of energy use efficiency in each sub-sector and have more
accurate comparison.
Also evaluating and acting on comparison/benchmarking results are as important as undertaking the
comparison activity. Successful energy intensity comparison/benchmarking also requires monitoring and
verification to ensure continuous improvement. This is more relevant for plant engineers and energy
managers. Monitoring and evaluation was beyond the scope of this particular study.
5. Energy-efficiency Improvement Opportunities in the Textile Industry
Based on the walk-through audit conducted in the plants by the experts as well as the results of this
analysis, a list of energy-efficiency measures was prepared and included in the reports that were

11
submitted to the plants, so they could consider the implementation of those measures. Below we briefly
present the list of some of the important energy-efficiency measures for different textile subsectors
which are based on both walk-through audits. The typical energy savings and payback periods given in
the table are from Hasanbeigi (2010).
5.1. Potential energy-efficiency measures in spinning plants
Energy efficiency measures that can be applied in spinning plants studied are presented in Table 6.
Table 6. Energy-efficiency measures for spinning plants (Hasanbeigi, 2010)
No. Energy-efficiency measures Typical Electricity saving Typical
Payback
Period
(Year)*
1 Installation of electronic roving end-break stop-motion detectors instead of
pneumatic systems
3.2 MWh/year/machine <1
2 Replacement of lighter spindles in place of conventional spindles in ring
frames
23 MWh/year/ring frame 8
3 Optimization of ring diameters with respect to yarn count in ring frames 10% of ring frame energy
use
2
4 False ceilings in production area 8 kWh/ year/spindle 1.2
5 Installation of energy-efficient motors in ring frames 6.3 -18.83 MWh/year/motor 2 - 4
6 The use of light weight bobbins in ring frames 10.8 MWh/year/ring frame <1
7 Installation of a soft starter on motor drives of older ring frames 1 – 5.2 MWh/year/ring
frame
2
8 Installation of variable frequency drives on autoconer machine 331.2 MWh/year/plant <1
9 Replacement of nozzles with energy-efficient mist nozzles in yarn
conditioning room
31MWh/year/humidification
plant
<1
10 Installation of variable frequency drives (VFD) for washer pump motors in
humidification plants
20
MWh/year/humidification
plant
<1
11 Installation of VFD on humidification system fan motors for flow control 18 -105 MWh/year/fan 1 - 2
12 Automatic energy-efficient control systems for humidification systems 50 MWh/year/
humidification plant
2 – 3.5
*Wherever the payback period was not provided, but the energy and cost were given, the payback period is
calculated assuming the price of electricity of US$75/MWh (US$0.075/kWh).
5.2. Potential energy-efficiency measures in weaving plants
Weaving machines (looms) account for a significant portion of energy consumption in a weaving plant.
Humidification, compressor and lighting accounts for the rest of the energy used, depending on the types
of the looms and wet insertion techniques (Sivaramakrishnan, et al. 2009). Since a loom is just a machine,
there are not many physical retrofits that can be done on existing looms to improve their efficiency.
Different loom types differ in their energy intensity (energy use per unit of product). However, for a given
type of loom, most of the opportunities for energy-efficiency improvements are related to the way the

12
loom is used (productivity), auxiliary utilities (humidification, compressed air system, lighting, etc), and
the maintenance of the looms.
All the measures mentioned in the previous sections which improve the efficiency of humidification
systems used in spinning processes are also to a great extent applicable to weaving plants. In addition to
those, the below measures will also improve efficiency in the weaving process:
Loom utilization should be more than 90%. A 10% drop in utilization of loom machines will
increase specific energy consumption by 3-4% (Sivaramakrishnan, et al. 2009).
The electric motor of the loom can be replaced by an energy-efficient motor.
The type of weaving machine can significantly influence the energy use per unit of product.
Therefore, when buying new looms, the energy-efficiency of the loom should be kept in mind.
The quality of warp and weft yarn directly influences the productivity and hence efficiency of the
weaving process. Therefore, using yarns with higher quality that may have a higher cost will result in
less yarn breakage and stoppage in the weaving process, and can eventually be more cost-effective
than using cheap, low quality yarns in weaving.
5.3. Potential energy-efficiency measures in wet-processing plants
Energy efficiency measures that can be implemented in wet-processing plants are presented in Table 7.
There are also many cross-cutting energy-efficiency measures applicable to the studied textile plants in
different energy systems such as electric motors, pumps, fans, and compressed air systems, steam
systems, and lighting. For a complete list of energy-efficiency technologies and measures and a brief
explanation for each measure please refer to Hasanbeigi (2010). For worsted fabric production plants and
carpet manufacturing, some of the measures proposed above were also applicable depending on the
production process (spinning, weaving, wet-processing).

13
Table 7. Energy-efficiency measures for wet-processing plants (Hasanbeigi, 2010)
No. Energy-efficiency measures Typical Fuel saving Typical Electricity
saving
Typical
Payback
Period
(Year)*
Preparatory Process
1 Combined preparatory treatments in wet
processing, such as washing, desizing, and scoring
up to 80% of preparatory
treatments energy use
2 Cold-pad-batch pretreatment up to 38% of pretreatment fuel
use
up to 50% of
pretreatment
electricity use
3 Bleach bath recovery systems US$38,500 -US$118,400 saving 2.1
4 Use of counter-flow current for washing process 41% - 62% of washing energy use
5 Installing heat recovery equipment for continuous
washing machines 5 GJ/tonne fabric
6 Enzymatic removal of residual hydrogen peroxide
after bleaching 2,780 GJ/year/plant
Dyeing and Printing Process
7 Heat insulation of high temperature/ high
pressure dyeing machines 210 - 280 GJ/year/plant 3.8 – 4.9
8 Automated preparation and dispensing of
chemicals in dyeing plants 1.3 – 7.5
9 Installation of VFD on circulation pumps and color
tank stirrers
138
MWh/year/plant < 1
10 Cooling water recovery in batch dyeing machines
(jet, beam, package, hank, jig and winches) 1.6 - 2.1 GJ/tonne fabric 1.3 - 3.6
11 Cold-pad-batch dyeing systems 16.3 GJ/tonne of dyed fabric 1.4 - 3.7
12 Discontinuous dyeing with airflow dyeing
machines up to 60% of machine's fuel use
13 Use of steam coils instead of direct steam heating
in batch dyeing machines (winch and jigger) 4580 GJ/year/plant
14 Equipment optimization in jet dyeing machines 1.8 - 2.4 kg steam /kg fabric increased 0.07 -
0.12 kWh/kg fabric 1.4 - 3.1
15 Heat recovery of hot waste water in autoclaves 554 MJ/batch product
16 Reducing the need for re-processing in dyeing 10% -12% of dyeing fuel use
17 Reduce rinse water temperature 10% of rinsing energy use
18 Heat recovery from hot rinse water 1.4 - 7.5 GJ/tonne fabric rinsed < 1
Drying and Finishing Process
19 Introduce mechanical de-watering or contact
drying before dryer/stenters 13% - 50% of stenter energy use
20 Avoid overdrying in dryer/stenters
21 Close exhaust streams during idling in dryer
/stenters
22 Optimize exhaust humidity in dryer /stenters 20 - 80% of stenter energy use
23 Install heat recovery equipment in dryer /stenters 30% of stenter energy use 1.5 - 6.6
24 Use of sensors and control systems in dryer
/stenters 22% of stenter fuel use
11% of stenter
electricity use 1.5 - 6.7
*Wherever the payback period was not provided, but the energy and cost were given, the payback period is
calculated assuming the price of electricity of US$75/MWh (US$0.075/kWh).

14
6. Conclusion
The results showed the range of energy intensities for plants in each sub-sector. It also showed that
energy saving/management efforts should be focused on motor-driven systems in spinning plants,
whereas in other textile sub-sectors thermal energy is the dominant type of energy used and should be
focused on. For conducting a fair and proper comparison/ benchmarking studies, factors that significantly
influence the energy intensity across plants within each textile sub-sector (explanatory variables) should
be taken into account or at least acknowledged. The data collection for the plant level energy intensity
with explanatory variable taken into account, process-level energy intensity, or equipment-level energy
intensity is difficult. Finally, a list of energy efficiency improvement measures observed during this study
are presented.
Acknowledgments
The empirical data collection of this study was funded by the Iranian Fuel Conservation Organization
(IFCO) and was conducted by the authors under supervision of Shayanik Engineering Company. The
authors would like to thank staff of Shayanik Engineering Company for their input to this study, especially
Ali Ghoba and Saeed Zahabiyoun. Authors also would like to thank Maryam Elhambakhsh from IFCO for
her support for this research. Authors are thankful to Lynn Price from Lawrence Berkeley National
Laboratory, Henri van Rensburg from Marbek Consultant Company in Canada, and Ernst Worrell from
Utrecht University for their valuable comments on this paper. Also, we are grateful to Christopher
Williams from University of California, Berkeley for editing the English of this paper. Finally, we would like
to thank all companies that participated in this study and those who helped us to complete this study.
15
References
Hasanbeigi, A., 2010. Energy-Efficiency Improvement Opportunities for the Textile Industry. Berkeley, CA:
Lawrence Berkeley National Laboratory. Available at http://china.lbl.gov/publications/energy-
efficiency-improvement-opportunities-textile-industry
Hong, G.B.; Su, T.L.; Lee, J.D.; Hsu, T.C.; Chen, H.W., 2010. Energy conservation potential in Taiwanese
textile industry. Energy Policy 38 (2010) 7048-7053
Martínez, C.I.P, 2010. Energy use and energy efficiency development in the German and Colombian
textile industries. Energy for Sustainable Development 14 (2010) 94-103.
Ozturk, H.K., 2005. Energy usage and cost in textile industry: A case study for Turkey. Energy 30 (2005)
2424–2446.
Palanichamy, C. and Sundar Babu, N., 2005. Second stage energy conservation experience with a textile
industry. Energy Policy 33 (2005) 603–609.
Sivaramakrishnan, A.; Muthuvelan, M.; Ilango, G.; Alagarsamy, M., 2009. Energy saving potential in
spinning, weaving, knitting, processing, and garmenting. Available at: http://www.emt-
india.net/Presentations2009/3L_2009Aug8_Textile/06-SITRA.pdf
U.S. Environmental Protection Agency (US EPA), 2007, Guidelines for Energy Management. EnergyStar
Program.
U.S. Environmental Protection Agency (US EPA), 2008.Benchmarking to save energy - Protect Our
Environment through Energy Efficiency. Energy Star Program.
Zabaniotou, A.; Andreou, K., 2010. Development of alternative energy sources for GHG emissions
reduction in the textile industry by energy recovery from cotton ginning waste. Journal of
Cleaner Production 18 (2010) 784-790