Embed Size (px)
Citation preview

Energy Efficiency and Waste Reduction at Plastech Corporation
Emily DanielMnTAP Advisor: Michelle Gage
On-Site Supervisors: Jerry Miller, Doug Hoffbeck

• Custom plastic injection molding plant
• Founded in 1956 and acquired by Dennis Frandsen in 1963
• 44 Injection Molding Machines
• Business to Business Operation, 24/7
• Manufacture, assemble, and deliver parts both state and nationwide
Company Background

Reasonings For MnTAP Assistance
• Material Waste Reduction• Excess, Contaminate, and Scrap
• Energy Efficiency• Motor Idle, Compressed Air
• Assembly Assessment• Tools, Processes, Space
• Determine benefits to Plastech

Material Waste Reduction

Approach
• Quantify excess material and scrap plastic generated from defects or rejects that is not already reused• Understanding the material cycle
• Scrap tracking
• Collection period
• Research alternatives for disposal of material• Resale and External Recycling

Material Cycle
Raw Plastic Pellets
MixingMolded
into Parts
Sprues, Rejects, Excess
Material
RegroundThrown
Out
Dyes or Additive
Finished Product

Findings – Material Efficiency
• Excess Materials
• Contaminated Materials
• Scrap Collection
• Regrind vs Purgings
• Mixed Materials vs Stream Separation

Solutions & Savings
• Resale of Excess• $13,500
• Resale of Contaminate• $3,600
• Stream Separation• Up to 104,000 lbs/yr (50%), $3,000
• Quincy Recycle
• Padnos
• Sattler Plastics Company
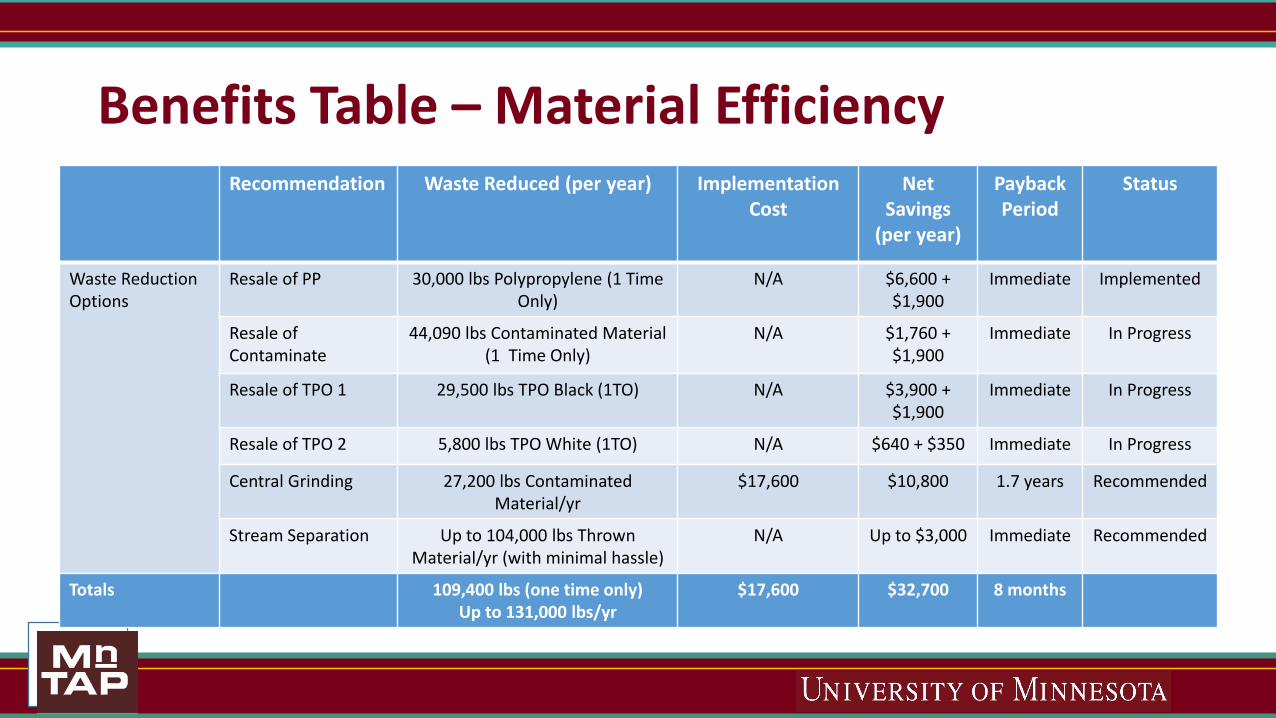
Benefits Table – Material EfficiencyRecommendation Waste Reduced (per year) Implementation
CostNet
Savings (per year)
PaybackPeriod
Status
Waste Reduction Options
Resale of PP 30,000 lbs Polypropylene (1 Time Only)
N/A $6,600 + $1,900
Immediate Implemented
Resale of Contaminate
44,090 lbs Contaminated Material (1 Time Only)
N/A $1,760 + $1,900
Immediate In Progress
Resale of TPO 1 29,500 lbs TPO Black (1TO) N/A $3,900 + $1,900
Immediate In Progress
Resale of TPO 2 5,800 lbs TPO White (1TO) N/A $640 + $350 Immediate In Progress
Central Grinding 27,200 lbs Contaminated Material/yr
$17,600 $10,800 1.7 years Recommended
Stream Separation Up to 104,000 lbs Thrown Material/yr (with minimal hassle)
N/A Up to $3,000 Immediate Recommended
Totals 109,400 lbs (one time only)Up to 131,000 lbs/yr
$17,600 $32,700 8 months

Energy Efficiency
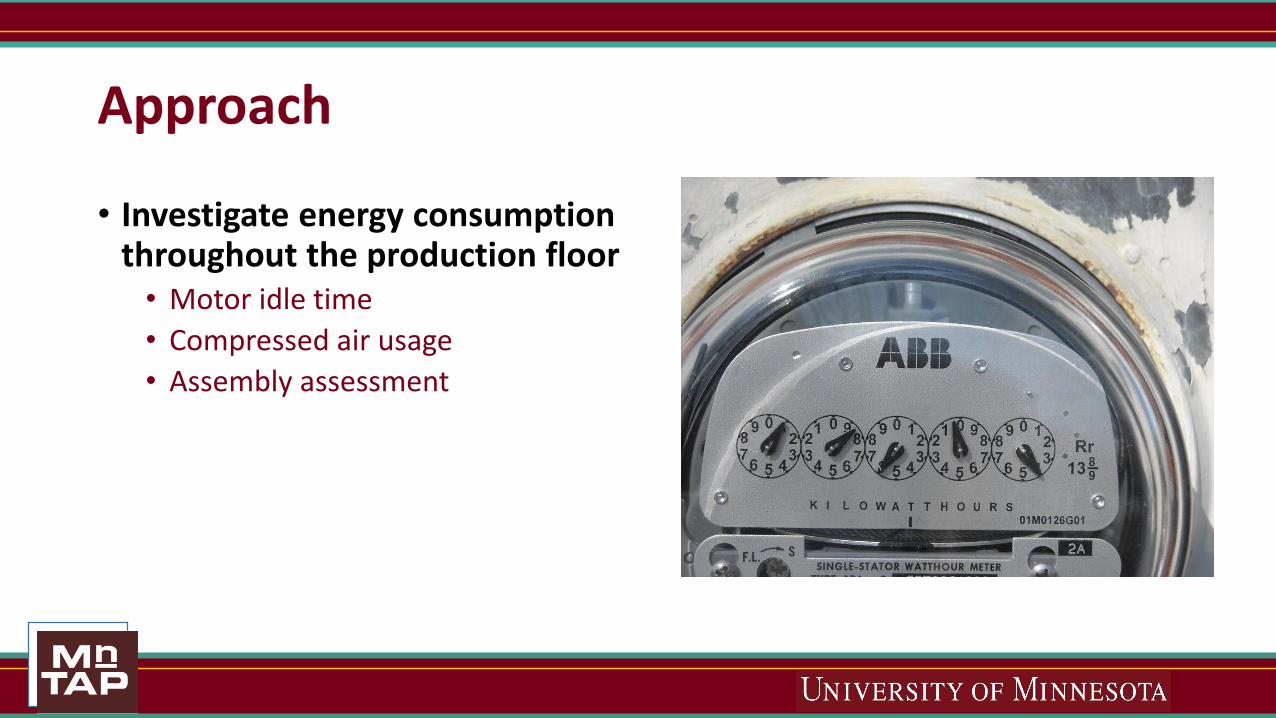
Approach
• Investigate energy consumption throughout the production floor• Motor idle time
• Compressed air usage
• Assembly assessment
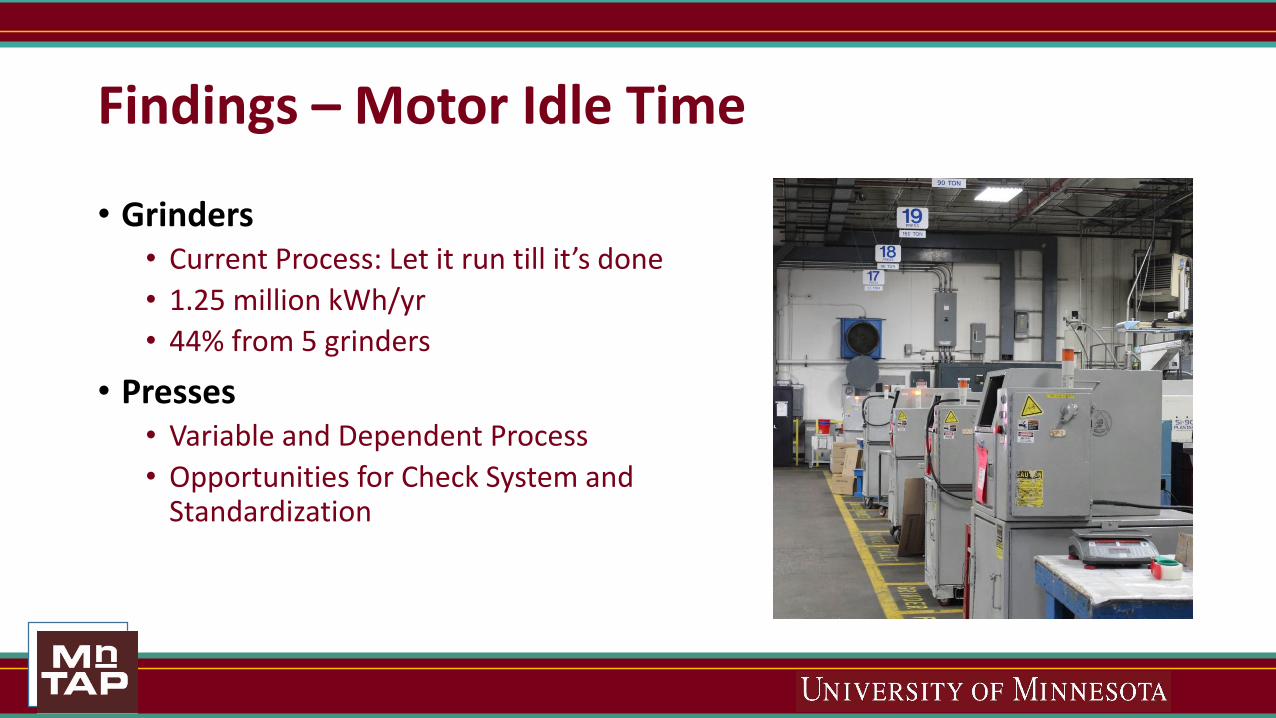
Findings – Motor Idle Time
• Grinders• Current Process: Let it run till it’s done
• 1.25 million kWh/yr
• 44% from 5 grinders
• Presses• Variable and Dependent Process
• Opportunities for Check System and Standardization
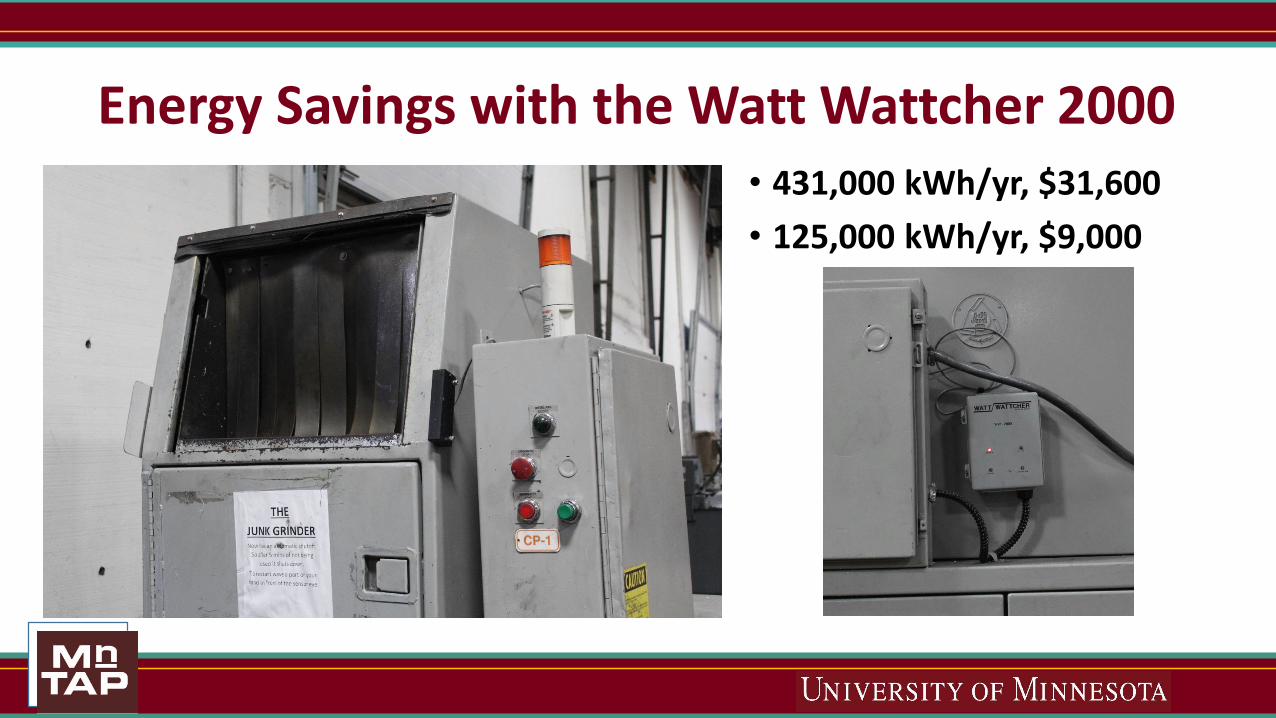
Energy Savings with the Watt Wattcher 2000• 431,000 kWh/yr, $31,600
• 125,000 kWh/yr, $9,000

Central Grinding vs Watt Wattcher 2000
• One Employee, One Room, One Job• 27,200 lbs of material/yr ($25,000)
• 658,000-692,000 kWh/yr ($48,000-$50,500)
• Noise Reduction
• Clean Production Floor
• Watt Wattcher 2000• 35 units
• 692,000 kWh/yr
• Payback of 9 months
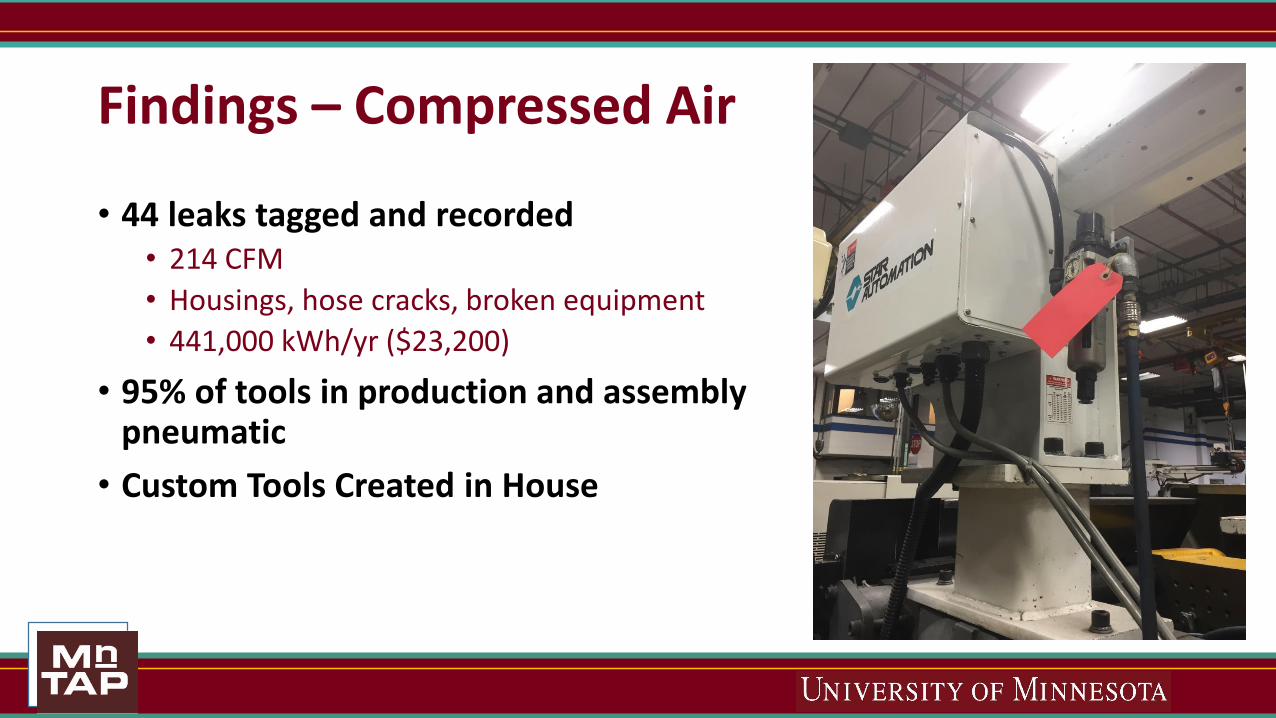
Findings – Compressed Air
• 44 leaks tagged and recorded• 214 CFM
• Housings, hose cracks, broken equipment
• 441,000 kWh/yr ($23,200)
• 95% of tools in production and assembly pneumatic
• Custom Tools Created in House
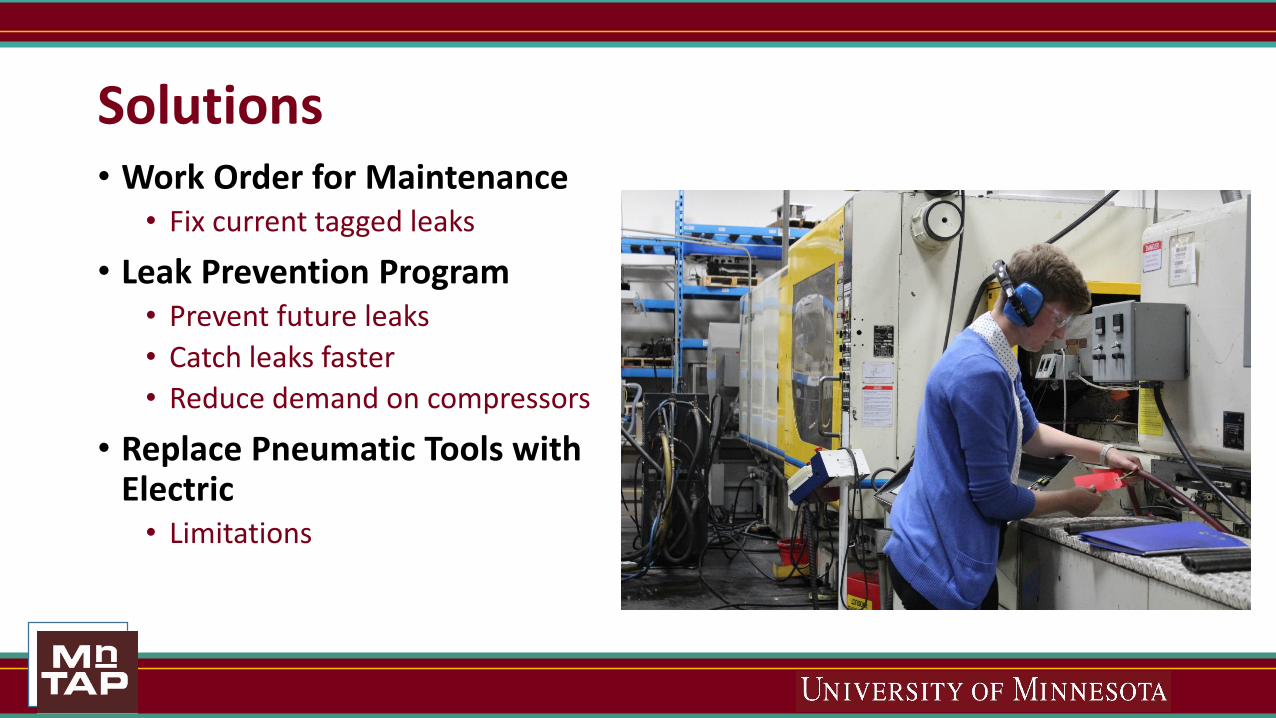
Solutions• Work Order for Maintenance
• Fix current tagged leaks
• Leak Prevention Program• Prevent future leaks
• Catch leaks faster
• Reduce demand on compressors
• Replace Pneumatic Tools with Electric• Limitations
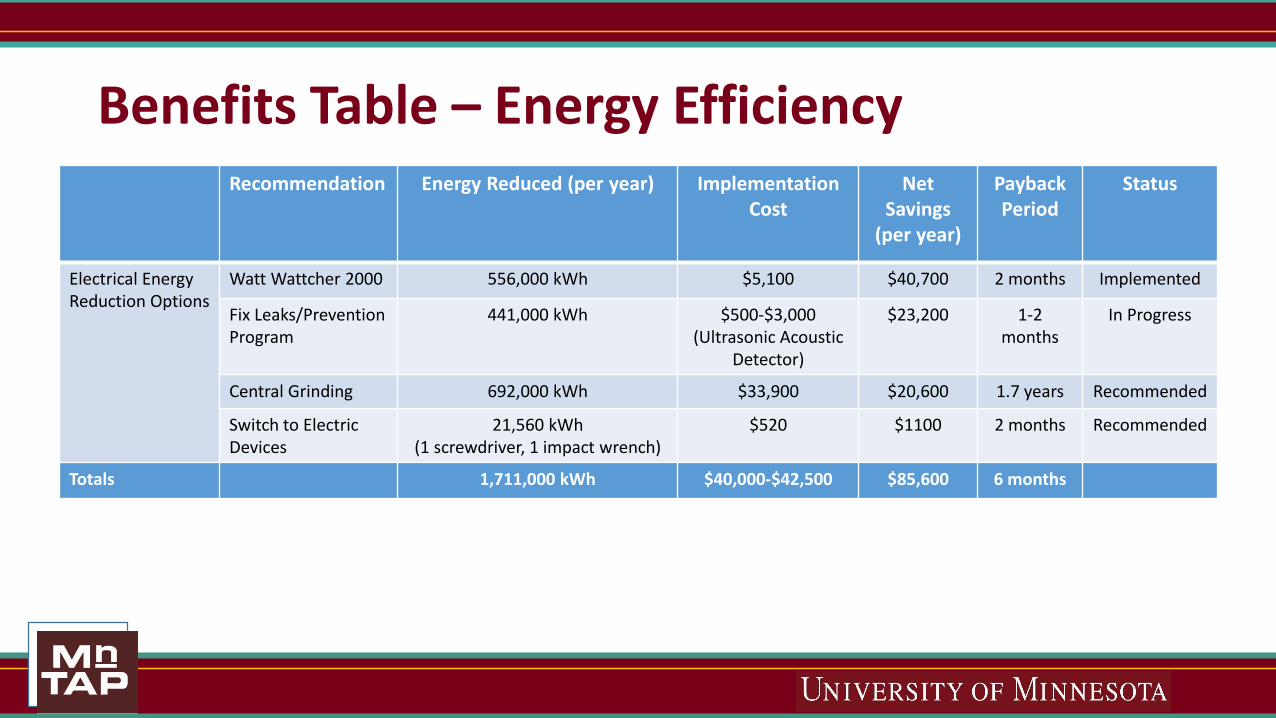
Benefits Table – Energy EfficiencyRecommendation Energy Reduced (per year) Implementation
CostNet
Savings (per year)
PaybackPeriod
Status
Electrical Energy Reduction Options
Watt Wattcher 2000 556,000 kWh $5,100 $40,700 2 months Implemented
Fix Leaks/PreventionProgram
441,000 kWh $500-$3,000(Ultrasonic Acoustic
Detector)
$23,200 1-2 months
In Progress
Central Grinding 692,000 kWh $33,900 $20,600 1.7 years Recommended
Switch to Electric Devices
21,560 kWh(1 screwdriver, 1 impact wrench)
$520 $1100 2 months Recommended
Totals 1,711,000 kWh $40,000-$42,500 $85,600 6 months

Findings – Assembly AssessmentStagin
gStagin
g
Staging
Staging
Staging Stag ing
Upstairs Assembly Area
Downstairs Assembly Area
72”Scale:

Assembly Processes
• Process A• Assembly
• Warehouse
• Shipping
• 1 Forklift Driver
• Processes B & C• <20 parts per tote
• 1-3 totes per hour
• Assembly Upstairs
• Material Downstairs

Solutions – Process A, B, C
• Move Process A to New Location• Eliminate forklift use and traffic
• 2,400 Gallons of Propane/yr ($2,800/yr)
• Employee available to be trained in new location• $25,000/yr saved
• Move Processes B and C Downstairs• Reduce Forklift Use
• 200 Gallons of Propane/yr
• Labor Efficiencies• $1,350/yr saved
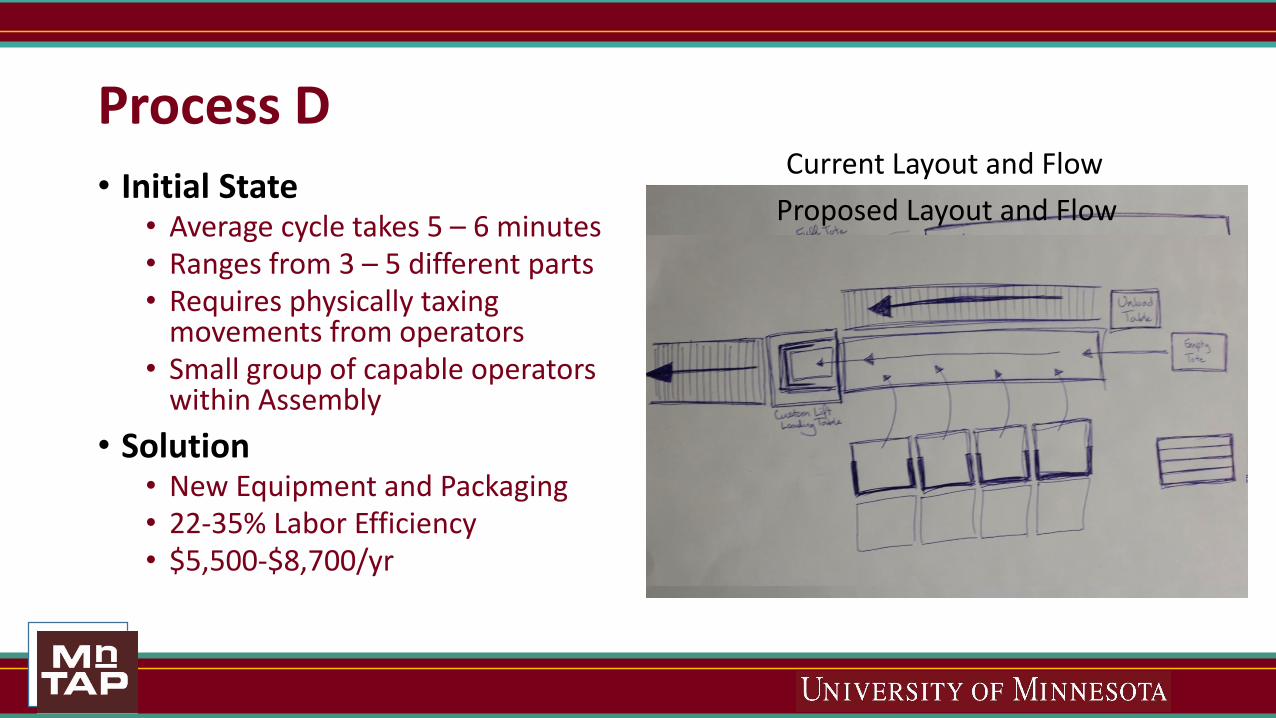
Process D
• Initial State• Average cycle takes 5 – 6 minutes• Ranges from 3 – 5 different parts• Requires physically taxing
movements from operators• Small group of capable operators
within Assembly
• Solution• New Equipment and Packaging• 22-35% Labor Efficiency• $5,500-$8,700/yr
Current Layout and Flow
Proposed Layout and Flow

Benefits Table – Process EfficiencyRecommendation Reductions (per year) Implementation
CostNet Savings (per year)
PaybackPeriod
Status
Assembly Process Efficiency Improvement Options
Move Process A 2,400 Gallons of Propane Gas,Labor Efficiency
N/A $2,800 (Gas),$25,000 (Labor)
Immediate Recommended
Move Process B 60 Gallons of Propane Gas,Labor Efficiency
N/A $70 (Gas),$320 (Labor)
Immediate Implemented
Move Process C 150 Gallons of Propane Gas,Labor Efficiency
N/A $170 (Gas)$790 (Labor)
Immediate Recommended
Process D New Equipment
22-35% Assembly Time(Labor Efficiency)
$8,900 $5,500-8,700 1-2 years Recommended
Totals 2,600 Gallons Propane22-35% Efficiency
$8,900 $34,600-$37,900 3-4months

In Conclusion
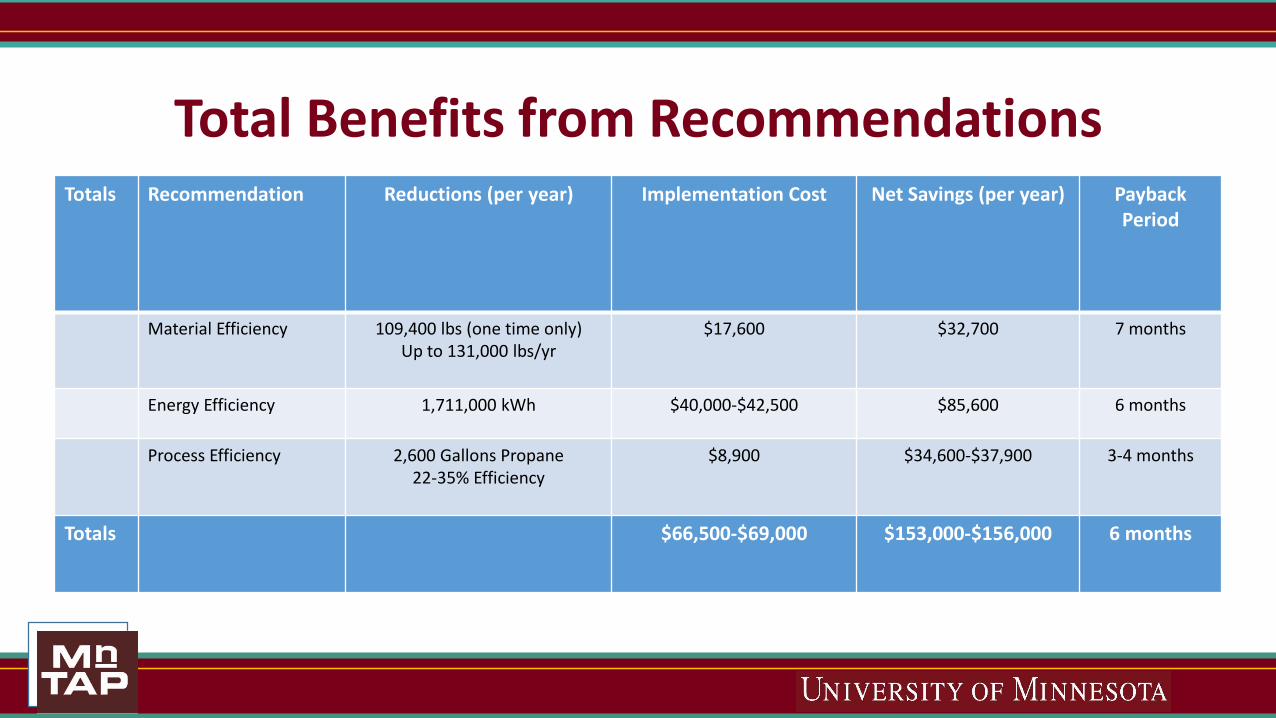
Total Benefits from RecommendationsTotals Recommendation Reductions (per year) Implementation Cost Net Savings (per year) Payback
Period
Material Efficiency 109,400 lbs (one time only)Up to 131,000 lbs/yr
$17,600 $32,700 7 months
Energy Efficiency 1,711,000 kWh $40,000-$42,500 $85,600 6 months
Process Efficiency 2,600 Gallons Propane22-35% Efficiency
$8,900 $34,600-$37,900 3-4 months
Totals $66,500-$69,000 $153,000-$156,000 6 months

Personal Gains
• How to fill a space with sticky notes• Collect, organize, and analyze data
• Concise information
• Confidence in abilities
• Importance of collaboration and individual responsibilities
• Every moment is a learning opportunity

Questions?