Embed Size (px)
Citation preview

WORCESTER POLYTECHNIC INSTITUTE IQP JAO 1402
Energy Consumption of
WPI Buildings An Interactive Qualifying Project
Jeremy Giguere, Cheng Jiang, Bryan Martins, Douglas Perez
Advisors: Prof. John Orr, Prof. Guillermo Salazar
March 13, 2014

ii
Abstract This report examines the energy efficiency of Founders Hall and East Hall on the WPI campus. East Hall, a
LEED certified building, is compared and contrasted to Founders Hall, a non-LEED certified building, by
analyzing and evaluating electricity and gas consumption through a walk-through audit, meter recording, and
surveys conducted in the winter season. Adding weather seals around doors, better placement of lighting,
and prioritizing thermal comfort are some recommendations to improve energy efficiency.

iii
Authorship All group members contributed equally to this project. Jeremy focused on the energy audit, including
background research, taking meter readings for East Hall, and performing walk-through audits of East and
Founders Hall. He also worked on formatting, style, and editing the paper along with contacting Residential
Services and Chartwells. Cheng worked on the background research of previous IQPs, the WPI Sustainability
Plan, human behavior and energy consumption, the East Hall LEED scorecard, retrocommissioning, and
SynergE. Cheng also focused on survey design, the analysis of the East Hall survey responses, and some
analysis of energy consumption and energy bills. Bryan performed background research of Energy Star, BIM,
and survey design. Bryan also worked on survey development using Qualtrics, survey distribution, analysis of
Founders Hall and Res Services responses, writing about the findings and recommendations, and contributed
to the proofreading of the final report. Douglas focused on researching LEED, performing energy audits,
collecting and organizing the energy audit data including meter readings and temperature readings, and
analysis of energy consumption.

iv
Acknowledgements First and foremost, we would like to thank Mr. William Grudzinski, Chief Engineer for the WPI Department of
Facilities. He has been invaluable in working with us to gather building and energy usage data, and has
become our primary contact with Facilities. We would also like to thank Ms. Elizabeth Tomaszewski, the
Sustainability Coordinator for WPI Facilities, Roger Griffin, the Associate Director of Buildings and Events for
the WPI Department of Facilities and Ms. Amy Beth Laythe and Ms. Emily Balcom of WPI Residential Services,
for providing information and advice.
We would like to thank our advisors Professors John Orr and Guillermo Salazar, their guidance and advice
have been essential to the completion of the project.
Finally, we would like to thank the members of the Sustaining the WPI Campus project center for their
invaluable feedback and criticism.
v
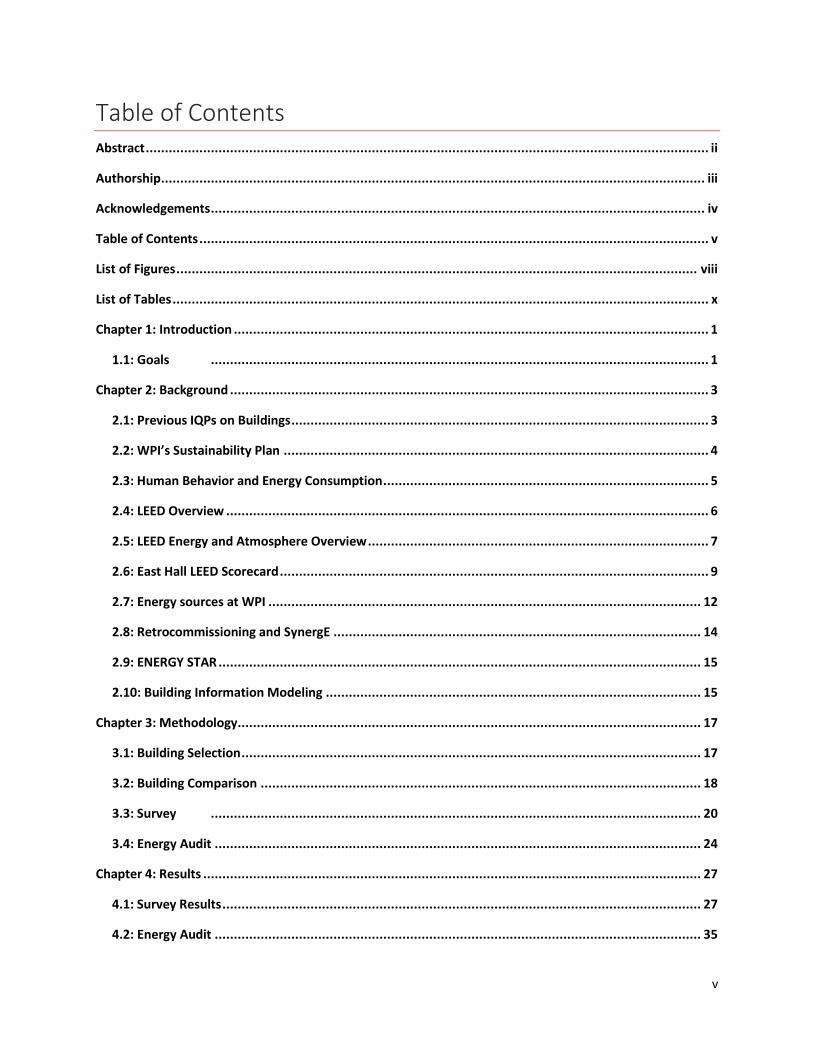
Table of Contents Abstract ................................................................................................................................................... ii
Authorship .............................................................................................................................................. iii
Acknowledgements ................................................................................................................................. iv
Table of Contents ..................................................................................................................................... v
List of Figures ........................................................................................................................................ viii
List of Tables ............................................................................................................................................ x
Chapter 1: Introduction ............................................................................................................................ 1
1.1: Goals .................................................................................................................................. 1
Chapter 2: Background ............................................................................................................................. 3
2.1: Previous IQPs on Buildings ............................................................................................................. 3
2.2: WPI’s Sustainability Plan ............................................................................................................... 4
2.3: Human Behavior and Energy Consumption ..................................................................................... 5
2.4: LEED Overview .............................................................................................................................. 6
2.5: LEED Energy and Atmosphere Overview ......................................................................................... 7
2.6: East Hall LEED Scorecard ................................................................................................................ 9
2.7: Energy sources at WPI ................................................................................................................. 12
2.8: Retrocommissioning and SynergE ................................................................................................ 14
2.9: ENERGY STAR .............................................................................................................................. 15
2.10: Building Information Modeling .................................................................................................. 15
Chapter 3: Methodology ......................................................................................................................... 17
3.1: Building Selection ........................................................................................................................ 17
3.2: Building Comparison ................................................................................................................... 18
3.3: Survey ................................................................................................................................ 20
3.4: Energy Audit ............................................................................................................................... 24
Chapter 4: Results .................................................................................................................................. 27
4.1: Survey Results ............................................................................................................................. 27
4.2: Energy Audit ............................................................................................................................... 35
vi
4.3: Metering ................................................................................................................................ 38
4.4: Energy Bills ................................................................................................................................ 45
Chapter 5: Recommendations and Conclusions ....................................................................................... 50
5.1: Immediate Implementation ......................................................................................................... 50
5.2: Future Implementation ............................................................................................................... 50
5.3: Behavior Changes ........................................................................................................................ 50
5.4: LEED ................................................................................................................................ 51
5.5: Future Projects ............................................................................................................................ 51
References ............................................................................................................................................. 52
Appendices ............................................................................................................................................ 54
Appendix A: East Hall LEED Scorecard ..................................................................................................... 55
Appendix B: WPI Buildings Supplied by Power House .............................................................................. 56
B.1: Electricity ................................................................................................................................ 56
B.2: Steam ................................................................................................................................ 57
B.3: Map of WPI Buildings Receiving Energy from the Power House ..................................................... 58
Appendix C: Meter Tracking Sheets ......................................................................................................... 59
C.1: Founders Main Gas...................................................................................................................... 59
C.2: The Goats Head Restaurant Gas ................................................................................................... 60
C.3: Founders Electric ......................................................................................................................... 61
C.4: East Gas ................................................................................................................................ 62
C.5: East Electric ................................................................................................................................ 63
Appendix D: East Hall First Floor Lighting Inventory ................................................................................. 64
Appendix E: Founders Hall Basement Lighting Inventory .......................................................................... 67
Appendix F: East Hall Lighting Fixtures .................................................................................................... 68
Appendix G: East Hall Survey Responses ................................................................................................. 74
Appendix H: Founders Hall Survey Responses ......................................................................................... 91
Appendix I: Floor Plans ......................................................................................................................... 107
I.1: Founders Hall Floor Plan ............................................................................................................. 107

vii
I.2: East Hall Floor Plans ................................................................................................................... 112
Appendix J: Energy Bills ........................................................................................................................ 114
J.1: National Grid—East Hall ............................................................................................................. 114
J.2: NSTAR—East Hall ....................................................................................................................... 115
J.3: National Grid—Founders Hall ..................................................................................................... 116
J.4: NSTAR—Founders Hall ............................................................................................................... 117
J.5: 2013 Cost History ....................................................................................................................... 118

viii
List of Figures Figure 1: Percentage of average energy usage per day of the WPI main campus in 2007................................... 3
Figure 2: East Hall LEED Scorecard brief view ....................................................................................................... 9
Figure 3: East Hall—vertical sun-shading ............................................................................................................ 10
Figure 4: East Hall—horizontal sun-shading ....................................................................................................... 11
Figure 5: East Hall lighting design type 1 ............................................................................................................ 11
Figure 6: East Hall lighting design type 2 ............................................................................................................ 12
Figure 7: FY13 electricity consumption of the WPI Main Campus...................................................................... 13
Figure 8: FY13 natural gas consumption of WPI Main Campus .......................................................................... 14
Figure 9: East Hall, LEED - Gold Certified ............................................................................................................ 17
Figure 10: Founders Hall, Non-LEED Certified .................................................................................................... 18
Figure 11: FY13 electricity consumption of Founders Hall and East Hall ........................................................... 19
Figure 12: FY13 natural gas consumption of Founders Hall and East Hall .......................................................... 20
Figure 13: Comparison of people with different attitudes ................................................................................. 33
Figure 14: A T8 bulb used in East Hall ................................................................................................................. 36
Figure 15: Gap in East Hall Main Trash Room door ............................................................................................ 37
Figure 16: Founders Hall Gas Meters .................................................................................................................. 38
Figure 17: Gas consumption per day from December 2 to December 20 .......................................................... 39
Figure 18: Gas consumption per Degree Day ..................................................................................................... 40
Figure 19: Gas consumption per square footage................................................................................................ 40
Figure 20: Electricity consumption from December 2-20 ................................................................................... 41
Figure 21: Total Energy consumption and temperature .................................................................................... 44
Figure 22: East Hall Electric Meter ...................................................................................................................... 44
Figure 23: East Hall Gas Meter ............................................................................................................................ 45
Figure 24: Founders Hall electric metering webcam setup ................................................................................ 45
Figure 25: NSTAR conversion ccf to therms ........................................................................................................ 46
Figure 26: National Grid Meter Multiplier .......................................................................................................... 46
Figure 27: Founders Hall Electricity and Gas consumption history .................................................................... 47

ix
Figure 28: East Hall Electricity and Gas consumption history ............................................................................. 48
Figure 29: 2013 Electricity usage histories of East Hall and Founders Hall ........................................................ 48
Figure 30: 2013 Gas usage histories of East Hall and Founders Hall .................................................................. 49
Figure 31: Buildings receiving energy from the Power House ............................................................................ 58

x
List of Tables Table 1: LEED rating systems [11] ......................................................................................................................... 7
Table 2: LEED Prerequisites and Credits ............................................................................................................... 8
Table 3: Comparison of East Hall and Founders Hall .......................................................................................... 19
Table 4: East Hall/Founders Hall Survey Questions brief overview .................................................................... 27
Table 5: East Hall/Founders Hall Survey Questions brief overview (continued) ................................................ 28
Table 6: Idle power of devices ............................................................................................................................ 34
Table 7: Conversion of ccf to kWh ...................................................................................................................... 41
Table 8: Energy Consumption from December 2 to December 20 ..................................................................... 42
Table 9: Energy consumption from December 20 to January 16 ....................................................................... 43
Table 10: Consumption per day .......................................................................................................................... 43
1
Chapter 1: Introduction The idea of sustainability has raised attention all over the world for the past few decades. Sustainability is the
goal of meeting the needs of the present without compromising the ability of future generations to meet
their own needs [1]. Energy consumption is one of the largest fields that society can attempt to reduce to
make the world more sustainable. An updated analysis published by the Lawrence Livermore National
Laboratory suggests that the USA is just 39% energy efficient [2], meaning that more than half (61%) of the
energy is ultimately wasted. This indicates a great potential for energy conservation and increased
sustainability.
Worcester Polytechnic Institute (WPI) currently owns 39 buildings on its main campus [3] and thus consumes
a fairly big amount of energy. As a community dedicated to promote the culture of sustainability, WPI is
taking various steps to accomplish this goal. Some steps include the Sustainability Plan and SynergE, which
will both be discussed in more detail later. Four of the five newest buildings on campus—the Bartlett Center,
East Hall, the Recreation Center and Faraday Hall, underwent a certification process known as LEED
certification to ensure that they were built in a sustainable, green manner. It is expected that these buildings
operate efficiently, but LEED certification cannot guarantee efficient operation, as the certification is
awarded shortly after construction. However, while the buildings may be designed to operate efficiently,
occupants may not use the buildings in the way they were designed.
1.1: Goals Our project had three primary goals:
1. To investigate the energy consumption and efficiency of selected buildings,
2. To determine behavioral issues of WPI constituency regarding awareness and attitudes toward
energy consumption, and
3. To make recommendations on how to improve the efficiency and energy usage of the buildings
analyzed
Goal 1: Evaluating Physical Issues As part of our first goal, we evaluated the energy consumption and efficiency of each of our selected
buildings. To satisfy this goal, we looked for things in the structure and equipment of the buildings that could
be improved.
Goal 2: Evaluating Social Issues We answered the question “How is building energy consumption affected by the behavior of the occupants?”
To this end, we started with the assumption that the building designers, especially those of the newer, LEED
certified buildings, expected a certain attitude towards building energy consumption and use. We attempted
to identify this expectation, as well as any discrepancies between this expectation and the current reality of
building usage. We then evaluated how these discrepancies affected the energy consumption of the building.

2
Goal 3: Making Recommendations The recommendations we made encompassed the data we collected about both the physical inefficiencies of
the buildings and the inefficiencies in the use of the building by the occupants. The recommendations
identified areas for improvement and recommended concrete steps for implementation. An important aspect
of this goal was to test our recommendations, especially those concerning changes in the behavior of building
occupants.

3
Chapter 2: Background In this section, information pertinent to a preliminary investigation regarding the current status of WPI’s
energy consumption is presented. Such information is useful in identifying existing problems and determining
the methodology for the project. Topics that are covered in the background section include a review of
previous student projects or Interactive Qualifying Projects on WPI buildings, review of WPI’s plan on
sustainability and the LEED certification process, collection and analysis of current utilities bills on WPI
campus, examining retrocommissioning practices such as SynergE and Energy Star including their
recommendations on energy conservation, and finally an overview of Building Information Modeling and how
it is used in conducting an energy analysis.
2.1: Previous IQPs on Buildings So far, there have been several Interactive Qualifying Projects (IQP) conducted by students at WPI about the
energy consumption of different buildings on the WPI campus, including Atwater Kent Laboratories and
Higgins Laboratories.
In 2007, “Monitoring Electricity Consumption on WPI Campus” examined the status of WPI’s electricity
monitoring system on a building-by-building basis [4]. It included a comprehensive report of electricity meter
functionality for several dormitories and academic buildings and presented a short and long-term plan to
improve the school’s ability to monitor its electricity consumption. This project was mostly a qualitative
analysis of energy usage and energy efficiency, because at that time, there was no single point source or sub
metering for information on WPI’s electricity metering system. Their findings were not quite satisfactory,
showing that Higgins Labs consumes 25.8% of the campus electricity while Fuller Lab only uses 0.8%, and
leaving 56% of the electrical energy used on campus unaccounted for. Reliability of this project is
questionable due to this unusual result, and the findings of this project need to be verified. The figure below
presents the energy consumption of each building according to their research.
Figure 1: Percentage of average energy usage per day of the WPI main campus in 2007

4
In 2009, an IQP group conducted an energy audit of Higgins Laboratories to address its electricity
consumption and to determine how to reduce the energy consumption of the building [5]. They
recommended the following methods to reduce electricity usage:
1. Replace incandescent light bulbs with LED or fluorescent bulbs,
2. Reduce the light levels in most rooms, and
3. Install occupancy sensors in all rooms.
Furthermore, they suggested developing an ongoing relationship with National Grid to conduct up-to-date
renovations and audits.
In 2010, a similar project focused on the reduction of power consumption in Atwater Kent. The “Atwater Kent
Energy Audit and Solar Energy” project explored the energy consumed by Atwater Kent by looking at ways to
reduce the determined electric power consumption, and the feasibility of placing solar panels on the roof of
the building [6]. Their recommendations were:
1. Remove unnecessary light bulbs from fixtures reducing light levels of over lit rooms by approximately
30%,
2. Change the light bulbs that are in the fixtures to LED bulbs, which use 54% less power,
3. Edit the computer settings so that the computers shut down when not in use, and
4. Install a photovoltaic system on the roof of the building to produce electricity.
2.2: WPI’s Sustainability Plan
“We at WPI will demonstrate our commitment to the preservation of the planet
and all its life through the incorporation of the principles of sustainability
throughout the institution. We will accomplish this goal by promoting a culture of
sustainability that incorporates the beliefs and behaviors supported by our
technical strengths and by our heritage of the application of both theory and
practice, as embodied in our motto, Lehr und Kunst, to the solution of important
problems. WPI will develop a bold and comprehensive strategy to advance the
three broad goals of sustainability: ecological stewardship, social justice, and
economic security.” —The WPI Task Force on Sustainability
In 2007, WPI established its Task Force on Sustainability to coordinate WPI’s efforts to provide long-term
sustainability campus-wide. The Task Force represents WPI’s commitment to promoting a culture of
sustainability to improve the quality of life for current and future generation, by taking advantage of its
technical strength. In October 2013, the WPI’s fourth annual Campus Sustainability Report was sent out by
the Task Force, indicating the current status of progress in making the campus more sustainable.
The WPI community started a two-phased planning process in order to accomplish its goal to develop an
innovative path to achieve sustainability. The plan [7] includes four major goals:
Goal 1: Academics
WPI will offer students opportunity to incorporate and evaluate the importance of sustainability
through various sources of undergraduate and graduate curriculums and projects.

5
Goal 2: Campus Operation
The operation of WPI’s campus and facilities should demonstrate the principles of sustainability. In
order to achieve this, a number of specific objectives and tasks are developed, including reducing
WPI utility consumption by 25% over 5 years.
Goal 3: Research and Scholarship
WPI will make significant contribution to the technologies, the policies and the attitudes that makes
world more sustainable through research and scholarly activities.
Goal 4: Community Engagement
WPI’s student, faculty and stuff should develop an attitude of promoting a culture of sustainability
on campus, in Worcester, for the nation and globally.
Starting early in 2012, the first phase evaluated the current status related to sustainability of the four major
aspects of WPI facilities and programs and identified broad goals for each of these components.
The Phase One working groups were charged with:
Determining WPI’s current status with regard to Sustainability in the working group’s area,
Benchmarking against other institutions as appropriate,
Generating new ideas for advancing sustainability at WPI,
Recommending specific goals for achieving key aspects of sustainability at WPI, and
Identifying strengths/weakness/opportunities for enhancement of WPI’s activities with respect to
sustainability [7].
By 2013, the first phase was completed. As pointed out by the 2012 annual campus sustainability report, WPI
met several sustainability goals, including preparation of sustainability courses, retrofitting of electrical sub-
metering in several buildings, construction of better reporting structures to improve public awareness, and
establishment a waste audit. Furthermore, three major tasks have been accomplished:
Internal benchmarking of our sustainability activities at WPI,
External benchmarking with regard to peer and aspirational institutions, and
Development of potential goals and strategies.
The Sustainability Plan was completed by the summer of 2013, and goals mentioned above were met. Some
of the major tasks and achievements include [8]:
WPI currently offers more than 90 courses that address one or more aspects of sustainability
Utility consumption is reduced by 25% over 5 years
New buildings and all major buildings on WPI campus are LEED-certifiable
At least 50% of the campus community is engaged in sustainability efforts
Several projects are performed to investigate WPI’s ground, energy consumption, greenhouse gas,
transportation, water, waste and dining
2.3: Human Behavior and Energy Consumption Although people are often aware of the benefits of using energy more efficiently, a variety of social, cultural,
and economic factors often prevent them from following these practices [9]. Even when high efficiency
technologies have been installed, 30 percent or more of the energy savings that could potentially be realized
6
through such technologies are lost, according to the American Council for an Energy-Efficient Economy
(ACEEE). In November 2009, Rep. Brian Baird (D-WA) said at a presentation at Environmental and Energy
Study Institute that “we have tremendous opportunities for tremendous savings” and that the industrialized
world should strive for 20 percent reduction in energy consumption in 20 weeks. The link between behavioral
science and energy use will play a key role in solving our energy crisis, our economic crisis, and our
geopolitical crisis.
Simple behavioral changes in the United States could result in a 25-30 percent energy savings, the equivalent
of the energy produced by 240 medium-sized coal-fired power plants. This would prevent the emission of
500 million metric tons of carbon dioxide annually.
2.4: LEED Overview Leadership in Energy and Environmental Design (LEED) is a globally recognized green building certification
system with the goal of improving: energy savings, water efficiency, CO2 emissions reduction, and improved
indoor environmental quality. Established in 1998 by the United States Green Buildings Council (USGBC),
LEED certification provides third-party verification that a building, home, or community was designed to
maximize positive environmental and human health and well-being [10].
The LEED rating system was designed for rating new and existing commercial, institutional, and residential
buildings as well as neighborhood developments. The current LEED rating system offers four certification
levels:
Certified (40-49 points)
Silver (50-59 points)
Gold (60-79 points)
Platinum (80+ points)
These levels of certification correspond to the number of points accumulated in seven green design
categories: sustainable sites, water efficiency, energy and atmosphere, indoor environmental quality,
innovation in design, and regional priority. Each category consists of prerequisites and credits, which are
required elements or green building strategies that must be met before a project can be considered for LEED
certification. These prerequisites and credits are provided as tools and strategies to achieve a level of LEED
certification. Table 1, provides an outline of LEED rating systems for projects such as New Construction,
Commercial Interiors, Existing Buildings, Core & Shell, and Schools.

7
Table 1: LEED rating systems [11]
Credit New
Construction
Commercial
Interiors
Existing
Buildings
Core & Shell Schools
Sustainable Sites 26 21 26 28 24
Water Efficiency 10 11 14 10 11
Energy and Atmosphere 35 37 35 37 33
Materials/Resources 14 14 10 13 13
Indoor Environmental
Quality
15 17 15 12 19
Innovation in Design 6 6 6 6 6
Regional Priority 4 4 4 4 4
Points Total 110 110 110 110 110
At WPI, sustainability is becoming integrated into the design and construction process. WPI is striving to
become a sustainability leader in its community by adopting a high performance, minimal impact approach.
Currently, WPI has four LEED certified buildings which are the following [12]:
Bartlett Center, 2006, LEED Certified
East Hall, 2008, LEED Gold
Sports and Recreation Center, 2012, LEED Gold
Faraday Hall, 2013, LEED Gold
East Hall is the first sustainable residence hall on campus and the first to receive LEED Gold, features the
city’s first green roof. The residential hall used local and recycled materials, with an increase of energy and
water efficiency, and includes an interior storage for bikes [13]. WPI’s Sports and Recreation Center,
constructed with recyclable building materials, features water-saving systems, solar energy, lighting sensors
and controls, fritted glass, and rainwater harvesting [14]. Another example of WPI’s interest of sustainability
is its newly constructed parking garage/playing field. Even though it is not LEED certified, this structure
provides 527 parking spaces with electric car plug-in stations, space for Zipcars, a bicycle parking area,
motion sensors to dim/brighten lights, and a full sized athletic field on the roof.
2.5: LEED Energy and Atmosphere Overview The LEED rating system has changed significantly over the years, with an increased emphasis on sustainable
sites, water efficiency, and energy and atmosphere. Out of the seven categories, “energy and atmosphere” is
considered to be one of the most important due to the large energy consumption and pollution generated by
buildings. The mission of the energy and atmosphere category is to enhance energy performance by
ensuring that mechanical systems, controls, and electrical systems are properly installed [11].
8
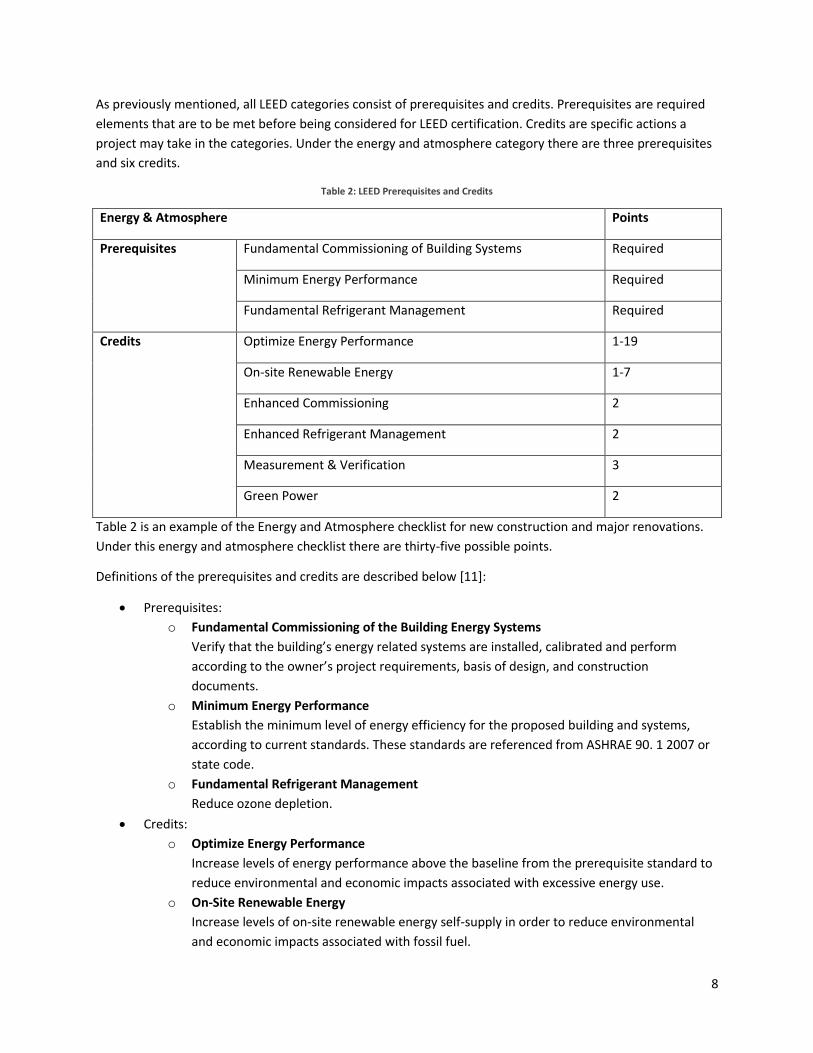
As previously mentioned, all LEED categories consist of prerequisites and credits. Prerequisites are required
elements that are to be met before being considered for LEED certification. Credits are specific actions a
project may take in the categories. Under the energy and atmosphere category there are three prerequisites
and six credits.
Table 2: LEED Prerequisites and Credits
Energy & Atmosphere Points
Prerequisites Fundamental Commissioning of Building Systems Required
Minimum Energy Performance Required
Fundamental Refrigerant Management Required
Credits Optimize Energy Performance 1-19
On-site Renewable Energy 1-7
Enhanced Commissioning 2
Enhanced Refrigerant Management 2
Measurement & Verification 3
Green Power 2
Table 2 is an example of the Energy and Atmosphere checklist for new construction and major renovations.
Under this energy and atmosphere checklist there are thirty-five possible points.
Definitions of the prerequisites and credits are described below [11]:
Prerequisites:
o Fundamental Commissioning of the Building Energy Systems
Verify that the building’s energy related systems are installed, calibrated and perform
according to the owner’s project requirements, basis of design, and construction
documents.
o Minimum Energy Performance
Establish the minimum level of energy efficiency for the proposed building and systems,
according to current standards. These standards are referenced from ASHRAE 90. 1 2007 or
state code.
o Fundamental Refrigerant Management
Reduce ozone depletion.
Credits:
o Optimize Energy Performance
Increase levels of energy performance above the baseline from the prerequisite standard to
reduce environmental and economic impacts associated with excessive energy use.
o On-Site Renewable Energy
Increase levels of on-site renewable energy self-supply in order to reduce environmental
and economic impacts associated with fossil fuel.

9
o Enhanced Commissioning
Begin the commissioning process early in the design process and execute additional
activities after systems performance verification is completed.
o Enhanced Refrigerant Management
Reduce ozone depletion.
o Measurement & Verification
Provide ongoing accountability of building energy consumption over time.
o Green Power
Encourage developers to use grid-source, renewable energy technologies on a net zero
pollution basis.
2.6: East Hall LEED Scorecard This section describes how East Hall got LEED Gold Certification in detail. The overall scorecard is described as
well as the Energy and Atmosphere Scorecard.
LEED Scorecard East Hall, a residential building completed in 2008, acquired 44 out of 69 points in the LEED certificate
evaluation, which is sufficient to achieve LEED Gold certification. Out of the 6 general categories, this project
focused mainly on “Energy & Atmosphere” and “Indoor Environmental Quality” since the aim of this section
is to identify the expectation of energy consumption in East Hall. Site selection, water efficiency, and
innovation are not considered. The figure below shows the LEED scorecard. For detailed scorecard, see
Appendix A.
Figure 2: East Hall LEED Scorecard brief view

10
Energy and Atmosphere East Hall scored a total of 7 out of 17 points in this category. These scores are presented below:
Optimize energy performance: 5/10
On-site renewable energy: 0/3
Enhanced commissioning: 1/1
Enhanced refrigerant management: 1/1
Measurement and verification: 0/1
Green power: 0/1
By definition, “Optimize Energy Performance” intends to “Achieve increasing levels of energy performance
above the baseline in the prerequisite standard to reduce environmental and economic impacts associated
with excessive energy use” [15]. According to ASHRAE/IESNA Standard 90.1-2004, the minimum energy cost
saving percentage for new buildings scoring 5/10 falls between 24.5% and 28%. East Hall scored no points for
renewable energy, measurement and verification and green power, as those are not applied in the building
design or construction process.
According to the designer of the building, Cannon Design, East Hall Reduced energy costs by more than 20%
versus ASHRAE 90.1-2004 standard. Data are evaluated via energy modeling, from the BIM (Building
Information Modeling) model created during the design of the building. According to the building strategy,
East Hall considered the effect of sun shading. This strategy of designing the shape of windows provides
vertical sun-shading on the west façade to optimize energy savings by minimizing solar heat gain and glare
and provides horizontal sun-shading on the south and east façades to optimize energy savings [16].
Figure 3: East Hall—vertical sun-shading
11
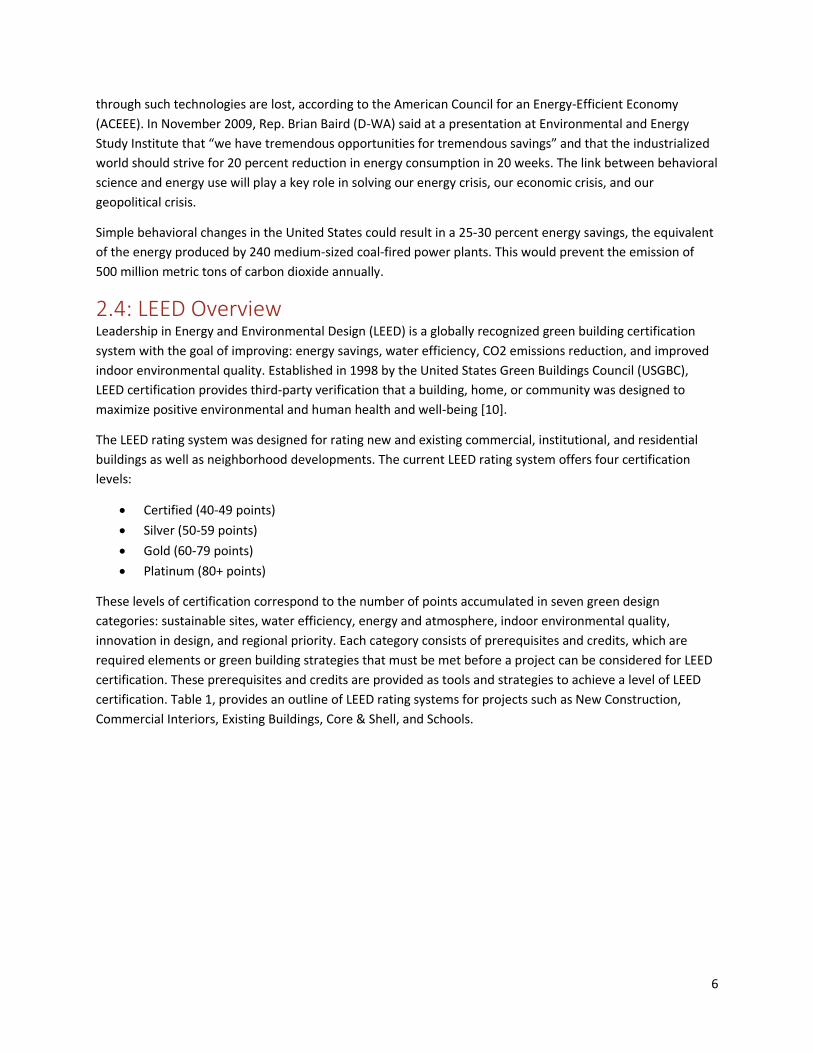
Figure 4: East Hall—horizontal sun-shading
The estimated savings by using this design are shown below:
Estimated cooling load reduction: 15 tons
Value of reduced plant: $34,000
Projected Yearly Energy Savings: $6,480
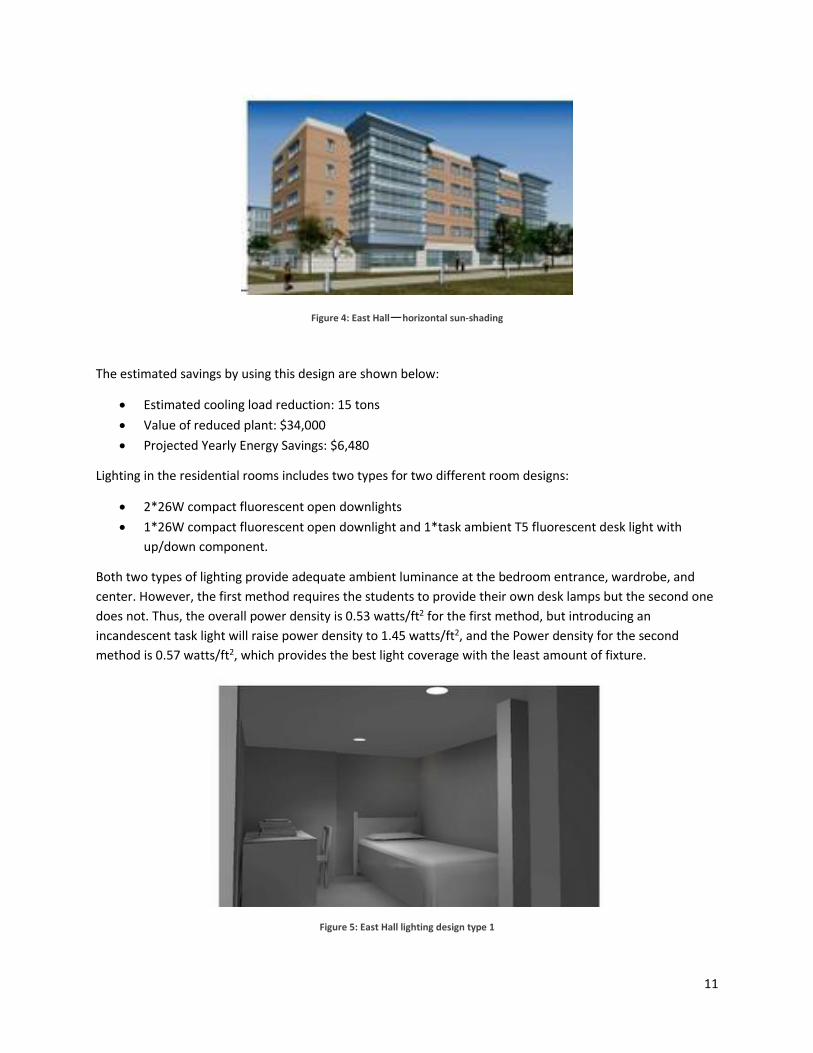
Lighting in the residential rooms includes two types for two different room designs:
2*26W compact fluorescent open downlights
1*26W compact fluorescent open downlight and 1*task ambient T5 fluorescent desk light with
up/down component.
Both two types of lighting provide adequate ambient luminance at the bedroom entrance, wardrobe, and
center. However, the first method requires the students to provide their own desk lamps but the second one
does not. Thus, the overall power density is 0.53 watts/ft2 for the first method, but introducing an
incandescent task light will raise power density to 1.45 watts/ft2, and the Power density for the second
method is 0.57 watts/ft2, which provides the best light coverage with the least amount of fixture.
Figure 5: East Hall lighting design type 1

12
Figure 6: East Hall lighting design type 2
Indoor Environmental Quality The most important line items in this section are the “Controllability of Systems—Thermal Comfort” and
“Thermal Comfort—Design,” since these factors affect the HVAC system efficiency.
East Hall scored one point for Controllability of Thermal Systems, which requires providing individual
comfort controls for 50% (minimum) of the building occupants to enable adjustments to suit individual task
needs and preferences and providing comfort system controls for all shared multi-occupant spaces to enable
adjustments to suit group needs and preferences. However, East Hall fails to ‘provide a comfortable thermal
environment that supports the productivity and well-being of building occupants’, as this category does not
pertain to its specific needs. This section is investigated by surveys to study the actual users’ feedback on the
system.
2.7: Energy sources at WPI To evaluate the energy consumption of WPI’s buildings it is important to know about the sources of energy
used by WPI. Electricity and natural gas were examined, as these are the two major energy sources for the
WPI campus.
Electricity Electricity is essential to have in buildings as it powers appliances for cooking, heating, and entertainment.
WPI receives its electricity from National Grid’s substation on Faraday Street [17]. The Power House receives
the electricity from National Grid and from here it is distributed among the buildings on the main campus.1
Now on the main campus there are twenty-nine buildings/properties, and out of these, only twelve buildings
are sub-metered, Appendix B. Buildings outside the main campus, such as East Hall and Founders Hall, have
individual meters. WPI purchases electricity from Direct Energy, an independent energy supplier. The reason
for this is that WPI as a community consumes large amounts of electricity, and therefore it is cheaper to buy
as a commodity. WPI pays National Grid for the service of transporting the electricity through their
1 The Power House, or Power Plant, has the main meter of the main campus.
13
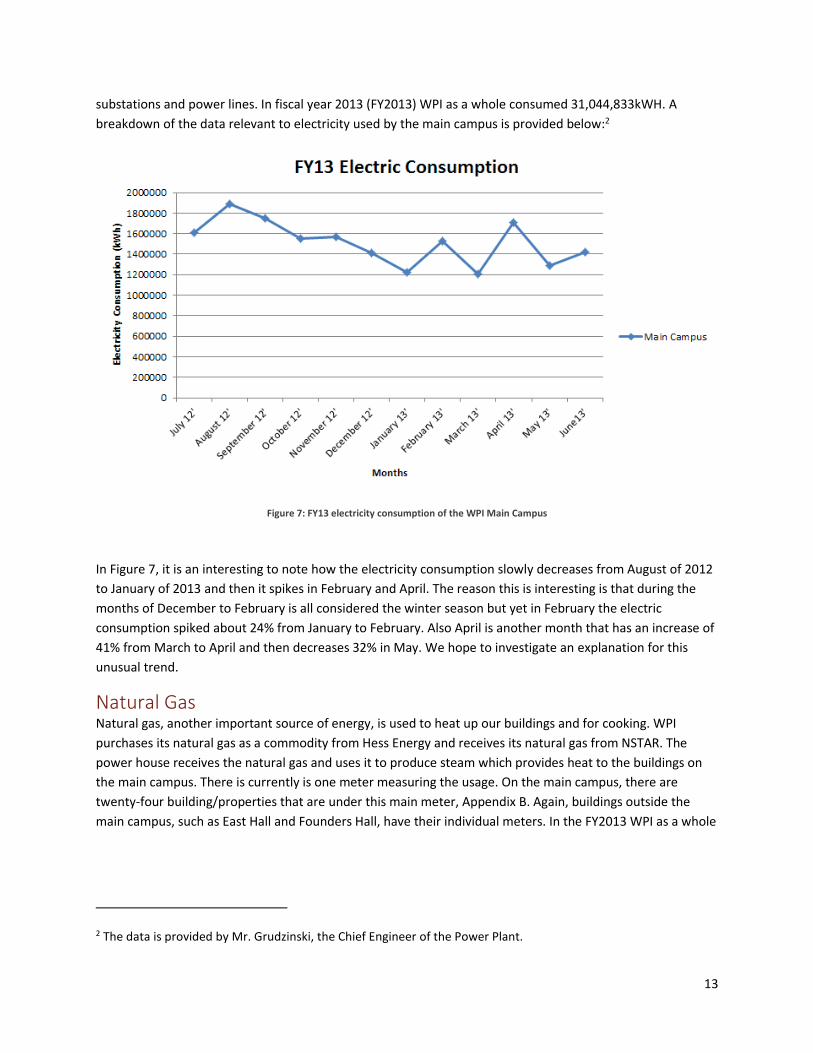
substations and power lines. In fiscal year 2013 (FY2013) WPI as a whole consumed 31,044,833kWH. A
breakdown of the data relevant to electricity used by the main campus is provided below:2
Figure 7: FY13 electricity consumption of the WPI Main Campus
In Figure 7, it is an interesting to note how the electricity consumption slowly decreases from August of 2012
to January of 2013 and then it spikes in February and April. The reason this is interesting is that during the
months of December to February is all considered the winter season but yet in February the electric
consumption spiked about 24% from January to February. Also April is another month that has an increase of
41% from March to April and then decreases 32% in May. We hope to investigate an explanation for this
unusual trend.
Natural Gas Natural gas, another important source of energy, is used to heat up our buildings and for cooking. WPI
purchases its natural gas as a commodity from Hess Energy and receives its natural gas from NSTAR. The
power house receives the natural gas and uses it to produce steam which provides heat to the buildings on
the main campus. There is currently is one meter measuring the usage. On the main campus, there are
twenty-four building/properties that are under this main meter, Appendix B. Again, buildings outside the
main campus, such as East Hall and Founders Hall, have their individual meters. In the FY2013 WPI as a whole
2 The data is provided by Mr. Grudzinski, the Chief Engineer of the Power Plant.
14
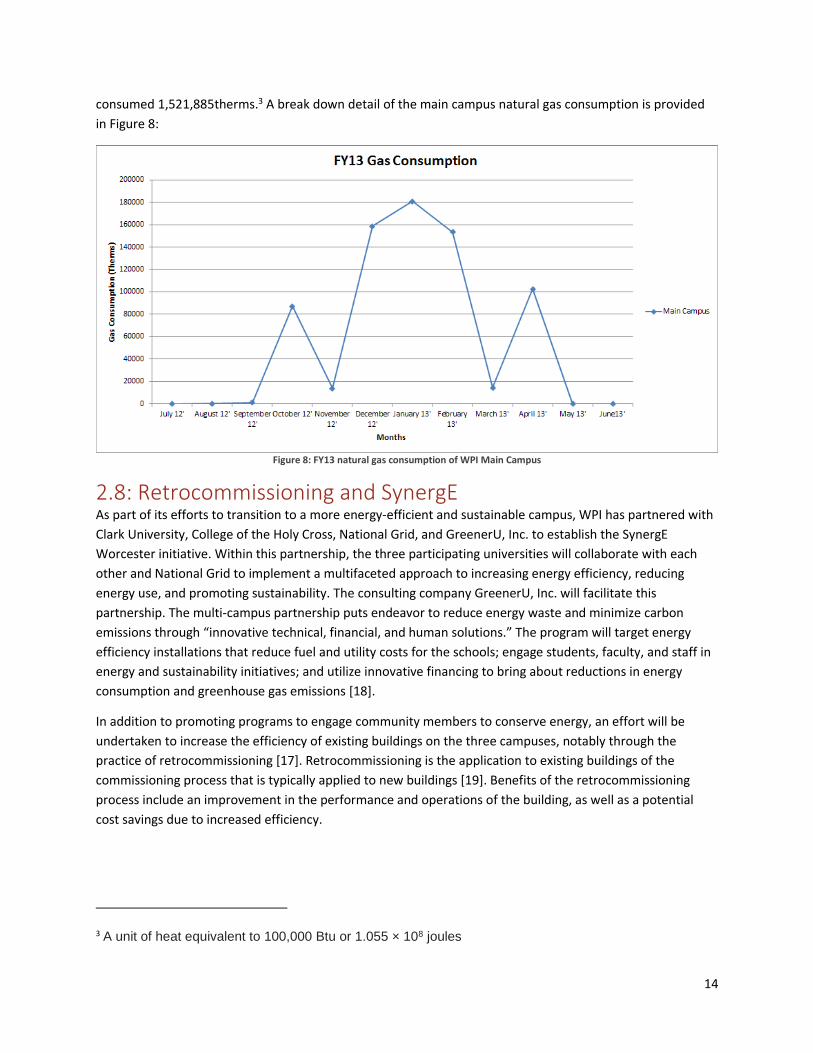
consumed 1,521,885therms.3 A break down detail of the main campus natural gas consumption is provided
in Figure 8:
Figure 8: FY13 natural gas consumption of WPI Main Campus
2.8: Retrocommissioning and SynergE As part of its efforts to transition to a more energy-efficient and sustainable campus, WPI has partnered with
Clark University, College of the Holy Cross, National Grid, and GreenerU, Inc. to establish the SynergE
Worcester initiative. Within this partnership, the three participating universities will collaborate with each
other and National Grid to implement a multifaceted approach to increasing energy efficiency, reducing
energy use, and promoting sustainability. The consulting company GreenerU, Inc. will facilitate this
partnership. The multi-campus partnership puts endeavor to reduce energy waste and minimize carbon
emissions through “innovative technical, financial, and human solutions.” The program will target energy
efficiency installations that reduce fuel and utility costs for the schools; engage students, faculty, and staff in
energy and sustainability initiatives; and utilize innovative financing to bring about reductions in energy
consumption and greenhouse gas emissions [18].
In addition to promoting programs to engage community members to conserve energy, an effort will be
undertaken to increase the efficiency of existing buildings on the three campuses, notably through the
practice of retrocommissioning [17]. Retrocommissioning is the application to existing buildings of the
commissioning process that is typically applied to new buildings [19]. Benefits of the retrocommissioning
process include an improvement in the performance and operations of the building, as well as a potential
cost savings due to increased efficiency.
3 A unit of heat equivalent to 100,000 Btu or 1.055 × 10⁸ joules

15
2.9: ENERGY STAR ENERGY STAR, created by the United States Environmental Protection Agency (EPA), is a standard for energy
efficient products adopted by several countries around the world. Consumer products that have the ENERGY
STAR label consume up to 30% less energy than the federal standard [20]. John S. Hoffman, creator of the
Green Programs at EPA, developed ENERGY STAR. It had originally begun as a labeling program that identified
energy efficient products to promote and demonstrate the potential for profit in reducing energy
consumption and greenhouse gases by power plants [21].
According to ENERGY STAR, there are many things that can be done immediately to conserve energy. When it
comes to heating it is recommended that the air filter be changed because a dirty air filter slows down the
airflow, making the system work harder. By changing the air filter often, dust and dirt do not accumulate and
it prevents an expensive maintenance process in the future if the system fails altogether. Some of the simpler
things that can go a long way are checking thermostat settings and sealing air ducts so that nothing is lost. If
an air conditioning system is used during the summer it is important to keep every window sealed and limit
the time doors are open. In the winter, ENERGY STAR recommends using a tight-fitting A/C unit cover to
insulate the system properly from cold air getting in while the heating system is running [20].
ENERGY STAR Recommendations WPI has many appliances in use around the entire campus. When doing laundry it is recommended to always
wait to wash large loads because the washing and drying machines use the same amount of electricity
regardless of the amount of clothes that are being washed. Also, it is best to use cold water and always clean
the lint trap. In the apartments and kitchens around the campus a problem that arises is the wasted energy
on stoves that have a pot on the wrong-sized burner. It a pot is too small compared to the burner there is
heat energy lost there. Refrigerators are big appliances that draw a lot of electricity. To minimize the energy
lost, the coils have to be clean, the door needs to be sealed properly, and the time the door remains open
has to be limited [20].
Lighting and electronics are two things that many people do not realize have a big impact on the energy
consumed by a building. In large buildings like those around the WPI campus there are many rooms that
need to be lit properly. However, there are times when rooms are either over lit or do not need to be lit at
all. An example of this is during bright days when natural light can be utilized or when rooms are completely
empty. The best option to conserving energy on any electronic is to unplug it completely because anything
that is plugged into an outlet continues to draw electricity. For students in the residence halls, TVs and
gaming consoles are the biggest energy wasters. Power strips are helpful in conserving energy because when
a TV or gaming console is not in use the power strip provides the option of cutting off the electricity provided
to the electronics. Also, when watching movies on DVDs, using a gaming console consumes 4 to 7 times more
power than a regular DVD player [20].
2.10: Building Information Modeling Building Information Modeling (BIM) is a method of designing, modeling, and communication about a
building. In contrast to paper methods, a BIM solution provides three dimensional, parametric models with
information relating to the construction and operation of the building, including references to warranties and
manuals. The object of BIM is to reduce communication and management complexity, to allow quicker
turnaround for modeling, and to allow for easier and more consistent access to information regarding a
16
building. Each component of the BIM model contains detailed information about that specific component.
For example, when looking at a BIM model of a building, the user can see the pipes throughout the structure,
what type of pipe, and even the size of the pipe. BIM has revolutionized the modeling world; where there
was once a directory of components of a building, there is now an interactive model of an entire building
containing all the same information [22]. BIM can prove to be helpful in improving energy efficiency through
the systematic measurement and verification of building systems. The performance of a building or energy
system can be evaluated through simulation. A BIM-based Baseline Building Model (B3M) is created from an
up-to-date BIM model. B3M models can provide real-time simulation data on the performance of building
systems and operating conditions [23]. BIM software allows to run simulations to supplement the sparse data
available for the energy systems and to make rough estimates of the feasibility and benefits of any
recommendation, and finally to identify energy saving or energy wasting components in the building.

17
Chapter 3: Methodology In order to achieve the three goals related to energy efficiency for this project, stated in the introduction, the
following steps were taken. First, some WPI buildings were selected and studied. Since there are over 50
buildings owned by WPI, it was quite difficult to investigate energy consumption in each building. As a result,
some of the typical WPI buildings that reflect college feature (e.g. highly academic, student users) and energy
saving strategies (ideally LEED certified) and that are comparable to each other were selected, to perform a
case study. After target buildings were selected, surveys were sent to users of each building, in order to
investigate behavioral attitudes and public opinion with regards to energy efficiency and consumption in
those buildings. Energy audits were performed in each building to check the detail of possible physical issues
of each building. Electric and gas meters of each building were monitored to continuously track the real-time
energy consumption situation. Data acquired from these methods were collected and analyzed, and thus
recommendations were drawn accordingly.
3.1: Building Selection We focused on East Hall and Founders Hall. These buildings were chosen for investigation because they are
among a small number of buildings for which separate electricity and gas consumption information is
available. Founders Hall and East Hall are both residential buildings, fully occupied 24/7 during the academic
year, and at a reduced occupancy during term breaks. Additionally East Hall was constructed in 2008 to meet
the standards for LEED certification, while Founders Hall was constructed in 1985 under more traditional
building methods. With this selection of buildings, we created a comparison of the efficiencies between the
newer, LEED certified buildings with those of the older buildings on campus.
Figure 9: East Hall, LEED - Gold Certified

18
Figure 10: Founders Hall, Non-LEED Certified
Our selection of buildings does not include any primarily academic, office, or laboratory buildings on campus.
This decision was made because none of the current academic or laboratory buildings was constructed
recently enough to be LEED certified, and we wish to use the LEED certification as an axis on which to
compare the buildings we are studying. Another reason for the decision was that previous IQPs had already
addressed inefficiencies of some academic and laboratory buildings, including Higgins Laboratories and
Atwater Kent, and they had already generated several suggestions concerning both heat and electricity.
Finally, collecting energy consumption information for buildings on the main campus would be difficult as
most of the buildings are supplied with electricity and steam from the Power House, and are generally not
individually metered.
3.2: Building Comparison While both East Hall and Founders Hall are residential buildings, they were built for very different use cases.
Founders Hall, built in 1985, is composed of suite-style living accommodations, with suites for 1, 2, 4, and 6
residents living in single and double bedrooms sharing a common area and a bathroom. In the summer of
2013, the suites were outfitted with a refrigerator and microwave, and some double rooms were converted
to triple rooms to allow for 8 residents in some suites. The residential areas are not cooled. Non-residential
functions of the building include dining spaces—the Goat’s Head Restaurant and the Outtakes Convenience
Store—and the Campus Police station.
East Hall, built in 2008, includes student residences and office space for the Office of Residential Services. The
residential spaces are 4-person apartment style suites. All suites contain singles, and some suites replace 2 of
the single rooms with a double room. All occupied areas of this building are climate controlled by a
continuously operating HVAC/ventilation system, which is controlled by a building management system. This
building was built to LEED standards.
Both buildings include laundry facilities and external lighting.

19
Table 3: Comparison of East Hall and Founders Hall
East Hall Founders Hall
Year built 2008 1985
Total square footage 103,300 96,994
Maximum capacity 232 249
Non-residential functions Res services/ID Office Goat’s Head/Outtakes/Police
Resident kitchen equipment Refrigerator and stove Refrigerator and microwave
Average monthly electric
consumption (FY13)
95,133 kWh 60,796 kWh
Average monthly natural gas
consumption (FY13)
2,893 therms 3,339 therms
From the table above, we see that the energy consumed by the two halls is very different while the capacity
of residents is not too different. These buildings are also placed directly beside each other facing Boynton St.
Figure 11: FY13 electricity consumption of Founders Hall and East Hall
East Hall is LEED certified and is supposed to operate at higher efficiency. However in Figure 11, it appears
East Hall consumes more electricity than Founders Hall. Mr. Grudzinski, the Chief Engineer of the Power
Plant, suggested that a reason for this is the air conditioning of the building in the summer. However, better
explanation for the high usage in East Hall is important for the purpose of this study.
0
20000
40000
60000
80000
100000
120000
140000
Ele
ctri
city
Co
nsu
mp
tio
n (
kWh
)
Months
FY13 Electric Consumption
East
Founders
20
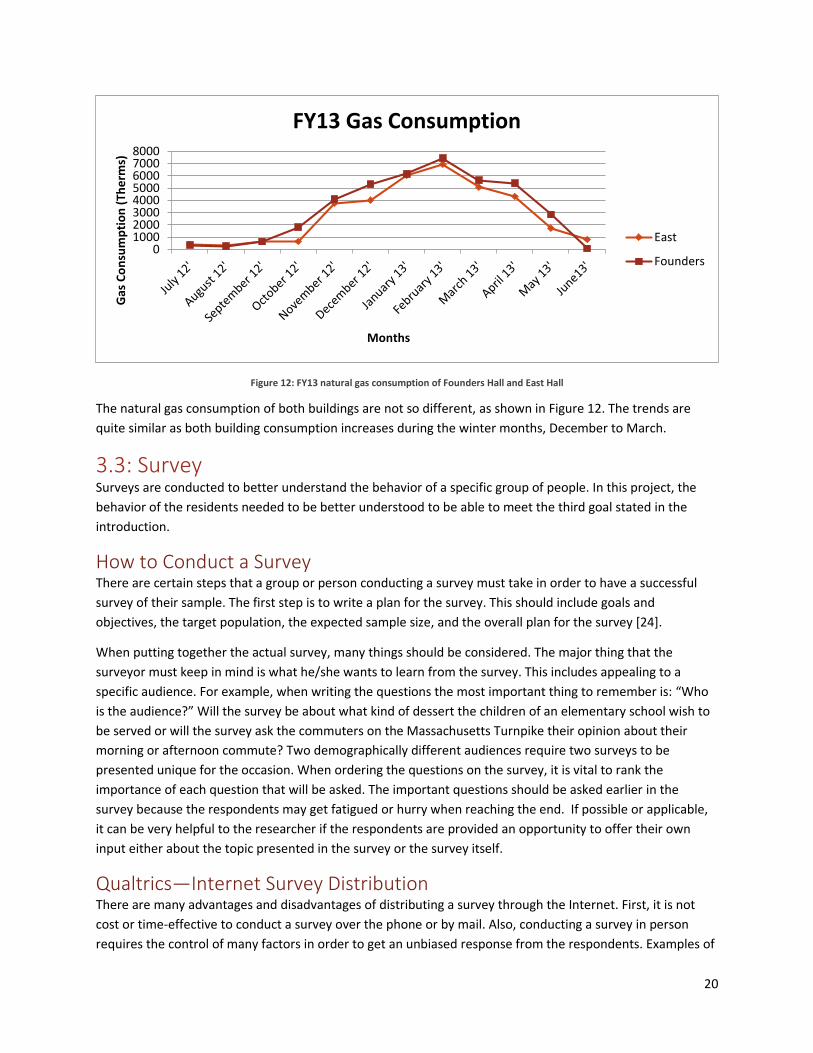
Figure 12: FY13 natural gas consumption of Founders Hall and East Hall
The natural gas consumption of both buildings are not so different, as shown in Figure 12. The trends are
quite similar as both building consumption increases during the winter months, December to March.
3.3: Survey Surveys are conducted to better understand the behavior of a specific group of people. In this project, the
behavior of the residents needed to be better understood to be able to meet the third goal stated in the
introduction.
How to Conduct a Survey There are certain steps that a group or person conducting a survey must take in order to have a successful
survey of their sample. The first step is to write a plan for the survey. This should include goals and
objectives, the target population, the expected sample size, and the overall plan for the survey [24].
When putting together the actual survey, many things should be considered. The major thing that the
surveyor must keep in mind is what he/she wants to learn from the survey. This includes appealing to a
specific audience. For example, when writing the questions the most important thing to remember is: “Who
is the audience?” Will the survey be about what kind of dessert the children of an elementary school wish to
be served or will the survey ask the commuters on the Massachusetts Turnpike their opinion about their
morning or afternoon commute? Two demographically different audiences require two surveys to be
presented unique for the occasion. When ordering the questions on the survey, it is vital to rank the
importance of each question that will be asked. The important questions should be asked earlier in the
survey because the respondents may get fatigued or hurry when reaching the end. If possible or applicable,
it can be very helpful to the researcher if the respondents are provided an opportunity to offer their own
input either about the topic presented in the survey or the survey itself.
Qualtrics—Internet Survey Distribution There are many advantages and disadvantages of distributing a survey through the Internet. First, it is not
cost or time-effective to conduct a survey over the phone or by mail. Also, conducting a survey in person
requires the control of many factors in order to get an unbiased response from the respondents. Examples of
010002000300040005000600070008000
Gas
Co
nsu
mp
tio
n (
The
rms)
Months
FY13 Gas Consumption
East
Founders

21
these factors are body language, tone of voice, and clarity in expressing the question. An Internet survey
takes all of these factors out of the equation. It is much easier to create and distribute a survey using an
internet source like Qualtrics. The major advantage in using an Internet survey is the collection, recording,
organization, and analysis of the data. Qualtrics records all of the inputted answers and allows the user to
graph and visually represent data. When targeting a population of 500, it can be very time-consuming and
exhausting to manually have to go through cards or booklets and record data by hand to then input it into a
spreadsheet. One of the various interesting features of Qualtrics is the ability to export the data recorded
online to an Excel file, if a person is more accustomed to reading spreadsheets.
There are also many disadvantages of an internet survey. The biggest disadvantage is that there is no way to
gauge the honesty of the respondents. In a case similar to this one where there is an incentive offered for a
better response rate, there could be outlying subjects that provided dishonest responses on purpose. There
are also surveys that require respondents to answer as quickly as possible, an example being psychological
surveys in which a researcher is trying to determine a specific type of trend following stimuli. In that specific
case, an internet survey is not ideal because the responder could take more time than is allotted because
perhaps they want to get a correct answer. The problem is that this does not provide a very reliable result.
Therefore, the type of survey used has to be specific to the type of result that is desired.
Survey Goals and Expectations The survey serves as an important approach to achieve the project goals—“To address behavioral issues of
WPI constituency regarding attitudes toward energy consumption,” and “to make recommendations on how
to improve the efficiency and energy usage of all buildings on campus.” Thus, the purpose of the survey is to
probe the attitudes and behaviors of the residents on energy consumption. Two separate surveys were sent
to residents in East Hall and Founders Hall in order to identify WPI students’ consciousness towards energy
consumption.
Through this survey, we hoped to address WPI’s performance to build a comfortable campus and identify
occupants’ behavior in energy-saving aspects. Defects in WPI’s heating/electric systems and behavioral issues
that may affect energy efficiency were determined, thus providing specific fields that the IQP team focused
on. Data on occupants’ ideal situation (e.g. temperature) could be compared with that from the actual
situation, and further calculation could indicate to what degree WPI could improve its energy efficiency in
those particular parts, including heating system (heat, hot water), electric systems (lighting, other electronic
devices), cooking, and occupants’ behavior.
Survey Design The survey was divided into four major blocks, each with its specific task goals, to fully study the behavior
issue of the occupancy group. These four blocks include: demographic background, heating/cooling at WPI,
electricity usage at WPI and human behavior.
Demographic Background This section sought to identify the background information of the occupants. It enabled the IQP team to
categorize the occupancy group in different ways, including floor number and building usage. Since people in
different categories tend to have similar behavior (e.g. top floor usually complains about heating and opens
windows), it would be very meaningful to differentiate people into different groups, and compare the
behavior of each group rather than acquire a general overall data. Furthermore, data acquired from these

22
questions introduced to the IQP team a general overview about WPI residents’ awareness of energy saving
strategies. These categories included:
1. Building, floor, and room identification, questions included:
o What floor do you live on?
o Do you live in a 2, 4, or 6 person suite?
2. User’s familiarity of their room. This section sought to determine how well people are aware of the
energy saving strategies in the building. People who are familiar with the building are defined as
people who know how to properly utilize the energy saving features in each building. Questions
included?
o How long have you lived in the building?
o Are you familiar with the energy saving feature in your building, like occupancy sensors?
o Overall, do you consider yourself to be an efficient user of energy?
3. User’s occupancy info regarding the expectation of the basic function of their room. This section
categorizes people into groups that treat dorms differently, because some people like to study and
entertain inside the dorm, causing more energy consumption while others may simply treat the
dorm as a place to rest. Questions included:
o On average, how much time do you spend per day (weekday/weekend) in your dorm?
o How would you define the role of the dorm? (in terms of activities and hours, options include
sleep, study, entertain, eating)
Answers to these questions introduced to the IQP team some basic information about occupancy, and helped
to categorize the occupants, to make the results more reliable and comparable. For example, a person’s
electricity usage significantly depends on the factors like time he spent in the room and what he usually does
in the room (e.g. sleeping only verses entertaining). Thus, it would be unreasonable to judge people’s
efficiency in energy usage by solely comparing their total energy usage. As a result, the demographic
background part is introduced to avoid such mistake, by comparing people’s behavior within each category.
Heating/Cooling This section sought to identify and quantify occupants’ opinions on WPI’s energy usage in heating and cooling
aspects. Through this, the IQP team hoped to determine whether WPI has provided a comfortable living
space for occupants, and thus was able to better understand the occupants’ level of satisfaction with their
room. The purpose of inspecting residents’ opinions about the heating/cooling system is to clearly determine
people’s expectation and WPI’s current performance, and to see if energy waste exists (i.e. heating too high
during winter, user can’t control thermostat). Questions included:
1. Occupants’ general opinion on the buildings:
o Overall, do you consider East/Founders Hall to be energy efficient?
2. Occupants’ general opinion on comfort level of the building
o Considering Heating/AC system, do you feel comfortable during winter/summer?
o Overall, do you consider East/Founders Hall to be a comfortable place to live?
3. Specific questions about heating system. In this section, heating in the room and hot water are
considered the major users of the heating system in daily life. Questions in this section mainly
focused on occupants’ opinions and expectations regarding the heating systems, and through these
23
questions, the IQP team could determine whether WPI is providing insufficient, sufficient or overly
sufficient (thus energy waste) heating. Questions were categorized as:
o People’s opinion and behavior:
Is it too hot/cold in winter? (and summer for east hall)
If it is too hot, do you find need to open the windows? (If yes, then how often do you
open the windows, and how long do you leave the windows open?)
How long it usually takes for the room to heat up to your desired temperature?
o People’s expectations
What temperature do you set for heat in winter? (and AC in summer for east)
At what temperature do you feel comfortable in the winter?(and summer for East Hall)
o Occupants’ control of the heating system
(open ended) Do you wish to have better control of the thermostats? Write down your
suggestions.
Electricity Similar to heat, this section asked about lighting and other electric appliances that affect energy
consumption. Some major sources of daily electricity consumption are inspected, including lighting,
refrigerators, cooking, and residents’ personal electric appliances. The IQP team expected to check WPI’s
current performance in providing such fields to identify possible energy waste, and to understand the
residents’ basic need in electricity consumption. Questions included:
Lighting
o Is there sufficient interior lighting in your room?
o Could you specify locations that are well-lit and that are not well-lit?
o Do you feel need to use additional lighting (e.g. desk lamp)
o Comments on lighting?
Electric appliances and personal belongings
o Do you use the fridge often and how full it is usually?
o Do you own a TV/laptop/desktop/gaming system?
o On average, how many hours a week do you use your TV/laptop/desktop/gaming system?
Cooking
o Do you cook in East/Founders Hall?
o (if so) How often do you cook on a weekly basis?
o What do you prefer to use to cook, microwave or stove?
o Comments on cooking systems?
Human Behavior This section looks more into the occupants’ attitude and behavior aspects, and thus identifies aspects that
people can improve to maximizing the energy efficiency.
1. People’s consciousness about energy conservation
o Attitude/awareness towards saving energy
Do you consider it’s necessary that everyone should save energy?
2. On average, how much energy in kWh do you think you’ll use? Write it down.(This question checks
whether residents truly have a sense of their electricity usage)Personal habits

24
o Difference between home and school? (since bills are not charged on you)
o Personal habits that may cause energy waste.
o Do you usually tend to leave the following devices on when it is not being used? (Here a list
of electronics was provided, and the occupants were asked to check them off if applicable.)
o Which electronics are plugged in at all times, regardless of being in use or not? (Here a list of
electronics was provided, and the occupants were asked to check them off if applicable.)
Through these questions, the IQP team sought to identify possible energy waste caused by occupants’ habits,
and determine the possibility of improvement (by raising their consciousness about energy saving) and
calculate how much energy could potentially be saved if people change their behavior. For the actual survey
questions, check Appendix G and Appendix H
Survey Distribution The targets of the survey are the resident students of East Hall and Founders Hall. The questions are
specifically designed to get their true opinion of the residence hall in which they are living. This is important
because the resident students are the ones that are most likely to provide suggestions for improvement on
things that the staff that work in those buildings may not experience. For example, staff probably wouldn’t
know if there were a draft coming through a closed window during a cold winter night.
Recently WPI has changed their policy regarding email. In order to send an email to a mailing list, the email
first has to be moderated by the Student Government Association (SGA). This makes it difficult for us because
we wanted to get the survey out as quickly as possible. Our answer to this was to get the names of the
Resident Advisors (RAs) of each of the floors of the two residence halls and send an email to them, asking
them to distribute the surveys to their respective floors. The problem with this was that we were depending
heavily on the RAs without knowing their disposition. In order to get as many responses as possible we
wanted to offer an incentive for the students to take the survey. Our incentive was a $25 Dunkin Donuts gift
card, which we gave to a randomly chosen person at the end of the survey. Our hope was that this would
raise their interest in taking the survey since many people like to drink Dunkin Donuts.
3.4: Energy Audit An important step in our investigation of the energy consumption in East and Founders Hall is to perform an
energy audit. Energy audits are performed to determine how the building is consuming energy, this way it
will help to make recommendation on improvements. Our energy audit consist of examining the building
layout, review energy bills, perform walk-through audits, and collecting real-time data by recording the meter
reading day-by-day.
Building Plans To start an energy audit it is important to research and understand the physical background information of
the buildings before conducting an energy audit. Building floor plans, buildings total square footage, number
of occupants, residential room capacities, preinstalled appliances, non-residential functions, and monthly
electric and gas consumption are important information we received from Residential Services and Facilities.
This information not only helps us understand the operations of the buildings but also compare the buildings’
intended functionality use, such as hosting shows, group projects in tech suites, or regular residential uses.

25
The floor plans of the buildings are essential tools for us to conduct an energy audit. The floor plan provides
us with information such as room locations, relative room size, and the number of windows and entry and
exit doors. While conducting the walk-through energy audit of East Hall and Founders Hall we used the
building plans to record the data such as luminance reading, light bulb locations, the amount of light bulbs in
certain locations, HVAC vent and air handler locations, and any present drafts. With this information on the
floor plans it helped us compare the lighting systems (bulb types, luminance reading, and locations), HVAC
locations, Founders Hall heaters locations, windows sizes, windows functions (if it opens or its fixed shut),
and areas with a present draft. The Department of Facilities and Professor Guillermo Salazar provided the
building floor plans for East Hall and Founders Hall presented in Appendix I.
Energy Bills Collecting data of the buildings electric and gas usage from the last 12 months is a handy tool for the audit.
We found this information by using WPI’s bill from NSTAR (gas) and National Grid (electric) as it presents the
usage history of the buildings. The reason why it was important to collect the building electric and gas usage
was to get an overall picture of the building electric and gas consumption history. We were able to see trends
of the electric and gas consumption such as what is the consumption difference from each of the winter
months and summer months. Another reason to collect the buildings usage history was to compare East Hall
and Founders Hall to one another by dividing the total consumption (gas or electric) to the square footage of
the buildings.
𝑇𝑜𝑡𝑎𝑙 𝐸𝑛𝑒𝑟𝑔𝑦 𝐶𝑜𝑛𝑠𝑢𝑚𝑝𝑡𝑖𝑜𝑛
𝐵𝑢𝑖𝑙𝑑𝑖𝑛𝑔𝑠 𝑆𝑞𝑢𝑎𝑟𝑒 𝑓𝑜𝑜𝑡
With this data, we were able to compare how much energy is used in a square foot. This is important data
because it compared a LEED certified building (East Hall) to a non-LEED certified building (Founders Hall).
Comparing them we examined how effective the energy efficiency of a LEED certified building is to that of a
non-LEED certified building.
Walk-through Audit A walk-through energy audit consists of touring a building to identify any obvious inefficient components and
practices. Steps in this process include taking an inventory of the electric and heating systems in the building,
and evaluating the building envelope. An invaluable resource in conducting the walkthrough audits is the
Commercial Energy Auditing Reference Handbook [25], which includes energy saving opportunities by
building type, as well as data on common types of lighting and mechanical systems.
The inventory process consisted of a few stages. The first stage was to obtain access to all areas of the
building, by working with the Department of Facilities and the various occupants of the space. The next step
was to inventory the lights and permanent appliances and to evaluate the heating and cooling systems. Part
of the lighting inventory was to take luminance readings using a lux meter. Finally, the building envelope was
evaluated, including taking measurements of windows and locating areas of noticeable draft.
Metering Monitoring the energy usage of electricity and gas, in East Hall and Founders Hall was an important step in
the energy audit. The monitoring gave us a sense of how much energy the building consumes on a daily basis.
While monitoring the meters on a daily basis we also took into account the temperature, its highs and lows.

26
Recording the high and low temperature of the days gave us a sense of how the outside temperature
correlates to the amount of energy the building is consuming. The process of energy monitoring consisted of
visiting East Hall and Founders Hall meters every morning at a relatively similar time and either record the
data by hand or take a photo with a smartphone, then transfer the data to the meter tracking sheet (see
Appendix C), and then break down the data into a graph form and view the day to day trends. We started
reading the meters on December 2 and ended on December 20. WPI’s winter break went from December 19
to January 16. Upon returning to classes on January 16 the meter reading was resumed for that one day.
With this information we were able to compare the difference in energy consumption with the buildings
regular operations with residents to without residents.
Initially this process sounded simple but we did run into some obstacles. The meters for East Hall are located
outside by the northern side of the building, Founders hall on the other hand has its gas meters located
outside and the electric meter in the basement, which is where the WPI police station is located. To get
access to the Founders electric meter we needed to be accompanied by our IQP advisor and escorted by an
officer to the room where the electric meter is located. Rather than going through that struggle each time we
decided to place a computer and webcam set-up to view the meter, Figure 24. The setup consisted of a
computer tower, a webcam on top of a tripod facing the meter, an LED light, and a power outlet timer that
will control the light. The process of monitoring this meter is to remotely access the computer from a
personal computer or smartphone in the morning from 7:15am to 8:15am (we set-up the light timer and the
computer to turn on at 7:15am and turn off at 8:15am). After logging into the computer we accessed the
webcam to view the meter and record its data.

27
Chapter 4: Results This section presents and describes the results of all parts of the project.
4.1: Survey Results Here the surveys were analyzed and discussed in detail. The following section presents the responses
provided by the residents of East Hall and Founders Hall. These responses can also be seen in Appendix G and
Appendix H, as well as Table 4: East Hall/Founders Hall Survey Questions.
Overview of survey results of East Hall and Founders Hall Here presents a general overview of survey responses for East Hall and Founders Hall.
Table 4: East Hall/Founders Hall Survey Questions brief overview
Question East Hall key response Founders Hall key response
1. How many people are there
in your suite? 96% said 4 45% said 4, 55% said 6
2. How long have you been
living in East/Founders Hall?
57% less than 1 year, 43% at
least one year 95% less than one year
3. Overall, do you consider
yourself to be an efficient user
of energy?
9% yes, 74% somewhat 24%yes, 48% somewhat
4. On average, how many hours
do you spend in East/Founders
Hall each day?
13 on weekday, 15.5 on
weekend
13.3 on weekday, 15.8 on
weekend
5. How would you define the
role of the dorm?
Mostly rest, studying
entertaining, dinging (over 70%) Mostly rest and studying
6. Overall, do you consider
East/Founders Hall to be energy
efficient?
70% Yes 10% Yes, 50% No
7. Overall, do you consider
East/Founders Hall to be a
comfortable place to live?
74% Yes 80% Yes

28
Table 5: East Hall/Founders Hall Survey Questions brief overview (continued)
Question East Hall key response Founders Hall key response
8. Considering the AC in room,
how do you feel during
summer? (East Only)
48% comfortable, 35%
somewhat hot
9. Considering the heating in
the room, how do you feel
during winter?
48% comfortable, 35%
somewhat hot
55% comfortable, 25%
somewhat hot
10. Have you ever opened the
windows during the winter due
to overheating in your room?
39% Yes 45% Yes
11. How often do you have to
open the windows due to
overheating?( if answered Yes
in previous question)
63% less than once a week 71% less than once a week
12. How long do you usually
leave the windows open?
25% less than 1 hour, 75%
longer 75% less than 1 hour
13. When your windows are
closed, do you feel a draft? 25% more than ‘Sometimes’ 75% more than ‘Sometimes’
14. What temperature do you
set for the heat in the winter? 71.3 70.6
15. At what temperature do
you feel comfortable in the
winter?
70.4 70.2
16. Do you have sufficient
lighting in your suite? 25% No 56% No
17. Do you feel the need to use
additional lighting anywhere in
your suite?
35% Yes 75% Yes
18. Do you consider it necessary
that everyone should save
energy?
60% Yes 84% Yes

29
Some key comments include:
East Hall:
o “I've had difficulty controlling the thermostat - it seems like it doesn't
actually do anything, and opening/closing the windows didn't have any
effect on the AC”
o “I would like to be able to turn off the A/C. One morning the sun was
shining on the thermostat so the A/C was blasting and we were cold.
We had to open a window to the colder outside air to get the A/C to
turn off. Also, when we're all home and in our rooms working for
several hours the heat will turn off because and we sometimes get
cold.”
o “The suite heats unevenly. My room terms to be chilly while the
double is pretty warm.”
o “There is no heat, the air coming out of the vents are cold. The
thermostat read 64 degrees this morning.”
o “Kitchen needs more light at night.”
o (regarding comments on lighting) “Location, my head creates a
constant shadow on my desk when working. there is also no lighting by
the door or by the counter”
Founders Hall:
o “The thermostat will often read a higher temperature than it actually
is. If we set it to 70 it will turn off around 65 because it reads 70. Also
because of the draft in the personal rooms, the rooms will be colder
than the common room where the thermostat is.”
o “I wish we could control the bedrooms separately.”
o (regarding heating system) “ think it works great, just wish there was
more control for individual rooms”
o “My light is located directly above the closet, and I do not have a built
in desk-light.”
o “The rooms only have one light that's too harsh, so I usually use a lamp
instead.”

30
Founders Hall A total of 22 Founders Hall residents responded to the survey we distributed. With 230 residents total
residing in Founders Hall, this gives us a 9.5% response rate. The response rate matches the average response
rate of US citizens towards a standard public survey, which is around 10% in year 2012 [26]. This response
rate is acceptable, but more engagement of student is required for a much representative data. Ways to
increase the response rate include increasing the gift card value, and sitting face to face with students in each
hall. 83% of the surveys were completed, answering each question. Since one of the questions were “How
long have you been living in Founders Hall?” we found that only 9% of the respondents have been living in
Founders Hall for more than one academic year. This means that the other 91% of respondents have been
living in Founders Hall for less than one academic year. Those who consider themselves energy efficient are
only 23%, while those who do not consider themselves energy efficient are 27%. The other 50% considered
themselves somewhat efficient users of energy.
In Founders Hall, 100% said they use their dormitory for resting and sleeping, 82% said they use their
dormitory for studying, and 59% use their dormitory for entertainment and dining. During the five weekdays,
the average amount of time spent in Founders Hall was 13 hours. During the weekend, the average amount
of time spent in Founders Hall was 16 hours. It was expected that residents would generally spend more time
in their dormitory during the weekend because there are no classes and most students like to sleep in on
both Saturday and Sunday. Those who consider Founders Hall to be a comfortable place to live amount to
76% and those who consider Founders Hall somewhat comfortable are 24%. There were none who said
Founders Hall was not a comfortable place to live.
The next part of the survey was regarding the heating in the rooms. During the winter, 29% said they were
somewhat hot, 52% said they were comfortable, 14% said they were somewhat cold, and 5% said they were
cold. Of those that were somewhat hot, none lived on the fourth floor of Founders Hall, 17% lived on the
third floor, 50% lived on the second floor, and the remaining 33% lived on the first floor. This turned out to
be a different result from what we had originally expected because our original expectation was that the
higher floors would be warmer, but these results disprove our hypothesis. Of those that said they were either
cold or somewhat cold, 100% said there was a draft coming through their closed window. Overall, 50% said
they felt a draft come through their windows. The survey provided a section for any comments about the
residents’ satisfaction or dissatisfaction with the heating system. One of the themes that were commented
on more than once was the dissatisfaction with the fact that there was only one thermostat to control the
heat of the entire suite located in the common area. Overall, the residents of Founders Hall would like to
have more control over the temperature variation in their individual bedrooms. They would like to have one
thermostat in each bedroom instead of just one thermostat located in the common area because the
temperature in the common area does not translate well to the temperature in the bedrooms. There is also a
difference between the temperature in the single bedrooms and the temperature in the double bedrooms.
One of the comments stated that the singles get very warm while the doubles do not heat up to the same
level.
Another part of the survey was concerned with the lighting of Founders Hall. 42% of the residents said they
had sufficient lighting in their suite 58% said they did not. This section also provided the opportunity for
residents to comment on their satisfaction or dissatisfaction with the lighting. Common statements are that
the closet area is well but not the other side of the bedrooms. The same situation is present in the common
area: only one side is well lit, the other is not.

31
The survey asked questions about how often the residents used the refrigerator provided in the suite. 15%
said they never open the fridge, 65% open the fridge 1-2 times a day and 20% open the fridge 3-5 times a
day. Of those who never open the fridge, 33% said their fridge was full and 67% said their fridge was half full.
Of those who open their fridge 1-2 times a day, 38% have a full fridge and 62% have a half full fridge. Finally,
of those who open their fridge 3-5 times a day, 25% have a full fridge and 75% have a half full fridge.
Originally we expected the correlation between how full a fridge is and how many times a person opened to
be directly proportional, but this was not what the results showed. 65% of the people who do open their
fridge anywhere from 1-5 times a day, had a half full fridge, the other 35% were the ones that had a full
fridge.
In the final part of the survey, we asked the residents of Founders Hall if they considered it necessary that
everyone should conserve energy. The results were: 80% said yes, 10% said no, and 10% said they don’t care.
Of those that said yes, 47% leave their laptop on, 6% leave their desktop computer on, and 25% leave their
lights on. Of those that said no, 50% leave their laptop computer on but they do not leave any other devices
on. Of those that said they do not care, 100% leave their laptop, desktop computer, and televisions on, and
50% leave their lights on. From these results we see that the residents of Founders Hall that do not care
whether we should conserve energy or not have the highest percentage among themselves of leaving
electronics on.
East Hall The survey for the East Hall took the same format as the one for Founders Hall.
A total of 24 East Hall residents responded to the survey posted. The response rate is 10.3%, similar to that of
Founders Hall. As has been mentioned, more engagement of student is required. Among the 24 students who
took part, 10 of them were residents for longer than 1 year. This survey provided a good test as to how long-
term residents felt about East Hall’s sustainable features.
Although 43% of students who took the survey have resided in East Hall for more than 1 year, only 17% were
confident that they are familiar with the energy saving features in East Hall, and 9% considered themselves
an efficient user of energy while most residents – around 70%, showed their recognition to these questions
as “somewhat familiar” or “somehow”, which indicates that in general, WPI residents’ have an opaque
impression in these fields. 70% of the students consider East Hall to be energy efficient, and 76% of the
students said that East Hall is a comfortable place to live, indicating a high satisfaction level of the living
conditions of East Hall. On average, residents spend 13 hours in their dorm during weekdays, and 16 hours
during the weekend, including sleeping time. 83% also defined the role of the dorm as for studying, 74% as a
place for entertaining, and 74% as a place for dining including cooking.
Regarding the cooling system in summer, 48% felt comfortable about the AC supply during summer, and 35%
felt somewhat cold. The range available for the thermostat is set from 69 to 72 degrees, while on average
people consider 69.7 degree as a comfortable temperature.
26% felt comfortable about the heating in winter, 26% felt somewhat cold and 47% felt cold. Due to the
limitation of respondent group, analysis of heating system according to floor is not performed. On average
people set 71 degrees for the thermostat. Among those people who felt cold, 70% never opened windows in
winter and 70% agreed that the windows are well sealed. Among people who felt hot, half opened windows
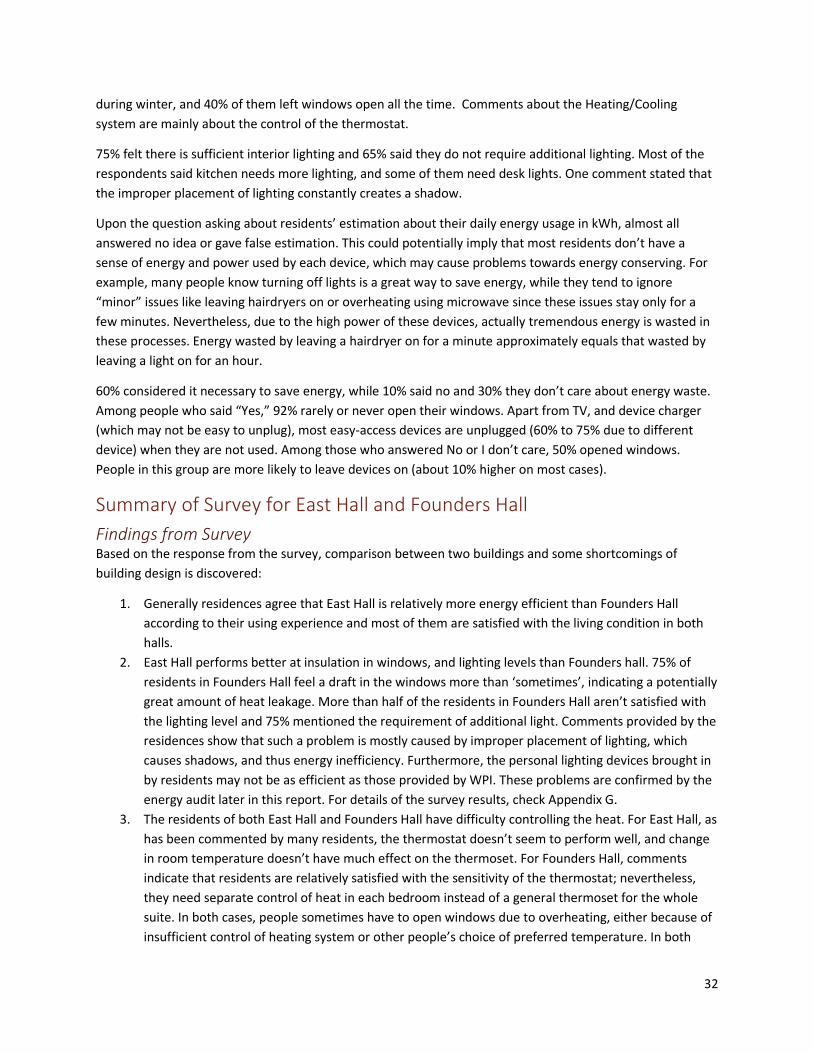
32
during winter, and 40% of them left windows open all the time. Comments about the Heating/Cooling
system are mainly about the control of the thermostat.
75% felt there is sufficient interior lighting and 65% said they do not require additional lighting. Most of the
respondents said kitchen needs more lighting, and some of them need desk lights. One comment stated that
the improper placement of lighting constantly creates a shadow.
Upon the question asking about residents’ estimation about their daily energy usage in kWh, almost all
answered no idea or gave false estimation. This could potentially imply that most residents don’t have a
sense of energy and power used by each device, which may cause problems towards energy conserving. For
example, many people know turning off lights is a great way to save energy, while they tend to ignore
“minor” issues like leaving hairdryers on or overheating using microwave since these issues stay only for a
few minutes. Nevertheless, due to the high power of these devices, actually tremendous energy is wasted in
these processes. Energy wasted by leaving a hairdryer on for a minute approximately equals that wasted by
leaving a light on for an hour.
60% considered it necessary to save energy, while 10% said no and 30% they don’t care about energy waste.
Among people who said “Yes,” 92% rarely or never open their windows. Apart from TV, and device charger
(which may not be easy to unplug), most easy-access devices are unplugged (60% to 75% due to different
device) when they are not used. Among those who answered No or I don’t care, 50% opened windows.
People in this group are more likely to leave devices on (about 10% higher on most cases).
Summary of Survey for East Hall and Founders Hall
Findings from Survey Based on the response from the survey, comparison between two buildings and some shortcomings of
building design is discovered:
1. Generally residences agree that East Hall is relatively more energy efficient than Founders Hall
according to their using experience and most of them are satisfied with the living condition in both
halls.
2. East Hall performs better at insulation in windows, and lighting levels than Founders hall. 75% of
residents in Founders Hall feel a draft in the windows more than ‘sometimes’, indicating a potentially
great amount of heat leakage. More than half of the residents in Founders Hall aren’t satisfied with
the lighting level and 75% mentioned the requirement of additional light. Comments provided by the
residences show that such a problem is mostly caused by improper placement of lighting, which
causes shadows, and thus energy inefficiency. Furthermore, the personal lighting devices brought in
by residents may not be as efficient as those provided by WPI. These problems are confirmed by the
energy audit later in this report. For details of the survey results, check Appendix G.
3. The residents of both East Hall and Founders Hall have difficulty controlling the heat. For East Hall, as
has been commented by many residents, the thermostat doesn’t seem to perform well, and change
in room temperature doesn’t have much effect on the thermoset. For Founders Hall, comments
indicate that residents are relatively satisfied with the sensitivity of the thermostat; nevertheless,
they need separate control of heat in each bedroom instead of a general thermoset for the whole
suite. In both cases, people sometimes have to open windows due to overheating, either because of
insufficient control of heating system or other people’s choice of preferred temperature. In both

33
halls, around 40% of residents open windows during heating season and 75% in East Hall open
windows for longer than one hour, showing significant energy loss.
Attitude and Behavior Overall, WPI students are concerned about conserving energy. Regarding the question “do you consider it
necessary that everyone should save energy”, over 70% respondents answered “Yes.” This number still needs
to be improved, as WPI is devoting its effort into making a more sustainable campus, and students’ support is
vital.
In order to study whether user attitudes affect their daily behavior, the following chart was created according
to the feedback from the survey.
Figure 13: Comparison of people with different attitudes
The figure offers a direct comparison between the behaviors of people who have positive attitude towards
conserving energy (marked in blue bar) and those who have negative attitude (red bar). From the chart, it can
be said that in general, people who care about conserving energy are less likely to leave devices on (4% to
36% less in each case). For more detail, see Appendix G and Appendix H. One of the findings is that the
difference in devices that are very often used like TV or laptop is very small, while the differences in devices
that are less often used like stereo system and gaming system is quite large. This may be because some

34
devices are so often used that for convenience, people seldom unplug them. The table below shows the cost
of leaving each device on. The data for each device’s idle power is acquired from Lawrence Berkeley National
Lab [27].
Table 6: Idle power of devices
Device Name Average Power when
idle (W)
Energy wasted per
day (kWh)
Money wasted per
day (¢)
Charger, mobile phone 2.24 0.053 0.70
Computer Display 0.8 0.019 0.25
Desktop 2.84 0.068 0.89
Laptop 4.42 0.106 1.37
Printer 1.26 0.030 0.39
Stereo system 1.66 0.040 0.52
TV 3.06 0.073 0.93
Game console 1.01 0.024 0.32
Notice that the unit for money wasted is in cents. The way to calculate the cost for electricity per kWh will be
discussed in detail later in the report. Even though the power and the cost seem to be small per person per
day, they do add up to a huge amount. A man wastes 5.22 kWh per month if he leaves only laptop and
desktop on all the time.
Residential Services Office A total of ten people responded to the Residential Services Office survey. Although the exact response rate is
not clear because they did not disclose with us exactly how many employees work in the Residential Services
Office, we do know that this is a much higher response rate than those of East Hall and Founders Hall.

35
Of the ten people that did respond to the survey, only nine were primarily located in the Residential Services
Office in East Hall. Of those who did primarily work in East Hall, 56% were full-time employees and 44% were
student workers. The average time spent in East Hall for work was six hours a day during the week, and 2.5
hours a day during the weekend.
When asked how familiar they were with the energy saving features of East Hall, 33% said they were very
familiar, 44% said they were somewhat familiar, and 22% said they were not familiar. 44% considered East
Hall to be an energy efficient building while 56% said they were not sure. None of the employees said East
Hall not energy efficient. Only 22% of the employees considered themselves to be efficient users of energy at
work, 56% said they were somewhat efficient users of energy, and 22% honestly considered themselves not
efficient users of energy.
The employees were unanimous in saying that East Hall was comfortable in the summer, but they were
divided when asked how the temperature was in East Hall during the winter. 22% said it was very cold, 67%
said it was somewhat cold, and only 11% said it was comfortable. Although the majority of employees in the
Residential Services Office felt cold in the winter, only one person said they could control the heating and AC
in the office. When asked to comment on their satisfaction or dissatisfaction with the heating and cooling
system in the office, one person wrote: “I hate that the vent blows all day. MY office is freezing during the
winter. It is so uncomfortable to the point I have to wear a blanket all day or trick the thermostat into reading
that I need more heat.”
When asked if there is sufficient lighting in their office, 89% of the employees said yes and 11% said no. In the
same manner, and as expected, there was a direct correlation between those who said there was not
sufficient lighting in their office and those who said they felt the need to use additional lighting in their
workspace. The results were actually identical with 11% saying they needed additional lighting and 89%
saying they did not. When asked to comment on their satisfaction or dissatisfaction with the lighting, more
than one person said they would prefer lights that were not the typical fluorescent bulbs.
The next part of the survey asked about the different devices that were used in the office by the employees.
22% said they had a laptop computer, 100% said they had a desktop computer, 56% said they had a printer,
11% said they had a fan, 56% said they had device chargers, 22% said they had desk lighting, and 56% said
they had a second computer monitor. When asked if they considered it necessary that everyone conserve
energy 89% responded yes and 11% responded no.
Overall, in the Residential Services Office located in East Hall, it is safe to say that the majority is satisfied with
their workspace except for only a very small number of people. Also, 77% are either very familiar or
somewhat familiar of the energy saving features already implemented in East Hall. There were far less
complaints from the Residential Services Office than from the students of East Hall and Founders Hall. This
can be attributed to the amount of time spent in the respective places and also the familiarity of the
respective buildings.
4.2: Energy Audit Walk through audits were conducted throughout East Hall and Founders Hall. Areas audited include the
common areas, such as hallways, lobbies, and common rooms, the mechanical and building service rooms,
the Campus Police station in Founders Hall, and a representative residential suite in each of the buildings.

36
East Hall In East Hall, we found most of the lighting is compact fluorescent (CFL) or a mix of T5 and T8 fluorescent
lighting, depending on the location. However, both the north and south elevators were lit with small,
incandescent lights. The wasted energy here is likely small, as the illuminance in the room was between 150–
225 lux. In the trash room on the first floor, we found a significant draft coming from the door to the outside,
resulting from an incomplete seal around the door, as illustrated in Figure 15. In this picture, there is an air
blower blowing hot air in front of the door; further analysis correlation with plans should show whether this
is an air curtain (to improve the building envelope) or a heating unit (likely wasting heat to the outside).
Figure 14: A T8 bulb used in East Hall
The residential areas in East Hall are lit with 24W compact fluorescent bulbs. The lighting levels are generally
adequate in the residential suites, with lux levels ranging from approximately 80-365. It is to be noted that
these lighting levels were measured with all lights in the suite turned on. During the walkthrough audit, it was
discovered that the built in table in the four-singles suite was not directly lit, but was illuminated with lights
in adjacent areas, namely the kitchen and the common area.

37
Figure 15: Gap in East Hall Main Trash Room door
Founders Hall Most of the Founders hall basement is lit by T8 bulbs. One significant result of the initial Founders Hall walk-
through audit was a complaint by a campus police officer that the Officer Work Room (room 105) is
uncomfortably bright. This room is lit by U-shaped fluorescent lights, a lighting choice unique to the Campus
Police Station, and illuminance levels are in excess of 600 lux at eye-level at the workstations. This area is in
need of having its lighting reduced, both to increase building efficiency and occupant comfort.
The common areas and hallways in the residential portions of the building are also lit by T8 fluorescent lights.
The lighting in the residential hallways averaged between 17 to 100 lux. Compared to East Hall and the
basement of Founders hall, this is relatively dark. It appears the lack of lighting is due to the poor placement
of the lights in the hallway: the light fixtures were placed perpendicular to the direction of the hall, creating
uneven and inadequate lighting.
This trend of inadequate lighting extended into the suites. Of particular note is the bedroom lighting. Both
the double and single bedrooms were lit by a single T8 light hung above the door of a built-in closet. This
closet was generally across the room from the desk and bed. This resulted in uneven lighting, ranging from
upwards of 300 lux near the closet, to as little as 5 lux at working height on the desk. The remainder of the
suite averaged between 150 and 300 lumens.
The heating in the residential suites of Founders Hall is locally controlled, with each suite containing a
Honeywell Round thermostat that allows the temperature to be set between 50 and 80 degrees Fahrenheit.
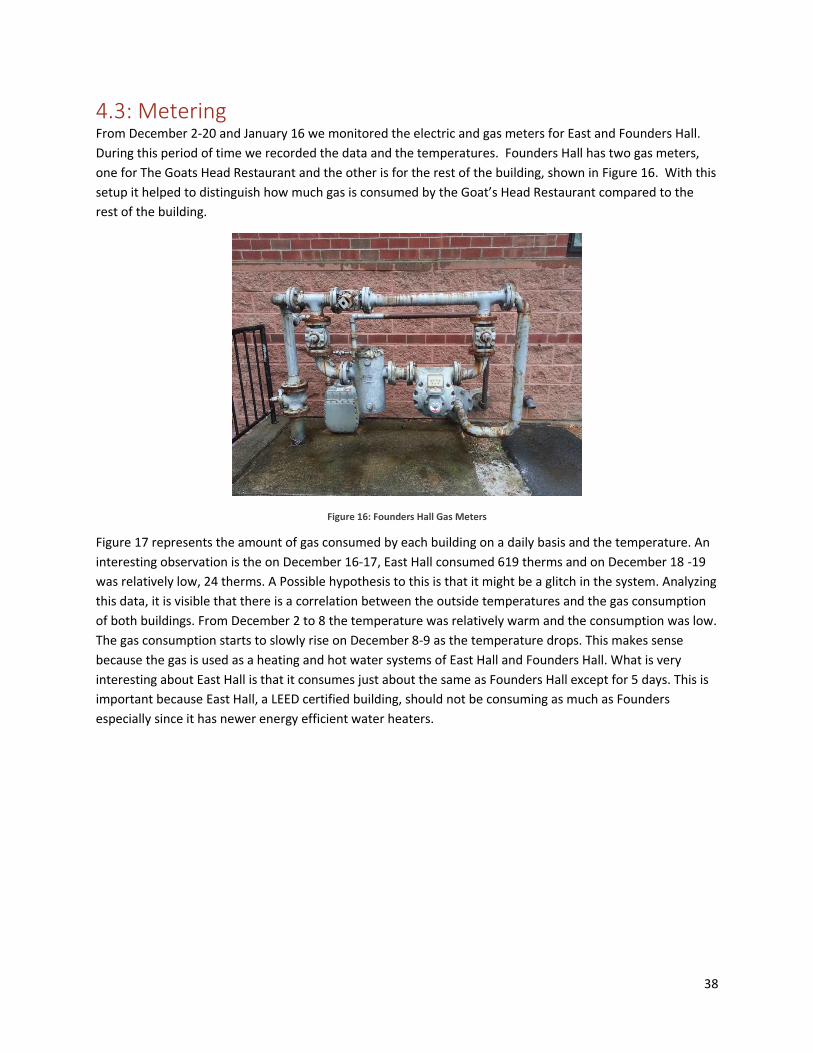
38
4.3: Metering From December 2-20 and January 16 we monitored the electric and gas meters for East and Founders Hall.
During this period of time we recorded the data and the temperatures. Founders Hall has two gas meters,
one for The Goats Head Restaurant and the other is for the rest of the building, shown in Figure 16. With this
setup it helped to distinguish how much gas is consumed by the Goat’s Head Restaurant compared to the
rest of the building.
Figure 16: Founders Hall Gas Meters
Figure 17 represents the amount of gas consumed by each building on a daily basis and the temperature. An
interesting observation is the on December 16-17, East Hall consumed 619 therms and on December 18 -19
was relatively low, 24 therms. A Possible hypothesis to this is that it might be a glitch in the system. Analyzing
this data, it is visible that there is a correlation between the outside temperatures and the gas consumption
of both buildings. From December 2 to 8 the temperature was relatively warm and the consumption was low.
The gas consumption starts to slowly rise on December 8-9 as the temperature drops. This makes sense
because the gas is used as a heating and hot water systems of East Hall and Founders Hall. What is very
interesting about East Hall is that it consumes just about the same as Founders Hall except for 5 days. This is
important because East Hall, a LEED certified building, should not be consuming as much as Founders
especially since it has newer energy efficient water heaters.
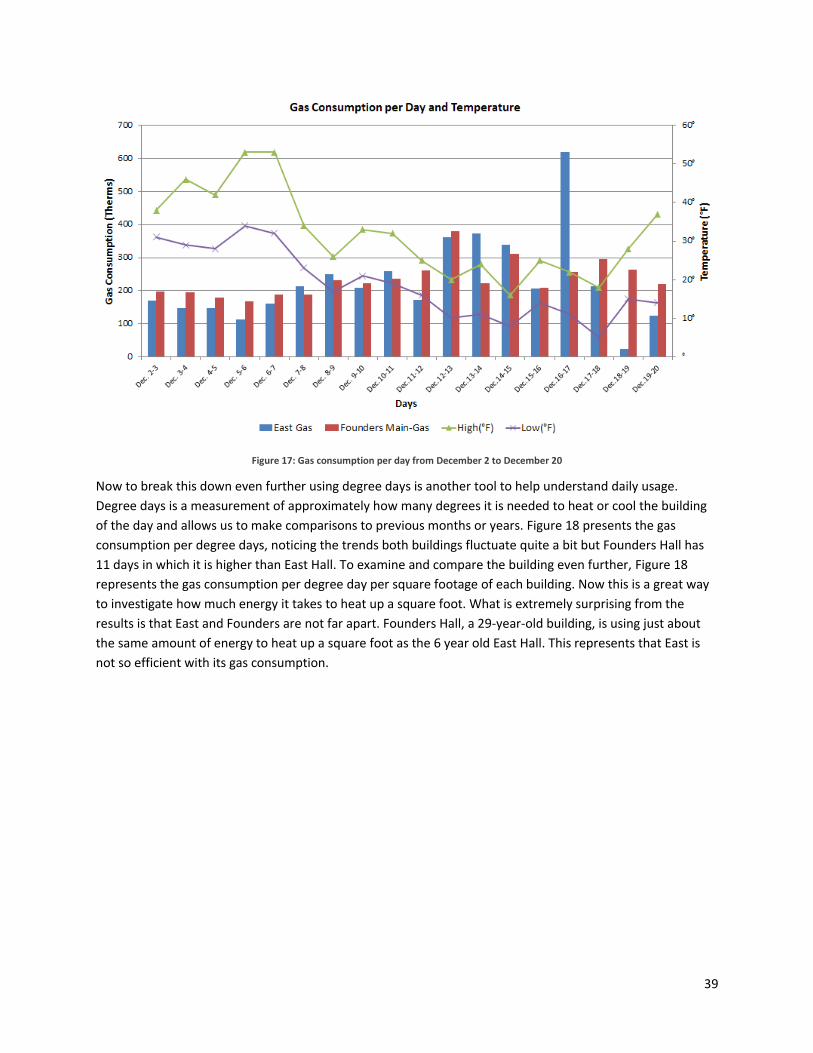
39
Figure 17: Gas consumption per day from December 2 to December 20
Now to break this down even further using degree days is another tool to help understand daily usage.
Degree days is a measurement of approximately how many degrees it is needed to heat or cool the building
of the day and allows us to make comparisons to previous months or years. Figure 18 presents the gas
consumption per degree days, noticing the trends both buildings fluctuate quite a bit but Founders Hall has
11 days in which it is higher than East Hall. To examine and compare the building even further, Figure 18
represents the gas consumption per degree day per square footage of each building. Now this is a great way
to investigate how much energy it takes to heat up a square foot. What is extremely surprising from the
results is that East and Founders are not far apart. Founders Hall, a 29-year-old building, is using just about
the same amount of energy to heat up a square foot as the 6 year old East Hall. This represents that East is
not so efficient with its gas consumption.

40
Figure 18: Gas consumption per Degree Day
Figure 19: Gas consumption per square footage
Reading the electricity meter is another form of data we collected. The graph below presents the daily
consumption of electricity of both buildings and the outside temperature of that particular day. Upon
examining Figure 20, there is no direct correlation of temperature affecting the electricity usage. This is
interesting because East Hall’s HVAC system is controlled using electricity, but it is not a factor to which the
electricity consumption fluctuates as the gas to Founders Hall. East Hall overall consumes more electricity

41
than Founders Hall and this does make sense because East Hall is a much laminated building with a full size
refrigerator and stove in each suite and a 24-hour garage.
Figure 20: Electricity consumption from December 2-20
To understand the overview building energy consumption (gas and electric) it is important to use the correct
unit of energy. In this case we will use kilowatt-hour. To convert the gas consumption from centum cubic feet
(ccf = 100 cubic feet) to kilowatt-hour (kWh) the following steps and equations:
Table 7: Conversion of ccf to kWh
ccf to therms 1 ccf = 1.023 therms
therms to BTU 1 therm = 100,000 BTU
BTU to Joules 1 BTU = 1055.05585 joules
Joules to kWh Kilowatt = joule / (1000 × second)
These numbers are from our metering data collection (Dec. 2 – 20, 2013) during school year.
East Gas:
o First reading Dec. 2, 2013—25092 ft3
o Second reading Dec. 20, 2013—29081 ft3
o Difference (CCF used in 19 days)—3989 ft3
o Converted to kilowatt-hour: 116,867 kWh

42
Founders Main Gas:
o First reading Dec. 2, 2013—775420 ft3
o Second reading Dec. 20, 2013—779524 ft3
o Difference (CCF used in 19 days) —4104 ft3
o Converted to kilowatt-hour: 123,043 kWh
Founders Goats Head Gas:
o First reading Dec. 2, 2013—38474 ft3
o Second reading Dec. 20, 2013—39075 ft3
o Difference (CCF used in 19 days) —601 ft3
o Converted to kilowatt-hour: 18,019 kWh
East Electric:
o First reading Dec. 2, 2013—6258400 kWh
o Second reading Dec. 20, 2013—6317200 kWh
o Difference (19 days) —58800 kWh
Founders Electric:
o First reading Dec. 2, 2013—5027360 kWh
o Second reading Dec. 20, 2013— 5071520 kWh
o Difference (19 days) —44160 kWh
Table 8: Energy Consumption from December 2 to December 20
Utilities (kWh) East Founders
Gas 116867 123043
Electric 58800 44160
Total 175667 167203
Per resident4 per day 40.2 35.3
Per day 9246 8800
Per square foot per day 0.089 0.091
The table above shows some very important information of the overview consumption of buildings. In East
Hall each resident consumes about 40.2 kWh per day compared to Founders 35.3 kWh, but yet Founders
consumes 2% more energy per square foot per day.
These numbers are from our metering data collection (Dec. 20, 2013 to January 16, 2014) during winter
break.
East Gas:
o First reading Dec. 20, 2013— 29081 ft3
o Second reading Jan. 16, 2014—34665 ft3
4 East (Fall 2013) 230 occupants, Founders (Fall 2013) 249 occupants

43
o Difference (CCF used in 28 days) —5584 ft3
o Converted to kilowatt-hour: 167,415 kWh
Founders Main Gas:
o First reading Dec. 20, 2013—779524 ft3
o Second reading Jan. 16, 2014—784096 ft3
o Difference (CCF used in 28 days) —4572 ft3
o Converted to kilowatt-hour: 130,980 kWh
Founders Goats Head Gas:
o First reading Dec. 20, 2013—39075 ft3
o Second reading Jan. 16, 2014—39165 ft3
o Difference (CCF used in 28 days) —90 ft3
o Converted to kilowatt-hour: 2698 kWh
East Electric:
o First reading Dec. 20, 2013—6317200 kWh
o Second reading Jan. 16, 2014—6382800 kWh
o Difference (28 days) —65600 kWh
Founders Electric:
o First reading Dec. 20, 2013—5071520 kWh
o Second reading Jan. 16, 2014—5109920 kWh
o Difference (28 days) —38400 kWh
Table 9: Energy consumption from December 20 to January 16
Utilities (kWh) East Founders
Gas 167415 130980
Electric 65600 38400
Total 233015 169380
Per resident* per day NA NA
Per day 8322 6049
Per square foot per day 0.081 0.062
Table 10: Consumption per day
(kWh) East Founders
Dec. 2 – 20, 2013 (19 days) 9246 8800
Dec. 20 – Jan 16, 2014 (28 days) 8322 6049
Difference per day 924 2751

44
The consumption per day table represents how much energy the buildings consumes per day with residents
in them (December 2-20) to no residents in them (December 20 to January 16). What is interesting about
East Hall is that the difference with to without the residents is only about 10% difference while Founders Hall
has a 31% difference. This is surprising because this means it costs more to operate East Hall than it does
Founders Hall.
Figure 21: Total Energy consumption and temperature
Figure 22: East Hall Electric Meter

45
Figure 23: East Hall Gas Meter
Figure 24: Founders Hall electric metering webcam setup
4.4: Energy Bills WPI’s January 2014 bills were used to view the electricity and gas consumption history of East Hall and
Founders Hall. In Appendix J, the bills are shown from NSTAR (gas) and National Grid (electricity). Again as a
reminder, WPI pays NSTAR and National Grid for the delivery/service of the utility, gas and electricity. These
bills provide a 12 month usage history of the buildings, except for the Founders Hall NSTAR bill which is
missing May, June, and August. Before looking at the usage history of the bills, it is important to understand
the units the utility companies are using. For example, NSTAR charges by the therm even though the gas
meters are measuring in centum cubic feet (ccf = 100 cubic feet). Figure 25 presents how NSTAR converts the
ccf to therms. NSTAR takes the difference of the billing period and multiplies it by the therm factor which, in
this example, is 1.0296. Now this number represents the East Hall actual energy usage.

46
Figure 25: NSTAR conversion ccf to therms
On the National Grid bill, it’s the same concept but the only difference is that the electric meter measures in
kilowatt-hours and all they have to do is multiply it by Meter Multiplier. The reason the electric meter is
multiplied by a meter multiplier is because on the meters the actual amount of energy used is too large to be
displayed, so the meter just displays a fraction of the actual use, as shown in Figure 26.
Figure 26: National Grid Meter Multiplier
To express the consumption of electricity and gas in a more direct sense, the energy unit kWh and therm is
converted into dollars according to WPI’s condition. Both electricity and natural gas bills consist of two parts:
the actual bill paid for the energy and the bill paid for distributing electricity/natural gas.
For electricity, the following equation:
𝐵𝑖𝑙𝑙 𝑐ℎ𝑎𝑟𝑔𝑒𝑑 = ($0.1 + $0.03) ∗ 𝑒𝑙𝑒𝑐𝑡𝑟𝑖𝑐𝑖𝑡𝑦 𝑢𝑠𝑒𝑑 (𝑖𝑛 𝑘𝑊ℎ)
Where the factor 0.1 is the charge per kWh electricity used (see Appendix J), and 0.03 is the combined charge
for delivery per kWh, including the factors for distribution, transition, transmission, energy efficiency and
renewable energy charge. For detailed value for these factors, Appendix J.
For gas, the following steps are taken:
1. The charge for natural gas by Hess Energy is around $4.6 per MBtu [28],
$4.6 = 1 ∗ 106 𝐵𝑡𝑢
2. Convert to therms:

47
1 𝑇ℎ𝑒𝑟𝑚 = 100,000 𝐵𝑡𝑢 = 0.1 𝑀𝐵𝑡𝑢
$0.46 = 1 𝑡ℎ𝑒𝑟𝑚
Thus the overall combined charge for natural gas is:
𝐵𝑖𝑙𝑙 𝑐ℎ𝑎𝑟𝑔𝑒𝑑 = ($0.229 + $0.113 + $0.46) ∗ 𝑛𝑎𝑡𝑢𝑟𝑎𝑙 𝑔𝑎𝑠 𝑐𝑜𝑛𝑠𝑢𝑚𝑒𝑑 (𝑖𝑛 𝑇ℎ𝑒𝑟𝑚𝑠)
The factor 0.229 and 0.113 come from the charge for delivering the natural gas WPI’s bill for Founders Hall
Year 12-13.
Using this cost information and the consumption history of both buildings, Figure 27 and Figure 28, we are
able to combine this information and create a graph representing the cost of each month. In Figure 30, we
are not sure why NSTAR does not present the months of May, June, and August.
Figure 27: Founders Hall Electricity and Gas consumption history

48
Figure 28: East Hall Electricity and Gas consumption history
Figure 29: 2013 Electricity usage histories of East Hall and Founders Hall
$0.00
$2,000.00
$4,000.00
$6,000.00
$8,000.00
$10,000.00
$12,000.00
$14,000.00
$16,000.00
Ch
arge
Months
2013 Electric Usage History
East ($)
Founders ($)

49
Figure 30: 2013 Gas usage histories of East Hall and Founders Hall
Using the data provided by NSTAR and National Grid, the yearly energy operating cost of East Hall can be
estimated at $195,474.75, while the cost for Founders Hall can be estimated at $139,644.85. The difference
of $56,829.90 shows Founders Hall consumes about 29% less energy in a year than East Hall. This
demonstrates that East Hall, a LEED Gold certified building, is not cost efficient compared to Founders Hall, a
non-LEED certified building.
$0.00
$1,000.00
$2,000.00
$3,000.00
$4,000.00
$5,000.00
$6,000.00
$7,000.00
Ch
arge
Months
2013 Gas Usage History
East ($)
Founders ($)

50
Chapter 5: Recommendations and Conclusions Finally, from all of the information that was obtained throughout the course of this project we can provide
recommendations from our findings. These will be divided into three appropriate parts.
5.1: Immediate Implementation There are certain things that can be done right away to improve the efficiency of the buildings in question.
The first thing is making sure that all of the exits of both East Hall and Founders Hall are sealed, most
specifically in the East Hall Trash Room shown in Figure 7. There are also windows in Founders Hall that can
be changed because they let in a draft. This was something that the residents of Founders Hall stated in the
survey. Something that is not present in neither East Hall nor Founders Hall are light level sensors. This
would be something that controlled the lights inside the building according to how much sunlight is already
being let in through the windows and doors. East Hall currently has occupancy sensors but Founders Hall
does not. Occupancy sensors could be installed in multiple parts of Founders Hall to minimize the time lights
are left on.
5.2: Future Implementation There are certain things that we learned about the buildings that can only serve as recommendations for
future buildings. In Founders Hall a major theme was the lighting in the suite. The reason why the lighting
levels in Founders Hall were so low in certain areas was not because of the type of bulb or size of bulb, but
almost entirely because of where the light is placed. In the future, lights should be placed primarily according
to where students’ work areas will be. Very similar to this is the use of natural light. Large windows are very
important in a building that wants to be efficient because it not only is a source of light, but it can also be a
source of warmth, other than a heater. Another important thing to consider when designing a new building is
thermal comfort from the resident’s point of view. Thermal comfort in this context means better thermostat
control and more heating zones. Better thermostat control is a factor because although East Hall has sensors
that are directly connected to the air conditioning system, residents deliberately try to trick the thermostat
into thinking the room is a different temperature than it actually is to make the thermostat do something
else. In Founders Hall the residents wanted better control of the thermostat because the singles got much
warmer than the doubles, and at a much faster rate. This caused the residents to turn the thermostat either
extremely high or low, back and forth, overworking the heating system, therefore causing it to be an efficient
use of energy.
5.3: Behavior Changes The residents of Founders Hall bring extra lamps with them to light up their workspace. We recommend that
the Residential Services Office provide information to new incoming residents of Founders Hall of specific
models of lamps and bulbs that are more efficient. It could even be a requirement that all desk lamps use
CFLs. This would be effective if the RA’s of Founders Hall checked each lamp in the beginning of the year.
Sometimes a person that does not usually turn off the lights when they leave a room, will do so if they are
asked. Posters and advertisements are very important in trying to get more people to pay attention to
something. Heavily trafficked areas like bathroom doors and entrances are great places for advertising
sustainability. Quick facts are things that people can read easily and remember easily, yet can make a large
impact. Also, the appliances in the kitchen areas are very important as well. We found that the residents will

51
use what is readily available to them and what is most convenient. If the residents are provided with a
smaller stove and a smaller oven they will still use it just as much. When installing the appliances the
difference will not be seen directly by the residents using them, but rather on the energy bills.
5.4: LEED When it comes to LEED Certification, there was no significant difference in energy consumption that provided
us with a definitive reason why a LEED certified building is more energy efficient than one that is not LEED
certified. When East Hall received its LEED Gold Certification, one of the things that East Hall was not
awarded points for was thermal comfort. As we’ve mentioned before, this was something with which the
residents were not satisfied. Overall LEED Certification does not mean that the building in question will
perform better than its counterpart on all fronts because we’ve shown that East Hall does consume more
energy than Founders Hall, a much older building.
5.5: Future Projects For future projects, we have multiple recommendations:
Evaluate other buildings on campus, especially academic buildings. There are many buildings that
either have already been retrocommissioned, or are in the process of retrocommissioning.
Develop new recommendations on best practices for new building construction. Areas that can be
closely researched and addressed are how to light the building and how to heat the building, of
course in the most sustainable and energy efficient manner possible.
Enhance real-time data collection. Perhaps there could be a project devoted to developing a system
that allows WPI Facilities to monitor each building individually.
Each of these projects would contribute to the continuing efforts to enhance the sustainability of the WPI
campus.

52
References
[1] World Commission on Environment and Development, "Our Common Future," Oxford University Press,
Cambridge, 1987.
[2] B. Fischer, "The tradition continues: the United States wastes more energy than it uses," 22 August 2013.
[Online]. Available: http://blog.opower.com/2013/08/the-tradition-continues-the-united-states-wastes-
more-energy-than-it-uses/.
[3] Worcester Polytechnic Institute, "Buildings," 2013. [Online]. Available:
http://www.wpi.edu/about/tour/building.html.
[4] V. Thierry, C. O'Hara, M. Hurgin and M. Hobson-Dupont, "Energy Monitoring on the WPI Campus,"
Worcester Polytechnic Institute, Worcester, MA, 2007.
[5] B. Habin, M. Dupis and D. Cancel, "Energy Audit of Higgins Laboratory," Worcester Polytechnic Institute,
Worcester, MA, 2009.
[6] E. Newman, A. Laflash and N. Granata-Cappabianca, "Atwater Kent Energy Study," Worcester
Polytechnic Institute, Worcester, MA, 2010.
[7] WPI Task Force on Sustainability, "WPI Sustainability Plan," Worcester Polytechic Institute, Worcester,
MA, 2013.
[8] WPI Task Force on Sustainability, "2013 Campus Sustainability Report," Worcester Polytechnic Institute,
Worcester, MA, 2013.
[9] B. Baird, D. McKenzie-Mohr, G. Rodrigues, R. Andres, C. Blumstein and K. Ehrhardt-Martinez, Human
Behavior and Energy Use, Washington, DC: Environmental and Energy Study Institute, 2010.
[10] United States Green Building Counsil, "Applying LEED," 2013. [Online]. Available:
http://www.usgbc.org/leed/why-LEED.
[11] S. Kubba, LEED Practicies, Certification, and Accredidation Handbook, Burlington, MA: Butterworth-
Heinemann, 2010.
[12] Worcester Polytechnic Institute, "Buildings & Grounds," 2013. [Online]. Available:
http://www.wpi.edu/about/sustainability/facili05.html.
[13] Worcester Polytechnic Institute, "East Hall," 2013. [Online]. Available:
http://www.wpi.edu/about/sustainability/easthall.html.
[14] Worcester Polytechnic Institute, "Sports & Recreation Center," 2013. [Online]. Available:
http://www.wpi.edu/about/sustainability/sports-rec.html.

53
[15] United States Green Building Council, "Optimize Energy Performance," 2009. [Online]. Available:
http://www.usgbc.org/node/1731022. [Accessed 6 October 2013].
[16] Cannon Design, "Greening Student Life by Greening Residence Halls," 9 December 2010. [Online].
Available: http://www.slideshare.net/Aarongrt/case-study-greening-student-life-by-greening-residence-
halls. [Accessed 6 October 2013].
[17] W. Grudzinski, Interviewee, Initital Facilities Interview. [Interview]. 17 September 2013.
[18] Worcester Polytechnic Institute, "WPI Partners with Area Colleges in Energy-Saving Program," 1 June
2012. [Online]. Available: http://www.wpi.edu/news/20112/synerge.html.
[19] E. MIlls, "Building Commissioning: Definition," 2013. [Online]. Available: http://cx.lbl.gov/definition.html.
[20] U.S. Environmental Protection Agency, "Save Energy at Home," 2013. [Online]. Available:
http://www.energystar.gov/index.cfm?c=products.pr_save_energy_at_home.
[21] M. McDonough, "John S. Hoffman, developer of Energy Star efficiency program, dies at 62," The
Washington Post, 14 October 2012.
[22] R. Mendez, "The Building Information Model in Facilities Management," Worcester Polytechnic Institute,
Worcester, MA, 2006.
[23] N. Alborzfard, "Life Cycle Cost Analysis Framework fo Green Features in Buildings," Worcester
Polytechnic Institute, Worcester, MA, 2011.
[24] Office of Management and Budget, "Standards and Guidelines for Statistical Surveys," Government
Printing Office, Washington, D.C., 2006.
[25] S. Doty, Commercial Energy Auditing Reference Handbok, Liburn, GA: Fairmont Press, 2008.
[26] Pew Research Center, "Assessing the Representativeness of Public Opinion Surveys," 15 May 2012.
[Online]. Available: http://www.people-press.org/2012/05/15/assessing-the-representativeness-of-
public-opinion-surveys/. [Accessed 25 February 2014].
[27] Lawrence Berkley National Laboratory, "Standby Power Summary Table," 2014. [Online]. Available:
http://standby.lbl.gov/summary-table.html. [Accessed 15 February 2014].
[28] Hess Energy Marketing, "Market Charts and Prices," 25 January 2014. [Online]. Available:
https://www.hessenergy.com/analysisresources/marketanalysis.aspx. [Accessed 25 January 2014].

54
Appendices

55
Appendix A: East Hall LEED Scorecard

56
Appendix B: WPI Buildings Supplied by Power House
B.1: Electricity

57
B.2: Steam
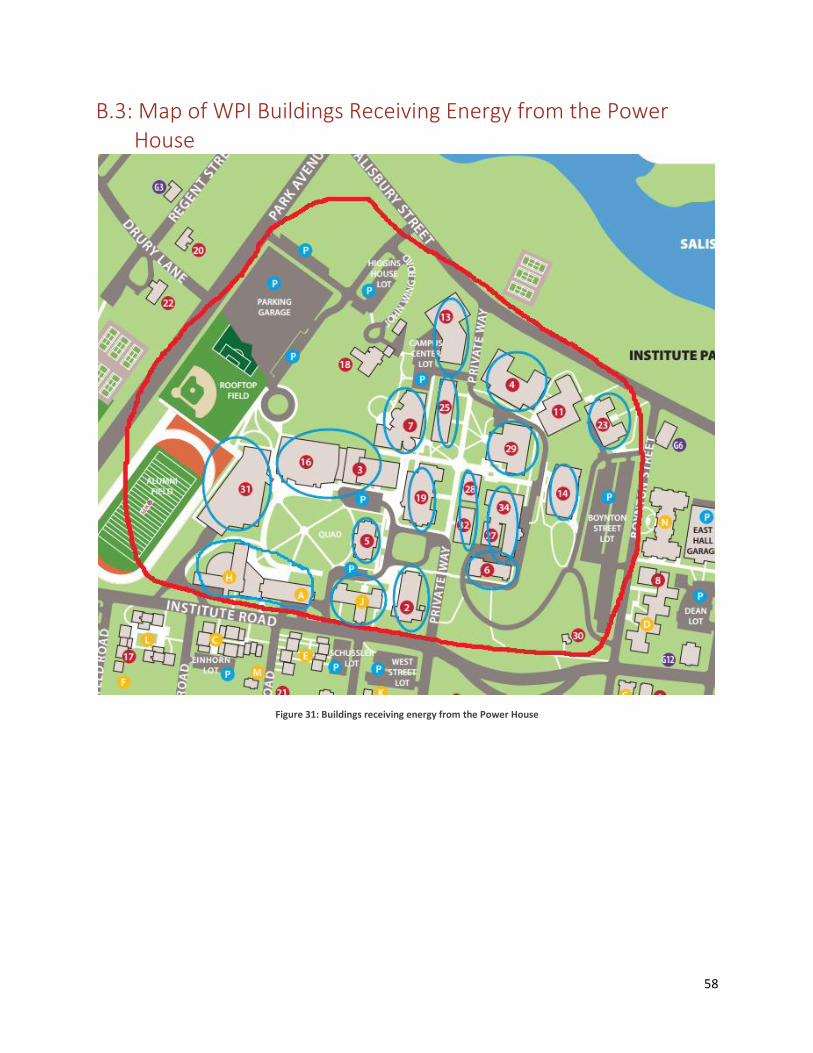
58
B.3: Map of WPI Buildings Receiving Energy from the Power House
Figure 31: Buildings receiving energy from the Power House

59
Appendix C: Meter Tracking Sheets
C.1: Founders Main Gas
Founders Main Gas Temperature
Date Meter
Number (f3) Time High(°F) Low(°F)
Δ Meter (f3)
Dec. 2,2013 775420 7:59AM 38 31
Dec. 3,2013 775611 7:58AM 46 29 191
Dec. 4,2013 775800 8:01AM 42 28 189
Dec. 5,2013 775973 7:57AM 53 34 173
Dec. 6,2013 776135 7:49AM 53 32 162
Dec. 7,2013 776319 10:32AM 34 23 184
Dec. 8,2013 776503 8:53AM 26 17 184
Dec. 9,2013 776727 8:29AM 33 21 224
Dec. 10,2013 776944 7:50AM 32 19 217
Dec. 11,2013 777174 7:53AM 25 16 230
Dec. 12,2013 777427 7:55AM 20 10 253
Dec. 13,2013 777795 7:56AM 24 11 368
Dec. 14,2013 778012 12:20PM 16 8 217
Dec. 15,2013 778315 1:48PM 25 14 303
Dec. 16,2013 778518 8:59AM 22 11 203
Dec. 17,2013 778768 8:00AM 18 5 250
Dec. 18,2013 779056 8:03AM 28 15 288
Dec. 19,2013 779311 8:43AM 37 14 255
Dec. 20,2013 779524 6:59AM 46 38 213
Jan. 16, 2014 784096 10:46AM 37 32 4572
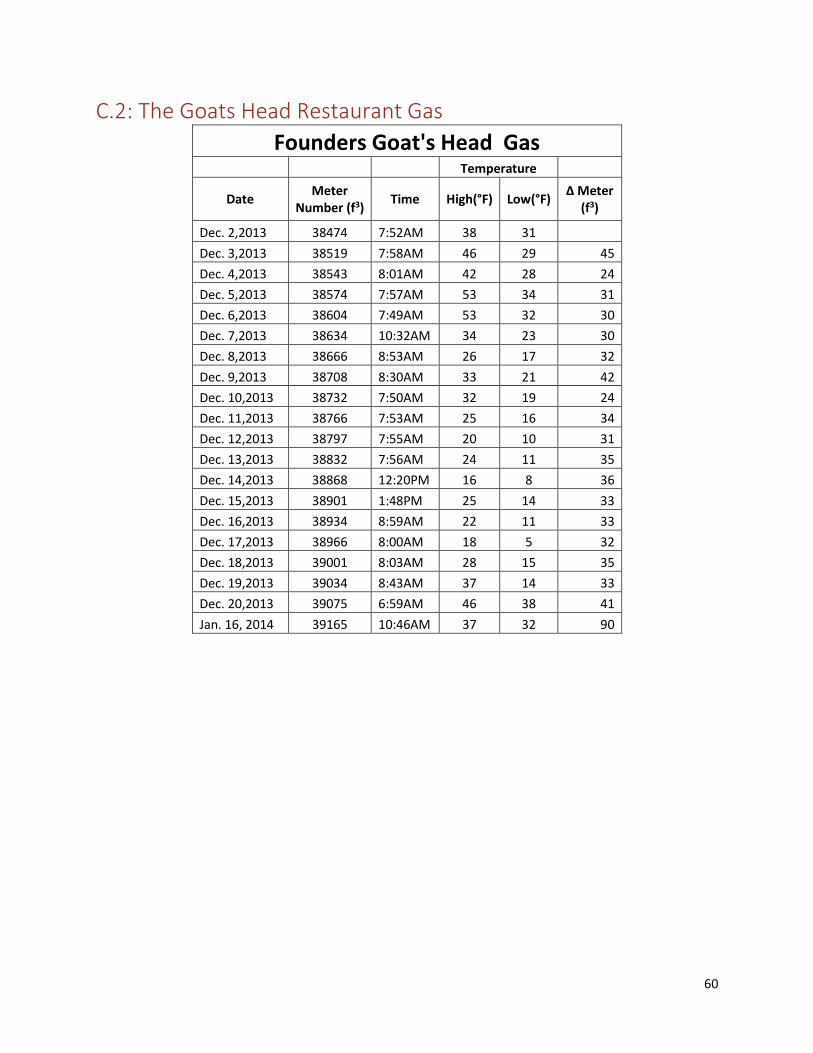
60
C.2: The Goats Head Restaurant Gas
Founders Goat's Head Gas Temperature
Date Meter
Number (f3) Time High(°F) Low(°F)
Δ Meter (f3)
Dec. 2,2013 38474 7:52AM 38 31
Dec. 3,2013 38519 7:58AM 46 29 45
Dec. 4,2013 38543 8:01AM 42 28 24
Dec. 5,2013 38574 7:57AM 53 34 31
Dec. 6,2013 38604 7:49AM 53 32 30
Dec. 7,2013 38634 10:32AM 34 23 30
Dec. 8,2013 38666 8:53AM 26 17 32
Dec. 9,2013 38708 8:30AM 33 21 42
Dec. 10,2013 38732 7:50AM 32 19 24
Dec. 11,2013 38766 7:53AM 25 16 34
Dec. 12,2013 38797 7:55AM 20 10 31
Dec. 13,2013 38832 7:56AM 24 11 35
Dec. 14,2013 38868 12:20PM 16 8 36
Dec. 15,2013 38901 1:48PM 25 14 33
Dec. 16,2013 38934 8:59AM 22 11 33
Dec. 17,2013 38966 8:00AM 18 5 32
Dec. 18,2013 39001 8:03AM 28 15 35
Dec. 19,2013 39034 8:43AM 37 14 33
Dec. 20,2013 39075 6:59AM 46 38 41
Jan. 16, 2014 39165 10:46AM 37 32 90

61
C.3: Founders Electric
Founders Hall Electric
Meter
Number
Max kVA/kW
Delivered
Total kWh Delivered
Max kW/kVA
Delivered
Register Constant
CMT ID (Program
ID)
Δ Meter (kWh)
Date Time *005 *003 *004 *010 *030 *050
Dec. 2,2013 7:26AM 800149 001.08 31421 001.05 001.800 00045
Dec. 3,2013 7:37AM 800149 001.08 31436 001.05 001.800 00045 15
Dec. 4,2013 7:26AM 800149 001.08 31451 001.05 001.800 00045 15
Dec. 5,2013 7:22AM 800149 001.08 31467 001.05 001.800 00045 16
Dec. 6,2013 7:23AM 800149 001.08 31482 001.05 001.800 00045 15
Dec. 7,2013 10:40AM 800149 001.08 31499 001.05 001.800 00045 17
Dec. 8,2013 10:25AM 800149 001.08 31514 001.05 001.800 00045 15
Dec. 9,2013 7:42AM 800149 001.08 31527 001.05 001.800 00045 13
Dec. 10,2013 7:25AM 800149 001.08 31542 001.05 001.800 00045 15
Dec. 11,2013 7:23AM 800149 001.08 31558 001.05 001.800 00045 16
Dec. 12,2013 7:23AM 800149 001.08 31573 001.05 001.800 00045 15
Dec. 13,2013 7:21AM 800149 001.08 31589 001.05 001.800 00045 16
Dec. 14,2013 12:30PM 800149 001.08 31607 001.05 001.800 00045 18
Dec. 15,2013 9:31AM 800149 001.08 31621 001.05 001.800 00045 14
Dec. 16,2013 7:26AM 800149 001.08 31635 001.05 001.800 00045 14
Dec. 17,2013 8:12AM 800149 001.00 31651 000.97 001.800 00045 16
Dec. 18,2013 7:32AM 800149 001.00 31667 000.97 001.800 00045 16
Dec. 19,2013 7:17AM 800149 001.00 31682 000.97 001.800 00045 15
Dec. 20,2013 7:58AM 800149 001.01 31697 000.99 001.800 00045 15
Jan. 16, 2013 7:24AM 800149 001.08 31937 001.06 001.800 00045

62
C.4: East Gas
East Hall Gas
Temperature
Date Meter
Number (f3)
Time High(°F) Low(°F) Δ Meter
(f3)
Dec. 2,2013 25092 7:59AM 38 31
Dec. 3,2013 25258 8:04AM 46 29 166
Dec. 4,2013 25400 8:06AM 42 28 142
Dec. 5,2013 25543 8:02AM 53 34 143
Dec. 6,2013 25652 8:52AM 53 32 109
Dec. 7,2013 25808 10:28AM 34 23 156
Dec. 8,2013 26016 8:49AM 26 17 208
Dec. 9,2013 26259 8:22AM 33 21 243
Dec. 10,2013 26462 8:08AM 32 19 203
Dec. 11,2013 26714 8:00AM 25 16 252
Dec. 12,2013 26882 8:02AM 20 10 168
Dec. 13,2013 27234 7:50AM 24 11 352
Dec. 14,2013 27597 12:13PM 16 8 363
Dec. 15,2013 27927 1:40PM 25 14 330
Dec. 16,2013 28127 9:17AM 22 11 200
Dec. 17,2013 28729 7:58AM 18 5 602
Dec. 18,2013 28936 9:00AM 28 15 207
Dec. 19,2013 28960 11:20AM 37 14 24
Dec. 20,2013 29081 7:03AM 46 38 121
Jan. 16, 2014 34665 10:41AM 37 32 5584

63
C.5: East Electric

Appendix D: East Hall First Floor Lighting Inventory
Location Light Type Quantity
Power
Rating
(W)
Total
Power (W) LUX Reading
Lobby/Foyer Compact Fluorescent Light 16 42 672
170-340
(470-600 Day time by the
windows)
Fluorescent Lamp (2ft) 16 17 272 170-340
Tech Suite 107 Fluorescent Lamp (2ft) 8 17 136
143-185(shades down lights on)
Shades Up lights off 124 - 560
(Daytime)
Elevator South Hall Compact Fluorescent Light 5 26 130 64-227
South Hall Compact Fluorescent Light 8 42 336 56-148
South Hall by Game Room Fluorescent Lamp (2ft) 8 17 136 80-230
Game room Fluorescent Lamp (2ft) 24 17 408 102-200
Tech Suite 113A Fluorescent Lamp (2ft) 8 17 136 100-192

65
East Hall First Floor Lighting Inventory (continued)
Location Light Type Quantity
Power
Rating
(W)
Total
Power (W) LUX Reading
Tech Suite 118 Fluorescent Lamp (2ft) 12 17 204 100-192
Gym Fluorescent Lamp (2ft) 20 17 340 125-440
Music room 120 Fluorescent Lamp (2ft) 12 17 204 163-312
Music room 121 Fluorescent Lamp (2ft) 6 17 102
60-180
(This has Occupancy sensor)
North Hall Compact Fluorescent Light 6 42 252 49-262
Elevator North Hall Compact Fluorescent Light 2 42 84 60-127
Mechanical Room Hallway Fluorescent Lamp (2ft) 14 17 238 73-343
Stairway 4 Hall (Northeast) Fluorescent Lamp (4ft) 24 54 1296 51-370
East 5th floor Hallway Fluorescent Lamp (4ft) 16 54 864 89-230
Fluorescent Lamp (2ft) 29 24 696 45-200
Compact Fluorescent Light 3 42 126 75-230
East 5th floor Tech Suite Fluorescent Lamp (2ft) 8 17 136 120-220
Stair way 2 (Southwest) Fluorescent Lamp (4ft) 20 54 1080 170-370
Main Entrance (between door
adjacent to Lobby) Compact Fluorescent Light 2 42
84 125-360
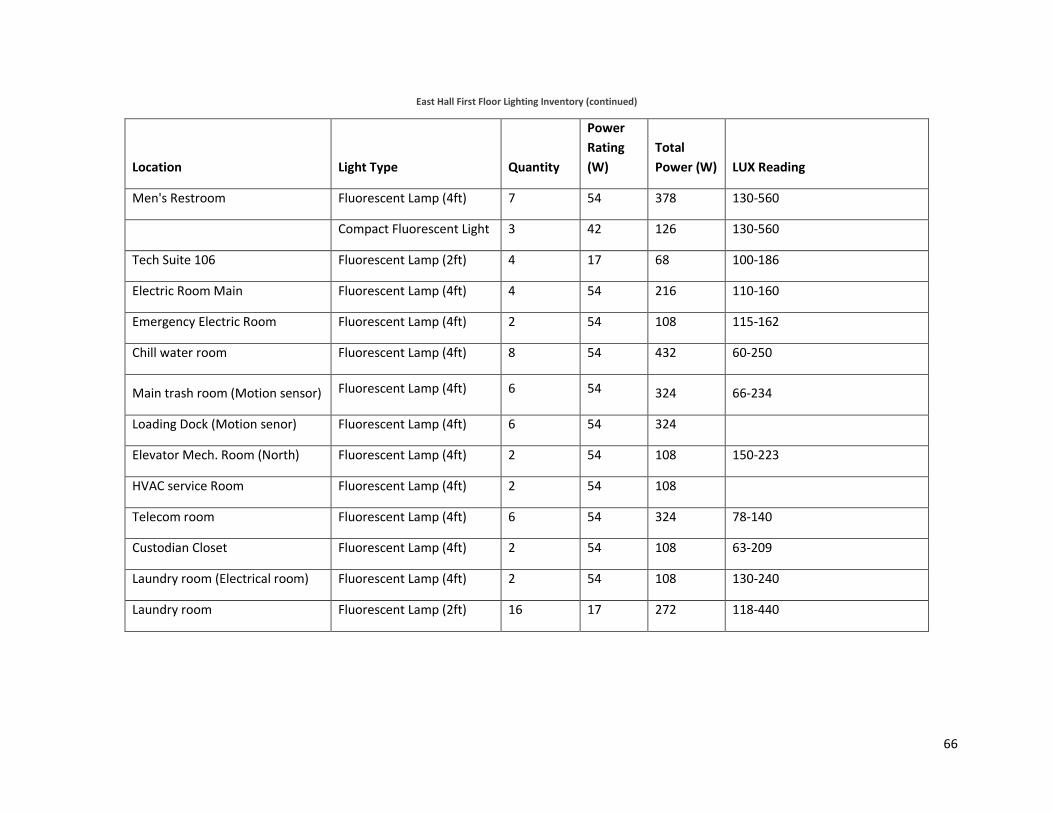
66
East Hall First Floor Lighting Inventory (continued)
Location Light Type Quantity
Power
Rating
(W)
Total
Power (W) LUX Reading
Men's Restroom Fluorescent Lamp (4ft) 7 54 378 130-560
Compact Fluorescent Light 3 42 126 130-560
Tech Suite 106 Fluorescent Lamp (2ft) 4 17 68 100-186
Electric Room Main Fluorescent Lamp (4ft) 4 54 216 110-160
Emergency Electric Room Fluorescent Lamp (4ft) 2 54 108 115-162
Chill water room Fluorescent Lamp (4ft) 8 54 432 60-250
Main trash room (Motion sensor) Fluorescent Lamp (4ft) 6 54 324 66-234
Loading Dock (Motion senor) Fluorescent Lamp (4ft) 6 54 324
Elevator Mech. Room (North) Fluorescent Lamp (4ft) 2 54 108 150-223
HVAC service Room Fluorescent Lamp (4ft) 2 54 108
Telecom room Fluorescent Lamp (4ft) 6 54 324 78-140
Custodian Closet Fluorescent Lamp (4ft) 2 54 108 63-209
Laundry room (Electrical room) Fluorescent Lamp (4ft) 2 54 108 130-240
Laundry room Fluorescent Lamp (2ft) 16 17 272 118-440

67
Appendix E: Founders Hall Basement Lighting Inventory Location Light Type Quantity LUX Reading
051 Mechanical Room T8 Fluorescent (4ft, 2 bulb) 7 130-430
Freight elevator machine room T8 Fluorescent (4ft, 2 bulb) 2 250-408
Basement hallway T8 Fluorescent (4ft, 2 bulb) 56-230
025 Custodian T8 Fluorescent (4ft, 2 bulb) 1
Main elevator machine room T8 Fluorescent (4ft, 2 bulb) 1 130-240
Police station hallway T8 Fluorescent (4ft, 2 bulb) 9 3-360
Basement network room T8 Fluorescent (4ft, 2 bulb) 4 230-400
Boiler room T8 Fluorescent (4ft, 2 bulb) 17 115-220
Electric room T8 Fluorescent (4ft, 2 bulb) 8 150-600
Generator room T8 Fluorescent (4ft, 2 bulb) 2
Generator entrance room T8 Fluorescent (4ft, 2 bulb) 1
Generator room closet T8 Fluorescent (4ft, 2 bulb) 2
Campus police fitness room T8 Fluorescent (4ft, 2 bulb) 2
Dispatch room U-tube fluorescent 118-290
Officer work room T8 Fluorescent (4ft, 2 bulb) 5 270-660 lux

68
Appendix F: East Hall Lighting Fixtures Fluorescent Lamps : F17T8/SP41/ECO—17W
http://www.grainger.com/product/GE-LIGHTING-Fluorescent-Linear-Lamp-6XT99
Compact Fluorescent mini-spiral—26W
o Light output 1700 lumens
o Energy Used 26 watts
o Life 10,000 hours
o Color Temp 4100K
Induction Lamp QL 85/830—85W

69
http://www.bulbspro.com/philips-ql85w-830-induction-lamp-3000k-warm-white.html
GE compact Fluorescent lamp non-integrated—26W

70
http://www.grainger.com/product/GE-LIGHTING-Plug-In-CFL-1PGY3
Incandescent Light bulb—40W
GE compact Fluorescent lamp (F42TBX/835/A/ECO)—42W
http://www.grainger.com/product/GE-LIGHTING-Plug-In-CFL-1PHA8
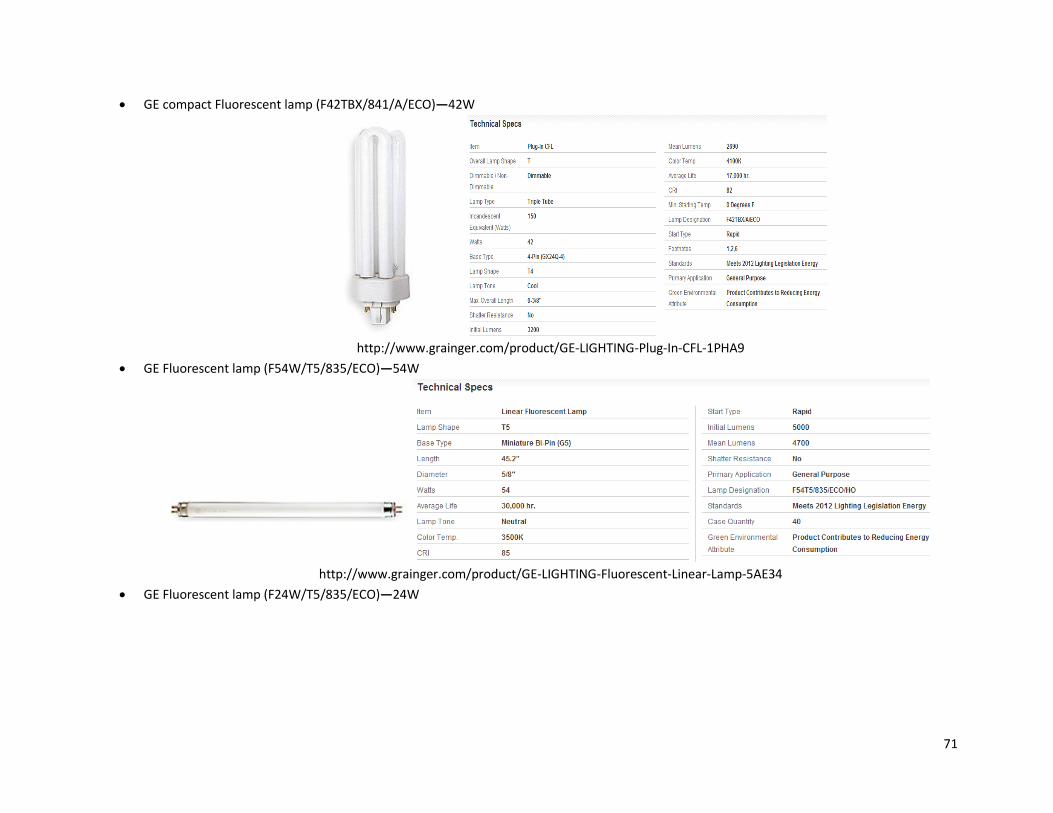
71
GE compact Fluorescent lamp (F42TBX/841/A/ECO)—42W
http://www.grainger.com/product/GE-LIGHTING-Plug-In-CFL-1PHA9
GE Fluorescent lamp (F54W/T5/835/ECO)—54W
http://www.grainger.com/product/GE-LIGHTING-Fluorescent-Linear-Lamp-5AE34
GE Fluorescent lamp (F24W/T5/835/ECO)—24W

72
http://www.grainger.com/product/GE-LIGHTING-Fluorescent-Linear-Lamp-5AE25
GE compact Fluorescent lamp (F26TBX/841/A/ECO)—26W
http://www.grainger.com/product/1PHA1?gclid=CNX_5o_R3bwCFVFo7Aodmh8ABA&cm_mmc=PPC:GooglePLA-_-Lighting-_-Lamps-_-
1PHA1&ci_src=17588969&ci_sku=1PHA1&ef_id=Uwd4jwAABe3gdWRf:20140221162529:s
GE Fluorescent lamp (F26DBX/835/ECO4P)—26W

73
http://www.grainger.com/product/GE-LIGHTING-Plug-In-CFL-1PGY6
GE Fluorescent lamp (F8T5/CW)—8W
http://www.grainger.com/product/GE-LIGHTING-Fluorescent-Linear-Lamp-2V235

74
Appendix G: East Hall Survey Responses
East Hall Final Report
Last Modified: 01/13/2014
1. Which floor do you live on?
# Answer
Response %
1 East 2
9 39%
2 East 3
13 57%
3 East 4
1 4%
4 East 5
0 0%
Total 23 100%
2. At what temperature do you feel comfortable in the
winter?
# Answer Min Value Max Value Average
Value
Standard
Deviation Responses
1
Click to
write
Choice 1
65.00 75.00 70.44 3.22 18
3. How many people are there in your suite?
# Answer
Response %
1
Single
(Studio)
Apartment
1 4%
2 4
22 96%
Total 23 100%
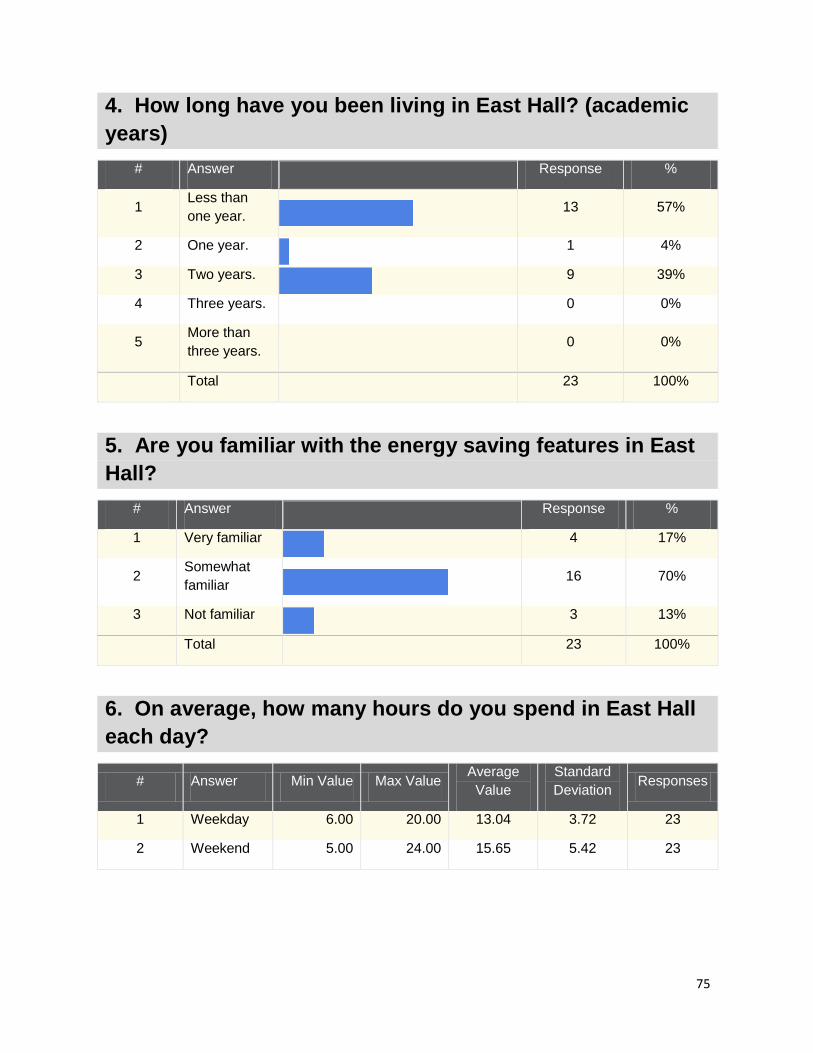
75
4. How long have you been living in East Hall? (academic
years)
# Answer
Response %
1 Less than
one year.
13 57%
2 One year.
1 4%
3 Two years.
9 39%
4 Three years.
0 0%
5 More than
three years.
0 0%
Total 23 100%
5. Are you familiar with the energy saving features in East
Hall?
# Answer
Response %
1 Very familiar
4 17%
2 Somewhat
familiar
16 70%
3 Not familiar
3 13%
Total 23 100%
6. On average, how many hours do you spend in East Hall
each day?
# Answer Min Value Max Value Average
Value
Standard
Deviation Responses
1 Weekday 6.00 20.00 13.04 3.72 23
2 Weekend 5.00 24.00 15.65 5.42 23

76
7. How would you define the role of the dorm? (check all
apply)
# Answer
Response %
1 Rest/Sleeping
23 100%
2 Studying
19 83%
3 Entertainment
17 74%
4
Dining
(including
cooking)
17 74%
5 Other (please
specify)
3 13%
Other (please specify)
Homework
Methalab
socializing
8. Overall, do you consider yourself to be an efficient user
of energy?
# Answer
Response %
1 Yes
2 9%
2 Somewhat
17 74%
3 No
4 17%
Total 23 100%

77
9. Overall, do you consider East Hall to be energy
efficient?
# Answer
Response %
1 Yes
16 70%
2 No
1 4%
3 Not sure
6 26%
Total 23 100%
10. Overall, do you consider East Hall to be a comfortable
place to live?
# Answer
Response %
1 Yes
17 74%
2 No
2 9%
3 Somewhat
4 17%
Total 23 100%
11. Considering the AC in room, how do you feel during
summer?
# Answer
Response %
1 Very cold
1 4%
2 Somewhat
cold
3 13%
3 Comfortable
11 48%
4 Somewhat hot
8 35%
5 Very hot
0 0%
Total 23 100%

78
12. Please comment on your satisfaction/dissatisfaction
with the heating/cooling system. Do you have enough
control? are there ways you feel it could be improved?
Text Response
I swear the AC wasn't adjusting during the summer. I tried to reduce the AC because I was getting
cold (that, and it's inefficient), but no dice.
you should be able to turn off the blower. the singles don't have sensors on the windows so the
fan ALWAYS blows and despite the temperature it's set to its always cold because of the draft
The controls of the system don't make sense since the thermostat is the only controler and
doesn't work well.
I really wish there were windows in the kitchen/living room
I've had difficulty controlling the thermostat - it seems like it doesn't actually do anything, and
opening/closing the windows didn't have any effect on the AC
I would like to be able to turn off the A/C. One morning the sun was shining on the thermostat so
the A/C was blasting and we were cold. We had to open a window to the colder outside air to get
the A/C to turn off. Also, when we're all home and in our rooms working for several hours the
heat will turn off because and we sometimes get cold.
Such hot, much cold, so AC, WOW
should be cooler in summer. Should be able to adjust fan speeds desired
Control is a placebo, it could be improved by extending the range and having something other
than dummy units on the walls.
We do not have enough control of the heat/AC. The rooms take too long to become comfortable
because they either take too long to heat up or cool down. In the case of the AC, it also does not
get cool enough to be comfortable.
The suite hearts unevenly. My room terms to be chilly while the double is pretty warm.
there is no heat, the air coming out of the vents are cold. The thermostat read 64 degrees this
morning.
Statistic Value
Total Responses 12
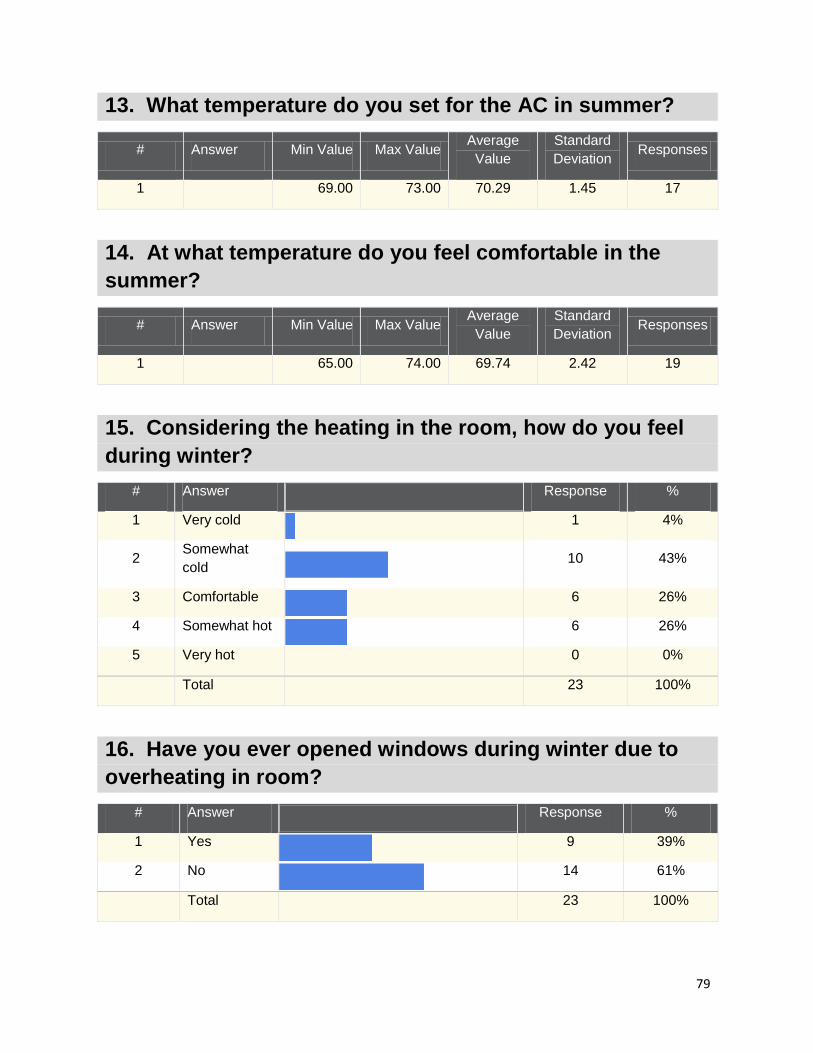
79
13. What temperature do you set for the AC in summer?
# Answer Min Value Max Value Average
Value
Standard
Deviation Responses
1 69.00 73.00 70.29 1.45 17
14. At what temperature do you feel comfortable in the
summer?
# Answer Min Value Max Value Average
Value
Standard
Deviation Responses
1 65.00 74.00 69.74 2.42 19
15. Considering the heating in the room, how do you feel
during winter?
# Answer
Response %
1 Very cold
1 4%
2 Somewhat
cold
10 43%
3 Comfortable
6 26%
4 Somewhat hot
6 26%
5 Very hot
0 0%
Total 23 100%
16. Have you ever opened windows during winter due to
overheating in room?
# Answer
Response %
1 Yes
9 39%
2 No
14 61%
Total 23 100%

80
17. How often do you have to open the windows due to
overheating?
# Answer
Response %
1 less than
once a week
5 63%
2 2-3 times a
week
1 13%
3 4-5 times a
week
0 0%
4 always
2 25%
Total 8 100%
18. How long do you usually leave the windows open?
# Answer
Response %
1 less than 5
minutes
0 0%
2 less than 1
hour
2 25%
3 1-3 hours
2 25%
4 half a day
2 25%
5 always
2 25%
Total 8 100%

81
19. How long does it usually take for the room to heat up to
your desired temperature?
# Answer
Response %
1 Less than 10
minutes
3 15%
2 10-30
minutes
2 10%
3 More than 30
minutes
4 20%
4 Unsure
11 55%
Total 20 100%
20. What temperature do you set for the heat in the
winter?
# Answer Min Value Max Value Average
Value
Standard
Deviation Responses
1
Click to
write
Choice 1
69.00 73.00 71.31 1.62 16
21. Do you cook in East Hall?
# Answer
Response %
1 Yes
17 85%
2 No
3 15%
Total 20 100%

82
22. Do you have sufficient lighting in your suite?
# Answer
Response %
1 Yes
15 75%
2 No
5 25%
Total 20 100%
23. Could you specify locations that are well-lit and others
that are not well-lit?
Text Response
Kitchen needs more light at night. Everywhere else is fine.
Kitchen
kitchen is not lit well
My methlab is not well lit. Can't see all the different drugs I mix. Some times i make mistakes.
Customers don't like that...
sometimes use desk light.
My room is well lit, the closests and main room are not.
Bathroom is well lit. Bedroom is borderline. Kitchen could definitely use more lights for at night.
My room often feels dark.
well lit: living room, sinks. poor lighting: kitchen, room
Statistic Value
Total Responses 9

83
24. Do you feel the need to use additional lighting
anywhere in your suite?
# Answer
Response %
1 Yes
7 35%
2 No
13 65%
Total 20 100%
25. Do you usually tend to leave the following devices on
when they are not being used?
# Question Yes No Total
Responses Mean
1 TV 3 17 20 1.85
2 Laptop
Computer 10 10 20 1.50
3 Desktop
Computer 5 13 18 1.72
4 Game
console 0 17 17 2.00
5 Lights 5 15 20 1.75
26. When your windows are closed, do you feel a draft?
# Answer
Response %
1 Always
1 5%
2 Many times
2 10%
3 Sometimes
2 10%
4 Rarely
8 38%
5 Never
7 33%
6 Unsure
1 5%
Total 21 100%

84
27. How full is your fridge?
# Answer
Response %
1 Full
5 25%
2 Medium
14 70%
3 Empty
1 5%
Total 20 100%
28. Overall, do you have any comments or suggestions on
lighting?
Text Response
I don't know the types of bulbs being used, but if they aren't fluorescent or better, they should be.
Maybe a standing light for the common room would b nice
Many of the rooms are lit by one or two lights, so if just one light goes out makes a big difference.
(It's happened once this year). It might be nice if we could go down to res services to get a
replacement lightbulb or something so we don't have to wait for a work order to go through.
Much light. Such color. So visible. WOW
brighter lights.
location, my head creates a constant shadow on my desk when working. there is also no lighting
by the door or by the counter
Statistic Value
Total Responses 6
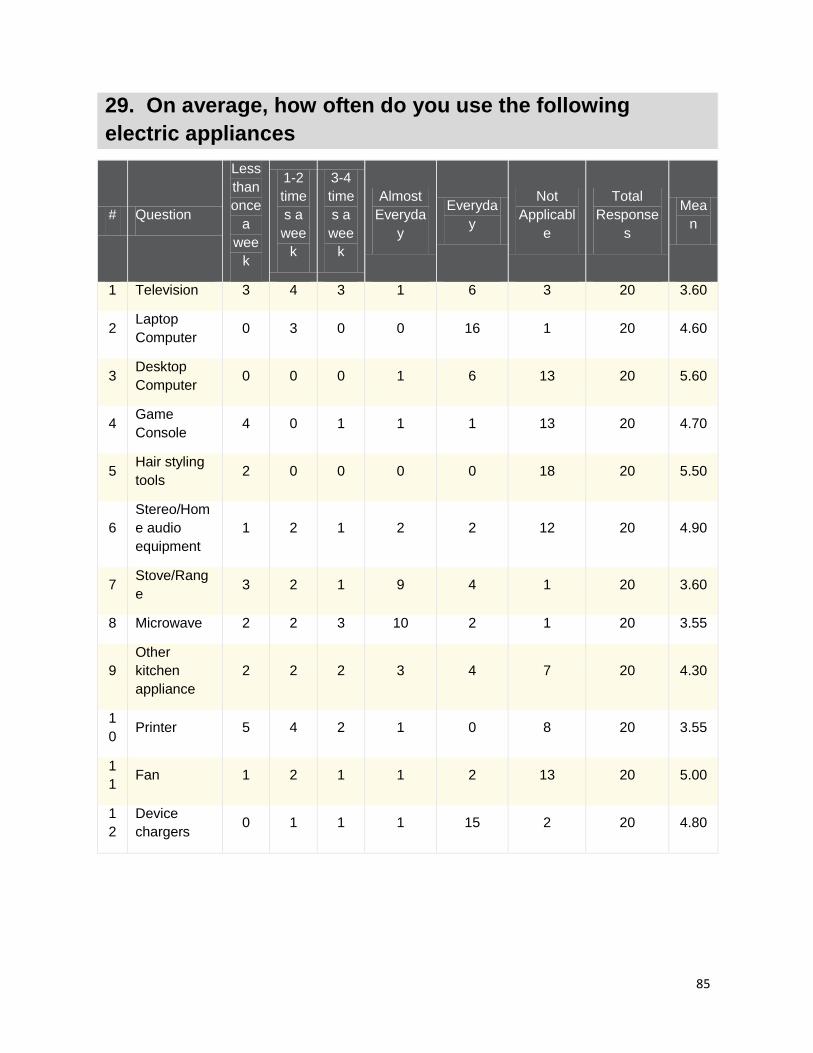
85
29. On average, how often do you use the following
electric appliances
# Question
Less
than
once
a
wee
k
1-2
time
s a
wee
k
3-4
time
s a
wee
k
Almost
Everyda
y
Everyda
y
Not
Applicabl
e
Total
Response
s
Mea
n
1 Television 3 4 3 1 6 3 20 3.60
2 Laptop
Computer 0 3 0 0 16 1 20 4.60
3 Desktop
Computer 0 0 0 1 6 13 20 5.60
4 Game
Console 4 0 1 1 1 13 20 4.70
5 Hair styling
tools 2 0 0 0 0 18 20 5.50
6
Stereo/Hom
e audio
equipment
1 2 1 2 2 12 20 4.90
7 Stove/Rang
e 3 2 1 9 4 1 20 3.60
8 Microwave 2 2 3 10 2 1 20 3.55
9
Other
kitchen
appliance
2 2 2 3 4 7 20 4.30
1
0 Printer 5 4 2 1 0 8 20 3.55
1
1 Fan 1 2 1 1 2 13 20 5.00
1
2
Device
chargers 0 1 1 1 15 2 20 4.80

86
30. How often do you open the fridge door?
# Answer
Response %
1 Never
0 0%
2 1-2 Times a
day
4 20%
3 3-5 Times a
day
6 30%
4 6-10 Times a
day
8 40%
5 More than 10
times a day
2 10%
Total 20 100%
31. How often do you cook?
# Answer
Response %
1
Less than
Once a
Month
2 11%
2 Once a
Month
1 5%
3 2-3 Times a
Month
1 5%
4 Once a
Week
1 5%
5 2-3 Times a
Week
3 16%
6 Daily
3 16%
7 Multiple
times per day
8 42%
Total 19 100%

87
32. What do you usually prefer to use to cook, microwave
or stove?
# Answer
Response %
1 Microwave
2 11%
2 Stove/Range
4 21%
3 Both
12 63%
4 Other (Please
specify)
1 5%
Total 19 100%
Other (Please specify)
Toaster oven (but not by much)
33. Do you consider it necessary that everyone should
save energy?
# Answer
Response %
1 Yes
12 60%
2 No
2 10%
3 I don't care
6 30%
Total 20 100%

88
34. Among the following electric appliances, which ones
do you have in your suite?
# Answer
Response %
1 Television
17 85%
2 Laptop
Computer
19 95%
3 Desktop
Computer
7 35%
4 Game Console
7 35%
5 Hair styling
tools
2 10%
6
Stereo/Home
audio
equipment
9 45%
7 Microwave
20 100%
8
Other Kitchen
Appliance (not
provided by
WPI)
12 60%
9 Printer
11 55%
10 Fan
6 30%
11 Device
chargers
20 100%

89
35. On average, how much electric energy in kWh do you
think you use every day?
Text Response
I don't have the foggiest idea
15
No idea at all
No idea. Average probably
I don't know.
idk, depends on how much Meth is made. Some days i'll use a lot some days not so much.
Unknown
A lot
Statistic Value
Total Responses 8

90
36. Which electronics are plugged in at all times,
regardless of being in use or not
# Answer
Response %
1 TV
16 80%
2 laptop
11 55%
3 desktop
7 35%
4 gaming
system
4 20%
5 extra lights
7 35%
6 stereo system
6 30%
7 kitchen
appliances
14 70%
8 printer
7 35%
9 personal mini
fridge
5 25%
10 fan
6 30%
11 Device
charger
16 80%
37. Do you have any suggestions that may be helpful in
improving this survey?
Text Response
as someone who completed iqp already, this survey is way too long and for those who start it
many will stop halfway throughout
Much time, Such waste, So long, WOW
Include water usage questions, if that is applicable to the IQP
ask why i choose not to conserve any enegy in east when i fully support saving enegy, and the
reason is i feel like im getting gyped. i pay so much for zero heat
Statistic Value
Total Responses 4
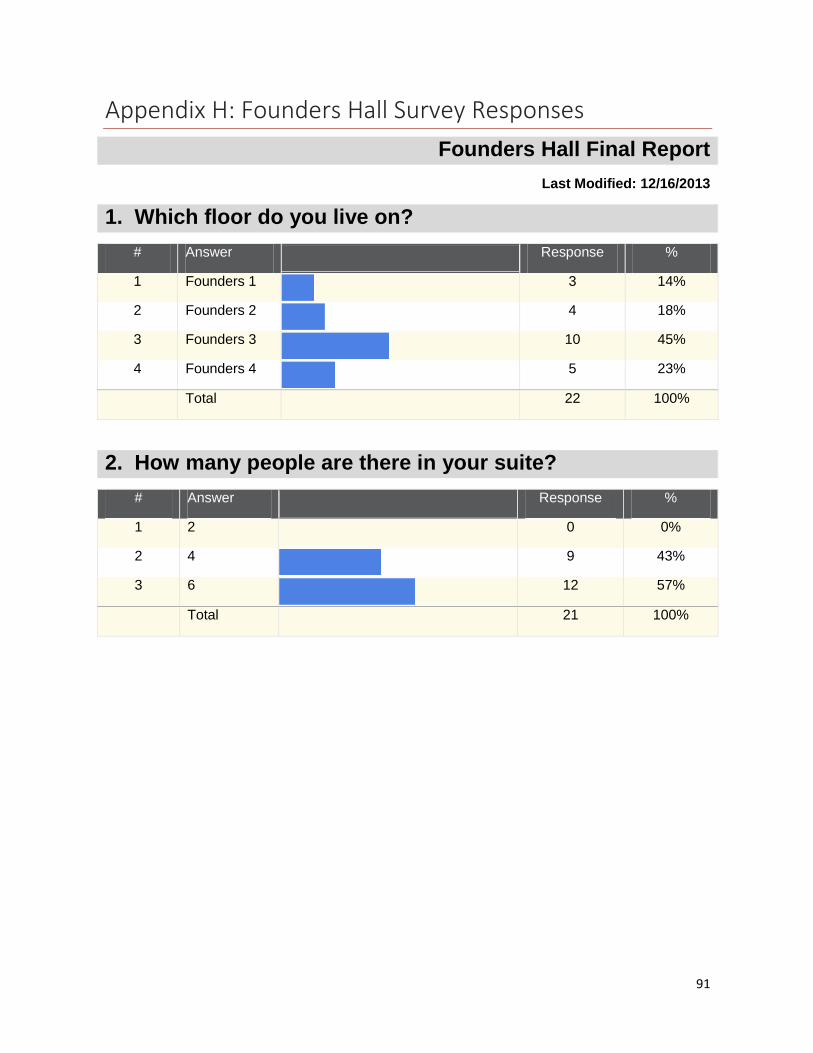
91
Appendix H: Founders Hall Survey Responses
Founders Hall Final Report
Last Modified: 12/16/2013
1. Which floor do you live on?
# Answer
Response %
1 Founders 1
3 14%
2 Founders 2
4 18%
3 Founders 3
10 45%
4 Founders 4
5 23%
Total 22 100%
2. How many people are there in your suite?
# Answer
Response %
1 2
0 0%
2 4
9 43%
3 6
12 57%
Total 21 100%

92
3. How long have you been living in Founders Hall?
(academic years)
# Answer
Response %
1 Less than
one year.
20 91%
2 One year.
2 9%
3 Two years.
0 0%
4 Three years.
0 0%
5 More than
three years.
0 0%
Total 22 100%
4. Overall, do you consider yourself to be an efficient user
of energy?
# Answer
Response %
1 Yes
5 23%
2 No
6 27%
3 Somewhat
11 50%
Total 22 100%
5. On average, how many hours do you spend in Founders
Hall each day?
# Answer Min Value Max Value Average
Value
Standard
Deviation Responses
1 Weekday 3.00 18.00 13.33 3.88 21
2 Weekend 8.00 24.00 15.86 4.96 21
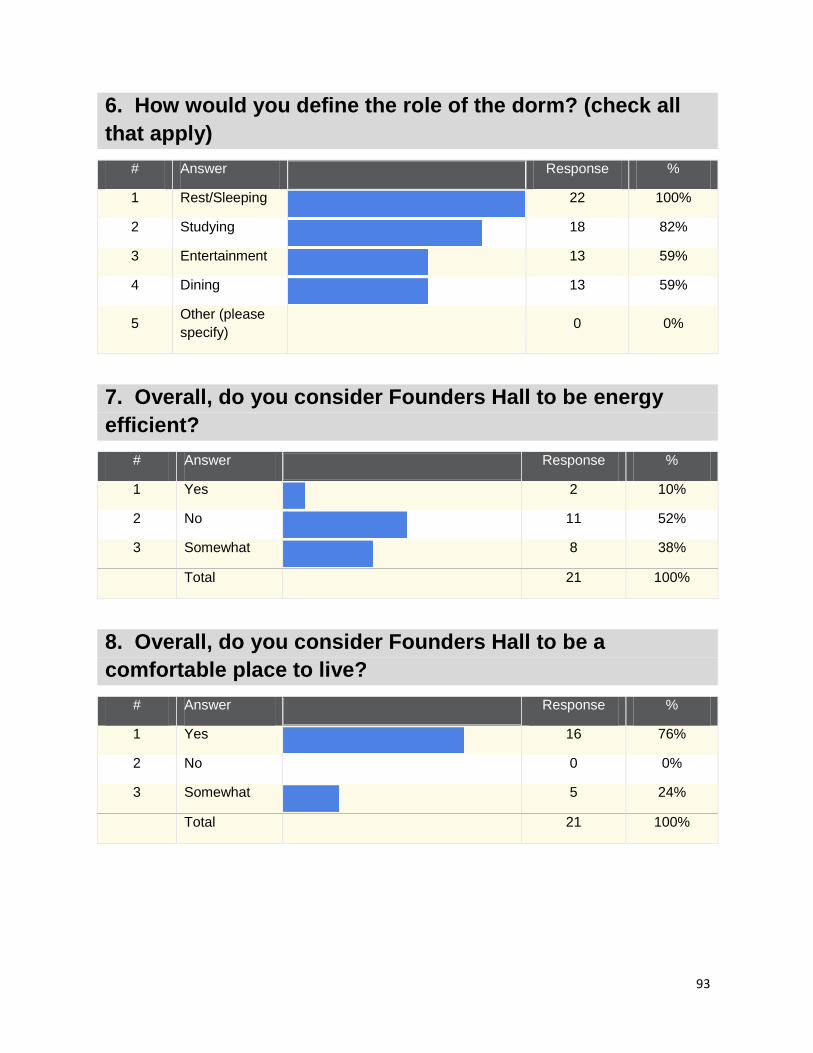
93
6. How would you define the role of the dorm? (check all
that apply)
# Answer
Response %
1 Rest/Sleeping
22 100%
2 Studying
18 82%
3 Entertainment
13 59%
4 Dining
13 59%
5 Other (please
specify)
0 0%
7. Overall, do you consider Founders Hall to be energy
efficient?
# Answer
Response %
1 Yes
2 10%
2 No
11 52%
3 Somewhat
8 38%
Total 21 100%
8. Overall, do you consider Founders Hall to be a
comfortable place to live?
# Answer
Response %
1 Yes
16 76%
2 No
0 0%
3 Somewhat
5 24%
Total 21 100%

94
9. Considering the heating in the room, how do you feel
during winter?
# Answer
Response %
1 Very cold
1 5%
2 Somewhat
cold
3 14%
3 Comfortable
11 52%
4 Somewhat hot
6 29%
5 Very hot
0 0%
Total 21 100%
10. Have you ever opened the windows during the winter
due to overheating in your room?
# Answer
Response %
1 Yes
10 48%
2 No
11 52%
Total 21 100%
11. How often do you have to open the windows due to
overheating?
# Answer
Response %
1 Less than
once a week
6 67%
2 2-3 times a
week
1 11%
3 4-5 times a
week
1 11%
4 Everyday
1 11%
Total 9 100%
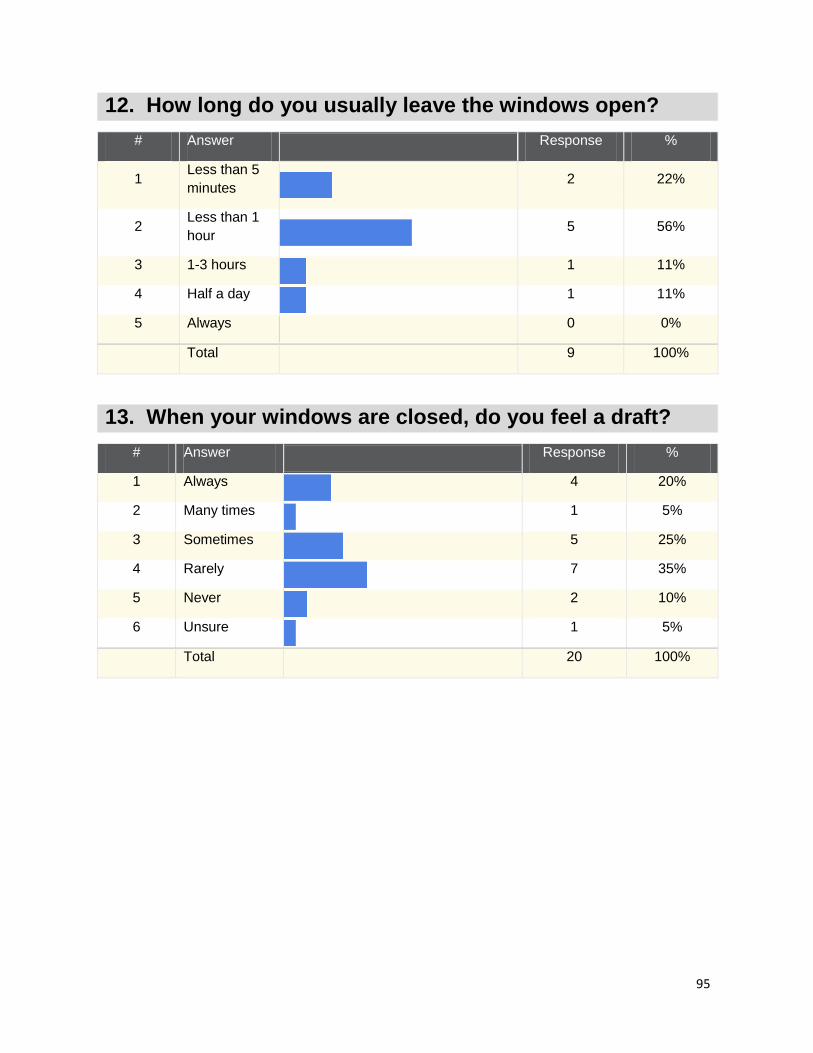
95
12. How long do you usually leave the windows open?
# Answer
Response %
1 Less than 5
minutes
2 22%
2 Less than 1
hour
5 56%
3 1-3 hours
1 11%
4 Half a day
1 11%
5 Always
0 0%
Total 9 100%
13. When your windows are closed, do you feel a draft?
# Answer
Response %
1 Always
4 20%
2 Many times
1 5%
3 Sometimes
5 25%
4 Rarely
7 35%
5 Never
2 10%
6 Unsure
1 5%
Total 20 100%

96
14. How long does it usually take for the room to heat up to
your desired temperature?
# Answer
Response %
1 Less than 10
minutes
5 25%
2 10-30
minutes
6 30%
3 More than 30
minutes
4 20%
4 Unsure
5 25%
Total 20 100%
15. What temperature do you set for the heat in the winter?
# Answer Min Value Max Value Average
Value
Standard
Deviation Responses
1 Degrees 60.00 80.00 71.05 6.51 19
16. At what temperature do you feel comfortable in the
winter?
# Answer Min Value Max Value Average
Value
Standard
Deviation Responses
1 Degrees 65.00 80.00 70.05 3.49 20

97
17. Please comment on your satisfaction/dissatisfaction
with the heating system. Do you have enough control? Are
there ways you feel it could be improved?
Text Response
The heating system is kind of overboard; I can make it uncomfortably warm to the point of
sweating in my room.
The larger problem is my roommates changing the heat to either too hot or too cold.
The thermostat will often read a higher temperature than it actually is. If we set it to 70 it will turn
off around 65 because it reads 70. Also because of the draft in the personal rooms, the rooms will
be colder than the common room where the thermostat is.
thermostat is for the whole suite and while the hallway might be warm our rooms are still cold.
Windows leak a lot; shades are always closed to conserve heat, but now don't let in any light;
room is almost always too cold; heater is under bed, need fan to push heat out from under bed;
disputes with roommates because doubles are always cold while singles are too hot
I wish we could control the bedrooms separately.
My room is a sauna once the heat is turned on
Wish each room within a suite could control their own room, as opposed to one thermostat in the
common area
I am satisfied with the heating system.
I think it works great, just wish there was more control for individual rooms
We have ours on the lowest setting in my suite and we still walk in and like immediately start
sweating
I didn't realize we had control. Our triple doesn't appear to have a thermostat, but overall I am
never cold in my room. Common rooms for the floor are different. The heaters in there never
seem to work correctly. It is either too hot or too cold in there.
Statistic Value
Total Responses 12
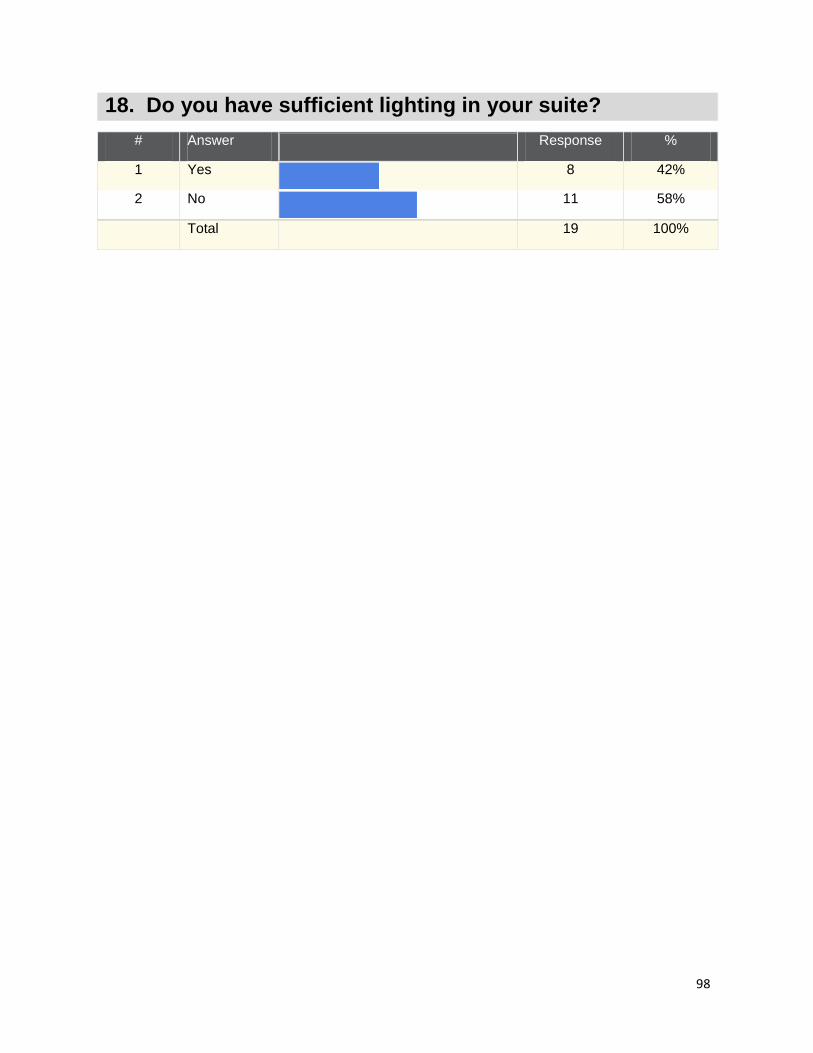
98
18. Do you have sufficient lighting in your suite?
# Answer
Response %
1 Yes
8 42%
2 No
11 58%
Total 19 100%

99
19. Could you specify locations that are well-lit and others
that are not well-lit?
Text Response
zxc
The doubles could be more well lit, had to bring in extra lamp
In the common room we need more light in the other side of the room.
everywhere but my room is well lit. my room is only lit on one side
closet area = well-lit, desk/work area = not so well-lit
The rooms only have one light that's too harsh, so I usually use a lamp instead.
closet is well-lit, bedroom in the double is not well-lit. the common room is omly well-lit now
becaude we brought in our own lamp.
Nothing is not well lit.
doubles are not well lit
the closet is well lit, bed not so much
Not well lit: area right in front of main door, end of hallway (can't see door handle/keyhole to room
at night because hallway light is too bright and kept off)
My light is located directly above the closet, and I do not have a built in desk-light.
the light is skewed to one side of the room, so the other side doesn't really get much
The common area is well lit but the bedrooms aren't
Room is only lit over closet
All the rooms are well-lit in founders.
not well lit neat the main door and on the opposite wall from the lights in the doubles
Everything is pretty well lit.
In a triple that is L-shaped, only the area by the door is well lit at all. The rest of the room,
especially the part around the corner from the door, is not well lit at all.
Statistic Value
Total Responses 19

100
20. Do you feel the need to use additional lighting
anywhere in your suite?
# Answer
Response %
1 Yes
15 75%
2 No
5 25%
Total 20 100%
21. Overall, do you have any comments or suggestions on
lighting?
Text Response
zx
Extra lighting in the doubles
more lamps
more lights
it is too dark.
Dimmers in bathroom and hallway would be great (or dimmers overall); have additional light right
above the main door in the living room; separate lightswitches for sink room and shower room;
lights above desk in double room are way too harsh, so we use a separate lamp instead
it would be great to move the light fixtures to the center of the room
The one light over the closet is no enough for my bedroom
we need two lamps for the common room
I only need additional lighting right next to my bed as I'm in a corner of the room.
Statistic Value
Total Responses 10
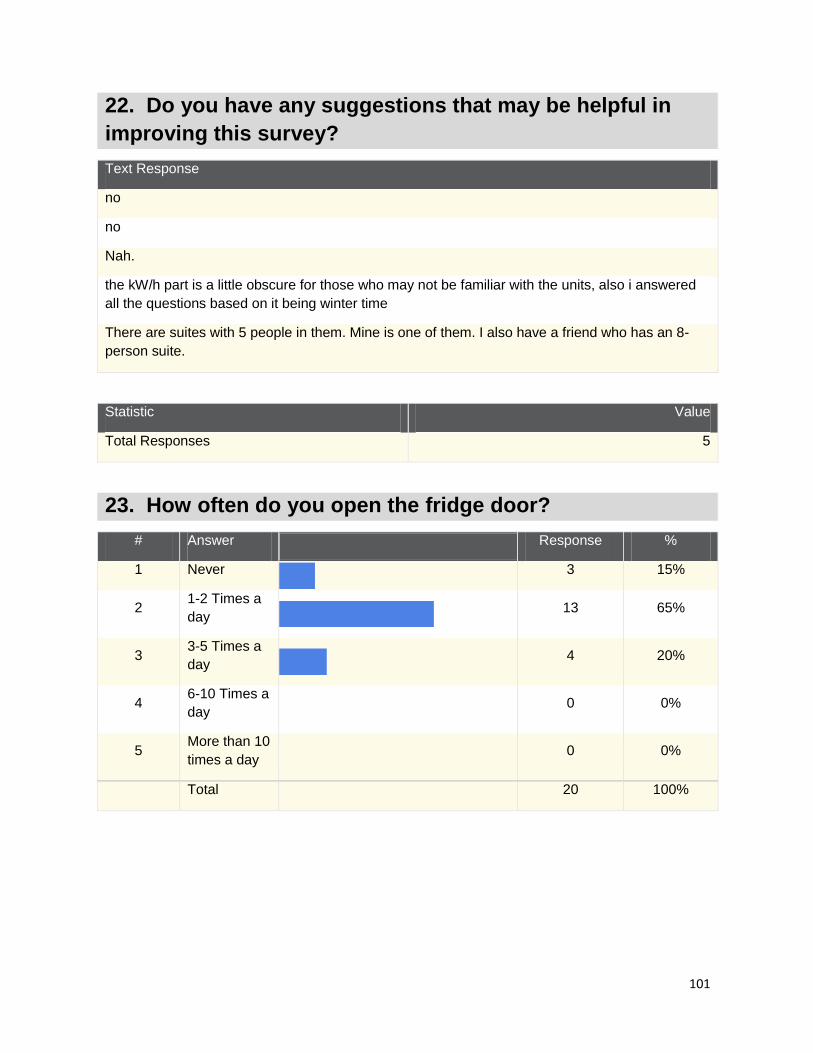
101
22. Do you have any suggestions that may be helpful in
improving this survey?
Text Response
no
no
Nah.
the kW/h part is a little obscure for those who may not be familiar with the units, also i answered
all the questions based on it being winter time
There are suites with 5 people in them. Mine is one of them. I also have a friend who has an 8-
person suite.
Statistic Value
Total Responses 5
23. How often do you open the fridge door?
# Answer
Response %
1 Never
3 15%
2 1-2 Times a
day
13 65%
3 3-5 Times a
day
4 20%
4 6-10 Times a
day
0 0%
5 More than 10
times a day
0 0%
Total 20 100%

102
24. How full is your fridge?
# Answer
Response %
1 Full
7 35%
2 Medium
13 65%
3 Empty
0 0%
Total 20 100%
25. Among the following electric appliances, which ones
do you own?
# Answer
Response %
1 Television
10 50%
2 Laptop
Computer
18 90%
3 Desktop
Computer
6 30%
4 Game Console
10 50%
5 Hair styling
tools
9 45%
6
Stereo/Home
audio
equipment
8 40%
7 Microwave
11 55%
8
Other Kitchen
Appliances (not
provided by
WPI)
4 20%
9 Printer
10 50%
10 Fan
13 65%
11 Device
chargers
19 95%

103
Other Kitchen Appliances (not provided by WPI)
Keurig
Electric tea kettle
Toaster oven
small fridge
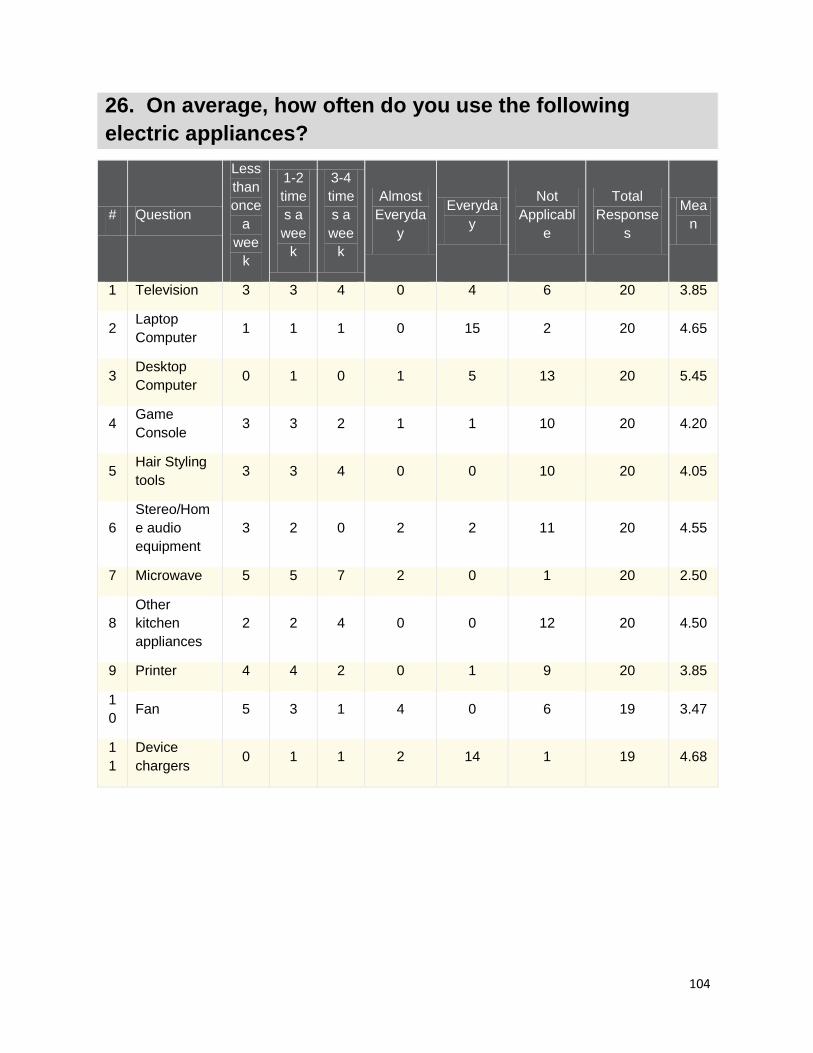
104
26. On average, how often do you use the following
electric appliances?
# Question
Less
than
once
a
wee
k
1-2
time
s a
wee
k
3-4
time
s a
wee
k
Almost
Everyda
y
Everyda
y
Not
Applicabl
e
Total
Response
s
Mea
n
1 Television 3 3 4 0 4 6 20 3.85
2 Laptop
Computer 1 1 1 0 15 2 20 4.65
3 Desktop
Computer 0 1 0 1 5 13 20 5.45
4 Game
Console 3 3 2 1 1 10 20 4.20
5 Hair Styling
tools 3 3 4 0 0 10 20 4.05
6
Stereo/Hom
e audio
equipment
3 2 0 2 2 11 20 4.55
7 Microwave 5 5 7 2 0 1 20 2.50
8
Other
kitchen
appliances
2 2 4 0 0 12 20 4.50
9 Printer 4 4 2 0 1 9 20 3.85
1
0 Fan 5 3 1 4 0 6 19 3.47
1
1
Device
chargers 0 1 1 2 14 1 19 4.68

105
27. Do you consider it necessary that everyone should
save energy?
# Answer
Response %
1 Yes
16 80%
2 No
2 10%
3 I don't care
2 10%
Total 20 100%
28. On average, how much energy in kWh do you think you
use everyday?
Text Response
xcx
no idea
6
I don't know how much a kWh is, but less than average for someone who lives in Founders.
I do not know.
No clue
unsure
No clue.
Not sure how to measure.
200
6
5
I have no idea
I have no idea. I don't really know how to gauge it without an actual readout of the energy each
thing uses.
Statistic Value
Total Responses 14

106
29. Do you usually tend to leave the following devices on
when they are not being used?
# Question Yes No Total
Responses Mean
1 TV 2 17 19 1.89
2 Laptop
Computer 10 9 19 1.47
3 Desktop
Computer 3 17 20 1.85
4 Game
Console 0 19 19 2.00
5 Lights 5 15 20 1.75
30. Which of the following electronics are plugged in at all
times, regardless of being in use or not?
# Answer
Response %
1 TV
9 45%
2 Laptop
Computer
12 60%
3 Desktop
Computer
7 35%
4 Game
Console
6 30%
5 Extra Light
15 75%
6 Stereo System
7 35%
7 Kitchen
Appliances
9 45%
8 Printer
9 45%
9 Personal Mini
Fridge
3 15%
10 Fan
9 45%

107
Appendix I: Floor Plans
I.1: Founders Hall Floor Plan

108
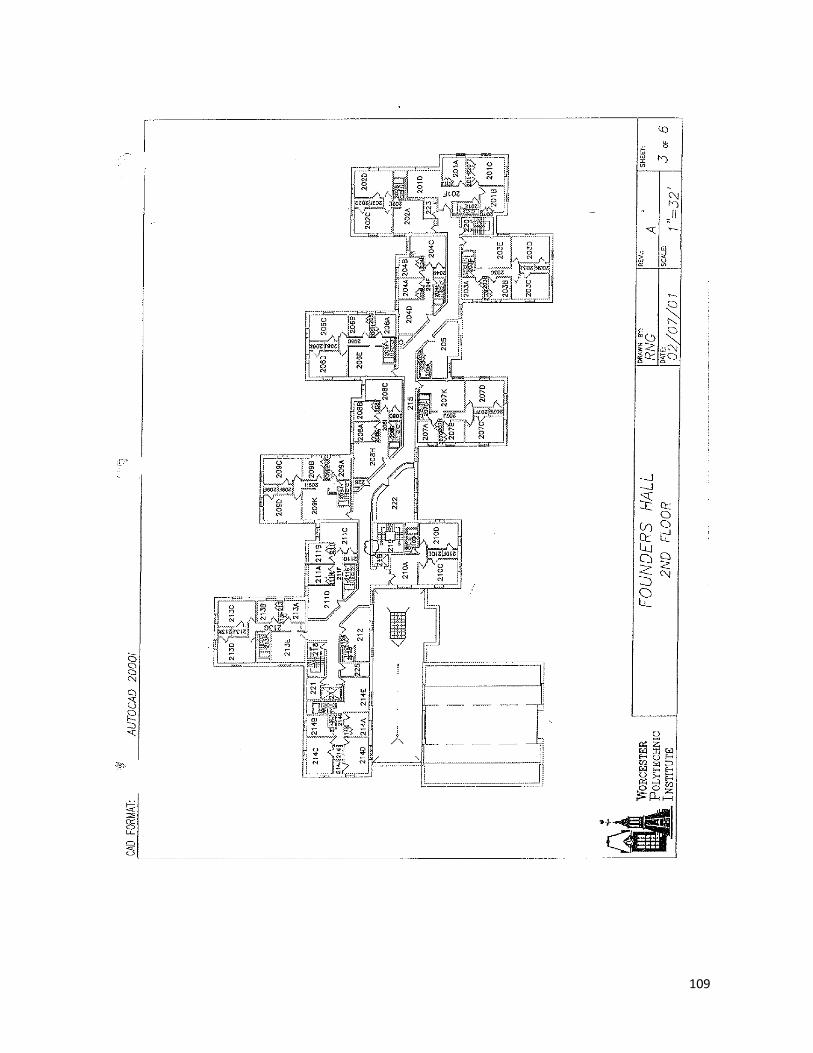
109

110

111
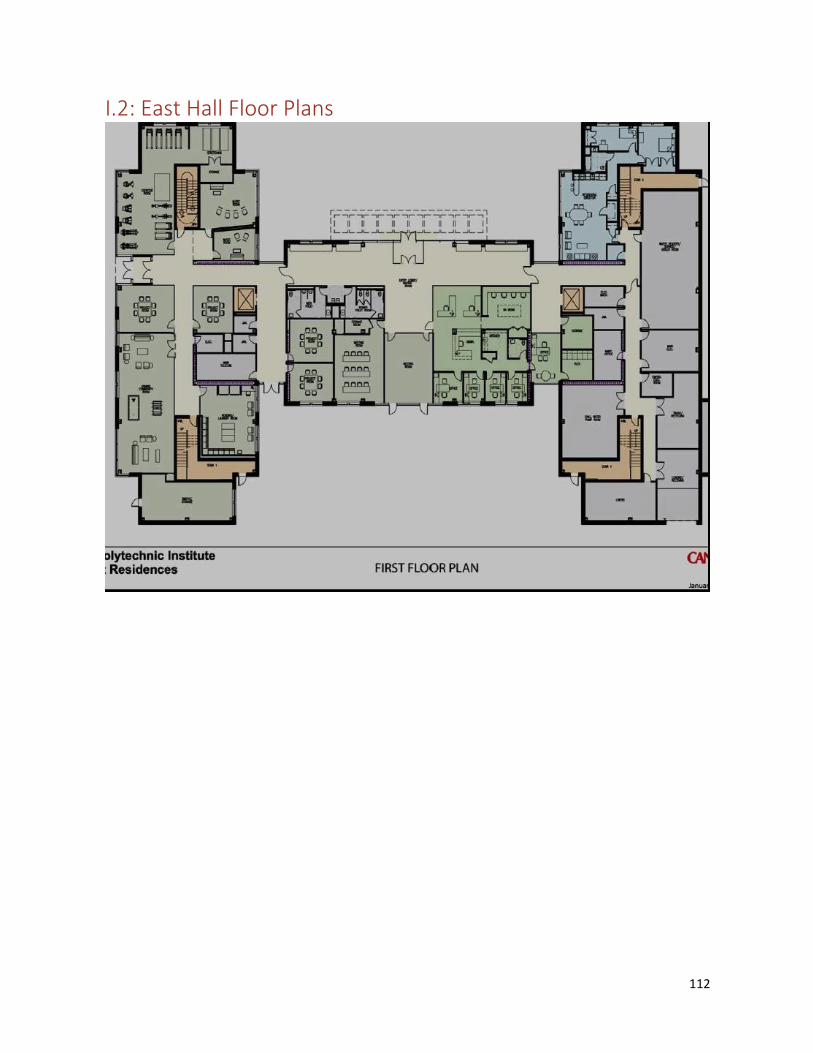
112
I.2: East Hall Floor Plans

113

114
Appendix J: Energy Bills
J.1: National Grid—East Hall
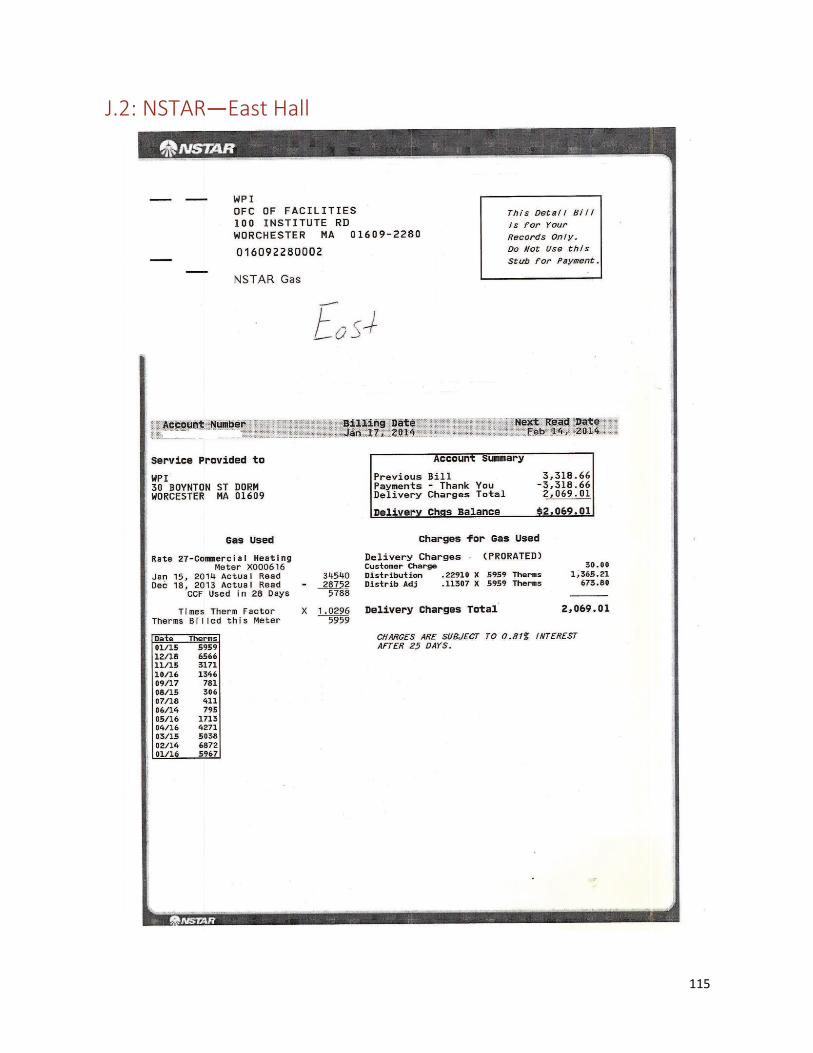
115
J.2: NSTAR—East Hall
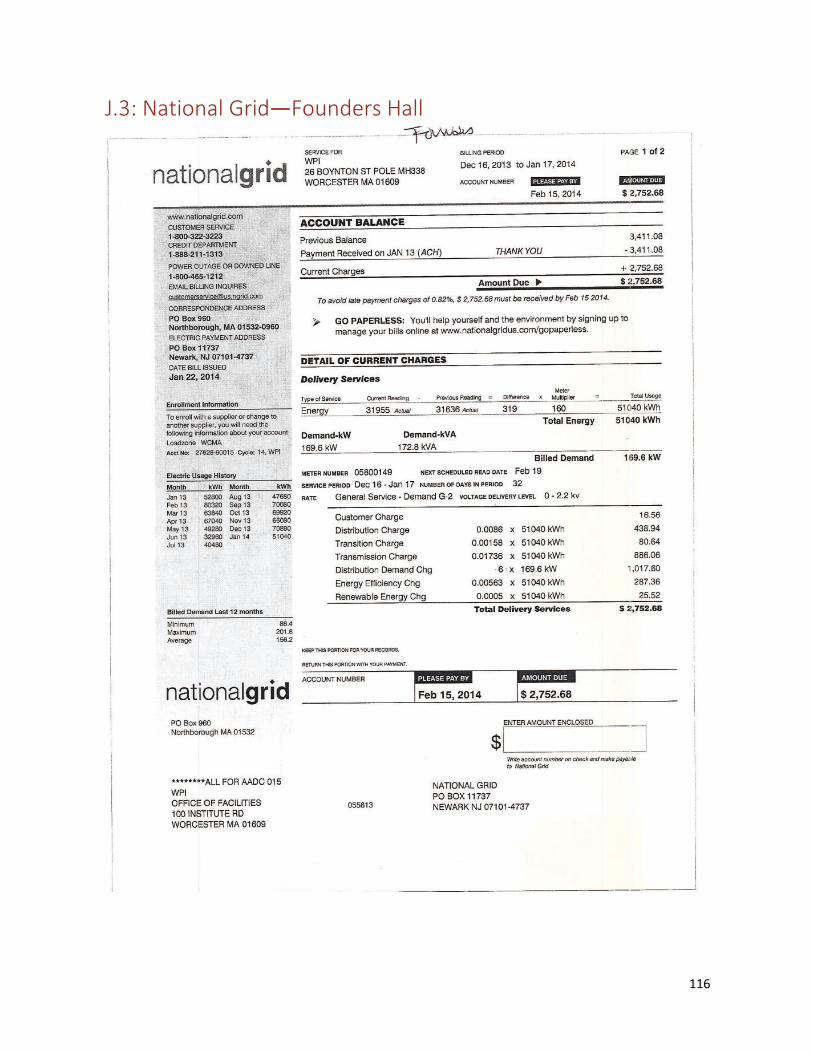
116
J.3: National Grid—Founders Hall
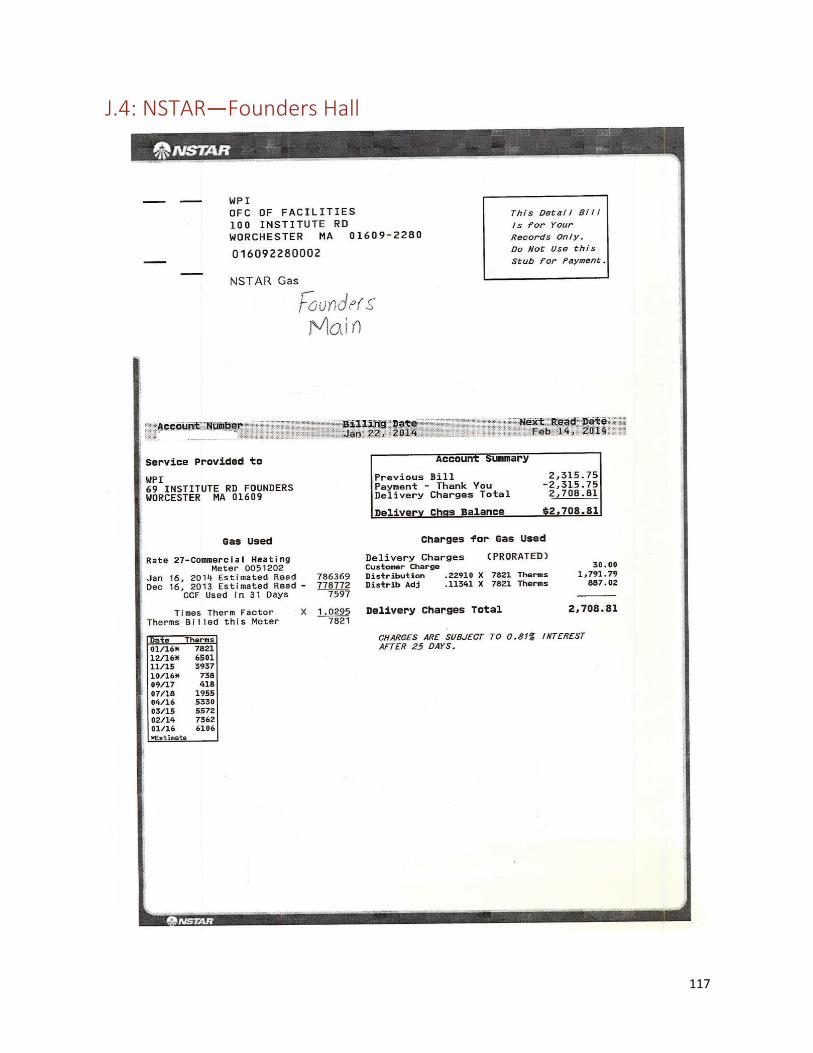
117
J.4: NSTAR—Founders Hall

118
J.5: 2013 Cost History 2013 Electric Usage History (kWh)
Month East Founders East ($) Founders ($)
January 79400 52800 10311.69 6857.142857
February 100200 80320 13012.99 10431.16883
March 86200 63840 11194.81 8290.909091
April 86000 67040 11168.83 8706.493506
May 89200 49280 11584.42 6400
June 90800 32960 11792.21 4280.519481
July 116600 40480 15142.86 5257.142857
August 112000 47680 14545.45 6192.207792
September 107400 70080 13948.05 9101.298701
October 99800 69920 12961.04 9080.519481
November 87800 66080 11402.6 8581.818182
December 96200 70880 12493.51 9205.194805
January 14' 83800 51040 10883.12 6628.571429

119
2013 Gas Usage History (kWh)
Month East Founders East ($) Founders ($)
January 5967 6106 4815.534 4927.012
February 6872 7362 5541.344 5934.324
March 5038 5572 4070.476 4498.744
April 4271 5330 3455.342 4304.66
May 1713 1403.826
June 795 667.59
July 411 1955 359.622 1597.91
August 306 275.412
September 781 418 656.362 365.236
October 1346 738 1109.492 621.876
November 3171 3937 2573.142 3187.474
December 6566 6501 5295.932 5243.802
January 14 5959 7821 4809.118 6302.442