Embed Size (px)
Citation preview

Energy Policy 50 (2012) 458–463
Contents lists available at SciVerse ScienceDirect
Energy Policy
0301-42
http://d
n Corr
E-m
journal homepage: www.elsevier.com/locate/enpol
Energy conservation status in Taiwanese food industry
Chih-Ming Ma a, Ming-Hue Chen b, Gui-Bing Hong a,n
a Department of Cosmetic Application and Management, St. Mary’s Medicine, Nursing and Management College, 100, Lane. 265, Section 2, Sanxing Road, Sanxing Township,
Yilan County, Taiwanb Service Systems Technology Center, Industrial Technology Research Institute, Rm. 209, Bldg. 52, 195, Sec. 4, Chung Hsing Road, Chutung, Hsinchu, Taiwan
H I G H L I G H T S
c This work summarizes the energy saving potential and the energy savings implemented in food industry.c The results of this study can serve as a benchmark for developing a quantified list in terms of potential energy savings.c The opportunities for improving the efficiency of the food industry can be a reference.
a r t i c l e i n f o
Article history:
Received 28 March 2012
Accepted 25 July 2012Available online 14 August 2012
Keywords:
Energy audit
Food industry
Tracking
15/$ - see front matter & 2012 Elsevier Ltd. A
x.doi.org/10.1016/j.enpol.2012.07.043
esponding author. Tel.: þ886 3 9897396; fax
ail address: [email protected] (G.-B. Hon
a b s t r a c t
The food industry in Taiwan is labor intensive, the cost of raw materials is high, and there is much product
diversification. Although this industry is primarily small and medium scale, it is a large user of electricity in
Taiwan’s manufacturing sector. The concentration of greenhouse gases (GHGs) from manufacturing activities
and vehicle emissions has increased remarkably. Energy audits are a basic and direct means by which energy
efficiency can be improved, energy consumption reduced, and carbon dioxide emissions inhibited. This work
summarizes the energy saving potential of 76 firms and the energy savings implemented by 23 firms as
determined by energy audit tracking and from the on-line energy declaration system in Taiwan’s food
industry. The results of this study can serve as a benchmark for developing a quantified list in terms of
potential energy savings and opportunities for improving the efficiency of the food industry.
& 2012 Elsevier Ltd. All rights reserved.
1. Introduction
The food industry, through its food manufacturing and processingtechnologies, provides foodstuffs for both humankind and animals.For a vast majority of the world’s population, food constitutes asignificant proportion of the family budget (Hathaway, 1974). Thedefinition of the food industry varies widely from country to country.The characteristics of the food industry in Taiwan are that it is laborintensive, the cost of raw materials is high, products are diversi-fied and companies are small and medium scale. In addition, theTaiwanese food industry is a complex and diverse business thatincludes agriculture, food transport and trade, food processing andthe catering industry, as shown in Fig. 1. Recently, the increases inglobal prices of most agricultural commodities have been attributedto: (1) the accelerated economic growth in many developing coun-tries, which has led to higher demands for food; (2) the deprecia-tion of the U.S. dollar; and (3) high oil prices, which have raisedproduction costs in agriculture via higher costs for transportation andinputs (Monteiro et al., 2012; Plant, 2008). Energy consumption inthe global agricultural system has increased by 54.6% since 1971,
ll rights reserved.
: þ886 3 9899114.
g).
reaching 180.0 MTOE in 2007 (OECD, 2010). Increases were evenhigher for specific energy carriers, such as petroleum fuels (658.0%increase) and electricity (274.9% increase) (Gasparatos, 2011).
A number of studies have shown that energy efficiency canbe improved with the help of energy conservation techniques.Energy use, savings and especially the energy efficiency of machinesused in the industrial sector have been studied by many authors indifferent parts of the world (Christoffersen et al., 2006; Ozturk,2005; Saidur et al., 2009; Subrahmanya, 2006). Wallgren and Hojer(2009) explored the possibilities for reducing the future energyneeds of the food industry to a sustainable level. An importantfinding was that energy efficiency in the food sector could bemonitored by an energy agency, without the need of implementinga task force, whereby company reporting would be done with thesole purpose of monitoring developments in energy efficiency(Ramirez et al., 2006). Although the food industry is not includedin the energy-intensive industrial groups, it is still a large user ofelectricity which is accounted about 70% of total energy consump-tion (Energy Information Network). According to the Energy Man-agement Law1 of Taiwan, energy users must observe the regulations
1 Energy Management Law was revised and promulgated by Taiwan’s President
on June 9, 2009 and July 8, 2009, respectively. The Law was aimed at upgrading
energy management, together with a rational and efficient utilization of energy.
Food Industry
Agriculture Food Transport and Trade
Food Processing Catering Industry
Food Related Industry
Food and Beverage Manufacturing
Tobacco Manufacturing
FoodMachinery Industry
Food Package Materials Industry
Food Additives Industry
1.Dairy Product Manufacturing 2.Canned Food Manufacturing 3.Frozen Food Manufacturing 4.Bakery Product Manufacturing 5.Sugar Confectionery Manufacturing 6.Edible Fats & Oils Manufacturing 7.Soy Sauce Manufacturing 8.Other Seasoning Manufacturing 9.Noodle Manufacturing 10. Other Food Manufacturing (not
elsewhere classified) 11.Soft Drink Manufacturing 12.Wine and Liquor Manufacturing 13.Beer Manufacturing 14.Slaughtering 15.Flour Milling 16.Grain Husking 17.Dehydrated Food Manufacturing 18.Preserved Food Manufacturing 19.Granulated Sugar Manufacturing 20.Tea Manufacturing 21.Prepared Animal Feeds Manufacturing
Fig. 1. Classification of Taiwan’s food industry. (Source: Committee Trade Development website).
Table 1Energy consumption and efficiency analysis of Taiwanese industry for period
2006–2010.
Year Energy type of food industry (KLOE) GOV
(million NT
dollars)
GDP
(million
NT
dollars)
Electricity Petroleum
products
Others Summation
2006 883,395 382,713 30,320 1,296,428 496,779 144,809
2007 881,667 356,022 30,512 1,268,201 531,970 148,860
2008 867,144 329,047 29,077 1,225,268 584,067 150,293
2009 862,923 332,893 27,600 1,223,416 556,950 154,428
2010 883,058 346,345 29,970 1,259,373 593,958 163,259
Source: AREMOS Data Bank.
C.-M. Ma et al. / Energy Policy 50 (2012) 458–463 459
promulgated by the central authority for conducting an energyaudit, and they must set an energy conservation target and devise anaction plan. However, as industries tend to focus on production, theyrequire some assistance in regard to achieving energy savings.Increasing energy efficiency is the most direct means of reducingenergy use and GHG emissions; it would assist industry in comply-ing with energy audits. Energy auditing has been demonstrated asan effective energy management program (Engin and Ari, 2004;Lafarge Canada Inc., 2002), and it can be applied to calculate andevaluate possible ways of reducing the energy demands of eachoperational unit in the manufacturing process. The aim of this workwas to examine what has been done in Taiwan, in terms of itsenergy conservation policy, and to describe the current status in thefood industry. In addition, potential energy conservation opportu-nities or measures are discussed.
3 Asian financial crisis: the American financial crisis sent shockwaves
throughout Asia in 2008 as governments, banks and corporations scrambled to
cope with plunging share prices, international financial turmoil and the prospects
of a serious downturn in the US and other major economies.
2. Current status in Taiwan’s food industry
The gross output value (GOV2), operating plants and amount oflabor in Taiwan’s food industry are currently in a stable growthstage. Taiwanese industry is primarily small and medium scale,especially in the food industry, which is one of the mostimportant manufacturing industries. The GOV of the food indus-try in 2010 saw an increase of 19.6% over the 2006 figure. Fromthe energy aspect, Taiwan’s food industry in 2010 consumed 1.26million KLOE, which decreased 2.9% as compared with its totalannual consumption in 2006. Meanwhile, the consumption of theentire industrial sector increased 14.4%. In comparison with 2009,GOV and energy use in 2010 increased by 6.6% and 2.9%,respectively, as shown in Table 1. Average energy use in theindustrial sector increased by 2.9%, while average food industryenergy use decreased by 0.6% during 2006–2010. The energy typeused in the food industry is predominantly in the form of
2 The total value of sales by producing enterprises (turnover of food industry)
in an accounting period (e.g., a quarter or a year).
electricity (around 70%). After the Asian financial crisis3 in 2008,the GOV of the food industry decreased and so resulted in adecrease in energy consumption. But the pace of economicrecovery in the food industry was evident in 2010.
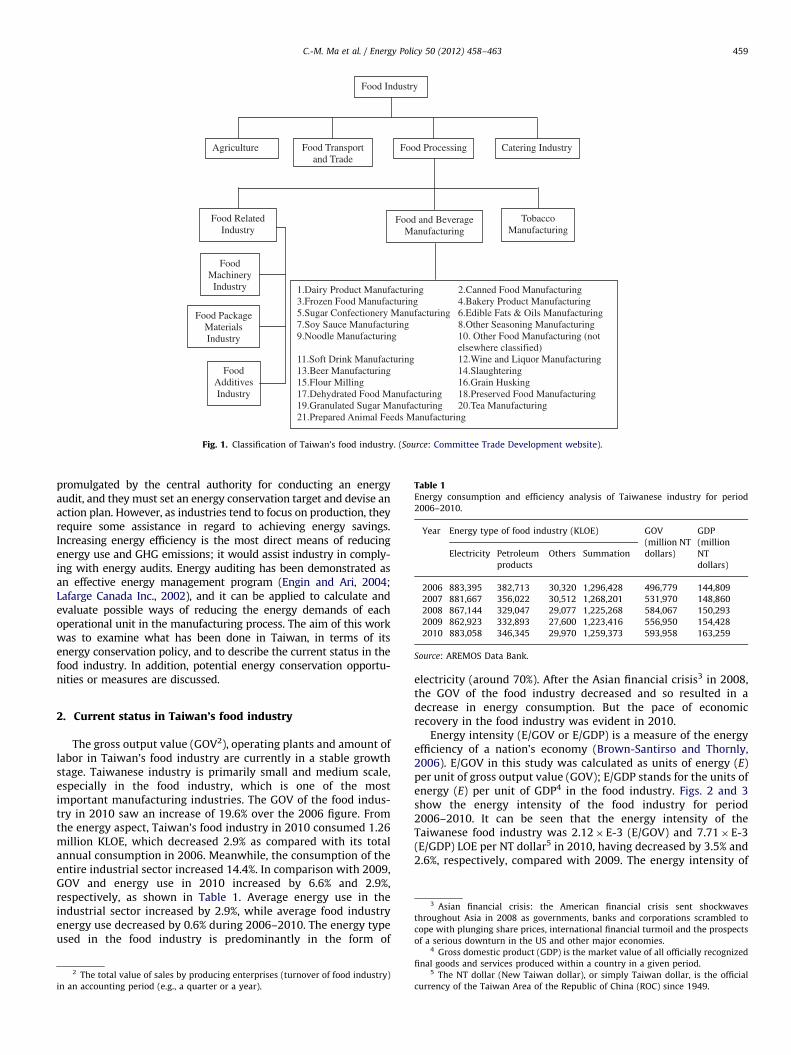
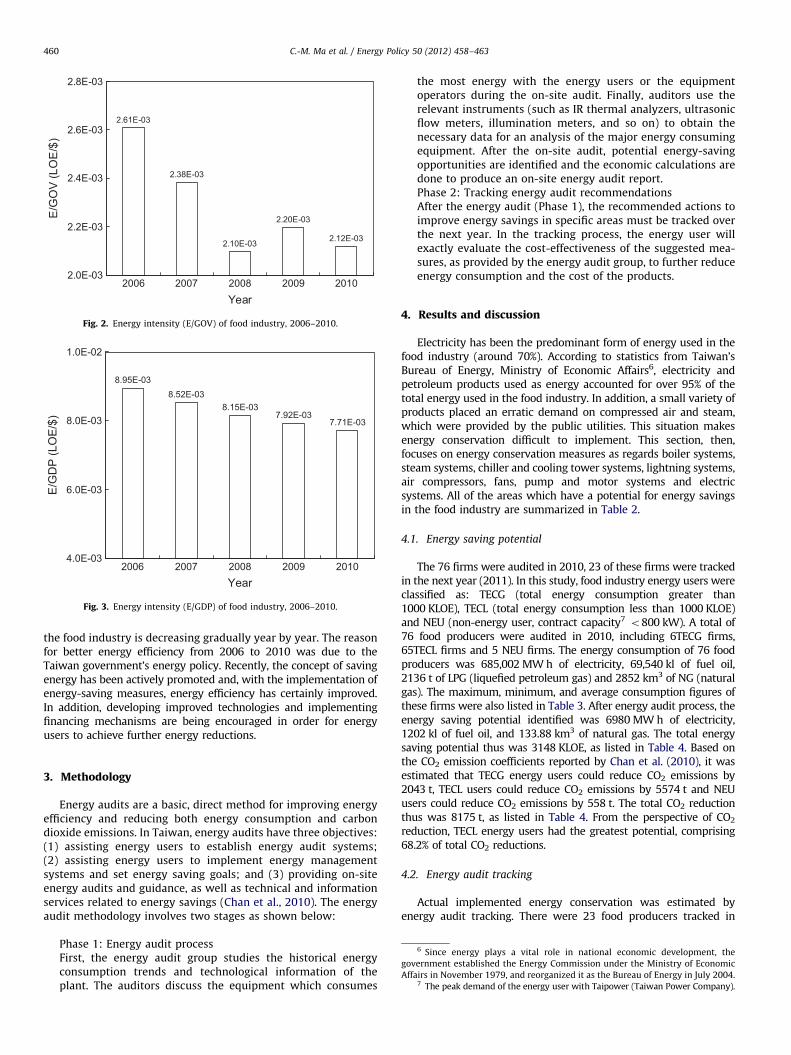
Energy intensity (E/GOV or E/GDP) is a measure of the energyefficiency of a nation’s economy (Brown-Santirso and Thornly,2006). E/GOV in this study was calculated as units of energy (E)per unit of gross output value (GOV); E/GDP stands for the units ofenergy (E) per unit of GDP4 in the food industry. Figs. 2 and 3show the energy intensity of the food industry for period2006–2010. It can be seen that the energy intensity of theTaiwanese food industry was 2.12� E-3 (E/GOV) and 7.71�E-3(E/GDP) LOE per NT dollar5 in 2010, having decreased by 3.5% and2.6%, respectively, compared with 2009. The energy intensity of
4 Gross domestic product (GDP) is the market value of all officially recognized
final goods and services produced within a country in a given period.5 The NT dollar (New Taiwan dollar), or simply Taiwan dollar, is the official
currency of the Taiwan Area of the Republic of China (ROC) since 1949.
2.61E-03
2.38E-03
2.10E-03
2.20E-03
2.12E-03
2.0E-03
2.2E-03
2.4E-03
2.6E-03
2.8E-03
2006 2007 2008 2009 2010Year
E/G
OV
(LO
E/$
)
Fig. 2. Energy intensity (E/GOV) of food industry, 2006–2010.
8.95E-038.52E-03
8.15E-037.92E-03
7.71E-03
4.0E-03
6.0E-03
8.0E-03
1.0E-02
2006 2007 2008 2009 2010Year
E/G
DP
(LO
E/$
)
Fig. 3. Energy intensity (E/GDP) of food industry, 2006–2010.
C.-M. Ma et al. / Energy Policy 50 (2012) 458–463460
the food industry is decreasing gradually year by year. The reasonfor better energy efficiency from 2006 to 2010 was due to theTaiwan government’s energy policy. Recently, the concept of savingenergy has been actively promoted and, with the implementation ofenergy-saving measures, energy efficiency has certainly improved.In addition, developing improved technologies and implementingfinancing mechanisms are being encouraged in order for energyusers to achieve further energy reductions.
6 Since energy plays a vital role in national economic development, the
government established the Energy Commission under the Ministry of Economic
Affairs in November 1979, and reorganized it as the Bureau of Energy in July 2004.7 The peak demand of the energy user with Taipower (Taiwan Power Company).
3. Methodology
Energy audits are a basic, direct method for improving energyefficiency and reducing both energy consumption and carbondioxide emissions. In Taiwan, energy audits have three objectives:(1) assisting energy users to establish energy audit systems;(2) assisting energy users to implement energy managementsystems and set energy saving goals; and (3) providing on-siteenergy audits and guidance, as well as technical and informationservices related to energy savings (Chan et al., 2010). The energyaudit methodology involves two stages as shown below:
Phase 1: Energy audit processFirst, the energy audit group studies the historical energyconsumption trends and technological information of theplant. The auditors discuss the equipment which consumes
the most energy with the energy users or the equipmentoperators during the on-site audit. Finally, auditors use therelevant instruments (such as IR thermal analyzers, ultrasonicflow meters, illumination meters, and so on) to obtain thenecessary data for an analysis of the major energy consumingequipment. After the on-site audit, potential energy-savingopportunities are identified and the economic calculations aredone to produce an on-site energy audit report.Phase 2: Tracking energy audit recommendationsAfter the energy audit (Phase 1), the recommended actions toimprove energy savings in specific areas must be tracked overthe next year. In the tracking process, the energy user willexactly evaluate the cost-effectiveness of the suggested mea-sures, as provided by the energy audit group, to further reduceenergy consumption and the cost of the products.
4. Results and discussion
Electricity has been the predominant form of energy used in thefood industry (around 70%). According to statistics from Taiwan’sBureau of Energy, Ministry of Economic Affairs6, electricity andpetroleum products used as energy accounted for over 95% of thetotal energy used in the food industry. In addition, a small variety ofproducts placed an erratic demand on compressed air and steam,which were provided by the public utilities. This situation makesenergy conservation difficult to implement. This section, then,focuses on energy conservation measures as regards boiler systems,steam systems, chiller and cooling tower systems, lightning systems,air compressors, fans, pump and motor systems and electricsystems. All of the areas which have a potential for energy savingsin the food industry are summarized in Table 2.
4.1. Energy saving potential
The 76 firms were audited in 2010, 23 of these firms were trackedin the next year (2011). In this study, food industry energy users wereclassified as: TECG (total energy consumption greater than1000 KLOE), TECL (total energy consumption less than 1000 KLOE)and NEU (non-energy user, contract capacity7 o800 kW). A total of76 food producers were audited in 2010, including 6TECG firms,65TECL firms and 5 NEU firms. The energy consumption of 76 foodproducers was 685,002 MW h of electricity, 69,540 kl of fuel oil,2136 t of LPG (liquefied petroleum gas) and 2852 km3 of NG (naturalgas). The maximum, minimum, and average consumption figures ofthese firms were also listed in Table 3. After energy audit process, theenergy saving potential identified was 6980 MW h of electricity,1202 kl of fuel oil, and 133.88 km3 of natural gas. The total energysaving potential thus was 3148 KLOE, as listed in Table 4. Based onthe CO2 emission coefficients reported by Chan et al. (2010), it wasestimated that TECG energy users could reduce CO2 emissions by2043 t, TECL users could reduce CO2 emissions by 5574 t and NEUusers could reduce CO2 emissions by 558 t. The total CO2 reductionthus was 8175 t, as listed in Table 4. From the perspective of CO2
reduction, TECL energy users had the greatest potential, comprising68.2% of total CO2 reductions.
4.2. Energy audit tracking
Actual implemented energy conservation was estimated byenergy audit tracking. There were 23 food producers tracked in
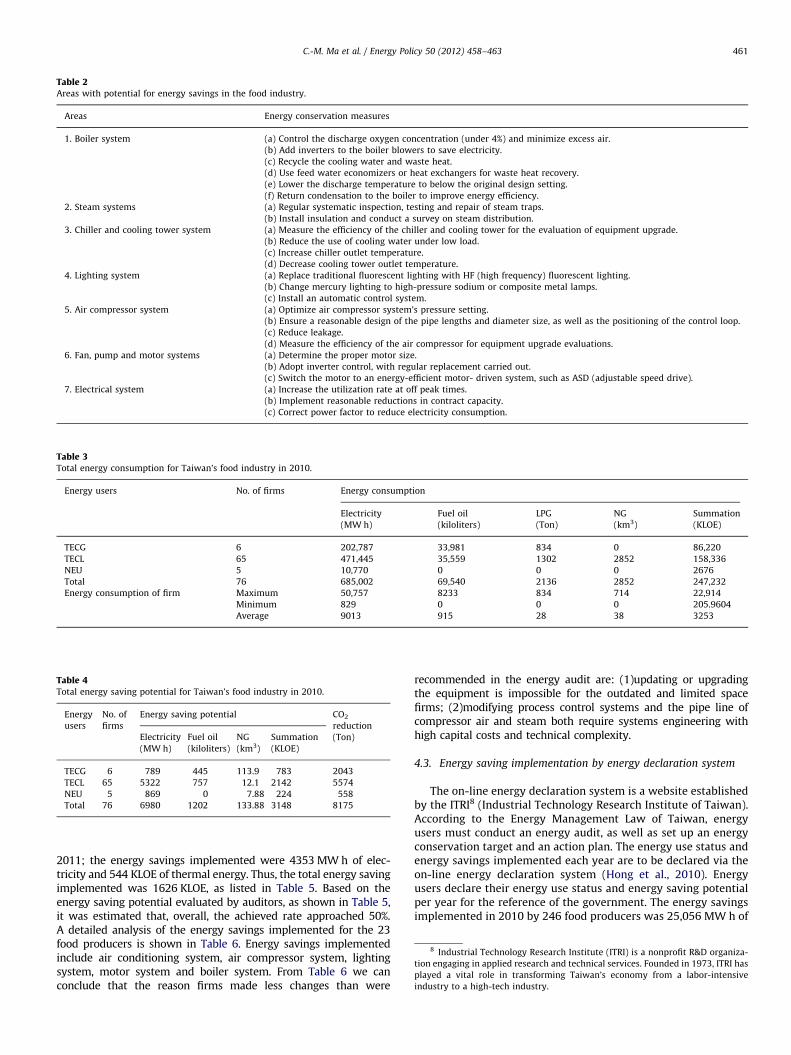
Table 2Areas with potential for energy savings in the food industry.
Areas Energy conservation measures
1. Boiler system (a) Control the discharge oxygen concentration (under 4%) and minimize excess air.
(b) Add inverters to the boiler blowers to save electricity.
(c) Recycle the cooling water and waste heat.
(d) Use feed water economizers or heat exchangers for waste heat recovery.
(e) Lower the discharge temperature to below the original design setting.
(f) Return condensation to the boiler to improve energy efficiency.
2. Steam systems (a) Regular systematic inspection, testing and repair of steam traps.
(b) Install insulation and conduct a survey on steam distribution.
3. Chiller and cooling tower system (a) Measure the efficiency of the chiller and cooling tower for the evaluation of equipment upgrade.
(b) Reduce the use of cooling water under low load.
(c) Increase chiller outlet temperature.
(d) Decrease cooling tower outlet temperature.
4. Lighting system (a) Replace traditional fluorescent lighting with HF (high frequency) fluorescent lighting.
(b) Change mercury lighting to high-pressure sodium or composite metal lamps.
(c) Install an automatic control system.
5. Air compressor system (a) Optimize air compressor system’s pressure setting.
(b) Ensure a reasonable design of the pipe lengths and diameter size, as well as the positioning of the control loop.
(c) Reduce leakage.
(d) Measure the efficiency of the air compressor for equipment upgrade evaluations.
6. Fan, pump and motor systems (a) Determine the proper motor size.
(b) Adopt inverter control, with regular replacement carried out.
(c) Switch the motor to an energy-efficient motor- driven system, such as ASD (adjustable speed drive).
7. Electrical system (a) Increase the utilization rate at off peak times.
(b) Implement reasonable reductions in contract capacity.
(c) Correct power factor to reduce electricity consumption.
Table 3Total energy consumption for Taiwan’s food industry in 2010.
Energy users No. of firms Energy consumption
Electricity Fuel oil LPG NG Summation
(MW h) (kiloliters) (Ton) (km3) (KLOE)
TECG 6 202,787 33,981 834 0 86,220
TECL 65 471,445 35,559 1302 2852 158,336
NEU 5 10,770 0 0 0 2676
Total 76 685,002 69,540 2136 2852 247,232
Energy consumption of firm Maximum 50,757 8233 834 714 22,914
Minimum 829 0 0 0 205.9604
Average 9013 915 28 38 3253
Table 4Total energy saving potential for Taiwan’s food industry in 2010.
Energy
users
No. of
firms
Energy saving potential CO2
reduction
(Ton)Electricity Fuel oil NG Summation
(MW h) (kiloliters) (km3) (KLOE)
TECG 6 789 445 113.9 783 2043
TECL 65 5322 757 12.1 2142 5574
NEU 5 869 0 7.88 224 558
Total 76 6980 1202 133.88 3148 8175
8 Industrial Technology Research Institute (ITRI) is a nonprofit R&D organiza-
tion engaging in applied research and technical services. Founded in 1973, ITRI has
played a vital role in transforming Taiwan’s economy from a labor-intensive
industry to a high-tech industry.
C.-M. Ma et al. / Energy Policy 50 (2012) 458–463 461
2011; the energy savings implemented were 4353 MW h of elec-tricity and 544 KLOE of thermal energy. Thus, the total energy savingimplemented was 1626 KLOE, as listed in Table 5. Based on theenergy saving potential evaluated by auditors, as shown in Table 5,it was estimated that, overall, the achieved rate approached 50%.A detailed analysis of the energy savings implemented for the 23food producers is shown in Table 6. Energy savings implementedinclude air conditioning system, air compressor system, lightingsystem, motor system and boiler system. From Table 6 we canconclude that the reason firms made less changes than were
recommended in the energy audit are: (1)updating or upgradingthe equipment is impossible for the outdated and limited spacefirms; (2)modifying process control systems and the pipe line ofcompressor air and steam both require systems engineering withhigh capital costs and technical complexity.
4.3. Energy saving implementation by energy declaration system
The on-line energy declaration system is a website establishedby the ITRI8 (Industrial Technology Research Institute of Taiwan).According to the Energy Management Law of Taiwan, energyusers must conduct an energy audit, as well as set up an energyconservation target and an action plan. The energy use status andenergy savings implemented each year are to be declared via theon-line energy declaration system (Hong et al., 2010). Energyusers declare their energy use status and energy saving potentialper year for the reference of the government. The energy savingsimplemented in 2010 by 246 food producers was 25,056 MW h of
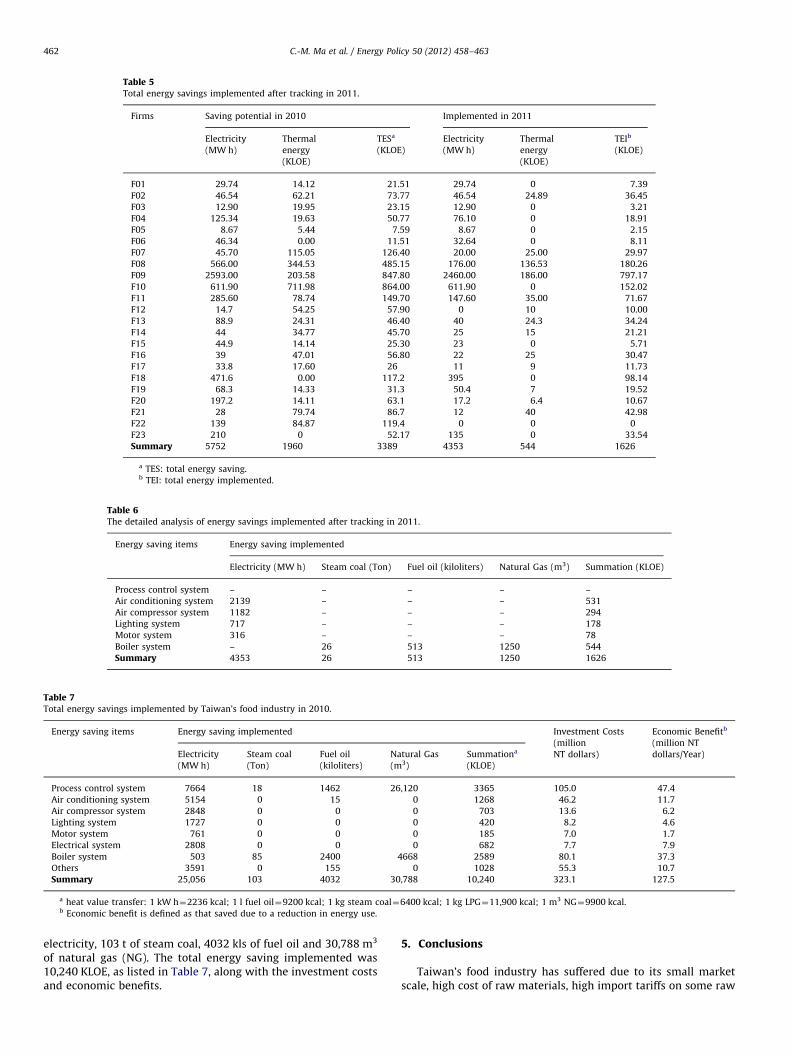
Table 5Total energy savings implemented after tracking in 2011.
Firms Saving potential in 2010 Implemented in 2011
Electricity
(MW h)
Thermal
energy
(KLOE)
TESa
(KLOE)
Electricity
(MW h)
Thermal
energy
(KLOE)
TEIb
(KLOE)
F01 29.74 14.12 21.51 29.74 0 7.39
F02 46.54 62.21 73.77 46.54 24.89 36.45
F03 12.90 19.95 23.15 12.90 0 3.21
F04 125.34 19.63 50.77 76.10 0 18.91
F05 8.67 5.44 7.59 8.67 0 2.15
F06 46.34 0.00 11.51 32.64 0 8.11
F07 45.70 115.05 126.40 20.00 25.00 29.97
F08 566.00 344.53 485.15 176.00 136.53 180.26
F09 2593.00 203.58 847.80 2460.00 186.00 797.17
F10 611.90 711.98 864.00 611.90 0 152.02
F11 285.60 78.74 149.70 147.60 35.00 71.67
F12 14.7 54.25 57.90 0 10 10.00
F13 88.9 24.31 46.40 40 24.3 34.24
F14 44 34.77 45.70 25 15 21.21
F15 44.9 14.14 25.30 23 0 5.71
F16 39 47.01 56.80 22 25 30.47
F17 33.8 17.60 26 11 9 11.73
F18 471.6 0.00 117.2 395 0 98.14
F19 68.3 14.33 31.3 50.4 7 19.52
F20 197.2 14.11 63.1 17.2 6.4 10.67
F21 28 79.74 86.7 12 40 42.98
F22 139 84.87 119.4 0 0 0
F23 210 0 52.17 135 0 33.54
Summary 5752 1960 3389 4353 544 1626
a TES: total energy saving.b TEI: total energy implemented.
Table 6The detailed analysis of energy savings implemented after tracking in 2011.
Energy saving items Energy saving implemented
Electricity (MW h) Steam coal (Ton) Fuel oil (kiloliters) Natural Gas (m3) Summation (KLOE)
Process control system – – – – –
Air conditioning system 2139 – – – 531
Air compressor system 1182 – – – 294
Lighting system 717 – – – 178
Motor system 316 – – – 78
Boiler system – 26 513 1250 544
Summary 4353 26 513 1250 1626
Table 7Total energy savings implemented by Taiwan’s food industry in 2010.
Energy saving items Energy saving implemented Investment Costs
(million
NT dollars)
Economic Benefitb
(million NT
dollars/Year)Electricity Steam coal Fuel oil Natural Gas Summationa
(MW h) (Ton) (kiloliters) (m3) (KLOE)
Process control system 7664 18 1462 26,120 3365 105.0 47.4
Air conditioning system 5154 0 15 0 1268 46.2 11.7
Air compressor system 2848 0 0 0 703 13.6 6.2
Lighting system 1727 0 0 0 420 8.2 4.6
Motor system 761 0 0 0 185 7.0 1.7
Electrical system 2808 0 0 0 682 7.7 7.9
Boiler system 503 85 2400 4668 2589 80.1 37.3
Others 3591 0 155 0 1028 55.3 10.7
Summary 25,056 103 4032 30,788 10,240 323.1 127.5
a heat value transfer: 1 kW h¼2236 kcal; 1 l fuel oil¼9200 kcal; 1 kg steam coal¼6400 kcal; 1 kg LPG¼11,900 kcal; 1 m3 NG¼9900 kcal.b Economic benefit is defined as that saved due to a reduction in energy use.
C.-M. Ma et al. / Energy Policy 50 (2012) 458–463462
electricity, 103 t of steam coal, 4032 kls of fuel oil and 30,788 m3
of natural gas (NG). The total energy saving implemented was10,240 KLOE, as listed in Table 7, along with the investment costsand economic benefits.
5. Conclusions
Taiwan’s food industry has suffered due to its small marketscale, high cost of raw materials, high import tariffs on some raw
C.-M. Ma et al. / Energy Policy 50 (2012) 458–463 463
materials or semi-products, as well as high labor and land costs,compared to adjacent developing countries. Taiwan’s quickindustrialization and rapid growth is a ‘‘Taiwan Economic Mira-cle,‘‘ especially given the extremely limited coal and petroleumresources. The Bureau of Energy for the Ministry of EconomicAffairs has taken substantial preparatory measures by establish-ing an energy audit group and on-line energy declaration systemto help energy users enhance energy efficiency and reduce CO2
emissions. The energy audit group audited 76 Taiwanese foodplants in 2010 and provided recommendations and technicalservices. The total energy saving potential was 3148 KLOE,equivalent to an 8175 t reduction in CO2 emissions. In 2011, 23food producers were tracked, and the total energy saving imple-mented was 1626 KLOE. In addition, in 2010, the energy savingimplemented from the on-line energy declaration system for foodproducers was around 10,240 kt of oil equivalent.
Acknowledgment
The authors would like to thank the Bureau of Energy, Ministry ofEconomic Affairs, Taiwan, for financially supporting this research.The anonymous reviewers are also appreciated for their comments.
References
Brown-Santirso, M., Thornly, A., 2006. Decoupling economic growth and energyuse in New Zealand. Available from: /www.stats.govt.nzS.
Chan, D.Y.L., Yang, K.H., Lee, J.D., Hong, G.B., 2010. The case study of furnace useand energy conservation in iron and steel industry. Energy 35, 1665–1770.
Christoffersen, L.B., Larsen, A., Togeby, M., 2006. Empirical analysis of energymanagement in Danish industry. Journal of Cleaner Production 14, 516–526.
Committee Trade Development website. Available from: /http://www.cnfi.org.tw/wto/admin/upload/35/ECFA0617.pdfS.
Energy Information Network. Available from: /http://emis.erl.itri.org.tw/index.aspS.
Engin, T., Ari, V., 2004. Energy auditing and recovery for dry type cement rotarykiln systems: a case study. Energy Conversion and Management 46, 551–562.
Gasparatos, A., 2011. Resource consumption in Japanese agriculture and its link tofood security. Energy Policy 39, 1101–1112.
Hathaway, D.E., 1974. Food Prices and Inflation. Brookings Papers on EconomicActivity 1, 63–116.
Hong, G.B., Su, T.L., Lee, J.D., Hsu, T.C., Chen, H.W., 2010. Energy conservationpotential in Taiwanese textile industry. Energy Policy 38, 7048–7053.
Lafarge Canada Inc., 2002. Pyroprocessing of Cement Processing Engineering.Canada: VADE-MECUM.
Monteiro, N., Altman, I., Lahiri, S., 2012. The impact of ethanol production on foodprices: the role of interplay between the U.S. and Brazil. Energy Policy 41,193–199.
OECD, 2010. Energy balances of OECD and non-OECD countries. Organization ofEconomic Cooperation and Development-International Energy Agency (OECD-IEA), Paris. Available from: /http://www.oecd-ilibrary.org/statisticsS.
Ozturk, H.K., 2005. Energy usage and cost in textile industry: a case study forTurkey. Energy 30, 2424–2446.
Plant, M., 2008. Food security and the increasein global food prices. InternationalMonetary Fund. Available from: /http://www.imf.org/external/np/speeches/2008/pdf/061908.pdfS.
Ramirez, C.A., Blok, K., Neelis, M., Patel, M., 2006. Energy usage and cost in textileindustry: a case study for Turkey. Energy 30, 2424–2446.
Saidur, R., Rahim, N.A., Ping, H.W., Jahirul, M.I., Mekhilef, S., Masjuki, H.H., 2009.Energy and emission analysis for industrial motors in Malaysia. Energy Policy37, 3650–3658.
Subrahmanya, M.H.B., 2006. Labour productivity, energy intensity and economicperformance in small enterprises: a study of brick enterprises cluster in India.Energy Conversion and Management 47, 763–777.
Wallgren, C., Hojer, M., 2009. Eating energy-identifying possibilities for reducedenergy use in the future food supply system. Energy Policy 37, 5803–5813.