Embed Size (px)
Citation preview
Endoscopic imaging of Cerenkov luminescence Sri-Rajasekhar Kothapalli,1,5 Hongguang Liu,1,5 Joseph C. Liao,2,3 Zhen Cheng,1,5,7 and
Sanjiv Sam Gambhir1,4,5,6 1Molecular Imaging Program at Stanford, Department of Radiology and Bio-X Program, Stanford University,
Palo Alto, CA, US 2Department of Urology, Stanford University, Palo Alto, CA, US
3Veterans Affairs Palo Alto Health Care System, Palo Alto, CA, USA 4Department of Bioengineering, Department of Materials Science & Engineering, Stanford University,
Palo Alto, CA, USA 5Equal contribution
[email protected] [email protected]
Abstract: We demonstrate feasibility of endoscopic imaging of Cerenkov light originated when charged nuclear particles, emitted from radionuclides, travel through a biological tissue of living subjects at superluminal velocity. The endoscopy imaging system consists of conventional optical fiber bundle/ clinical endoscopes, an optical imaging lens system, and a sensitive low-noise charge coupled device (CCD) camera. Our systematic studies using phantom samples show that Cerenkov light from as low as 1 µCi of radioactivity emitted from 18F-Fluorodeoxyglucose (FDG) can be coupled and transmitted through conventional optical fibers and endoscopes. In vivo imaging experiments with tumor bearing mice, intravenously administered with 18F-FDG, further demonstrated that Cerenkov luminescence endoscopy is a promising new tool in the field of endoscopic molecular imaging. © 2012 Optical Society of America OCIS codes: (170.2150) Endoscopic imaging; (170.0110) Imaging systems; (170.4580) Optical diagnostics for medicine.
References and links 1. M. L. James and S. S. Gambhir, “A molecular imaging primer: modalities, imaging agents, and applications,”
Physiol. Rev. 92(2), 897–965 (2012). 2. R. Weissleder, “Scaling down imaging: molecular mapping of cancer in mice,” Nat. Rev. Cancer 2(1), 11–18
(2002). 3. T. F. Massoud and S. S. Gambhir, “Molecular imaging in living subjects: seeing fundamental biological
processes in a new light,” Genes Dev. 17(5), 545–580 (2003). 4. G. J. Tearney, S. Waxman, M. S. Shishkov, B. J. Vakoc, M. J. Suter, M. I. Freilich, A. E. Desjardins, W. Y. Oh,
L. A. Bartlett, M. Rosenberg, and B. E. Bouma, “Three-dimensional coronary artery microscopy by intracoronary optical frequency domain imaging,” JACC Cardiovasc. Imaging 1(6), 752–761 (2008).
5. T. D. Wang, J. M. Crawford, M. S. Feld, Y. Wang, I. Itzkan, and J. Van Dam, “In vivo identification of colonic dysplasia using fluorescence endoscopic imaging,” Gastrointest. Endosc. 49(4), 447–455 (1999).
6. K. Wu, J. J. Liu, W. Adams, G. A. Sonn, K. E. Mach, Y. Pan, A. H. Beck, K. C. Jensen, and J. C. Liao, “Dynamic real-time microscopy of the urinary tract using confocal laser endomicroscopy,” Urology 78(1), 225–231 (2011).
7. D. Kang, M. J. Suter, C. Boudoux, H. Yoo, P. S. Yachimski, W. P. Puricelli, N. S. Nishioka, M. Mino-Kenudson, G. Y. Lauwers, B. E. Bouma, and G. J. Tearney, “Comprehensive imaging of gastroesophageal biopsy samples by spectrally encoded confocal microscopy,” Gastrointest. Endosc. 71(1), 35–43 (2010).
8. A. Quon and S. S. Gambhir, “FDG-PET and beyond: molecular breast cancer imaging,” J. Clin. Oncol. 23(8), 1664–1673 (2005).
9. A. Iagaru, E. Mittra, S. S. Yaghoubi, D. W. Dick, A. Quon, M. L. Goris, and S. S. Gambhir, “Novel strategy for a cocktail 18F-fluoride and 18F-FDG PET/CT scan for evaluation of malignancy: results of the pilot-phase study,” J. Nucl. Med. 50(4), 501–505 (2009).
10. H. Schöder and S. M. Larson, “Positron emission tomography for prostate, bladder, and renal cancer,” Semin. Nucl. Med. 34(4), 274–292 (2004).
11. H. Vees, F. Buchegger, S. Albrecht, H. Khan, D. Husarik, H. Zaidi, D. Soloviev, T. F. Hany, and R. Miralbell, “18F-choline and/or 11C-acetate positron emission tomography: detection of residual or progressive subclinical disease at very low prostate-specific antigen values (<1 ng/mL) after radical prostatectomy,” BJU Int. 99(6), 1415–1420 (2007).
#162250 - $15.00 USD Received 30 Jan 2012; revised 7 Apr 2012; accepted 28 Apr 2012; published 3 May 2012(C) 2012 OSA 1 June 2012 / Vol. 3, No. 6 / BIOMEDICAL OPTICS EXPRESS 1215
12. M. Souvatzoglou, A. L. Grosu, B. Röper, B. J. Krause, R. Beck, G. Reischl, M. Picchio, H. J. Machulla, H. J. Wester, and M. Piert, “Tumour hypoxia imaging with [18F]FAZA PET in head and neck cancer patients: a pilot study,” Eur. J. Nucl. Med. Mol. Imaging 34(10), 1566–1575 (2007).
13. M. Bruehlmeier, U. Roelcke, P. A. Schubiger, and S. M. Ametamey, “Assessment of hypoxia and perfusion in human brain tumors using PET with 18F-fluoromisonidazole and 15O-H2O,” J. Nucl. Med. 45(11), 1851–1859 (2004).
14. R. Amzat, P. Taleghani, B. Savir-Baruch, P. T. Nieh, V. A. Master, R. K. Halkar, M. M. Lewis, M. Faurot, L. M. Bellamy, M. M. Goodman, and D. M. Schuster, “Unusual presentations of metastatic prostate carcinoma as detected by anti-3 F-18 FACBC PET/CT,” Clin. Nucl. Med. 36(9), 800–802 (2011).
15. A. Zhu and H. Shim, “Current molecular imaging positron emitting radiotracers in oncology,” Nucl. Med. Mol. Imaging 45(1), 1–14 (2011).
16. J. Buscombe, H. Hirji, and C. Witney-Smith, “Nuclear medicine in the management of thyroid disease,” Expert Rev. Anticancer Ther. 8(9), 1425–1431 (2008).
17. R. Robertson, M. S. Germanos, C. Li, G. S. Mitchell, S. R. Cherry, and M. D. Silva, “Optical imaging of Cerenkov light generation from positron-emitting radiotracers,” Phys. Med. Biol. 54(16), N355–N365 (2009).
18. H. Liu, G. Ren, Z. Miao, X. Zhang, X. Tang, P. Han, S. S. Gambhir, and Z. Cheng, “Molecular optical imaging with radioactive probes,” PLoS ONE 5(3), e9470 (2010).
19. C. Li, G. S. Mitchell, and S. R. Cherry, “Cerenkov luminescence tomography for small-animal imaging,” Opt. Lett. 35(7), 1109–1111 (2010).
20. A. E. Spinelli, C. Kuo, B. W. Rice, R. Calandrino, P. Marzola, A. Sbarbati, and F. Boschi, “Multispectral Cerenkov luminescence tomography for small animal optical imaging,” Opt. Express 19(13), 12605–12618 (2011).
21. Y. Xu, E. Chang, H. Liu, H. Jiang, S. S. Gambhir, and Z. Cheng, “Proof-of-concept study of monitoring cancer drug therapy with cerenkov luminescence imaging,” J. Nucl. Med. 53(2), 312–317 (2012).
22. Y. Xu, H. Liu, and Z. Cheng, “Harnessing the power of radionuclides for optical imaging: Cerenkov luminescence imaging,” J. Nucl. Med. 52(12), 2009–2018 (2011).
23. H. Liu, C. M. Carpenter, H. Jiang, G. Pratx, C. Sun, M. P. Buchin, S. S. Gambhir, L. Xing, and Z. Cheng, “Intraoperative imaging of tumors using Cerenkov luminescence endoscopy: a feasibility experimental study,” J. Nucl. Med. (to be published).
24. S. Kosuda, P. V. Kison, R. Greenough, H. B. Grossman, and R. L. Wahl, “Preliminary assessment of fluorine-18 fluorodeoxyglucose positron emission tomography in patients with bladder cancer,” Eur. J. Nucl. Med. 24(6), 615–620 (1997).
25. “Fibers get special,” Nat. Photonics 5(8), 461 (2011).
1. Introduction
In recent years, molecular imaging has increasingly evolved as an integral imaging modality in the diagnosis, surveillance, and treatment monitoring of cancer, as well as neurological and cardiovascular diseases [1–3]. In contrast to traditional diagnostic imaging modalities such as computed tomography (CT) and ultrasound, which provide predominantly anatomical information, molecular imaging offers insights into the underlying biochemistry with molecular specificity. Optical imaging, magnetic resonance imaging (MRI), and positron emission tomography (PET) are mainly used for non-invasive molecular imaging. While MRI has limited sensitivity (contrast agent concentration: 10−3 to 10−5 mol/L), both optical imaging and PET provide high sensitivity (radioisotope concentration: 10−11 to 10−12 mol/L). While optical imaging offers rapid image acquisition, low cost, and the absence of ionizing radiation, it is limited by depth of penetration due to the strong attenuation of light by biological tissue. Optical endoscopes and laparoscopes deliver light directly to the internal organs through natural or surgical orifices. In conventional white light endoscopy, diffusely reflected light from the tissue surface is imaged to visualize lesions or structural changes. Several new endoscopic technologies exploit light properties such as optical coherence and fluorescence [4,5]. For example, fluorescence emitted from endogenous molecules [e.g., aromatic amino acids, NADH (nicotinamide adenine dinucleotide) and FAD (flavin adenine dinucleotide)] and exogenous fluorescent-labeled probes have been used to determine the biochemical and molecular changes in diseased tissues [6,7]. However, optical imaging has been limited by paucity of available contrast agents for clinical use, with only three approved by the US Food and Drug Administration (FDA): indocyanine green (ICG), methylene blue, and fluorescein. These non-specific agents are used to improve tissue contrast and highlight the vasculature. For targeted imaging, it still remains a challenge to translate optical molecular contrast agents from bench to the clinics, primarily due to concerns for toxicity and immunogenicity.
#162250 - $15.00 USD Received 30 Jan 2012; revised 7 Apr 2012; accepted 28 Apr 2012; published 3 May 2012(C) 2012 OSA 1 June 2012 / Vol. 3, No. 6 / BIOMEDICAL OPTICS EXPRESS 1216
Many radioactive probes/tracers have been approved by the FDA for PET or single-photon emission computed tomography (SPECT). A relative disadvantage of Cerenkov based detection is the need for radioactive tracers that produce ionizing radiation. However the tracers are injected at relatively low mass amounts following the safety limits for human radiation exposure. The PET probes target intracellular, cell surface, or extracellular matrix molecules that are over-expressed in different diseases. For example, 18F-FDG is used in conjunction with PET to assess glucose metabolism in the heart, lungs, the brain and several cancer, including lung, breast, colorectal, melanoma, Hodgkin's and non-Hodgkin's lymphoma [1,8,9]. It has also been approved for use in diagnosing Alzheimer's disease. Similarly, several 18F labeled metabolic tracers (e.g., 18F-Choline) and non-metabolic tracers such as 18F labeled Arginine-Glycine-Asparatic acid (RGD) peptide that targets integrin receptor αvβ3, 18F-Fluoroazomycin Arabinoside (FAZA) and 18F-Fluoromisonidazole (FMISO) (tracers that selectively accumulate in hypoxic cells), anti-18F-fluorocyclobutyl-1-carboxylic acid [FACBC] (an amino acid analogue) are in pilot clinical trials [10–16]. A dedicated PET-CT scanner is used to precisely combine the spatial distribution of metabolic or biochemical activity obtained from these PET probes with anatomical information obtained by CT for non-invasive molecular imaging. The current limitations of PET, however, include limited spatial resolution (several mm), relatively high cost, the time consuming nature, and its limited use in endoscopy mode.
New advancements in optical molecular imaging are moving beyond conventional fluorescence imaging. In the last couple of years, Cerenkov luminescence imaging (CLI) has emerged as an active field of research in biomedical community [17–22]. CLI combines the PET probes approved for nuclear medicine applications with optical imaging. Cerenkov light is emitted when charged nuclear particles, such as β+ (positron) or β− (nuclear electron) from radionuclides, travel at superluminal velocity in dielectric medium including biological tissue or water. CLI can be performed with positron and electron emitters, unlike SPECT and PET that depends on gamma (γ) rays and positrons, respectively. Cerenkov light is continuous and occurs mainly in the visible (more intense in the blue) region of the electromagnetic spectrum in the wavelength range of 250–1000 nm. This enables in vivo optical imaging using PET probes administered intravenously and commercially available optical imaging systems with cooled CCD cameras (e.g., IVIS 200 Spectrum, Caliper Life Sciences). We recently demonstrated the feasibility of intraoperative imaging of Cerenkov luminescence for identifying tumors in mice models using a custom made fiber optic system [23]. Similar to conventional optical imaging, however, imaging of internal organs using CLI is challenging and limited by the depth of penetration from strong scattering of Cerenkov light as it propagates through biological tissue. Detection of Cerenkov light through conventional endoscopes may expand potential applications of CLI to common gastrointestinal and urinary tract cancers (e.g. esophageal and bladder) that are primarily managed endoscopically, and significantly expand the utility of the PET probes.
In this work, we investigated whether Cerenkov light can be detected through conventional optical fibers/clinical endoscopes with a sensitive CCD camera. We studied the limits of detection of Cerenkov light emitted from phantom samples containing different concentrations of 18F-FDG using different optical fibers and endoscopes. We further validated the feasibility of detecting Cerenkov light emitted from C6 glioma tumor bearing mice after intravenous administration of 18F-FDG, using an endoscopy imaging system that consists of optical fiber coupled to a CCD camera. Since PET probes have the capability to targeting cancer cells in different regions of the body, the Cerenkov light emitted from these cells can then be detected using conventional endoscopes routinely used in the clinic. Our results support additional investigations of CLI as a promising modality for endoscopic molecular imaging.
#162250 - $15.00 USD Received 30 Jan 2012; revised 7 Apr 2012; accepted 28 Apr 2012; published 3 May 2012(C) 2012 OSA 1 June 2012 / Vol. 3, No. 6 / BIOMEDICAL OPTICS EXPRESS 1217
2. Methods and materials
2.1. Experimental setup
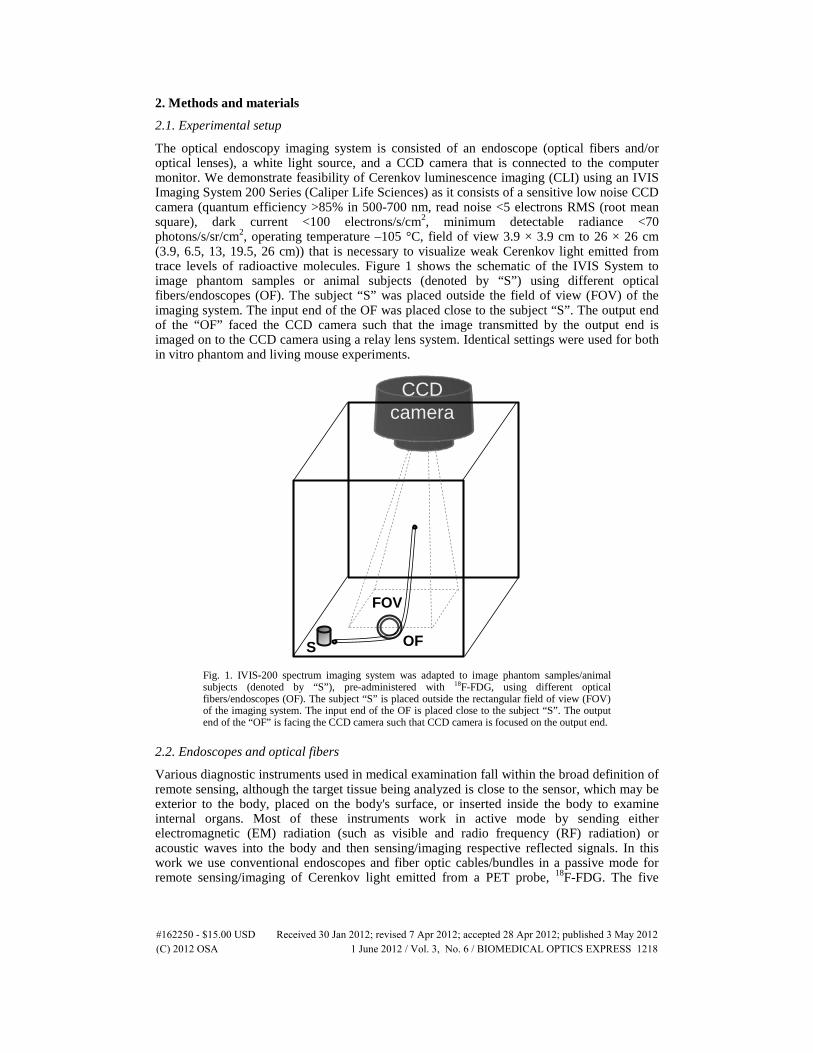
The optical endoscopy imaging system is consisted of an endoscope (optical fibers and/or optical lenses), a white light source, and a CCD camera that is connected to the computer monitor. We demonstrate feasibility of Cerenkov luminescence imaging (CLI) using an IVIS Imaging System 200 Series (Caliper Life Sciences) as it consists of a sensitive low noise CCD camera (quantum efficiency >85% in 500-700 nm, read noise <5 electrons RMS (root mean square), dark current <100 electrons/s/cm2, minimum detectable radiance <70 photons/s/sr/cm2, operating temperature –105 °C, field of view 3.9 × 3.9 cm to 26 × 26 cm (3.9, 6.5, 13, 19.5, 26 cm)) that is necessary to visualize weak Cerenkov light emitted from trace levels of radioactive molecules. Figure 1 shows the schematic of the IVIS System to image phantom samples or animal subjects (denoted by “S”) using different optical fibers/endoscopes (OF). The subject “S” was placed outside the field of view (FOV) of the imaging system. The input end of the OF was placed close to the subject “S”. The output end of the “OF” faced the CCD camera such that the image transmitted by the output end is imaged on to the CCD camera using a relay lens system. Identical settings were used for both in vitro phantom and living mouse experiments.
FOV
S OF
CCDcamera
Fig. 1. IVIS-200 spectrum imaging system was adapted to image phantom samples/animal subjects (denoted by “S”), pre-administered with 18F-FDG, using different optical fibers/endoscopes (OF). The subject “S” is placed outside the rectangular field of view (FOV) of the imaging system. The input end of the OF is placed close to the subject “S”. The output end of the “OF” is facing the CCD camera such that CCD camera is focused on the output end.
2.2. Endoscopes and optical fibers
Various diagnostic instruments used in medical examination fall within the broad definition of remote sensing, although the target tissue being analyzed is close to the sensor, which may be exterior to the body, placed on the body's surface, or inserted inside the body to examine internal organs. Most of these instruments work in active mode by sending either electromagnetic (EM) radiation (such as visible and radio frequency (RF) radiation) or acoustic waves into the body and then sensing/imaging respective reflected signals. In this work we use conventional endoscopes and fiber optic cables/bundles in a passive mode for remote sensing/imaging of Cerenkov light emitted from a PET probe, 18F-FDG. The five
#162250 - $15.00 USD Received 30 Jan 2012; revised 7 Apr 2012; accepted 28 Apr 2012; published 3 May 2012(C) 2012 OSA 1 June 2012 / Vol. 3, No. 6 / BIOMEDICAL OPTICS EXPRESS 1218
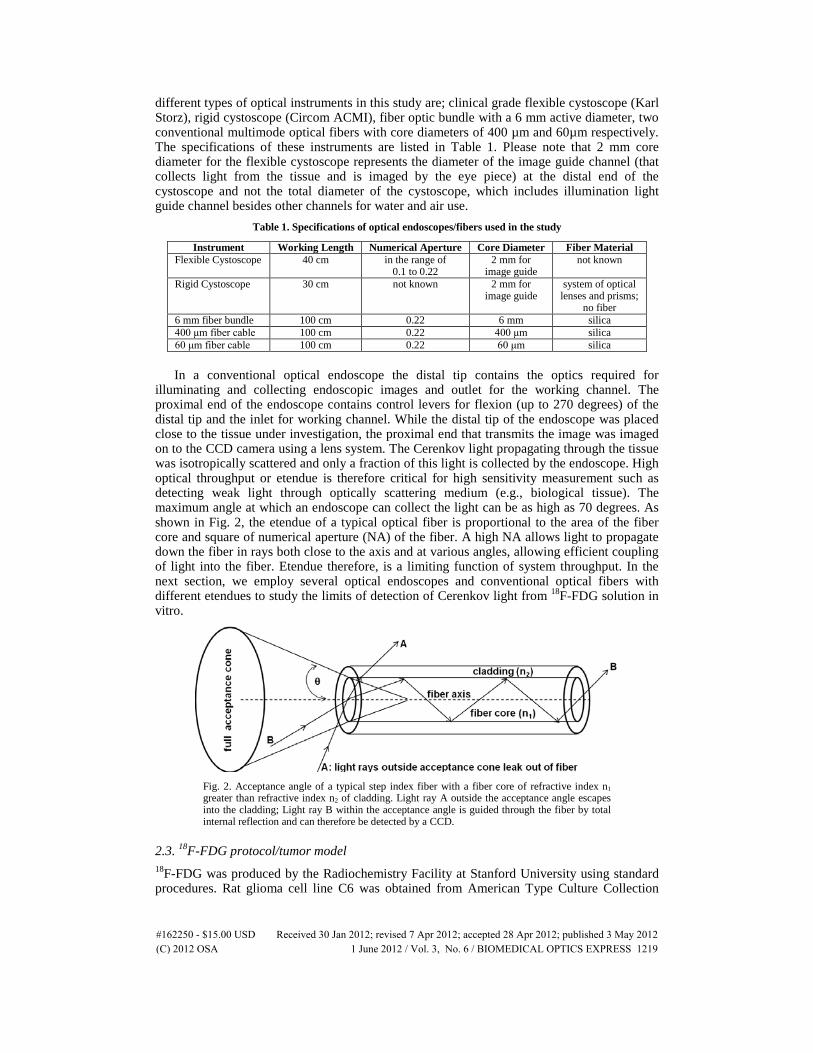
different types of optical instruments in this study are; clinical grade flexible cystoscope (Karl Storz), rigid cystoscope (Circom ACMI), fiber optic bundle with a 6 mm active diameter, two conventional multimode optical fibers with core diameters of 400 µm and 60µm respectively. The specifications of these instruments are listed in Table 1. Please note that 2 mm core diameter for the flexible cystoscope represents the diameter of the image guide channel (that collects light from the tissue and is imaged by the eye piece) at the distal end of the cystoscope and not the total diameter of the cystoscope, which includes illumination light guide channel besides other channels for water and air use.
Table 1. Specifications of optical endoscopes/fibers used in the study
Instrument Working Length Numerical Aperture Core Diameter Fiber Material Flexible Cystoscope 40 cm in the range of
0.1 to 0.22 2 mm for
image guide not known
Rigid Cystoscope 30 cm not known 2 mm for image guide
system of optical lenses and prisms;
no fiber 6 mm fiber bundle 100 cm 0.22 6 mm silica 400 μm fiber cable 100 cm 0.22 400 μm silica 60 μm fiber cable 100 cm 0.22 60 μm silica
In a conventional optical endoscope the distal tip contains the optics required for illuminating and collecting endoscopic images and outlet for the working channel. The proximal end of the endoscope contains control levers for flexion (up to 270 degrees) of the distal tip and the inlet for working channel. While the distal tip of the endoscope was placed close to the tissue under investigation, the proximal end that transmits the image was imaged on to the CCD camera using a lens system. The Cerenkov light propagating through the tissue was isotropically scattered and only a fraction of this light is collected by the endoscope. High optical throughput or etendue is therefore critical for high sensitivity measurement such as detecting weak light through optically scattering medium (e.g., biological tissue). The maximum angle at which an endoscope can collect the light can be as high as 70 degrees. As shown in Fig. 2, the etendue of a typical optical fiber is proportional to the area of the fiber core and square of numerical aperture (NA) of the fiber. A high NA allows light to propagate down the fiber in rays both close to the axis and at various angles, allowing efficient coupling of light into the fiber. Etendue therefore, is a limiting function of system throughput. In the next section, we employ several optical endoscopes and conventional optical fibers with different etendues to study the limits of detection of Cerenkov light from 18F-FDG solution in vitro.
Fig. 2. Acceptance angle of a typical step index fiber with a fiber core of refractive index n1 greater than refractive index n2 of cladding. Light ray A outside the acceptance angle escapes into the cladding; Light ray B within the acceptance angle is guided through the fiber by total internal reflection and can therefore be detected by a CCD.
2.3. 18F-FDG protocol/tumor model 18F-FDG was produced by the Radiochemistry Facility at Stanford University using standard procedures. Rat glioma cell line C6 was obtained from American Type Culture Collection
#162250 - $15.00 USD Received 30 Jan 2012; revised 7 Apr 2012; accepted 28 Apr 2012; published 3 May 2012(C) 2012 OSA 1 June 2012 / Vol. 3, No. 6 / BIOMEDICAL OPTICS EXPRESS 1219
(Manassas, VA). Female athymic nude mice (nu/nu), obtained from Charles River Laboratories, Inc (Cambridge, MA) were at 4-6 weeks of age. A CRC-15R PET dose calibrator (Capintec Inc., Ramseb, NJ) was used for all radioactivity measurements. All animal studies were carried out in compliance with federal and local institutional rules for the conduct of animal experimentation. C6 cells were cultured in DMEM medium supplemented with 10% fetal bovine serum (FBS) and 1% pencillin/streptomycin (Invitrogen Life Technologies, Carlsbad, CA). The cell line was maintained in a humidified atmosphere of 5% CO2 at 37°C, with the medium changed every other day. A 75% confluent monolayer was detached with trypsin and dissociated into a single cell suspension for further cell culture. Approximately 1 × 10⁶ C6 cells suspended in phosphate buffered saline (PBS, 0.1 M, pH = 7.4, Invitrogen, Carlsbad, CA) were implanted subcutaneously in the left flanks of nude mice. Tumors were allowed to grow to a size of 150 to 200 mm3 over 2-3 weeks, and the tumor bearing mice were subjected to in vivo imaging studies. For all in vivo and in vitro studies, radioactive PET probes were diluted in PBS. As shown in Fig. 1, animals (denoted by “S”) were placed in a light-tight chamber under isoflurane anesthesia. For the 18F-FDG imaging study, the mice were fasted overnight prior to the experiment and kept anesthetized during the experiment. For the in vivo imaging study, normal mice or mice bearing C6 glioma tumor were injected with 18F-FDG (34.78-35.89 MBq (940-970 μCi) via tail vein.
3. Results and Discussion
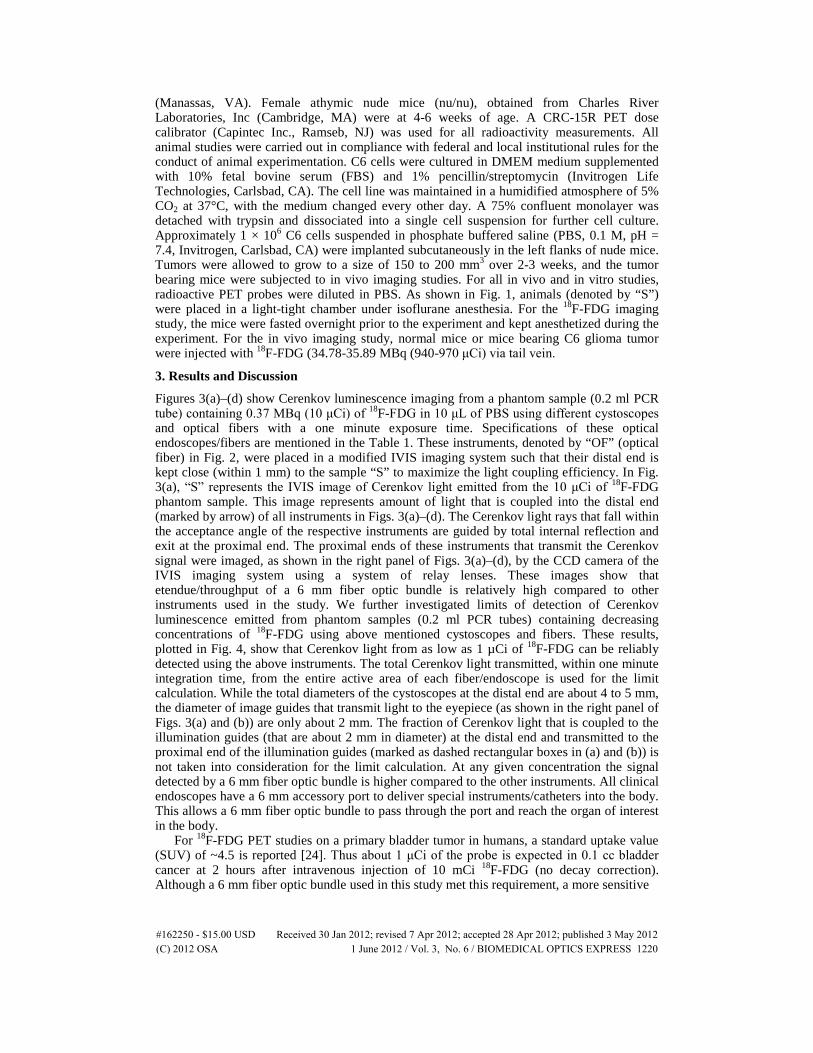
Figures 3(a)–(d) show Cerenkov luminescence imaging from a phantom sample (0.2 ml PCR tube) containing 0.37 MBq (10 μCi) of 18F-FDG in 10 μL of PBS using different cystoscopes and optical fibers with a one minute exposure time. Specifications of these optical endoscopes/fibers are mentioned in the Table 1. These instruments, denoted by “OF” (optical fiber) in Fig. 2, were placed in a modified IVIS imaging system such that their distal end is kept close (within 1 mm) to the sample “S” to maximize the light coupling efficiency. In Fig. 3(a), “S” represents the IVIS image of Cerenkov light emitted from the 10 μCi of 18F-FDG phantom sample. This image represents amount of light that is coupled into the distal end (marked by arrow) of all instruments in Figs. 3(a)–(d). The Cerenkov light rays that fall within the acceptance angle of the respective instruments are guided by total internal reflection and exit at the proximal end. The proximal ends of these instruments that transmit the Cerenkov signal were imaged, as shown in the right panel of Figs. 3(a)–(d), by the CCD camera of the IVIS imaging system using a system of relay lenses. These images show that etendue/throughput of a 6 mm fiber optic bundle is relatively high compared to other instruments used in the study. We further investigated limits of detection of Cerenkov luminescence emitted from phantom samples (0.2 ml PCR tubes) containing decreasing concentrations of 18F-FDG using above mentioned cystoscopes and fibers. These results, plotted in Fig. 4, show that Cerenkov light from as low as 1 µCi of 18F-FDG can be reliably detected using the above instruments. The total Cerenkov light transmitted, within one minute integration time, from the entire active area of each fiber/endoscope is used for the limit calculation. While the total diameters of the cystoscopes at the distal end are about 4 to 5 mm, the diameter of image guides that transmit light to the eyepiece (as shown in the right panel of Figs. 3(a) and (b)) are only about 2 mm. The fraction of Cerenkov light that is coupled to the illumination guides (that are about 2 mm in diameter) at the distal end and transmitted to the proximal end of the illumination guides (marked as dashed rectangular boxes in (a) and (b)) is not taken into consideration for the limit calculation. At any given concentration the signal detected by a 6 mm fiber optic bundle is higher compared to the other instruments. All clinical endoscopes have a 6 mm accessory port to deliver special instruments/catheters into the body. This allows a 6 mm fiber optic bundle to pass through the port and reach the organ of interest in the body.
For 18F-FDG PET studies on a primary bladder tumor in humans, a standard uptake value (SUV) of ~4.5 is reported [24]. Thus about 1 μCi of the probe is expected in 0.1 cc bladder cancer at 2 hours after intravenous injection of 10 mCi 18F-FDG (no decay correction). Although a 6 mm fiber optic bundle used in this study met this requirement, a more sensitive
#162250 - $15.00 USD Received 30 Jan 2012; revised 7 Apr 2012; accepted 28 Apr 2012; published 3 May 2012(C) 2012 OSA 1 June 2012 / Vol. 3, No. 6 / BIOMEDICAL OPTICS EXPRESS 1220
6 mm
400 µm
60 µm
6 mm fiber optic bundle
400 µm/60 µm core diameterfiber optic patch cable
(c)
(d)
Total Flux (a.u)
s(a)
Flexible cystoscope
(b) Rigid cystoscope
Fig. 3. Phantom sample (0.2 ml PCR tube) containing about 10 μCi of 18F-FDG in 10 μL of PBS was imaged using different optical fibers and endoscopes with a one minute exposure time. Arrows in all figures indicate the distal end of the respective instruments which are within 1 mm distance from the phantom sample. The dashed rectangular boxes in (a) and (b) show the white light illumination channels of respective cystoscopes through which also we observed (in absence of the white illumination) the Cerenkov light.
10-110010110210310410
100
1000
10000
100000
1000000 6mm fiber400µm fiber with lens60µm fiberFlexible cystoscopeRigid cystoscope
18F ( kBq )
Tota
l Flu
x (a
.u)
Fig. 4. Detection limits of various optical endoscopes and fibers. Luminescence detected by different fibers as a function of concentration of 18F-FDG with one minute exposure time
#162250 - $15.00 USD Received 30 Jan 2012; revised 7 Apr 2012; accepted 28 Apr 2012; published 3 May 2012(C) 2012 OSA 1 June 2012 / Vol. 3, No. 6 / BIOMEDICAL OPTICS EXPRESS 1221
imaging system using specialty fibers that have high etendue (including high numerical aperture, larger diameter optic bundle, high packing fraction, low reflection and transmission losses) can likely further improve the sensitivity and signal to noise ratio of the imaging system. Improved sensitivity can also be achieved using a radionuclide with a high mean energy beta particle such as 90Y, that produces approximately 15 times stronger signal than 18F-FDG used in the study [18].
From Figs. 3 and 4 we found that that 6 mm fiber bundle performed better compared to other fibers/endoscopes and is a good candidate for our in vivo animal studies. We first quantified the transmission efficiency of the 6 mm fiber optic bundle using two collimated laser sources, a 633 nm He-Ne laser and a 532 nm laser diode. We found that 6 mm fiber bundle has about 50% transmission efficiency at both the wavelengths.
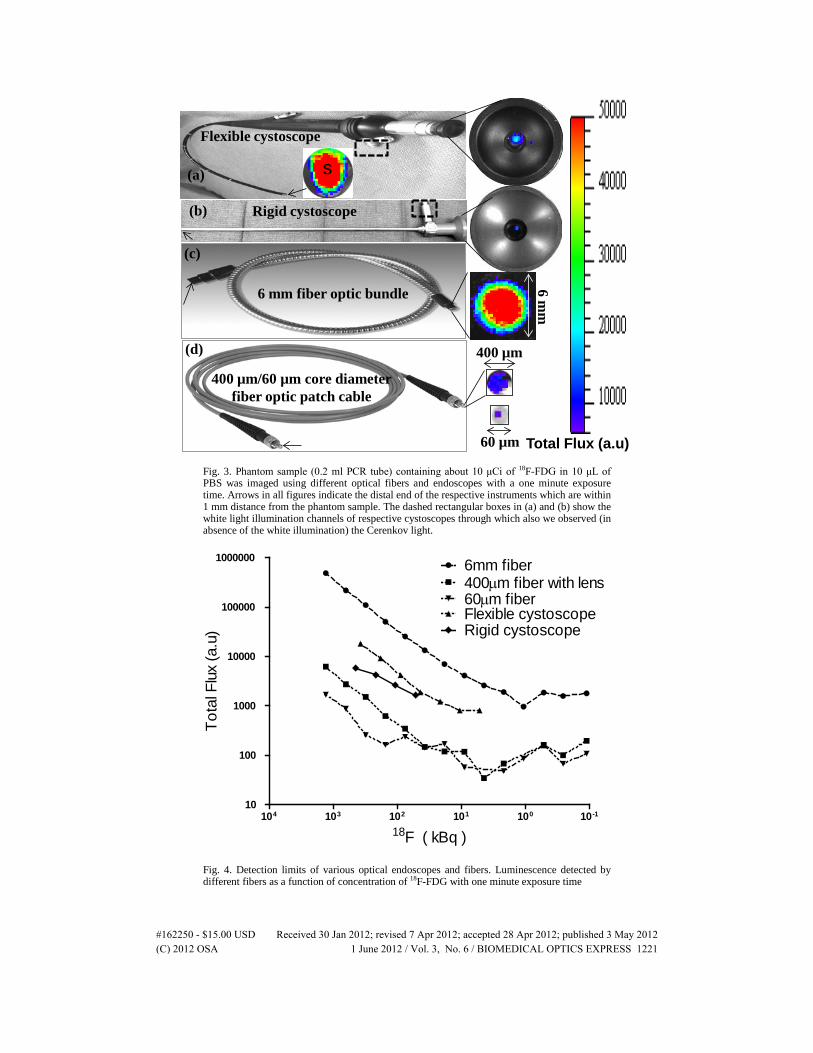
We then studied spectral characteristics and transmission efficiency of Cerenkov light, emitted from 10µCi of 18F-FDG in 10µL solution, transmitted through the 6 mm fiber optic bundle. As shown in the experimental setup in Fig. 1, a 0.2 ml PCR tube containing 10 μCi of 18F-FDG in 10 μL of PBS is placed close (within 1 mm) to the distal end of the fiber to maximize the light coupling efficiency into the fiber.
Our study included blocking the coupling of Cerenkov light into the fiber using a thick black paper (to record gamma scintillation), unblocking by removing the black paper (to record all the luminescence), and also removing the radioactive samples (to measure the background). Three images (total Cerenkov luminescence, background luminescence by inserting black paper, background noise with no radioactivity) were captured at each wavelength using a 20 nm narrow band pass filter, the IVIS imaging system. At the end of the experiment three images were also captured in open filter position of the IVIS imaging system. In Fig. 5, the decay and background corrected Cerenkov luminescence was plotted against wavelength range from 500 nm to 840 nm with a 20 nm step size.
Based on these studies we quantified the contribution of gamma scintillation, when high energy gamma radiation from 18F-FDG radioactive solution is irradiating the 6 mm optical fiber optic bundle, to the total Cerenkov light detected. Our experimental results show that the contribution of gamma scintillation when the radioactive sample is within the field of view of the imaging system and when not in the field of view of the imaging system is about 9.5% and 3% respectively. In addition our results show that background (gamma scintillation) corrected
0
5000
10000
15000
20000
25000
500 520 540 560 580 600 620 640 660 680 700 720 740 760 780 800 820 840
Tota
l Flu
x (a
.u)
Wavelength (nm) Fig. 5. Spectral characteristics of Cerenkov luminescence, emitted from 10µCi of 18F-FDG in 10µL solution, transmitted through the 6mm fiber optic bundle and detected using a narrow band pass filter (20 nm) in the IVIS imaging system with one minute exposure time (decay corrected and also background corrected).
#162250 - $15.00 USD Received 30 Jan 2012; revised 7 Apr 2012; accepted 28 Apr 2012; published 3 May 2012(C) 2012 OSA 1 June 2012 / Vol. 3, No. 6 / BIOMEDICAL OPTICS EXPRESS 1222
Cerenkov light coupling efficiency (from the source to the output end of the fiber bundle) is about 50% in the visible region and about 40% in the near infrared region (720 nm to 840nm). The loss in the transmission efficiency can be attributed to several factors such as, reflection and transmission losses, not being able to transmit light in the spaces between the fibers, low packing fraction, and low numerical aperture.
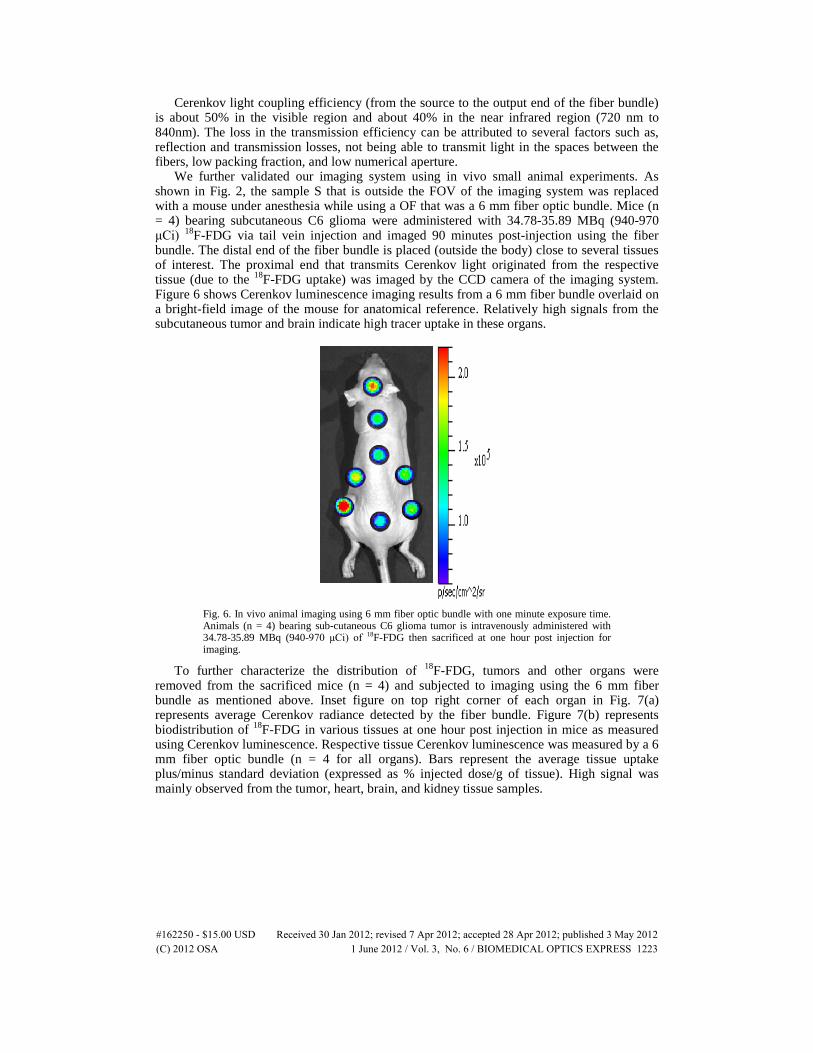
We further validated our imaging system using in vivo small animal experiments. As shown in Fig. 2, the sample S that is outside the FOV of the imaging system was replaced with a mouse under anesthesia while using a OF that was a 6 mm fiber optic bundle. Mice (n = 4) bearing subcutaneous C6 glioma were administered with 34.78-35.89 MBq (940-970 μCi) 18F-FDG via tail vein injection and imaged 90 minutes post-injection using the fiber bundle. The distal end of the fiber bundle is placed (outside the body) close to several tissues of interest. The proximal end that transmits Cerenkov light originated from the respective tissue (due to the 18F-FDG uptake) was imaged by the CCD camera of the imaging system. Figure 6 shows Cerenkov luminescence imaging results from a 6 mm fiber bundle overlaid on a bright-field image of the mouse for anatomical reference. Relatively high signals from the subcutaneous tumor and brain indicate high tracer uptake in these organs.
Fig. 6. In vivo animal imaging using 6 mm fiber optic bundle with one minute exposure time. Animals (n = 4) bearing sub-cutaneous C6 glioma tumor is intravenously administered with 34.78-35.89 MBq (940-970 μCi) of 18F-FDG then sacrificed at one hour post injection for imaging.
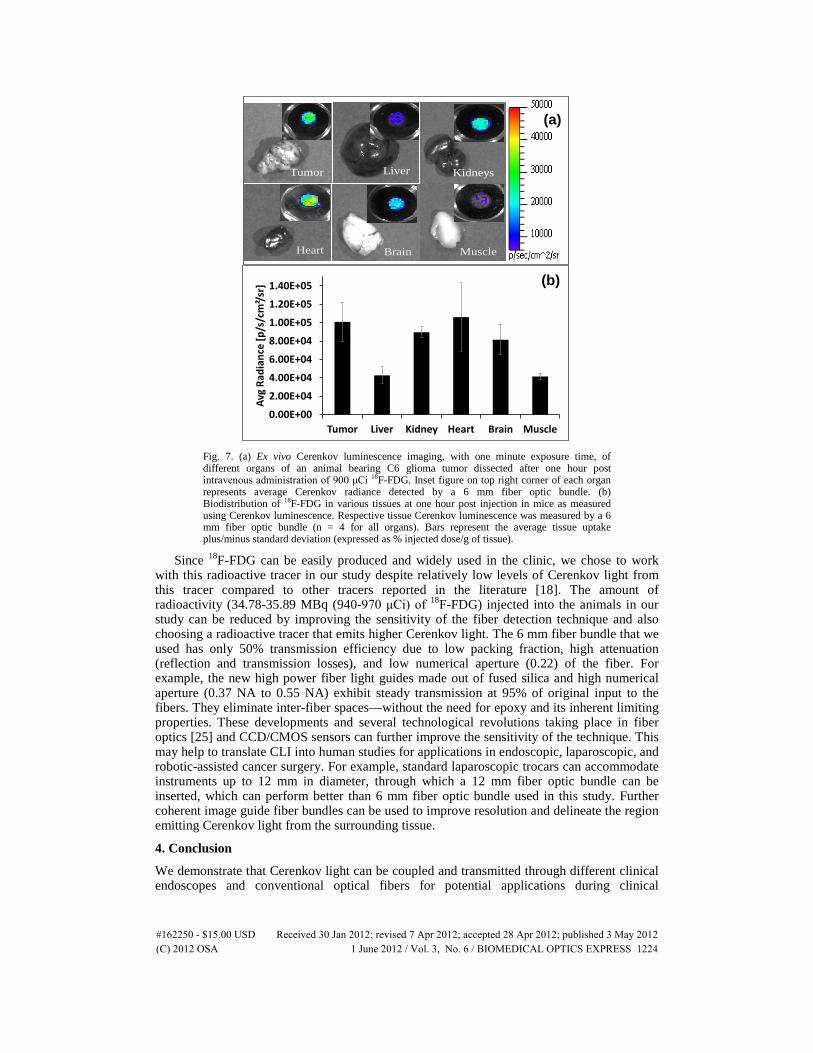
To further characterize the distribution of 18F-FDG, tumors and other organs were removed from the sacrificed mice (n = 4) and subjected to imaging using the 6 mm fiber bundle as mentioned above. Inset figure on top right corner of each organ in Fig. 7(a) represents average Cerenkov radiance detected by the fiber bundle. Figure 7(b) represents biodistribution of 18F-FDG in various tissues at one hour post injection in mice as measured using Cerenkov luminescence. Respective tissue Cerenkov luminescence was measured by a 6 mm fiber optic bundle (n = 4 for all organs). Bars represent the average tissue uptake plus/minus standard deviation (expressed as % injected dose/g of tissue). High signal was mainly observed from the tumor, heart, brain, and kidney tissue samples.
#162250 - $15.00 USD Received 30 Jan 2012; revised 7 Apr 2012; accepted 28 Apr 2012; published 3 May 2012(C) 2012 OSA 1 June 2012 / Vol. 3, No. 6 / BIOMEDICAL OPTICS EXPRESS 1223
Tumor Liver Kidneys
Heart Brain Muscle
(a)
0.00E+00
2.00E+04
4.00E+04
6.00E+04
8.00E+04
1.00E+05
1.20E+05
1.40E+05
Tumor Liver Kidney Heart Brain Muscle
Avg
Radi
ance
[p/s
/cm
²/sr]
(b)
Fig. 7. (a) Ex vivo Cerenkov luminescence imaging, with one minute exposure time, of different organs of an animal bearing C6 glioma tumor dissected after one hour post intravenous administration of 900 μCi 18F-FDG. Inset figure on top right corner of each organ represents average Cerenkov radiance detected by a 6 mm fiber optic bundle. (b) Biodistribution of 18F-FDG in various tissues at one hour post injection in mice as measured using Cerenkov luminescence. Respective tissue Cerenkov luminescence was measured by a 6 mm fiber optic bundle (n = 4 for all organs). Bars represent the average tissue uptake plus/minus standard deviation (expressed as % injected dose/g of tissue).
Since 18F-FDG can be easily produced and widely used in the clinic, we chose to work with this radioactive tracer in our study despite relatively low levels of Cerenkov light from this tracer compared to other tracers reported in the literature [18]. The amount of radioactivity (34.78-35.89 MBq (940-970 μCi) of 18F-FDG) injected into the animals in our study can be reduced by improving the sensitivity of the fiber detection technique and also choosing a radioactive tracer that emits higher Cerenkov light. The 6 mm fiber bundle that we used has only 50% transmission efficiency due to low packing fraction, high attenuation (reflection and transmission losses), and low numerical aperture (0.22) of the fiber. For example, the new high power fiber light guides made out of fused silica and high numerical aperture (0.37 NA to 0.55 NA) exhibit steady transmission at 95% of original input to the fibers. They eliminate inter-fiber spaces—without the need for epoxy and its inherent limiting properties. These developments and several technological revolutions taking place in fiber optics [25] and CCD/CMOS sensors can further improve the sensitivity of the technique. This may help to translate CLI into human studies for applications in endoscopic, laparoscopic, and robotic-assisted cancer surgery. For example, standard laparoscopic trocars can accommodate instruments up to 12 mm in diameter, through which a 12 mm fiber optic bundle can be inserted, which can perform better than 6 mm fiber optic bundle used in this study. Further coherent image guide fiber bundles can be used to improve resolution and delineate the region emitting Cerenkov light from the surrounding tissue.
4. Conclusion
We demonstrate that Cerenkov light can be coupled and transmitted through different clinical endoscopes and conventional optical fibers for potential applications during clinical
#162250 - $15.00 USD Received 30 Jan 2012; revised 7 Apr 2012; accepted 28 Apr 2012; published 3 May 2012(C) 2012 OSA 1 June 2012 / Vol. 3, No. 6 / BIOMEDICAL OPTICS EXPRESS 1224
endoscopy. Our results show that coupling and transmission efficiency increases with an increase in the etendue of the endoscope/optical fiber. Cerenkov light from as low as 1 μCi of radioactivity emitted from 18F-FDG was reliably detected using a 6 mm fiber optic bundle. The feasibility of Cerenkov luminescence imaging using a 6 mm fiber was demonstrated by non-invasive in vivo imaging of mice bearing C6 glioma with intravenous 18F-FDG. Cerenkov light emitted from the tumor and other organs of the mouse were detected one hour post-injection, with higher tumor uptake of 18F-FDG compared to the surrounding tissue. We further validated our in-vivo results with respective ex-vivo imaging of different organs. Our promising results support future investigations of endoscopic molecular imaging based on Cerenkov luminescence.
Acknowledgments
Dr. Kothapalli would like to thank The Sir Peter and Lady Michael Foundation for the Hamalainen Pelican Postdoctoral Fellowship. We would also like to thank partial funding support from the Canary Foundation (S. S. G.), the Ben and Catherine Ivy Foundation (S. S. G.), the NCI ICMIC P50 CA114747 (S. S. G.), and NCI CCNE-T U54 U54CA151459 (S. S. G.), R01 CA160986 (J. C. L.), National Cancer Institute (NCI) R01 CA128908 (Z. C.).
#162250 - $15.00 USD Received 30 Jan 2012; revised 7 Apr 2012; accepted 28 Apr 2012; published 3 May 2012(C) 2012 OSA 1 June 2012 / Vol. 3, No. 6 / BIOMEDICAL OPTICS EXPRESS 1225