Embed Size (px)
Citation preview
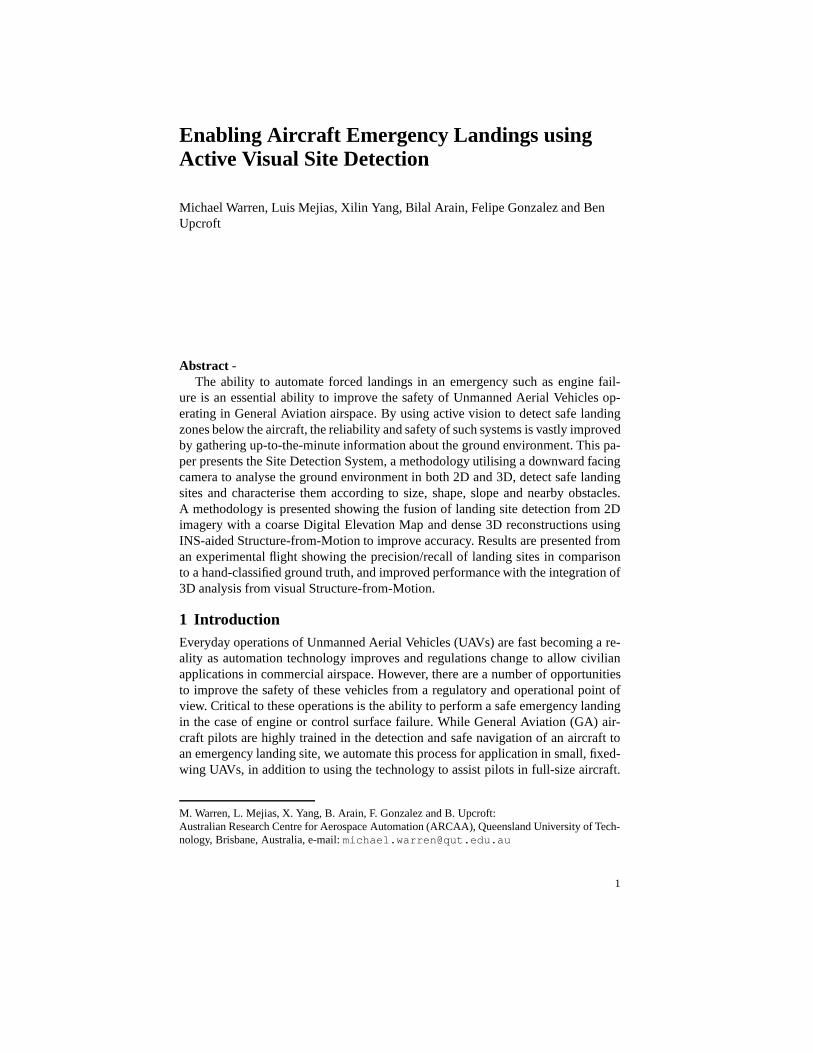
Enabling Aircraft Emergency Landings usingActive Visual Site Detection
Michael Warren, Luis Mejias, Xilin Yang, Bilal Arain, Felipe Gonzalez and BenUpcroft
Abstract -The ability to automate forced landings in an emergency suchas engine fail-
ure is an essential ability to improve the safety of UnmannedAerial Vehicles op-erating in General Aviation airspace. By using active vision to detect safe landingzones below the aircraft, the reliability and safety of suchsystems is vastly improvedby gathering up-to-the-minute information about the ground environment. This pa-per presents the Site Detection System, a methodology utilising a downward facingcamera to analyse the ground environment in both 2D and 3D, detect safe landingsites and characterise them according to size, shape, slopeand nearby obstacles.A methodology is presented showing the fusion of landing site detection from 2Dimagery with a coarse Digital Elevation Map and dense 3D reconstructions usingINS-aided Structure-from-Motion to improve accuracy. Results are presented froman experimental flight showing the precision/recall of landing sites in comparisonto a hand-classified ground truth, and improved performancewith the integration of3D analysis from visual Structure-from-Motion.
1 IntroductionEveryday operations of Unmanned Aerial Vehicles (UAVs) arefast becoming a re-ality as automation technology improves and regulations change to allow civilianapplications in commercial airspace. However, there are a number of opportunitiesto improve the safety of these vehicles from a regulatory andoperational point ofview. Critical to these operations is the ability to performa safe emergency landingin the case of engine or control surface failure. While General Aviation (GA) air-craft pilots are highly trained in the detection and safe navigation of an aircraft toan emergency landing site, we automate this process for application in small, fixed-wing UAVs, in addition to using the technology to assist pilots in full-size aircraft.
M. Warren, L. Mejias, X. Yang, B. Arain, F. Gonzalez and B. Upcroft:Australian Research Centre for Aerospace Automation (ARCAA), Queensland University of Tech-nology, Brisbane, Australia, e-mail:[email protected]
1
2 Authors Suppressed Due to Excessive Length
Through the use of an on-board, self-contained system that uses a downward facingcamera, we apply visual classification and 3D reconstruction of the environment be-low the aircraft to automatically detect suitable landing sites under the flight path.Using this information, the system will plan suitable approach trajectories to landthe aircraft safely without significantly damaging the system, and more importantly,not adversely impact on people or property on the ground.
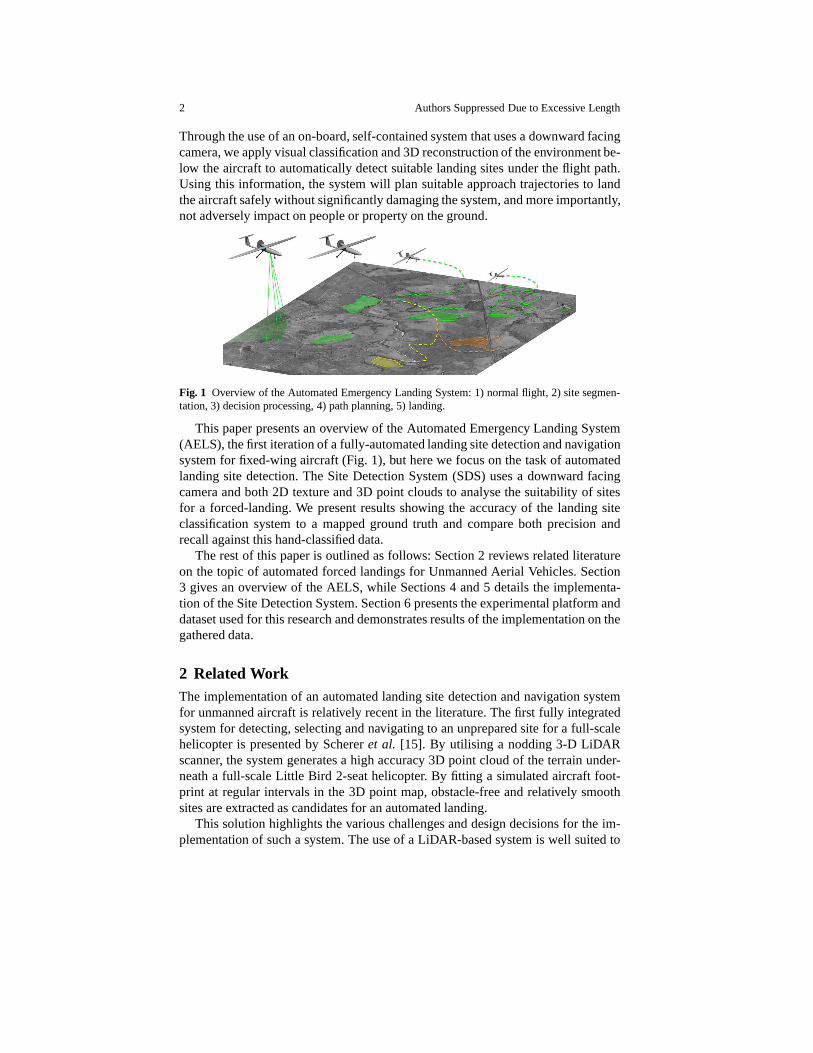
Fig. 1 Overview of the Automated Emergency Landing System: 1) normal flight, 2) site segmen-tation, 3) decision processing, 4) path planning, 5) landing.
This paper presents an overview of the Automated Emergency Landing System(AELS), the first iteration of a fully-automated landing site detection and navigationsystem for fixed-wing aircraft (Fig. 1), but here we focus on the task of automatedlanding site detection. The Site Detection System (SDS) uses a downward facingcamera and both 2D texture and 3D point clouds to analyse the suitability of sitesfor a forced-landing. We present results showing the accuracy of the landing siteclassification system to a mapped ground truth and compare both precision andrecall against this hand-classified data.
The rest of this paper is outlined as follows: Section 2 reviews related literatureon the topic of automated forced landings for Unmanned Aerial Vehicles. Section3 gives an overview of the AELS, while Sections 4 and 5 detailsthe implementa-tion of the Site Detection System. Section 6 presents the experimental platform anddataset used for this research and demonstrates results of the implementation on thegathered data.
2 Related WorkThe implementation of an automated landing site detection and navigation systemfor unmanned aircraft is relatively recent in the literature. The first fully integratedsystem for detecting, selecting and navigating to an unprepared site for a full-scalehelicopter is presented by Schereret al. [15]. By utilising a nodding 3-D LiDARscanner, the system generates a high accuracy 3D point cloudof the terrain under-neath a full-scale Little Bird 2-seat helicopter. By fittinga simulated aircraft foot-print at regular intervals in the 3D point map, obstacle-free and relatively smoothsites are extracted as candidates for an automated landing.
This solution highlights the various challenges and designdecisions for the im-plementation of such a system. The use of a LiDAR-based system is well suited to
Enabling Aircraft Emergency Landings using Active Visual Site Detection 3
a GA aircraft due to their carrying capacity, relative cost of the platform and poweravailability, but such systems are not suited to smaller Unmanned Aircraft for thesesame reasons. Instead, we focus on the use of downward facingvision to perform 3Dreconstruction and classification. In this context, visionis not range limited (in nor-mal Visual Meteorological Conditions [VMC]) and is suitably cheap and low-massfor application in UAVs as small as 5kg. Since many of these low-mass UAVs arerestricted to the same VMC restrictions as many GA pilots, there is no significantloss of ability in normal operations through the choice of a visual sensor. However,the use of vision from such high altitudes presents a number of challenges, particu-larly in terms of 3D reconstruction using Structure-from-Motion (SfM) and accurateground classification to assess suitability.
Johnsonet al. [6] present an alternative implementation that uses SfM to recon-struct the area under a small, unmanned rotorcraft to assesssuitability and executea safe landing of the vehicle. Yuet al. perform a similar task [21]. However, the air-craft in these experiments are flying at a relatively low altitude (a few tens of metres)and only use image pairs for the reconstruction task. Use of this stereo triangulationmethod is prone to degeneracy and unreliable at the high altitudes (500− 5000 ftAbove Ground Level [AGL]) at which we intend to operate the system due to pla-narity of the ground and the extremely large temporal baseline required.
As the first stage of detection of potential landing sites, the SDS includes a2D candidate identifier based on canny-edge detection, which forms a significantcomponent of a 2D binary landing site classifier already presented in the literature[11, 10]. The use of texture analysis and contrast descriptors to identify suitablelanding areas has also been used by Garcia-Pardoet al. [4]. However, this approachcannot enable decision making due to its inability to detectmultiple landing sites.Recently, a similar detection approach intended to aid pilots in decision making hasbeen proposed by Shenet al. [16]. This approach has limited applicability at thispoint since it has only been tested using synthetic images from Google Earth®.
The lack of 3D information in these algorithms partially motivates the approachdeveloped here. We extend the previous 2D classification methodology to integratepotentially noisy observations into a probabilistic representation of the ground DEMand identify strong landing site candidates. This representation is then used as aprior to trigger evaluation of the visual data in 3D (a potentially costly exercise).This allows the system to corroborate or challenge the 2D classifier’s output as wellas gain a finer resolution that can determine obstacles such as trees and individualbuildings from high altitudes.
SfM is a well studied area of research, with a large sum of literature on the topicin recent years [14, 3]. By tracking features between cameraframes with overlap-ping views, a 3D model of the scene structure and camera pose can be extracted. Ascomputational speed improves and algorithms become more efficient, near real-timeimplementations of SfM and Visual Odometry (VO) are now in the literature [7, 12]and can perform online on commodity hardware for small workspaces.
Typically, SfM is applied on ground-vehicles as a form of VO [8, 2], and the pointclouds generated are often used in obstacle avoidance and navigation tasks [13]. VOhas also been applied in selected airborne applications[20]. More specialised, high
4 Authors Suppressed Due to Excessive Length
altitude applications of VO, however, presents additionalchallenges. Accurate VOrelies on triangulation from spatially separated cameras to achieve robust estimationof 3D structure, meaning a reliance on aircraft movement to achieve accuracy, andtriangulation performance decreases quadratically with distance, a difficulty at thealtitudes in which we intend the system to operate. Additionally, degeneracies oc-cur when looking at planar structure, an oft-encountered scenario when using visionfrom high altitude. However, VO has been successfully applied in airborne applica-tions [18, 17, 19] by taking into account many of these factors.
For the SDS, our interest is the mapping output of a VO system:a dense 3Dpoint cloud capable of discriminating obstacles and flat surfaces that are otherwiseambiguous or indiscernible from a 2D image. While SfM provides a sparse 3Dcloud, at the altitude range we intend for the system to operate, we employ densermapping using high-resolution depth maps and the integration of this data into a 3Dmesh using Poisson reconstruction [5].
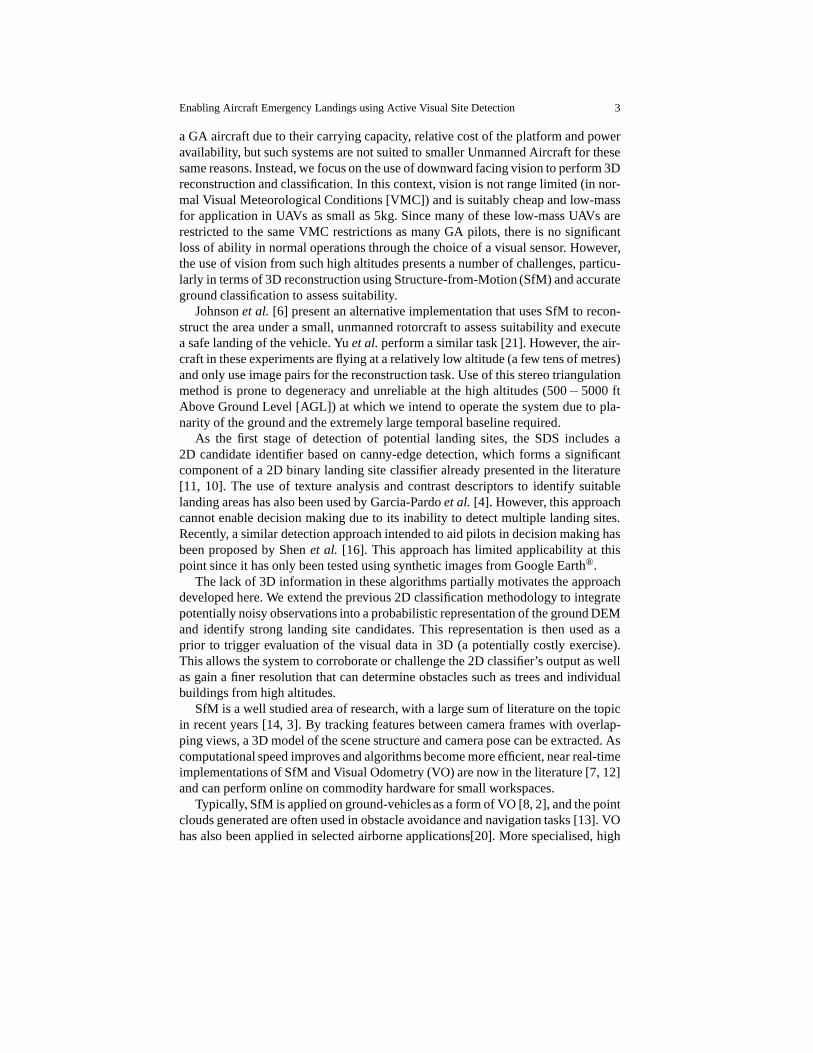
Fig. 2 An overview of the AELS and its components
3 System Overview
The AELS (Fig. 2) has four major components:
1. The Fault Detection System (FDS), an automated system fordetection of inflight failure modes.
2. The Site Detection System (SDS), a system for detecting and characterisingfeasible landing sites below the aircraft, the focus of thispaper.
3. The Multi-Criteria Decision Maker (MCDM), a continuous estimator that choosesfeasible landing sites based on certain criteria such as terrain ruggedness, slopeand obstacles as well as wind direction/speed in preparation for an emergency.
4. The Guidance Navigation and Control (GNC) system, for planning and navigat-ing the aircraft to a safe aim point in preparation for a final landing manoeuvre.
Each operates in a loose hierarchy between sensing a failureand navigating to a safelanding location.
This paper focuses on the Site Detection System (SDS) as the primary methodof providing landing site candidates to the higher level decision making and guid-ance algorithms. Using on-board sensing and prior information such as satellite andDEM data, the SDS is required to detect landing sites on the ground that meet min-
Enabling Aircraft Emergency Landings using Active Visual Site Detection 5
imum criteria of size, slope, variance and proximity to obstacles such as trees andbuildings.
The SDS currently consists of three major components:
1. A binary classification algorithm that operates on purely2D data, classifyingthe pixels of each image intosafe or not-safe based on derivative and intensitymeasures, and
2. A world model that incorporates a terrain ruggedness prior and 2D image ob-servations into a Bayesian model by projecting the observedclassification ofsafe/not-safe from the image onto the world plane, accounting for altitudedif-ferences in the terrain.
3. A dense 3D reconstruction algorithm that leverages Poisson reconstruction toassess potential landing sites for suitability in relationto ground variance, ob-stacles and slope.
The major components of the SDS can be seen in Figs. 4 and 6. Themap is initiallysplit into small segments of 100m2 and the initial probability ofsafe establishedfrom a-priori data. The 2D classifier detects candidate landing sites in the imagebefore projecting these observations into the world plane (Fig. 4). Once a contiguouslanding site is established that meets minimum size and probability requirements,an SfM routine uses the imagery to construct a dense 3D surface model to refineand check the estimate (Fig. 6). From this model, the surfacenormals are used todetermine relatively flat and non-flat areas and segment potential obstacles from theworld plane (Fig 11). We describe these modules in more detail in the followingsections.
4 2D Landing Site Pre-Classifier
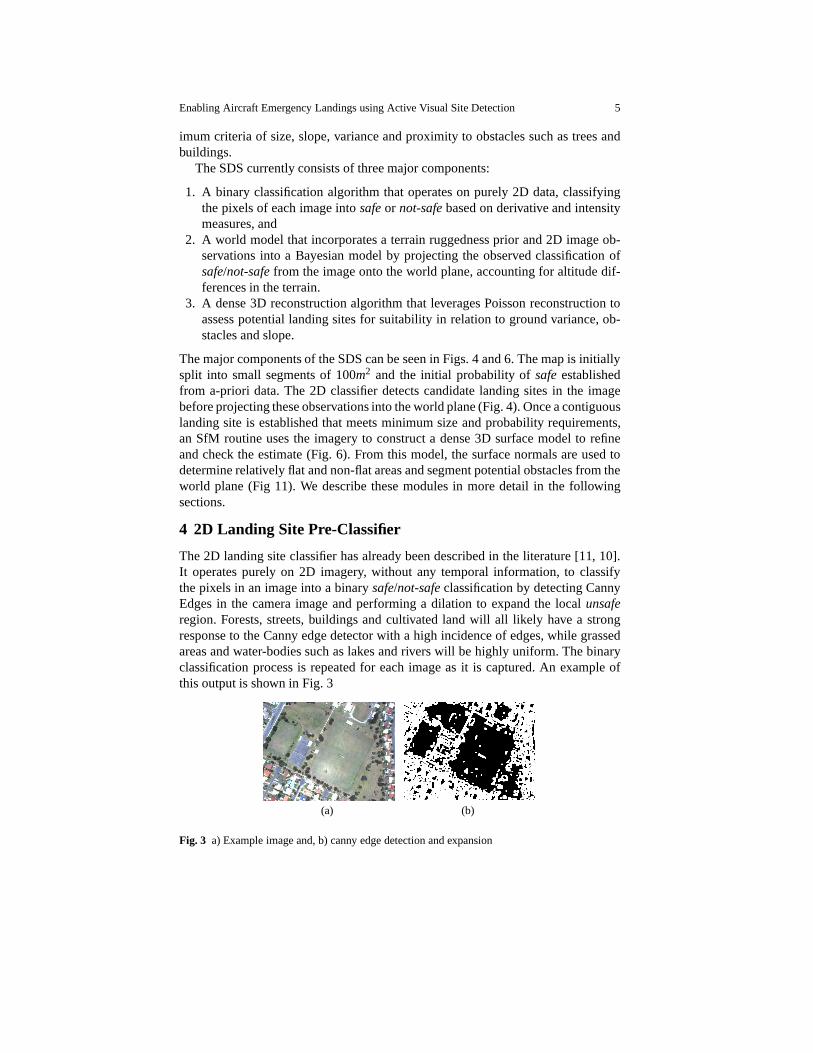
The 2D landing site classifier has already been described in the literature [11, 10].It operates purely on 2D imagery, without any temporal information, to classifythe pixels in an image into a binarysafe/not-safe classification by detecting CannyEdges in the camera image and performing a dilation to expandthe localunsaferegion. Forests, streets, buildings and cultivated land will all likely have a strongresponse to the Canny edge detector with a high incidence of edges, while grassedareas and water-bodies such as lakes and rivers will be highly uniform. The binaryclassification process is repeated for each image as it is captured. An example ofthis output is shown in Fig. 3
(a) (b)
Fig. 3 a) Example image and, b) canny edge detection and expansion
6 Authors Suppressed Due to Excessive Length
4.1 Bayesian World Model
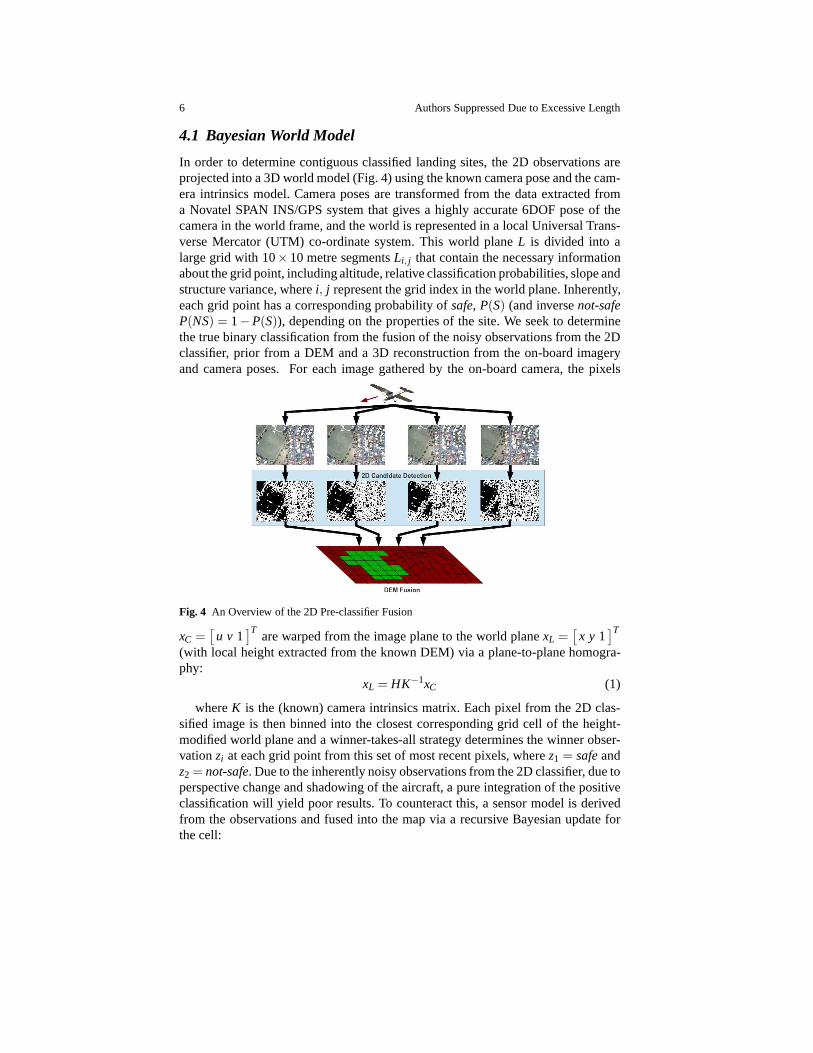
In order to determine contiguous classified landing sites, the 2D observations areprojected into a 3D world model (Fig. 4) using the known camera pose and the cam-era intrinsics model. Camera poses are transformed from thedata extracted froma Novatel SPAN INS/GPS system that gives a highly accurate 6DOF pose of thecamera in the world frame, and the world is represented in a local Universal Trans-verse Mercator (UTM) co-ordinate system. This world planeL is divided into alarge grid with 10×10 metre segmentsLi, j that contain the necessary informationabout the grid point, including altitude, relative classification probabilities, slope andstructure variance, wherei, j represent the grid index in the world plane. Inherently,each grid point has a corresponding probability ofsafe, P(S) (and inversenot-safeP(NS) = 1−P(S)), depending on the properties of the site. We seek to determinethe true binary classification from the fusion of the noisy observations from the 2Dclassifier, prior from a DEM and a 3D reconstruction from the on-board imageryand camera poses. For each image gathered by the on-board camera, the pixels
Fig. 4 An Overview of the 2D Pre-classifier Fusion
xC =[
u v 1]T
are warped from the image plane to the world planexL =[
x y 1]T
(with local height extracted from the known DEM) via a plane-to-plane homogra-phy:
xL = HK−1xC (1)
whereK is the (known) camera intrinsics matrix. Each pixel from the2D clas-sified image is then binned into the closest corresponding grid cell of the height-modified world plane and a winner-takes-all strategy determines the winner obser-vationzi at each grid point from this set of most recent pixels, wherez1 = safe andz2 = not-safe. Due to the inherently noisy observations from the 2D classifier, due toperspective change and shadowing of the aircraft, a pure integration of the positiveclassification will yield poor results. To counteract this,a sensor model is derivedfrom the observations and fused into the map via a recursive Bayesian update forthe cell:
Enabling Aircraft Emergency Landings using Active Visual Site Detection 7
P(S)k+1 = αP(zi|x j)P(S)k (2)
P(NS)k+1 = α(1−P(zi|x j))P(NS)k (3)
where we defineα as a normalising constant. Each grid-cell or site can be given auniform priorP(S) = 0.5 or, alternatively, a prior from an external set of data. Sinceeach grid-point that is observed is typically observed up to20 times due to aircraftspeed, altitude and frame-rate, a close to uniform sensor model describingP(zi|x j) isused to determine the probability ofsafe to counteract the potentially noisy outputof the 2D classifier. From empirical evaluation, we derive the sensor observationmodel asP(z1|x1) = 0.52 andP(z2|x2) = 0.51. Once a grid-point leaves the set ofvisible points, it can then be finally classified as binarysafe/not-safe depending onwhether the probability exceeds an empirically chosen threshold (P(S) > T ). Weexplore the selection of this minimum threshold in the results.
4.2 Terrain Ruggedness: Generating a Classification Prior
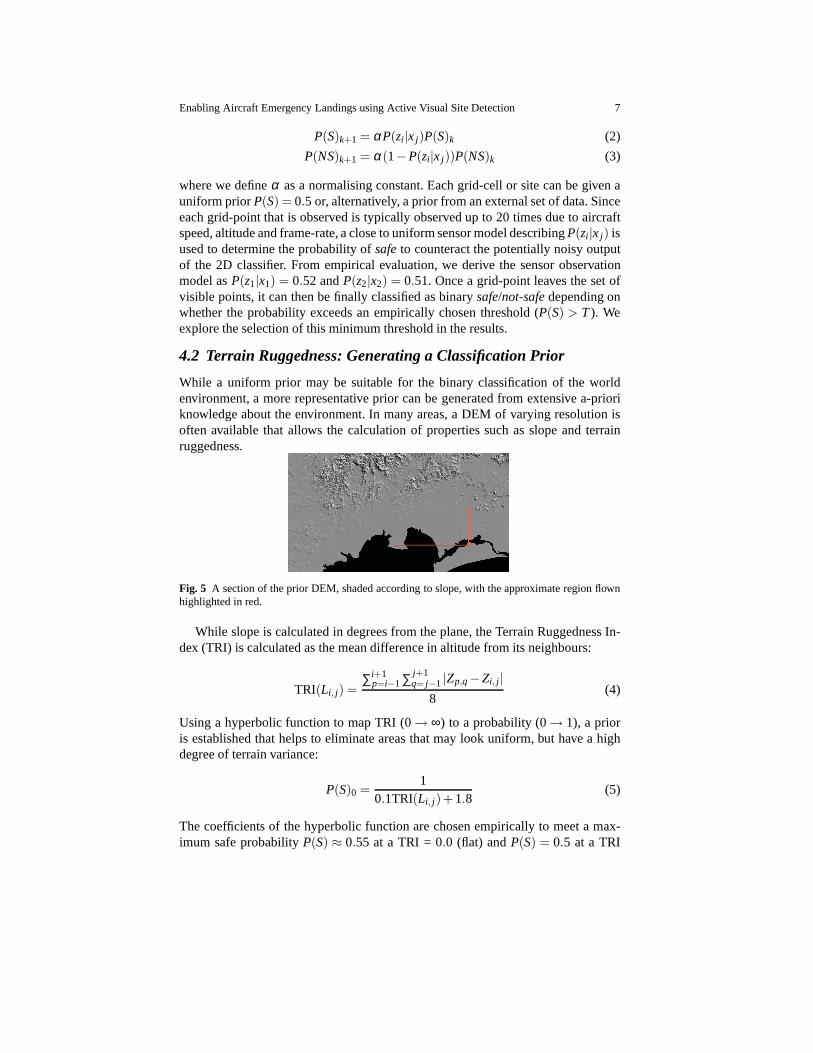
While a uniform prior may be suitable for the binary classification of the worldenvironment, a more representative prior can be generated from extensive a-prioriknowledge about the environment. In many areas, a DEM of varying resolution isoften available that allows the calculation of properties such as slope and terrainruggedness.
Fig. 5 A section of the prior DEM, shaded according to slope, with the approximate region flownhighlighted in red.
While slope is calculated in degrees from the plane, the Terrain Ruggedness In-dex (TRI) is calculated as the mean difference in altitude from its neighbours:
TRI(Li, j) =∑i+1
p=i−1∑ j+1q= j−1 |Zp,q −Zi, j|
8(4)
Using a hyperbolic function to map TRI (0→ ∞) to a probability (0→ 1), a prioris established that helps to eliminate areas that may look uniform, but have a highdegree of terrain variance:
P(S)0 =1
0.1TRI(Li, j)+1.8(5)
The coefficients of the hyperbolic function are chosen empirically to meet a max-imum safe probabilityP(S) ≈ 0.55 at a TRI = 0.0 (flat) andP(S) = 0.5 at a TRI
8 Authors Suppressed Due to Excessive Length
of 4.0, corresponding to a mean variation of 0.5m on a 25m resolution DEM. Weimplement this prior to take into account that, in some cases, heavily forested areasmay look uniform from a 2D perspective but contain a high degree of ruggedness.Alternatively, farmed land may also look uniform, but subject to a high degree ofslope. A non-uniform prior helps to down-weight these particular observations andestablish a better model ofsafe terrain.
In addition, knowledge of areas covered by water bodies is a useful output ofsuch a prior, and can be easily included in the world model. Given that coastlinesdo not change significantly over long periods, this is an extremely strong prior thatassists where an on-board sensor will likely fail to successfully classify a site due tothe non-static nature of the scene. Hence, areas known to be water in the DEM aregiven asafe classification with probabilityP(S) = 1.0.
However, despite the assistance of such a set of priors, manyagricultural areascan change: forests can be cleared and fields replanted with trees. While a DEM cangive broad scale knowledge of terrain, it does not give up-to-the-minute knowledgeabout land-use changes that is available from using an on-board sensor. It is forthis reason we include an active sensor, in addition to it’s ability to increase modelprecision.
5 3D Landing Site Classification
While the 2D classifier can infer the suitability of a landingsite to a large degree, asignificant amount of fine information is lost, and many areasof land that are suit-able for a forced landing do not necessarily respond appropriately to a canny edgeclassifier. By performing 3D analysis on a candidate site, local obstacles, terrainsmoothness and other data about the 3D environment can be better determined toa higher resolution than both the DEM and 2D classifier. This,however, can comeat high cost: a fully-featured SfM routine is computationally expensive on limitedhardware suited to deployment on a small UAV, particularly in relation to the dense3D reconstructions required for 3D analysis. For these reasons, we trigger the 3Danalysis only when certain criteria are met: thesafe classification for a set of gridpoints must exceed a minimum probability of 80%, and they must lie in a contiguousarea of minimum size. While this area may vary depending on the aircraft, we seta minimum contiguous area of 2000m2 to suit the test aircraft, a full-scale Cessna172.
The 3D reconstruction routine follows a standard Structure-from-Motionpipeline,with some modifications. Once a contiguous area is recognised from the 2D clas-sifier, those camera frames that observe the candidate site are flagged for the SfMpipeline (as poses and views are already known to a high degree of accuracy). Toreduce complexity, frames are subsampled from the incomingstream at about 5Hz.Additionally, instead of a structure based pose update, poses are extracted directlyfrom the INS solution to give an accurate estimate of pose in the world frame with-out requiring scale or other transforms to align the poses. SURF [1] features aretracked between frames and initial structure triangulatedbetween matched features.To account for any triangulation and pose errors, a monocular bundle adjustment isapplied to the set of flagged frames.
Enabling Aircraft Emergency Landings using Active Visual Site Detection 9
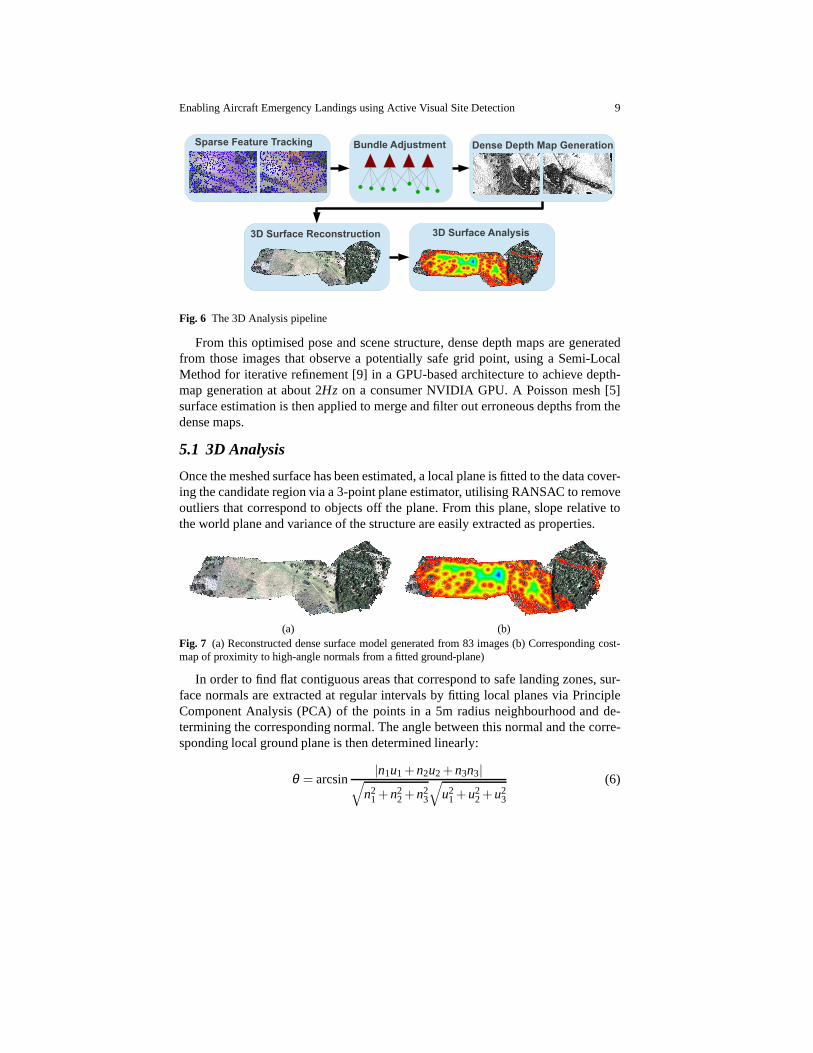
Fig. 6 The 3D Analysis pipeline
From this optimised pose and scene structure, dense depth maps are generatedfrom those images that observe a potentially safe grid point, using a Semi-LocalMethod for iterative refinement [9] in a GPU-based architecture to achieve depth-map generation at about 2Hz on a consumer NVIDIA GPU. A Poisson mesh [5]surface estimation is then applied to merge and filter out erroneous depths from thedense maps.
5.1 3D Analysis
Once the meshed surface has been estimated, a local plane is fitted to the data cover-ing the candidate region via a 3-point plane estimator, utilising RANSAC to removeoutliers that correspond to objects off the plane. From thisplane, slope relative tothe world plane and variance of the structure are easily extracted as properties.
(a) (b)Fig. 7 (a) Reconstructed dense surface model generated from 83 images (b) Corresponding cost-map of proximity to high-angle normals from a fitted ground-plane)
In order to find flat contiguous areas that correspond to safe landing zones, sur-face normals are extracted at regular intervals by fitting local planes via PrincipleComponent Analysis (PCA) of the points in a 5m radius neighbourhood and de-termining the corresponding normal. The angle between thisnormal and the corre-sponding local ground plane is then determined linearly:
θ = arcsin|n1u1 + n2u2 + n3n3|
√
n21 + n2
2+ n23
√
u21 + u2
2+ u23
(6)
10 Authors Suppressed Due to Excessive Length
whereu = [u1,u2,u3,1], n = [n1,n2,n3,1] correspond to the plane coefficients ofthe local normal and fitted ground plane respectively, andθ is the relative anglebetween the normal and the fitted ground plane.
The surface is then classified intosafe andnot-safe via the gathered properties:if the surface point diverges from the plane by more than 5m orthe surface normalangleθ is less than 80◦, the point is considered as not corresponding to the localplane and flagged asnot-safe. From this analysis, contiguous regions classified assafe are extracted by a nearest-neighbour search expansion. These contiguous areasare then mapped into the 10×10m world grid and classified assafe.
For fixed-wing aircraft, landing sites must meet certain minimum criteria relatedto their width and breadth. In most cases, their length must far exceed their width.For this reason, a 2 dimensional mask that corresponds to theminimum safe landingfootprint for the aircraft is applied to the classified worldgrid to find these zones.
In addition, for an upstream control algorithm, the plannermust plan a path thatapproaches the landing site with the maximal length. Principle Component Analysis(PCA) is again used to determine the dominant angle from which to approach thesite by calculating the eigenvectors of the 2-variable covariance matrix correspond-ing to X and Y directions. This is easily converted to a compass direction and passedas an additional property of the site to the MCDM for path planning. Additionally,the ratio of the eigenvalues can be used to determine the relative weight applied toselection of a dominant final approach angle.
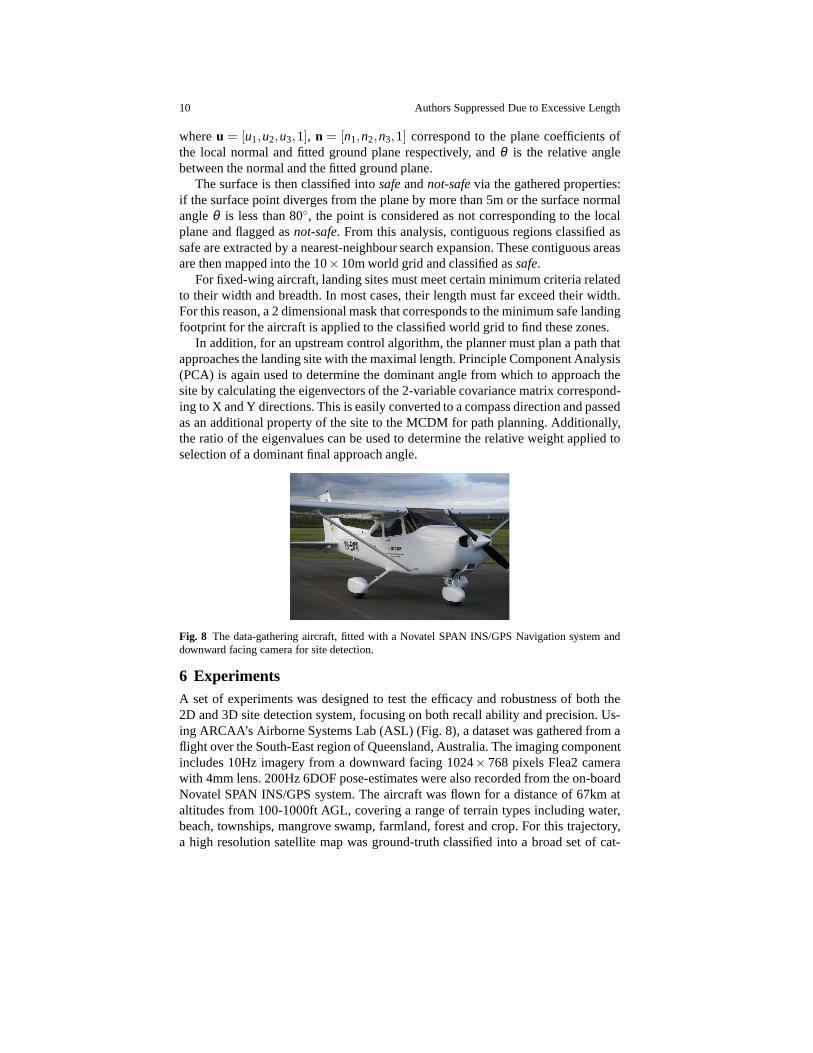
Fig. 8 The data-gathering aircraft, fitted with a Novatel SPAN INS/GPS Navigation system anddownward facing camera for site detection.
6 ExperimentsA set of experiments was designed to test the efficacy and robustness of both the2D and 3D site detection system, focusing on both recall ability and precision. Us-ing ARCAA’s Airborne Systems Lab (ASL) (Fig. 8), a dataset was gathered from aflight over the South-East region of Queensland, Australia.The imaging componentincludes 10Hz imagery from a downward facing 1024× 768 pixels Flea2 camerawith 4mm lens. 200Hz 6DOF pose-estimates were also recordedfrom the on-boardNovatel SPAN INS/GPS system. The aircraft was flown for a distance of 67km ataltitudes from 100-1000ft AGL, covering a range of terrain types including water,beach, townships, mangrove swamp, farmland, forest and crop. For this trajectory,a high resolution satellite map was ground-truth classifiedinto a broad set of cat-
Enabling Aircraft Emergency Landings using Active Visual Site Detection 11
egories including grass, trees, water, crop, road and buildings. The classificationswere then split into binary classes based on their suitability: safe or not-safe. Water,roads, grass and crop-land were classified assafe due to their relatively flat surfaceaway from civilisation, while trees and buildings were classified asnot-safe due tothe likelihood of interaction with persons or damage to the aircraft. These classifi-cations could change depending on aircraft size and whetherthe vehicle is manned.Each classification was binned into a world grid corresponding to the 2D Bayesianworld model derived from the observation data.
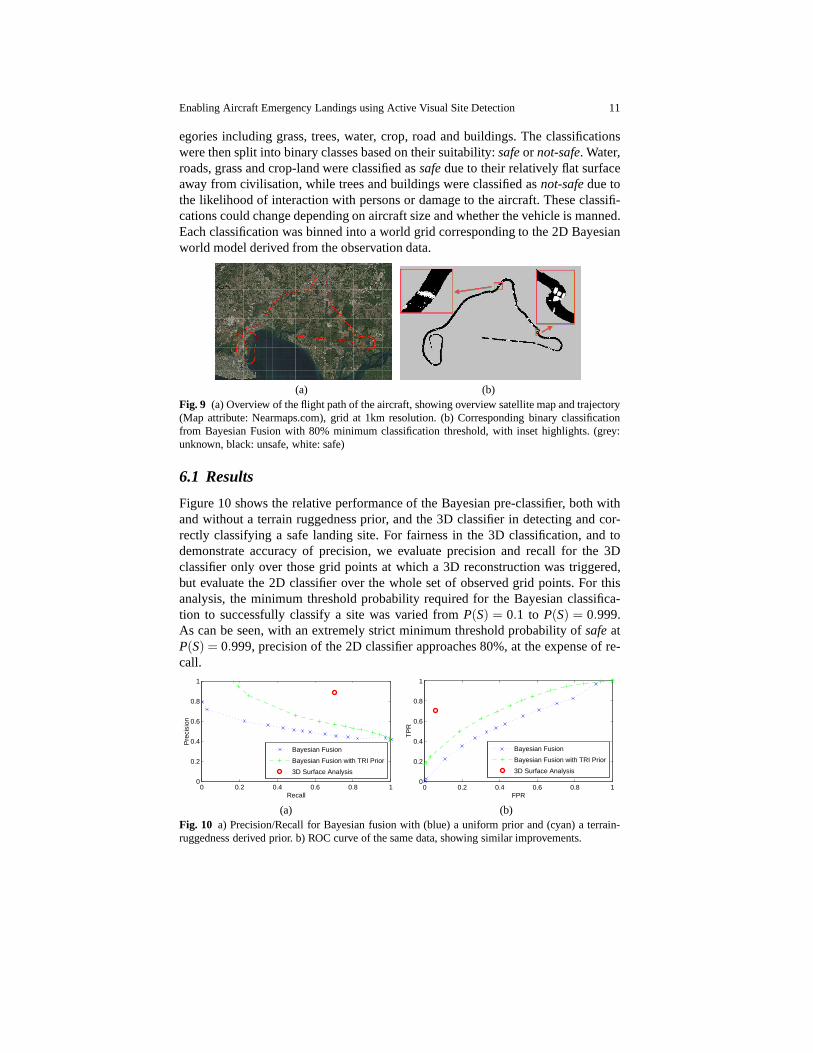
(a) (b)Fig. 9 (a) Overview of the flight path of the aircraft, showing overview satellite map and trajectory(Map attribute: Nearmaps.com), grid at 1km resolution. (b)Corresponding binary classificationfrom Bayesian Fusion with 80% minimum classification threshold, with inset highlights. (grey:unknown, black: unsafe, white: safe)
6.1 Results
Figure 10 shows the relative performance of the Bayesian pre-classifier, both withand without a terrain ruggedness prior, and the 3D classifierin detecting and cor-rectly classifying a safe landing site. For fairness in the 3D classification, and todemonstrate accuracy of precision, we evaluate precision and recall for the 3Dclassifier only over those grid points at which a 3D reconstruction was triggered,but evaluate the 2D classifier over the whole set of observed grid points. For thisanalysis, the minimum threshold probability required for the Bayesian classifica-tion to successfully classify a site was varied fromP(S) = 0.1 to P(S) = 0.999.As can be seen, with an extremely strict minimum threshold probability of safe atP(S) = 0.999, precision of the 2D classifier approaches 80%, at the expense of re-call.
0 0.2 0.4 0.6 0.8 10
0.2
0.4
0.6
0.8
1
Recall
Pre
cisi
on
Bayesian Fusion
Bayesian Fusion with TRI Prior
3D Surface Analysis
(a)
0 0.2 0.4 0.6 0.8 10
0.2
0.4
0.6
0.8
1
FPR
TP
R
Bayesian Fusion
Bayesian Fusion with TRI Prior
3D Surface Analysis
(b)Fig. 10 a) Precision/Recall for Bayesian fusion with (blue) a uniform prior and (cyan) a terrain-ruggedness derived prior. b) ROC curve of the same data, showing similar improvements.
12 Authors Suppressed Due to Excessive Length
Utilising a terrain ruggedness prior increases both recalland precision by ac-counting for terrain that is not relatively smooth. Additionally, some of the gain inprecision is from successfully classifying water bodies such as lakes and ocean.
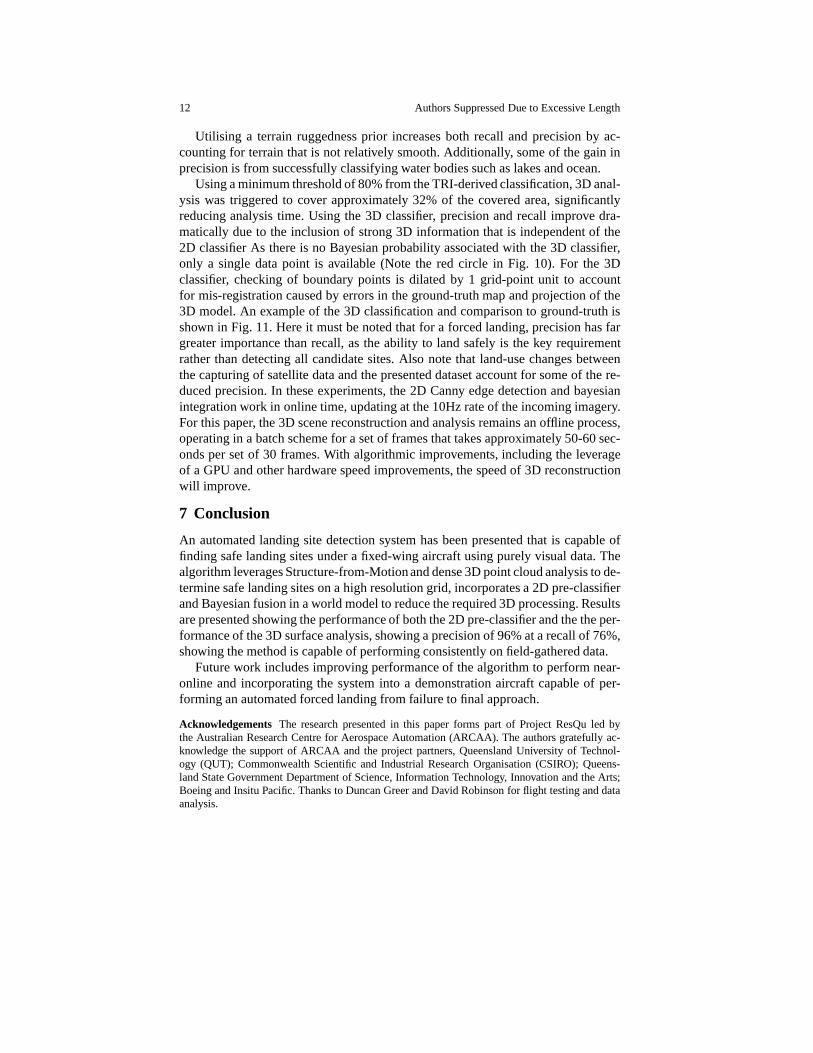
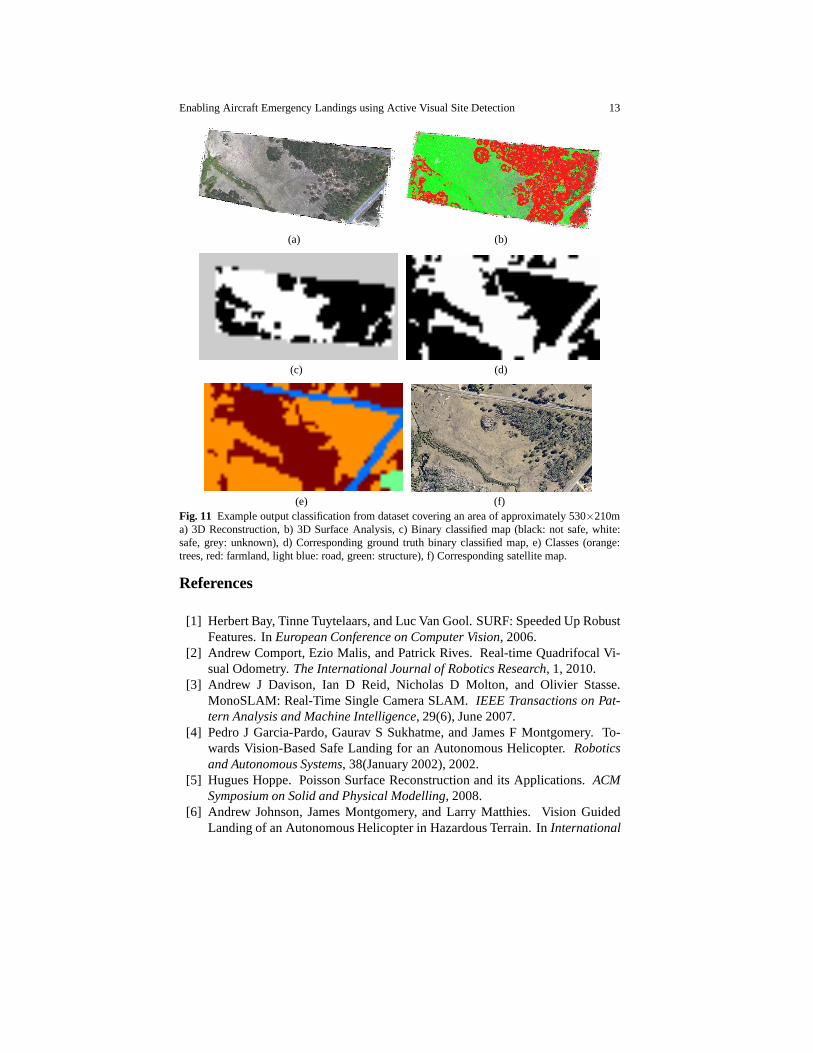
Using a minimum threshold of 80% from the TRI-derived classification, 3D anal-ysis was triggered to cover approximately 32% of the coveredarea, significantlyreducing analysis time. Using the 3D classifier, precision and recall improve dra-matically due to the inclusion of strong 3D information thatis independent of the2D classifier As there is no Bayesian probability associatedwith the 3D classifier,only a single data point is available (Note the red circle in Fig. 10). For the 3Dclassifier, checking of boundary points is dilated by 1 grid-point unit to accountfor mis-registration caused by errors in the ground-truth map and projection of the3D model. An example of the 3D classification and comparison to ground-truth isshown in Fig. 11. Here it must be noted that for a forced landing, precision has fargreater importance than recall, as the ability to land safely is the key requirementrather than detecting all candidate sites. Also note that land-use changes betweenthe capturing of satellite data and the presented dataset account for some of the re-duced precision. In these experiments, the 2D Canny edge detection and bayesianintegration work in online time, updating at the 10Hz rate ofthe incoming imagery.For this paper, the 3D scene reconstruction and analysis remains an offline process,operating in a batch scheme for a set of frames that takes approximately 50-60 sec-onds per set of 30 frames. With algorithmic improvements, including the leverageof a GPU and other hardware speed improvements, the speed of 3D reconstructionwill improve.
7 Conclusion
An automated landing site detection system has been presented that is capable offinding safe landing sites under a fixed-wing aircraft using purely visual data. Thealgorithm leverages Structure-from-Motionand dense 3D point cloud analysis to de-termine safe landing sites on a high resolution grid, incorporates a 2D pre-classifierand Bayesian fusion in a world model to reduce the required 3Dprocessing. Resultsare presented showing the performance of both the 2D pre-classifier and the the per-formance of the 3D surface analysis, showing a precision of 96% at a recall of 76%,showing the method is capable of performing consistently onfield-gathered data.
Future work includes improving performance of the algorithm to perform near-online and incorporating the system into a demonstration aircraft capable of per-forming an automated forced landing from failure to final approach.
Acknowledgements The research presented in this paper forms part of Project ResQu led bythe Australian Research Centre for Aerospace Automation (ARCAA). The authors gratefully ac-knowledge the support of ARCAA and the project partners, Queensland University of Technol-ogy (QUT); Commonwealth Scientific and Industrial ResearchOrganisation (CSIRO); Queens-land State Government Department of Science, Information Technology, Innovation and the Arts;Boeing and Insitu Pacific. Thanks to Duncan Greer and David Robinson for flight testing and dataanalysis.
Enabling Aircraft Emergency Landings using Active Visual Site Detection 13
(a) (b)
(c) (d)
(e) (f)Fig. 11 Example output classification from dataset covering an areaof approximately 530×210ma) 3D Reconstruction, b) 3D Surface Analysis, c) Binary classified map (black: not safe, white:safe, grey: unknown), d) Corresponding ground truth binaryclassified map, e) Classes (orange:trees, red: farmland, light blue: road, green: structure),f) Corresponding satellite map.
References
[1] Herbert Bay, Tinne Tuytelaars, and Luc Van Gool. SURF: Speeded Up RobustFeatures. InEuropean Conference on Computer Vision, 2006.
[2] Andrew Comport, Ezio Malis, and Patrick Rives. Real-time Quadrifocal Vi-sual Odometry.The International Journal of Robotics Research, 1, 2010.
[3] Andrew J Davison, Ian D Reid, Nicholas D Molton, and Olivier Stasse.MonoSLAM: Real-Time Single Camera SLAM.IEEE Transactions on Pat-tern Analysis and Machine Intelligence, 29(6), June 2007.
[4] Pedro J Garcia-Pardo, Gaurav S Sukhatme, and James F Montgomery. To-wards Vision-Based Safe Landing for an Autonomous Helicopter. Roboticsand Autonomous Systems, 38(January 2002), 2002.
[5] Hugues Hoppe. Poisson Surface Reconstruction and its Applications. ACMSymposium on Solid and Physical Modelling, 2008.
[6] Andrew Johnson, James Montgomery, and Larry Matthies. Vision GuidedLanding of an Autonomous Helicopter in Hazardous Terrain. In International
14 Authors Suppressed Due to Excessive Length
Conference on Robotics and Automation. IEEE, 2005.[7] Georg Klein and David Murray. Parallel Tracking and Mapping for Small AR
Workspaces.2007 6th IEEE and ACM International Symposium on Mixed andAugmented Reality, November 2007.
[8] Kurt Konolige, Motilal Agrawal, and Joan Sola. Large Scale Visual Odometryfor Rough Terrain. InInternational Symposium on Robotics Research, 2007.
[9] David McKinnon, Ryan N Smith, and Ben Upcroft. A Semi-Local Methodfor Iterative Depth-Map Refinement. InInternational Conference on Roboticsand Automation (ICRA), 2012.
[10] Luis Mejias and Daniel Fitzgerald. A Multi-Layered Approach for Site De-tection in UAS Emergency Landing Scenarios Using Geometry-Based ImageSegmentation. InInternational Conference on Unmanned Aircraft Systems(ICUAS). IEEE, May 2013.
[11] Luis Mejias, Daniel Fitzgerald, Pillar Eng, and Xi Liu.Forced Landing Tech-nologies for Unmanned Aerial Vehicles: Towards Safer Operations. AerialVehicles, 2009.
[12] Richard Newcombe, Steven Lovegrove, and Andrew Davison. DTAM: DenseTracking and Mapping in Real-Time.International Conference on ComputerVision, November 2011.
[13] Marc Pollefeys, D. Nister, J.-M. Frahm, a. Akbarzadeh, P. Mordohai, B. Clipp,C. Engels, D. Gallup, S.-J. Kim, P. Merrell, C. Salmi, S. Sinha, B. Talton,L. Wang, Q. Yang, H. Stewenius, R. Yang, G. Welch, and H. Towles. DetailedReal-Time Urban 3D Reconstruction from Video.International Journal ofComputer Vision, 78(2-3), October 2007.
[14] Davide Scaramuzza, Friedrich Fraundorfer, and RolandSiegwart. Real-TimeMonocular Visual Odometry for On-Road Vehicles with 1-Point RANSAC. InInternational Conference on Robotics and Automation (ICRA), 2009.
[15] Sebastian Scherer, Lyle Chamberlain, and Sanjiv Singh. Autonomous Landingat Unprepared Sites by a Full-Scale Helicopter.Robotics and AutonomousSystems, 60(12), December 2012.
[16] Yu-Fei Shen, Zia-Ur Rahman, Dean Krusienski, and JiangLi. A Vision-Based Automatic Safe Landing-Site Detection System.IEEE Transactionson Aerospace and Electronic Systems, 49(1), January 2013.
[17] Michael Warren and Ben Upcroft. High Altitude Stereo Visual Odometry. InProceedings of Robotics: Science and Systems, 2013.
[18] Michael Warren and Ben Upcroft. Robust Scale Initialization for Long-RangeStereo Visual Odometry. InIROS, 2013.
[19] Michael Warren, David McKinnon, Hu He, Arren Glover, and Michael Shiel.Large Scale Monocular Vision-only Mapping from a Fixed-Wing sUAS. InField and Service Robotics, 2012.
[20] Stephan M Weiss.Vision Based Navigation for Micro Helicopters. PhD thesis,Swiss Federal Institute of Technology, 2012.
[21] Zhenyu Yu and Kenzo Nonami. 3D Vision Based Landing Control of a SmallScale Autonomous Helicopter.International Journal of Advanced RoboticsSystems, 2007.