Embed Size (px)
Citation preview
EVALUATION STUDY ON THE IMPLEMENTATION OF MINIMUM WAGES ACT,1948 IN STONE BREAKING & STONE CRUSHING INDUSTRY IN GUJARAT 2007‐08
Government of India Ministry of Labour & Employment Labour Bureau Chandigarh
reji
PREFACE
The Minimum Wages Act,1948 is a Welfare legislation enacted to prevent exploitation of unorganised , illiterate and ignorant workers in the form of paying unduly low wages. The Act empowers the Appropriate Government to fix and revise the statutory rates of minimum wages for scheduled employments at intervals not exceeding five years. However, fixation of statutory minimum wage in itself does not ensure that it is paid to the target workers. It requires effective enforcement on the part of appropriate authorities.
The effective enforcement of various provisions of the Act has remained a cause of concern for the government. The first National Commission on Labour (1969) and the National Commission on Agriculture (1976) had observed that wages fixed under the Act were not revised for long period although the price increase warranted it. Considering the dissatisfaction over the pace of implementation of Act, the Government of India, Ministry of Labour & Employment entrusted the task of conducting Evaluation Studies on the Implementation of Minimum Wages Act, 1948 to the Labour Bureau in the year 1981. The studies were initially conducted in Agriculture sector in different states and subsequently extended to other unorganised employments like Bidi & Tobacco Manufacturing, Bauxite Mines, Building & Construction Industry, etc.
The second National Commission on Labour, National Statistical Commission and National Common Minimum Programme of the Government also emphasized upon effective enforcement of the Act and need for concerted efforts in this direction.
The present report is based on a study conducted in the “Stone Breaking and Stone Crushing Industry in the state of Gujarat. The study throws light on the level of compliance of various provisions of the Minimum Wages Act, 1948 in the Stone Breaking and Stone Crushing Industry in terms of payment of prescribed wages, daily hours of work, awareness among the employers and workers about various provisions of the Act, difficulties faced in the enforcement of the Act in the scheduled employment.
My thanks are due to the Commissioner of Labour, Government of Gujarat and the officers of his organisation for extending valuable cooperation in the execution of the study. I would also like to place on record, my appreciation for the dedicated efforts put in by the team of officers and staff members of Bureau in the conduct of field study and bringing out this report.
The views expressed in this report, are not necessarily those of the Ministry of Labour & Employment, Government of India. Suggestions for improvement in the study are welcome.
Dated: 03-08-2009 Chandigarh
Dr. K.S.R.V.S. Chalam Director General
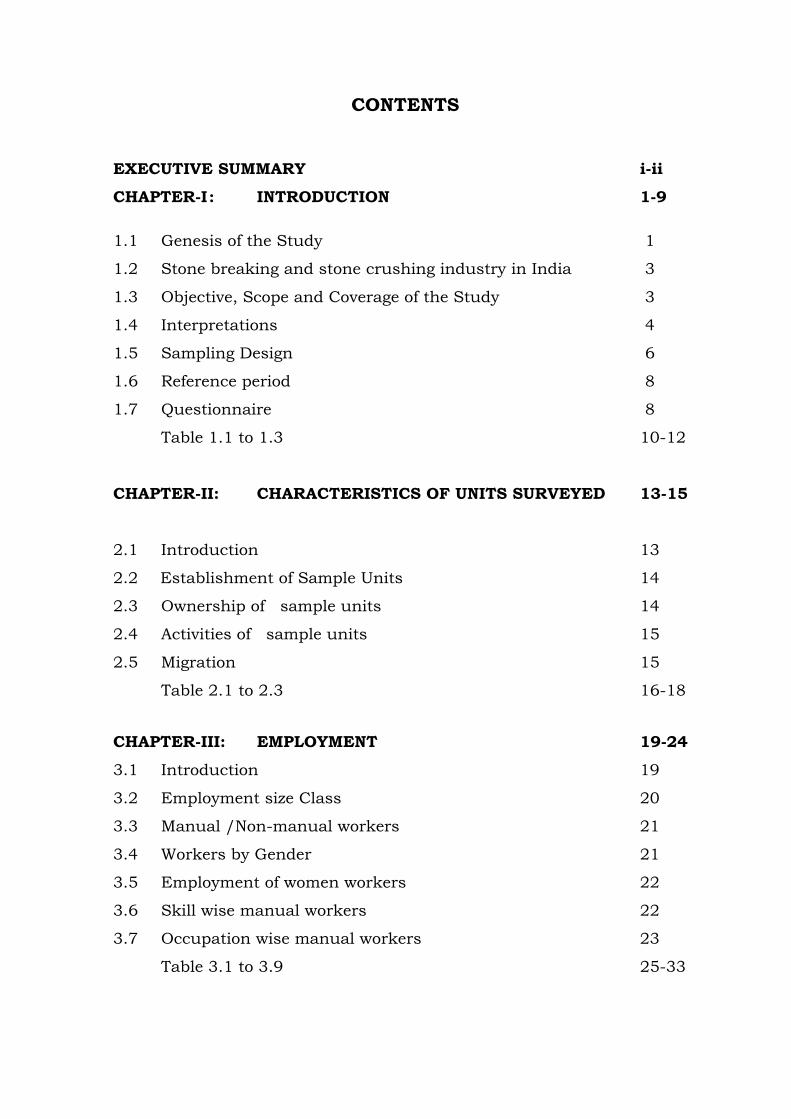
CONTENTS EXECUTIVE SUMMARY i-ii CHAPTER-I : INTRODUCTION 1-9 1.1 Genesis of the Study 1
1.2 Stone breaking and stone crushing industry in India 3
1.3 Objective, Scope and Coverage of the Study 3
1.4 Interpretations 4
1.5 Sampling Design 6
1.6 Reference period 8
1.7 Questionnaire 8
Table 1.1 to 1.3 10-12
CHAPTER-II: CHARACTERISTICS OF UNITS SURVEYED 13-15
2.1 Introduction 13
2.2 Establishment of Sample Units 14
2.3 Ownership of sample units 14
2.4 Activities of sample units 15
2.5 Migration 15
Table 2.1 to 2.3 16-18
CHAPTER-III: EMPLOYMENT 19-24
3.1 Introduction 19
3.2 Employment size Class 20
3.3 Manual /Non-manual workers 21
3.4 Workers by Gender 21
3.5 Employment of women workers 22
3.6 Skill wise manual workers 22
3.7 Occupation wise manual workers 23
Table 3.1 to 3.9 25-33
CHAPTER –IV: WAGES, EARNINGS AND HOURS OF WORK 34-41
4.1 Introduction 34
4.2 Prescribed Rates of the Minimum Wages 34
4.3 Mode of payment and wage period 36
4.4 Basic Wages and Earnings of Manual Workers 36
4.5 Payment of Lower wages 38
4.6 Payment of Lower Wages to Women Workers for similar work 39
4.7 Hours of work, rest interval and weekly off 39
4.8 Overtime 41
Table 4.1 to 4.10 42-57
CHAPTER-V: AWARENESS ABOUT LABOUR LAWS 58-61
5.1 Introduction 58
5.2 Awareness about the Minimum Wages Act & Equal 58
Remuneration Act
5.3 Maintenance of records, notices, extracts, annual returns, etc. 60
5.4 Employer’s Associations and Trade Unions 61
Table 5.1 to 5.5 62-66
CHAPTER-VI: ENFORCEMENT OF LABOUR LAWS 67-71
6.1 Introduction 67
6.2 Enforcement machinery in Gujarat State 68
6.3 Inspections conducted by Labour Inspectors under various 69
Labour Laws
6.4 Inspections carried out in sample units 69
6.5 Observations of enforcement machinery 70
6.7 Suggestions made by Labour Inspectors for effective enforcement of
the Minimum Wages Act, 1948 and the Equal Remuneration
Act, 1976 70
Table 6.1 to 6.3 72-74
CHAPTER-VII: OBSERVATIONS OF THE FIELD STAFF 75
ANNEXURE – I : EVALUATION STUDIES ALREADY CONDUCTED
ANNEXURE – II : EMPLOYER SCHEDULE
ANNEXURE – III : WORKER SCHEDULE
ANNEXURE – IV : LABOUR AUTHORITIES SCHEDULE
~~~0~~~
i
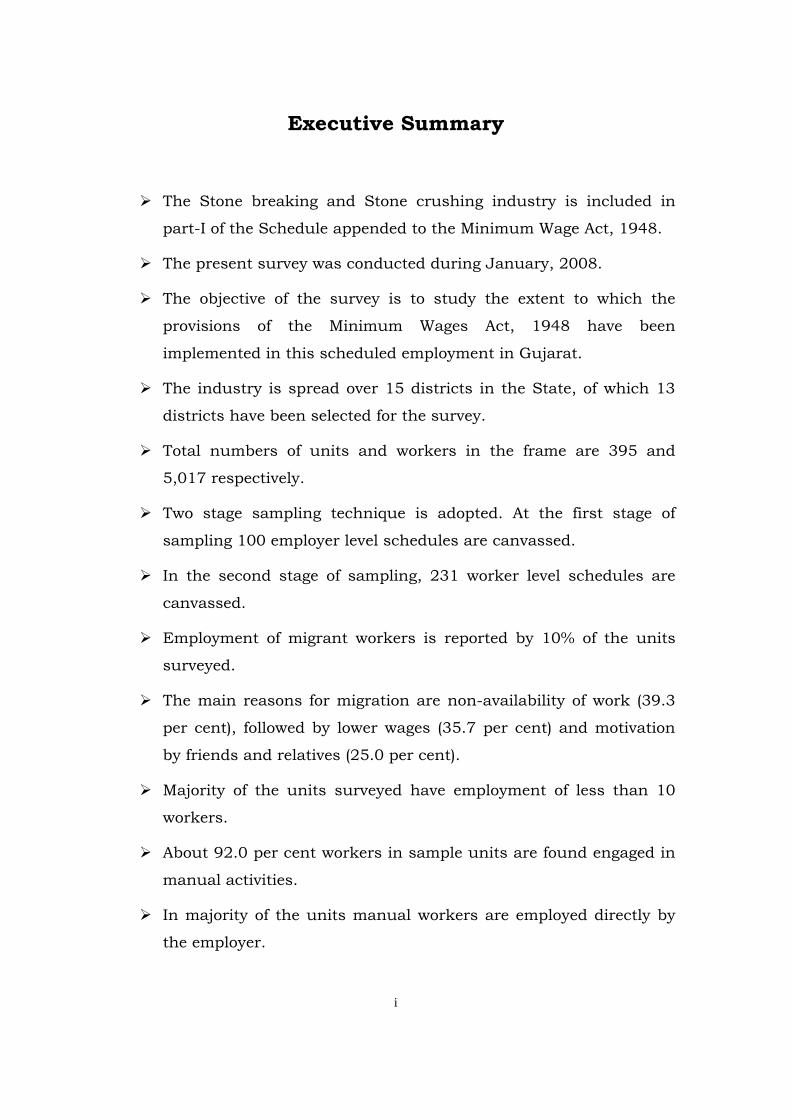
Executive Summary
The Stone breaking and Stone crushing industry is included in
part-I of the Schedule appended to the Minimum Wage Act, 1948.
The present survey was conducted during January, 2008.
The objective of the survey is to study the extent to which the
provisions of the Minimum Wages Act, 1948 have been
implemented in this scheduled employment in Gujarat.
The industry is spread over 15 districts in the State, of which 13
districts have been selected for the survey.
Total numbers of units and workers in the frame are 395 and
5,017 respectively.
Two stage sampling technique is adopted. At the first stage of
sampling 100 employer level schedules are canvassed.
In the second stage of sampling, 231 worker level schedules are
canvassed.
Employment of migrant workers is reported by 10% of the units
surveyed.
The main reasons for migration are non-availability of work (39.3
per cent), followed by lower wages (35.7 per cent) and motivation
by friends and relatives (25.0 per cent).
Majority of the units surveyed have employment of less than 10
workers.
About 92.0 per cent workers in sample units are found engaged in
manual activities.
In majority of the units manual workers are employed directly by
the employer.
ii
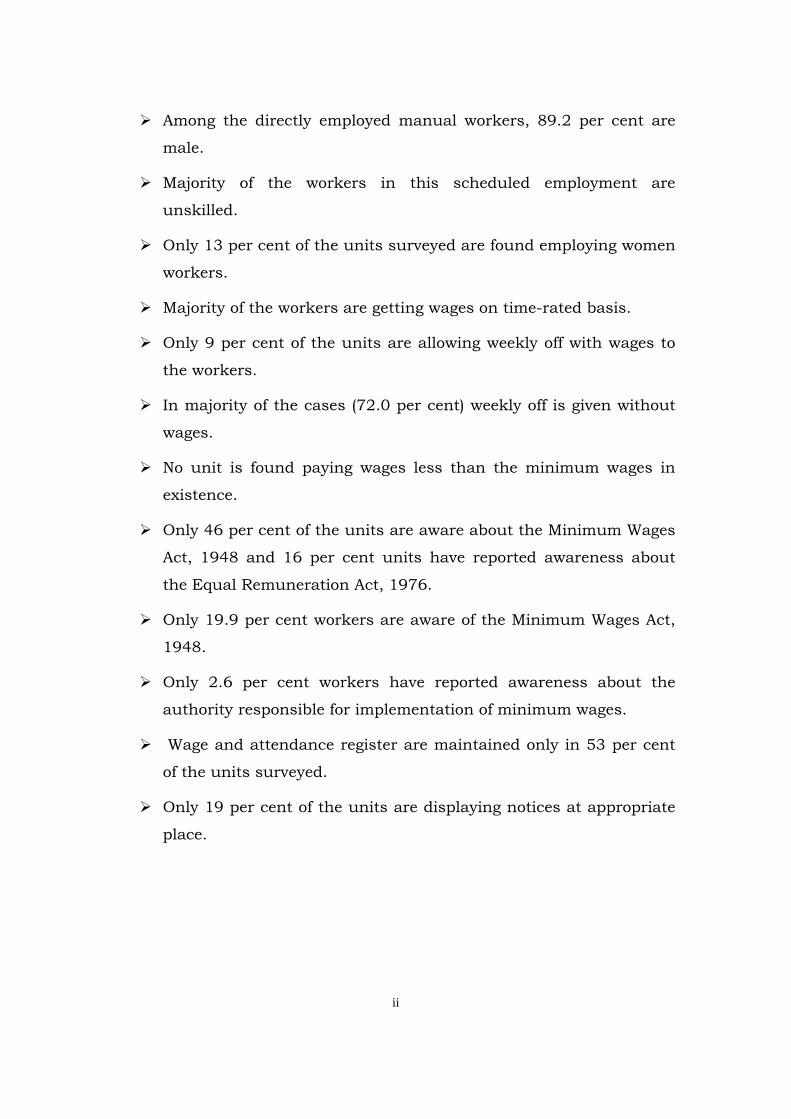
Among the directly employed manual workers, 89.2 per cent are
male.
Majority of the workers in this scheduled employment are
unskilled.
Only 13 per cent of the units surveyed are found employing women
workers.
Majority of the workers are getting wages on time-rated basis.
Only 9 per cent of the units are allowing weekly off with wages to
the workers.
In majority of the cases (72.0 per cent) weekly off is given without
wages.
No unit is found paying wages less than the minimum wages in
existence.
Only 46 per cent of the units are aware about the Minimum Wages
Act, 1948 and 16 per cent units have reported awareness about
the Equal Remuneration Act, 1976.
Only 19.9 per cent workers are aware of the Minimum Wages Act,
1948.
Only 2.6 per cent workers have reported awareness about the
authority responsible for implementation of minimum wages.
Wage and attendance register are maintained only in 53 per cent
of the units surveyed.
Only 19 per cent of the units are displaying notices at appropriate
place.
1
CHAPTER – I
INTRODUCTION
1.1 Genesis of the survey
1.1.1 In India, majority of the workers are employed in the
unorganized sector of the economy. The labour force employed
in the unorganized sector is vulnerable to exploitation in terms
of low wages due to lack of any organization and weak
bargaining power. Therefore, determination of wages cannot be
left to the market forces of demand and supply. Hence, in order
to ensure that the workers get the wages at least to meet their
basic needs, the Government of India enacted the Minimum
Wages Act, 1948. The objective of the Act was to fix and revise
the Minimum Wages in certain scheduled employments so as to
prevent the exploitation of labour force.
1.1.1 The Act provided for fixation/revision of minimum wages
by the Appropriate Government at interval not exceeding 5
years, to make wages more realistic, yet the implementation of
the Act remained a cause of concern for the Government. The
National Commission on Labour (1969) also pointed out that
“While it was generally accepted that the Minimum Wages Act,
1948 had served a useful purpose in checking exploitation of
the labour in employments where sweating conditions
prevailed, dissatisfaction was expressed over the proper
implementation of each of the provisions of the Act. An equally
persistent complaint has been that the minimum wages once
fixed have not been revised for longer periods. We have come
2
across several instances where the rates have not been revised
even after they were initially fixed”.
1.1.2 The National Commission of Agriculture (1976) also expressed
their concern on the implementation and non-revision of wages
fixed under the Act for long period, and recommended initiation
of strict and time bound measures to prevent exploitation of the
workers. Accordingly, Government of India launched the
scheme “Evaluation of Implementation of the Minimum Wages
Act 1948” to make an assessment of the extent to which the
provisions of the Act have been enforced in the different
scheduled employments.
1.1.3 Ministry of Labour & Employment, entrusted this task to
Labour Bureau, in May, 1981 for conducting evaluation studies
on the implementation of Minimum Wages Act 1948. Initially
these evaluation studies were conducted in the scheduled
employment of Agriculture in different states in a phased
manner. The first study was done in Agriculture sector in the
state of Gujarat during the year 1982 and subsequently similar
studies were conducted in the states of Rajasthan, Bihar and
Karnataka etc. The list of evaluations studies conducted so far
is enclosed in Annexure-I.
1.1.4 Keeping in view of the utility of the data so collected, the scope
and coverage of the study was extended to the organized
employments like Bauxite Mines, Building Construction
Industry, Beedi Making establishments, etc. Labour Bureau
has so far conducted 26 such evaluation studies and the
present report is the 27th in the series.
3
1.2 Stone Breaking and Stone Crushing Industry in India
1.2.1 Stone Breaking and Stone Crushing industry is an important
industrial sector in the country engaged in producing crushed
stone which acts as raw material for various construction activities
such as the construction of the roads, bridges, buildings, canals
etc. The stone crusher is one such industry that exists in the
vicinity of almost all major cities/towns throughout the country.
The first survey in stone breaking and stone crushing was
conducted in Rajasthan in 2004. The current survey is the third
survey under the industry and was conducted in 2008.
1.2.2 The crushed rock produced by the labour or by the machines,
popularly known as crusher plants, is termed as Aggregates in the
civil engineering technologies, which are the basic materials for
construction works to build homes, townships, roads, dams to
irrigate the fields, etc. The various operations involved in the stone
crushing viz. size reduction, size classification and transfer
operations have the potential to emit process and fugitive dust.
The particle size analysis, however, indicates high percentage of
silica contents posing serious health problems to the workers who
are exposed for longer duration in the process of stone breaking
and stone crushing and consequently the workers are grabbed with
the respiratory problems.
1.3 Objectives, Scope and Coverage of the Survey
1.3.1 The objective of the study is to assess the extent to which the
provisions of Minimum Wages Act, 1948 are implemented in
the Stone Breaking and Stone Crushing industry in Gujarat.
Some of the other main objectives of the study are to assess:
4
i) The extent to which the provisions of the Minimum Wages
Act, 1948 have been enforced in Stone Breaking and Stone
Crushing establishments in the State;
ii) The extent of awareness about the Minimum Wages Act,
1948 and the Equal Remuneration Act, 1976 among the
employers and workers;
iii) Level of compliance to the Statutory Minimum Wages fixed
by the appropriate Govt.; and
iv) The problems faced by the state government in the
enforcement of the Minimum Wages Act, 1948.
1.3.2 The scope and coverage of study is extended to all
establishments of Stone Breaking and Stone Crushing
industry falling under the Scheduled Employment in Gujarat
State. However, the actual coverage is restricted to the
sampled units and its employers, contractors and workers.
1.4 Interpretations
Appropriate Government means: (i) in relation to any scheduled
employment carried on by or under the authority of the Central
Government or any corporation established by a Central Act, the
Central Government and (ii) in relation to any other scheduled
employment, the State Government.
Scheduled Employment: An employment specified in the schedule
appended to the Minimum Wages Act or any process or branch of
work forming part of such employment.
Unit/Establishment: Any office or department of the Government
or a local authority, or any place where an industry, trade,
business, manufacture or occupation is carried on.

5
Employer: Any person who employs, whether directly or through
any other person/ agency, whether on behalf of himself or any
agency, one or more employees/ workers in any scheduled
employment in respect of which Minimum rates of wages have
been fixed under the Minimum Wages Act, 1948 by the
Appropriate Government.
Worker: Any person who is employed for hire or reward to do any
work skilled semi-skilled or unskilled, manual or clerical in a
scheduled employment in respect of which Minimum rates of
wages have been fixed.
Contractor: A person who undertakes to produce a given result for
the establishment, other than a mere supply of goods or articles
of manufacture to such establishment, through contract labour or
who supplies labour for any contract work of the establishment
and includes a sub contractor within this category.
Contract Labour: A workman who is hired in or in connection
with the work of an establishment by or through a contractor,
with or without the knowledge of principal employer.
Wages: Wages include basic pay, dearness pay, dearness
allowance, variable dearness allowance, adhoc-dearness
allowance.
Earnings: The earnings include all type of basic pay and dearness
allowance as well as other allowances like house rent allowances,
conveyance allowance, washing allowance, medical allowance,
etc.
6
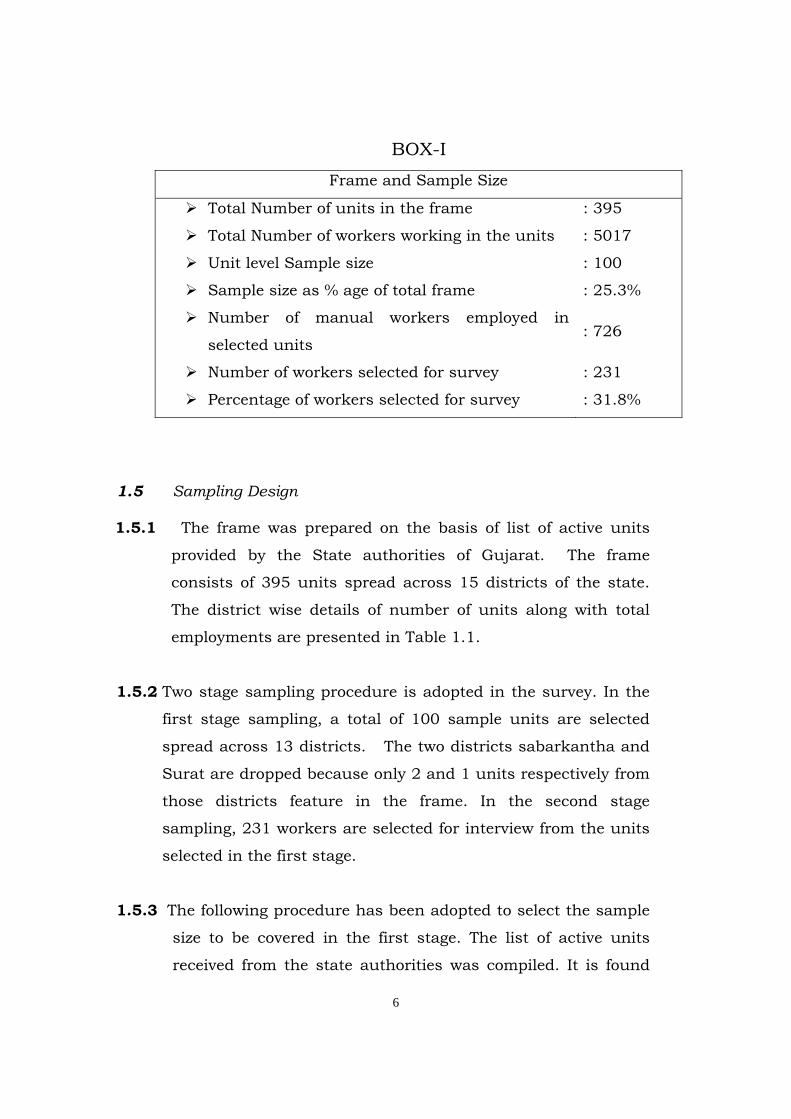
BOX-I
Frame and Sample Size
Total Number of units in the frame : 395
Total Number of workers working in the units : 5017
Unit level Sample size : 100
Sample size as % age of total frame : 25.3%
Number of manual workers employed in
selected units : 726
Number of workers selected for survey : 231
Percentage of workers selected for survey : 31.8%
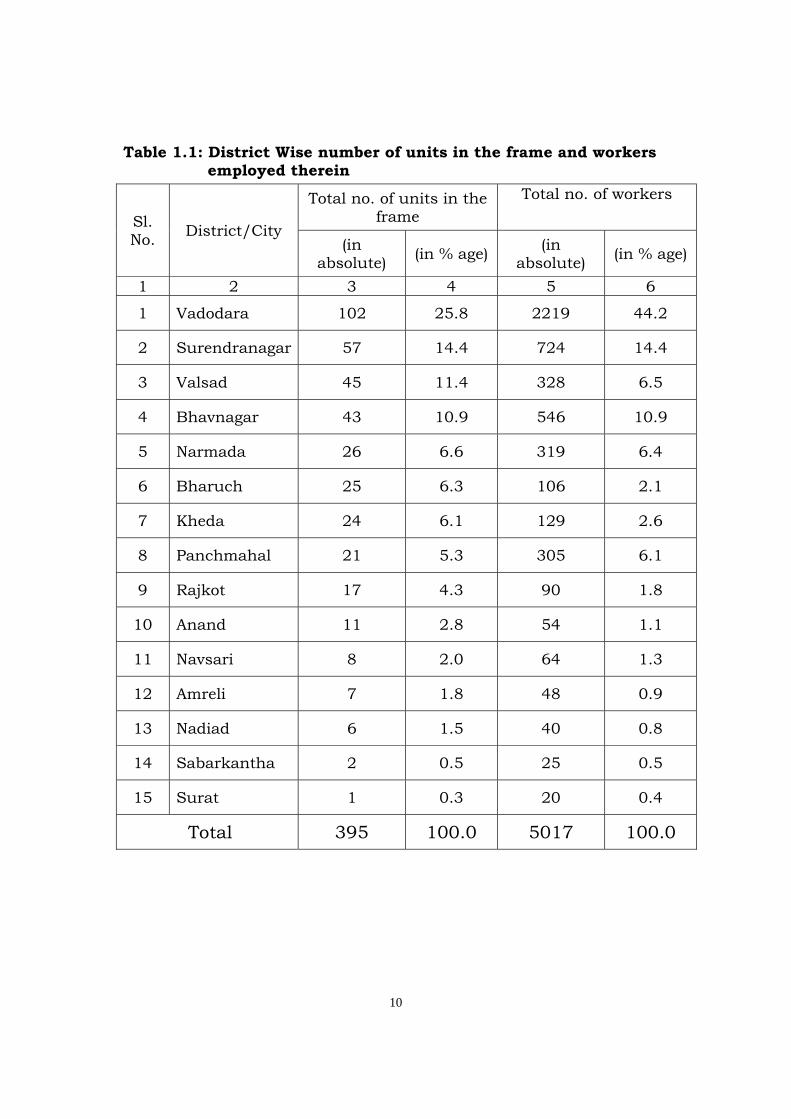
1.5 Sampling Design 1.5.1 The frame was prepared on the basis of list of active units
provided by the State authorities of Gujarat. The frame
consists of 395 units spread across 15 districts of the state.
The district wise details of number of units along with total
employments are presented in Table 1.1.
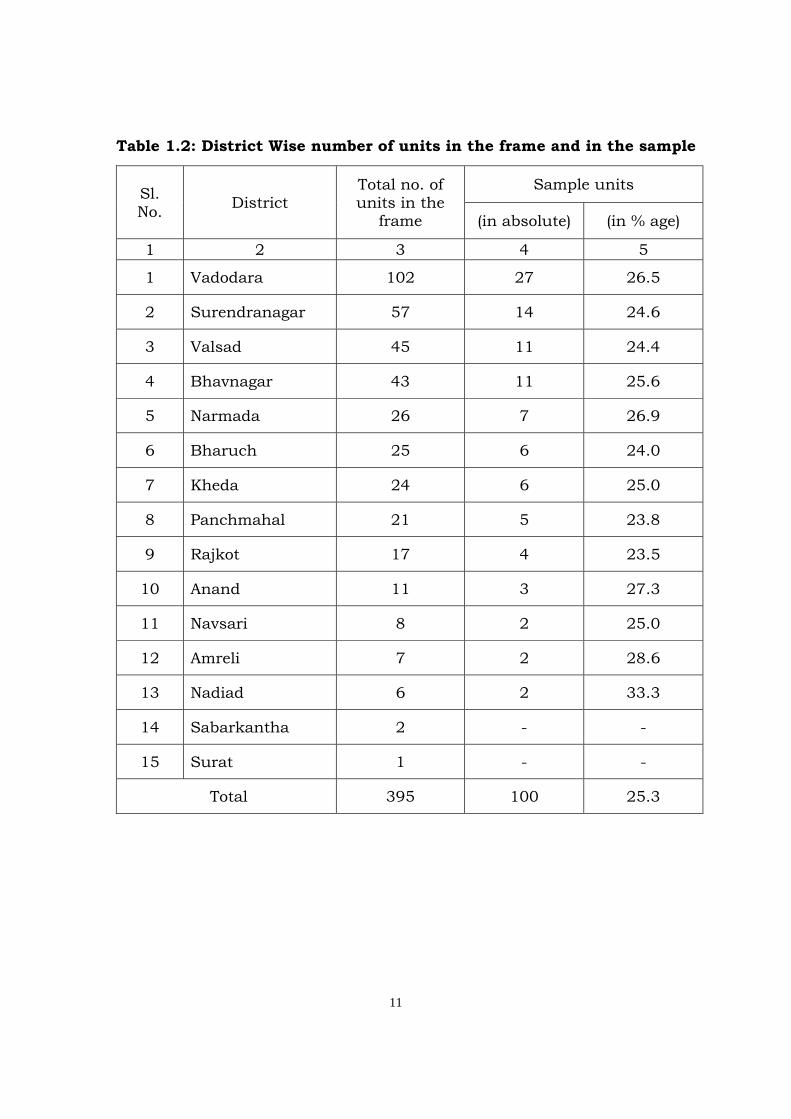
1.5.2 Two stage sampling procedure is adopted in the survey. In the
first stage sampling, a total of 100 sample units are selected
spread across 13 districts. The two districts sabarkantha and
Surat are dropped because only 2 and 1 units respectively from
those districts feature in the frame. In the second stage
sampling, 231 workers are selected for interview from the units
selected in the first stage.
1.5.3 The following procedure has been adopted to select the sample
size to be covered in the first stage. The list of active units
received from the state authorities was compiled. It is found
7
that majority of the units (90%) have employment size of less
than or equal to 20 workers.
1.5.4 In order to estimate the sample size, coefficient of variation
based on employment size of 304 units is calculated.
Accordingly, the sample size is fixed at 100 units with 95%
confidence coefficient considering 10% permissible error.
These 100 sample units have been distributed among the
districts proportionately according to their share in total
employment in the frame.
1.5.5 It was however ensured that in each selected district a
minimum of two units are covered. After allocating the sample
size proportionately among the districts, the sampled units are
selected by simple random sampling. The district wise units in
the frame and in the sample selected are indicated in Table
1.2
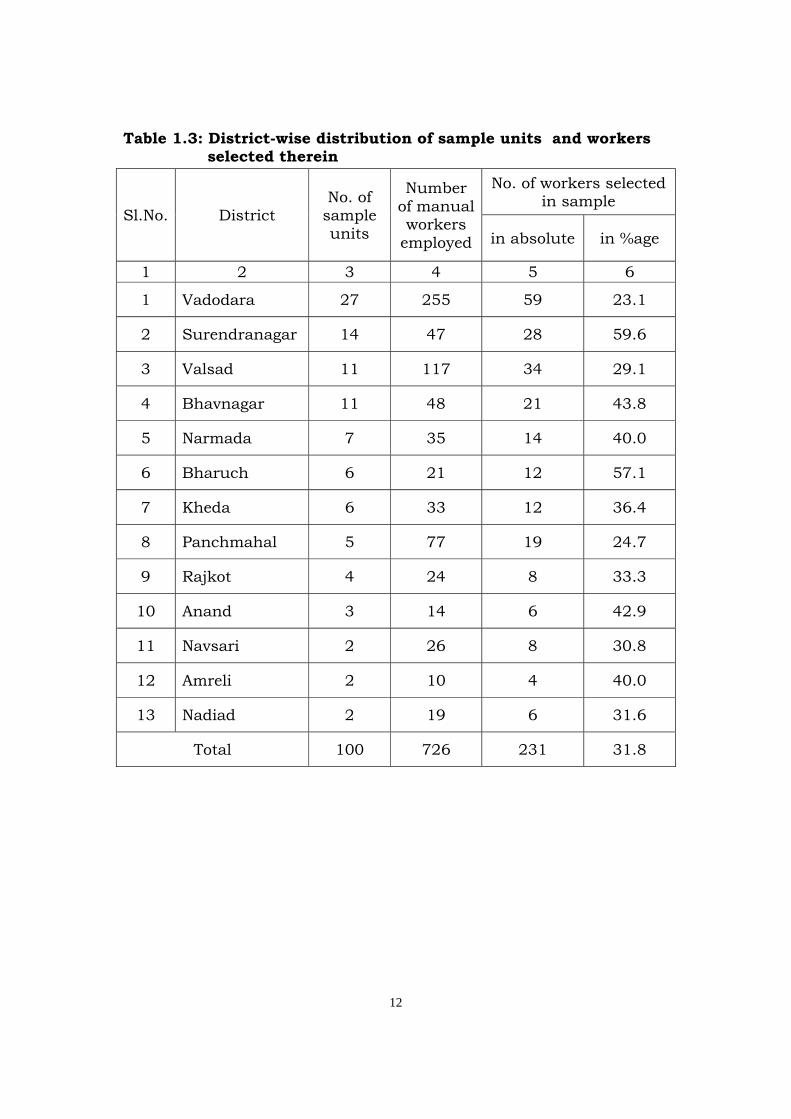
1.5.6 For the second stage sampling i.e. selection of workers,
employment of the sample unit is the sole criteria. For
canvassing the workers schedules in the units selected at the
1st stage of sampling, the following criterion is adopted:
I. 2 workers selected from the units employing 1 to 9
workers;
II. 4 workers selected from the units employing 10 to 19
workers; and
III. 5 workers selected from the units employing 20 and more
workers.
1.5.7 It is ensured that there is adequate representation of all the
occupations in the second stage sample units. Out of 726
8
manual workers employed in 100 sample units, 231 workers
are selected as the second stage sample. The district wise
sample units and the workers selected therein are presented
in Table 1.3.
1.6 Reference period
1.6.1 The reference period for the evaluation study on the
implementation of the Minimum Wages Act, 1948 in the Stone
Breaking and Stone Crushing industry in the Gujarat State is the
last pay period of October, 2007 calendar month. In case the unit
is found closed or not working in the reference period, the last pay
period nearest to the reference period is taken.
1.6.2 The field work was launched and completed in January, 2008
1.7 Questionnaire
1.7.1 The following three schedules were canvassed for the study on
Evaluation of Implementation of the Minimum Wages Act,
1948 in the Stone Breaking and Stone Crushing Industry.
Schedule I: Employer Schedule
Information on gender and skill wise employment, wages paid
to workers, hours of work, weekly off, awareness about the
Minimum Wages Act, 1948, the Equal Remuneration Act,
1976 and maintenance of records etc. are collected from the
employers through this schedule.
9
Schedule II: Worker Schedule
In this schedule, information is collected from the selected
workers on the actual wages and earnings of worker from all
sources, awareness among workers about the prescribed
minimum wages, working hours, awareness among the female
workers about the Equal Remuneration Act, 1976, etc.
Schedule III: Enforcement Authority’s Schedule
In this Schedule, information on frequency of inspections made
in the units/establishments by Labour Inspectors, difficulties
faced in the enforcement of the Act and suggestions for
improving the level of compliance under various provisions of
the Act is collected from the Labour Inspectors of the concerned
areas.
~~0~~
10
Table 1.1: District Wise number of units in the frame and workers employed therein
Sl. No. District/City
Total no. of units in the frame
Total no. of workers
(in absolute) (in % age) (in
absolute) (in % age)
1 2 3 4 5 6
1 Vadodara 102 25.8 2219 44.2
2 Surendranagar 57 14.4 724 14.4
3 Valsad 45 11.4 328 6.5
4 Bhavnagar 43 10.9 546 10.9
5 Narmada 26 6.6 319 6.4
6 Bharuch 25 6.3 106 2.1
7 Kheda 24 6.1 129 2.6
8 Panchmahal 21 5.3 305 6.1
9 Rajkot 17 4.3 90 1.8
10 Anand 11 2.8 54 1.1
11 Navsari 8 2.0 64 1.3
12 Amreli 7 1.8 48 0.9
13 Nadiad 6 1.5 40 0.8
14 Sabarkantha 2 0.5 25 0.5
15 Surat 1 0.3 20 0.4
Total 395 100.0 5017 100.0
11
Table 1.2: District Wise number of units in the frame and in the sample
Sl. No. District
Total no. of units in the
frame
Sample units
(in absolute) (in % age)
1 2 3 4 5
1 Vadodara 102 27 26.5
2 Surendranagar 57 14 24.6
3 Valsad 45 11 24.4
4 Bhavnagar 43 11 25.6
5 Narmada 26 7 26.9
6 Bharuch 25 6 24.0
7 Kheda 24 6 25.0
8 Panchmahal 21 5 23.8
9 Rajkot 17 4 23.5
10 Anand 11 3 27.3
11 Navsari 8 2 25.0
12 Amreli 7 2 28.6
13 Nadiad 6 2 33.3
14 Sabarkantha 2 - -
15 Surat 1 - -
Total 395 100 25.3
12
Table 1.3: District-wise distribution of sample units and workers selected therein
Sl.No. District No. of
sample units
Number of manual workers
employed
No. of workers selected in sample
in absolute in %age
1 2 3 4 5 6
1 Vadodara 27 255 59 23.1
2 Surendranagar 14 47 28 59.6
3 Valsad 11 117 34 29.1
4 Bhavnagar 11 48 21 43.8
5 Narmada 7 35 14 40.0
6 Bharuch 6 21 12 57.1
7 Kheda 6 33 12 36.4
8 Panchmahal 5 77 19 24.7
9 Rajkot 4 24 8 33.3
10 Anand 3 14 6 42.9
11 Navsari 2 26 8 30.8
12 Amreli 2 10 4 40.0
13 Nadiad 2 19 6 31.6
Total 100 726 231 31.8
13
CHAPTER-II
CHARACTERSTICS OF UNITS SURVEYED
2.1 Introduction
2.1.1 Mineral resources are important ingredients of the State economy
and are one of the yardsticks to measure the State’s economic
growth. Minerals are directly or indirectly a basic raw material for
strategic industries. The State of Gujarat is geologically so endowed
that it has become a veritable repository of minerals
2.1.2 Geologically the State of Gujarat consists of varieties of rock ranging
from oldest Precambrian to dinosaur bearing Jurassic, Cretaceous &
lignite, oil & natural gas bearing tertiary and quaternary etc.
2.1.3 The stone breaking and stone crushing industry is in unorganized
sector of industries, the sector which is sometimes defined as not
covered under any factory legislation. In this sense, unorganized
sector employment is derived as a residual after deducting the
registered labour force from the total labour force. The Stone
Breaking and Stone Crushing industry plays a very important role
in the economic and industrial development of Gujarat State which,
in turn contributes to the National development.
2.1.4 During the “Evaluation study on the implementation of the
Minimum Wages Act, 1948 in the Stone Breaking and Stone
Crushing industry in Gujarat state, a sample of 100 units is drawn
from 13 districts of the State.
14
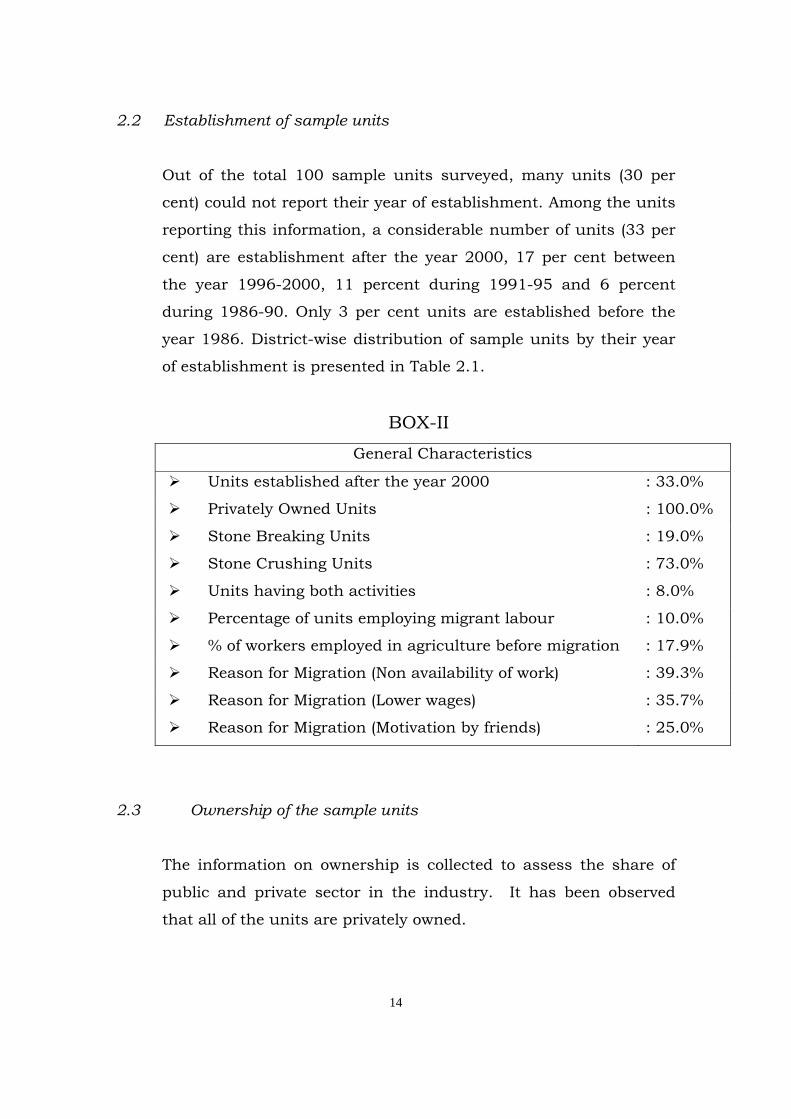
2.2 Establishment of sample units
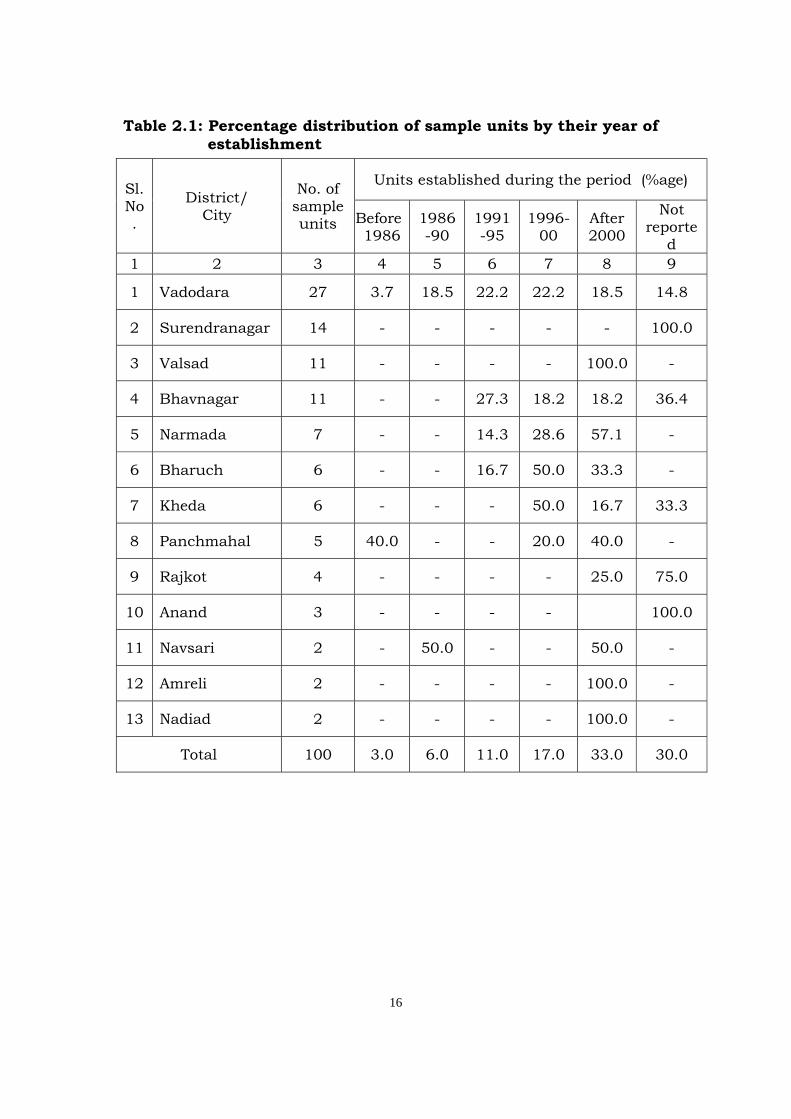
Out of the total 100 sample units surveyed, many units (30 per
cent) could not report their year of establishment. Among the units
reporting this information, a considerable number of units (33 per
cent) are establishment after the year 2000, 17 per cent between
the year 1996-2000, 11 percent during 1991-95 and 6 percent
during 1986-90. Only 3 per cent units are established before the
year 1986. District-wise distribution of sample units by their year
of establishment is presented in Table 2.1.
BOX-II
General Characteristics
Units established after the year 2000 : 33.0%
Privately Owned Units : 100.0%
Stone Breaking Units : 19.0%
Stone Crushing Units
Units having both activities
: 73.0%
: 8.0%
Percentage of units employing migrant labour : 10.0%
% of workers employed in agriculture before migration : 17.9%
Reason for Migration (Non availability of work) : 39.3%
Reason for Migration (Lower wages) : 35.7%
Reason for Migration (Motivation by friends) : 25.0%
2.3 Ownership of the sample units
The information on ownership is collected to assess the share of
public and private sector in the industry. It has been observed
that all of the units are privately owned.
15
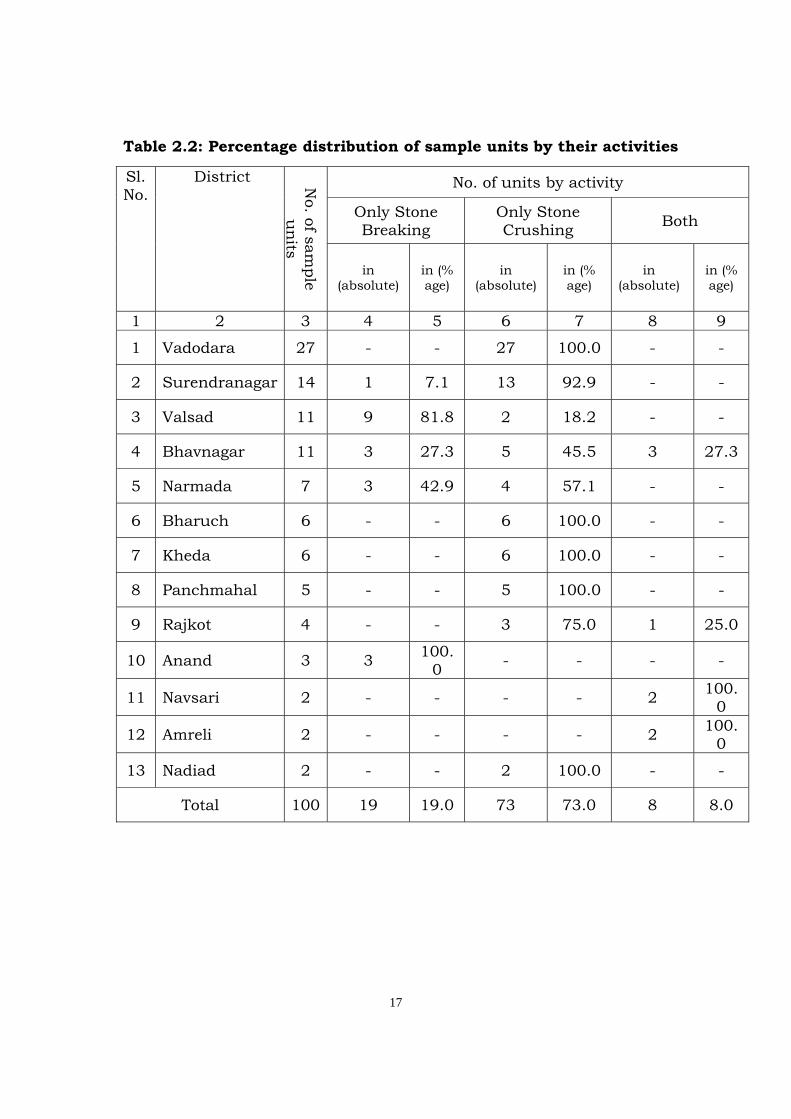
2.4 Activities of the sample units
It has been observed that 73 per cent units are engaged in stone
crushing activity, 19 per cent in stone breaking and the remaining
8 per cent in both the activities. District wise distribution of sample
units engaged in stone breaking and stone crushing activities is
presented in Table 2.2.
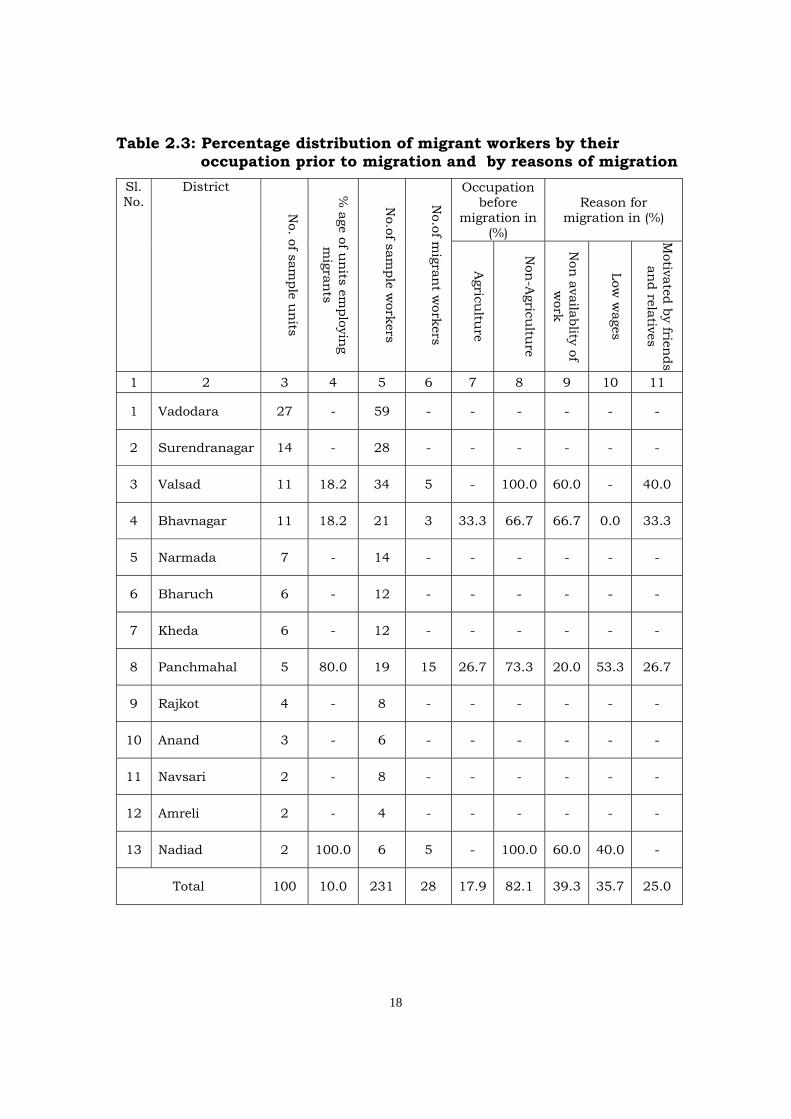
2.5 Migration
2.5.1 It is believed that the migration rate is very high in the unorganized
sectors of the economy. The information collected in this regard,
however reveals that only 10 per cent sample units are employing
workers from others states. District-wise details of units employing
migrant workers and number of migrant workers therein are
presented in Table 2.3.
2.5.2 An attempt is also made to find out the reasons for migration and
occupation of the migrant workers before migrating to the Gujarat
state. As shown in Table 2.3, out of total 231 sample workers, only
28 workers (12 per cent) have migrated from other states. Most of
the migrant workers (82 per cent) were engaged in non-agricultural
occupations before migration and rest 18 per cent were working in
agricultural occupations.
2.5.3 A significant proportion of migrant workers (39.3 per cent) reported
the reason of migration as non-availability of work, followed by
35.7 per cent as low wages, and 25 percent as motivation by
friends and relatives.
~~0~~
16
Table 2.1: Percentage distribution of sample units by their year of establishment
Sl. No.
District/ City
No. of sample units
Units established during the period (%age)
Before 1986
1986-90
1991-95
1996-00
After 2000
Not reporte
d 1 2 3 4 5 6 7 8 9
1 Vadodara 27 3.7 18.5 22.2 22.2 18.5 14.8
2 Surendranagar 14 - - - - - 100.0
3 Valsad 11 - - - - 100.0 -
4 Bhavnagar 11 - - 27.3 18.2 18.2 36.4
5 Narmada 7 - - 14.3 28.6 57.1 -
6 Bharuch 6 - - 16.7 50.0 33.3 -
7 Kheda 6 - - - 50.0 16.7 33.3
8 Panchmahal 5 40.0 - - 20.0 40.0 -
9 Rajkot 4 - - - - 25.0 75.0
10 Anand 3 - - - - 100.0
11 Navsari 2 - 50.0 - - 50.0 -
12 Amreli 2 - - - - 100.0 -
13 Nadiad 2 - - - - 100.0 -
Total 100 3.0 6.0 11.0 17.0 33.0 30.0
17
Table 2.2: Percentage distribution of sample units by their activities
Sl. No.
District No. of sam
ple u
nits
No. of units by activity
Only Stone Breaking
Only Stone Crushing Both
in (absolute)
in (% age)
in (absolute)
in (% age)
in (absolute)
in (% age)
1 2 3 4 5 6 7 8 9
1 Vadodara 27 - - 27 100.0 - -
2 Surendranagar 14 1 7.1 13 92.9 - -
3 Valsad 11 9 81.8 2 18.2 - -
4 Bhavnagar 11 3 27.3 5 45.5 3 27.3
5 Narmada 7 3 42.9 4 57.1 - -
6 Bharuch 6 - - 6 100.0 - -
7 Kheda 6 - - 6 100.0 - -
8 Panchmahal 5 - - 5 100.0 - -
9 Rajkot 4 - - 3 75.0 1 25.0
10 Anand 3 3 100.0 - - - -
11 Navsari 2 - - - - 2 100.0
12 Amreli 2 - - - - 2 100.0
13 Nadiad 2 - - 2 100.0 - -
Total 100 19 19.0 73 73.0 8 8.0
18
Table 2.3: Percentage distribution of migrant workers by their occupation prior to migration and by reasons of migration
Sl. No.
District
No. of sam
ple un
its
% age of u
nits em
ploying
migran
ts
No.of sam
ple workers
No.of m
igrant w
orkers
Occupation before
migration in (%)
Reason for migration in (%)
Agricu
lture
Non
-Agricu
lture
Non
availablity of w
ork
Low w
ages
Motivated by frien
ds an
d relatives
1 2 3 4 5 6 7 8 9 10 11
1 Vadodara 27 - 59 - - - - - -
2 Surendranagar 14 - 28 - - - - - -
3 Valsad 11 18.2 34 5 - 100.0 60.0 - 40.0
4 Bhavnagar 11 18.2 21 3 33.3 66.7 66.7 0.0 33.3
5 Narmada 7 - 14 - - - - - -
6 Bharuch 6 - 12 - - - - - -
7 Kheda 6 - 12 - - - - - -
8 Panchmahal 5 80.0 19 15 26.7 73.3 20.0 53.3 26.7
9 Rajkot 4 - 8 - - - - - -
10 Anand 3 - 6 - - - - - -
11 Navsari 2 - 8 - - - - - -
12 Amreli 2 - 4 - - - - - -
13 Nadiad 2 100.0 6 5 - 100.0 60.0 40.0 -
Total 100 10.0 231 28 17.9 82.1 39.3 35.7 25.0
19
CHAPTER-III
EMPLOYMENT 3.1 Introduction
3.1.1 The main objective of the evaluation study is to assess the extent of
Implementation of the Minimum Wages Act, 1948 in the Stone
Breaking and Stone Crushing industry in Gujarat State. To assess
this, it is important to study the pattern of employment in the
industry. The sample units have been distributed in different
employment size classes of workers. The units have been divided
into three broad categories; units employing up to 9 workers,
between 10-19 workers and above 19 workers.
3.1.2 As the minimum wages are fixed on the basis of skill, the workers
in the sample units have further been classified into three skill
categories i.e. Skilled, Semi-skilled and Unskilled. It is found that
no highly skilled worker is employed in the Stone Breaking and
Stone Crushing industry in any of the units surveyed.
3.1.3 Analysis of characteristics like employment size of the sample
units, proportion of manual and non-manual workers, methods of
recruitment, women employment etc. is discussed in the following
paragraphs.
20
BOX-III
Employment Characteristics
Employment size 1-9 workers units : 85.0%
Employment size 10-19 workers units : 13.0%
Manual Workers employed in the sample units : 91.7%
Directly Employed Workers among Manual Workers : 97.8%
Time Rated Directly Employed Manual Workers : 93.1%
Units Employing Women workers : 13.0%
Skilled Manual workers : 17.2%
Semi- skilled Manual workers : 10.0%
Un-skilled Manual workers : 72.8%
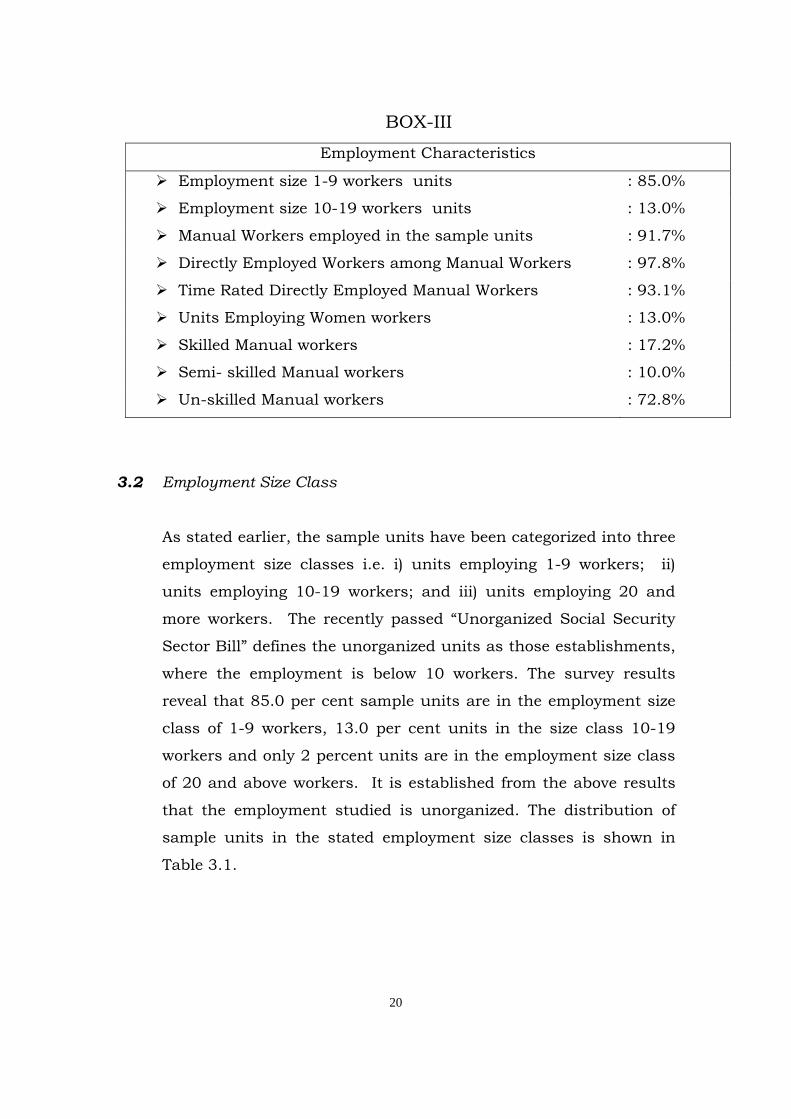
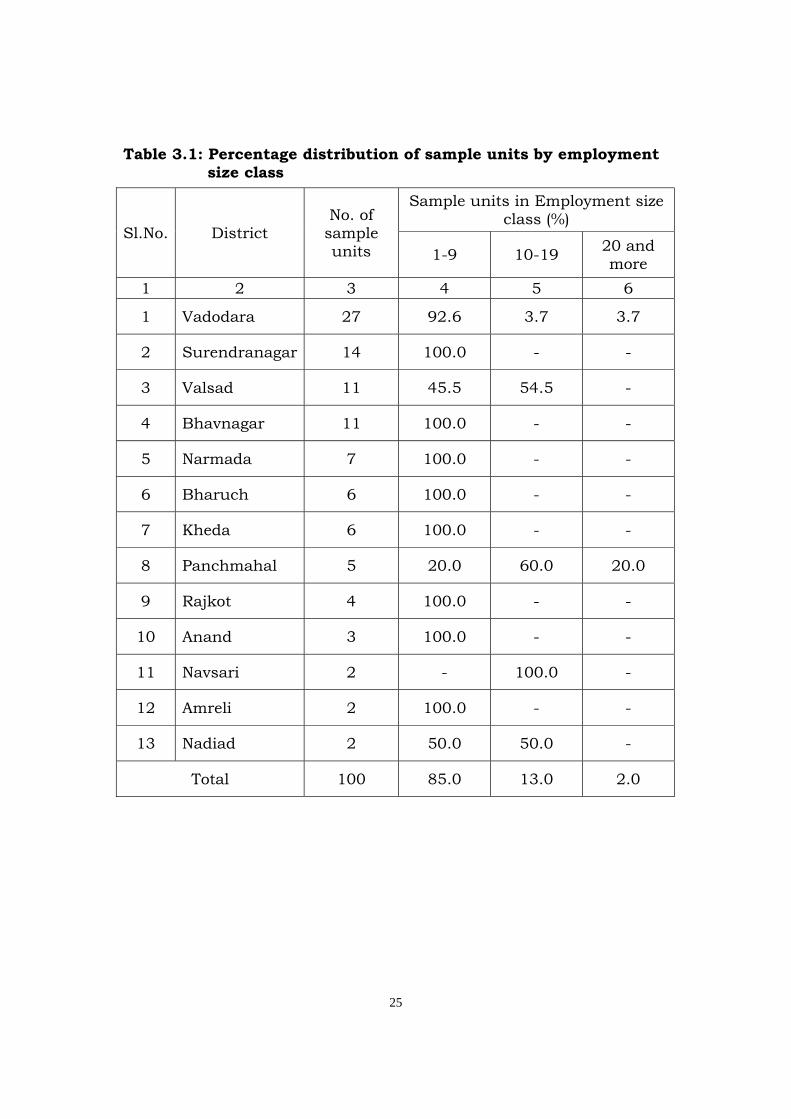
3.2 Employment Size Class
As stated earlier, the sample units have been categorized into three
employment size classes i.e. i) units employing 1-9 workers; ii)
units employing 10-19 workers; and iii) units employing 20 and
more workers. The recently passed “Unorganized Social Security
Sector Bill” defines the unorganized units as those establishments,
where the employment is below 10 workers. The survey results
reveal that 85.0 per cent sample units are in the employment size
class of 1-9 workers, 13.0 per cent units in the size class 10-19
workers and only 2 percent units are in the employment size class
of 20 and above workers. It is established from the above results
that the employment studied is unorganized. The distribution of
sample units in the stated employment size classes is shown in
Table 3.1.
21
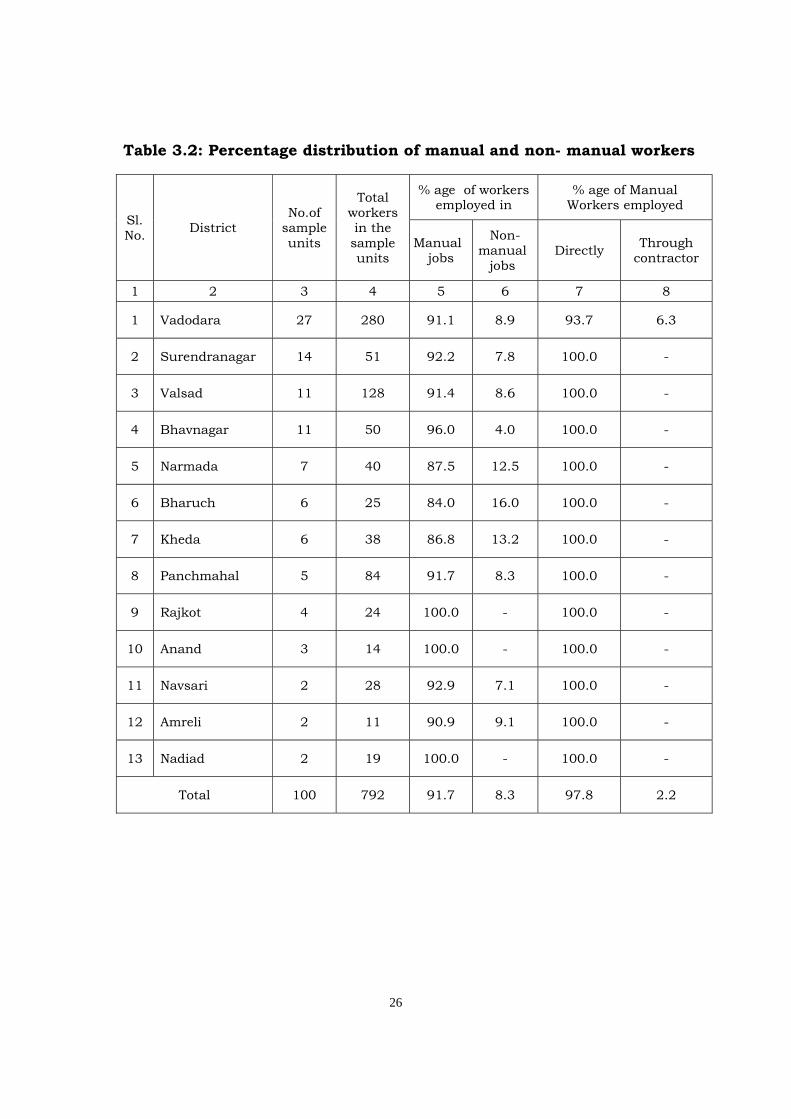
3.3 Manual/Non-Manual Workers
3.3.1 The jobs performed by the working force can broadly be classified
as manual and non-manual depending on the physical labour
involved and the skill required for accomplishing them. Table 3.2
presents the distribution of workers employed in the sample units
by manual and non-manual category. It may be observed from the
table that 91.7 per cent workers are engaged in manual jobs and
rest 8.3 per cent in non-manual jobs. The results clearly indicate
that the industry is labour intensive as the non-manual jobs are
very few.
3.3.2 The information on the mode of employment i.e. directly employed
or employed through contractor is also collected in the survey. The
results reveal that most of the workers (97.8) per cent are directly
employed. Only in vadodara district 16 workers are found
employed through contractors.
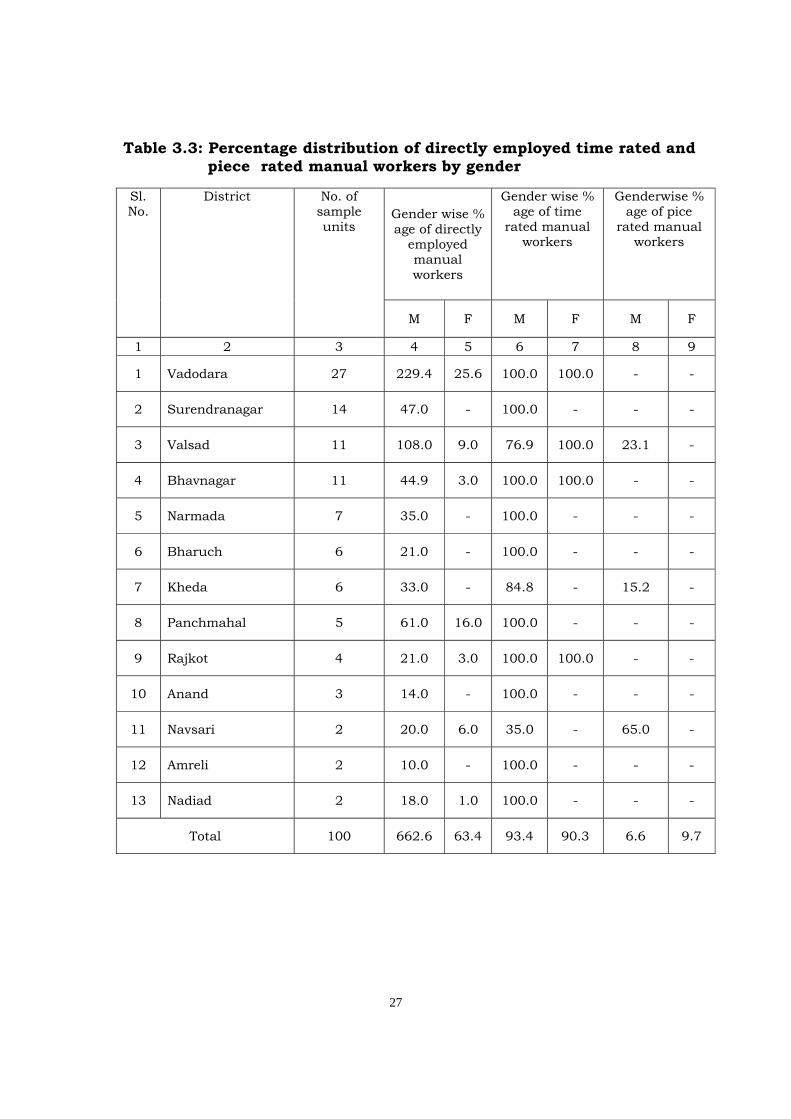
3.4 Workers by Gender
3.4.1 The distribution of directly employed manual workers by gender
and their mode of payment are depicted in Table 3.3. Most of the
directly employed manual workers are male. The results reveal that
only 8.7 per cent women workers are employed as manual directly
employed in the sampled units. The highest (23.1 per cent)
proportion of women is in Navsari district.
3.4.2 Further, the information is collected on the mode of payment to
the workers. As the output of workers in stone crushing and
breaking work is difficult to quantify, most of the workers are paid
on time-rate basis. The results reveal that 93.1 per cent workers
are getting their wages on this basis. The piece rated workers are
22
employed only in Valsad, Kheda and Navsari district in which only
6.9 per cent of the directly employed manual workers are
employed. The gender wise distribution of time rated and piece
rated manual workers is presented in table 3.3.
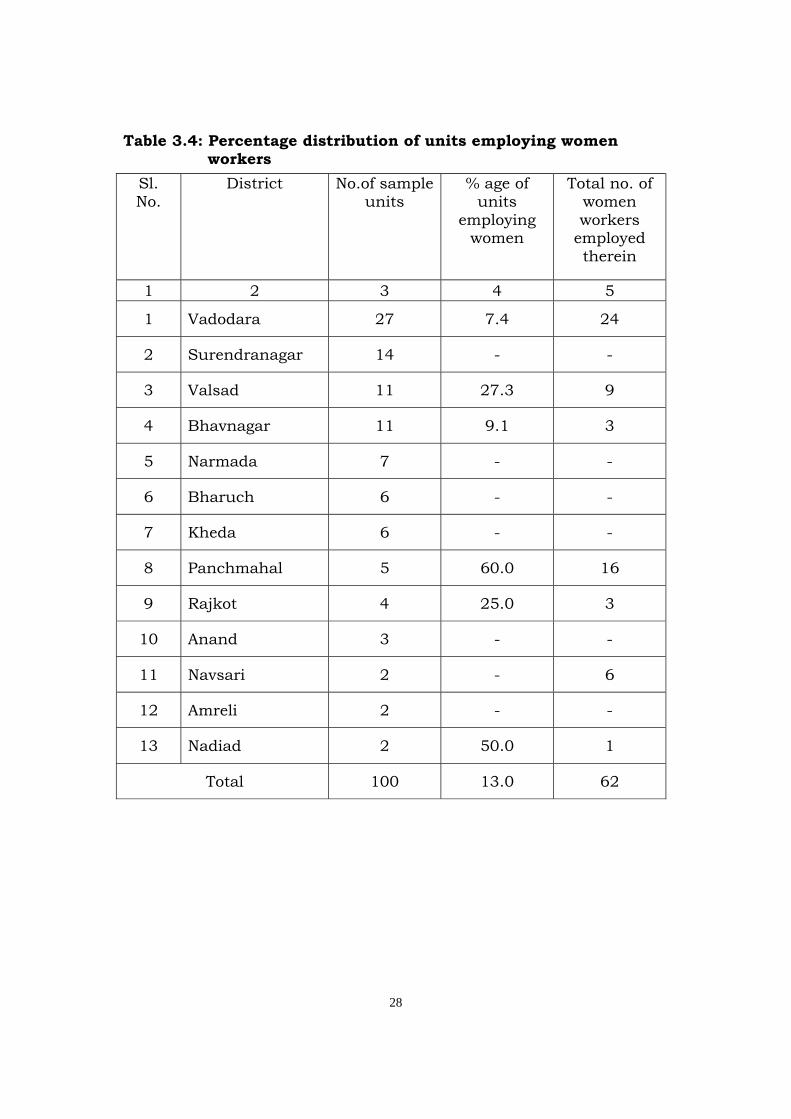
3.5 Employment of women workers
Table 3.4 presents the district-wise distribution of sample units
employing women workers. It may be seen from the table that only
11 per cent units are employing women workers. The employment
of women workers in the industry is not very significant because
probably due to the reason that more physical activity is involved
in the stone breaking and crushing process. The total women
workers employed in the sampled units are 62 only and most of
them are reported from Vadodara and Panchmahal district.
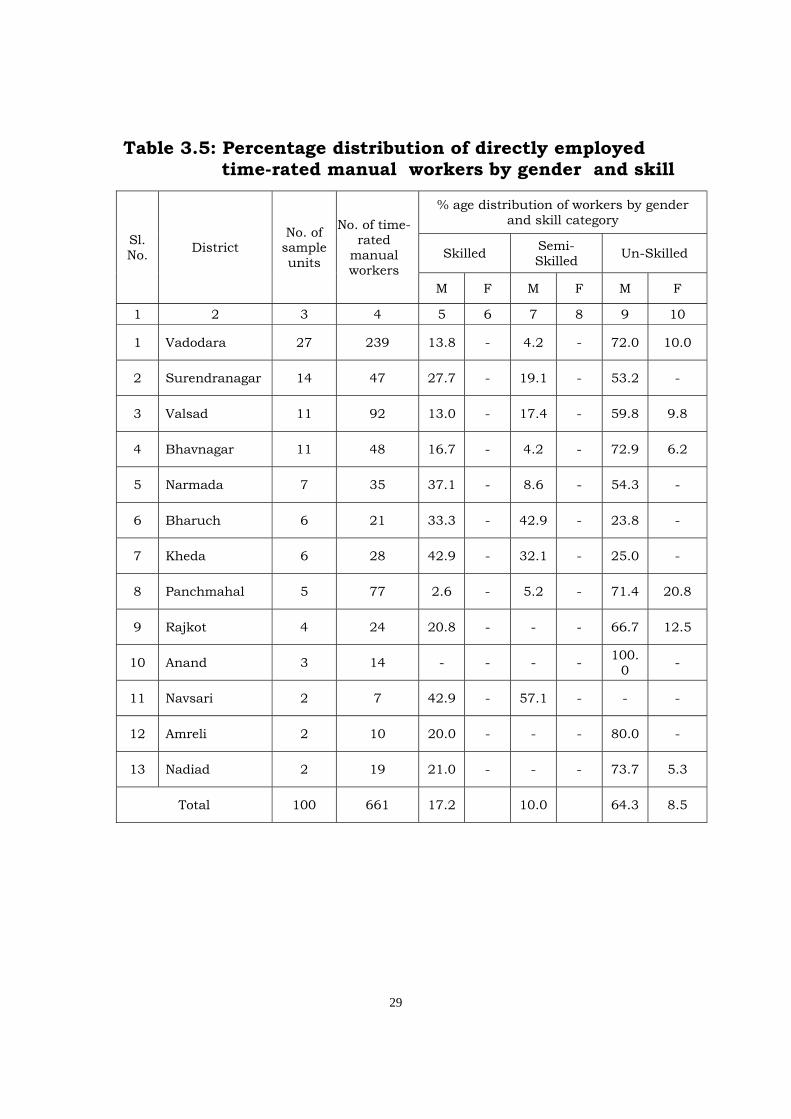
3.6 Skill wise Manual Workers
3.6.1 As discussed in the earlier paragraphs, the employment in the
sampled units is collected skill-wise i.e. skilled, semi-skilled and
un-skilled workers. Table 3.5 presents the distribution of time
rated directly employed manual workers by gender and skill. It
may be seen from the table that majority of the workers are
employed in un-skilled occupations. About 73 per cent workers are
working in un-skilled jobs, followed by about 17 per cent in skilled
jobs and remaining 10 percent in semi-skilled jobs.
3.6.2 The results further reveal that no women worker is employed in
any skilled and semi-skilled category. In Navsari and Kheda
districts each 42.9 per cent workers are engaged in skilled jobs,
which is quite significant as compared to other districts.
23
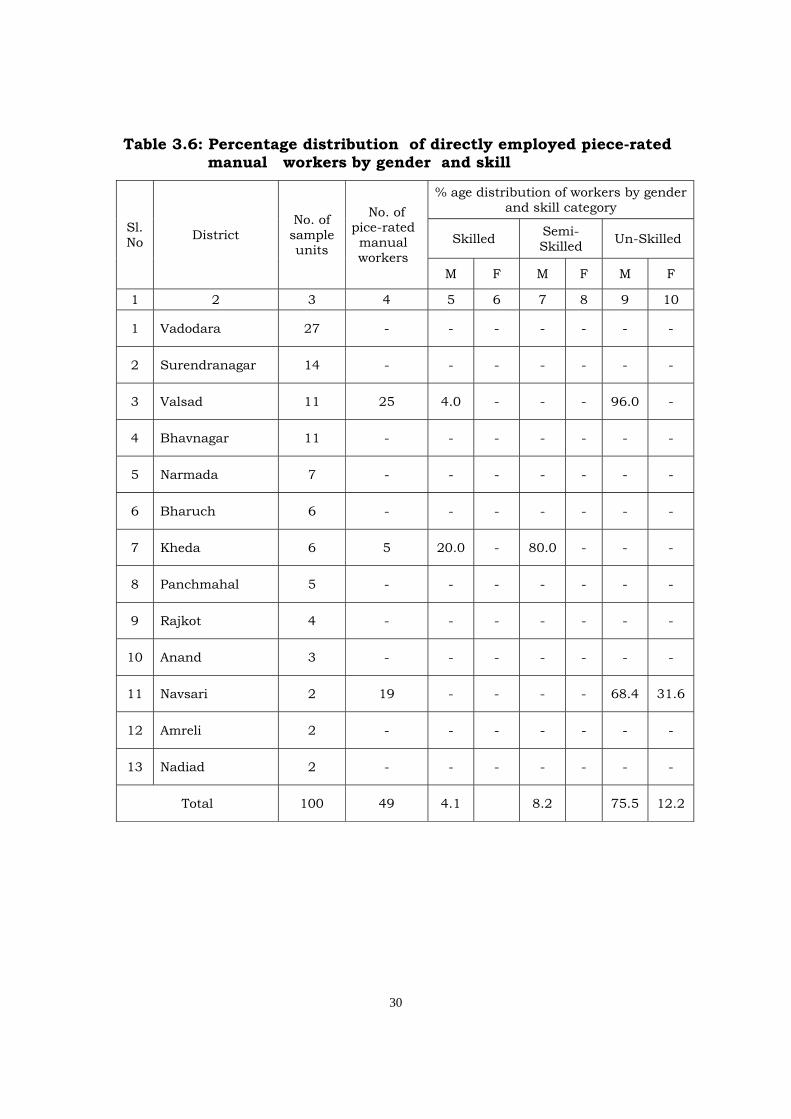
3.6.3 The piece rated workers are reported in Valsad, Kheda and Navsari
district only. In the piece rated category, majority of the workers
are employed in unskilled occupations. Only 4 per cent are found
working in the skilled category jobs. District wise distribution of
directly employed piece rated manual workers by gender and skill
is presented in Table 3.6.
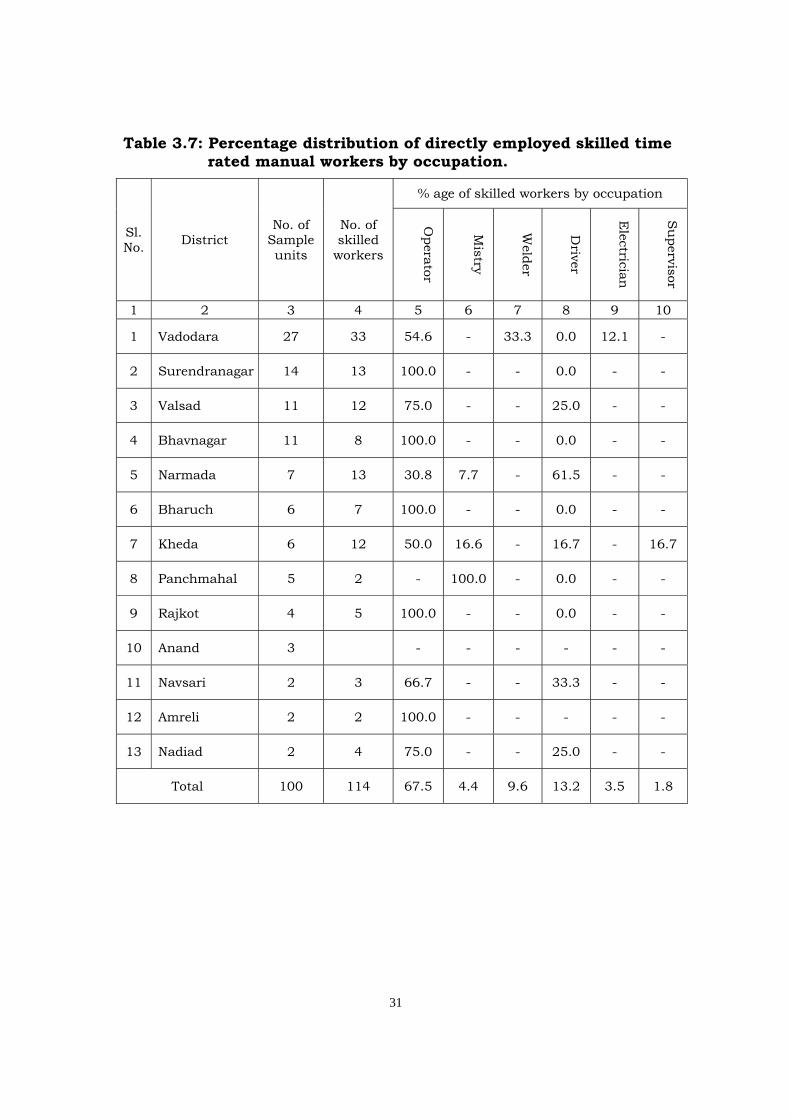
3.7 Occupation Wise Manual Workers
3.7.1 An attempt has been made to present occupation wise distribution
of skilled, semi-skilled and un-skilled time rated manual workers.
It may be observed from the table, that there are six occupations in
the skilled category viz. Operator, Mistry, Welder, Driver,
Electrician and Supervisor. As already stated no women worker is
employed in this category. The majority of skilled workers are
employed as Operator category (67.5 per cent) followed by Driver
(13.2 per cent), Welder (9.6 per cent), Mistry (4.4 per cent),
Electrician (3.5 per cent) and Supervisor (1.8 per cent). The details
are presented in Table 3.7.
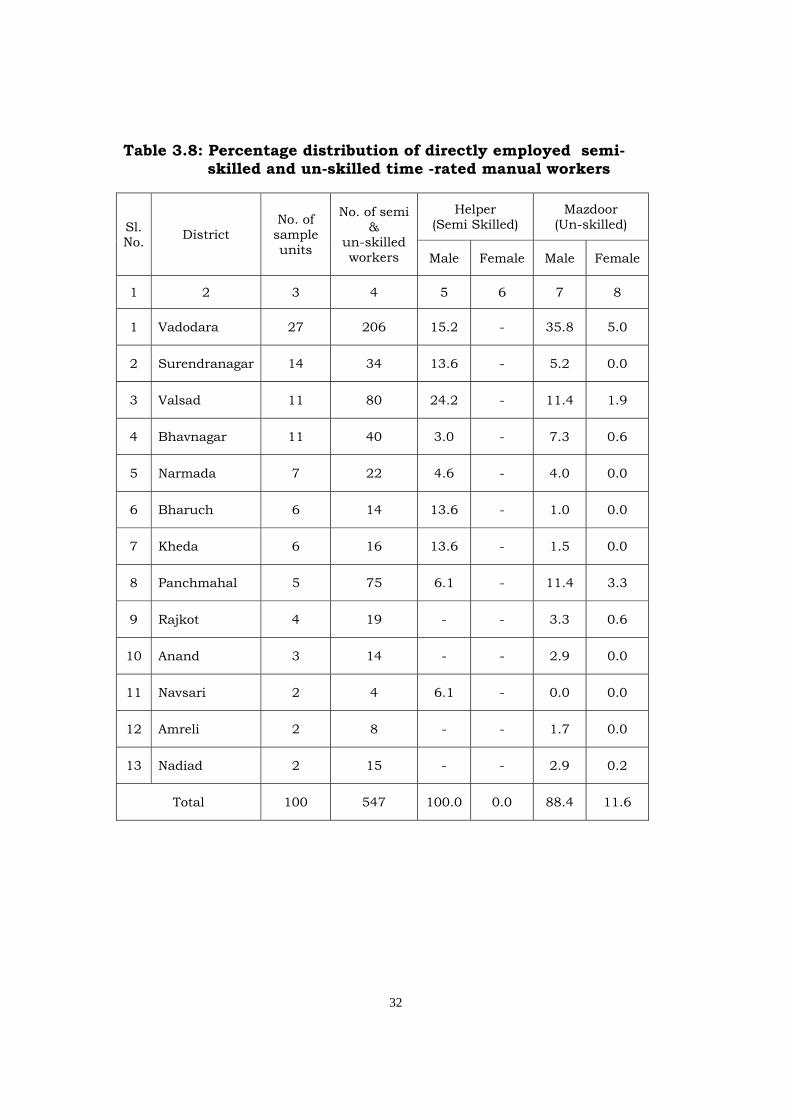
3.7.2 Occupation-wise details of directly employed semiskilled and
unskilled time rated manual workers are presented in Table 3.8. In
semi-skilled category, all the workers are male and engaged as
Helpers. The maximum proportion of Helpers is reported in Valsad
district (24.2 per cent). Among unskilled workers, 88.4 per cent are
male and 11.6 per cent female engaged in mazdoor occupation.
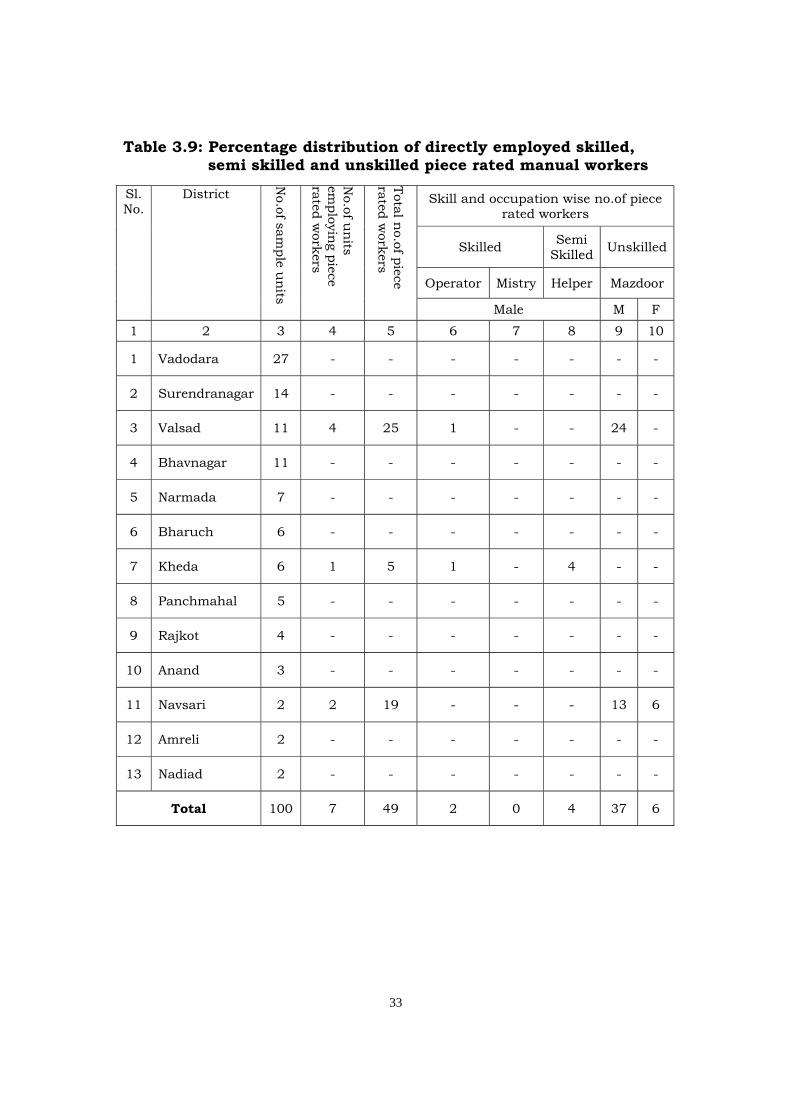
3.7.3 Table 3.9 presents occupation wise data on directly employed
skilled, semi skilled and unskilled piece rated manual workers. The
piece rated workers are observed in the sample units in Valsad,
Kheda and Navsari districts only. Majority of the piece rated

24
workers are employed in un-skilled jobs. In the skilled category of
occupations, only 2 Operators are reported as piece-rated.
~~0~~
25
Table 3.1: Percentage distribution of sample units by employment size class
Sl.No. District No. of
sample units
Sample units in Employment size class (%)
1-9 10-19 20 and more
1 2 3 4 5 6
1 Vadodara 27 92.6 3.7 3.7
2 Surendranagar 14 100.0 - -
3 Valsad 11 45.5 54.5 -
4 Bhavnagar 11 100.0 - -
5 Narmada 7 100.0 - -
6 Bharuch 6 100.0 - -
7 Kheda 6 100.0 - -
8 Panchmahal 5 20.0 60.0 20.0
9 Rajkot 4 100.0 - -
10 Anand 3 100.0 - -
11 Navsari 2 - 100.0 -
12 Amreli 2 100.0 - -
13 Nadiad 2 50.0 50.0 -
Total 100 85.0 13.0 2.0
26
Table 3.2: Percentage distribution of manual and non- manual workers
Sl. No. District
No.of sample units
Total workers in the sample units
% age of workers employed in
% age of Manual Workers employed
Manual jobs
Non-manual
jobs Directly Through
contractor
1 2 3 4 5 6 7 8
1 Vadodara 27 280 91.1 8.9 93.7 6.3
2 Surendranagar 14 51 92.2 7.8 100.0 -
3 Valsad 11 128 91.4 8.6 100.0 -
4 Bhavnagar 11 50 96.0 4.0 100.0 -
5 Narmada 7 40 87.5 12.5 100.0 -
6 Bharuch 6 25 84.0 16.0 100.0 -
7 Kheda 6 38 86.8 13.2 100.0 -
8 Panchmahal 5 84 91.7 8.3 100.0 -
9 Rajkot 4 24 100.0 - 100.0 -
10 Anand 3 14 100.0 - 100.0 -
11 Navsari 2 28 92.9 7.1 100.0 -
12 Amreli 2 11 90.9 9.1 100.0 -
13 Nadiad 2 19 100.0 - 100.0 -
Total 100 792 91.7 8.3 97.8 2.2
27
Table 3.3: Percentage distribution of directly employed time rated and piece rated manual workers by gender
Sl. No.
District No. of sample units
Gender wise % age of directly
employed manual workers
Gender wise % age of time
rated manual workers
Genderwise % age of pice
rated manual workers
M F M F M F
1 2 3 4 5 6 7 8 9
1 Vadodara 27 229.4 25.6 100.0 100.0 - -
2 Surendranagar 14 47.0 - 100.0 - - -
3 Valsad 11 108.0 9.0 76.9 100.0 23.1 -
4 Bhavnagar 11 44.9 3.0 100.0 100.0 - -
5 Narmada 7 35.0 - 100.0 - - -
6 Bharuch 6 21.0 - 100.0 - - -
7 Kheda 6 33.0 - 84.8 - 15.2 -
8 Panchmahal 5 61.0 16.0 100.0 - - -
9 Rajkot 4 21.0 3.0 100.0 100.0 - -
10 Anand 3 14.0 - 100.0 - - -
11 Navsari 2 20.0 6.0 35.0 - 65.0 -
12 Amreli 2 10.0 - 100.0 - - -
13 Nadiad 2 18.0 1.0 100.0 - - -
Total 100 662.6 63.4 93.4 90.3 6.6 9.7
28
Table 3.4: Percentage distribution of units employing women workers
Sl. No.
District No.of sample units
% age of units
employing women
Total no. of women workers
employed therein
1 2 3 4 5
1 Vadodara 27 7.4 24
2 Surendranagar 14 - -
3 Valsad 11 27.3 9
4 Bhavnagar 11 9.1 3
5 Narmada 7 - -
6 Bharuch 6 - -
7 Kheda 6 - -
8 Panchmahal 5 60.0 16
9 Rajkot 4 25.0 3
10 Anand 3 - -
11 Navsari 2 - 6
12 Amreli 2 - -
13 Nadiad 2 50.0 1
Total 100 13.0 62
29
Table 3.5: Percentage distribution of directly employed time-rated manual workers by gender and skill
Sl. No. District
No. of sample units
No. of time-rated
manual workers
% age distribution of workers by gender and skill category
Skilled Semi-Skilled Un-Skilled
M F M F M F
1 2 3 4 5 6 7 8 9 10
1 Vadodara 27 239 13.8 - 4.2 - 72.0 10.0
2 Surendranagar 14 47 27.7 - 19.1 - 53.2 -
3 Valsad 11 92 13.0 - 17.4 - 59.8 9.8
4 Bhavnagar 11 48 16.7 - 4.2 - 72.9 6.2
5 Narmada 7 35 37.1 - 8.6 - 54.3 -
6 Bharuch 6 21 33.3 - 42.9 - 23.8 -
7 Kheda 6 28 42.9 - 32.1 - 25.0 -
8 Panchmahal 5 77 2.6 - 5.2 - 71.4 20.8
9 Rajkot 4 24 20.8 - - - 66.7 12.5
10 Anand 3 14 - - - - 100.0 -
11 Navsari 2 7 42.9 - 57.1 - - -
12 Amreli 2 10 20.0 - - - 80.0 -
13 Nadiad 2 19 21.0 - - - 73.7 5.3
Total 100 661 17.2 10.0 64.3 8.5
30
Table 3.6: Percentage distribution of directly employed piece-rated manual workers by gender and skill
Sl. No District
No. of sample units
No. of pice-rated manual workers
% age distribution of workers by gender and skill category
Skilled Semi-Skilled Un-Skilled
M F M F M F
1 2 3 4 5 6 7 8 9 10
1 Vadodara 27 - - - - - - -
2 Surendranagar 14 - - - - - - -
3 Valsad 11 25 4.0 - - - 96.0 -
4 Bhavnagar 11 - - - - - - -
5 Narmada 7 - - - - - - -
6 Bharuch 6 - - - - - - -
7 Kheda 6 5 20.0 - 80.0 - - -
8 Panchmahal 5 - - - - - - -
9 Rajkot 4 - - - - - - -
10 Anand 3 - - - - - - -
11 Navsari 2 19 - - - - 68.4 31.6
12 Amreli 2 - - - - - - -
13 Nadiad 2 - - - - - - -
Total 100 49 4.1 8.2 75.5 12.2
31
Table 3.7: Percentage distribution of directly employed skilled time rated manual workers by occupation.
Sl. No. District
No. of Sample units
No. of skilled
workers
% age of skilled workers by occupation
Operator
Mistry
Welder
Driver
Electrician
Su
pervisor
1 2 3 4 5 6 7 8 9 10
1 Vadodara 27 33 54.6 - 33.3 0.0 12.1 -
2 Surendranagar 14 13 100.0 - - 0.0 - -
3 Valsad 11 12 75.0 - - 25.0 - -
4 Bhavnagar 11 8 100.0 - - 0.0 - -
5 Narmada 7 13 30.8 7.7 - 61.5 - -
6 Bharuch 6 7 100.0 - - 0.0 - -
7 Kheda 6 12 50.0 16.6 - 16.7 - 16.7
8 Panchmahal 5 2 - 100.0 - 0.0 - -
9 Rajkot 4 5 100.0 - - 0.0 - -
10 Anand 3 - - - - - -
11 Navsari 2 3 66.7 - - 33.3 - -
12 Amreli 2 2 100.0 - - - - -
13 Nadiad 2 4 75.0 - - 25.0 - -
Total 100 114 67.5 4.4 9.6 13.2 3.5 1.8
32
Table 3.8: Percentage distribution of directly employed semi- skilled and un-skilled time -rated manual workers
Sl. No. District
No. of sample units
No. of semi &
un-skilled workers
Helper (Semi Skilled)
Mazdoor (Un-skilled)
Male Female Male Female
1 2 3 4 5 6 7 8
1 Vadodara 27 206 15.2 - 35.8 5.0
2 Surendranagar 14 34 13.6 - 5.2 0.0
3 Valsad 11 80 24.2 - 11.4 1.9
4 Bhavnagar 11 40 3.0 - 7.3 0.6
5 Narmada 7 22 4.6 - 4.0 0.0
6 Bharuch 6 14 13.6 - 1.0 0.0
7 Kheda 6 16 13.6 - 1.5 0.0
8 Panchmahal 5 75 6.1 - 11.4 3.3
9 Rajkot 4 19 - - 3.3 0.6
10 Anand 3 14 - - 2.9 0.0
11 Navsari 2 4 6.1 - 0.0 0.0
12 Amreli 2 8 - - 1.7 0.0
13 Nadiad 2 15 - - 2.9 0.2
Total 100 547 100.0 0.0 88.4 11.6
33
Table 3.9: Percentage distribution of directly employed skilled, semi skilled and unskilled piece rated manual workers
Sl. No.
District
No.of sam
ple units
No.of u
nits
employin
g piece rated w
orkers
Total no.of piece
rated workers
Skill and occupation wise no.of piece rated workers
Skilled Semi Skilled Unskilled
Operator Mistry Helper Mazdoor
Male M F
1 2 3 4 5 6 7 8 9 10
1 Vadodara 27 - - - - - - -
2 Surendranagar 14 - - - - - - -
3 Valsad 11 4 25 1 - - 24 -
4 Bhavnagar 11 - - - - - - -
5 Narmada 7 - - - - - - -
6 Bharuch 6 - - - - - - -
7 Kheda 6 1 5 1 - 4 - -
8 Panchmahal 5 - - - - - - -
9 Rajkot 4 - - - - - - -
10 Anand 3 - - - - - - -
11 Navsari 2 2 19 - - - 13 6
12 Amreli 2 - - - - - - -
13 Nadiad 2 - - - - - - -
Total 100 7 49 2 0 4 37 6
34
CHAPTER – IV
WAGES, EARNINGS AND HOURS OF WORK
4.1 Introduction
4.1.1 The wages fixed and revised under the Minimum Wage Act, 1948
include all remunerations which can be expressed in terms of
money and are payable to the workers under the Minimum Wages
Act, 1948. The Act is a protective as well as welfare legislation
guaranteeing the payment of minimum rates of wages to the
workers in various scheduled employments. The statutory rates of
minimum wages for different categories of workers under the
scheduled employments are fixed, revised and notified by the
Appropriate Government under the Minimum Wages Act, 1948
from time to time.
4.1.2 In the Stone Breaking and Stone Crushing employment in
Gujarat, the state Government is the Competent Authority for
fixing and revising the Minimum Wages. The present chapter deals
with various issues which have direct bearing on the working and
economic conditions of sampled workers both directly employed
and employed through contractors and time rated or piece rated.
Wages and earnings, hours of work, overtime, weekly off and rest
interval, etc. are discussed in the following paras:
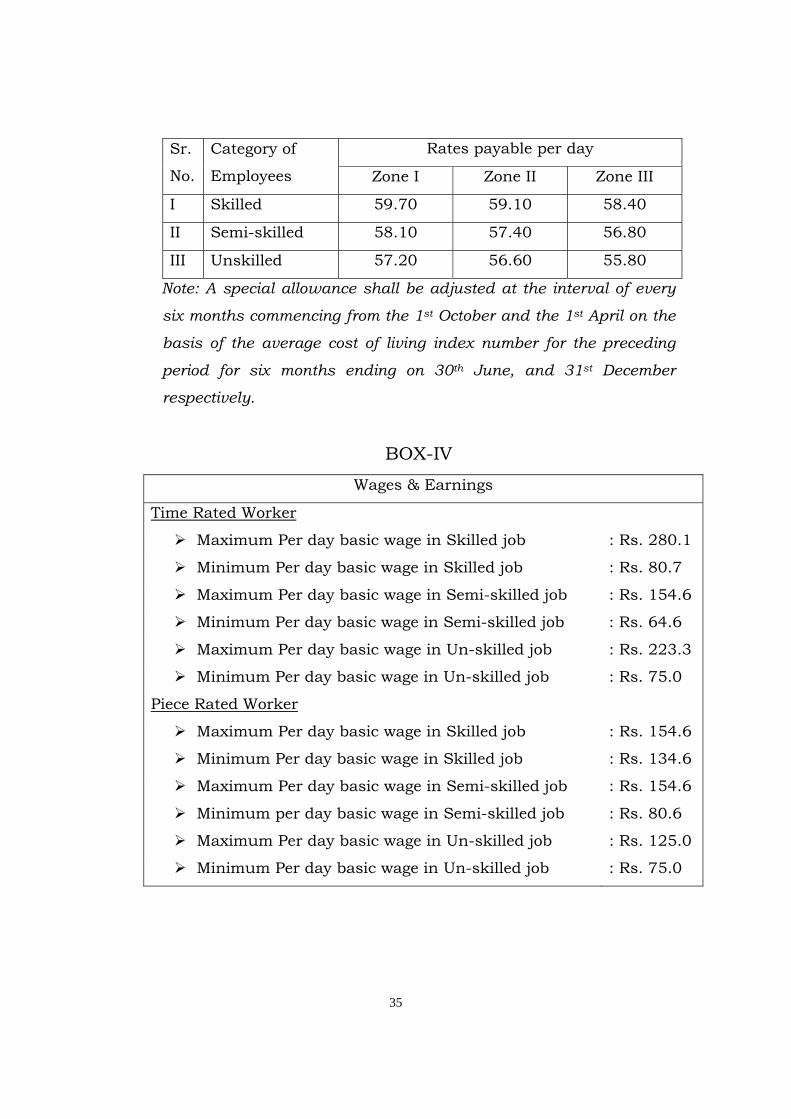
4.2 Prescribed Rates of Minimum Wages
Per day rates of minimum wages have been fixed zone wise for the
three categories of workers i.e. skilled, semi-skilled and un-skilled.
The basic rates of wages as fixed by the Labour and Employment
Department, Government of Gujarat are as follows:
35
Sr.
No.
Category of
Employees
Rates payable per day
Zone I Zone II Zone III
I Skilled 59.70 59.10 58.40
II Semi-skilled 58.10 57.40 56.80
III Unskilled 57.20 56.60 55.80
Note: A special allowance shall be adjusted at the interval of every
six months commencing from the 1st October and the 1st April on the
basis of the average cost of living index number for the preceding
period for six months ending on 30th June, and 31st December
respectively.
BOX-IV
Wages & Earnings
Time Rated Worker
Maximum Per day basic wage in Skilled job : Rs. 280.1
Minimum Per day basic wage in Skilled job : Rs. 80.7
Maximum Per day basic wage in Semi-skilled job : Rs. 154.6
Minimum Per day basic wage in Semi-skilled job : Rs. 64.6
Maximum Per day basic wage in Un-skilled job : Rs. 223.3
Minimum Per day basic wage in Un-skilled job : Rs. 75.0
Piece Rated Worker
Maximum Per day basic wage in Skilled job : Rs. 154.6
Minimum Per day basic wage in Skilled job : Rs. 134.6
Maximum Per day basic wage in Semi-skilled job
Minimum per day basic wage in Semi-skilled job
: Rs. 154.6
: Rs. 80.6
Maximum Per day basic wage in Un-skilled job : Rs. 125.0
Minimum Per day basic wage in Un-skilled job : Rs. 75.0
36
4.3 Mode of Payment and Wage Period
4.3.1 Section 3 (2) of the Minimum Wages Act, 1948 empowers
Appropriate Government to fix the minimum rates of wages on time
rate or on piece rate basis. As mentioned in the last chapter
majority of workers in Stone Breaking and Stone Crushing units
are time rated (93.1 per cent).
4.3.2 Section 3(3b) of the Minimum Wages Act, 1948 provides for
different wage periods ranging from hour to month. The study
however reveals that all the workers in the selected units are
monthly paid.
4.4 Basic Wages and Earnings of Manual Workers
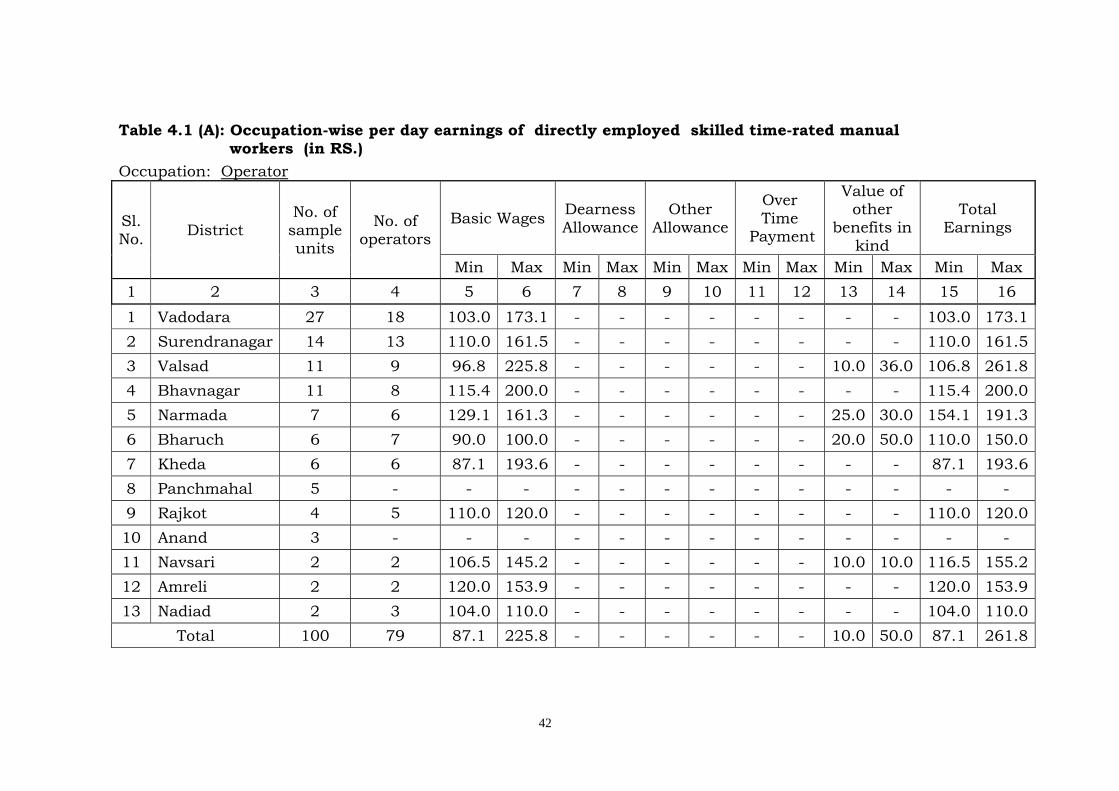
4.4.1 Occupation and district-wise per day basic wages and total
earnings of six skilled occupations viz. Operators, Mistry, Welder,
Driver, Electrician and Supervisor are presented in Table 4.1 (A-F)
respectively. The total earnings of workers are the sum of basic
wages, dearness allowances, over time payment, value of benefits
in kinds and other allowances paid to them.
4.4.2 From the table 4.1 (A) it may be observed that for Operator
occupation, maximum earnings of Rs.261.8 per day are reported in
valsad district whereas minimum of Rs.87.1 are in Kheda district.
The operators are employed in all districts under studied except
two districts.
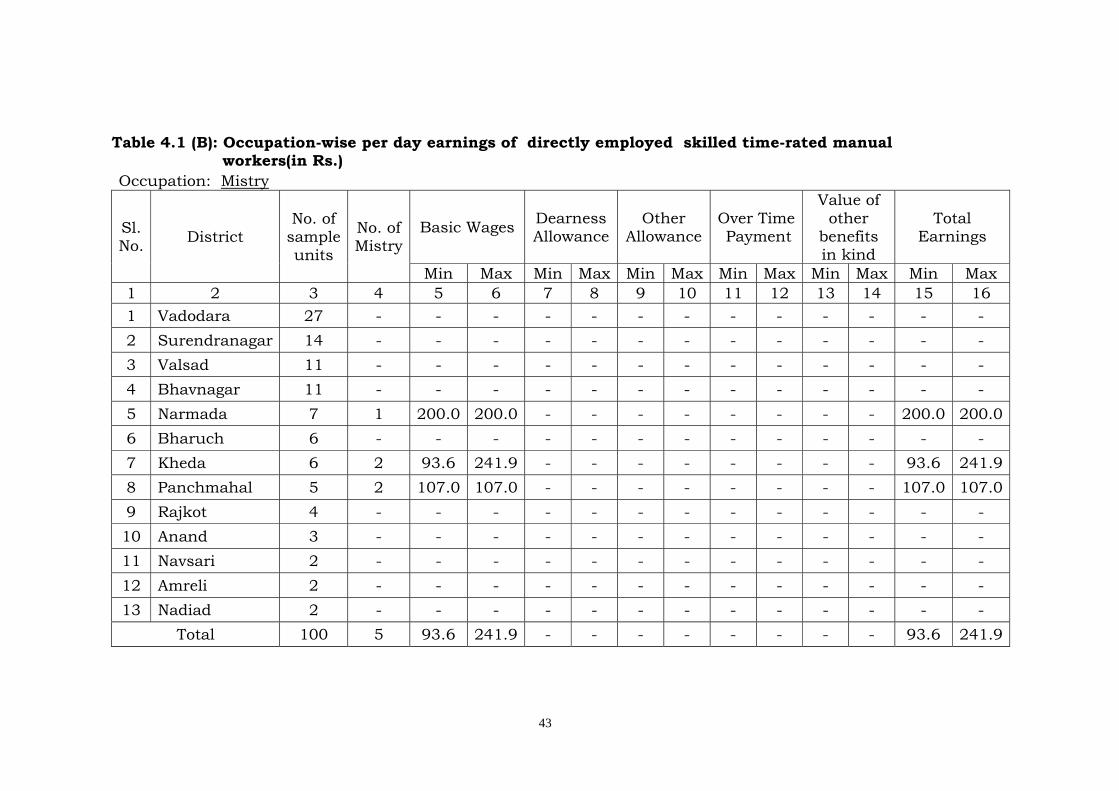
4.4.3 In case of Mistry occupation, Rs.241.9 per day earnings as
maximum and Rs. 93.6 per day earnings as minimum are reported
in Kheda district as shown in Table 4.1(B). The workers in this
37
occupation are found employed only in three districts viz.
Narmada, Kheda and Panchmahal.
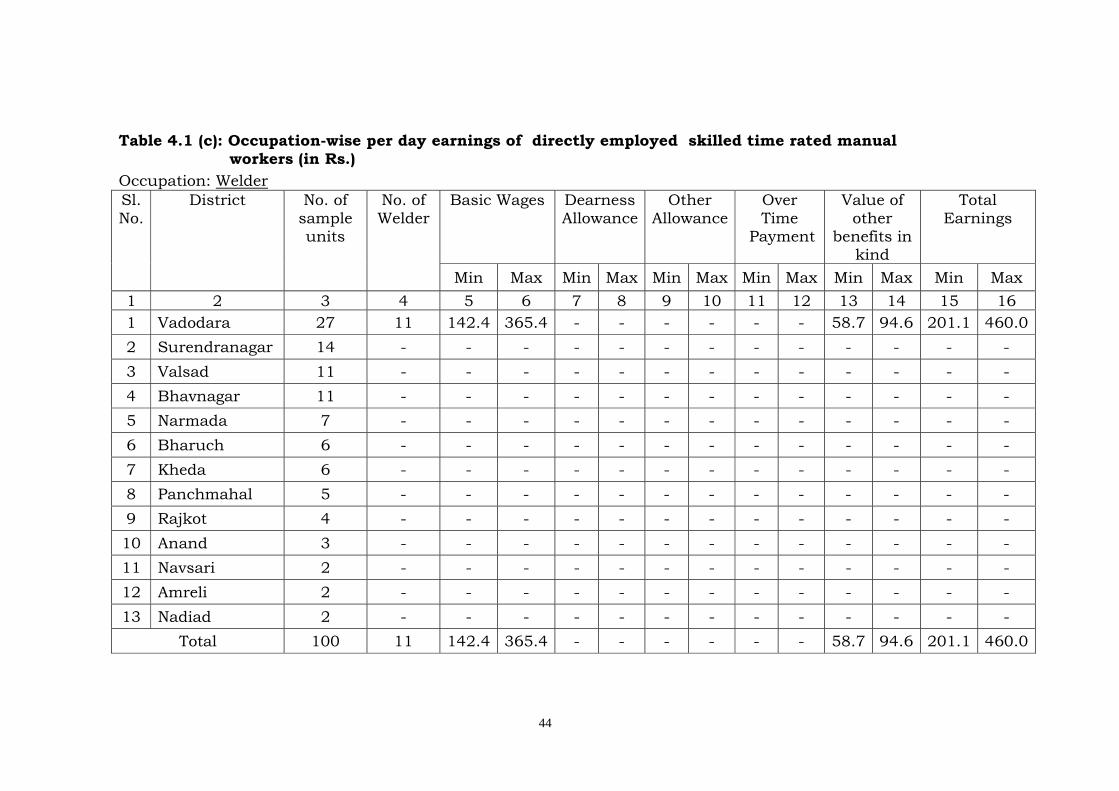
4.4.4 District wise earnings of workers employed in Welder occupation
are presented in Table 4.1 (C). It may be seen that Welders are
employed only in Vadodara district and their maximum earnings
are reported as Rs 460.0 and minimum Rs. 201.1.
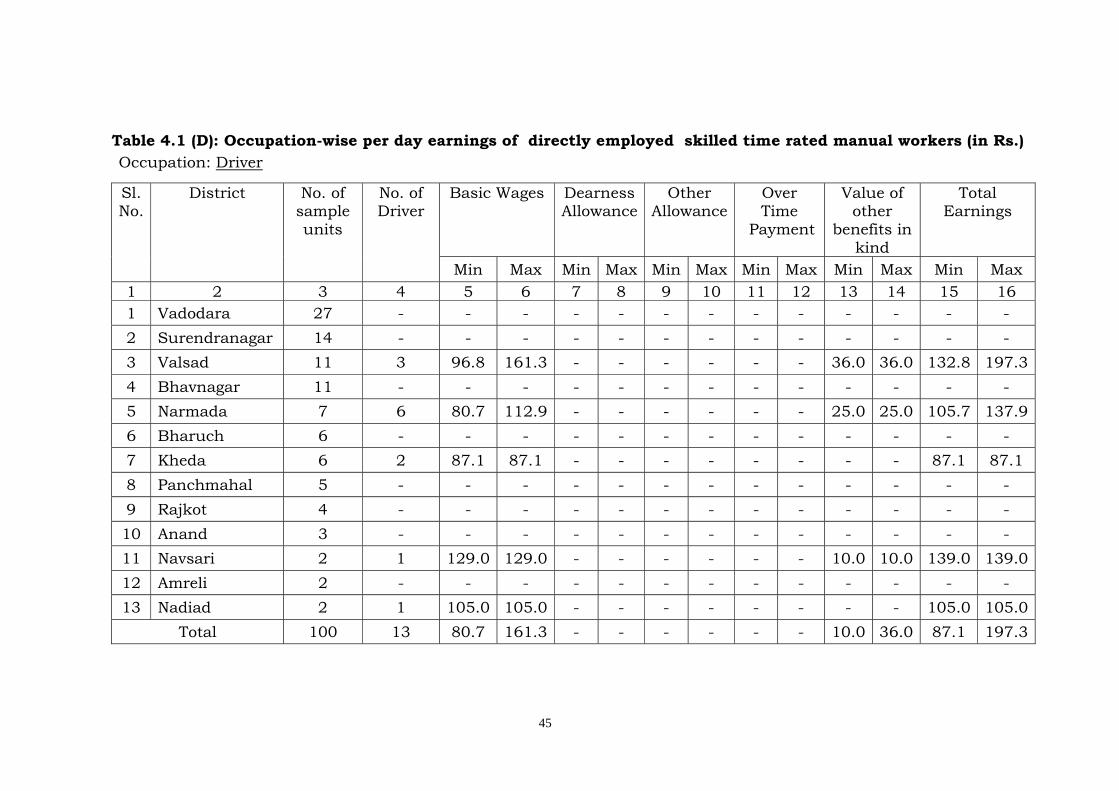
4.4.5 The details of earnings of the Driver occupation are presented in
Table 4.1 (D). Drivers are employed only in five districts. The
minimum per day earnings (Rs. 87.10) are reported in Kheda
district and maximum of Rs.197.3 per day earnings are in Valsad
district.
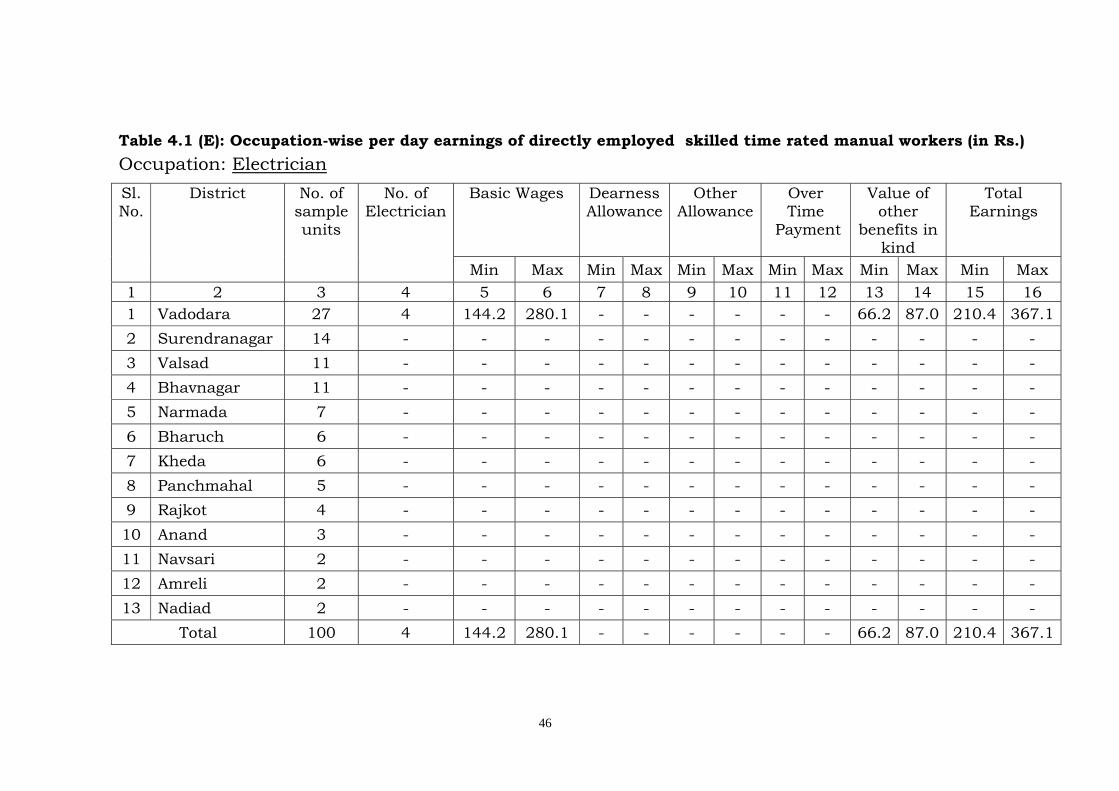
4.4.6 The workers in Electrician occupation are reported only in
vadodara district. The survey results reveal that Electrician earns
a maximum of Rs.367.1 per day and a minimum of Rs.210.4 per
day. The details are presented in Table 4.1 (E).
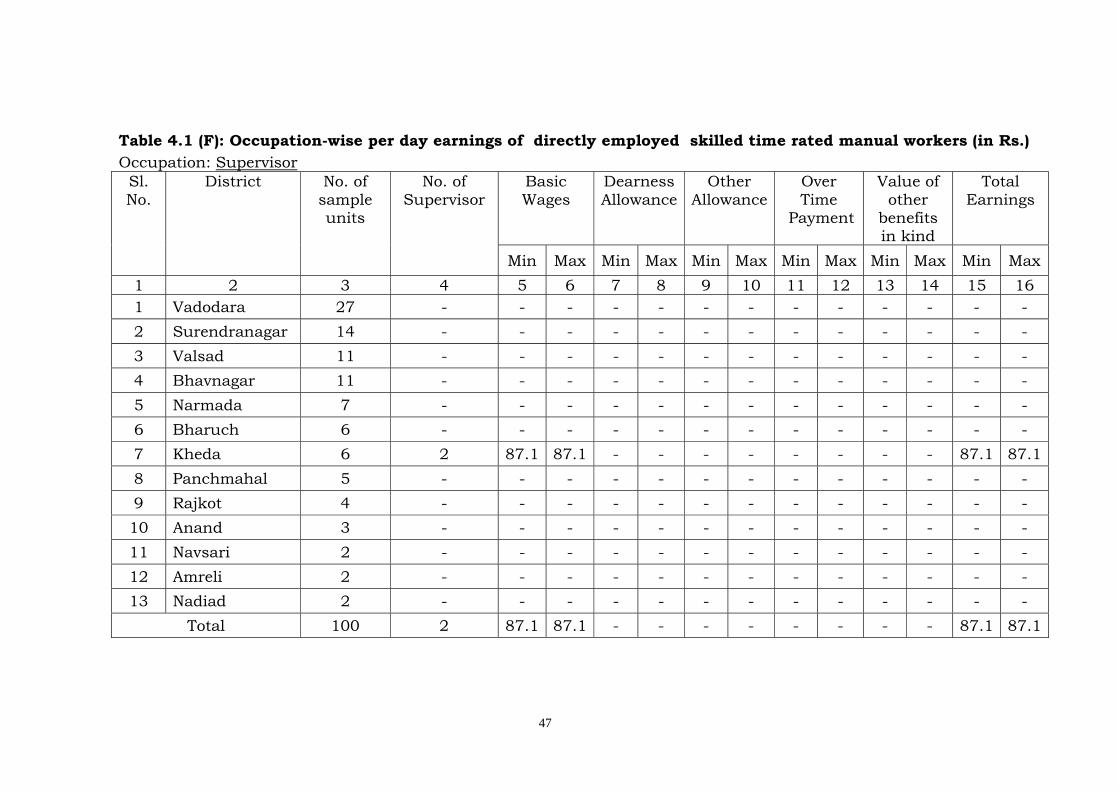
4.4.7 Further, the Supervisors are found working only in one sample
units of Kheda district. These two Supervisors have earnings of
same level. As much the minimum and maximum per day earnings
of this occupation are same i.e. of Rs 87.1 (Table 4.1(F)). No sample
unit was found paying dearness allowance to their skilled workers.
4.4.8 Table 4.2 presents occupation-wise per day earnings of directly
employed semi-skilled time rated manual workers. It may be
observed from the table that no dearness allowance or over time
payment is given to any worker. Further the results reveal that a
maximum of Rs. 154.6 per day earnings and minimum of Rs.80.6
are reported in Kheda district.
4.4.9 Gender-wise per day earnings of the un-skilled occupations
workers are given in Table 4.3 (A) and 4.3(B). It is observed from
38
the table 4.3 (A) that a maximum of Rs 223.3 per day earnings are
reported in Vadodara district and minimum of Rs.75.0 per day
earnings in Anand district. Payment of over time allowances is
reported only in one district. The details of male un-skilled workers
are given in Table 4.3(A).
4.4.10 The Table 4.3(B) presents the details of female un-skilled workers.
The women workers are found employed in five districts of Gujarat
state. A maximum of Rs. 200.8 per day earnings of women are
reported in Vadodara district and minimum of Rs. 80.0 in Valsad
district.
4.4.11 Table 4.4 presents the occupation-wise per day earnings of
directly employed piece rated skilled, semi-skilled and un-skilled
manual workers. In the skilled category of workers only Operators
are reported in Valsad and Kheda districts. A minimum of Rs.134.6
and maximum of Rs 154.6 per day earnings are reported in Valsad
and Kheda district respectively. Semi-skilled category of piece rated
workers is observed only in Kheda district. The un-skilled piece
rated workers are reported in two districts namely Valsad and
Navsari.
4.4.12 Only 16 workers employed through contractors are found working
in Vadodara district. All the 16 workers are un-skilled and their
minimum and maximum earnings are Rs 103.0 for both male and
female workers.
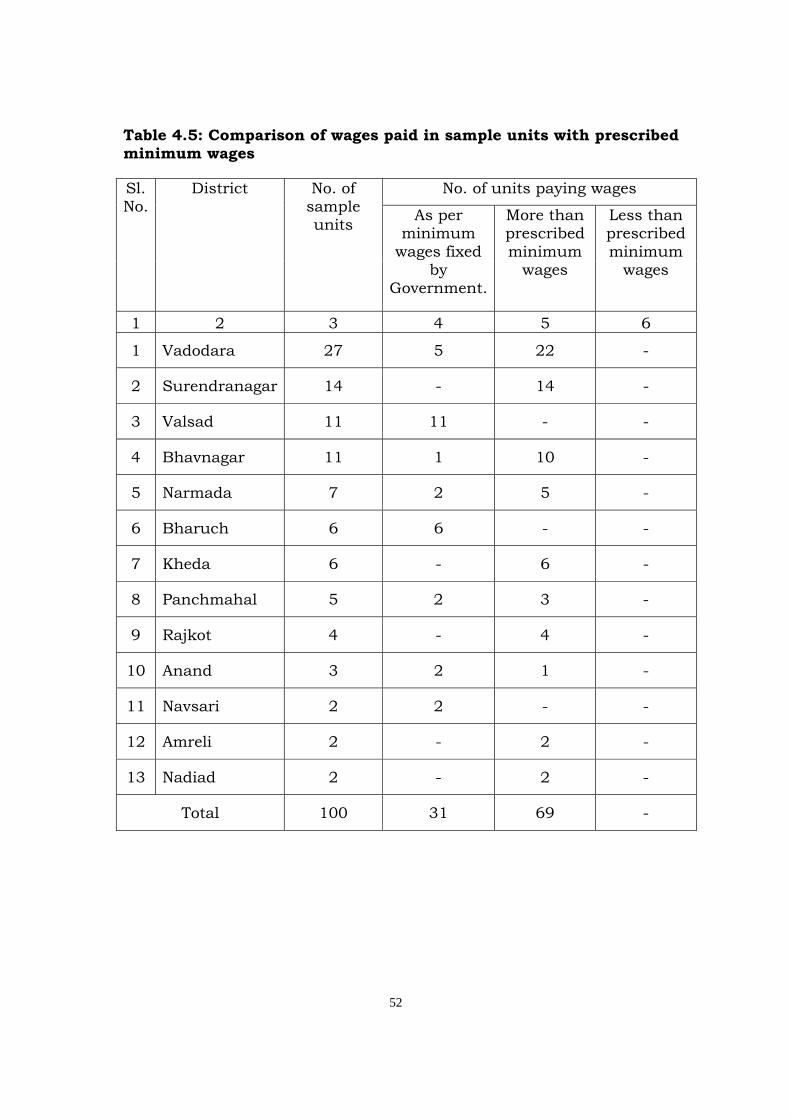
4.5 Payment of Lower Wages
Table 4.5 presents the distribution of sample units paying wages
as prescribed under the Minimum Wages Act, above the minimum
wages and below the minimum wages. The survey results reveal
that no worker is paid less than the prescribed minimum wages.
39
The units are paying wages to the workers either as per the
minimum wages prescribed by the appropriate authority or more.
BOX-IV (A)
Weekly off, Hours of work, Rest Interval
Units allowing weekly off with wages : 9.0%
Units allowing weekly off without wages : 72.0%
Workers reported 8 hours of work : 90.9%
Workers reported less than 8 hours of work : 9.1%
Workers reported rest interval b/w half to 1 hour : 57.1%
Workers reported rest interval more than 1 hour : 42.9%
Number of units employing women workers : 13.0%
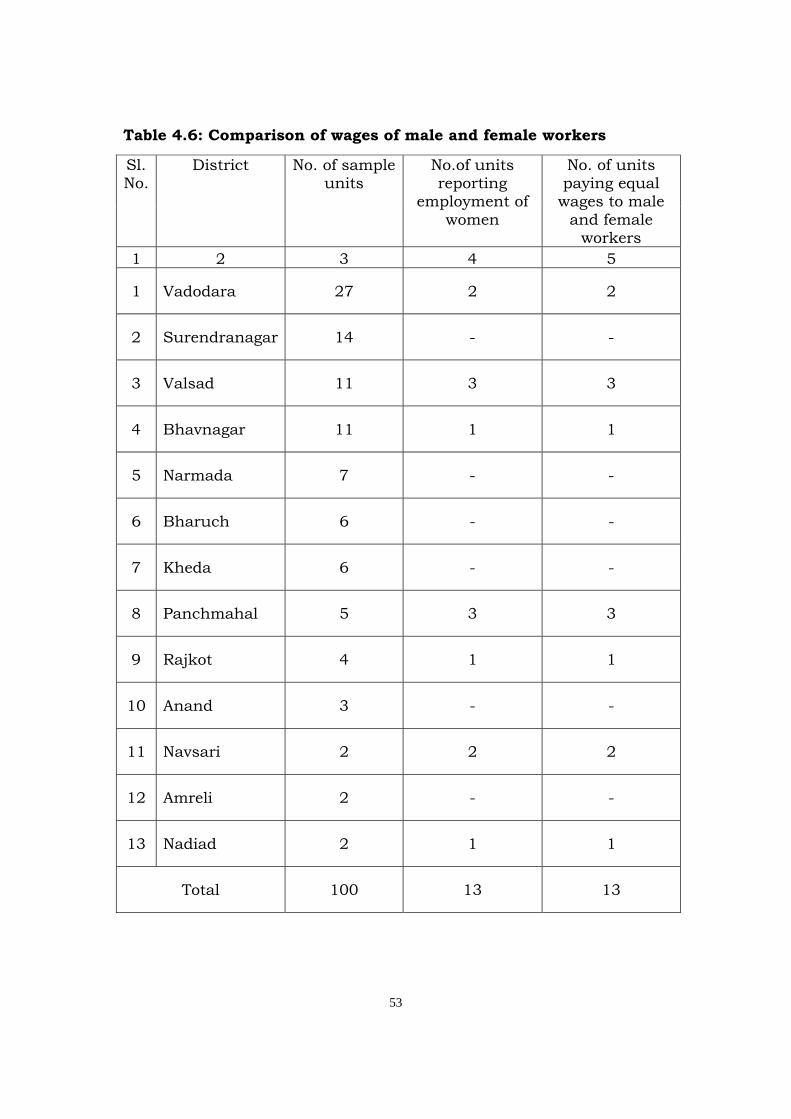
4.6 Payment of wages to women as compared to male workers
Table 4.6 presents information on comparison of wages paid to
men and women workers for similar work. The survey results
reveal that of the 100 sample units, 13 units reported employment
of women workers. All these units reported paying equal wages to
male and female workers for similar work.
4.7 Hours of Work, Rest Interval and Weekly Off
4.7.1 Under Section 13 of the Minimum Wages Act, 1948, the
Appropriate Government may (i) fix the number of hours of work
on a normal working day inclusive of one or more specified rest
intervals, (ii) provide for a day of rest in every period of 7 days
which shall be allowed to all employees or to any specified class of
employees and for the payment of remuneration in respect of such
a day of rest; and (iii) provide for payment for work on a day of rest
at a rate not less than the overtime rate. To assess the
40
implementation of the above provisions, information is collected in
respect of hours of work, rest interval and weekly off.
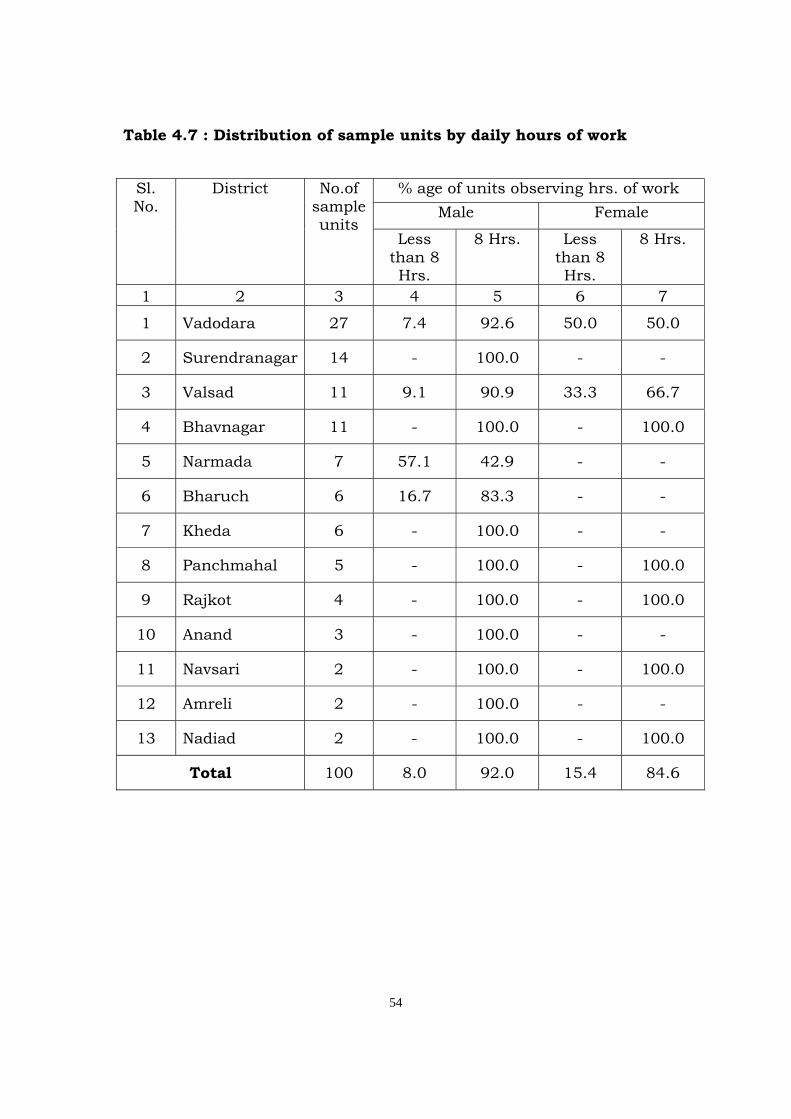
4.7.2 Table 4.7 presents the distribution of sample units by daily hours
of work for male and female workers separately. The result reveals
that in case of male workers 92 per cent units are observing 8
hours of work in a day and rest observe less than 8 hours of work.
For female workers, 84.6 per cent units reported 8 hours of work
in a day and rest less than 8 hours of work in a day. No unit was
working beyond 8 hours a day.
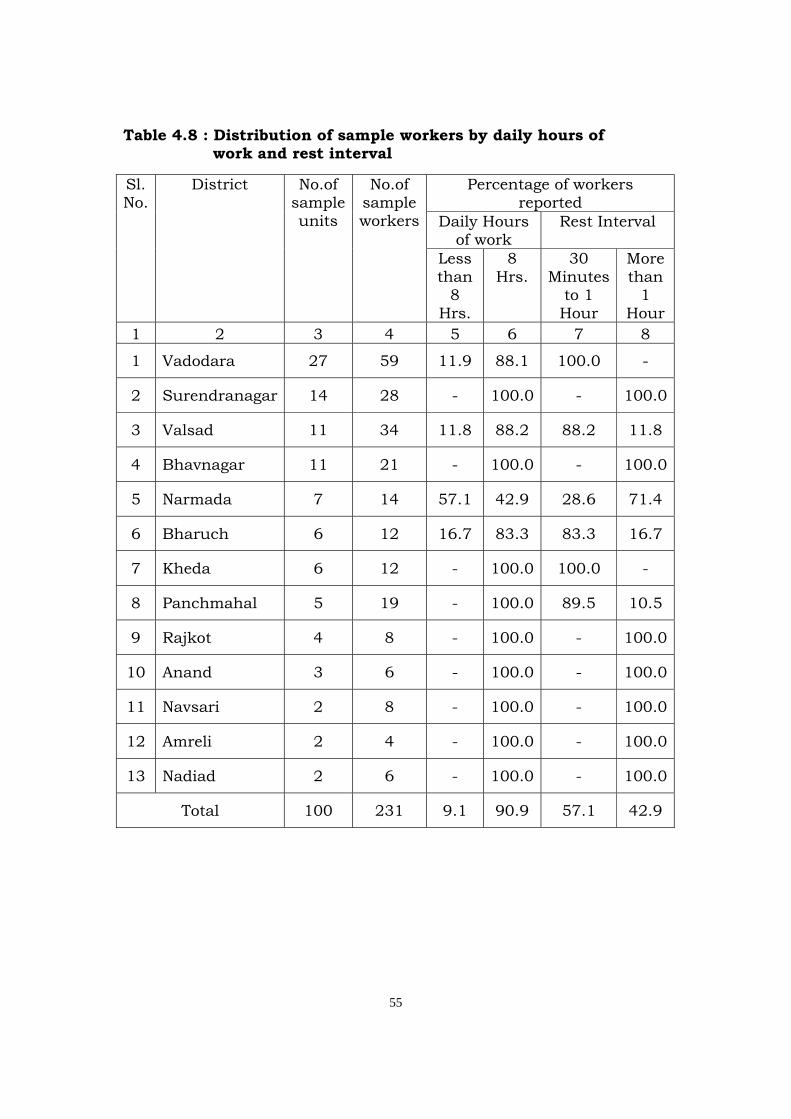
4.7.3 The information of daily hours of work was also collected from the
sample workers while canvassing the worker schedule. The table
4.8 reveals that 90.9 per cent workers have reported 8 hours as
daily hours of work and rest less than 8 hours as daily hours of
work. The results more or less corroborate the findings based on
the information garnered through the employer schedule.
4.7.4 Table 4.9 presents the distribution of sample units allowing rest
interval to the workers by the period of rest. The survey results
reveal that 54 per cent units are allowing rest interval of 30
minutes to one hour and 46 per cent of the units of more than one
hour in case of male workers. Of the total 231 sample workers
interviewed, 57.1 per cent reported rest interval of 30 minutes to
one hour and 42.9% reported rest interval of more than one hour
as shown in Table 4.8.
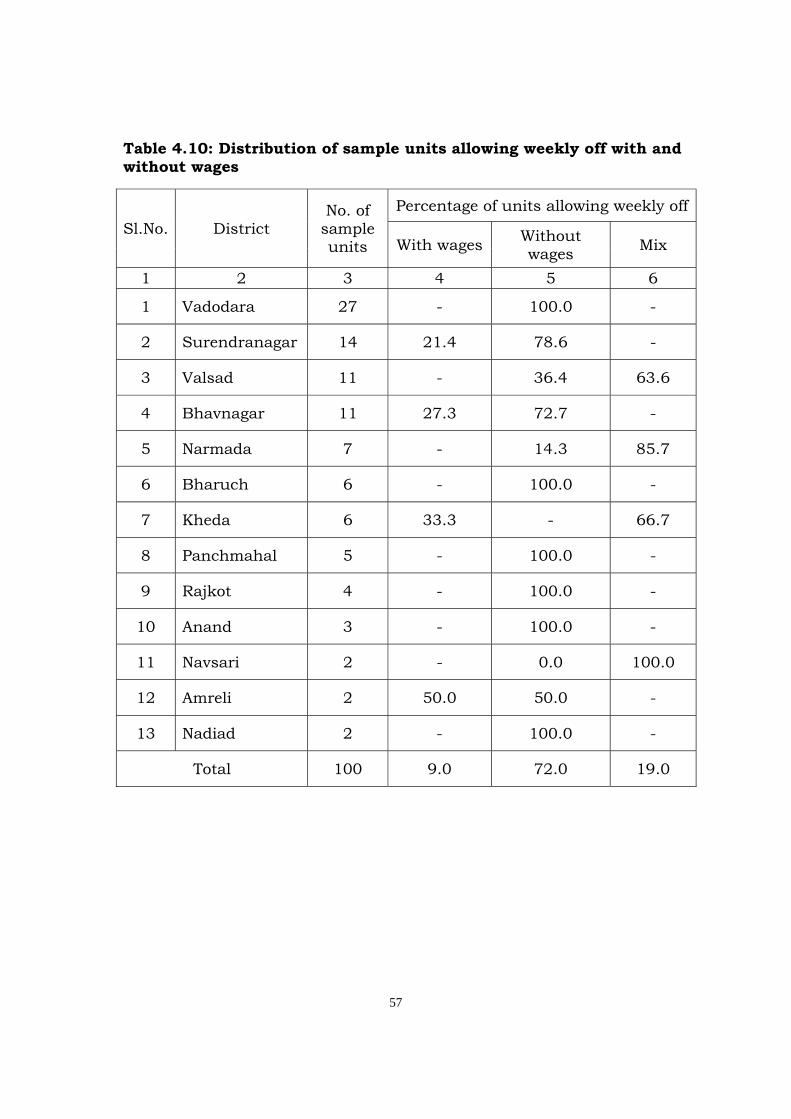
4.7.5 Table 4.10 presents the distribution of sample units allowing
weekly off with and without wages. The survey results reveal that
72 per cent units are allowing weekly off to the workers without
wages followed by 19 per cent with wages to some and without

41
wages to others and only 9 per cent units are allowing weekly off
with wages to the workers.
4.8 Overtime
Only one unit of Vadodara district reportedly worked on overtime
basis.
~~0~~
42
Table 4.1 (A): Occupation-wise per day earnings of directly employed skilled time-rated manual workers (in RS.) Occupation: Operator
Sl. No. District
No. of sample units
No. of operators
Basic Wages Dearness Allowance
Other Allowance
Over Time
Payment
Value of other
benefits in kind
Total Earnings
Min Max Min Max Min Max Min Max Min Max Min Max 1 2 3 4 5 6 7 8 9 10 11 12 13 14 15 16 1 Vadodara 27 18 103.0 173.1 - - - - - - - - 103.0 173.1 2 Surendranagar 14 13 110.0 161.5 - - - - - - - - 110.0 161.5 3 Valsad 11 9 96.8 225.8 - - - - - - 10.0 36.0 106.8 261.8 4 Bhavnagar 11 8 115.4 200.0 - - - - - - - - 115.4 200.0 5 Narmada 7 6 129.1 161.3 - - - - - - 25.0 30.0 154.1 191.3 6 Bharuch 6 7 90.0 100.0 - - - - - - 20.0 50.0 110.0 150.0 7 Kheda 6 6 87.1 193.6 - - - - - - - - 87.1 193.6 8 Panchmahal 5 - - - - - - - - - - - - - 9 Rajkot 4 5 110.0 120.0 - - - - - - - - 110.0 120.0 10 Anand 3 - - - - - - - - - - - - - 11 Navsari 2 2 106.5 145.2 - - - - - - 10.0 10.0 116.5 155.2 12 Amreli 2 2 120.0 153.9 - - - - - - - - 120.0 153.9 13 Nadiad 2 3 104.0 110.0 - - - - - - - - 104.0 110.0
Total 100 79 87.1 225.8 - - - - - - 10.0 50.0 87.1 261.8
43
Table 4.1 (B): Occupation-wise per day earnings of directly employed skilled time-rated manual workers(in Rs.) Occupation: Mistry
Sl. No. District
No. of sample units
No. of Mistry
Basic Wages Dearness Allowance
Other Allowance
Over Time Payment
Value of other
benefits in kind
Total Earnings
Min Max Min Max Min Max Min Max Min Max Min Max 1 2 3 4 5 6 7 8 9 10 11 12 13 14 15 16 1 Vadodara 27 - - - - - - - - - - - - - 2 Surendranagar 14 - - - - - - - - - - - - - 3 Valsad 11 - - - - - - - - - - - - - 4 Bhavnagar 11 - - - - - - - - - - - - - 5 Narmada 7 1 200.0 200.0 - - - - - - - - 200.0 200.0 6 Bharuch 6 - - - - - - - - - - - - - 7 Kheda 6 2 93.6 241.9 - - - - - - - - 93.6 241.9 8 Panchmahal 5 2 107.0 107.0 - - - - - - - - 107.0 107.0 9 Rajkot 4 - - - - - - - - - - - - - 10 Anand 3 - - - - - - - - - - - - - 11 Navsari 2 - - - - - - - - - - - - - 12 Amreli 2 - - - - - - - - - - - - - 13 Nadiad 2 - - - - - - - - - - - - -
Total 100 5 93.6 241.9 - - - - - - - - 93.6 241.9
44
Table 4.1 (c): Occupation-wise per day earnings of directly employed skilled time rated manual workers (in Rs.) Occupation: Welder Sl. No.
District No. of sample units
No. of Welder
Basic Wages Dearness Allowance
Other Allowance
Over Time
Payment
Value of other
benefits in kind
Total Earnings
Min Max Min Max Min Max Min Max Min Max Min Max 1 2 3 4 5 6 7 8 9 10 11 12 13 14 15 16 1 Vadodara 27 11 142.4 365.4 - - - - - - 58.7 94.6 201.1 460.0 2 Surendranagar 14 - - - - - - - - - - - - - 3 Valsad 11 - - - - - - - - - - - - - 4 Bhavnagar 11 - - - - - - - - - - - - - 5 Narmada 7 - - - - - - - - - - - - - 6 Bharuch 6 - - - - - - - - - - - - - 7 Kheda 6 - - - - - - - - - - - - - 8 Panchmahal 5 - - - - - - - - - - - - - 9 Rajkot 4 - - - - - - - - - - - - - 10 Anand 3 - - - - - - - - - - - - - 11 Navsari 2 - - - - - - - - - - - - - 12 Amreli 2 - - - - - - - - - - - - - 13 Nadiad 2 - - - - - - - - - - - - -
Total 100 11 142.4 365.4 - - - - - - 58.7 94.6 201.1 460.0
45
Table 4.1 (D): Occupation-wise per day earnings of directly employed skilled time rated manual workers (in Rs.) Occupation: Driver
Sl. No.
District No. of sample units
No. of Driver
Basic Wages Dearness Allowance
Other Allowance
Over Time
Payment
Value of other
benefits in kind
Total Earnings
Min Max Min Max Min Max Min Max Min Max Min Max 1 2 3 4 5 6 7 8 9 10 11 12 13 14 15 16 1 Vadodara 27 - - - - - - - - - - - - - 2 Surendranagar 14 - - - - - - - - - - - - - 3 Valsad 11 3 96.8 161.3 - - - - - - 36.0 36.0 132.8 197.3 4 Bhavnagar 11 - - - - - - - - - - - - - 5 Narmada 7 6 80.7 112.9 - - - - - - 25.0 25.0 105.7 137.9 6 Bharuch 6 - - - - - - - - - - - - - 7 Kheda 6 2 87.1 87.1 - - - - - - - - 87.1 87.1 8 Panchmahal 5 - - - - - - - - - - - - - 9 Rajkot 4 - - - - - - - - - - - - - 10 Anand 3 - - - - - - - - - - - - - 11 Navsari 2 1 129.0 129.0 - - - - - - 10.0 10.0 139.0 139.0 12 Amreli 2 - - - - - - - - - - - - - 13 Nadiad 2 1 105.0 105.0 - - - - - - - - 105.0 105.0
Total 100 13 80.7 161.3 - - - - - - 10.0 36.0 87.1 197.3
46
Table 4.1 (E): Occupation-wise per day earnings of directly employed skilled time rated manual workers (in Rs.) Occupation: Electrician Sl. No.
District No. of sample units
No. of Electrician
Basic Wages Dearness Allowance
Other Allowance
Over Time
Payment
Value of other
benefits in kind
Total Earnings
Min Max Min Max Min Max Min Max Min Max Min Max 1 2 3 4 5 6 7 8 9 10 11 12 13 14 15 16 1 Vadodara 27 4 144.2 280.1 - - - - - - 66.2 87.0 210.4 367.1 2 Surendranagar 14 - - - - - - - - - - - - - 3 Valsad 11 - - - - - - - - - - - - - 4 Bhavnagar 11 - - - - - - - - - - - - - 5 Narmada 7 - - - - - - - - - - - - - 6 Bharuch 6 - - - - - - - - - - - - - 7 Kheda 6 - - - - - - - - - - - - - 8 Panchmahal 5 - - - - - - - - - - - - - 9 Rajkot 4 - - - - - - - - - - - - - 10 Anand 3 - - - - - - - - - - - - - 11 Navsari 2 - - - - - - - - - - - - - 12 Amreli 2 - - - - - - - - - - - - - 13 Nadiad 2 - - - - - - - - - - - - -
Total 100 4 144.2 280.1 - - - - - - 66.2 87.0 210.4 367.1
47
Table 4.1 (F): Occupation-wise per day earnings of directly employed skilled time rated manual workers (in Rs.) Occupation: Supervisor
Sl. No.
District No. of sample units
No. of Supervisor
Basic Wages
Dearness Allowance
Other Allowance
Over Time
Payment
Value of other
benefits in kind
Total Earnings
Min Max Min Max Min Max Min Max Min Max Min Max 1 2 3 4 5 6 7 8 9 10 11 12 13 14 15 16 1 Vadodara 27 - - - - - - - - - - - - - 2 Surendranagar 14 - - - - - - - - - - - - - 3 Valsad 11 - - - - - - - - - - - - - 4 Bhavnagar 11 - - - - - - - - - - - - - 5 Narmada 7 - - - - - - - - - - - - - 6 Bharuch 6 - - - - - - - - - - - - - 7 Kheda 6 2 87.1 87.1 - - - - - - - - 87.1 87.1 8 Panchmahal 5 - - - - - - - - - - - - - 9 Rajkot 4 - - - - - - - - - - - - - 10 Anand 3 - - - - - - - - - - - - - 11 Navsari 2 - - - - - - - - - - - - - 12 Amreli 2 - - - - - - - - - - - - - 13 Nadiad 2 - - - - - - - - - - - - -
Total 100 2 87.1 87.1 - - - - - - - - 87.1 87.1
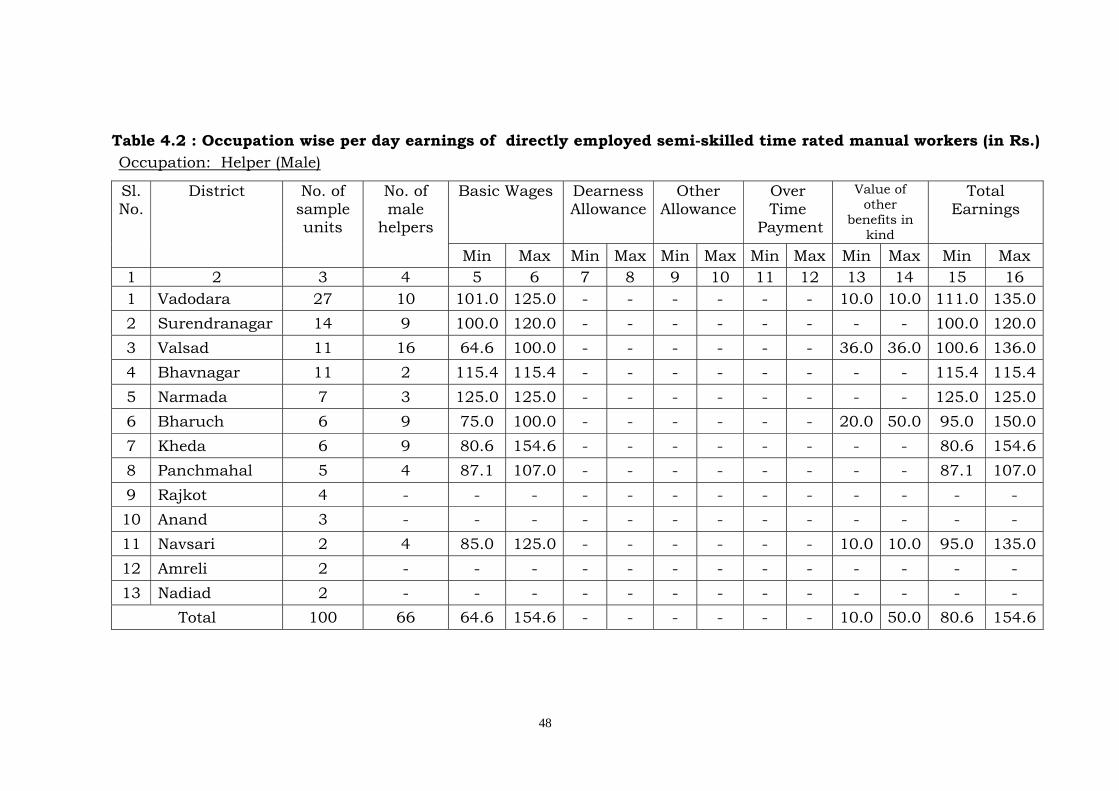
48
Table 4.2 : Occupation wise per day earnings of directly employed semi-skilled time rated manual workers (in Rs.) Occupation: Helper (Male)
Sl. No.
District No. of sample units
No. of male
helpers
Basic Wages Dearness Allowance
Other Allowance
Over Time
Payment
Value of other
benefits in kind
Total Earnings
Min Max Min Max Min Max Min Max Min Max Min Max 1 2 3 4 5 6 7 8 9 10 11 12 13 14 15 16 1 Vadodara 27 10 101.0 125.0 - - - - - - 10.0 10.0 111.0 135.0 2 Surendranagar 14 9 100.0 120.0 - - - - - - - - 100.0 120.0 3 Valsad 11 16 64.6 100.0 - - - - - - 36.0 36.0 100.6 136.0 4 Bhavnagar 11 2 115.4 115.4 - - - - - - - - 115.4 115.4 5 Narmada 7 3 125.0 125.0 - - - - - - - - 125.0 125.0 6 Bharuch 6 9 75.0 100.0 - - - - - - 20.0 50.0 95.0 150.0 7 Kheda 6 9 80.6 154.6 - - - - - - - - 80.6 154.6 8 Panchmahal 5 4 87.1 107.0 - - - - - - - - 87.1 107.0 9 Rajkot 4 - - - - - - - - - - - - - 10 Anand 3 - - - - - - - - - - - - - 11 Navsari 2 4 85.0 125.0 - - - - - - 10.0 10.0 95.0 135.0 12 Amreli 2 - - - - - - - - - - - - - 13 Nadiad 2 - - - - - - - - - - - - -
Total 100 66 64.6 154.6 - - - - - - 10.0 50.0 80.6 154.6
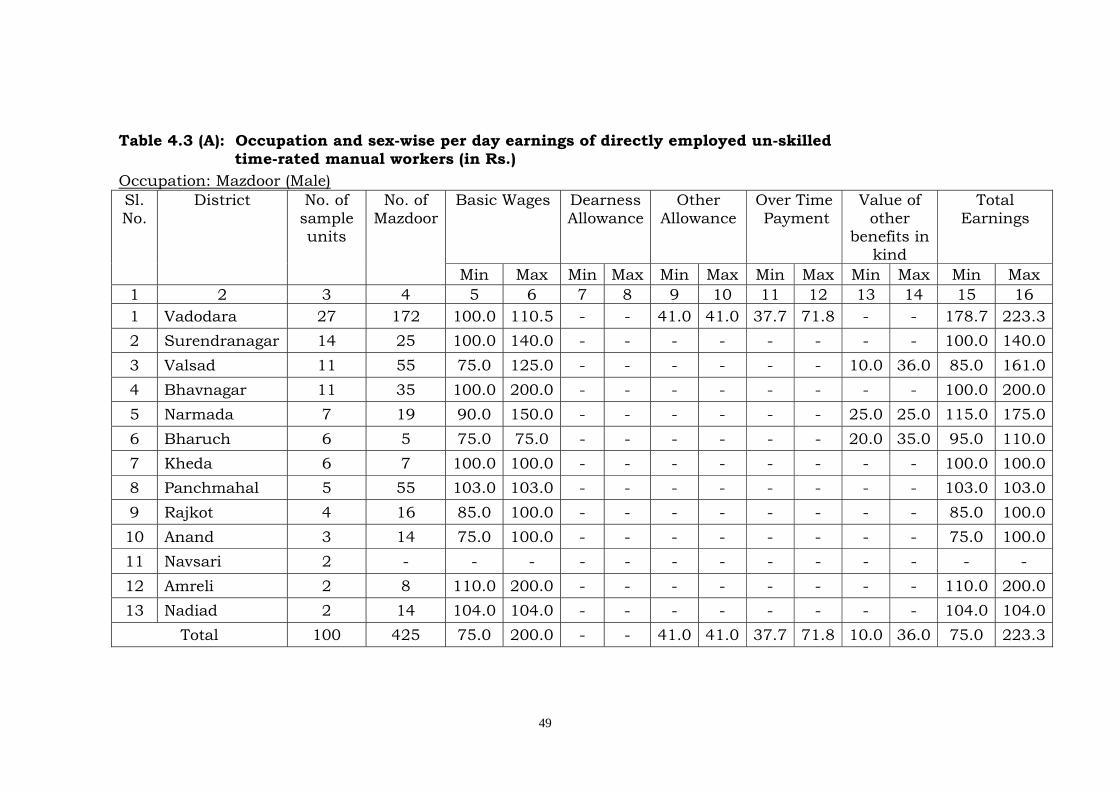
49
Table 4.3 (A): Occupation and sex-wise per day earnings of directly employed un-skilled time-rated manual workers (in Rs.) Occupation: Mazdoor (Male) Sl. No.
District No. of sample units
No. of Mazdoor
Basic Wages Dearness Allowance
Other Allowance
Over Time Payment
Value of other
benefits in kind
Total Earnings
Min Max Min Max Min Max Min Max Min Max Min Max 1 2 3 4 5 6 7 8 9 10 11 12 13 14 15 16 1 Vadodara 27 172 100.0 110.5 - - 41.0 41.0 37.7 71.8 - - 178.7 223.3 2 Surendranagar 14 25 100.0 140.0 - - - - - - - - 100.0 140.0 3 Valsad 11 55 75.0 125.0 - - - - - - 10.0 36.0 85.0 161.0 4 Bhavnagar 11 35 100.0 200.0 - - - - - - - - 100.0 200.0 5 Narmada 7 19 90.0 150.0 - - - - - - 25.0 25.0 115.0 175.0 6 Bharuch 6 5 75.0 75.0 - - - - - - 20.0 35.0 95.0 110.0 7 Kheda 6 7 100.0 100.0 - - - - - - - - 100.0 100.0 8 Panchmahal 5 55 103.0 103.0 - - - - - - - - 103.0 103.0 9 Rajkot 4 16 85.0 100.0 - - - - - - - - 85.0 100.0 10 Anand 3 14 75.0 100.0 - - - - - - - - 75.0 100.0 11 Navsari 2 - - - - - - - - - - - - - 12 Amreli 2 8 110.0 200.0 - - - - - - - - 110.0 200.0 13 Nadiad 2 14 104.0 104.0 - - - - - - - - 104.0 104.0
Total 100 425 75.0 200.0 - - 41.0 41.0 37.7 71.8 10.0 36.0 75.0 223.3
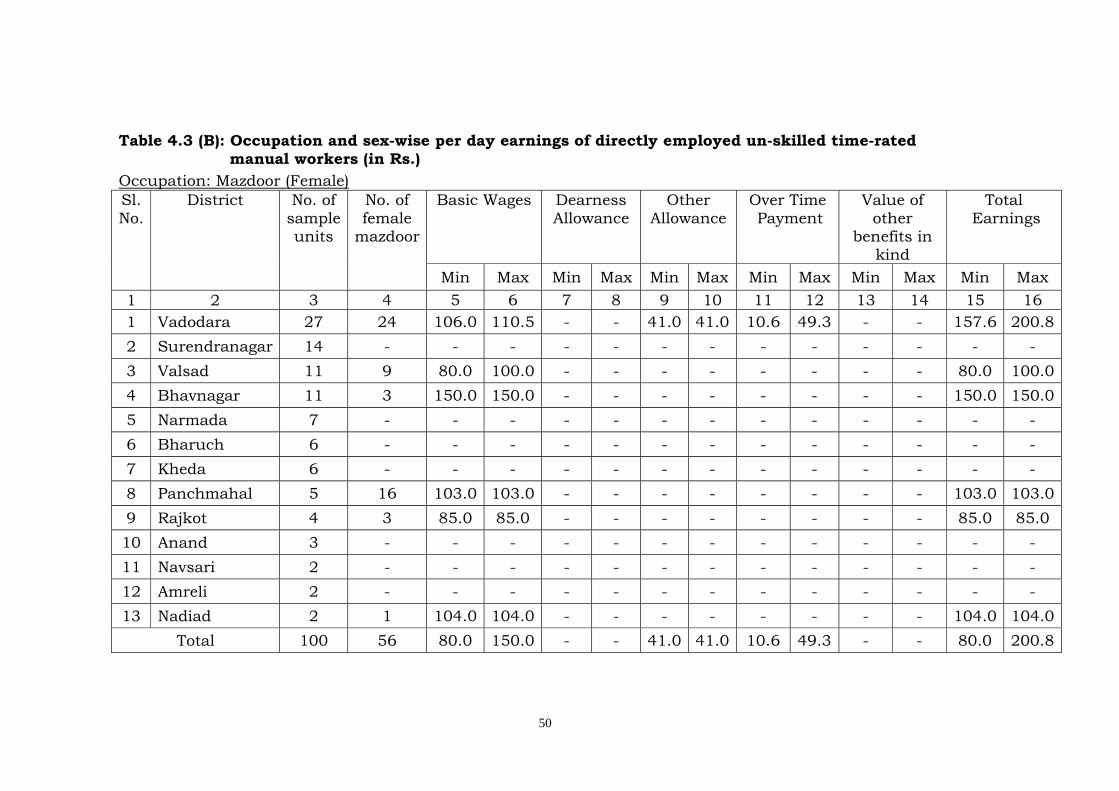
50
Table 4.3 (B): Occupation and sex-wise per day earnings of directly employed un-skilled time-rated manual workers (in Rs.) Occupation: Mazdoor (Female) Sl. No.
District No. of sample units
No. of female
mazdoor
Basic Wages Dearness Allowance
Other Allowance
Over Time Payment
Value of other
benefits in kind
Total Earnings
Min Max Min Max Min Max Min Max Min Max Min Max 1 2 3 4 5 6 7 8 9 10 11 12 13 14 15 16 1 Vadodara 27 24 106.0 110.5 - - 41.0 41.0 10.6 49.3 - - 157.6 200.8 2 Surendranagar 14 - - - - - - - - - - - - - 3 Valsad 11 9 80.0 100.0 - - - - - - - - 80.0 100.0 4 Bhavnagar 11 3 150.0 150.0 - - - - - - - - 150.0 150.0 5 Narmada 7 - - - - - - - - - - - - - 6 Bharuch 6 - - - - - - - - - - - - - 7 Kheda 6 - - - - - - - - - - - - - 8 Panchmahal 5 16 103.0 103.0 - - - - - - - - 103.0 103.0 9 Rajkot 4 3 85.0 85.0 - - - - - - - - 85.0 85.0 10 Anand 3 - - - - - - - - - - - - - 11 Navsari 2 - - - - - - - - - - - - - 12 Amreli 2 - - - - - - - - - - - - - 13 Nadiad 2 1 104.0 104.0 - - - - - - - - 104.0 104.0
Total 100 56 80.0 150.0 - - 41.0 41.0 10.6 49.3 - - 80.0 200.8
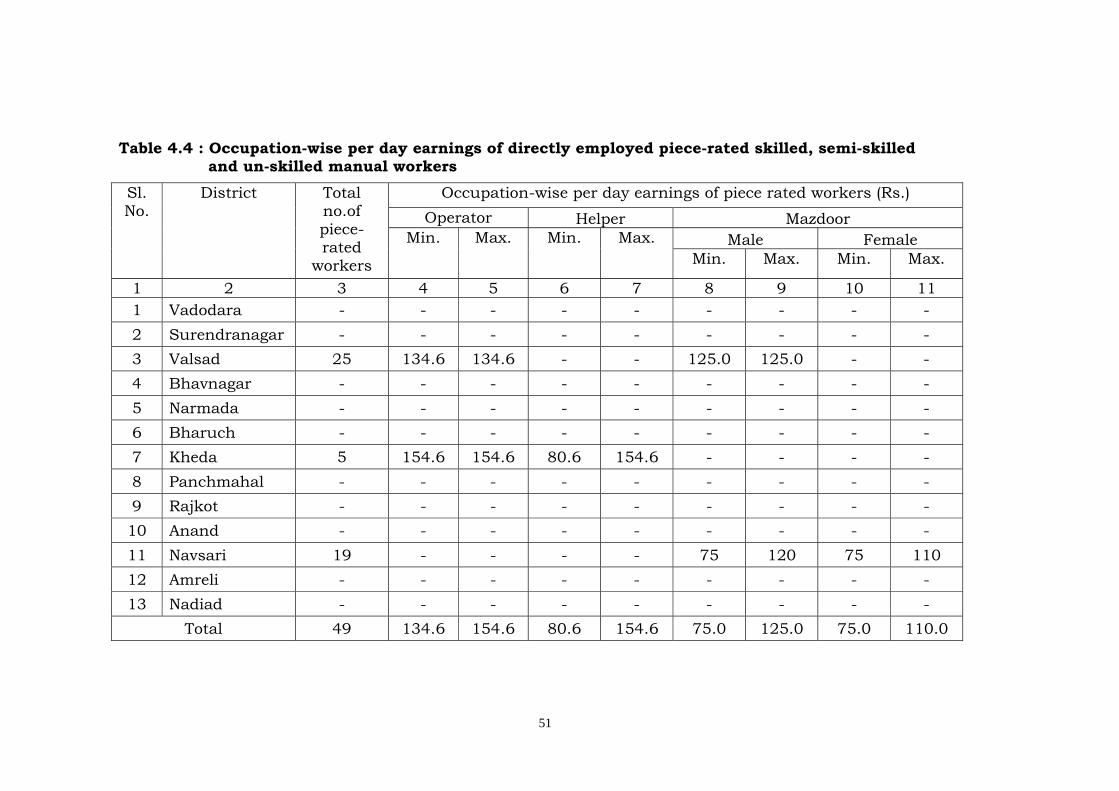
51
Table 4.4 : Occupation-wise per day earnings of directly employed piece-rated skilled, semi-skilled and un-skilled manual workers Sl. No.
District Total no.of piece-rated
workers
Occupation-wise per day earnings of piece rated workers (Rs.) Operator Helper Mazdoor
Min. Max. Min. Max. Male Female Min. Max. Min. Max.
1 2 3 4 5 6 7 8 9 10 11 1 Vadodara - - - - - - - - - 2 Surendranagar - - - - - - - - - 3 Valsad 25 134.6 134.6 - - 125.0 125.0 - - 4 Bhavnagar - - - - - - - - - 5 Narmada - - - - - - - - - 6 Bharuch - - - - - - - - - 7 Kheda 5 154.6 154.6 80.6 154.6 - - - - 8 Panchmahal - - - - - - - - - 9 Rajkot - - - - - - - - - 10 Anand - - - - - - - - - 11 Navsari 19 - - - - 75 120 75 110 12 Amreli - - - - - - - - - 13 Nadiad - - - - - - - - -
Total 49 134.6 154.6 80.6 154.6 75.0 125.0 75.0 110.0
52
Table 4.5: Comparison of wages paid in sample units with prescribed minimum wages
Sl. No.
District No. of sample units
No. of units paying wages
As per minimum
wages fixed by
Government.
More than prescribed minimum
wages
Less than prescribed minimum
wages
1 2 3 4 5 6
1 Vadodara 27 5 22 -
2 Surendranagar 14 - 14 -
3 Valsad 11 11 - -
4 Bhavnagar 11 1 10 -
5 Narmada 7 2 5 -
6 Bharuch 6 6 - -
7 Kheda 6 - 6 -
8 Panchmahal 5 2 3 -
9 Rajkot 4 - 4 -
10 Anand 3 2 1 -
11 Navsari 2 2 - -
12 Amreli 2 - 2 -
13 Nadiad 2 - 2 -
Total 100 31 69 -
53
Table 4.6: Comparison of wages of male and female workers
Sl. No.
District No. of sample units
No.of units reporting
employment of women
No. of units paying equal
wages to male and female
workers 1 2 3 4 5
1 Vadodara 27 2 2
2 Surendranagar 14 - -
3 Valsad 11 3 3
4 Bhavnagar 11 1 1
5 Narmada 7 - -
6 Bharuch 6 - -
7 Kheda 6 - -
8 Panchmahal 5 3 3
9 Rajkot 4 1 1
10 Anand 3 - -
11 Navsari 2 2 2
12 Amreli 2 - -
13 Nadiad 2 1 1
Total 100 13 13
54
Table 4.7 : Distribution of sample units by daily hours of work
Sl. No.
District No.of sample units
% age of units observing hrs. of work Male Female
Less than 8 Hrs.
8 Hrs. Less than 8 Hrs.
8 Hrs.
1 2 3 4 5 6 7
1 Vadodara 27 7.4 92.6 50.0 50.0
2 Surendranagar 14 - 100.0 - -
3 Valsad 11 9.1 90.9 33.3 66.7
4 Bhavnagar 11 - 100.0 - 100.0
5 Narmada 7 57.1 42.9 - -
6 Bharuch 6 16.7 83.3 - -
7 Kheda 6 - 100.0 - -
8 Panchmahal 5 - 100.0 - 100.0
9 Rajkot 4 - 100.0 - 100.0
10 Anand 3 - 100.0 - -
11 Navsari 2 - 100.0 - 100.0
12 Amreli 2 - 100.0 - -
13 Nadiad 2 - 100.0 - 100.0
Total 100 8.0 92.0 15.4 84.6
55
Table 4.8 : Distribution of sample workers by daily hours of work and rest interval
Sl. No.
District No.of sample units
No.of sample workers
Percentage of workers reported
Daily Hours of work
Rest Interval
Less than
8 Hrs.
8 Hrs.
30 Minutes
to 1 Hour
More than
1 Hour
1 2 3 4 5 6 7 8
1 Vadodara 27 59 11.9 88.1 100.0 -
2 Surendranagar 14 28 - 100.0 - 100.0
3 Valsad 11 34 11.8 88.2 88.2 11.8
4 Bhavnagar 11 21 - 100.0 - 100.0
5 Narmada 7 14 57.1 42.9 28.6 71.4
6 Bharuch 6 12 16.7 83.3 83.3 16.7
7 Kheda 6 12 - 100.0 100.0 -
8 Panchmahal 5 19 - 100.0 89.5 10.5
9 Rajkot 4 8 - 100.0 - 100.0
10 Anand 3 6 - 100.0 - 100.0
11 Navsari 2 8 - 100.0 - 100.0
12 Amreli 2 4 - 100.0 - 100.0
13 Nadiad 2 6 - 100.0 - 100.0
Total 100 231 9.1 90.9 57.1 42.9

56
Table 4.9: Distribution of Sample Units by period of Rest Interval
Sl.No. District No.of sample units
% age of units reporting rest interval Male Female
30 minutes - I hour
More than one hour
30 minutes - I hour
More than one hour
1 2 3 4 5 6 7
1 Vadodara 27 100.0 - 100 -
2 Surendranagar 14 0.0 100.0 - -
3 Valsad 11 90.9 9.1 33.3 66.7
4 Bhavnagar 11 0.0 100.0 - 100
5 Narmada 7 28.6 71.4 - -
6 Bharuch 6 83.3 16.7 - -
7 Kheda 6 100.0 - - -
8 Panchmahal 5 80.0 20.0 100 -
9 Rajkot 4 - 100.0 - 100
10 Anand 3 - 100.0 - -
11 Navsari 2 - 100.0 - 100
12 Amreli 2 - 100.0 - -
13 Nadiad 2 - 100.0 - 100
Total 100 54.0 46.0 46.2 53.8
57
Table 4.10: Distribution of sample units allowing weekly off with and without wages
Sl.No. District No. of
sample units
Percentage of units allowing weekly off
With wages Without wages Mix
1 2 3 4 5 6
1 Vadodara 27 - 100.0 -
2 Surendranagar 14 21.4 78.6 -
3 Valsad 11 - 36.4 63.6
4 Bhavnagar 11 27.3 72.7 -
5 Narmada 7 - 14.3 85.7
6 Bharuch 6 - 100.0 -
7 Kheda 6 33.3 - 66.7
8 Panchmahal 5 - 100.0 -
9 Rajkot 4 - 100.0 -
10 Anand 3 - 100.0 -
11 Navsari 2 - 0.0 100.0
12 Amreli 2 50.0 50.0 -
13 Nadiad 2 - 100.0 -
Total 100 9.0 72.0 19.0
58
CHAPTER-V
AWARENESS OF THE LABOUR LAWS
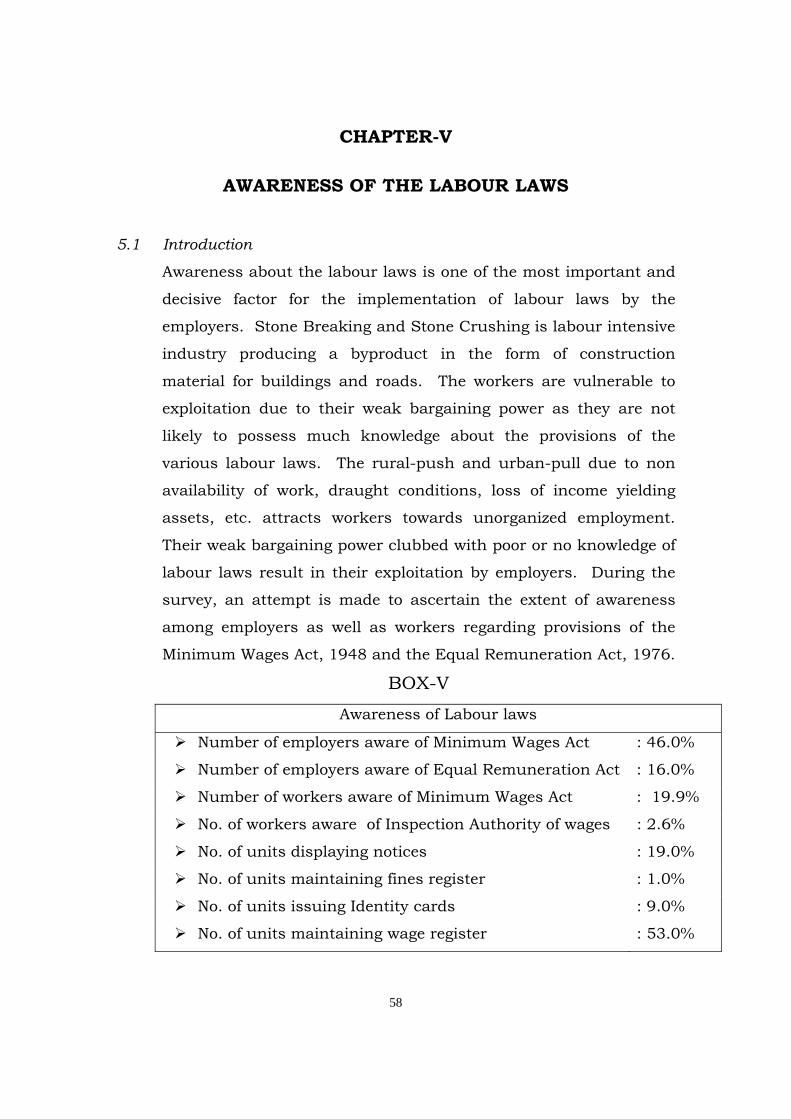
5.1 Introduction
Awareness about the labour laws is one of the most important and
decisive factor for the implementation of labour laws by the
employers. Stone Breaking and Stone Crushing is labour intensive
industry producing a byproduct in the form of construction
material for buildings and roads. The workers are vulnerable to
exploitation due to their weak bargaining power as they are not
likely to possess much knowledge about the provisions of the
various labour laws. The rural-push and urban-pull due to non
availability of work, draught conditions, loss of income yielding
assets, etc. attracts workers towards unorganized employment.
Their weak bargaining power clubbed with poor or no knowledge of
labour laws result in their exploitation by employers. During the
survey, an attempt is made to ascertain the extent of awareness
among employers as well as workers regarding provisions of the
Minimum Wages Act, 1948 and the Equal Remuneration Act, 1976.
BOX-V
Awareness of Labour laws
Number of employers aware of Minimum Wages Act : 46.0%
Number of employers aware of Equal Remuneration Act : 16.0%
Number of workers aware of Minimum Wages Act : 19.9%
No. of workers aware of Inspection Authority of wages : 2.6%
No. of units displaying notices : 19.0%
No. of units maintaining fines register : 1.0%
No. of units issuing Identity cards : 9.0%
No. of units maintaining wage register : 53.0%
59
5.2 Awareness about the Minimum Wages Act & the Equal
Remuneration Act
5.2.1 Awareness among Employers
It is generally believed that the employers are well aware and well
versed with the provision under various labour laws. In order to
know the extent of awareness among employers about the
Minimum Wages Act, 1948, information has been collected from
the employers and is presented in Table 5.1. The results reveal
that only 46.0 per cent of the employers are aware of the Minimum
Wages Act, 1948. Further, among the employers who are aware of
the Minimum Wages act, 1948, 87.0 per cent are aware of the
prescribed minimum wages. The details are presented in Table
5.1.
The Table 5.2 presents data on the source of awareness about the
Minimum Wages Act, 1948 and also on awareness about the Equal
Remuneration Act, 1976 among the employers. It may be observed
from the table that most of the employers are aware of the
minimum wages act through contact with government officials. As
far as, the awareness of the Equal Remuneration Act, 1976 among
the employers is concerned, it is very low. Only 16.0 per cent of the
employers have reported awareness about the act.
5.2.2 Awareness among Workers
Awareness among the workers about the Minimum Wages Act,
1948 and the prescribed minimum wages in force is equally
important and pertinent for effective implementation of the
Minimum Wages Act, 1948. The survey results reveal that only
19.9 per cent workers are aware of the Minimum Wages Act, 1948.
60
Out of the workers who are aware of the Act, 87.0 per cent are
aware of the prescribed minimum wages. Further only 2.6 per cent
of the workers are aware of the authority responsible for inspection
of wages in the state. The district wise details are presented in
Table 5.3.
5.2.3 Awareness among the Women Workers
During the course of survey information on awareness regarding
the provision to ensure equal wages to men and women for similar
work is also collected from women workers. The women workers
employed in the industry are very few and all of them have
reported awareness of the Equal Remuneration Act, 1976.
5.3 Maintenance of records, notices, extracts, annual returns etc.
5.3.1 Section (18) of the Minimum Wages Act, 1948 provides that (i)
every employer shall maintain such registers and records giving
such particulars of employees employed by him; (ii) every employer
shall keep exhibited in such a manner as may be prescribed, in the
factory, workshop or place where the employees in the Scheduled
Employment may be employed, notices in the prescribed form
containing prescribed particulars; and (iii) the appropriate
Government may, by rules made under this Act, provide for the
issue of wage books or wage slips to employees employed in any
scheduled employment and authenticated in such wage books or
wage slips by the employer or his agent.
5.3.2 Information regarding various records and registers maintained by
the establishments covered under the study is presented in Table
5.4. The survey results reveal that 53.0 per cent units are
maintaining muster rolls/attendance and wages registers, 15 per
61
cent inspection books, 10 per cent wage slips, 5 per cent register of
deductions, 2 per cent welfare amenities & overtime register and 1
per cent fines register.
5.3.3 The information on the maintenance of notice board, submission of
annual returns and issuing identity cards to workers is presented
in Table 5.5. It may be seen from the table that only 19.0 per cent
of the units are displaying notices at the appropriate place.
Further, 45.0 per cent of the units have submitted the annual
returns on time and only 9.0 per cent have issued identity cards to
their workers.
5.4 Employers’ Associations and Trade Unions
The survey results reveal that 38.0 per cent units are members of
Employers Association. However, no worker is reported to be
member of any Trade Union.
~~0~~
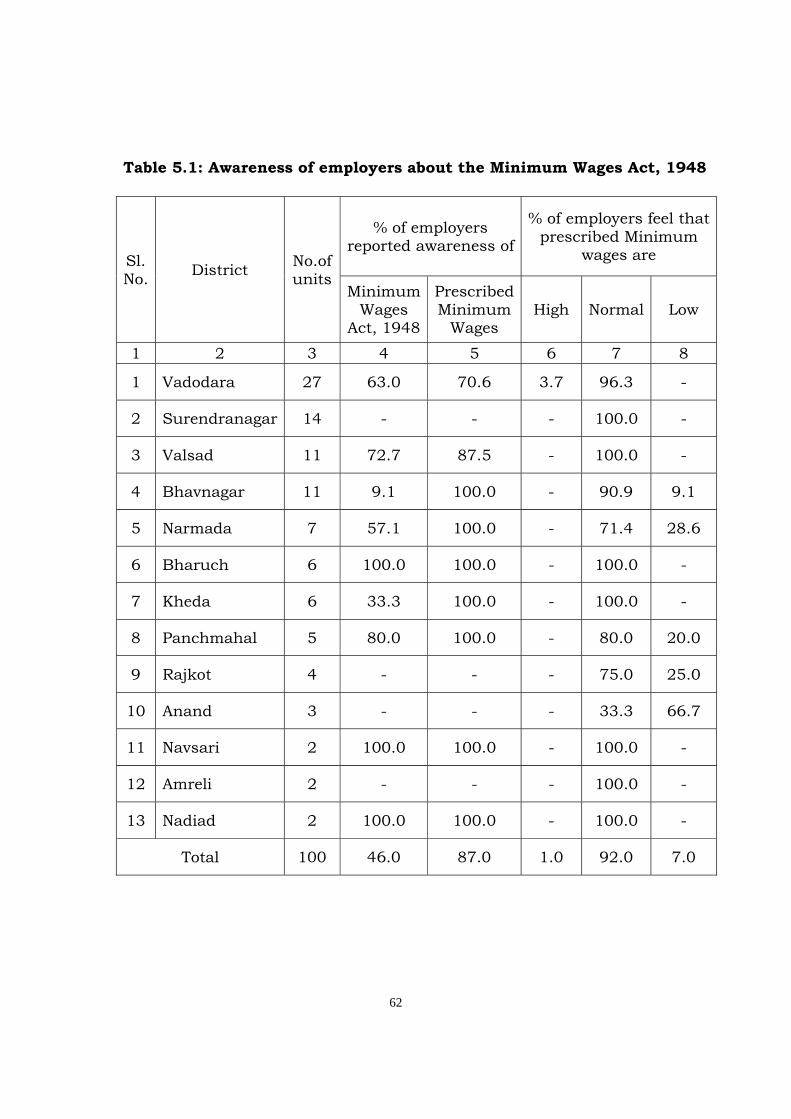
62
Table 5.1: Awareness of employers about the Minimum Wages Act, 1948
Sl. No. District No.of
units
% of employers reported awareness of
% of employers feel that prescribed Minimum
wages are
Minimum Wages
Act, 1948
Prescribed Minimum
Wages High Normal Low
1 2 3 4 5 6 7 8
1 Vadodara 27 63.0 70.6 3.7 96.3 -
2 Surendranagar 14 - - - 100.0 -
3 Valsad 11 72.7 87.5 - 100.0 -
4 Bhavnagar 11 9.1 100.0 - 90.9 9.1
5 Narmada 7 57.1 100.0 - 71.4 28.6
6 Bharuch 6 100.0 100.0 - 100.0 -
7 Kheda 6 33.3 100.0 - 100.0 -
8 Panchmahal 5 80.0 100.0 - 80.0 20.0
9 Rajkot 4 - - - 75.0 25.0
10 Anand 3 - - - 33.3 66.7
11 Navsari 2 100.0 100.0 - 100.0 -
12 Amreli 2 - - - 100.0 -
13 Nadiad 2 100.0 100.0 - 100.0 -
Total 100 46.0 87.0 1.0 92.0 7.0
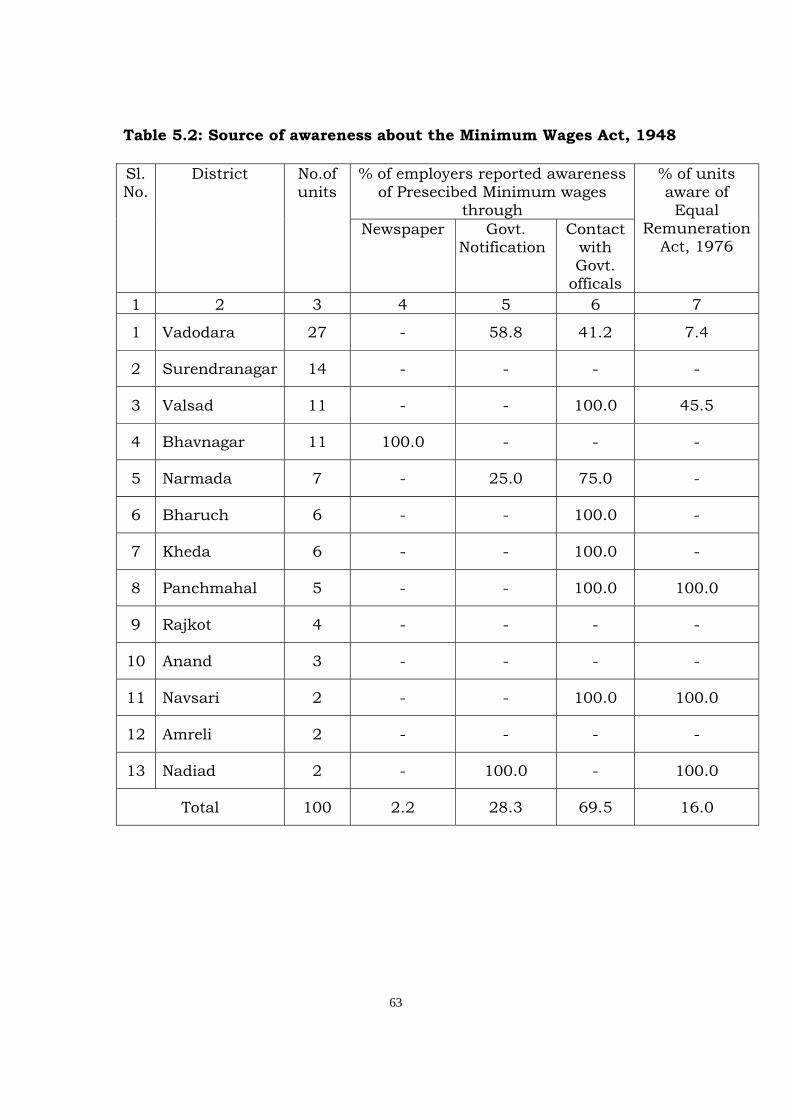
63
Table 5.2: Source of awareness about the Minimum Wages Act, 1948
Sl. No.
District No.of units
% of employers reported awareness of Presecibed Minimum wages
through
% of units aware of Equal
Remuneration Act, 1976
Newspaper Govt. Notification
Contact with Govt.
officals 1 2 3 4 5 6 7
1 Vadodara 27 - 58.8 41.2 7.4
2 Surendranagar 14 - - - -
3 Valsad 11 - - 100.0 45.5
4 Bhavnagar 11 100.0 - - -
5 Narmada 7 - 25.0 75.0 -
6 Bharuch 6 - - 100.0 -
7 Kheda 6 - - 100.0 -
8 Panchmahal 5 - - 100.0 100.0
9 Rajkot 4 - - - -
10 Anand 3 - - - -
11 Navsari 2 - - 100.0 100.0
12 Amreli 2 - - - -
13 Nadiad 2 - 100.0 - 100.0
Total 100 2.2 28.3 69.5 16.0
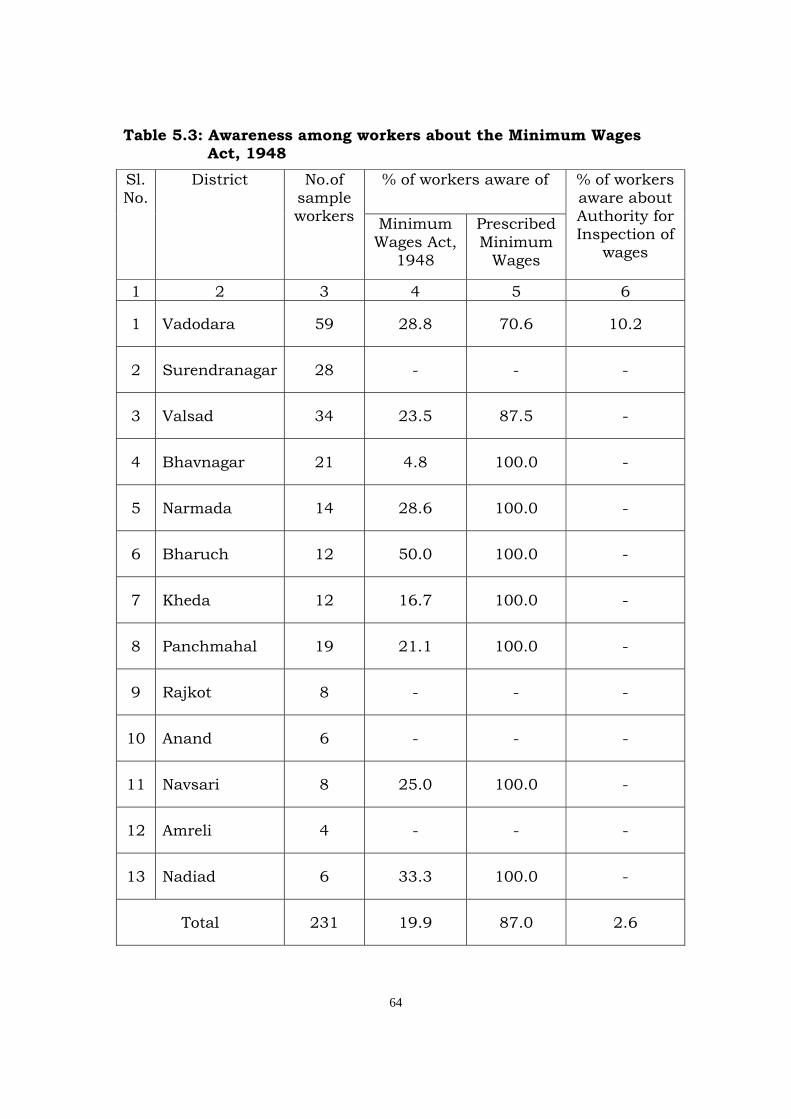
64
Table 5.3: Awareness among workers about the Minimum Wages Act, 1948 Sl. No.
District No.of sample workers
% of workers aware of % of workers aware about Authority for Inspection of
wages
Minimum Wages Act,
1948
Prescribed Minimum
Wages
1 2 3 4 5 6
1 Vadodara 59 28.8 70.6 10.2
2 Surendranagar 28 - - -
3 Valsad 34 23.5 87.5 -
4 Bhavnagar 21 4.8 100.0 -
5 Narmada 14 28.6 100.0 -
6 Bharuch 12 50.0 100.0 -
7 Kheda 12 16.7 100.0 -
8 Panchmahal 19 21.1 100.0 -
9 Rajkot 8 - - -
10 Anand 6 - - -
11 Navsari 8 25.0 100.0 -
12 Amreli 4 - - -
13 Nadiad 6 33.3 100.0 -
Total 231 19.9 87.0 2.6
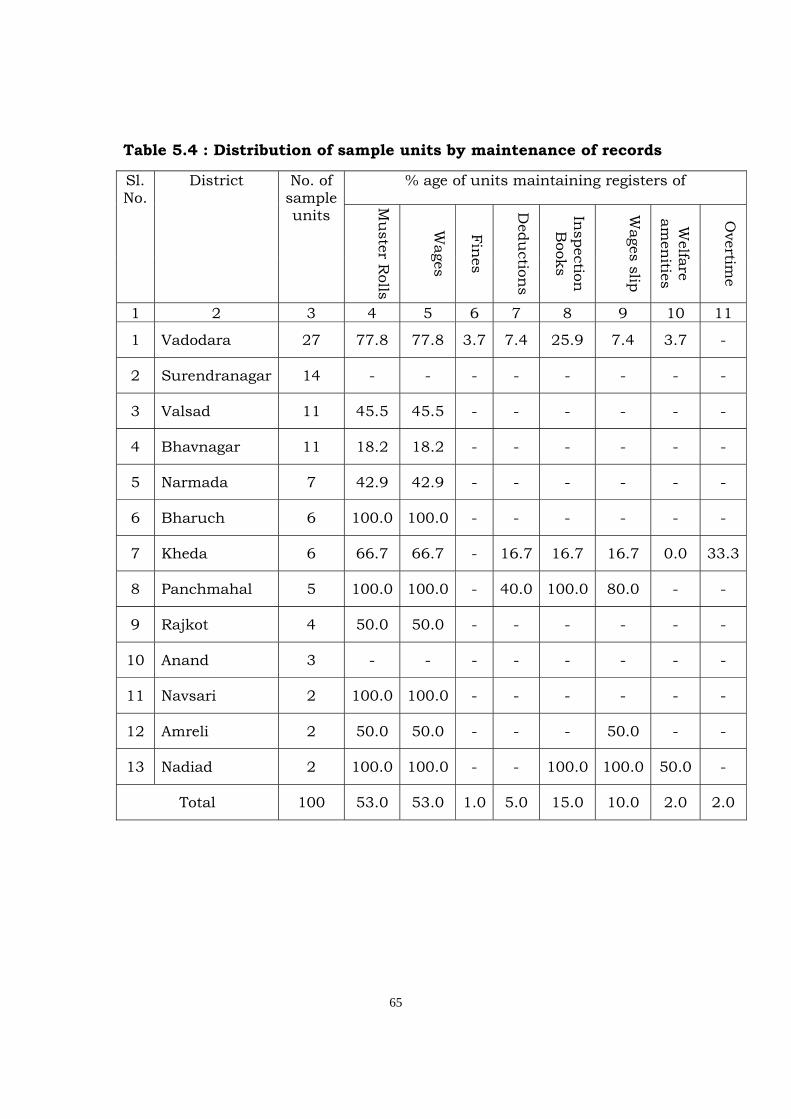
65
Table 5.4 : Distribution of sample units by maintenance of records
Sl. No.
District No. of sample units
% age of units maintaining registers of
Mu
ster Rolls
Wages
Fines
Dedu
ctions
Inspection B
ooks
Wages slip
Welfare
amen
ities
Overtim
e
1 2 3 4 5 6 7 8 9 10 11
1 Vadodara 27 77.8 77.8 3.7 7.4 25.9 7.4 3.7 -
2 Surendranagar 14 - - - - - - - -
3 Valsad 11 45.5 45.5 - - - - - -
4 Bhavnagar 11 18.2 18.2 - - - - - -
5 Narmada 7 42.9 42.9 - - - - - -
6 Bharuch 6 100.0 100.0 - - - - - -
7 Kheda 6 66.7 66.7 - 16.7 16.7 16.7 0.0 33.3
8 Panchmahal 5 100.0 100.0 - 40.0 100.0 80.0 - -
9 Rajkot 4 50.0 50.0 - - - - - -
10 Anand 3 - - - - - - - -
11 Navsari 2 100.0 100.0 - - - - - -
12 Amreli 2 50.0 50.0 - - - 50.0 - -
13 Nadiad 2 100.0 100.0 - - 100.0 100.0 50.0 -
Total 100 53.0 53.0 1.0 5.0 15.0 10.0 2.0 2.0
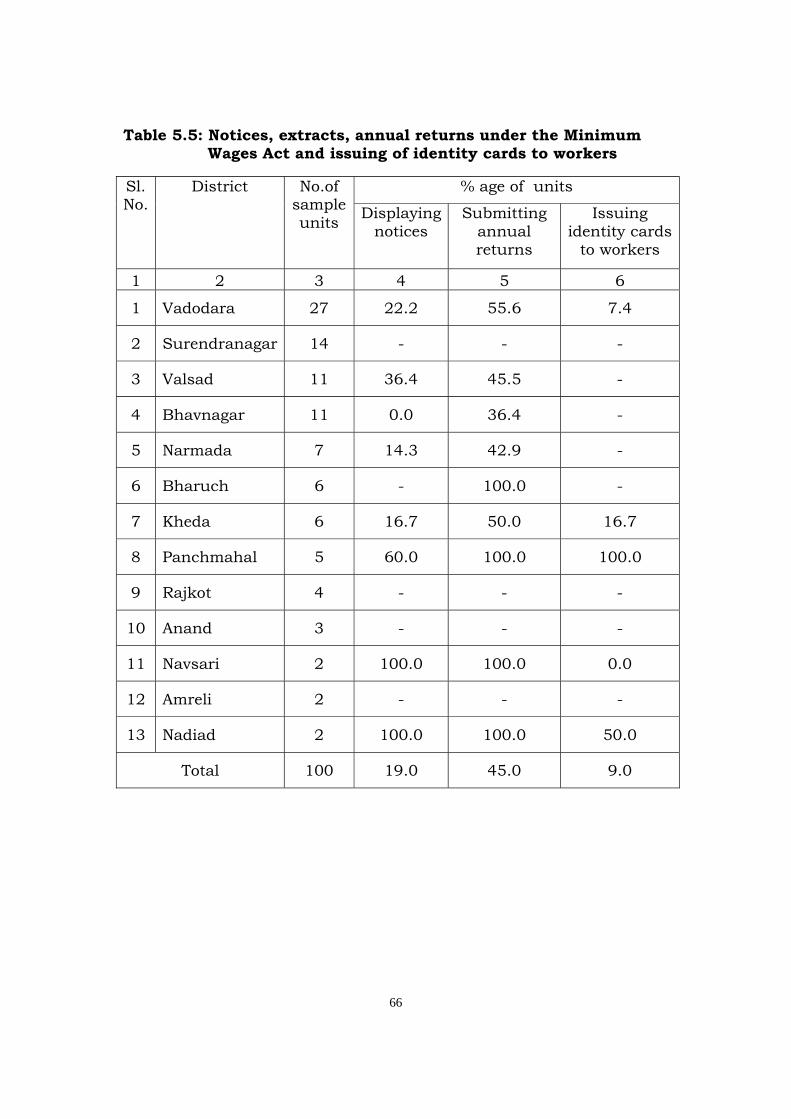
66
Table 5.5: Notices, extracts, annual returns under the Minimum Wages Act and issuing of identity cards to workers
Sl. No.
District No.of sample units
% age of units
Displaying notices
Submitting annual returns
Issuing identity cards
to workers
1 2 3 4 5 6
1 Vadodara 27 22.2 55.6 7.4
2 Surendranagar 14 - - -
3 Valsad 11 36.4 45.5 -
4 Bhavnagar 11 0.0 36.4 -
5 Narmada 7 14.3 42.9 -
6 Bharuch 6 - 100.0 -
7 Kheda 6 16.7 50.0 16.7
8 Panchmahal 5 60.0 100.0 100.0
9 Rajkot 4 - - -
10 Anand 3 - - -
11 Navsari 2 100.0 100.0 0.0
12 Amreli 2 - - -
13 Nadiad 2 100.0 100.0 50.0
Total 100 19.0 45.0 9.0
67
CHAPTER – VI
ENFORCEMENT OF THE LABOUR LAWS
6.1 Introduction 6.1.1 The Minimum Wages Act, 1948 provides for fixation and revision
of the statutory rates of the minimum wages in certain scheduled
employments to prevent exploitation of ignorant, less organised
and under privileged workers. The Appropriate Government,
whether the Centre or the State, as the case may be are
responsible for enforcing the labour laws. The Minimum Wages
Act, 1948 covers all employers who employ one or more workers in
any scheduled employment in respect of which the minimum
wages have been fixed under the Act. The enforcement of the
minimum wages poses a great challenge to the authorities
enforcing the Minimum Wages Act, 1948 and Equal Remuneration
Act, 1976. The enforcement system can work efficiently if the
workers have the knowledge of the minimum wages fixed by the
Government and are also aware of the extent to which they can
approach the enforcement officers to seek protection under the Act.
6.1.2 The Government of Gujarat is the appropriate Government for
enforcing the labour laws in the scheduled employment of Stone
Breaking and Stone Crushing in the State. The Act makes the
State Government responsible for fixing, revising and enforcing
minimum wages in the Scheduled Employment. Section19 of the
Act provides for appointments of Inspectors by the Appropriate
Government.
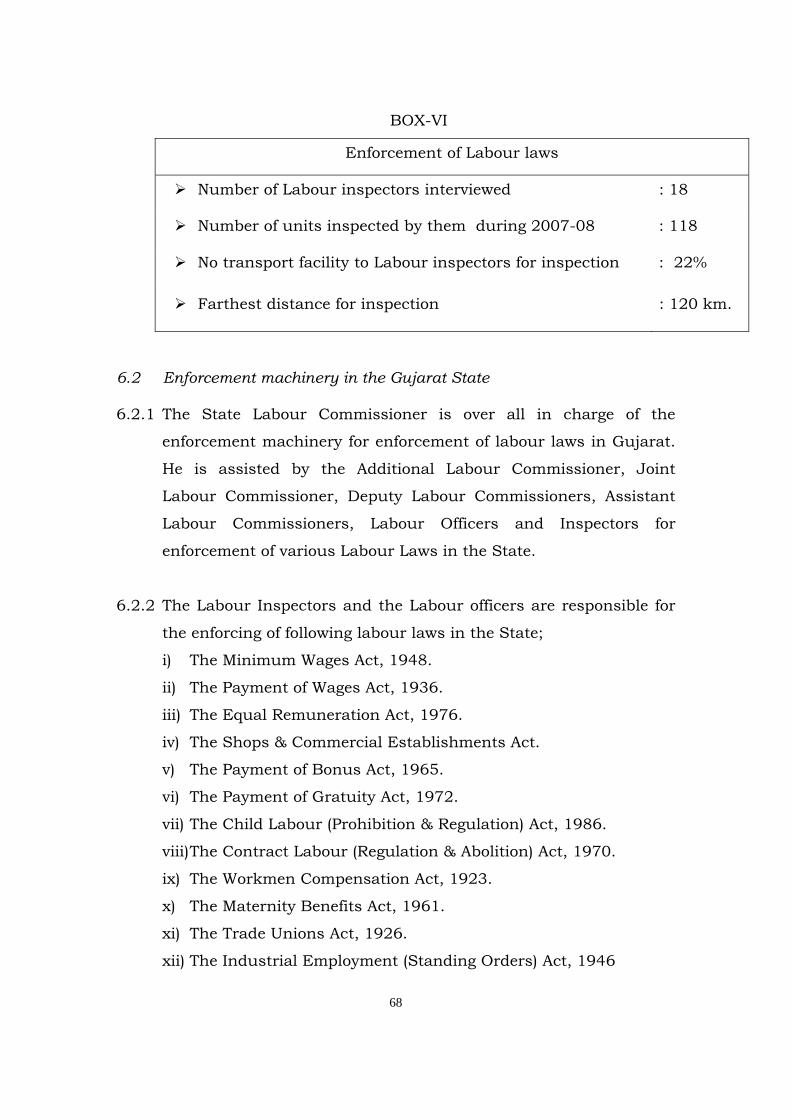
68
BOX-VI
Enforcement of Labour laws
Number of Labour inspectors interviewed : 18
Number of units inspected by them during 2007-08 : 118
No transport facility to Labour inspectors for inspection : 22%
Farthest distance for inspection : 120 km.
6.2 Enforcement machinery in the Gujarat State 6.2.1 The State Labour Commissioner is over all in charge of the
enforcement machinery for enforcement of labour laws in Gujarat.
He is assisted by the Additional Labour Commissioner, Joint
Labour Commissioner, Deputy Labour Commissioners, Assistant
Labour Commissioners, Labour Officers and Inspectors for
enforcement of various Labour Laws in the State.
6.2.2 The Labour Inspectors and the Labour officers are responsible for
the enforcing of following labour laws in the State;
i) The Minimum Wages Act, 1948.
ii) The Payment of Wages Act, 1936.
iii) The Equal Remuneration Act, 1976.
iv) The Shops & Commercial Establishments Act.
v) The Payment of Bonus Act, 1965.
vi) The Payment of Gratuity Act, 1972.
vii) The Child Labour (Prohibition & Regulation) Act, 1986.
viii) The Contract Labour (Regulation & Abolition) Act, 1970.
ix) The Workmen Compensation Act, 1923.
x) The Maternity Benefits Act, 1961.
xi) The Trade Unions Act, 1926.
xii) The Industrial Employment (Standing Orders) Act, 1946
69
xiii) The Bidi & Cigar Workers Act, 1966.
xiv) The Motor Transport Workers Act, 1961.
xv) The Building Construction Act, 1952.
xvi) The Plantations Labour Act, 1951.
xvii) The Labour Welfare Act.
6.2.3 During the survey, information is collected from 18 Labour
Inspectors through a specially designed questionnaire regarding
the number of inspections made in the units, difficulties faced by
them during the enforcement of the Act and suggestions for
effecting improvement in the compliance of various provisions of
the Acts.
6.3 Inspections conducted by Labour Inspectors under various Labour
Laws
Table 6.1 presents the data on inspections carried out by the
Labour Inspectors for the enforcement of various labour laws. The
survey results reveal that all the inspectors have reported
inspections for the enforcement of Minimum Wages Act, 1948 and
Child Labour (Prohibition & Regulation Act), 1986.
6.4 Inspections carried out in the sample units
In order to make the realistic assessment about the frequency of
inspections conducted by the labour inspectors, information on
this aspect was also collected from the sample units and is
presented in Table 6.2. The results reveal that 68.0 per cent of the
units have reported inspections by the labour inspectors during
the year 2007-08.
70
6.5 Observations of the Enforcement Machinery
Table 6.3 presents the nature of transport facilities provided to the
Labour Inspectors for the inspection. The results reveal that of the
18 Labour Inspectors, 5 Inspectors reported Transport/Petrol
Allowance for inspections, 9 Inspectors other modes and 4
inspectors have reported no facility for carrying out the
inspections.
6.6 Suggestions made by the Labour Inspectors for effective enforcement
of the Minimum Wages Act, 1948, and the Equal Remuneration Act
1976.
1. Efforts need to be made to create awareness among workers
about the provisions under the Minimum Wages Act, 1948 and
the Equal Remuneration Act, 1976 as well as the Minimum
Wages in force.
2. The prescribed/Statutory wages in force should be given a wide
publicity through media, newspapers, etc
3. Appropriate provisions for ensuring job security of the workers
reporting the cases of violation to be included in the Minimum
Wages Act, 1948 and in the Equal Remuneration Act, 1976.
4. Vehicle be provided to the Labour Inspectors to enable them to
carry out inspections in remote areas. Alternatively, sufficient
Transport Allowance needs to be provided to the Labour
Inspectors.
71
5. Political influence or interference should be resisted in case of
violations detected by the Labour Inspectors.
6. Provisions to be made to register the small units under the
Gujarat Shops and Commercial Establishments Act, 1961.
7. Where the area of the operation for enforcement is large, it
should be delimited.
8. Sufficient budget for prosecution be provided.
9. A team of at least 2 Labour Inspectors be sent to inspect the
units located in the remote and unsafe areas.
10. The fine amount to be increased from the existing level of
Rs.500/- to discourage violations.
11. The time lag for prosecution of units who fail to maintain
records be reduced from six months to three months.
12. In case of non implementation of labour laws, the Labour
Inspectors should be empowered to fine the employer on the
spot.
13. The amount of penalty to be imposed on successful prosecution
of defaulter may be equal or more than the cost involved in the
case.
14. Awareness about the Labour Laws may be created among the
employers as well as employees.
~~0~~
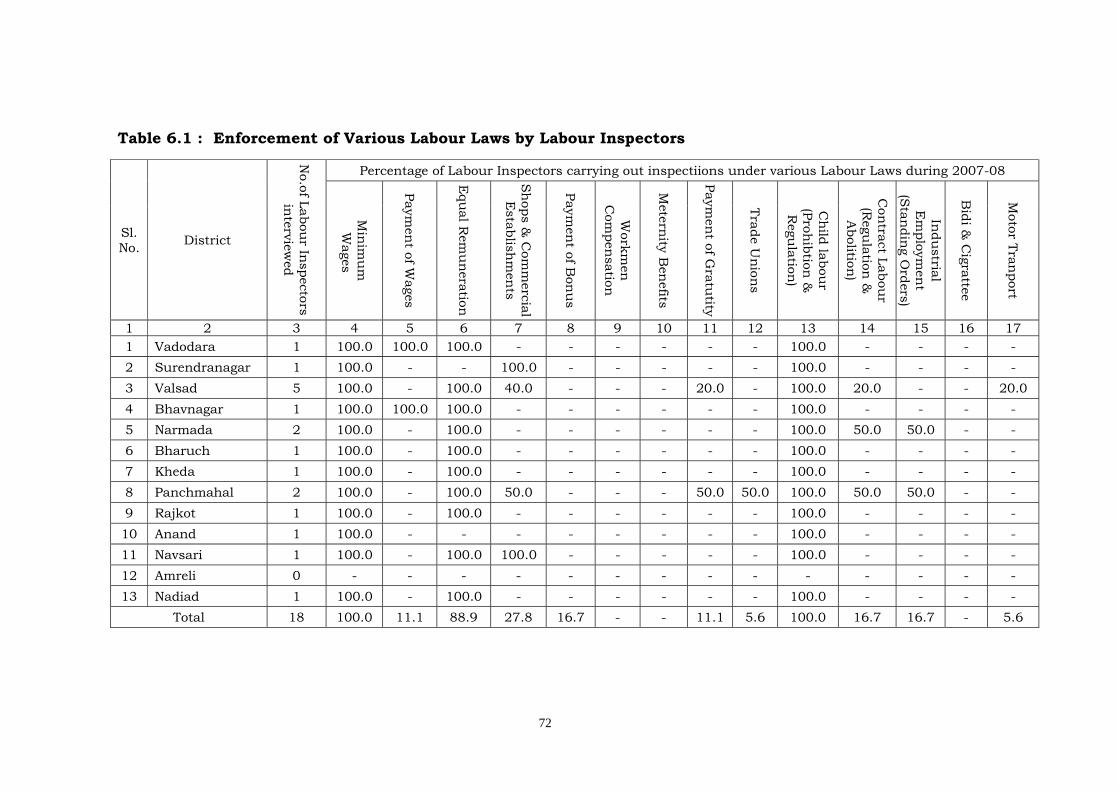
72
Table 6.1 : Enforcement of Various Labour Laws by Labour Inspectors
Sl. No. District
No.of Labou
r Inspectors
interview
ed
Percentage of Labour Inspectors carrying out inspectiions under various Labour Laws during 2007-08
Min
imu
m
Wages
Paymen
t of Wages
Equ
al Rem
un
eration
Sh
ops & C
omm
ercial E
stablishm
ents
Paymen
t of Bon
us
Workm
en
Com
pensation
Metern
ity Ben
efits
Paymen
t of Gratu
tity
Trade Unions
Ch
ild labour
(Prohibtion
&
Regu
lation)
Con
tract Labour
(Regu
lation &
A
bolition)
Indu
strial E
mploym
ent
(Standin
g Orders)
Bidi &
Cigrattee
Motor Tran
port
1 2 3 4 5 6 7 8 9 10 11 12 13 14 15 16 17 1 Vadodara 1 100.0 100.0 100.0 - - - - - - 100.0 - - - - 2 Surendranagar 1 100.0 - - 100.0 - - - - - 100.0 - - - - 3 Valsad 5 100.0 - 100.0 40.0 - - - 20.0 - 100.0 20.0 - - 20.0 4 Bhavnagar 1 100.0 100.0 100.0 - - - - - - 100.0 - - - - 5 Narmada 2 100.0 - 100.0 - - - - - - 100.0 50.0 50.0 - - 6 Bharuch 1 100.0 - 100.0 - - - - - - 100.0 - - - - 7 Kheda 1 100.0 - 100.0 - - - - - - 100.0 - - - - 8 Panchmahal 2 100.0 - 100.0 50.0 - - - 50.0 50.0 100.0 50.0 50.0 - - 9 Rajkot 1 100.0 - 100.0 - - - - - - 100.0 - - - - 10 Anand 1 100.0 - - - - - - - - 100.0 - - - - 11 Navsari 1 100.0 - 100.0 100.0 - - - - - 100.0 - - - - 12 Amreli 0 - - - - - - - - - - - - - - 13 Nadiad 1 100.0 - 100.0 - - - - - - 100.0 - - - -
Total 18 100.0 11.1 88.9 27.8 16.7 - - 11.1 5.6 100.0 16.7 16.7 - 5.6
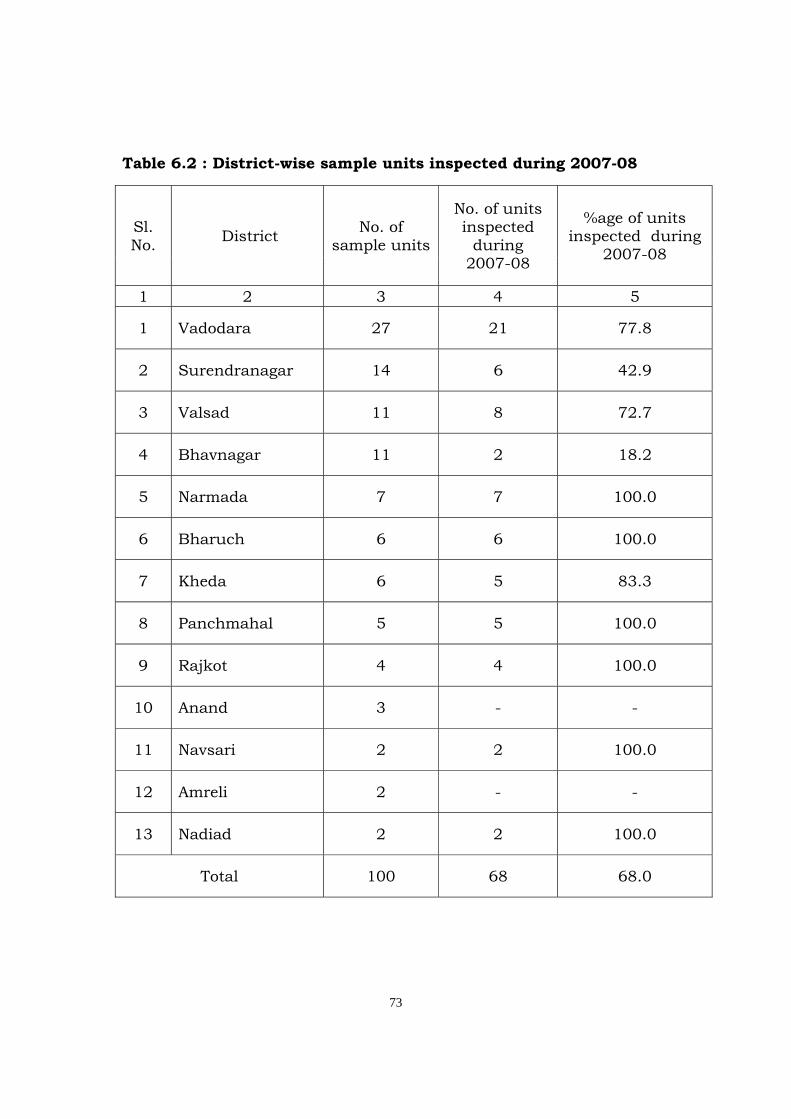
73
Table 6.2 : District-wise sample units inspected during 2007-08
Sl. No. District No. of
sample units
No. of units inspected
during 2007-08
%age of units inspected during
2007-08
1 2 3 4 5
1 Vadodara 27 21 77.8
2 Surendranagar 14 6 42.9
3 Valsad 11 8 72.7
4 Bhavnagar 11 2 18.2
5 Narmada 7 7 100.0
6 Bharuch 6 6 100.0
7 Kheda 6 5 83.3
8 Panchmahal 5 5 100.0
9 Rajkot 4 4 100.0
10 Anand 3 - -
11 Navsari 2 2 100.0
12 Amreli 2 - -
13 Nadiad 2 2 100.0
Total 100 68 68.0
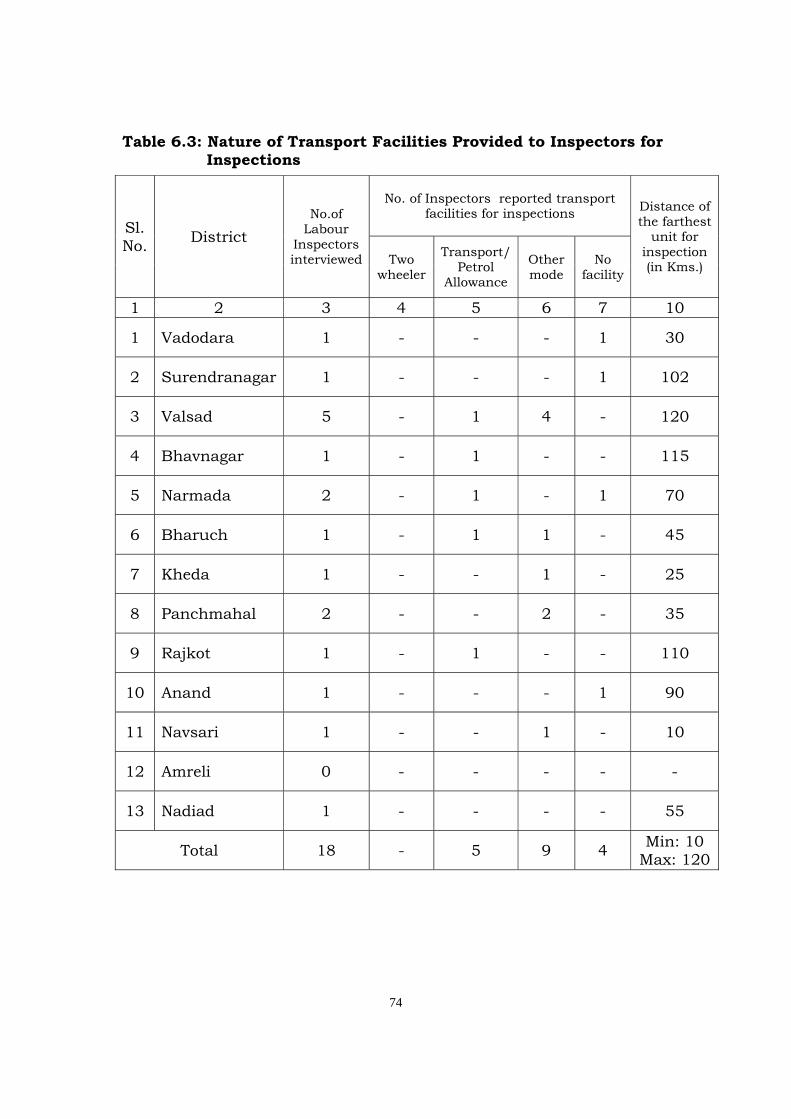
74
Table 6.3: Nature of Transport Facilities Provided to Inspectors for Inspections
Sl. No. District
No.of Labour
Inspectors interviewed
No. of Inspectors reported transport facilities for inspections Distance of
the farthest unit for
inspection (in Kms.) Two
wheeler
Transport/ Petrol
Allowance
Other mode
No facility
1 2 3 4 5 6 7 10
1 Vadodara 1 - - - 1 30
2 Surendranagar 1 - - - 1 102
3 Valsad 5 - 1 4 - 120
4 Bhavnagar 1 - 1 - - 115
5 Narmada 2 - 1 - 1 70
6 Bharuch 1 - 1 1 - 45
7 Kheda 1 - - 1 - 25
8 Panchmahal 2 - - 2 - 35
9 Rajkot 1 - 1 - - 110
10 Anand 1 - - - 1 90
11 Navsari 1 - - 1 - 10
12 Amreli 0 - - - - -
13 Nadiad 1 - - - - 55
Total 18 - 5 9 4 Min: 10 Max: 120

75
CHAPTER – VII
Field Officer’s Observations
1. There had been no sign board of the units at their sites which made difficult to locate the units.
2. Records are not available at the site of units.
3. The units were situated in remote areas.
4. No records are maintained by most of the owners’ which rendered to believe on verbal information.
5. Some of the units found running by other persons than the actual owner of the units (having the lease from the Government).
6. The record of attendance and payment of wages are maintained
only in the rough note books and not in prescribed registers.
7. The attitude of some employers is luke-warm towards providing information about the payments of wages.
8. Most of the owners keep the records at their residence and not in
their units/site of work.
9. The owners of the crushing units do not provide mask or any other protective equipment to workers who remove the dust of stones. Resultantly, the workers are prone to breathing problems and asthma.
10. Due to language problem, workers could be interviewed with the
help of Labour inspectors.
~~0~~
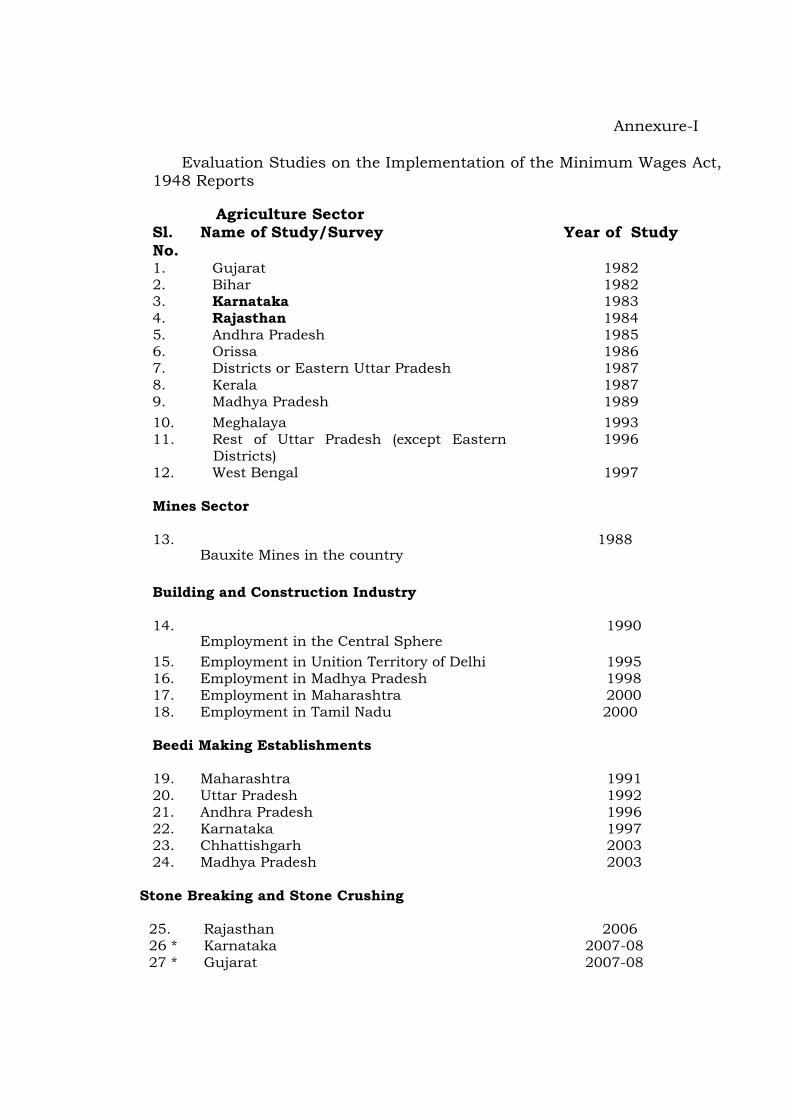
Annexure-I
Evaluation Studies on the Implementation of the Minimum Wages Act, 1948 Reports Agriculture Sector Sl. No.
Name of Study/Survey
Year of Study
1. Gujarat 1982 2. Bihar 1982 3. Karnataka 1983 4. Rajasthan 1984 5. Andhra Pradesh 1985 6. Orissa 1986 7. Districts or Eastern Uttar Pradesh 1987 8. Kerala 1987 9. Madhya Pradesh 1989 10. Meghalaya 1993 11. Rest of Uttar Pradesh (except Eastern
Districts) 1996
12. West Bengal 1997 Mines Sector 13.
Bauxite Mines in the country 1988
Building and Construction Industry 14.
Employment in the Central Sphere 1990
15. Employment in Unition Territory of Delhi 1995 16. Employment in Madhya Pradesh 1998 17. Employment in Maharashtra 2000 18. Employment in Tamil Nadu 2000 Beedi Making Establishments 19. Maharashtra 1991 20. Uttar Pradesh 1992 21. Andhra Pradesh 1996 22. Karnataka 1997 23. Chhattishgarh 2003 24. Madhya Pradesh 2003
Stone Breaking and Stone Crushing 25. Rajasthan 2006 26 * Karnataka 2007-08 27 * Gujarat 2007-08