Embed Size (px)
Citation preview

Empower PDA SoftwareGetting Started Guide
34 Maple StreetMilford, MA 01757
71500031503, Revision A

NOTICE
The information in this document is subject to change without notice and should not be construed as a commitment by Waters Corporation. Waters Corporation assumes no responsibility for any errors that may appear in this document. This document is believed to be complete and accurate at the time of publication. In no event shall Waters Corporation be liable for incidental or consequential damages in connection with, or arising from, the use of this document.
© 2002 WATERS CORPORATION. PRINTED IN THE UNITED STATES OF AMERICA. ALL RIGHTS RESERVED. THIS DOCUMENT OR PARTS THEREOF MAY NOT BE REPRODUCED IN ANY FORM WITHOUT THE WRITTEN PERMISSION OF THE PUBLISHER.
Millennium and Waters are registered trademarks, and Empower is a trademark of Waters Corporation.
Microsoft, Windows, and Windows NT are registered trademarks of Microsoft Corporation.
All other trademarks or registered trademarks are the sole property of their respective owners.

Table of Contents
Preface ....................................................................................... 10
Chapter 1 PDA Software Overview .................................................................. 15
1.1 What Is PDA Software? ........................................................ 15
1.2 Tutorial Overview................................................................... 17
1.3 Restoring the PDA Project .................................................... 18
Chapter 2 Viewing PDA Data ........................................................................... 23
2.1 Tutorial Overview................................................................... 23
2.2 Viewing Data in Review......................................................... 23
2.3 Displaying the 3D Plot........................................................... 29
2.4 Zooming In on Plots .............................................................. 31
2.5 Extracting a Chromatogram .................................................. 33
2.6 Extracting a Spectrum........................................................... 36
2.7 Annotating Chromatograms and Spectra.............................. 41
2.7.1 Adding Annotations.................................................... 42
2.7.2 Erasing Annotations................................................... 45
2.7.3 Annotation Tools ........................................................ 46
Chapter 3 Peak Purity Processing .................................................................... 47
3.1 Tutorial Overview................................................................... 47
3.2 Deriving Chromatograms ...................................................... 48
Table of Contents 3

Table of Contents 4
3.3 Developing a PDA Processing Method ................................. 51
3.3.1 Viewing, Modifying and Saving the Method Set......... 65
3.3.2 Viewing the Peak Purity Calculation .......................... 67
3.4 Reviewing Peak Purity Results ............................................. 69
3.4.1 Using Spectrum Index ............................................... 69
3.4.2 Using the Results Window......................................... 75
Chapter 4 Library Matching .............................................................................. 80
4.1 Tutorial Overview................................................................... 80
4.1.1 Steps in Creating a Library ........................................ 80
4.1.2 Steps in Library Matching .......................................... 81
4.2 Creating a New Library ......................................................... 82
4.3 Matching Spectra to a Library ............................................... 89
4.3.1 Modifying an Existing Processing Method for Library Matching.................................................................... 89
4.3.2 Creating a New Processing Method for Library Matching.................................................................... 94
4.3.3 Performing Library Matching.................................... 107
4.4 Reviewing Library Matching Results ................................... 109

Chapter 5 Printing Reports ............................................................................. 114
5.1 Previewing a Report............................................................ 114
5.2 Background Printing............................................................ 117
Appendix A Default PDA Reports ...................................................................... 120
Index ..................................................................................... 140
Table of Contents 5

List of Figures
1-1 Empower Login Dialog Box............................................................ 181-2 Empower Pro Window ................................................................... 191-3 Configuration Manager .................................................................. 201-4 Restore Project Wizard - Start Software Page .............................. 211-5 Configuration Manager with Restored PDA_Default Project ......... 22
2-1 Empower Pro Window ................................................................... 242-2 Browse Project Dialog Box ............................................................ 242-3 Project Window.............................................................................. 252-4 Review with PDA Data, no Chromatogram Extracted.................... 262-5 Maximized Review Main Window in 3D Layout ............................. 272-6 Review Toolbar Buttons ................................................................. 282-7 Sample 3D Plot Window ................................................................ 302-8 Creating the Zoom Box.................................................................. 312-9 Zoomed View of the Contour Plot.................................................. 322-10 Scaling Tab .................................................................................... 332-11 Extracted Chromatogram at Wavelength 254 nm .......................... 342-12 Extracted Chromatogram at Wavelength 280 nm .......................... 352-13 Overlaid Chromatograms at Wavelengths 254 and 280 nm .......... 362-14 Extracted Spectrum at 1.388 Minutes............................................ 372-15 Overlaid Extracted Spectra............................................................ 382-16 Spectra Table ................................................................................. 392-17 Normalized Spectra ....................................................................... 402-18 Viewing Spectrum Points: Absorbances Versus Wavelengths....... 412-19 Annotation Tools ............................................................................ 422-20 Annotation Object Properties Dialog Box for an Object ................. 432-21 Annotation Object Properties Dialog Box for Text .......................... 442-22 Annotation Example....................................................................... 45
List of Figures 6

3-1 Project Window of the PDA_Default Project .................................. 493-2 Review Main Window with a Max Plot Chromatogram .................. 503-3 Review Main Window with a Chromatogram at 254 nm ................ 513-4 Processing Method Wizard Dialog Box ......................................... 523-5 New Processing Method Dialog Box.............................................. 523-6 Integration - Peak Detection 1 Page, Full View.............................. 533-7 Setting the Peak Width Parameter................................................. 543-8 Integration - Peak Detection 2 Page .............................................. 553-9 Setting the Threshold Parameter ................................................... 563-10 Integration - Integration Region Page ............................................ 573-11 Integration - Peak Rejection Page ................................................. 583-12 Names and Retention Times Page................................................ 593-13 PDA Purity/Matching Page ............................................................ 603-14 PDA Spectral Contrast Page.......................................................... 613-15 Setting the Noise Interval............................................................... 623-16 Processing Method Name Page .................................................... 633-17 Integrated Chromatogram in Review ............................................. 643-18 Method Set Editor Window ............................................................ 653-19 Method Set Tree Pane ................................................................... 663-20 Save Current Method Set Dialog Box ............................................ 663-21 Method Set Editor Window after Modifying and Saving................. 673-22 Purity Angle and Purity Threshold Values in the Peaks Table ....... 683-23 Apex Spectrum .............................................................................. 703-24 Apex Spectra Overlaid with Maximum Impurity Spectra................ 713-25 Maximum Impurity Spectrum with Peak 1 Spectra Zoomed.......... 723-26 Maximum Impurity Spectrum with Peak 2 Spectra Zoomed.......... 733-27 Maximum Impurity Spectrum with Peak 3 Spectra Zoomed.......... 743-28 Results Window ............................................................................. 753-29 Purity Plot ...................................................................................... 763-30 Plot Properties Dialog Box............................................................. 773-31 Purity Plot with Maximum Impurity Indicator.................................. 78
List of Figures 7
4-1 Steps in Library Matching .............................................................. 814-2 Selecting Data for a Library ........................................................... 824-3 Review Main Window..................................................................... 834-4 Open an Existing Method Set Dialog Box...................................... 844-5 Paraben Stds Chromatogram ........................................................ 854-6 Create a New Library Dialog Box .................................................. 864-7 Spectrum Review with Spectra Selected ....................................... 874-8 Add Spectrum to Library Dialog Box.............................................. 884-9 Project Window of the PDA_Default Project .................................. 894-10 Review Main Window..................................................................... 904-11 Integrated 254 nm Chromatogram of Mixture................................ 914-12 Processing Method Window .......................................................... 924-13 PDA Library Search Tab ................................................................ 934-14 Processing Method Wizard Dialog Box ......................................... 944-15 New Processing Method Dialog Box.............................................. 954-16 Integration - Peak Detection 1 Page, Full View.............................. 964-17 Setting the Peak Width Parameter................................................. 974-18 Integration - Peak Detection 2 Page .............................................. 974-19 Setting the Threshold Parameter ................................................... 984-20 Integration - Integration Region Page ............................................ 994-21 Integration - Peak Rejection Page ............................................... 1004-22 Names and Retention Times Page.............................................. 1014-23 PDA Purity/Matching Page .......................................................... 1024-24 PDA Spectral Contrast Page........................................................ 1034-25 Setting the Noise Interval............................................................. 1044-26 PDA Match Library Page ............................................................. 1054-27 Processing Method Name Page .................................................. 1064-28 Processed Chromatogram with Library Match Results................ 1074-29 Integrated Chromatogram with Library Match Results ................ 1084-30 Spectrum Index with Library Matching......................................... 1094-31 Overlaid Library Match Spectra ................................................... 1104-32 Results Window Displaying Library Match Plot ........................... 111
List of Figures 8

4-33 Library Match Plot and Library Match Tab ................................... 1124-34 Triple Plot: Library Match ............................................................. 113
5-1 Project Window............................................................................ 1145-2 Open Report Method Dialog Box................................................. 1155-3 Preview of an Example Report .................................................... 1165-4 Project Window............................................................................ 1175-5 Background Processing and Reporting Dialog Box..................... 1185-6 Sample Report............................................................................. 119
List of Figures 9

Preface
The Empower PDA Software Getting Started Guide describes the basics of how to use the Empower™ PDA option to develop a PDA processing method for peak purity and library matching and to review PDA results.
This guide is intended for a wide variety of users whose familiarity with computers and software ranges from novice to expert.
Organization
This guide contains the following:
Chapter 1 describes the Empower PDA software.
Chapter 2 describes the basics of viewing PDA data.
Chapter 3 describes how to derive chromatograms and how to develop a peak purity processing method.
Chapter 4 describes how to create a spectral library and match spectra to the library.
Chapter 5 describes the basics of printing reports.
Appendix A, Default PDA Reports shows examples of various PDA reports available in Empower software.
Related Documentation
Waters Licenses, Warranties, and Support: Provides software license and warranty information, describes training and extended support, and tells how Waters handles shipments, damages, claims, and returns.
Online Documentation
Empower Help: Describes all Empower windows, menus, menu selections, and dialog boxes for the base software and software options. Also includes reference information and procedures for performing all tasks required to use Empower software. Included as part of the Empower software.
Empower Read Me File: Describes product features and enhancements, helpful tips, installation and/or configuration considerations, and changes since the previous version.
Empower LIMS Help: Describes how to use the Empower LIMS Interface to export results and import worklists.
10

Empower Toolkit Professional Help: Describes how to use the common-object- model, message-based protocol to communicate with the Empower software from a third-party application.
Printed Documentation for Base Product
Empower Software Getting Started Guide: Provides an introduction to the Empower software. Describes the basics of how to use Empower software to acquire data, develop a processing method, review results, and print a report. Also covers basic information for managing projects and configuring systems.
Empower Software Data Acquisition and Processing Theory Guide: Provides theories pertaining to data acquisition, peak detection and integration, and quantitation of sample components.
Empower System Installation and Configuration Guide: Describes Empower software installation, including the stand-alone Personal workstation, Workgroup configuration, and the Enterprise client/server system. Discusses how to configure the computer and chromatographic instruments as part of the Empower System. Also covers the installation, configuration, and use of acquisition servers such as the LAC/E32 module, the busLAC/E™ card, and interface cards used to communicate with serial instruments.
Empower System Upgrade and Configuration Guide: Describes how to add hardware and upgrade the Empower software using an import-and-export upgrade method.
Empower Software System Administrator’s Guide: Describes how to administer the Empower Enterprise client/server system and Workgroup configuration.
Empower Software Release Notes: Contains last-minute information about the product. Also provides supplementary information about specific Empower software releases.
Printed Documentation for Software Options
Empower System Suitability Quick Reference Guide: Describes the basics of the Empower System Suitability option and describes the equations used by the System Suitability software.
Empower PDA Software Getting Started Guide: Describes the basics of how to use the Empower PDA option to develop a PDA processing method and to review PDA results.
Empower GC Software Getting Started Guide: Describes how to use the Empower GC option to develop a GC processing method and to review GC results.
11

Empower GPC Software Getting Started Guide: Describes how to use the Empower GPC option to develop a GPC processing method and to review GPC results.
Empower GPCV Software Getting Started Guide: Describes how to use the Empower GPCV option to develop a GPCV processing method and to review GPCV results.
Empower Light Scattering Software Getting Started Guide: Describes how to use the Empower Light Scattering option to develop a light scattering processing method and to review light scattering results.
Empower ZQ Mass Detector Software Getting Started Guide: Describes installation, configuration, calibration, and tuning methods, as well as how to operate the ZQ Mass Detector with Empower software.
Empower Chromatographic Pattern Matching Software Getting Started Guide: Describes how to use the Chromatographic Pattern Matching option to develop a pattern matching processing method and to review pattern matching results.
Empower Dissolution System Software Quick Start Guide: Describes how to operate the Alliance® Dissolution System using Empower software.
Empower Toolkit Programmer’s Reference Guide: Describes how to use the common-object-model, message-based protocol to communicate with Empower software from a third-party application.
Waters Integrity System Getting Started Guide: Describes features of the Waters Integrity® System and provides step-by-step tutorials that guide a user through the use of the Empower Mass Spectrometry (MS) option.
Empower AutoArchive Software Installation and Configuration Guide: Describes how to install and configure the Empower AutoArchive option.
Documentation on the Web
Related product information and documentation can be found on the World Wide Web. Our address is http://www.waters.com.
Related Adobe Acrobat Reader Documentation
For detailed information about using Adobe® Acrobat® Reader, see the Adobe Acrobat Reader Online Guide. This guide covers procedures such as viewing, navigating, and printing electronic documentation from Adobe Acrobat Reader.
12

Printing This Electronic Document
Adobe Acrobat Reader lets you easily print pages, page ranges, or the entire document by selecting File > Print. For optimum print quantity, Waters recommends that you specify a PostScript® printer driver for your printer. Ideally, use a printer that supports 600 dpi print resolution.
Documentation Conventions
The following conventions can be used in this guide:
Convention Usage
Purple Purple text indicates user action such as keys to press, menu selec-tions, and commands. For example, “Click Next to go to the next page.”
Italic Italic indicates information that you supply such as variables. It also indicates emphasis and document titles. For example, “Replace file_name with the actual name of your file.”
Courier Courier indicates examples of source code and system output. For example, “The SVRMGR> prompt appears.”
Courier Bold Courier bold indicates characters that you type or keys you press in examples of source code. For example, “At the LSNRCTL> prompt, enter set password oracle to access Oracle.”
Underlined Blue Indicates hypertext cross-references to a specific chapter, section, subsection, or sidehead. Clicking this topic using the hand symbol brings you to this topic within the document. Right-clicking and selecting Go Back from the shortcut menu returns you to the origi-nating topic. For example, “Section 4.1.2, Steps in Library Matching, shows the steps used for library matching.”
Keys The word key refers to a computer key on the keypad or keyboard. Screen keys refer to the keys on the instrument located immedi-ately below the screen. For example, “The A/B screen key on the 2414 Detector displays the selected channel.”
… Three periods indicate that more of the same type of item can optionally follow. For example, “You can store filename1, filename2, … in each folder.”
> A right arrow between menu options indicates you should choose each option in sequence. For example, “Select File > Exit” means you should select File from the menu bar, then select Exit from the File menu.
13

Notes
Notes call out information that is helpful to the operator. For example:
Note: Record your result before you proceed to the next step.
Attentions
Attentions provide information about preventing damage to the system or equipment. For example:
Cautions
Cautions provide information essential to the safety of the operator. For example:
STOPAttention: To avoid damaging the detector flow cell, do not touch the flow cell window.
Caution: To avoid burns, turn off the lamp at least 30 minutes before removing it for replacement or adjustment.
Caution: To avoid electrical shock and injury, turn off the detector and unplug the power cord before performing maintenance procedures.
Caution: To avoid chemical or electrical hazards, observe safe laboratory practices when operating the system.
14
1
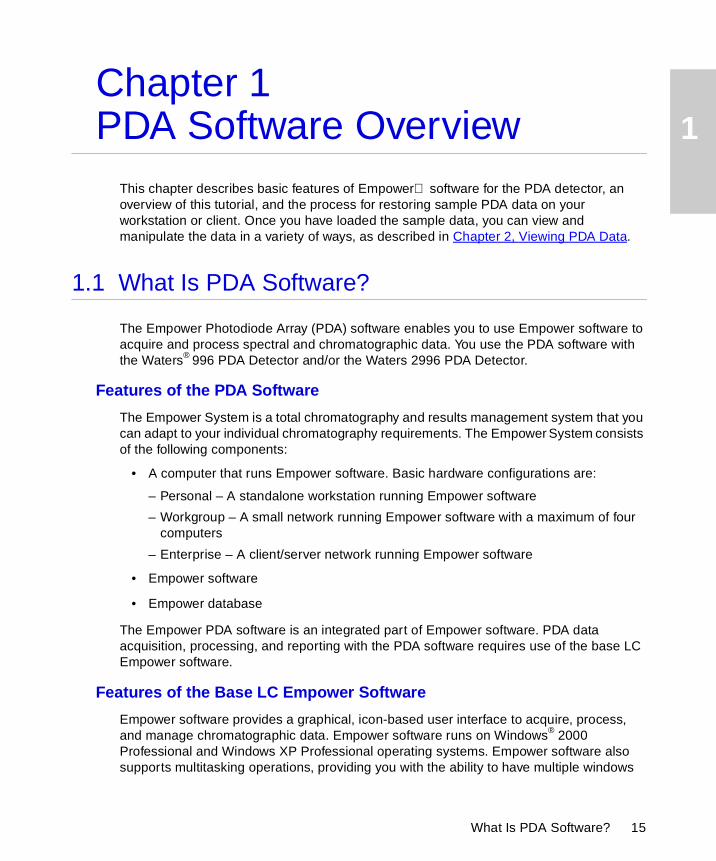
Chapter 1PDA Software OverviewThis chapter describes basic features of Empower software for the PDA detector, an overview of this tutorial, and the process for restoring sample PDA data on your workstation or client. Once you have loaded the sample data, you can view and manipulate the data in a variety of ways, as described in Chapter 2, Viewing PDA Data.
1.1 What Is PDA Software?
The Empower Photodiode Array (PDA) software enables you to use Empower software to acquire and process spectral and chromatographic data. You use the PDA software with the Waters® 996 PDA Detector and/or the Waters 2996 PDA Detector.
Features of the PDA Software
The Empower System is a total chromatography and results management system that you can adapt to your individual chromatography requirements. The Empower System consists of the following components:
• A computer that runs Empower software. Basic hardware configurations are:
– Personal – A standalone workstation running Empower software
– Workgroup – A small network running Empower software with a maximum of four computers
– Enterprise – A client/server network running Empower software
• Empower software
• Empower database
The Empower PDA software is an integrated part of Empower software. PDA data acquisition, processing, and reporting with the PDA software requires use of the base LC Empower software.
Features of the Base LC Empower Software
Empower software provides a graphical, icon-based user interface to acquire, process, and manage chromatographic data. Empower software runs on Windows® 2000 Professional and Windows XP Professional operating systems. Empower software also supports multitasking operations, providing you with the ability to have multiple windows
What Is PDA Software? 15

1
open at the same time. You can view a real-time data acquisition run while simultaneously producing summary results of previously acquired data.
The base LC Empower software provides tools for:
• Creating projects
• Configuring chromatographic systems
• Developing instrument methods to control chromatographic systems
• Acquiring data from samples and standards
• Developing a processing method to perform integration, calibration, and quantitation
• Processing data and obtaining results
• Creating report methods to generate custom reports
• Viewing and printing reports
• Backing up, deleting, restoring, and copying the contents of an individual project
PDA Software Functions
The Empower PDA software supports the following:
• PDA Instrument dialog box – Allows you to define control parameters for the 996 PDA Detector and the 2996 PDA Detector.
• Real-time PDA data acquisition displays – Allow you to plot the latest acquired spectra and wavelengths in Run Samples for up to four individual real-time data acquisition plots.
• 3D blank subtraction – Allows you to use a method set to subtract a labeled 3D chromatogram (a solvent blank) from a second 3D chromatogram (a sample or standard) and display the difference in Review. This feature is useful for subtracting the effects of a mobile phase containing strong UV absorbing compounds.
• PDA calibration – Allows you to examine the wavelength calibration, the reference spectrum and dark current, and the effects of exposure time on photodiode saturation.
• PDA diagnostics – Allow you to run internal and external diagnostics on the 996 PDA Detector and the 2996 PDA Detector.
• Review – Allows you to view your chromatograms and spectra by using the Contour plot, which allows you to extract, integrate, and process 2D chromatograms and spectra (from the 3D data), and the Spectrum Index plot, which displays selected spectra for the peaks shown in the Chromatogram plot. Displays the maximum impurity for multiple PDA purity passes. Also displays the Review Results window which displays purity and library match results.
PDA Software Overview 16

1
• Spectrum Review Spectral plot – Allows you to display library, peak, and extracted spectra in Review, search against library spectra, create derived spectra, and create and maintain spectral libraries.
• Spectrum Review tables – Allow you to display spectral and match results data in Review, such as the:
– Spectra table with an image of all extracted spectra and peak apex spectra with complete data on each spectrum including wavelength range and the resolution used to acquire PDA data
– Library Match table with the results of the library search
– Spectrum Points table with the wavelength and absorbance data points
1.2 Tutorial Overview
This guide does not cover acquiring data, optimizing integration, generating calibration curves, quantitating unknowns, obtaining results for 2D chromatograms, or performing specific PDA procedures. For details on these topics, see the Empower Software Getting Started Guide or the Empower Help.
This tutorial shows you how to:
• Restore PDA data from the Empower Software Options CD-ROM. This data is used in all the examples in this guide.
• Extract chromatograms and spectra.
• Develop a processing method.
• Calculate peak purity and examine peak purity results.
• Build a UV spectral library and match unknown spectra to spectra in the library and examine library match results.
• Generate a report.
Before You Begin
Note: This guide uses the Empower Pro interface. If you do not have access to this interface, see your system administrator.
Before you perform the procedures described in this guide, make sure that:
• You installed or upgraded the Empower software as described in the Empower System Installation and Configuration Guide or the Empower System Upgrade and Configuration Guide.
• You reviewed and followed the basic operating procedures, including data acquisition, described in the Empower Software Getting Started Guide.
Tutorial Overview 17

1
• You read the Waters 996 PDA Detector Operator’s Guide or the Waters 2996 PDA Detector Operator’s Guide.
• Your printer is properly configured for use with Empower software.
1.3 Restoring the PDA Project
To run through the tutorial, you will restore the PDA example project, called PDA_Default. This project contains the sample PDA data used in all the examples in this guide. Use the Restore Project Wizard in Configuration Manager to restore the project data to your computer. The PDA project is located on the Empower Options CD-ROM.
To restore the PDA project PDA_Default:
1. Start Empower software by double-clicking the Empower Login desktop icon. Alternatively, select Start > Programs (for Windows XP, All Programs) > Empower > Empower Login. The Empower Login dialog box appears (Figure 1-1).
Figure 1-1 Empower Login Dialog Box
2. Enter your user name and password. If you do not know your user name or password, see your system administrator.
3. If you are using an Empower Enterprise system, select the correct database from the Database list. This list appears only when you are connected to a client/server system.
4. Click Advanced and verify that the Requested Interface field is set to Pro. If you cannot select the Empower Pro interface, see your system administrator.
5. Click OK. The Empower Pro window appears with the name of the logged-in user displayed (Figure 1-2).
Personal System Workgroup or Enterprise System
PDA Software Overview 18

1
Figure 1-2 Empower Pro Window
Logged-in User and Database
Name
Restoring the PDA Project 19

1
6. Click Configure System (Figure 1-2) to open Configuration Manager with the available projects displayed in the view table (Figure 1-3).
Figure 1-3 Configuration Manager
7. Click (Restore Project(s)) (Figure 1-3) to start the Restore Project Wizard (Figure 1-4).
Restore Project(s) Tool
ViewTable
PDA Software Overview 20

1
8. Click the Browse button to select the path of your CD-ROM drive as shown in Figure 1-4. The drive letter can differ from the one in Figure 1-4.
Figure 1-4 Restore Project Wizard - Start Software Page
9. Click Next and follow the instructions on each page to complete the wizard.
Note: If a message indicates that the restored project needs to be updated, click OK.
10. Click Finish on the last page, Restore Display, to complete the restoration. The restored project, PDA_Default, appears in the Configuration Manager Projects view table (Figure 1-5). If the project does not appear, select View > Refresh.
11. Select File > Exit to close Configuration Manager.
Browse Button
Restoring the PDA Project 21

1
Figure 1-5 Configuration Manager with Restored PDA_Default Project
You are now ready to view the PDA data using Empower software.
PDA Software Overview 22

2
Chapter 2Viewing PDA Data
This chapter provides step-by-step procedures for viewing chromatograms and spectra.
2.1 Tutorial Overview
This tutorial shows you the basics of using Empower software to view the data in the PDA_Default project. Now that you have restored PDA sample data to your Empower
workstation, you can examine it in a variety of ways. The procedures in this chapter are the building blocks for using the PDA software and are a foundation for the procedures in Chapter 3, Peak Purity Processing, and Chapter 4, Library Matching. This chapter describes the simple tasks you can do to view the PDA data that comes with Empower software, including:
• Using Review and viewing the Contour plot
• Displaying the 3D plot
• Zooming in on plots
• Extracting a chromatogram
• Extracting a spectrum
• Annotating chromatograms and spectra
2.2 Viewing Data in Review
Review is the Empower software application that lets you view and manipulate 2D and 3D chromatographic data brought in from the Project window. Review consists of menus, toolbars, the Chromatogram plot, the Channel table, the Contour plot, the Spectrum Review Spectral plot, and the Spectrum Review tables. Each item is explained in this section.
To view a PDA data file in Review:
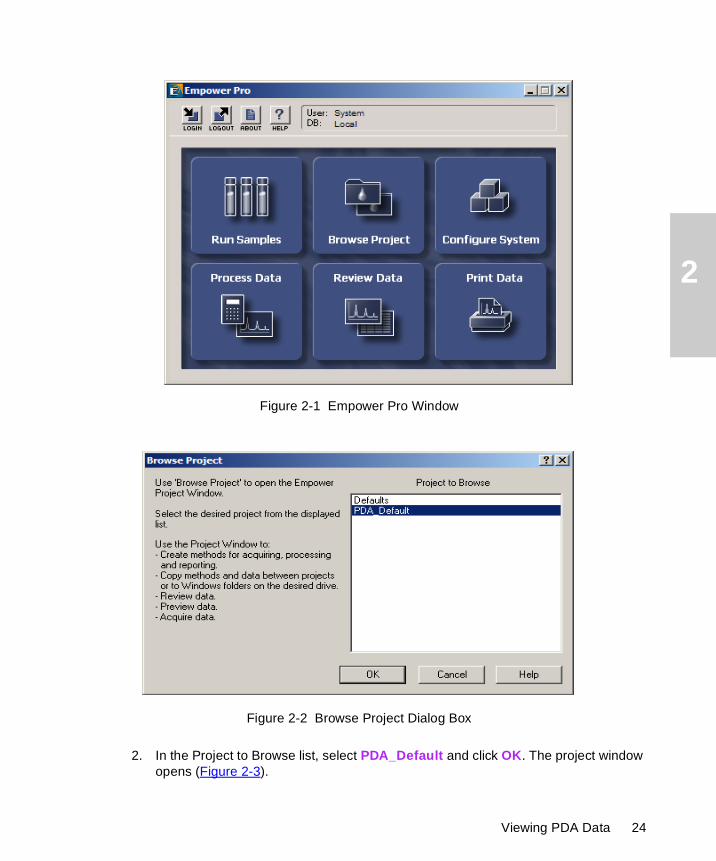
1. In the Empower Pro window (Figure 2-1), click Browse Project to open the Browse Project dialog box (Figure 2-2).
Tutorial Overview 23
2
Figure 2-1 Empower Pro Window
Figure 2-2 Browse Project Dialog Box
2. In the Project to Browse list, select PDA_Default and click OK. The project window opens (Figure 2-3).
Viewing PDA Data 24

2
Note: If PDA_Default does not appear in the Project to Browse list, check that you restored it according to Section 1.3, Restoring the PDA Project.
Figure 2-3 Project Window
3. Click the Channels tab in the Project window, then select Mixture in the Channels View table. Click (Review) or select Tools > Review (Figure 2-3). Review appears with the unprocessed data in a screen similar to the one in Figure 2-4. (If your screen does not resemble Figure 2-4, select Window > Main Window.)
Review Button
Channels View Table
Channels Tab
Viewing Data in Review 25

2
Figure 2-4 Review with PDA Data, no Chromatogram Extracted
4. If the Review window is not maximized, click (maximize) (Figure 2-4). Maximize both the main window and the daughter window.
Note: If you do not see the Contour plot and Spectrum Review, select View > 3D Layout.
Figure 2-5 displays Review with the Review Main window maximized. The Contour plot is an overhead view of the three-dimensional data file in which the x-axis plots time and the y-axis plots wavelength. The chromatogram plot displays extracted chromatograms. Spectrum Review displays extracted spectra.
Note: No chromatograms or spectra are extracted at this time.
Review Main
Window
Maximize Button
ContourPlot
Spectrum Review
Viewing PDA Data 26

2
Figure 2-5 Maximized Review Main Window in 3D Layout
5. Click the 3D Channels tab at the bottom of Review (Figure 2-5) to view information regarding the data file, such as sample name, type, date, time acquired, and so on.
6. Figure 2-6 shows the tools you can use as shortcuts in Review. This figure shows the toolbar separated into two rows in order to label the tools.
Shortcut ToolsContour
Plot
3D Channels Tab
Review Menus
Spectra Table
Spectrum Review is Made Up of the Spectra Table and the Spectra Plot
Spectrum Review 3D Channels Table
Chromatogram Plot
Viewing Data in Review 27

2
Figure 2-6 Review Toolbar Buttons
Review Toolbar
Maximum Impurity-Pass 1Peak Offsets
Peak Valleys
Unzoom
Processing Method Wizard
Extract Chromatogram
Integrate
Results
Processing Method
Overlay
3D Plot
Method Set
Previous 2D Channel
Quantitate
Empower Help
Library Match
Calibrate
Full View
Next 2D Channel
Review Main Window
Extract Spectrum
Annotation Tools Drop-Down List
Clear AnnotationTool
Extract Choices Drop-Down List
Review ToolsSave All
Save Processing Method
Previous 3D ChannelNext 3D Channel
Maximum Impurity-Pass 4Maximum Impurity-Pass 3
Maximum Impurity-Pass 2
Peak ApexPeak Inflection
Apply Method Set
Set Peak Width,Set Threshold,
Set Minimum Area,and
Set Minimum Height, Respectively
Viewing PDA Data 28

2
2.3 Displaying the 3D Plot
The 3D plot provides a three-dimensional view of PDA data. The data is plotted on three axes:
• X-axis – Represents time.
• Y-axis – Represents absorbance units.
• Z-axis – Represents wavelength.
You can rotate the 3D plot to view the data from the following different perspectives:
• The front view displays a chromatogram with time plotted on the x-axis and absorbance units plotted on the y-axis.
• The side view displays the UV spectra with wavelength plotted on the x-axis and absorbance units plotted on the y-axis.
• The top view displays a contour plot with time plotted on the x-axis and wavelength plotted on the y-axis.
To display the 3D plot:
1. With the PDA data open in Review, click the Legend tab on the lower-right side of Review to display the legend for the absorbance. The legend defines the colors used in the Contour plot and the 3D plot.
2. Click (3D Plot) or select Window > 3D Plot (Figure 2-6) to view the 3D plot.
3. You can rotate the handle on the 3D plot (Figure 2-7) to view it from one of the following perspectives:
• Front – Move the handle to the upper center of the window.
• Side – Move the handle to the upper-right corner of the window.
• Top – Move the handle to the bottom center of the window.
Displaying the 3D Plot 29

2
Figure 2-7 Sample 3D Plot Window
4. To exit the 3D Plot window and return to the Review Main window, click (Close) (the lower close button) in the upper-right corner of the daughter (not the main) window.
X-Axis Represents Time Z-Axis Represents Wavelength
Handle for Rotating 3D Plot
Y-Axis Represents Absorbance Units
Close Button
Y-Axis Represents Absorbance Units
Viewing PDA Data 30

2
2.4 Zooming In on Plots
You can examine graphical plot features in detail by using a zoom box. You can zoom in on the Chromatogram plot, Contour plot, and Spectral plot. You also use this technique to view baseline noise in a chromatogram.
To create a zoom box, hold down the left mouse button and drag the mouse around the features you want to enlarge. A box appears around the area of interest (Figure 2-8). When the box is in the desired size and position, release the left mouse button.
Figure 2-8 Creating the Zoom Box
Figure 2-9 shows the area after zooming.
Note: If you view the 3D plot after zooming on the Contour plot, the 3D plot is also zoomed to the same region of data. There is no zoom capability directly in the 3D Plot window. See Section 2.3, Displaying the 3D Plot, for information on viewing the 3D plot.
Zoom Box
Zooming In on Plots 31

2
Figure 2-9 Zoomed View of the Contour Plot
Rescaling the Plot
You can revert to the unzoomed plot in one of the following ways:
• Full View – Reverts the plot to its original scale. To activate Full View, click (Full View) or right-click in the Contour plot and select Full View (Figure 2-9).
• Unzoom – Returns to the previous zoom when you have zoomed repeatedly. To activate Unzoom, click (Unzoom) or right-click in the Contour plot and select Unzoom (Figure 2-9).
Full View ToolUnzoom Tool
Viewing PDA Data 32

2
Saving Zoom Parameters
If you repeatedly want to see the same zoomed area, you can save the parameters of the zoom box. To save the zoom parameters:
1. Right-click the desired plot, then select Properties to access the Plot Properties dialog box.
2. Click the Scaling tab, then click Get Values from Plot to fill in values from the plot in the Scaling section of the tab (Figure 2-10). Alternatively, enter the X-start, X-end, Y-start, and Y-end values manually.
3. Click OK to apply the settings.
Note: For details on how to customize display settings, see the “Customizing the Display of Data in Review” topic in the Empower Help.
Figure 2-10 Scaling Tab
2.5 Extracting a Chromatogram
Extracting a chromatogram manually allows you to see what the chromatogram looks like at any wavelength across the collected wavelength range. You can extract chromatograms from several wavelengths and then overlay them for further comparison.
Extracting a Chromatogram 33

2
To manually extract a chromatogram:
1. With the PDA data displayed in Review, select 254.0 from the Extract Choices list to display a wavelength marker and an extracted 254.0-nm chromatogram in the chromatogram plot (Figure 2-11).
Note: The 254.0 nm selection is a default value that automatically appears in the list.
Figure 2-11 Extracted Chromatogram at Wavelength 254 nm
2. View a chromatogram at a different wavelength using one of these methods:
• In the Extract Choices list, select the empty choice at the top. Drag the wavelength marker to the desired wavelength, for example, 280.0. As you drag the wavelength marker, the chromatogram automatically updates in the Chromatogram plot (Figure 2-12).
Wavelength Marker
Extract Choices Drop-Down List
2D Channels Tab Spectra Tab
Viewing PDA Data 34

2
• In the Extract Choices list, select the empty choice at the top of the list. Double-click the wavelength marker and enter the desired wavelength, for example, 280.0, and press Enter (Figure 2-12).
• Enter the desired wavelength, for example, 280.0 in the Extract Choices list, and click (Extract Chromatogram) (Figure 2-12).
Figure 2-12 Extracted Chromatogram at Wavelength 280 nm
3. To overlay the chromatograms, click (Overlay) or select Plot > Overlay. The overlaid chromatograms appear in the Chromatogram plot as shown in Figure 2-13. The 2D Channels tab lists each extracted chromatogram. The Channel Description field indicates the extracted wavelength (you might need to scroll to the right side of the table to see this field).
Extract Choices Drop-Down List
Extract Chromatogram Tool
Chromatogram Plot
Wavelength Marker
2D Channels Tab
Extracting a Chromatogram 35

2
4. Click (Overlay) or select Plot > Overlay again to toggle back to a single chromatogram. The extracted chromatogram that is selected in the 2D Channels tab is displayed.
Figure 2-13 Overlaid Chromatograms at Wavelengths 254 and 280 nm
2.6 Extracting a Spectrum
When you extract a spectrum manually, you can see what the spectrum looks like at any time in the chromatographic run. You can extract a spectrum at several elution times and then overlay them for further comparison. You can also use extracted spectra to build spectral libraries.
Overlaid Chromatograms
Two Markers Indicate a Chromatogram Extracted at Two Different WavelengthsOverlay Tool
Channel Description
Viewing PDA Data 36

2
To manually extract a spectrum:
1. With the PDA data displayed in Review, click (Extract Spectrum) to display a spectrum marker in the lower-left corner of the Contour plot and to display an extracted spectrum in Spectrum Review.
2. Change the spectrum marker using one of the following methods:
• Drag the spectrum marker to the desired time, for example, 1.388 (the retention time of the first peak apex). Notice as you drag the marker, the spectrum automatically updates in Spectrum Review (Figure 2-14).
• Double-click the spectrum marker and enter the desired time, for example, 1.388, then press Enter (Figure 2-14).
• Right-click the spectrum marker and select Edit. Enter the desired time, for example, 1.388, then press Enter (Figure 2-14).
Figure 2-14 Extracted Spectrum at 1.388 Minutes
Spectrum ReviewExtract Spectrum Tool
SpectrumMarker
Spectrum ReviewExtract Spectrum Tool
Extracting a Spectrum 37

2
3. Click (Extract Spectrum) to extract another spectrum.
4. Change the spectrum marker to 2.159 (the retention time of the second peak apex). The next spectrum is overlaid with the previous spectrum in Spectrum Review (Figure 2-15).
Figure 2-15 Overlaid Extracted Spectra
5. Click the Spectra tab on the lower-right side of the window (Figure 2-16) to view information about the spectra in Spectrum Review.
Spectrum Review
Viewing PDA Data 38

2
Figure 2-16 Spectra Table
6. To view the overlaid spectra in a normalized fashion, double-click inside the Spectrum plot. Note that the y-axis does not display absorbance units. Viewing the normalized spectra corrects for concentration differences and allows you to compare the UV spectra based on their shape differences (Figure 2-17).
You can restore the default scaling (autoscaling) by double-clicking again inside the Spectrum plot.
Spectra Tab
Spectra Table
Spectrum Plot
Extracting a Spectrum 39

2
Figure 2-17 Normalized Spectra
7. In the Spectra table below Spectral Review, clear all but one spectrum by selecting the Select check box (Figure 2-17).
8. Scroll in the area containing the tabs below the Spectra table and click the Spectrum Points tab to display the raw data points of the spectrum, as shown in Figure 2-18.
Select Check Boxes
NormalizedSpectra
SpectraTable
Viewing PDA Data 40

2
Figure 2-18 Viewing Spectrum Points: Absorbances Versus Wavelengths
2.7 Annotating Chromatograms and Spectra
Empower software has a set of Annotation tools. In Review, these tools allow you to add notes to chromatograms and spectra when you want to:
• Copy one to a document or presentation
• Print one for reference
Note: Annotations are not saved when you exit Review.
Spectrum Points Table
Spectrum Points Tab
Scroll Here Until the Spectrum Points Tab Appears
Annotating Chromatograms and Spectra 41

2
2.7.1 Adding Annotations
In the following example, you will annotate the chromatogram by drawing an arrow and adding supporting text.
Drawing an Arrow
To draw an arrow on the chromatogram:
1. With the PDA data displayed in Review, select (arrow tool) from the Annotation Tools list (Figure 2-19).
Figure 2-19 Annotation Tools
2. Move the mouse to the Chromatogram plot. The pointer changes to an arrow tool.
3. Hold the left mouse button while drawing an arrow to the tallest peak. When you finish drawing, release the mouse button.
Annotation Tools
Annotation Tools Drop-Down List Clear Annotations
Viewing PDA Data 42

2
4. Click the arrow to select it. The pointer changes to a pointing finger and the arrow is selected (black handles appear on each end). When the arrow is selected, you can:
• Move it to another location by clicking a part of the arrow other than the black handles and dragging it to the desired location.
• Rotate the arrow by holding one of the black handles and turning it in the desired direction.
• Resize the arrow by pulling one of the black handles.
• Delete the arrow by pressing the Delete key.
If you do not want to change the arrow, click elsewhere in the Chromatogram plot to deselect it.
5. Right-click the arrow and select Annotations > Properties to open the Annotation Object Properties dialog box (Figure 2-20). From this dialog box you can change the style, thickness, and/or color of the arrow.
Figure 2-20 Annotation Object Properties Dialog Box for an Object
Adding Text
To add text to the chromatogram:
1. From the Annotation Tools list, select (text tool).
2. Move the mouse to the Chromatogram plot. The pointer changes to +abc.
Annotating Chromatograms and Spectra 43

2
3. Click the area of the plot where you want to add text to open the Annotation Object Properties dialog box (Figure 2-21).
Figure 2-21 Annotation Object Properties Dialog Box for Text
4. In the Text field, type the text you want to add to the chromatogram. From this dialog box you can also specify text properties such as alignment, font, and size. When you are finished, click OK to add the text to the chromatogram.
5. Click the text to select it. The pointer changes to a pointing finger and the text is selected (black handles appear on the corners). When the text is selected, you can:
• Move the text to another location by clicking a part of the text other than the black handles and dragging to the desired location.
• Resize the text box (if all of your text is not displayed) by pulling one of the black handles.
• Delete the text by pressing the Delete key.
If you do not want to make these changes to the text, click elsewhere in the plot to deselect the text.
6. To change the text and/or the properties of the text, right-click the text and select Annotations > Properties to open the Annotation Object Properties dialog box
Viewing PDA Data 44

2
Figure 2-22 shows an example of an annotation in the Chromatogram plot.
Figure 2-22 Annotation Example
2.7.2 Erasing Annotations
Click (Clear Annotations) to remove all annotations. You can only remove individual annotations by selecting them and pressing the Delete key.
Annotating Chromatograms and Spectra 45

2
2.7.3 Annotation Tools
The remaining Annotation tools, other than the text tool, function the same way as the arrow. This list describes each Annotation tool and the action it performs or the object it creates.
Exiting Review
To exit Review:
1. Click (Close) or select File > Exit (Figure 2-18). A dialog box warning that the modified method set cannot be saved appears.
2. Click OK.
Next Steps
Now that you have examined the PDA_Default data in Review, you have the following options:
• You can develop a processing method for peak purity, as described in Chapter 3, Peak Purity Processing.
• You can create a spectral library and develop a processing method to match unknown spectra against the library, as described in Chapter 4, Library Matching.
Tool Action or Object
Draws a line.
Draws a line with an arrowhead on one end.
Draws a line with arrowheads on both ends.
Draws a rectangle.
Draws an ellipse.
Adds text.
Viewing PDA Data 46

3
Chapter 3Peak Purity Processing
This chapter provides a tutorial with step-by-step procedures for developing a PDA processing method to determine peak purity.
3.1 Tutorial Overview
This tutorial familiarizes you with Empower PDA software tools and the procedures used to develop a PDA processing method for determining peak purity. You calculate peak purity to determine if a peak is spectrally homogeneous. Spectral heterogeneity can indicate the presence of a coelution. A coelution of two or more spectrally distinct compounds can produce a spectrally heterogeneous peak.
This tutorial shows you how to:
• Derive chromatograms.
• Develop a processing method to determine peak purity using the Processing Method Wizard, which is where you define key parameters for integration and peak purity determination.
• Examine peak purity results in Spectrum Index.
• View peak purity results in the Purity table and Purity plot of the Results window.
Steps to Compute Peak Purity
The following are the steps used to compute peak purity:
1. Bring the PDA data from the PDA_Default Project into Review (Section 3.2).
2. Derive chromatograms (Section 3.2).
3. Build a PDA processing method (Section 3.3).
Tutorial Overview 47

3
4. View results (Section 3.4).
• Peak apex spectrum
• Maximum impurity pass 1 spectrum
• Purity table
• Purity plot and points of maximum impurity
3.2 Deriving Chromatograms
Before developing a processing method that computes peak purity, you must derive a chromatogram. A derived chromatogram is the two-dimensional chromatogram extracted from the three-dimensional PDA data at the wavelength that you specify.
Note: A Max Plot chromatogram is a derived chromatogram which plots the maximum spectral absorbance measured at each time point. It allows you to see all the chromatographic peaks in the sample regardless of each peak’s lambda max (the wavelength at maximum absorbance). The Max Plot chromatogram is useful in determining the appropriate noise interval for your processing method. It is also necessary to check the absorbance range of the Max Plot chromatogram. When obtaining purity results, it is important that your sample does not exceed 1.0 AU in any region of the 3D data (see step 4 in Section 3.2). However, data extracted at one particular wavelength is typically used to set processing parameters when developing a processing method and for quantitative purposes. Because Max Plot uses the absorbances from all wavelengths in the range selected during data acquisition, it is not meaningful to use it to generate a calibration curve and quantitate data.
To derive a chromatogram:
1. Open the Project window, which you opened in Chapter 2, Viewing PDA Data, by selecting the PDA_Default project in the Windows taskbar.
Peak Purity Processing 48

3
2. In the Channels tab of the Project window (Figure 3-1), select Mixture. Click (Review) or select Tools > Review. The Review window appears.
Figure 3-1 Project Window of the PDA_Default Project
3. From the Extract Choices list in Review, select MAX Plot to extract a Max Plot chromatogram. The chromatogram appears in the Chromatogram plot (Figure 3-2).
ReviewButton
Deriving Chromatograms 49

3
Figure 3-2 Review Main Window with a Max Plot Chromatogram
4. Ensure that the absorbance of all peaks in the chromatogram is less than 1 AU (absorbance unit). This criteria is necessary when calculating purity results in order for these results to be valid. If the absorbance is less than 1 AU, proceed with the next step. If the absorbance of any peak is greater than 1 AU, dilute the sample appropriately and acquire it again.
5. From the Extract Choices list, select 254 to extract a chromatogram at 254.0 nm. The Max Plot chromatogram is replaced with the newly extracted chromatogram (Figure 3-3). We will use the 254-nm extracted channel to determine the optimal integration parameters.
Select MAX Plot from the Extract Choices Drop-Down List
Peak Purity Processing 50

3
Figure 3-3 Review Main Window with a Chromatogram at 254 nm
3.3 Developing a PDA Processing Method
Now that you have verified that your absorbance for each peak is less than 1 AU and you have extracted a chromatogram at the desired wavelength, you can build a processing method to integrate the chromatograms and assess peak purity. The simplest way to build a PDA processing method is to use the Processing Method Wizard.
Note: This procedure assumes that the Use V3.0X Style Peak Width and Threshold Determination system policy is enabled (the default setting). If this system policy is not enabled on your system, the Processing Method Wizard will look slightly different. For more information on this system policy, see the Empower Help.
Select 254 from the Extract Choices Drop-Down List
2D Channels Tab
Developing a PDA Processing Method 51

3
This procedure uses the traditional integration algorithm rather than the ApexTrack integration algorithm. For more information on these processing algorithms, see the Empower Software Acquisition and Processing Theory Guide or the ApexTrack Integration: Theory and Application white paper (go to www.waters.com).
Note: Ensure that the 254-nm channel is selected in the Channels tab (Figure 3-3).
To build a PDA processing method:
1. Click (Processing Method Wizard) or select File > New > Processing Method to start the wizard and open the Processing Method Wizard dialog box (Figure 3-4).
Figure 3-4 Processing Method Wizard Dialog Box
2. Click Create a New Processing Method and click OK to open the New Processing Method dialog box (Figure 3-5).
Figure 3-5 New Processing Method Dialog Box
Peak Purity Processing 52

3
3. From the Processing Type list, select PDA. If the Integration Algorithm list is present, select Traditional. Make sure the Use Processing Method Wizard check box is selected, then click OK to go to the Integration - Peak Detection 1 page (Figure 3-6).
Note: The Integration Algorithm list appears only if ApexTrack integration is enabled in your system policies and ApexTrack is enabled in your PDA_Default project.
Figure 3-6 Integration - Peak Detection 1 Page, Full View
This page allows you to set the peak width parameter in your processing method. Peak width determines the number of points bunched together to act as a filter and to produce a single point for peak detection (although all data points are used during integration).
4. Follow the wizard instructions and use the mouse to draw a zoom box that encloses the liftoff and touchdown of the narrowest peak of interest (peak 1 at 1.39 minutes). The software displays the zoomed selection and determines the appropriate peak width (Figure 3-7).
Peak WidthZoom Box
Developing a PDA Processing Method 53

3
Note: Right-click the plot to access the Full View/Unzoom shortcut menu selections. If you are unsure which peak is the narrowest, you can check different peaks by zooming and unzooming repeatedly on each peak. Each time you zoom, the software calculates and displays the appropriate peak width. Zoom properly (and perhaps multiple times) so that the peak start is at the beginning of the displayed x-axis in the plot and the peak end is at the end of the displayed x-axis in the plot.
The peaks in this data have nearly identical widths and all yield a Peak Width setting of 15 seconds when zoomed correctly. It therefore does not matter which peak is chosen, however, some data does contain peaks of varying widths. In this case, the appropriate peak should be used.
Figure 3-7 Setting the Peak Width Parameter
5. Click Next to go to the Integration - Peak Detection 2 page (Figure 3-8).
Peak Purity Processing 54

3
Figure 3-8 Integration - Peak Detection 2 PageThis page allows you to set the threshold parameter in your processing method based on a selected area of baseline. Threshold is a slope setting that defines the peak liftoff and touchdown points by determining whether the slope across three data points exceeds the determined slope threshold. It is used to reject baseline noise.
6. Follow the wizard instructions and use the mouse to draw a zoom box that encloses the area of the baseline that contains the greatest amount of noise and no peaks of
Developing a PDA Processing Method 55

3
interest (approximately 0.2 to 1.2 minutes). The software displays the zoomed selection and determines the appropriate threshold value (Figure 3-9).
Note: In general, you might need to zoom the baseline several times to ensure that the selected area is free of peaks of interest.
Figure 3-9 Setting the Threshold Parameter
7. Click Next to go to the Integration - Integration Region page (Figure 3-10).
Peak Purity Processing 56

3
Figure 3-10 Integration - Integration Region PageThis page allows you to refine your integration by using an Inhibit Integration event to specify a time region where no integration occurs.
8. If you want to inhibit integration, follow the wizard instructions and use the mouse to draw a zoom box that encloses the area where you want integration to occur. Integration is inhibited in the area outside of the zoom box. The software displays the zoomed selection. Click Next to go to the Integration - Peak Rejection page (Figure 3-11).
This step is not necessary with this particular data. If you do not want to inhibit integration, do nothing in this dialog box and click Next.
Developing a PDA Processing Method 57

3
Figure 3-11 Integration - Peak Rejection PageUse this page to reject small peaks that are not of interest. This step is not necessary with this particular data as there is no unwanted baseline noise that is integrated. Click Next to go to the Calibration - General page.
Note: To use this setting, select the smallest peak of interest to highlight it in red. Select the Mimimum Area or Minimum Height check box to set the minimum area or height to 95% of the selected peak.
When it is necessary to use the Minimum Area or Minimum Height parameter, you typically use one or the other, but not both. For more information see the “Minimum Area” and “Minimum Height” topics in the Empower Help.
9. Accept the default settings and click Next. A message indicates that channels require channel names in order to perform cross-channel internal standard processing. Click No in this dialog box. The Names and Retention Times page appears (Figure 3-12).
Peak Purity Processing 58

3
Figure 3-12 Names and Retention Times Page10. Click 1 to the left of the Name column in the first row. Press Shift and click 3 to the left of the Name column in the third row. All rows are highlighted. Press Delete on your keyboard to remove all entries from this table. Click Next on this page and successive pages until the PDA Purity/Matching page appears (Figure 3-13).
Note: Entering component names and amounts is necessary only when you intend to process standards, generate calibration curves, and quantitate unknowns. Since this guide focuses on generating purity and library match data, this information is unnecessary. For information about calibration and quantitation, see the Empower Software Getting Started Guide or the Empower Help.
Developing a PDA Processing Method 59

3
Figure 3-13 PDA Purity/Matching Page11. Ensure Yes is selected for the question “Do you wish to perform peak purity testing on all peaks?”. For the question “Do you wish to match spectra against PDA library spectra?” click No (Figure 3-13). Click Next to go to the PDA Spectral Contrast page (Figure 3-14).
Peak Purity Processing 60

3
Figure 3-14 PDA Spectral Contrast PageUse this page to set the noise interval by selecting a segment of the baseline that is free of peaks. You must select a segment of the baseline that is at least one-half minute in length.
Note: The MaxPlot check box is selected by default and allows you to display the Max Plot chromatogram in the PDA Spectral Contrast page regardless of the type of chromatogram that was extracted before starting the Processing Method Wizard. It is recommended to use the Max Plot chromatogram when setting the noise interval to ensure that this parameter is set to a region of the baseline where no compound-related spectral absorbance occurs.
When the MaxPlot check box is selected, the software displays the Max Plot chromatogram for the entire wavelength range in which the data was acquired. If you need to view the Max Plot chromatogram without using the entire acquired wavelength range, you must create a Max Plot chromatogram with the appropriate Start and End Wavelength by creating a derived channel in your method set and then applying the method set before starting the Processing Method Wizard. The Start and End Wavelength Limits are set in the Purity tab of the processing method. (These settings are not available when using the Processing Method Wizard. You must view the processing method by clicking (Processing Method) or by selecting Window > Processing Method.)
It is often desirable to define the wavelength start range above 190 nm to eliminate the effect of mobile phase absorption.
Developing a PDA Processing Method 61

3
12. Select the segment of the baseline from approximately 3.00 to 3.50 minutes (Figure 3-15).
You can select the baseline area by using the mouse to zoom in on the desired area, or you can specify the baseline area by typing the start and end time of the desired area in the Noise Interval Start Time and Noise Interval End Time text boxes, respectively.
When zooming, you can right-click and select Fullview or Unzoom to move between zoom levels. Do this to view multiple sections of baseline before deciding on the correct region for the noise interval.
For details about selecting the noise interval, see the “Determining the Noise Interval” topic in the Empower Help.
Figure 3-15 Setting the Noise Interval
13. Click Next to go to the Processing Method Name page (Figure 3-16).
Peak Purity Processing 62
3
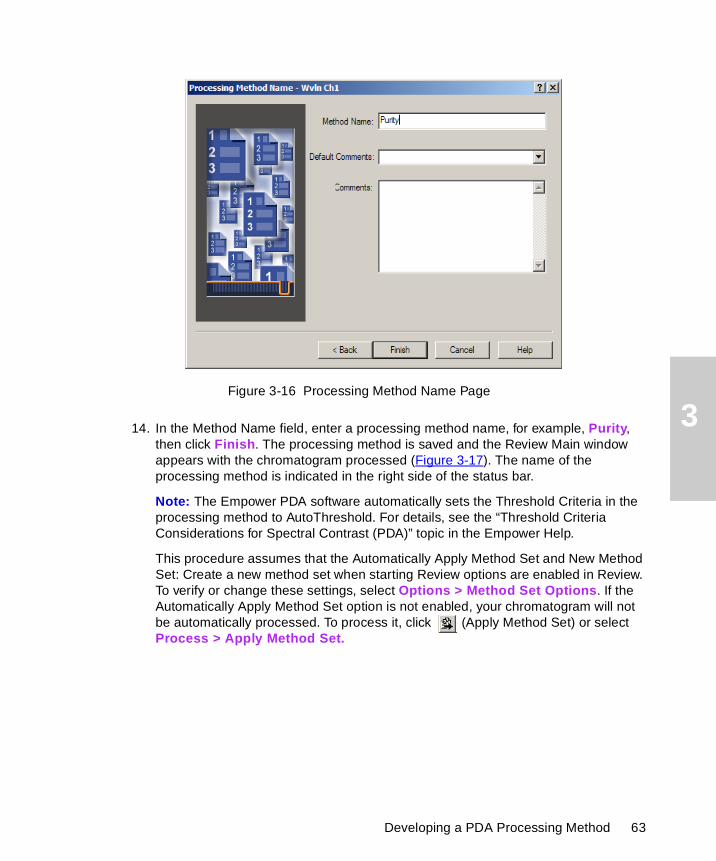
Figure 3-16 Processing Method Name Page14. In the Method Name field, enter a processing method name, for example, Purity, then click Finish. The processing method is saved and the Review Main window appears with the chromatogram processed (Figure 3-17). The name of the processing method is indicated in the right side of the status bar.
Note: The Empower PDA software automatically sets the Threshold Criteria in the processing method to AutoThreshold. For details, see the “Threshold Criteria Considerations for Spectral Contrast (PDA)” topic in the Empower Help.
This procedure assumes that the Automatically Apply Method Set and New Method Set: Create a new method set when starting Review options are enabled in Review. To verify or change these settings, select Options > Method Set Options. If the Automatically Apply Method Set option is not enabled, your chromatogram will not be automatically processed. To process it, click (Apply Method Set) or select Process > Apply Method Set.
Developing a PDA Processing Method 63

3
Figure 3-17 Integrated Chromatogram in Review
When working with a PDA processing method, you must specify an extracted channel(s) and a processing method(s) to use when processing the extracted data. You also have the ability to specify multiple extracted channels and to use different processing methods for each, if desired. When you extract channels as you did in Section 3.2, Deriving Chromatograms, they are automatically added to your method set. No further action is required, however, it is recommended to verify the information in your method set and to rename the derived channel from the generic name that the software assigns to a name that is more meaningful to you.
Name of Method Set and Processing Method
Indicated Here
Integrated Chromatogram
Click the Arrow to Scroll Through
the Tabs
Peak Purity Processing 64

3
3.3.1 Viewing, Modifying and Saving the Method Set1. Click (Method Set) or select Window > Method Set to open the Method Set
Editor window (Figure 3-18).
Figure 3-18 Method Set Editor Window
Notice that the Max Plot and 254 nm (named Wvln Ch1) chromatograms that you extracted earlier are listed in the Channel Name column of the Channel table. The processing method that you just created has also been specified in this table for the 254-nm chromatogram.
2. Right-click the Wvln Ch1 derived channel in the tree pane on the left side of the Method Set Editor window. Select Rename from the shortcut menu. Wvln Ch1 is selected (Figure 3-19). Enter a new name for this derived channel, for example, 254nm.
Method Set
Developing a PDA Processing Method 65

3
Figure 3-19 Method Set Tree Pane
3. Click the first row in the Channel table to select the Max Plot chromatogram (Figure 3-18). Press Delete on your keyboard to remove this row from the table.
4. Select File > Save As > Method Set to open the Save current Method Set dialog box (Figure 3-20).
Figure 3-20 Save Current Method Set Dialog Box
5. In the Name field, type a name, for example, Purity, then click Save. The name of the method set appears in the title bar of the Method Set Editor window and should look as in Figure 3-21.
Peak Purity Processing 66

3
Figure 3-21 Method Set Editor Window after Modifying and Saving
3.3.2 Viewing the Peak Purity Calculation1. Click (Review Main Window) or select Window > Main Window to return to
the Review Main window.
2. Click (Apply Method Set) or select Process > Apply Method Set to extract and process the channel specified in the method set you created (Figure 3-22).
Method Set Name Appears in
Title Bar
Developing a PDA Processing Method 67

3
Figure 3-22 Purity Angle and Purity Threshold Values in the Peaks Table
3. Select the scroll arrows where indicated at the bottom left of the window to make the Peaks tab visible (Figure 3-22). To view the numeric results of the peak purity calculation, click the Peaks tab at the bottom of the Review Main window.
4. Using the mouse, move the Chromatogram plot up or down by dragging the split bar to size the Chromatogram plot and the Peaks table. The Peaks table displays the Purity Angle and Purity Threshold values (Figure 3-22). If the Purity Angle and Purity Threshold values are not visible, scroll within the Peaks table to reveal them.
5. If the Purity Angle is less than the Purity Threshold, the peak is spectrally homogeneous. Scroll down in the table to view the values for every integrated peak. Note that Peaks 1 and 2 are not spectrally homogeneous; whereas Peak 3 is spectrally homogeneous. For details on interpreting peak purity results, see the “Interpreting Peak Purity Results (PDA)” topic in the Empower Help.
Peaks Table
Scroll to the Right to Reveal Additional Purity Angle and Purity Threshold
Values
Peaks Tab
Scroll to View Peaks Tab
Peak Purity Processing 68

3
3.4 Reviewing Peak Purity Results
Once you have calculated peak purity, you can view the results in different ways. For example, you can examine the apex spectrum and the maximum impurity spectrum in Spectrum Index (see Section 3.4.1). Alternatively, you can use the Results window to examine the Purity plot and to view the peak purity results (see Section 3.4.2).
3.4.1 Using Spectrum Index
Spectrum Index allows you to view the apex spectra of the integrated peaks. To view Spectrum Index:
1. In the Review Main window, click the Spectrum Index tab (Figure 3-23). The apex spectrum for each integrated peak appears and additional Spectrum Index tools appear in the toolbar if they were not already present.
Note: If the Spectrum Index tools do not appear, right-click the toolbar and select Spectrum Index or select View > Toolbar > Spectrum Index.
Reviewing Peak Purity Results 69

3
Figure 3-23 Apex Spectrum
2. Click (Maximum Impurity - Pass 1) (Figure 3-23) to display the maximum impurity spectrum in the Spectrum Index plot (Figure 3-24). You are now viewing the apex spectrum overlaid with the spectrum within the integrated peak that differs most from the apex spectrum. This is displayed for every integrated peak. The dotted line in the Chromatogram plot indicates the location within each peak from where these spectra are taken. The lambda max, which is the wavelength of the maximum absorbance, for each spectrum is labeled in the Spectrum Index plot by default.
Spectrum Index Tab
Apex SpectrumMaximum Impurity -
Pass 1 Tool
Spectrum Index Tools
Peak Purity Processing 70

3
Figure 3-24 Apex Spectra Overlaid with Maximum Impurity Spectra
3. In the Chromatogram plot, zoom in on the first peak and examine the overlaid spectra and note the slight differences between the spectra (Figure 3-25). Recall that this peak is not spectrally pure.
X-Axis Is Wavelength
Spectrum Index Plot(y-axis is absorbance)
Reviewing Peak Purity Results 71

3
Figure 3-25 Maximum Impurity Spectrum with Peak 1 Spectra Zoomed
4. Scroll to the right and examine the spectra from the second peak and note the significant differences between the spectra (Figure 3-26). Recall that this peak is not spectrally pure.
Scroll to the Right to Examine Subsequent Peaks
Peak Purity Processing 72

3
Figure 3-26 Maximum Impurity Spectrum with Peak 2 Spectra Zoomed
5. Scroll to the right and examine the spectra from the third peak (Figure 3-27). The spectra overlay well.
The first and second peaks do not appear spectrally homogeneous and require further investigation. The third peak appears spectrally homogeneous. This validates the purity results discussed in step 5 of “Viewing the Peak Purity Calculation”.
Reviewing Peak Purity Results 73

3
Figure 3-27 Maximum Impurity Spectrum with Peak 3 Spectra Zoomed
Results Tool
Peak Purity Processing 74

3
3.4.2 Using the Results Window
To view the Purity plot in the Results window:
1. Click (Results) or select Window > Results Window (Figure 3-27) to open the Results window (Figure 3-28). If necessary, maximize the Results window or size the different panes by dragging the split bars.
Figure 3-28 Results Window
2. Click the Purity tab in the top pane and the Purity Plot tab in the bottom pane of the Results window. The Purity plot (Figure 3-29) displays the currently active (selected) chromatographic peak and plots the Purity Angle and the Purity Threshold values across the entire peak. Note that the left y-axis is in absorbance units and the right y-axis is in Spectral Contrast degrees. The Purity tab displays the purity information for each peak in a numerical format. Select each peak using the Peak list (Figure 3-29).
Purity Plot Tab
Purity Tab
Reviewing Peak Purity Results 75

3
Figure 3-29 Purity Plot
For a spectrally homogeneous peak, the Purity Angle always remains below the Threshold Angle. For the peak at 1.389 minutes, the Purity Angle is above the Threshold Angle in the early region of the peak, which indicates that the peak is not spectrally homogeneous in this region.
The Purity Plot plots the Spectral Contrast Angle between the peak apex spectrum and all other peak spectra. For details, see the “Spectral Contrast Angle (PDA)” topic in the Empower Help. The Purity Angle increases in the peak tails due to the effects of baseline noise.
Purity Angle
Threshold Angle
TimeAbsorbance
Peak List
Spectral Contrast Degrees
Peak Purity Processing 76

3
3. Select the next peak in the Peak list (Figure 3-29) to display the Purity plot for the next peak at 2.165 minutes. The Purity Angle is above the Threshold Angle in the early region of the peak, which indicates that the peak is not spectrally homogeneous in this region.
4. Select the next peak in the Peak list (Figure 3-29) to display the Purity plot for the next peak at 3.931 minutes. The Purity Angle is below the Threshold Angle throughout the entire peak, which indicates that the peak is spectrally homogeneous.
5. Right-click the Purity plot, then select Properties to open the Plot Properties dialog box (Figure 3-30).
Figure 3-30 Plot Properties Dialog Box
6. In the Purity tab, select the Annotate Peak Apex/Max. Impurity check box, then click OK. The point of maximum impurity appears in the Purity plot and is marked with an “M” (Figure 3-31). The peak apex is marked with a vertical line drawn from the apex of the peak perpendicular to the baseline.
Reviewing Peak Purity Results 77

3
Figure 3-31 Purity Plot with Maximum Impurity Indicator
7. Save the result so you can print it in a report. To save the results, select File > Save > Result. If Save > Result is not available, select Save > Processing Method first.
8. Exit Review by clicking (Close) or selecting File > Exit.
Peak ApexPoint of Maximum Impurity
Peak Purity Processing 78

3
Next Steps
Now that you have developed a processing method to assess peak purity, you have the following options:
• Modify the existing processing method to include library matching, as described in Chapter 4, Library Matching.
• Modify the processing method for multicomponent peak purity. For details, see the “Multicomponent Peak Purity Testing (PDA)” topic in the Empower Help.
• Print your results, as described in Chapter 5, Printing Reports.
Reviewing Peak Purity Results 79

4
Chapter 4Library Matching
This chapter provides step-by-step tutorials describing the procedures for creating a library and matching unknown or acquired spectra to spectra in a library.
4.1 Tutorial Overview
This tutorial familiarizes you with Empower software tools and procedures used to create a library and to match spectra to a library. Library matching allows you to identify peaks by comparing spectra from unknown peaks to spectra from known peaks. These tutorials show you how to:
• Create a library from existing standards.
• Match unknown spectra to spectra in a library.
• Review library matching results.
Section 4.1.1, Steps in Creating a Library, lists the steps used to create a library. Section 4.1.2, Steps in Library Matching, shows the steps used for library matching. If you followed the tutorial in Chapter 3, Peak Purity Processing, you can use the processing method that you developed and modify it to include library matching.
4.1.1 Steps in Creating a Library
The following steps in creating a library are outlined in Section 4.2:
1. Select PDA 3D Channels of data.
2. Bring data into Review.
3. Open an existing method set.
4. Create a new library.
5. Add spectra to the library.
Tutorial Overview 80

4
4.1.2 Steps in Library Matching
Figure 4-1 Steps in Library Matching
Set Noise Interval(Section 4.3.2)
Derive a Chromatogram(Section 4.3.2)
Set Integration Parameters(Section 4.3.2)
Do You Want toDo Library Matching and
Peak Purity?
Open an Existing Method Set (Section 4.3.1)
Enable Library Matching(Section 4.3.2)
Integrate Chromatogram and Calculate Results
(Section 4.3.3)
View Results(Section 4.4)
End
Bring PDA data into Review(Section 4.3.1)
Bring PDA data into Review(Section 4.3.1)
Yes: With Peak Purity
No: Library Match Only
Enable Library Matching(Section 4.3.1)
Start
Library Matching 81

4
4.2 Creating a New Library
You must create a library of known spectra before you can match unknown spectra to them. The first step in creating a library is to choose the spectra to add to the library. In this procedure, you add the spectra for Paraben Stds, Phenone Stds, and Benzoate Stds to the library.
To create a library:
1. In the Project window Channels view, which you opened in Chapter 2, Viewing PDA Data, select Paraben Stds, Phenone Stds, and Benzoate Stds, then click (Review) or select Window > Review (Figure 4-2) to open the Review Main window (Figure 4-3).
Note: In Empower software, multiple items can be selected simultaneously by selecting them in the table with a Ctrl-click (multiple noncontiguous rows) or a Shift-click (multiple contiguous rows).
If the Review Main window is not displayed, click (Review Main Window) or select Window > Main Window (Figure 4-3).
Figure 4-2 Selecting Data for a Library
Review Tool
Creating a New Library 82

4
Figure 4-3 Review Main Window2. At the bottom of the Review Main window, click the 3D Channels tab (Figure 4-3). Make sure Paraben Stds is selected.
3. To enlarge the 3D Channels table if necessary, use the mouse to drag the split bar above the 3D Channels table higher on the screen, as shown in Figure 4-3.
4. Select File > Open > Method Set to open the Open an existing Method Set dialog box (Figure 4-4).
3D Channels Tab
Move the Split Bar Higher to View More Rows in the 3D
Channels Table
Review Main Window Tool
Library Matching 83
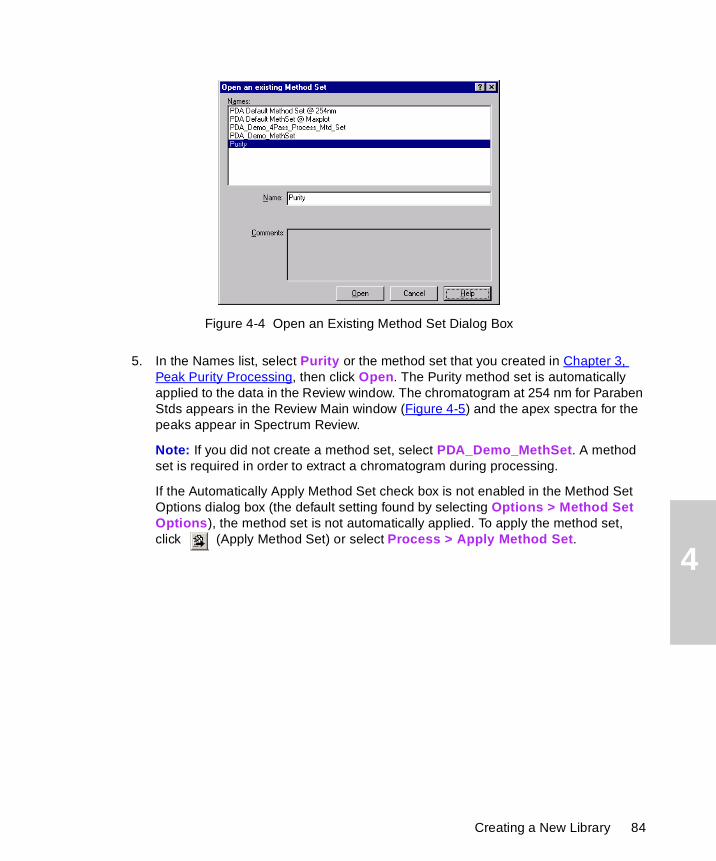
4
Figure 4-4 Open an Existing Method Set Dialog Box
5. In the Names list, select Purity or the method set that you created in Chapter 3, Peak Purity Processing, then click Open. The Purity method set is automatically applied to the data in the Review window. The chromatogram at 254 nm for Paraben Stds appears in the Review Main window (Figure 4-5) and the apex spectra for the peaks appear in Spectrum Review.
Note: If you did not create a method set, select PDA_Demo_MethSet. A method set is required in order to extract a chromatogram during processing.
If the Automatically Apply Method Set check box is not enabled in the Method Set Options dialog box (the default setting found by selecting Options > Method Set Options), the method set is not automatically applied. To apply the method set, click (Apply Method Set) or select Process > Apply Method Set.
Creating a New Library 84

4
Figure 4-5 Paraben Stds Chromatogram
6. Select Library > New Library to open the Create a new Library dialog box (Figure 4-6).
Note: The retention times of the peaks do not match the retention times displayed in the Spectra tab. The apex spectrum is extracted using a method that differs slightly from that used to determine retention time.
Apply Method Set Tool
Library Matching 85

4
Figure 4-6 Create a New Library Dialog Box
7. In the Name field, type a name for the new library, for example, My Library, then click Create to create the new library.
Adding Spectra to the Library
1. In the Spectra table, make sure that the check box in the Select column is only selected for the two main peaks as shown in Figure 4-7. The two spectra appear in Spectrum Review.
Note: When addding spectra to a library, choose your spectra by using the Select column in the Spectra table. Spectra that do not have the Select field selected are not added to the library.
Creating a New Library 86
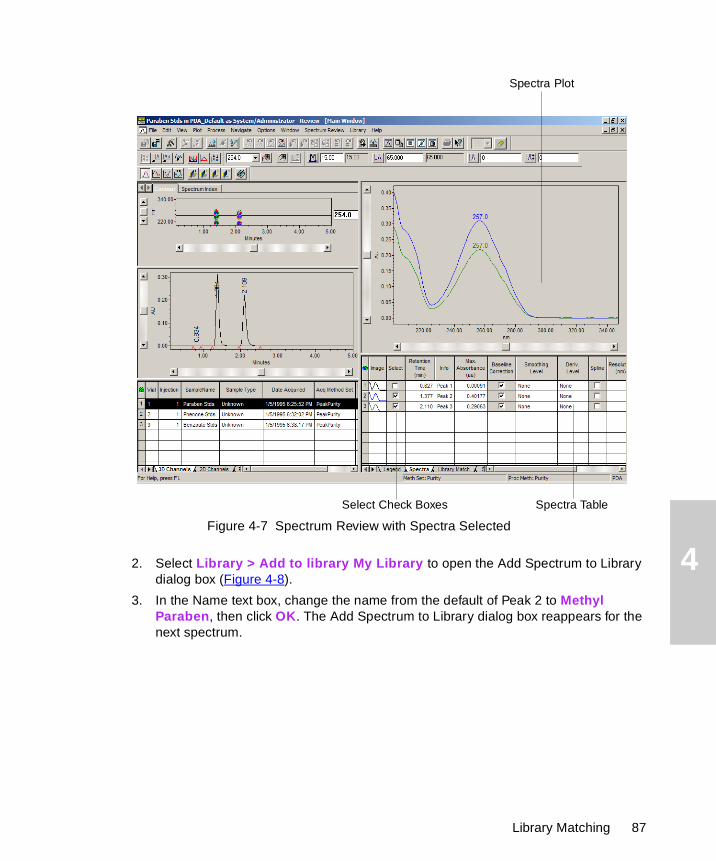
4
Figure 4-7 Spectrum Review with Spectra Selected2. Select Library > Add to library My Library to open the Add Spectrum to Library dialog box (Figure 4-8).
3. In the Name text box, change the name from the default of Peak 2 to Methyl Paraben, then click OK. The Add Spectrum to Library dialog box reappears for the next spectrum.
Select Check Boxes Spectra Table
Spectra Plot
Library Matching 87

4
Figure 4-8 Add Spectrum to Library Dialog Box
4. Change the name from the default of Peak 3 to Ethyl Paraben in the Name text box, then click OK. The spectra are added to the library and appear (unselected) in the Spectra table.
5. In the 3D Channels table, select Phenone Stds. The processed chromatogram for Phenone Stds appears. Repeat steps 1 and 2 for Peaks 2 and 3 in this sample.
6. In the Name text box, change the name from the default of Peak 2 to Acetophenone, then click OK. The Add Spectrum to Library dialog box reappears for the next spectrum.
7. Change the name from the default of Peak 3 to Propriophenone in the Name text box, then click OK. The spectra are added to the library and appear (unselected) in the Spectra table.
8. In the 3D Channels table, select Benzoate Stds. The processed chromatogram for Benzoate Stds appears. Repeat steps 1 and 2 for Peaks 1 and 2 in this sample.
9. In the Name text box, change the name from the default of Peak 1 to Ethyl Paba, then click OK. The Add Spectrum to Library dialog box reappears for the next spectrum.
10. Change the name from the default of Peak 2 to Benzoic Acid in the Name text box, then click OK. The spectra are added to the library and appear (unselected) in the Spectra table.
11. Select File > Exit.
Creating a New Library 88

4
4.3 Matching Spectra to a Library
Now that you have created a spectral library, you can compare unknown spectra to spectra in the library. As Figure 4-1 shows, you can create a processing method in one of the following ways:
• If you plan to use peak purity and library matching, you can modify the existing processing method that you created in Chapter 3, Peak Purity Processing, to include library matching. See Section 4.3.3, Modifying an Existing Processing Method for Library Matching.
• If you plan to do library matching only, you can create a new processing method for library matching alone. SeeSection 4.3.2 Creating a New Processing Method for Library Matching.
When you have finished creating a processing method, proceed to Section 4.3.3, Performing Library Matching.
4.3.1 Modifying an Existing Processing Method for Library Matching
To modify the existing processing method:
1. In the Project window (Figure 4-9), which you opened in Chapter 2, Viewing PDA Data, select Mixture from the Channels view, then click (Review) or select Tools > Review to open the Review Main window.
Figure 4-9 Project Window of the PDA_Default Project
Library Matching 89

4
The Review window appears with the unprocessed data (Figure 4-10).
Figure 4-10 Review Main Window
2. Select File > Open > Method Set to open the Open an existing Method Set dialog box.
3. In the Names list, select Purity or the method set that you created in Chapter 3, Peak Purity Processing, then click Open. The Purity method set is automatically applied to the data in the Review window. The chromatogram at 254 nm for Mixture appears in the Review Main window (Figure 4-11) and the apex spectra for the peaks appear in Spectrum Review.
Note: If you did not create a method set, select PDA_Demo_MethSet. A method set is required in order to extract a chromatogram during processing.
If the Automatically Apply Method Set check box is not enabled in the Method Set Options dialog box (the default setting found by selecting Options > Method Set Options), the method set is not automatically applied. To apply the method set, click (Apply Method Set) or select Process > Apply Method Set.
Matching Spectra to a Library 90

4
Figure 4-11 Integrated 254 nm Chromatogram of Mixture
4. Click (Processing Method) or select Window > Processing Method to open the Processing Method window and modify the existing processing method for library matching (Figure 4-12). If necessary, maximize the window.
Processing Method Tool
Library Matching 91

4
Figure 4-12 Processing Method Window
5. Click the PDA Library Search tab. In the Library list box, select the check box of the library you want to search, for example, My Library (Figure 4-13).
Note: For information on setting a solvent angle, see the “Guidelines for Estimating the Solvent Angle (PDA)” topic in the Empower Help. For this demonstration, we will leave the solvent angle set to 1.0. In general, this value needs to be determined empirically and set accordingly.
PDA Library Search Tab
Matching Spectra to a Library 92

4
Figure 4-13 PDA Library Search Tab
6. Click (Review Main Window) or select Window > Main Window to return to the Review Main window.
7. To save the changes to the existing processing method, select File > Save > Processing Method.
To save the modified method under a different name, select File > Save As > Processing Method. Type a name in the Name field, for example, Purity and Library Match, then click Save.
8. To save the modified method set under a different name, select File > Save As > Method Set. Type a name in the text box, for example, Purity and Library Match, then click Save.
Note: After modifying a processing method or method set, you should click (Method Set) or select Window > Method Set and verify that the desired processing method(s) are specified in the Channel table for the appropriate channel(s). Save the method set if you make any modifications.
9. Proceed to Chapter 4.3.3, Performing Library Matching, to complete the steps for library matching.
Library List Box
Library Matching 93

4
4.3.2 Creating a New Processing Method for Library Matching
If you plan to do library matching without peak purity, you can build a processing method for library matching alone. The simplest way to build a PDA processing method is by using the Processing Method Wizard.
Note: This procedure assumes that the Use V3.0X Style Peak Width and Threshold Determination system policy is enabled (the default setting). If this system policy is not enabled on your system, the Processing Method Wizard will look slightly different.
To build a PDA processing method for library matching:
1. Before you start, you must derive a chromatogram as described in Section 2.5, Extracting a Chromatogram.
2. Click (Processing Method Wizard) or select File > New > Processing Method to start the wizard and open the Processing Method Wizard dialog box (Figure 4-14).
Figure 4-14 Processing Method Wizard Dialog Box
Matching Spectra to a Library 94

4
3. Click Create a New Processing Method and click OK to open the New Processing Method dialog box (Figure 4-15).
Figure 4-15 New Processing Method Dialog Box
4. From the Processing Type list, select PDA. If the Integration Algorithm list is present, select Traditional. Make sure the Use Processing Method Wizard check box is selected, then click OK to go to the Integration - Peak Detection 1 page (Figure 4-16).
Note: The Integration Algorithm list appears only if ApexTrack integration is enabled in your system policies and ApexTrack is enabled in your PDA_Default project.
Library Matching 95

4
Figure 4-16 Integration - Peak Detection 1 Page, Full View
This page allows you to set the peak width parameter in your processing method. Peak width determines the number of points bunched together to act as a filter and to produce a single point for peak detection (although all data points are used during integration).
5. Follow the wizard instructions and use the mouse to draw a zoom box that encloses the liftoff and touchdown of the narrowest peak of interest (peak 1 at 1.39 minutes). The software displays the zoomed selection and determines the appropriate peak width (Figure 4-17).
Note: Right-click the plot to access the Full View/Unzoom shortcut menu selections. If you are unsure which peak is the narrowest, you can check different peaks by zooming and unzooming repeatedly on each peak. Each time you zoom, the software calculates and displays the appropriate peak width. Zoom properly (and perhaps multiple times) so that the peak start is at the beginning of the displayed x-axis in the plot and the peak end is at the end of the displayed x-axis in the plot.
The peaks in this data have nearly identical widths and all yield a Peak Width setting of 15 seconds when zoomed correctly. It therefore does not matter which peak is chosen, however, some data does contain peaks of varying widths. In this case, the appropriate peak should be used.
Peak WidthZoom Box
Matching Spectra to a Library 96

4
Figure 4-17 Setting the Peak Width Parameter
6. Click Next to go to the Integration - Peak Detection 2 page (Figure 4-18).
Figure 4-18 Integration - Peak Detection 2 Page
Library Matching 97

4
This page allows you to set the threshold parameter in your processing method based on a selected area of baseline. Threshold is a slope setting that defines the peak liftoff and touchdown points by determining whether the slope across three data points exceeds the determined slope threshold. It is used to reject baseline noise.
7. Follow the wizard instructions and use the mouse to draw a zoom box that encloses the area of the baseline that contains the greatest amount of noise and no peaks of interest (approximately 0.2 to 1.2 minutes). The software displays the zoomed selection and determines the appropriate threshold value (Figure 4-19).
Note: In general, you might need to zoom the baseline several times to ensure that the selected area is free of peaks of interest.
Figure 4-19 Setting the Threshold Parameter
8. Click Next to go to the Integration - Integration Region page (Figure 4-20)
Matching Spectra to a Library 98

4
Figure 4-20 Integration - Integration Region Page
This page allows you to refine your integration by using an Inhibit Integration event to specify a time region where no integration occurs.
9. If you want to inhibit integration, follow the wizard instructions and use the mouse to draw a zoom box that encloses the area where you want integration to occur. Integration is inhibited in the area outside of the zoom box. The software displays the zoomed selection. Click Next to go to the Integration - Peak Rejection page (Figure 4-21).
This step is not necessary with this particular data. If you do not want to inhibit integration, do nothing in this dialog box and click Next.
Library Matching 99

4
Figure 4-21 Integration - Peak Rejection Page
Use this page to reject small peaks that are not of interest. This step is not necessary with this particular data as there is no unwanted baseline noise that is integrated. Click Next to go to the Calibration - General page.
Note: To use this setting, select the smallest peak of interest to highlight it in red. Select the Mimimum Area or Minimum Height check box to set the minimum area or height to 95% of the selected peak.
When it is necessary to use the Minimum Area or Minimum Height parameter, you typically use one or the other, but not both. For more information see the “Minimum Area” and “Minimum Height“ topics in the Empower Help.
10. Accept the default settings and click Next. A message indicates that channels require channel names in order to perform cross-channel internal standard processing. Click No in this dialog box. The Names and Retention Times page appears (Figure 4-22).
Matching Spectra to a Library 100

4
Figure 4-22 Names and Retention Times Page
11. Click 1 to the left of the Name column in the first row. Press Shift and click 3 to the left of the Name column in the third row. All rows are highlighted. Press Delete on your keyboard to remove all entries from this table. Click Next on this page and successive pages until the PDA Purity/Matching page appears (Figure 4-23).
Note: Entering component names and amounts is necessary only when you intend to process standards, generate calibration curves, and quantitate unknowns. Since this guide focuses on generating purity and library match data, this information is unnecessary. For information about calibration and quantitation, see the Empower Software Getting Started Guide or the Empower Help.
Library Matching 101

4
Figure 4-23 PDA Purity/Matching Page
12. For the question “Do you wish to perform peak purity testing on all peaks?”, click No. For the question “Do you wish to match spectra against PDA library spectra?”, click Yes. Click Next to go to the PDA Spectral Contrast page (Figure 4-24).
Matching Spectra to a Library 102

4
Figure 4-24 PDA Spectral Contrast Page
Use this page to set the noise interval by selecting a segment of the baseline that is free of peaks. You must select a segment of the baseline that is at least one-half minute in length.
Note: The MaxPlot check box is selected by default and allows you to display the Max Plot chromatogram in the PDA Spectral Contrast page regardless of the type of chromatogram that was extracted before starting the Processing Method Wizard. It is recommended to use the Max Plot chromatogram when setting the noise interval to ensure that this parameter is set to a region of the baseline where no compound-related spectral absorbance occurs.
When the MaxPlot check box is selected, the software displays the Max Plot chromatogram for the entire wavelength range in which the data was acquired. If you need to view the Max Plot chromatogram without using the entire acquired wavelength range, you must create a Max Plot chromatogram with the appropriate Start and End Wavelength by creating a derived channel in your method set and then applying the method set before starting the Processing Method Wizard. The Start and End Wavelength Limits are set in the Purity tab of the processing method. (These settings are not available when using the Processing Method Wizard. You must view the processing method by clicking (Processing Method) or by selecting Window > Processing Method.)
It is often desirable to define the wavelength start range above 190 nm to eliminate the effect of mobile phase absorption.
Library Matching 103

4
13. Select the segment of the baseline from approximately 3.00 to 3.50 minutes (Figure 4-25).
You can select the baseline area by using the mouse to zoom in on the desired area, or you can specify the baseline area by typing the start and end time of the desired area in the Noise Interval Start Time and Noise Interval End Time text boxes, respectively.
When zooming, you can right-click and select Fullview or Unzoom to move between zoom levels. Do this to view multiple sections of baseline before deciding on the correct region for the noise interval.
For details about selecting the noise interval, see the “Determining the Noise Interval” topic in the Empower Help.
By default, the Empower PDA software sets the Threshold Criteria to Noise plus Solvent with the Solvent Angle set to one degree. For details, see the “Threshold Criteria Considerations for Spectral Contrast (PDA)” topic in the Empower Help.
Figure 4-25 Setting the Noise Interval
14. Click Next to go to the PDA Match Library page (Figure 4-26).
Matching Spectra to a Library 104

4
Figure 4-26 PDA Match Library Page
15. Select the check box for the library(s) you want to match against, for example, My Library, then click Next to go to the Processing Method Name page (Figure 4-27).
Library Matching 105

4
Figure 4-27 Processing Method Name Page
16. In the Method Name field, enter a processing method name, for example, Library Matching Only, then click Finish. The processing method is saved and the Review Main window appears with the Max Plot chromatogram processed. The name of the processing method appears in the right side of the status bar.
When working with a PDA processing method, you must save both the processing method and method set. You can then apply the saved method set to subsequent data to determine library matching.
Saving the Method Set
1. Select File > Save As > Method Set to open the Save current Method Set dialog box.
2. In the Name field, type a name, for example, Library Matching Only, then click Save. The processing method is saved and the Review Main window appears with the chromatogram processed (Figure 4-28). The name of the processing method is indicated in the right side of the status bar.
Note: This procedure assumes that the Automatically Apply Method Set and New Method Set: Create a new method set when starting Review options are enabled in Review. To verify or change these settings, select Options > Method Set Options. If the Automatically Apply Method Set option is not enabled, your chromatogram will not be automatically processed. To process it, click (Apply Method Set) or select Process > Apply Method Set.
Matching Spectra to a Library 106

4
Figure 4-28 Processed Chromatogram with Library Match Results4.3.3 Performing Library Matching
Now that you have created or modified a processing method, you can perform library matching. Apply an appropriate method set to compute the library Match Angle and Threshold Angle for each peak.
1. If the Review Main window is not displayed, click (Review Main Window) or select Window > Main Window (Figure 4-29).
2. Click (Apply Method Set) or select Process > Apply Method Set.
Name of Method Set and Processing Method
Indicated Here
Library Matching 107

4
Figure 4-29 Integrated Chromatogram with Library Match Results3. Use the arrows at the bottom of the Peaks table to scroll until the Peaks tab appears (Figure 4-29). Click the Peaks tab. The Peaks table displays the results of library matching.
4. Scroll to the right of the Peaks table (Figure 4-29) to view the portion of the table that lists the match results, if necessary.
A Match Angle less than a Match Threshold indicates a good match. A Match Angle greater than the Match Threshold indicates a poor match. Match 1 is the closest (best) match to a library spectrum; Match 2 is the next closest; Match 3 is the third closest. For details, see the “Interpreting PDA Library Matching Results” topic in the Empower Help.
Integrate Tool
Scroll Here Until the Peaks Tab
Appears
Review Main Window Tool
Apply Method Set Tool
Scroll to the Right to View Library Match Results
Matching Spectra to a Library 108

4
4.4 Reviewing Library Matching Results
Once you have determined library matching, you can view the results in different ways. For example, you can examine the apex spectra and the Triple plot by using the Spectrum Index and the Results window, respectively.
To view the library matching results:
1. Click the Spectrum Index tab to view Spectrum Index in the Review Main window (Figure 4-30).
Figure 4-30 Spectrum Index with Library Matching
2. Click (Library Match) to overlay the library match spectrum with the peak spectrum in the Spectrum Index plot (Figure 4-31).
SpectrumIndex Tab
Library Match Tool
Library Matching 109

4
Figure 4-31 Overlaid Library Match SpectraBy default, the black spectra are the library spectra and the blue spectra are the peak apex spectra. If these types of spectra overlay well, this is a qualitative indication of a good match.
Note: The colors displayed in your software can differ from those described here.
3. For another view of the library match results, click (Results) or select Window > Results to open the Results window, which contains the Library Match table and Match Plot (Figure 4-32). If necessary, maximize the Results window or size the different panes by dragging the split bars.
4. In the Results window, click the Match Plot tab (Figure 4-32). The Library Match plot displays the peak spectrum overlaid with any possible matches to the library spectra. The name of the library spectra is displayed in the upper-right side of the plot. When you select a specific peak from the Peaks tab in the top pane of this
Overlaid Spectra
Overlaid Spectra are Indicated by Retention Time and are Color Coded
Results Tool
Reviewing Library Matching Results 110

4
window, the Match plot displays the corresponding match data for the selected peak. Up to three matches can be displayed for each apex spectrum.
Figure 4-32 Results Window Displaying Library Match Plot
5. Click the Library Match tab in the upper table (Figure 4-33). The Library Match tab displays the match information for each peak in a numerical format. Select each peak using the Peak drop-down list. Up to three matches can be displayed for each apex spectrum.
Match Plot Tab
Library Match Tab
Names of Library Spectra
Library Matching 111

4
Figure 4-33 Library Match Plot and Library Match TabNote: You can normalize the spectra to visually check the match. Right-click in the Library Match plot, then select Properties to open the Plot Properties dialog box. Click the Scaling tab, then select Normalize Y, and click OK.
6. In the lower pane, click the Triple Plot tab (Figure 4-34). The Triple plot shows the peak spectrum, the library spectrum, and the difference spectrum, which shows the difference between the peak spectrum and the library spectrum. Again, you can navigate between peaks using the Peak drop-down list in the Library Match tab or by selecting the appropriate row in the Peaks tab.
Triple Plot Tab Library Match Plot
Library Match Table
Reviewing Library Matching Results 112

4
Figure 4-34 Triple Plot: Library Match
7. Save the result so you can print it in a report. To save the result, select File > Save > Result. If Save > Result is not available, select Save > Processing Method first.
8. Exit Review by clicking (Close) or selecting File > Exit.
Next Step
You can now proceed to Chapter 5, Printing Reports, to print your results.
Close Button
PeakSpectrum
LibrarySpectrum
DifferenceBetween
Peak and LibrarySpectrum
Library Matching 113

5
Chapter 5Printing Reports
When you want to print a report with PDA data (using Empower software), you can:
• Preview the report before printing it.
• Print in the background.
5.1 Previewing a Report
To preview a report before printing it:
1. Go to the Project window (Figure 5-1), which you opened in Chapter 2, Viewing PDA Data. If the Project window is minimized in the Windows taskbar, maximize it.
Figure 5-1 Project Window
2. Click the Results tab (Figure 5-1) to view the Results view in the Project window.
Results TabPreview Tool
Previewing a Report 114

5
3. Select the data you want to print, then click (Preview) or select Tools > Preview/Publisher to open the Open Report Method dialog box (Figure 5-2).
Figure 5-2 Open Report Method Dialog Box
4. Click the Use the following Report Method option button, then select PDA Default from the list, and click OK to view a preview of the report (Figure 5-3).
Printing Reports 115

5
Figure 5-3 Preview of an Example Report
5. From Preview, you have the following options:
• You can add annotations. For more information on using the Annotation tools, see Section 2.7, Annotating Chromatograms and Spectra. When annotations are added in Preview, they appear on the report when the report is saved and subsequently printed. However, annotations do not become part of the report method and are not saved with the method.
Note: To modify a method so that all reports that use that method contain the annotations, use the drawing objects in the report group tree of Report Publisher. For more information on these tools, see the Empower Help.
• If the report looks the way you want it, click (Print) (Figure 5-3). The Print dialog box appears. Make sure that the correct settings are selected, then click OK. A report similar to the one in Figure 5-6 prints.
Print ToolAnnotation Tools Drop-Down List
Annotation Erase Tool
Previewing a Report 116

5
• If you want to change the way your report looks, you can modify it by using Report Publisher. For details, see the “Report Publisher” topic in the Empower Help.
• To exit without printing, click (Close), or select File > Exit.
5.2 Background Printing
To print in the background:
1. Go to the Project window (Figure 5-4), which you opened in Chapter 2, Viewing PDA Data. If the Project window is minimized in the Windows taskbar, maximize it.
Figure 5-4 Project Window
2. Click the Results tab. The Results view appears in the Project window.
3. Select the data you want to print, then click (Print) in the Project window (Figure 5-4). The Background Processing and Reporting dialog box appears (Figure 5-5).
Results TabPrint Tool
Printing Reports 117

5
Figure 5-5 Background Processing and Reporting Dialog Box
4. In the Reporting section, make sure that Print and Use specified report method are selected.
5. From the drop-down list next to the Use specified report method option button, select PDA Default, then click OK. A report similar to the one in Figure 5-6 prints.
Background Printing 118

5
Figure 5-6 Sample Report
PDA Default
Project Name: PDA_DefaultReported by User: System
Page: 1 of 1Report Method: PDA Default Printed 10:41:14 PM 4/24/2002
S A M P L E I N F O R M A T I O N
Acquired By: DEMO Sample Name: Mixture Date Acquired: 1/5/1995 6:44:28 PM Sample Type: Unknown
Acq. Method Set: PeakPurity Vial: 4
Date Processed: 8/20/2001 10:05:42 PM Injection #: 1 Processing Method: PDA_Demo_4Pass_Processing Injection Volume: 5.00 ul
Channel Name: PDA Max Plot 190.0 - 800.0 Run Time: 5.0 Minutes
Proc. Chnl. Descr.: PDA MaxPlot (190.0 nm to 800.0 nm)Sample Set Name:
AU
0.00
0.05
0.10
0.15
0.20
0.25
0.30
0.35
0.40
Minutes
0.50 1.00 1.50 2.00 2.50 3.00 3.50 4.00 4.50 5.00
Cpd 1
- 1
.387
Cpd 2
- 2
.166
Cpd 3
- 3
.931
1
2
3
Name RT AreaPurity (#1)
Angle
Purity (#1)
Threshold
Purity
Flag
Match (#1)
Spect. Name
Match (#1)
Angle
Match (#1)
Threshold
PDA Match
Flag
Cpd 1
Cpd 2
Cpd 3
1.387
2.166
3.931
2319720
1816222
3059836
0.303
1.049
0.066
0.233
0.220
0.230
Yes
Yes
No
Methylparaben
Ethyl paba
Propiophenone
0.316
0.325
0.049
0.206
0.207
0.209
Yes
Yes
No
PDA Result Table
Printing Reports 119

A
Appendix ADefault PDA ReportsThere are nine default reports available in the PDA Default project. These reports are available for your direct use or could be used as a starting point to create a customized report. These reports can be copied from the PDA Default project and pasted into other projects. You can also transfer these reports by dragging them from one project and dropping them into another project.
Examples of the sample reports are provided in this appendix. The following reports are in the PDA Default project:
• 1 Pass Peak Purity Report
• 254 nm Extraction Example Report
• 3D Plot Report
• 4 Pass Peak Purity Report
• LC Default Individual Report
• PDA Default Report
• PDA Purity Lib Match Report
• PDA Purity Plot Report
• PDA Spectrum Index Plot Report
Default PDA Reports 120

A
A.1 1 Pass Peak Purity Report
1Pass Peak Purity
Project Name: PDA_DefaultReported by User: System
Page: 1 of 3Report Method: 1Pass Peak Purity Printed 10:34:38 PM 4/24/2002
S A M P L E I N F O R M A T I O N
Acquired By: DEMO Sample Name: Mixture Date Acquired: 1/5/1995 6:44:28 PM Sample Type: Unknown
Acq. Method Set: PeakPurity Vial: 4
Date Processed: 8/20/2001 10:06:11 PM Injection #: 1 Processing Method: PDA_Demo_Processing Injection Volume: 5.00 ul
Channel Name: Maxplot 200 350nm Run Time: 5.0 Minutes
Proc. Chnl. Descr.: PDA MaxPlot (200.0 nm to 350.0 nm)Sample Set Name:
Purity Plot
Peak: Cpd 1 Retention Time: 1.387
Purity
Auto Threshold
PA: 0.303 TH: 0.233
AU
Degre
es
0.00
0.10
0.20
0.30
0.40
0.00
10.00
20.00
30.00
40.00
50.00
60.00
70.00
80.00
90.00
Minutes
1.30 1.40 1.50 1.60 1.70 1.80 1.90
Cpd 1
- 1
.387
Purity
Auto Threshold
Default PDA Reports 121

A
1Pass Peak PurityProject Name: PDA_DefaultReported by User: System
Page: 2 of 3Report Method: 1Pass Peak Purity Printed 10:34:38 PM 4/24/2002
Purity Plot
Peak: Cpd 2 Retention Time: 2.166
Purity
Auto Threshold
PA: 1.049 TH: 0.220
AU
Degre
es
0.00
0.05
0.10
0.15
0.20
0.25
0.30
0.00
10.00
20.00
30.00
40.00
50.00
60.00
70.00
Minutes
2.00 2.10 2.20 2.30 2.40 2.50 2.60
Cp
d 2
- 2
.16
6
Purity
Auto Threshold
Default PDA Reports 122

A
1Pass Peak PurityProject Name: PDA_DefaultReported by User: System
Page: 3 of 3Report Method: 1Pass Peak Purity Printed 10:34:38 PM 4/24/2002
Purity Plot
Peak: Cpd 3 Retention Time: 3.931
Purity
Auto Threshold
PA: 0.066 TH: 0.230
AU
Degre
es
0.00
0.05
0.10
0.15
0.20
0.25
0.30
0.35
0.00
5.00
10.00
15.00
20.00
25.00
30.00
Minutes
3.70 3.80 3.90 4.00 4.10 4.20 4.30 4.40 4.50
Cpd 3
- 3
.931
Purity
Auto Threshold
1
2
3
Name RTPurity (#1)
Angle
Purity (#1)
Threshold
Cpd 1
Cpd 2
Cpd 3
1.387
2.166
3.931
0.303
1.049
0.066
0.233
0.220
0.230
PDA Result Table
Default PDA Reports 123

A
A.2 254 nm Extraction Example Report
254 nm Extraction Example
Project Name: PDA_DefaultReported by User: System
Page: 1 of 2Report Method: 254 nm Extraction Example Printed 10:35:47 PM 4/24/2002
S A M P L E I N F O R M A T I O N
Acquired By: DEMO Sample Name: Mixture Date Acquired: 1/5/1995 6:44:28 PM Sample Type: Unknown
Acq. Method Set: PeakPurity Vial: 4
Date Processed: 8/20/2001 10:06:11 PM Injection #: 1 Processing Method: PDA_Demo_Processing Injection Volume: 5.00 ul
Channel Name: Maxplot 200_350nm Run Time: 5.0 Minutes
Proc. Chnl. Descr.: PDA MaxPlot (200.0 nm to 350.0 nm)Sample Set Name:
254 nm Chromatogram
996 Extraction at 254 nm
AU
0.00
0.10
0.20
0.30
min
0.50 1.00 1.50 2.00 2.50 3.00 3.50 4.00 4.50 5.00
1
2
3
4
5
6
7
8
9
10
11
12
13
14
Wavelength
(nm)
Absorbance
(au)
220.37
221.55
222.72
223.90
225.08
226.26
227.44
228.62
229.80
230.97
232.15
233.33
234.51
235.69
0.01562
0.01787
0.02056
0.02371
0.02739
0.03135
0.03558
0.04013
0.04506
0.05023
0.05539
0.06044
0.06545
0.07043
15
16
17
18
19
20
21
22
23
24
25
26
27
28
Wavelength
(nm)
Absorbance
(au)
236.87
238.05
239.23
240.41
241.59
242.78
243.96
245.14
246.32
247.50
248.68
249.87
251.05
252.23
0.07518
0.07940
0.08295
0.08582
0.08802
0.08946
0.08996
0.08941
0.08782
0.08525
0.08181
0.07751
0.07242
0.06662
29
30
31
32
33
34
35
36
37
38
39
40
41
42
Wavelength
(nm)
Absorbance
(au)
253.41
254.60
255.78
256.96
258.15
259.33
260.51
261.70
262.88
264.07
265.25
266.44
267.62
268.81
0.06030
0.05359
0.04675
0.04002
0.03372
0.02809
0.02323
0.01919
0.01592
0.01338
0.01147
0.01012
0.00921
0.00863
Example Extraction Table
Time: 4.000 min
Channel: 996
Default PDA Reports 124

A
254 nm Extraction ExampleProject Name: PDA_DefaultReported by User: System
Page: 2 of 2Report Method: 254 nm Extraction Example Printed 10:35:47 PM 4/24/2002
43
44
45
46
47
48
49
50
51
52
53
54
55
56
57
58
59
60
61
62
63
64
65
66
67
68
Wavelength
(nm)
Absorbance
(au)
269.99
271.18
272.36
273.55
274.74
275.92
277.11
278.30
279.48
280.67
281.86
283.05
284.23
285.42
286.61
287.80
288.99
290.17
291.36
292.55
293.74
294.93
296.12
297.31
298.50
299.69
0.00828
0.00810
0.00802
0.00804
0.00809
0.00815
0.00822
0.00827
0.00827
0.00821
0.00808
0.00785
0.00758
0.00730
0.00695
0.00661
0.00622
0.00576
0.00526
0.00471
0.00414
0.00355
0.00302
0.00255
0.00211
0.00180
Example Extraction Table
Time: 4.000 min
Channel: 996
Default PDA Reports 125

A
A.3 3D Plot Report
3D Plot
Project Name: PDA_DefaultReported by User: System
Page: 1 of 1Report Method: 3D Plot Printed 10:36:51 PM 4/24/2002
S A M P L E I N F O R M A T I O N
Acquired By: DEMO Sample Name: Mixture Date Acquired: 1/5/1995 6:44:28 PM Sample Type: Unknown
Acq. Method Set: PeakPurity Vial: 4
Date Processed: 8/20/2001 10:06:11 PM Injection #: 1 Processing Method: PDA_Demo_Processing Injection Volume: 5.00 ul
Channel Name: Maxplot 200_350nm Run Time: 5.0 Minutes
Proc. Chnl. Descr.: PDA MaxPlot (200.0 nm to 350.0 nm)Sample Set Name:
3D Plot
0.00
0.05
0.10
0.15
0.20
0.25
0.30
0.35
0.40
AU
0.50 1.00 1.50 2.00 2.50 3.00 3.50 4.00 4.50 5.00
Minutes
250.00
300.00
Default PDA Reports 126

A
A.4 4 Pass Peak Purity Report
4 Pass Peak Purity
Project Name: PDA_DefaultReported by User: System
Page: 1 of 3Report Method: 4 Pass Peak Purity Printed 10:38:10 PM 4/24/2002
S A M P L E I N F O R M A T I O N
Acquired By: DEMO Sample Name: Mixture Date Acquired: 1/5/1995 6:44:28 PM Sample Type: Unknown
Acq. Method Set: PeakPurity Vial: 4
Date Processed: 8/20/2001 10:05:42 PM Injection #: 1 Processing Method: PDA_Demo_4Pass_Processing Injection Volume: 5.00 ul
Channel Name: PDA Max Plot 190.0 - 800.0 Run Time: 5.0 Minutes
Proc. Chnl. Descr.: PDA MaxPlot (190.0 nm to 800.0 nm)Sample Set Name:
Purity Plot
Peak: Cpd 1 Retention Time 1.387
Purity
Auto Threshold
PA: 0.303 TH: 0.233
AU
Degre
es
0.00
0.20
0.40
0.00
20.00
40.00
60.00
80.00
Minutes
1.40 1.60 1.80
Cp
d 1
- 1
.38
7
Purity
Auto Threshold
PA: 0.062 TH: 0.234
AU
Degre
es
0.00
0.20
0.40
0.00
20.00
40.00
60.00
80.00
Minutes
1.40 1.60 1.80
Cp
d 1
- 1
.38
7
Purity
Auto Threshold
PA: 0.026 TH: 0.235
AU
Degre
es
0.00
0.20
0.40
0.00
20.00
40.00
60.00
80.00
Minutes
1.40 1.60 1.80
Cp
d 1
- 1
.38
7
Purity
Auto Threshold
PA: 0.019 TH: 0.235
AU
Degre
es
0.00
0.20
0.40
0.00
20.00
40.00
60.00
80.00
Minutes
1.40 1.60 1.80
Cp
d 1
- 1
.38
7
Purity
Auto Threshold
Default PDA Reports 127

A
4 Pass Peak PurityProject Name: PDA_DefaultReported by User: System
Page: 2 of 3Report Method: 4 Pass Peak Purity Printed 10:38:10 PM 4/24/2002
Purity Plot
Peak: Cpd 2 Retention Time 2.166
Purity
Auto Threshold
PA: 1.049 TH: 0.220
AU
Degre
es
0.00
0.10
0.20
0.30
0.00
20.00
40.00
60.00
Minutes
2.00 2.20 2.40 2.60
Cpd 2
- 2
.166
Purity
Auto Threshold
PA: 0.119 TH: 0.220
AU
Degre
es
0.00
0.10
0.20
0.30
0.00
10.00
20.00
Minutes
2.00 2.20 2.40 2.60
Cpd 2
- 2
.166
Purity
Auto Threshold
PA: 0.040 TH: 0.221
AU
Degre
es
0.00
0.10
0.20
0.30
0.00
10.00
20.00
Minutes
2.00 2.20 2.40 2.60
Cpd 2
- 2
.166
Purity
Auto Threshold
PA: 0.018 TH: 0.222
AU
Degre
es
0.00
0.10
0.20
0.30
0.00
10.00
20.00
Minutes
2.00 2.20 2.40 2.60
Cpd 2
- 2
.166
Purity
Auto Threshold
Default PDA Reports 128

A
4 Pass Peak PurityProject Name: PDA_DefaultReported by User: System
Page: 3 of 3Report Method: 4 Pass Peak Purity Printed 10:38:10 PM 4/24/2002
Purity Plot
Peak: Cpd 3 Retention Time 3.931
Purity
Auto Threshold
PA: 0.066 TH: 0.230
AU
Degre
es
0.00
0.20
0.00
10.00
20.00
30.00
Minutes
3.80 4.00 4.20 4.40
Cpd 3
- 3
.931
Purity
Auto Threshold
PA: 0.033 TH: 0.231
AU
Degre
es
0.00
0.20
0.00
10.00
20.00
30.00
Minutes
3.80 4.00 4.20 4.40
Cpd 3
- 3
.931
Purity
Auto Threshold
PA: 0.018 TH: 0.232
AU
Degre
es
0.00
0.20
0.00
10.00
20.00
30.00
Minutes
3.80 4.00 4.20 4.40
Cpd 3
- 3
.931
Purity
Auto Threshold
PA: 0.016 TH: 0.232
AU
Degre
es
0.00
0.20
0.00
10.00
20.00
30.00
Minutes
3.80 4.00 4.20 4.40
Cpd 3
- 3
.931
Purity
Auto Threshold
1
2
3
Name RTPurity (#1)
Angle
Purity (#1)
Threshold
Purity (#2)
Angle
Purity (#2)
Threshold
Purity (#3)
Angle
Purity (#3)
Threshold
Cpd 1
Cpd 2
Cpd 3
1.387
2.166
3.931
0.303
1.049
0.066
0.233
0.220
0.230
0.062
0.119
0.033
0.234
0.220
0.231
0.026
0.040
0.018
0.235
0.221
0.232
PDA Result Table
1
2
3
Purity (#4)
Threshold
Purity (#4)
Angle
0.235
0.222
0.232
0.019
0.018
0.016
PDA Result Table
Default PDA Reports 129

A
A.5 LC Default Individual Report
LC Default Individual Report
Project Name: PDA_DefaultReported by User: System
Page: 1 of 1Report Method: LC Default Individual Report Printed 10:39:53 PM 4/24/2002
S A M P L E I N F O R M A T I O N
Acquired By: DEMO Sample Name: Mixture Date Acquired: 1/5/1995 6:44:28 PM Sample Type: Unknown
Acq. Method Set: PeakPurity Vial: 4
Date Processed: 8/20/2001 10:05:42 PM Injection #: 1 Processing Method: PDA_Demo_4Pass_Processing Injection Volume: 5.00 ul
Channel Name: PDA Max Plot 190.0 - 800.0 Run Time: 5.0 Minutes
Proc. Chnl. Descr.: PDA MaxPlot (190.0 nm to 800.0 nm)Sample Set Name:
AU
0.00
0.05
0.10
0.15
0.20
0.25
0.30
0.35
0.40
Minutes
0.50 1.00 1.50 2.00 2.50 3.00 3.50 4.00 4.50 5.00
Cp
d 1
- 1
.38
7
Cp
d 2
- 2
.16
6
Cp
d 3
- 3
.93
1
1
2
3
Peak Name RT Area % Area Height
Cpd 1
Cpd 2
Cpd 3
1.387
2.166
3.931
2319720
1816222
3059836
32.24
25.24
42.52
431888
281385
357284
Default PDA Reports 130

A
A.6 PDA Default Report
PDA Default
Project Name: PDA_DefaultReported by User: System
Page: 1 of 1Report Method: PDA Default Printed 10:41:14 PM 4/24/2002
S A M P L E I N F O R M A T I O N
Acquired By: DEMO Sample Name: Mixture Date Acquired: 1/5/1995 6:44:28 PM Sample Type: Unknown
Acq. Method Set: PeakPurity Vial: 4
Date Processed: 8/20/2001 10:05:42 PM Injection #: 1 Processing Method: PDA_Demo_4Pass_Processing Injection Volume: 5.00 ul
Channel Name: PDA Max Plot 190.0 - 800.0 Run Time: 5.0 Minutes
Proc. Chnl. Descr.: PDA MaxPlot (190.0 nm to 800.0 nm)Sample Set Name:
AU
0.00
0.05
0.10
0.15
0.20
0.25
0.30
0.35
0.40
Minutes
0.50 1.00 1.50 2.00 2.50 3.00 3.50 4.00 4.50 5.00
Cpd 1
- 1
.387
Cpd 2
- 2
.166
Cpd 3
- 3
.931
1
2
3
Name RT AreaPurity (#1)
Angle
Purity (#1)
Threshold
Purity
Flag
Match (#1)
Spect. Name
Match (#1)
Angle
Match (#1)
Threshold
PDA Match
Flag
Cpd 1
Cpd 2
Cpd 3
1.387
2.166
3.931
2319720
1816222
3059836
0.303
1.049
0.066
0.233
0.220
0.230
Yes
Yes
No
Methylparaben
Ethyl paba
Propiophenone
0.316
0.325
0.049
0.206
0.207
0.209
Yes
Yes
No
PDA Result Table
Default PDA Reports 131

A
A.7 PDA Purity Lib Match Report
PDA Purity Lib Match Report
Project Name: PDA_DefaultReported by User: System
Page: 1 of 3Report Method: PDA Purity Lib Match Report Printed 10:43:13 PM 4/24/2002
S A M P L E I N F O R M A T I O N
Acquired By: DEMO Sample Name: Mixture Date Acquired: 1/5/1995 6:44:28 PM Sample Type: Unknown
Acq. Method Set: PeakPurity Vial: 4
Date Processed: 8/20/2001 10:05:42 PM Injection #: 1 Processing Method: PDA_Demo_4Pass_Processing Injection Volume: 5.00 ul
Channel Name: PDA Max Plot 190.0 - 800.0 Run Time: 5.0 Minutes
Proc. Chnl. Descr.: PDA MaxPlot (190.0 nm to 800.0 nm)Sample Set Name:
Purity Plot
Peak: Cpd 1
Purity
Auto Threshold
PA: 0.303 TH: 0.233
AU
Degre
es
0.00
0.05
0.10
0.15
0.20
0.25
0.30
0.35
0.40
0.45
0.00
10.00
20.00
30.00
40.00
50.00
60.00
70.00
80.00
90.00
Minutes
1.40 1.60 1.80
Cp
d 1
- 1
.38
7
Purity
Auto Threshold
M
Library Match Plot
nm
220.00 240.00 260.00 280.00 300.00 320.00 340.00
Match #1 Angle 0.316 Methylparaben
Cpd 1
1
Name RT AreaPurity
Angle
Purity
Threshold
Purity
Flag
Match
Spect. Name
Match
Angle
Match
Threshold
Match
Flag
Cpd 1 1.387 2319720 0.303 0.233 Yes Methylparaben 0.316 0.206 Yes
PDA Result Table
Default PDA Reports 132

A
PDA Purity Lib Match ReportProject Name: PDA_DefaultReported by User: System
Page: 2 of 3Report Method: PDA Purity Lib Match Report Printed 10:43:13 PM 4/24/2002
S A M P L E I N F O R M A T I O N
Acquired By: DEMO Sample Name: Mixture Date Acquired: 1/5/1995 6:44:28 PM Sample Type: Unknown
Acq. Method Set: PeakPurity Vial: 4
Date Processed: 8/20/2001 10:05:42 PM Injection #: 1 Processing Method: PDA_Demo_4Pass_Processing Injection Volume: 5.00 ul
Channel Name: PDA Max Plot 190.0 - 800.0 Run Time: 5.0 Minutes
Proc. Chnl. Descr.: PDA MaxPlot (190.0 nm to 800.0 nm)Sample Set Name:
Purity Plot
Peak: Cpd 2
Purity
Auto Threshold
PA: 1.049 TH: 0.220
AU
De
gre
es
0.00
0.05
0.10
0.15
0.20
0.25
0.30
0.00
10.00
20.00
30.00
40.00
50.00
60.00
70.00
Minutes
2.00 2.20 2.40 2.60
Cpd 2
- 2
.166
Purity
Auto Threshold
M
Library Match Plot
nm
220.00 240.00 260.00 280.00 300.00 320.00 340.00
Match #1 Angle 0.325 Ethyl paba
Cpd 2
1
Name RT AreaPurity
Angle
Purity
Threshold
Purity
Flag
Match
Spect. Name
Match
Angle
Match
Threshold
Match
Flag
Cpd 2 2.166 1816222 1.049 0.220 Yes Ethyl paba 0.325 0.207 Yes
PDA Result Table
Default PDA Reports 133

A
PDA Purity Lib Match ReportProject Name: PDA_DefaultReported by User: System
Page: 3 of 3Report Method: PDA Purity Lib Match Report Printed 10:43:13 PM 4/24/2002
S A M P L E I N F O R M A T I O N
Acquired By: DEMO Sample Name: Mixture Date Acquired: 1/5/1995 6:44:28 PM Sample Type: Unknown
Acq. Method Set: PeakPurity Vial: 4
Date Processed: 8/20/2001 10:05:42 PM Injection #: 1 Processing Method: PDA_Demo_4Pass_Processing Injection Volume: 5.00 ul
Channel Name: PDA Max Plot 190.0 - 800.0 Run Time: 5.0 Minutes
Proc. Chnl. Descr.: PDA MaxPlot (190.0 nm to 800.0 nm)Sample Set Name:
Purity Plot
Peak: Cpd 3
Purity
Auto Threshold
PA: 0.066 TH: 0.230
AU
De
gre
es
0.00
0.05
0.10
0.15
0.20
0.25
0.30
0.35
0.00
5.00
10.00
15.00
20.00
25.00
30.00
Minutes
3.80 4.00 4.20 4.40
Cpd 3
- 3
.931
Purity
Auto Threshold
M
Library Match Plot
nm
220.00 240.00 260.00 280.00 300.00 320.00 340.00
Match #1 Angle 0.049 Propiophenone
Cpd 3
1
Name RT AreaPurity
Angle
Purity
Threshold
Purity
Flag
Match
Spect. Name
Match
Angle
Match
Threshold
Match
Flag
Cpd 3 3.931 3059836 0.066 0.230 No Propiophenone 0.049 0.209 No
PDA Result Table
Default PDA Reports 134

A
A.8 PDA Purity Plot Report
PDA Purity Plot
Project Name: PDA_DefaultReported by User: System
Page: 1 of 4Report Method: PDA Purity Plot Printed 10:44:06 PM 4/24/2002
S A M P L E I N F O R M A T I O N
Acquired By: DEMO Sample Name: Mixture Date Acquired: 1/5/1995 6:44:28 PM Sample Type: Unknown
Acq. Method Set: PeakPurity Vial: 4
Date Processed: 8/20/2001 10:05:42 PM Injection #: 1 Processing Method: PDA_Demo_4Pass_Processing Injection Volume: 5.00 ul
Channel Name: PDA Max Plot 190.0 - 800.0 Run Time: 5.0 Minutes
Proc. Chnl. Descr.: PDA MaxPlot (190.0 nm to 800.0 nm)Sample Set Name:
Purity Plot
Peak: Cpd 1 Purity Angle 0.303 Purity Threshold 0.233
Purity
Auto Threshold
PA: 0.303 TH: 0.233
AU
De
gre
es
0.00
0.10
0.20
0.30
0.40
0.00
20.00
40.00
60.00
80.00
Minutes
1.30 1.40 1.50 1.60 1.70 1.80 1.90
Cpd 1
- 1
.387
Purity
Auto Threshold
M
Default PDA Reports 135

A
PDA Purity PlotProject Name: PDA_DefaultReported by User: System
Page: 2 of 4Report Method: PDA Purity Plot Printed 10:44:06 PM 4/24/2002
Purity Plot
Peak: Cpd 2 Purity Angle 1.049 Purity Threshold 0.220
Purity
Auto Threshold
PA: 1.049 TH: 0.220
AU
Degre
es
0.00
0.05
0.10
0.15
0.20
0.25
0.30
0.00
10.00
20.00
30.00
40.00
50.00
60.00
70.00
Minutes
2.00 2.10 2.20 2.30 2.40 2.50 2.60
Cpd 2
- 2
.166
Purity
Auto Threshold
M
Default PDA Reports 136

A
PDA Purity PlotProject Name: PDA_DefaultReported by User: System
Page: 3 of 4Report Method: PDA Purity Plot Printed 10:44:06 PM 4/24/2002
Purity Plot
Peak: Cpd 3 Purity Angle 0.066 Purity Threshold 0.230
Purity
Auto Threshold
PA: 0.066 TH: 0.230
AU
De
gre
es
0.00
0.05
0.10
0.15
0.20
0.25
0.30
0.35
0.00
5.00
10.00
15.00
20.00
25.00
30.00
Minutes
3.70 3.80 3.90 4.00 4.10 4.20 4.30 4.40 4.50
Cpd 3
- 3
.931
Purity
Auto Threshold
M
Default PDA Reports 137

A
PDA Purity PlotProject Name: PDA_DefaultReported by User: System
Page: 4 of 4Report Method: PDA Purity Plot Printed 10:44:06 PM 4/24/2002
1
2
3
Name RTPurity (#1)
Angle
Purity (#1)
Threshold
Match (#1)
Spect. Name
Match (#1)
Angle
Match (#1)
Threshold
Cpd 1
Cpd 2
Cpd 3
1.387
2.166
3.931
0.303
1.049
0.066
0.233
0.220
0.230
Methylparaben
Ethyl paba
Propiophenone
0.316
0.325
0.049
0.206
0.207
0.209
PDA Result Table
Default PDA Reports 138

A
A.9 PDA Spectrum Index Plot Report
PDA Spectrum Index Plot
Project Name: PDA_DefaultReported by User: System
Page: 1 of 1Report Method: PDA Spectrum Index Plot Printed 10:45:14 PM 4/24/2002
S A M P L E I N F O R M A T I O N
Acquired By: DEMO Sample Name: Mixture Date Acquired: 1/5/1995 6:44:28 PM Sample Type: Unknown
Acq. Method Set: PeakPurity Vial: 4
Date Processed: 8/20/2001 10:05:42 PM Injection #: 1 Processing Method: PDA_Demo_4Pass_Processing Injection Volume: 5.00 ul
Channel Name: PDA Max Plot 190.0 - 800.0 Run Time: 5.0 Minutes
Proc. Chnl. Descr.: PDA MaxPlot (190.0 nm to 800.0 nm)Sample Set Name:
Spectrum Index Plo
nm250.00
300.00
257.0
1.38
Cpd 1 - 1.387
nm250.00
300.00
221.5
289.02.16
Cpd 2 - 2.166
nm250.00
300.00
244.0
3.93
Cpd 3 - 3.931
AU
0.00
0.10
0.20
0.30
0.40
Minutes
0.50 1.00 1.50 2.00 2.50 3.00 3.50 4.00 4.50 5.00
Cp
d 1
- 1
.38
7
Cp
d 2
- 2
.16
6
Cp
d 3
- 3
.93
1
AU
0.00
0.10
0.20
0.30
0.40
Minutes
0.50 1.00 1.50 2.00 2.50 3.00 3.50 4.00 4.50 5.00
1
2
3
Name RT AreaPurity (#1)
Angle
Purity (#1)
Threshold
Purity
Flag
Match (#1)
Spect. Name
Match (#1)
Angle
Match (#1)
Threshold
PDA Match
Flag
Cpd 1
Cpd 2
Cpd 3
1.387
2.166
3.931
2319720
1816222
3059836
0.303
1.049
0.066
0.233
0.220
0.230
Yes
Yes
No
Methylparaben
Ethyl paba
Propiophenone
0.316
0.325
0.049
0.206
0.207
0.209
Yes
Yes
No
PDA Result Table
Default PDA Reports 139

I NDEX
Index
Numerics3D Channels table 27
enlarging 833D data 23, 26
3D plot 29viewing 27
3D plot 29colors 29maximizing 30rotating 30tool 28
996/2996 Photodiode Array detector 15Waters 2996 PDA Detector Operator’s
Guide 18Waters 996 PDA Detector Operator’s
Guide 18
AAbsorbance
different wavelengths 40legend 29maximum 48
Acquisition time 27Adding spectra to library 82Annotation Object Properties dialog box 43
text 44Annotation tools 46
arrow 42Annotations
adding to chromatogram and spectra 42Annotation Object Properties dialog box
43description 41erasing 45selecting, resizing, rotating, deleting,
moving 43
text 43tools 46
Apex spectrum 69, 70, 109zoomed 71
Apply Method Set tool 28AutoThreshold parameter 63
BBackground printing 117Baseline noise 31, 76
CCalculating peak purity 47Calibration curves 17Channels table 23Channels View table 25Chromatogram plot 23, 27, 31, 35Chromatograms
at different wavelengths 33deriving 48displaying peaks 75extracting 33full view 32integrated 64marker 34Max Plot 48overlaid 35plot 23, 27, 31, 35zooming 31
Comparing spectra 39Configuration Manager 20Contour plot 23, 27
colors 29zooming 31
Conventions, documentation 13
Index 140

INDEX
Creating a library 82assigning name 85flowchart 80
DData
acquisition 17acquisition time 27displaying 23, 25sample name 27sample PDA 18sample type 27viewing 23zooming 31
Default PDA reports1Pass Peak Purity Report 121254 nm Extraction Example Report 1243D Plot Report 1264 Pass Peak Purity Report 127LC Default Individual Report 130overview 120PDA Default Report 131PDA Purity Lib Match Report 132PDA Purity Plot Report 135PDA Spectrum Index Plot Report 139
Deriving chromatograms 48Displaying
apex spectra 69chromatograms at different wavelengths
34Contour plot 23library versus data file spectra 112peaks 48, 75Purity plot 75three-dimensional data 29
Documentationconventions 13related 10
I
EEmpower 15Empower Configurations
Enterprise 15Personal 15Workgroup 15
Empower Help tool 28Empower PDA software,
prerequisites 17Empower software
base LC software overview 15features 15icons 28PDA software overview 16Restore program 18
Empower System Installation and Configuration Guide 17
Extract a Max/Tic Plot tool 50, 51Extract Chromatogram tool 28, 34Extracting
chromatograms 33spectra 36
FFlowcharts
library creation 80library matching 81
Full View command 32Full View tool 28
HHardware
for Empower system 15Waters 996 or 2996 PDA Detector 18
Index 141

INDEX
IIcons. See Tools for Empower softwareIntegrate tool 28Integrated chromatogram 64Integration 17Interpreting
library matching results 108peak purity results 68
LLamda max 48, 70Legend for absorbances 29Library
adding spectra 82creating 82creating, flowchart 80name 86spectrum 112See also Library matching
Library Match plot,normalized 112
Library Match table 17, 110Library Match tool 28Library matching 80, 108
flowchart 81performing 107processing method for 89, 94results 108, 109selecting 92, 102
Login defaults 18
MMarkers, chromatogram 34Match angle 108Match threshold 108Max Plot chromatogram 48Maximizing
3D Plot window 30Review 26
I
Review Main window 26Maximum absorbance 48Maximum impurity
point of 77spectrum 70
Maximum Impurity Pass 1 tool 28Method Set
opening 83, 90saving 65, 106
Method Set tool 28Modifying
processing method 80, 89, 91reports 117
NNoise interval 61, 103Normalized
Library Match plot 112spectra 39, 112
OOpening
Method Set 83, 90PDA_Default project 24project window 48
Overlay tool 28, 35, 36Overlaying
chromatograms 35spectra 38
PPassword, default 18PDA default reports 120PDA detector 15PDA Review window, accessing 25PDA software 16
prerequisites 17
Index 142

INDEX
PDA_Default project 18, 24loading sample data 18restored 21
Peak purity 47interpreting results 68processing method 52, 94selecting 60viewing results 69
Peaks 108apex 77viewing 48, 75
Peaks table 68, 108Plot Properties dialog box 33Plots
3D 29Chromatogram 23, 27, 35Contour 23, 27, 29full view 32Purity 75Spectra 17, 23, 27, 37, 39, 86Triple 112zooming 31
Prerequisites for Empower PDA software 17Preview tool 115Previewing reports 115Print tool 28Printing 114
background 117Report Preview 115
Processing methodfor library matching 80, 89, 94for peak purity 47, 51modifying 80, 89, 91name 62saving 65, 106tool 28wizard 51, 94
Processing Method Wizard tool 28Project window 23
minimized 48opening 48Review Data selection mode 24with results 114, 117
I
Projectsopening 24, 48PDA_Default 18, 21, 24restoring 18
Purity angle 68, 75, 76Purity plot 75Purity threshold 68, 75
QQuantitation 17
RRelated documentation 10Report Publisher 117Reports
default PDA 120modifying 117preview 116printing 114sample 119
Requirements for Empower PDA software 17Restore
program 18Project wizard 20tool 20
Restoring projects 18Results
library matching 108, 109, 110peak purity 68saving 113tool 28
Results windowlibrary matching 110Project window 114, 117Purity plot 75with maximum impurity 77
Reviewmaximizing 26menus 27summary 16, 23
Index 143

INDEX
tools 27Review Main window 26
maximizing 26parts of 27peak purity results 68tools 28
Rotating 3D plot 30
SSample
name 27reports 118type 27
Savingmethod set 65, 106processing method 65, 106results 113zoom parameters 33
Scaling tab 33Selecting
library matching 92, 102peak purity testing 60
Setting noise interval 61, 103Shortcuts 27, 28Spectra
adding to library 82apex 69, 109comparing 39comparing library versus data file 112extracting 36matching results 110maximum impurity 70normalized 39, 112overlaid 38, 70, 71, 109shape differences 39zooming 31
Spectra plot 17, 23, 27, 37, 86normalized 39zooming 31
Spectra table 17, 27, 38, 40, 86Spectral Contrast angle 76
I
Spectral homogeneity 47, 68Spectrum Index 23, 69, 109Spectrum matching. See Library matchingSpectrum Points table 17, 41, 42Spectrum Review 17, 27
See also Spectral plotSystem
password 18
TTables
3D Channels 27Channels 23Channels View 25Library Match 17, 110Peaks 68, 108Spectra 17, 27, 38, 40, 86Spectrum Points 17, 41, 42
Taskbar 48Three-dimensional data
3D plot 29in Contour plot 26viewing 23, 27
Thresholdcriteria 63, 104interpreting 63, 104
Tools for Empower software 28Triple plot 112
UUnzoom tool 28Unzooming windows 32
VViewing
apex spectra 69chromatograms 34data 23
Index 144

INDEX
library versus data file spectra 112matches to library 110peaks 48, 75projects 24Purity plot 75Report Preview 115Spectrum Index 109three-dimensional data 27zooming and unzooming data 32
Viewsfull plot 32saving parameters 33zoomed 31
WWaters 2996 PDA Detector Operator’s Guide
18Waters 996 PDA Detector Operator’s Guide
18Waters 996/2996 PDA Detector 15Wavelengths, marker for 34Windows
full view 32maximizing 26Project 23, 24, 48, 114rescaling 32Results 75, 110, 114Review Main 27unzooming 32
Windows taskbar 48Wizards
processing method 51, 94restore project 20
XX-axis 26, 75
I
YY-axis 26, 75
ZZoom box 31Zoom parameters 33Zooming
apex spectra 71plots 31
Index 145


![ODOT- PDA intro.ppt [Read-Only] · PDA ConclusionsPDA Conclusions • PDA with CAPWAP evaluates capacity at low cost for driven piles, drilled shafts, & augercast piles • PDA gives](https://img.dokumen.tips/doc/110x75/5e80a08e0838cb51cc1301e3/odot-pda-introppt-read-only-pda-conclusionspda-conclusions-a-pda-with-capwap.jpg)