Employee Engagement Survey Results - TTC · PDF fileLast fall, the TTC conducted a...
31
Staff report for information on Employee Engagement Survey Results 1 Insert TTC logo here STAFF REPORT INFORMATION ONLY Employee Engagement Survey Results Date: February 25 , 2015 To: TTC Board From: Chief Executive Officer Summary Last fall, the TTC conducted a comprehensive employee engagement survey – a commitment it made as part of the Five-Year Corporate Plan under the People objective and something it intends to do every two years. This is the first such survey to be conducted in recent memory at the TTC. The survey ran from Oct. 27 to Dec. 8 and was conducted on the TTC’s behalf by an independent third party, Malatest and Associates Ltd. The survey was conducted by email and paper. As most TTC employees do not have access to work email, the majority of the surveys were sent by mail to employees’ homes. For those with access to email and a computer at work, the survey was conducted online. More than 13,000 surveys were issued to all permanent TTC employees (contractors were excluded). The total response rate was 36%, an excellent response for a first-time survey of this magnitude. A series of questions, divided into eight categories, were asked. The mean score of three key measures that define employee engagement, i.e. overall satisfaction with the TTC as an employer, enjoyment of the work each employee performs, and appreciating the value of the work they do, was 7.8 on a scale of 1-10. Financial Impact The survey cost of $120,000 was fully funded. While the survey results are now available, an action plan has yet to be developed and costed. The financial impact of the action plan (if any) will be presented at a future meeting of the TTC Board.
Employee Engagement Survey Results - TTC · PDF fileLast fall, the TTC conducted a comprehensive employee engagement survey – a commitment it made as part of the Five-Year Corporate
Staff report for information on Employee Engagement Survey Results 1
Insert TTC logo here STAFF REPORT INFORMATION ONLY
Employee Engagement Survey Results
Date: February 25, 2015
To: TTC Board
From: Chief Executive Officer
Summary Last fall, the TTC conducted a comprehensive employee engagement survey – a commitment it made as part of the Five-Year Corporate Plan under the People objective and something it intends to do every two years. This is the first such survey to be conducted in recent memory at the TTC. The survey ran from Oct. 27 to Dec. 8 and was conducted on the TTC’s behalf by an independent third party, Malatest and Associates Ltd. The survey was conducted by email and paper. As most TTC employees do not have access to work email, the majority of the surveys were sent by mail to employees’ homes. For those with access to email and a computer at work, the survey was conducted online. More than 13,000 surveys were issued to all permanent TTC employees (contractors were excluded). The total response rate was 36%, an excellent response for a first-time survey of this magnitude. A series of questions, divided into eight categories, were asked. The mean score of three key measures that define employee engagement, i.e. overall satisfaction with the TTC as an employer, enjoyment of the work each employee performs, and appreciating the value of the work they do, was 7.8 on a scale of 1-10. Financial Impact The survey cost of $120,000 was fully funded. While the survey results are now available, an action plan has yet to be developed and costed. The financial impact of the action plan (if any) will be presented at a future meeting of the TTC Board.
Staff report for information on Employee Engagement Survey Results 2
Issue Background Refer to presentation Accessibility/Equity Matters The survey results and action plan require a review through an equity lens to determine what impact there may be on accessibility and equity matters. The results of this review will be presented at a future meeting of the TTC Board. Contact Arthur Borkwood Head of Customer Development Strategy & Customer Experience Group Toronto Transit Commission Tel: 416 393 6085 [email protected] Attachments Presentation document to follow.
February 25th, 2015 Arthur Borkwood Head of Customer Development
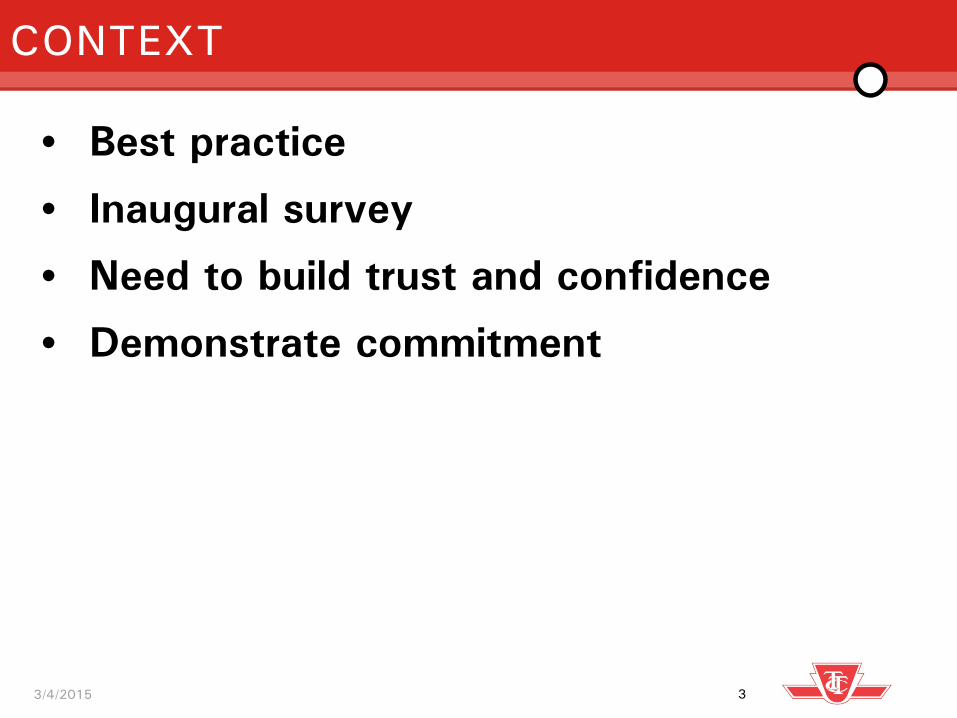
CONTEXT
• Best practice
• Inaugural survey
• Need to build trust and confidence
• Demonstrate commitment
CONTEXT
3/4/2015 3
Produced by Malatest on behalf of TTC
Employee Engagement Survey
Board Presentation February 25, 2015
Employee Engagement Survey 2014
Produced by Malatest on behalf of TTC
INTRODUCTION
5
Employee Engagement Survey 2014
Produced by Malatest on behalf of TTC
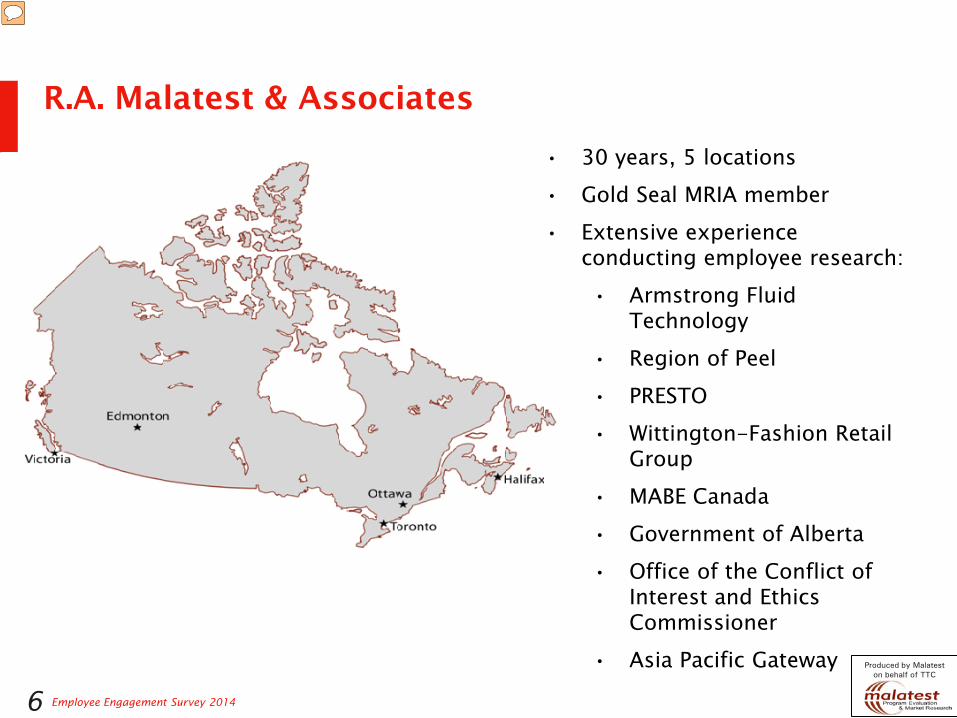
R.A. Malatest & Associates
6
• 30 years, 5 locations • Gold Seal MRIA member • Extensive experience
conducting employee research: • Armstrong Fluid
Technology • Region of Peel • PRESTO • Wittington-Fashion Retail
Group • MABE Canada • Government of Alberta • Office of the Conflict of
Interest and Ethics Commissioner
• Asia Pacific Gateway
Presenter
Presentation Notes
Gold Seal: means we are bound by the MRIA’s (Marketing Research & Intelligence Association) Code of Conduct and Good Practice and adhere to an audit every three years (currently conducted by Deloitte), to ensure the highest national standards of, for example, Security, Privacy and Maintenance of Research Data and Records (to ensure your confidential data remains as such), and rigorous and ethical data collection. Malatest’s data security is maintained at a high level with its data storage facilities audited annually by Industry Canada. All of our servers have received clearance to store highly sensitive information and all staff members are required to obtain federal security clearances. MRIA: a Canadian not-for-profit association representing all aspects of the market intelligence and survey research industry. Began operations in 2005, after the membership of the three Canadian associations representing the industry voted overwhelmingly in favour of merging. The MRIA presents a unified voice for the industry; pulling together all of the products and services formerly offered to the public and the respective members of the now dissolved Canadian Association of Market Research Organizations (CAMRO), the Canadian Survey Research Council (CSRC) and the Professional Marketing Research Society (PMRS). -Armstrong: international org (provides HVAC, plumbing, and fire safety solutions to building professionals & owners across the globe) – in addition to designing survey, collecting data, analysing and reporting results, we conducted in-depth discussion groups with employees to provide insight into the quantitative findings – the reasons behind the ratings (probed employees’ reasons for giving lower scores to certain measures that were also highly impactful on levels of engagement) Linking employee engagement and customer satisfaction: Validity determined by: quality of match (between employee engagement data and customer satisfaction data) and the number of units examined Criteria for selection of data pairs: Same calendar year for each department Employees who provide service x align with customers who receive service x Analysis: Assess strength of relationship between employee engagement and customer satisfaction scores Assess how much customer satisfaction will increase when employee engagement increases by one unit of measure Assess how much variance in customer satisfaction can be attributed to changes in employee engagement Assess relative size of each of employee commitment groups (low, medium, high) Region of Peel: examined the relationship between employee engagement and customer/client satisfaction to assess whether higher employee engagement translated into more satisfied clients and, ultimately, greater trust and confidence in the organization. It was discovered through this analysis that the confidence which employees had in their organization’s leadership had a positive correlation with client satisfaction. (8 surveys resulting in approximately 4,400 interviews conducted via telephone, online and/or paper amongst a range of client groups) PRESTO: assessment of key drivers of satisfaction among PRESTO cardholders and PRESTO service providers. A total of ten service providers were included in the research: GO Transit; Brampton Transit; Burlington Transit; Durham Region Transit; Hamilton Street Railway; Mississauga Transit; Oakville Transit; OC Transpo – Ottawa; TTC; and York Region Transit. As part of this research, Malatest conducted five focus groups with transit employees to better understand their experience with the PRESTO card and communicating with PRESTO staff. We learned that there are best practices when it comes to introducing staff to new technology, and adhering to these best practices can have a significant impact on employee job satisfaction. Also, when staff training on this new technology is provided by a third party, effective communication plays a critical role in the overall success of the training process. Malatest learned what constitutes effective communication within this context, and that this can vary somewhat by transit provider. MABE Canada Employee Engagement Qualitative Research: Malatest was contracted by Mabe to complete qualitative research relating to their employee engagement survey results. In particular, findings from survey topic areas were further explored through this qualitative study including: communication between employees and managers within business units and between business units; orientation training and professional development; employee engagement and commitment across employees, managers and business units. The results of the research helped management realize that much of the employees’ concern was related to the change in the company’s ownership (Mabe purchased the appliance division of General Electric Canada in 2009) and concerns over redundancies and pensions. Alberta Corporate HR Hiring Practices – Government of Alberta: In order to help support the Alberta Public Service (APS) strategic policy development, input was collected from clients (Line Managers) and stakeholders (Applicants; Human Resource professionals (HR Directors, HR Consultants, HR Assistants and CHR); and Deputy Ministers) on the recruitment and selection business processes within the APS, as well as on the legislation and principles that guide the APS staffing process. Approximately 1,000 randomly sampled ministry line managers were surveyed regarding recruiting and selecting employees for their respective organizations.The second survey took a census approach to probing the experiences of human resource professionals within the organizations in terms of recruitment and selection processes. The final survey asked approximately 3,000 randomly sampled successful and unsuccessful applicants about their experience of the recruitment and selection processes. These quantitative surveys were followed by focus groups to explore initial findings and emergent issues of the research. In total, Malatest collected secure online survey responses from 2,402 respondents. Employee Satisfaction Survey – Office of the Conflict of Interest and Ethics Commissioner, Ottawa, ON: The mandate of the Office of the Conflict of Interest and Ethics Commissioner (OCIEC) is to prevent conflict between the public duties and the private interests of elected and appointed officials of the Government of Canada. As the OCIEC is not subject to most Treasury Board policies, it does not participate in the Public Service Employee (PSE) Survey and therefore commissioned Malatest to administer an employee satisfaction survey in order to assess the extent to which relevant policies and guidelines implemented by the OCIEC have been successful in maintaining a positive workplace and effectively managing staff. Overall, 44 of 45 Office employees completed the survey, representing a response rate of 98%. Due to the the small size of the OCIEC, data were analyzed and reported on at the organizational level only so as not to compromise the anonymity of survey respondents. Through this study, Malatest was able to assist the OCIEC in determining appropriate approaches to staff management and engaging its employees Labour Force Profile of Port Drayage Drivers in Metro Vancouver – Asia Pacific Gateway, Vancouver, B.C. The goal of the research was to develop a profile of the current port trucking labour force in order to better understand employers’ and employees’ needs, to enable the industry to respond with appropriate human resource strategies, and to provide insight and recommendations that can inform and guide future initiatives in the drayage sector.
Employee Engagement Survey 2014
Produced by Malatest on behalf of TTC
Objectives
7
• To establish organizational best practice within TTC corporate culture • To establish baseline measures that will facilitate comparisons over time and
across employee groups. • To identify key drivers of employee engagement across the following aspects
of the employee experience:
Job
Company
Manager/Supervisor
Team
Working Environment
Safety
Training and Development
Performance and Reward
1.
2.
3.
4.
5.
6.
7.
8.
Employee Engagement Survey 2014
Produced by Malatest on behalf of TTC
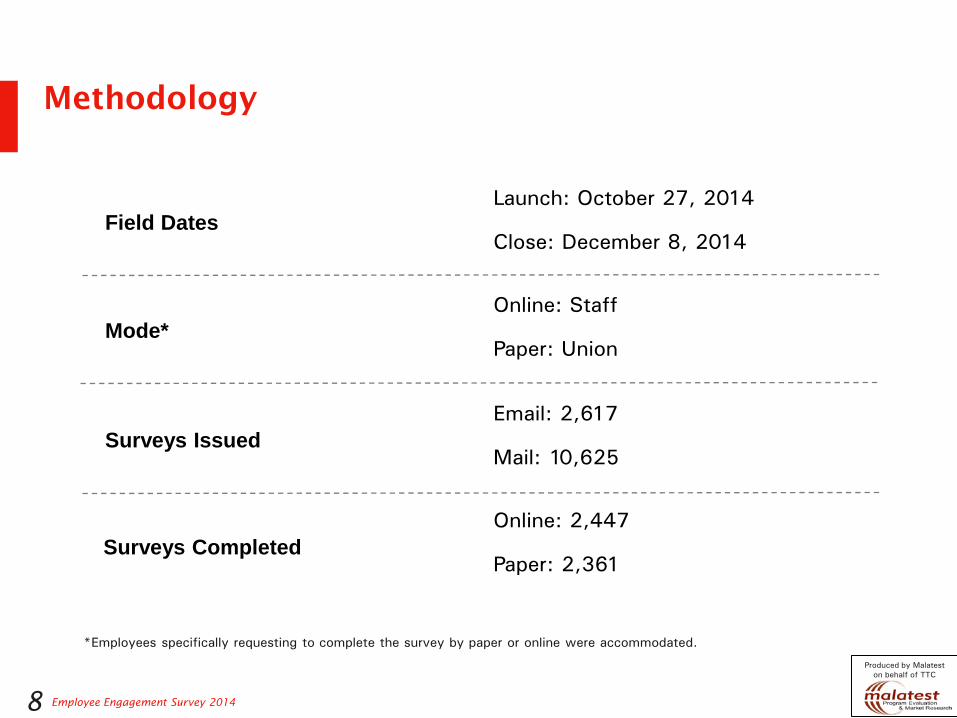
Methodology
8
Launch: October 27, 2014
Close: December 8, 2014 Field Dates
Mode*
Surveys Issued
Surveys Completed
Online: Staff
Paper: Union
Email: 2,617
Mail: 10,625
Online: 2,447
Paper: 2,361
*Employees specifically requesting to complete the survey by paper or online were accommodated.
Employee Engagement Survey 2014
Produced by Malatest on behalf of TTC
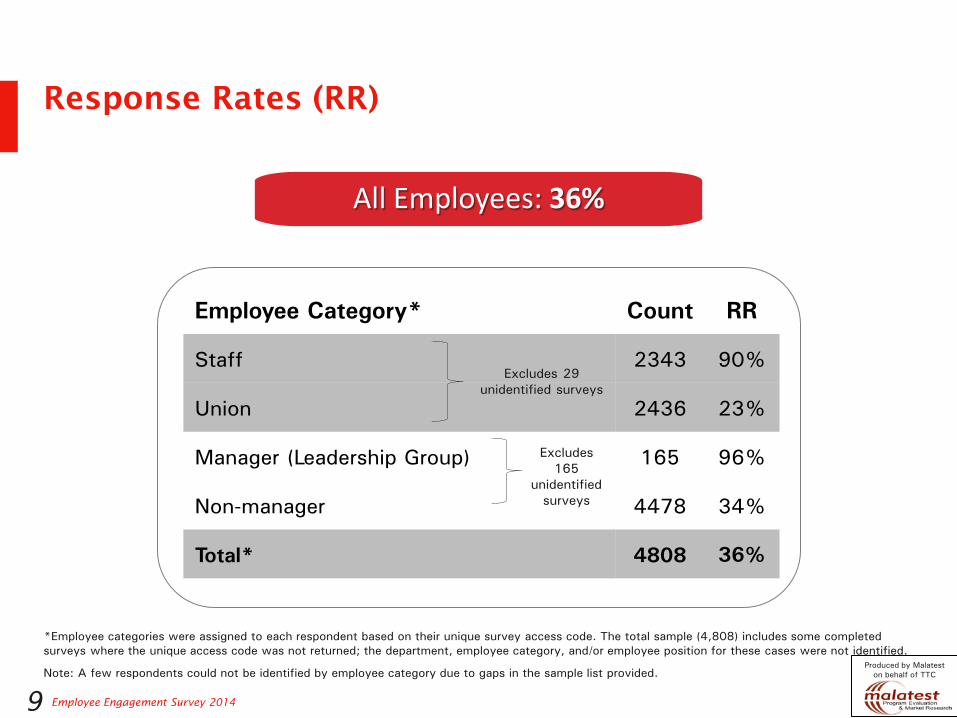
Response Rates (RR)
9
Employee Category* Count RR
Staff 2343 90%
Union 2436 23%
Manager (Leadership Group) 165 96%
Non-manager 4478 34%
Total* 4808 36%
All Employees: 36%
*Employee categories were assigned to each respondent based on their unique survey access code. The total sample (4,808) includes some completed surveys where the unique access code was not returned; the department, employee category, and/or employee position for these cases were not identified.
Note: A few respondents could not be identified by employee category due to gaps in the sample list provided.
Excludes 29 unidentified surveys
Excludes 165
unidentified surveys
Employee Engagement Survey 2014
Produced by Malatest on behalf of TTC
OVERALL EMPLOYEE ENGAGEMENT SCORE
10
Employee Engagement Survey 2014
Produced by Malatest on behalf of TTC
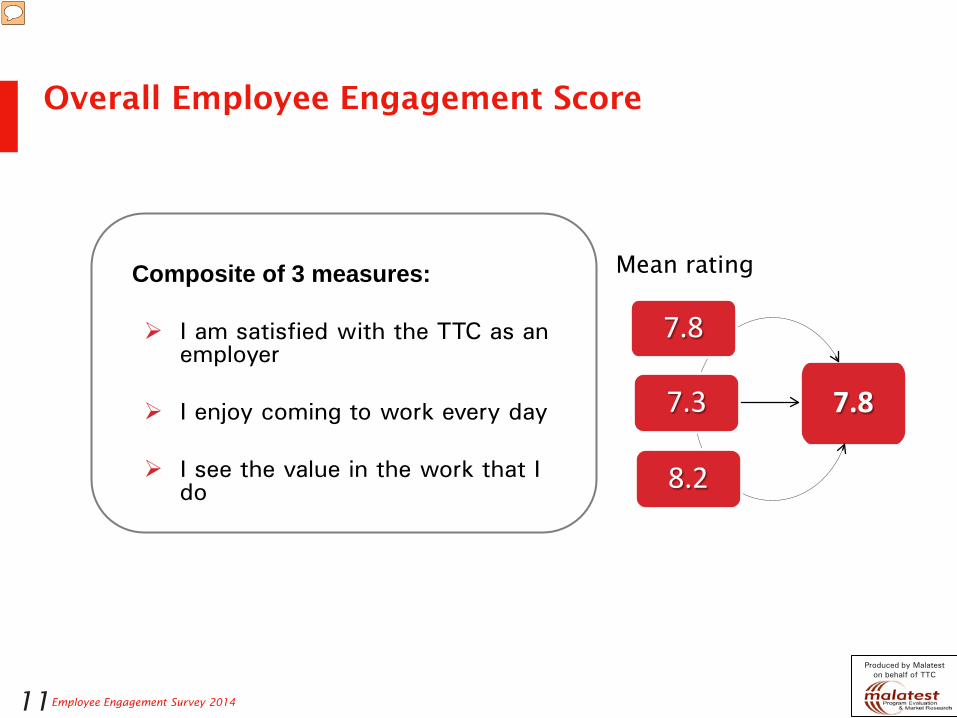
Composite of 3 measures: I am satisfied with the TTC as an
employer
I enjoy coming to work every day
I see the value in the work that I do
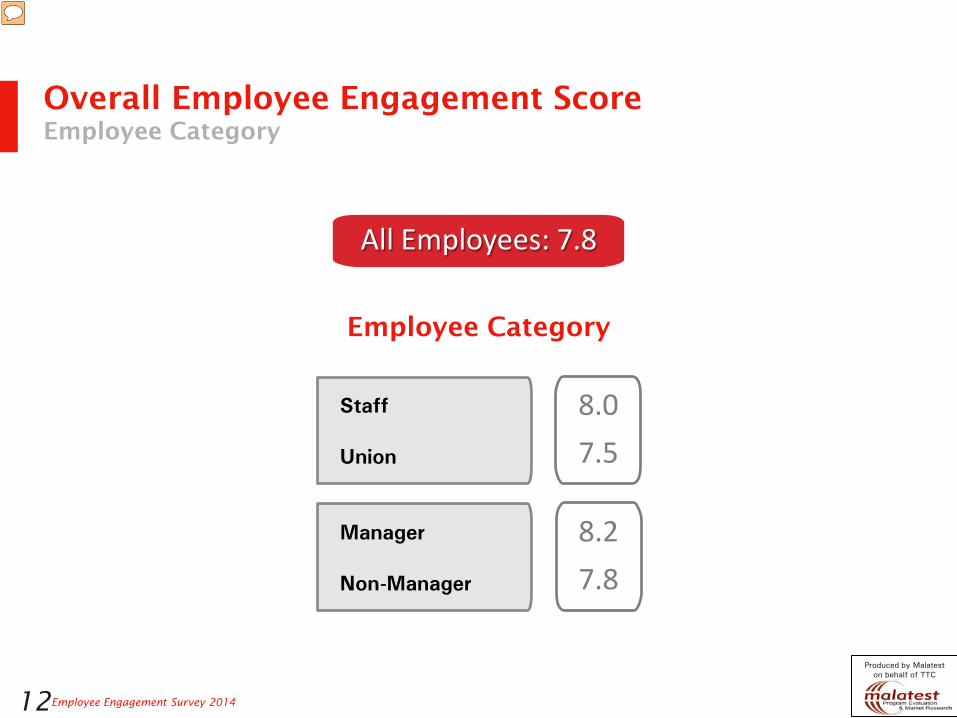
Overall Employee Engagement Score
11
7.8
7.8
7.3
8.2
Mean rating
Presenter
Presentation Notes
Typically, we define engagement by using a composite of different survey measures. We use a composite because it is more stable than a single variable (a single variable tends to respond more quickly to random fluctuations in the data and is more likely to show more variation over time), and it explains more of the employee experience than a single measure can. We typically use three measures rather than more than three because using more than three can result in a composite that is very difficult to move over time (because you need to receive a high or low rating on all measures included in the composite before you see movement). Three measures tends to result in a composite that is stable without being immovable. Since this is the first time the TTC has conducted an employee engagement study, we didn’t presume to know in advance which variables should be included in this composite. We know that employee engagement can be defined differently, depending on the organization. So, a number of tests were conducted to identify the ‘best’ composite to explain employee engagement within the TTC. The best composite was identified as the one that explained the most variance in employee engagement overall, and the one that included measures which generated the lowest number of non-response (indicating that these measures resonated with a larger proportion of TTC employees). The result of these tests revealed that the best composite measure to use to define employee engagement within the TTC included the following three survey measures: “I am satisfied with the TTC as an employer”; “I enjoy coming to work every day”; and “I see value in the work that I do”. TTC’s overall engagement score is as a composite of employees’ ratings across these three survey measures. Overall, across these three measures, the TTC’s mean employee engagement score is 7.8 on a 10 point scale (where “10” is the highest rating and “1” is the lowest).
The overall employee engagement score is highest among employees in the Engineering Construction & Expansion group, followed by employees in the CEO’s Office. Levels of engagement are lowest among employees in the Service Delivery group and the Strategy & Customer Experience group. When examined by employee category, the overall employee engagement score is highest among Staff (vs. Union) and Managers (vs. Non-Managers). Engagement levels among the four transportation modes are quite similar.
Employee Engagement Survey 2014
Produced by Malatest on behalf of TTC
IMPRESSIONS OF THE TTC
13
Employee Engagement Survey 2014
Produced by Malatest on behalf of TTC
How Employees Speak About the TTC All TTC Employees
14
Always 49%Sometimes 44%
Never 4% Don’t know 2%
I would speak highly of the TTC…
Presenter
Presentation Notes
Speaking Highly of the TTC (n= 4746) Differences among groups: - The CEO’s office (71%), Engineering Construction & Expansion (66%), and Corporate Services (60%) are more likely to ‘Always’ speak highly of the TTC. Differences by employee category: -Staff (60%) and Managers (70%) have a higher proportion of employees indicating that they would ‘Always’ speak highly of the TTC (vs. 39% among Union employees and 48% among Non-manager employees). -Results are similar among different transportation modes.
Employee Engagement Survey 2014
Produced by Malatest on behalf of TTC
How Employees’ Experience has Changed Over Time All TTC Employees
Gotten better30%
Stayed the same42%
Gotten worse24%
Don’t know4%
In the past 12 months, working for the TTC has...
Gotten Worse: Why?
1.Unqualified managers / lack of accountability (20%)
2.Worse personal work environment (15%)
3.Declining morale/employees not valued/respected (14%)
4.No leadership/ lack of vision/direction (12%)
Gotten Better: Why?
1.Management/ vision/ leadership (16%)
2.New managers/co-workers/ (15%)
3.Improved job / career path / opportunities (13%)
4.Better communication (12%)
15 Note: The top four reasons for employees’ change in experience are shown.
Presenter
Presentation Notes
Change in Experience Working for the TTC (n= 4735) Differences by Group: - CEO’s Office is most likely to express that working for the TTC has improved over the past 12 months (54%), while Service Delivery is least likely to feel this way (24%). - In addition to the Service Delivery group (29%), Strategy & Customer Experience (29%) and Operations (24%) feel that working for the TTC has gotten worse in the past twelve months. This sentiment is not shared with ECE (8%), the CEO’s Office (14%), and Corporate Services (16%). - The proportion of employees indicating their experience has not changed over the past twelve months is higher among Engineering Construction & Expansion (55%) and lower among CEO’s Office (29%). Differences by employee category: Staff are more likely to express that working for the TTC has improved over the past 12 months (37%) compared to Union (23%) employees. Along similar lines, Staff are almost twice as less likely to feel that that working for the TTC has declined (17%) compared to Union (30%) employees. 53% of Managers indicated that their experience has improved over the past twelve months (vs. 29% for Non-managers) Managers are therefore less likely to: (a) indicate a negative change in experience (16% vs. 24% for Non-managers) and (b) indicate no change in experience (30% vs. 43% for Non-managers) Results for “Gotten Better” are similar across different modes of transportation (ranging from 23% with Bus to 30% with Subway) Results for “Gotten Worse” are also similar across different modes (ranging from 26% with Bus to 32% with Subway and Wheel-Trans) However, respondents in the Bus category were most likely to report no change in their experience (45%), compared to 32% among subway employees.
Employee Engagement Survey 2014
Produced by Malatest on behalf of TTC
SATISFACTION WITH EMPLOYEE EXPERIENCE
16
Employee Engagement Survey 2014
Produced by Malatest on behalf of TTC
People get things done both quickly and efficiently at the TTC (5.1)
Top 5 and Bottom 5 Scores All TTC Employees
17
I feel comfortable discussing safety issues at work (8.3)
The TTC offers good job security (8.3)
I often look for ways to make improvements in how things are done (8.1)
My manager/supervisor is well informed about safety issues (8.0)
I am strongly encouraged to report unsafe working conditions (8.0)
1.
2.
3.
4.
5.
Top 5
There is a good level of trust between Senior Management and employees (4.9)
There is effective sharing of information across the TTC(4.9)
If something goes wrong, people concentrate on putting it right, not blaming others (5.0)
Best practices are shared effectively across the TTC (5.3)
1.
2.
3.
4.
5.
Bottom 5
Presenter
Presentation Notes
Across the entire survey, the following attributes received the highest satisfaction ratings from TTC Employees: I feel comfortable discussing safety issues at work (8.3 – attribute within Safety) The TTC offers good job security (8.3 – attribute within Performance and Reward) I often look for ways to make improvements in how things are done (8.1 – attribute within Your Job) My manager/supervisor is well informed about safety issues (8.0 – attribute within Safety) I am strongly encouraged to report unsafe working conditions (8.0 – attribute within Safety) The following attributes – all associated with Your Company – received the lowest satisfaction ratings from TTC Employees: There is a good level of trust between Senior Management and employees (4.9) There is effective sharing of information across the TTC (4.9) If something goes wrong, people concentrate on putting it right, not blaming others (5.0) People get things done both quickly and efficiently at the TTC (5.1) Best practices are shared effectively across the TTC (5.3)
Employee Engagement Survey 2014
Produced by Malatest on behalf of TTC
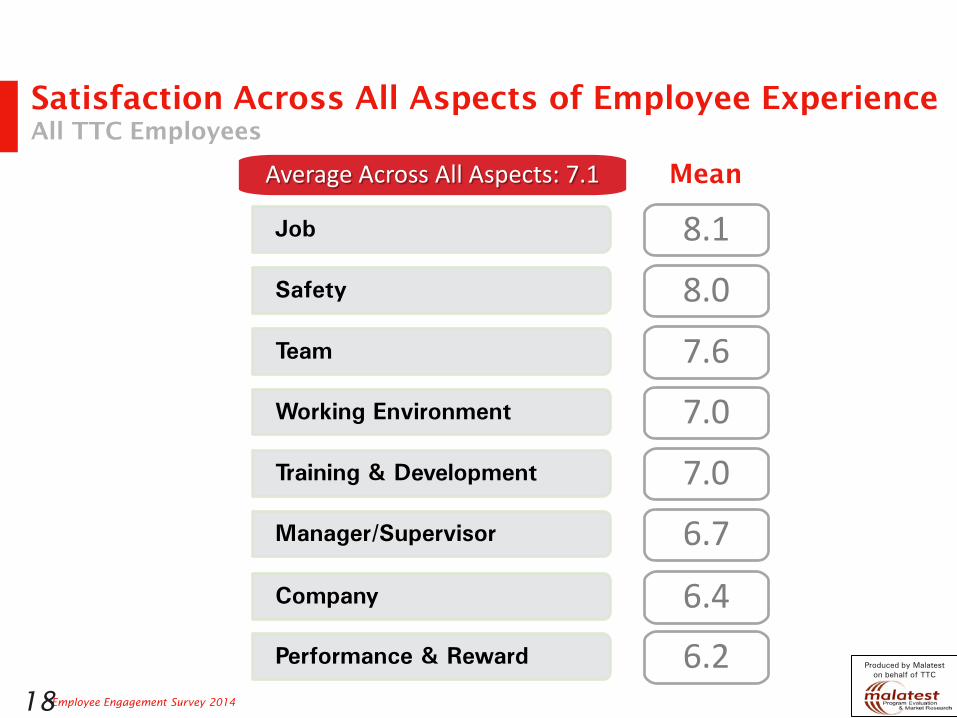
Satisfaction Across All Aspects of Employee Experience All TTC Employees
18
Job 8.1 Safety 8.0 Team 7.6 Working Environment 7.0 Training & Development 7.0 Manager/Supervisor 6.7 Company 6.4 Performance & Reward 6.2
Mean Average Across All Aspects: 7.1
Employee Engagement Survey 2014
Produced by Malatest on behalf of TTC
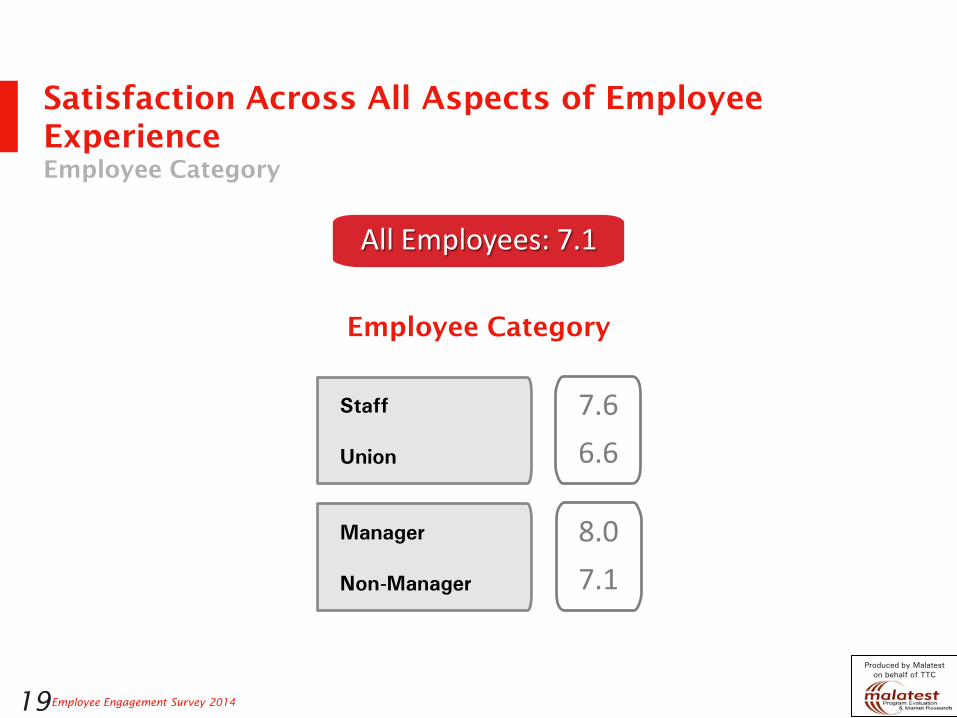
Satisfaction Across All Aspects of Employee Experience Employee Category
19
Staff Union
7.6 6.6
Employee Category
Manager Non-Manager
8.0 7.1
All Employees: 7.1
Employee Engagement Survey 2014
Produced by Malatest on behalf of TTC
WHAT DRIVES EMPLOYEE ENGAGEMENT?
20
Employee Engagement Survey 2014
Produced by Malatest on behalf of TTC
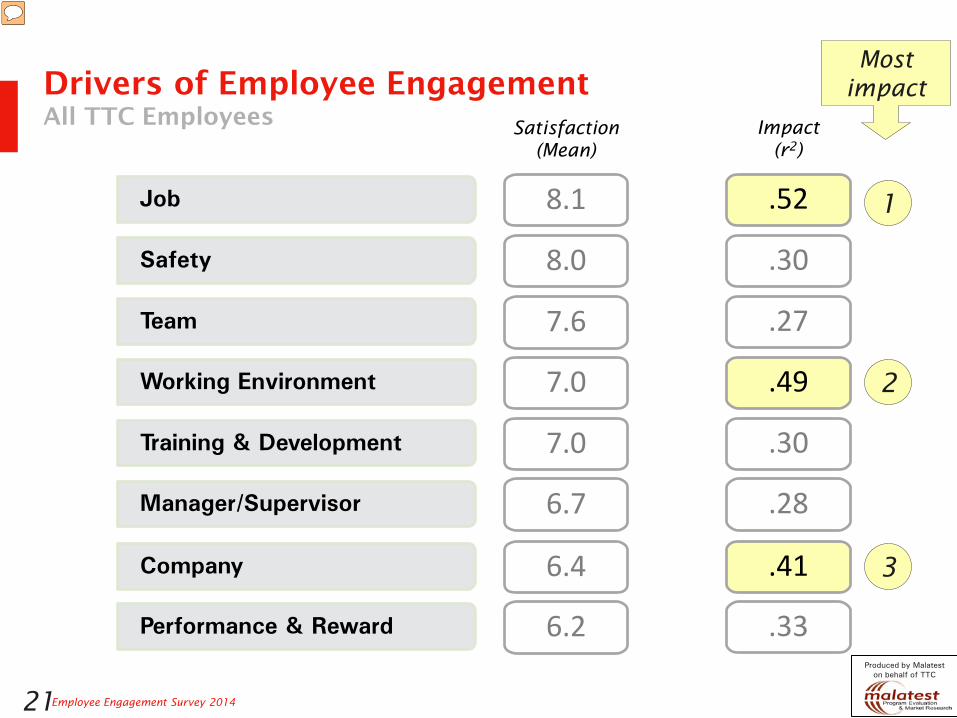
Drivers of Employee Engagement All TTC Employees
21
Job 8.1
Safety 8.0
Team 7.6
Working Environment 7.0
Training & Development 7.0
Manager/Supervisor 6.7
Company 6.4
Performance & Reward 6.2
Satisfaction (Mean)
.52
.30
.27
.49
.30
.28
.41
.33
Impact (r2)
1
2
3
Most impact
Presenter
Presentation Notes
Each aspect of the employee experience can be thought of as a lever that will generate a greater or lesser amount of 'lift' in Employee Engagement overall. In other words, if you devote resources to increasing employees' satisfaction with Performance & Reward, will you see an increase in employee engagement overall? To determine this, we assessed the strength of the correlation between each aspect of the employee experience and employee engagement overall. These correlation values are listed at the far right of this slide. As shown, correlation values are highest for Your Job, Working Environment, and Your Company. Focusing your efforts on increasing employee satisfaction with these aspects of the employee experience will have the generate the greatest amount of lift in employee engagement overall.
Employee Engagement Survey 2014
Produced by Malatest on behalf of TTC
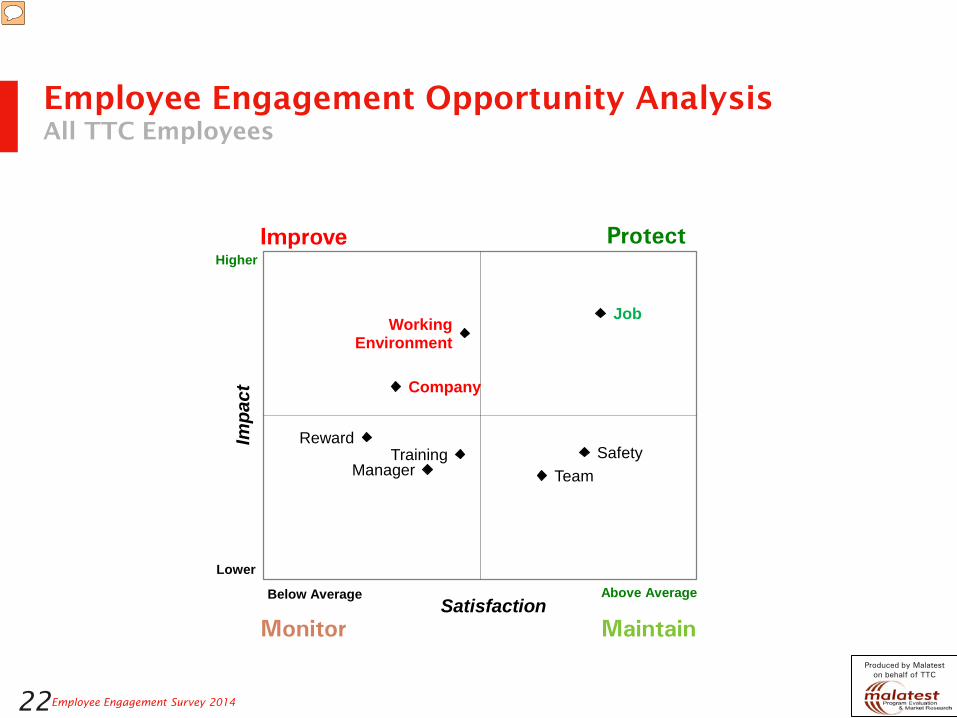
Employee Engagement Opportunity Analysis All TTC Employees
22
Improve Protect
Monitor Maintain
Job
Company
Manager Team
Working Environment
Safety Training Reward
Above Average Below Average
Higher
Lower
Impa
ct
Satisfaction
Presenter
Presentation Notes
Areas to Improve (high relative impact; low relative performance): Working Environment Company Areas to Protect (high relative impact; high relative performance): Job Areas to Monitor (low relative impact; low relative performance): Performance/Reward Training & Development Manager/Supervisor Areas to Maintain (low relative impact; high relative performance): Safety Team This model of Employee Engagement includes drivers that explain 68% of the variance in employee engagement overall, so it’s quite a strong model. (Adjusted R2 = 0.68 (stepwise)). The adjusted R2 (coefficient of determination) indicates the certainty with which predictions can be made using a model. In other words, 68% of the variance in Employee Engagement can be predicted using this model.
Employee Engagement Survey 2014
Produced by Malatest on behalf of TTC
KEY ACTION AREAS
23
Employee Engagement Survey 2014
Produced by Malatest on behalf of TTC
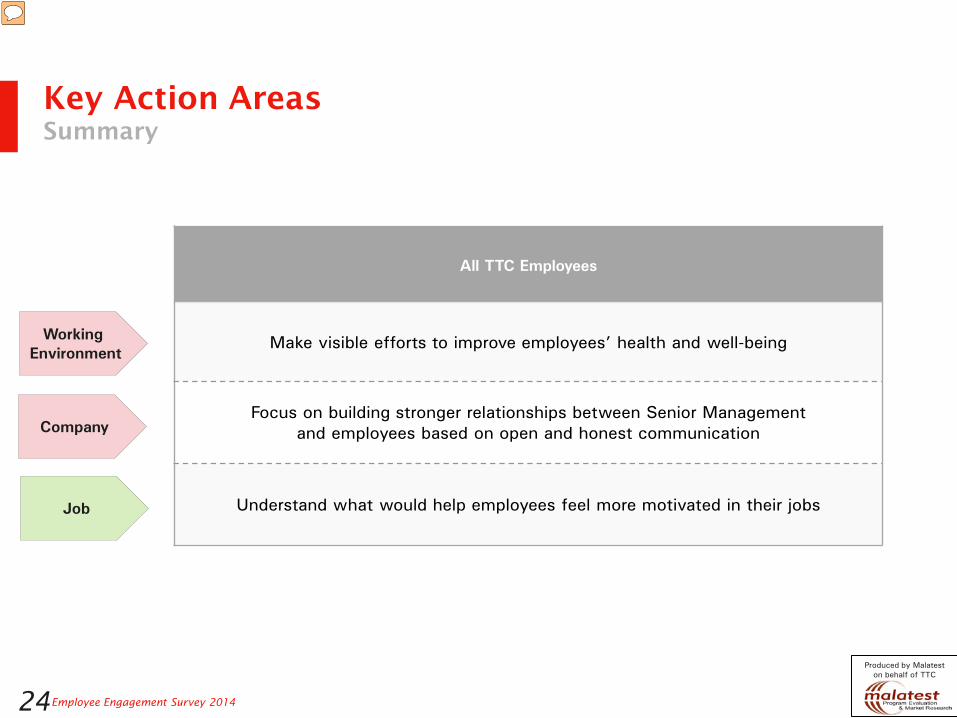
Key Action Areas Summary
24
All TTC Employees
Make visible efforts to improve employees’ health and well-being
Focus on building stronger relationships between Senior Management and employees based on open and honest communication
Understand what would help employees feel more motivated in their jobs
Working Environment
Company
Job
Presenter
Presentation Notes
Working Environment: Showing concern for employees’ health and wellbeing is about: Caring about employees mental health & emotional wellbeing (i.e., “The TTC cares about my mental health and emotional well-being”) – Area to Improve for all groups except Strategy & Customer Experience. Encouraging a healthy work-life balance (i.e., “The TTC encourages employees to maintain a healthy work-life balance”) – Area to Improve for all groups except CEO’s Office Workspaces & facilities is an issue for employees all groups except Corporate Services and Engineering Construction & Expansion. Further exploration is required to identify reasons for lower levels of satisfaction with being “satisfied with my work/office space and facilities.” Your Company: Relationship building is and issue for all groups and is about: Building trust by being open and honest (i.e., “Senior Managers communicate openly and honestly with employees” and “There is a good level of trust between Senior Management and employees”) Welcoming feedback (i.e., “TTC leadership welcomes all feedback, both positive and negative”) Valuing employees’ time -Confidence in TTC leadership’s decision making ability is an issue only for Operations and Service Delivery – but it is the strongest driver of satisfaction with Your Company for these groups. This area is related to making the right decisions for the company’s future success (i.e., “I feel confident that TTC leadership is making the right decisions for the company’s future success”). Effective information sharing and collaboration is specifically an issue for Operations & Service Delivery and relates to: Making sure employees are well informed about what is happening in the TTC (both groups) There is effective sharing of information across the TTC (Service Delivery) Good collaboration between different parts of the TTC (Service Delivery) Performance & Reward is specifically an issue for Strategy & Customer Experience and the CEO’s Office. Meaningful recognition= “At the TTC, the recognition and/or rewards are meaningful” Opportunities to progress=“I have the opportunity to progress within the company” Training & Development is specifically an issue for Strategy & Customer Experience and received this group’s lowest satisfaction rating – a much lower score than seen for other groups: Supporting personal development = “I am satisfied with the support I receive on my personal development” and “I have a clear, agreed, personal development plan, which I have agreed to with my manager/supervisor” Career development opportunities = “I am satisfied with the career development opportunities available to me” Your Job is an area to Protect for all groups and the strongest driver for all groups except Strategy & Customer Experience. Key drivers of satisfaction are: -‘I feel motivated in my job‘ – Area to Improve for all groups except Service Delivery -‘My work enables me to use my skills and abilities’ – Area to Improve for Corporate Services, EC&E, and Strategy & Customer Experience -‘I am given the freedom to make decisions in my job’ is an Area to Improve for CEO’s Office, EC&E, and Strategy & Customer Experience -Feeling ‘able to put customers first’ is generally an Area to Protect, but is an Area to Improve for the CEO’s office
Employee Engagement Survey 2014
Produced by Malatest on behalf of TTC
RECOMMENDATIONS
Employee Engagement Survey 2014
Produced by Malatest on behalf of TTC
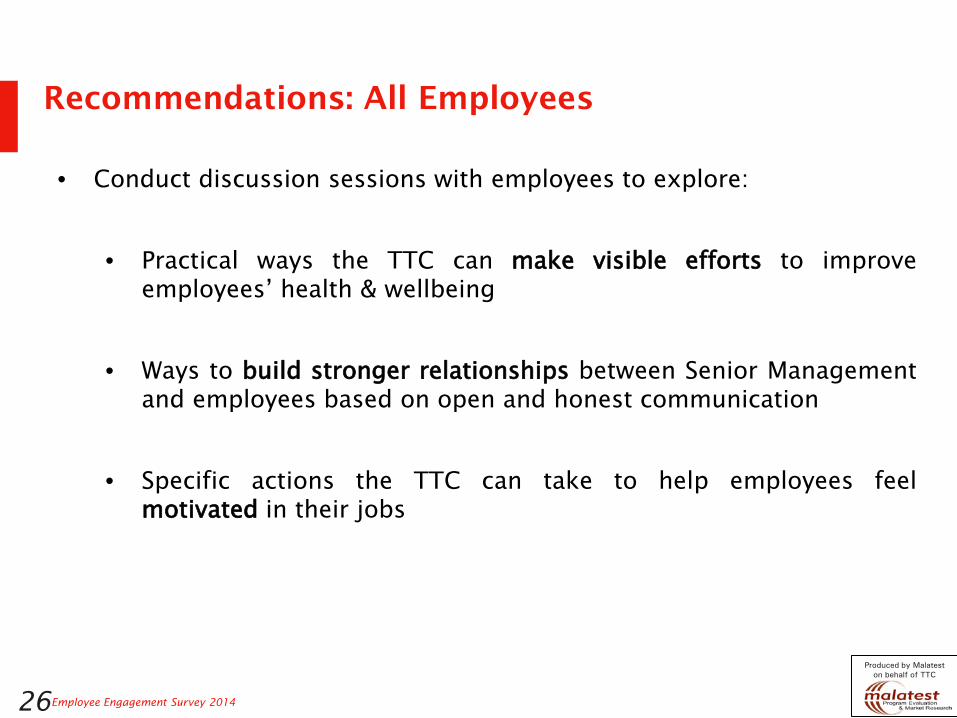
Recommendations: All Employees
26
• Conduct discussion sessions with employees to explore: • Practical ways the TTC can make visible efforts to improve
employees’ health & wellbeing
• Ways to build stronger relationships between Senior Management and employees based on open and honest communication
• Specific actions the TTC can take to help employees feel motivated in their jobs
Employee Engagement Survey 2014
Produced by Malatest on behalf of TTC
Thank you
29
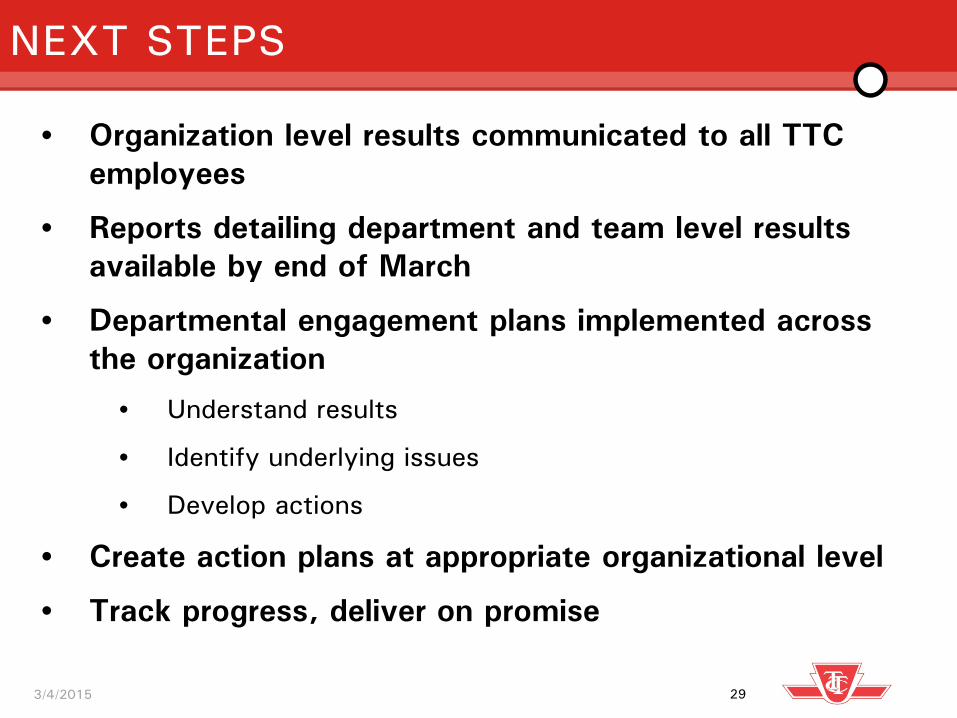
NEXT STEPS
• Organization level results communicated to all TTC employees
• Reports detailing department and team level results available by end of March
• Departmental engagement plans implemented across the organization
• Understand results
• Identify underlying issues
• Develop actions
• Create action plans at appropriate organizational level