Embed Size (px)
Citation preview
U N I T E D N AT I O N S C O N F E R E N C E O N T R A D E A N D D E V E L O P M E N T
EMPIRICAL INSIGHTEMPIRICAL INSIGHTS ON MARKET AS ON MARKET ACCESSCCESSAND FOREIGN DIRECT INVESTMENTAND FOREIGN DIRECT INVESTMENT
POLICY ISSUES IN INTERNAPOLICY ISSUES IN INTERNATIONAL TRADE AND COMMODITIESTIONAL TRADE AND COMMODITIESSTUDY SERIES No. 63
M E N T
������������������� ���� ������ ���������������� ���
���������������
��
������������ ��������������������������� ��������������������
�
���
���������������
������
����������� !� �������������
UNITED NATIONS
New York and Geneva, 2014
U N I T E D N AT I O N S C O N F E R E N C E O N T R A D E A N D D E V E L O P M E N T
ii POLICY ISSUES IN INTERNATIONAL TRADE AND COMMODITIES
��!�
The purpose of this series of studies is to analyse policy issues and to stimulate discussions in the area of international trade and development. The series includes studies by UNCTAD staff and by distinguished researchers from other organizations and academia. This paper represents the personal
views of the author only, and not the views of the UNCTAD secretariat or its member States.
This publication has not been formally edited.
The designations employed and the presentation of the material do not imply the expression of any opinion on the part of the United Nations concerning the legal status of any country, territory, city or area, or of authorities or concerning the delimitation of its frontiers or boundaries.
Material in this publication may be freely quoted or reprinted, but acknowledgement is requested, together with a copy of the publication containing the quotation or reprint to be sent to the
UNCTAD secretariat at the following address:
Marco Fugazza
Trade Analysis Branch Division on International Trade in Goods and Services, and Commodities
United Nations Conference on Trade and Development Palais des Nations, CH-1211 Geneva 10, Switzerland
Tel: +41 22 917 5772; Fax: +41 22 917 0044 E-mail: [email protected]
Series Editor:
Victor Ognivtsev Officer-in-Charge
Trade Analysis Branch DITC/UNCTAD
UNCTAD/ITCD/TAB/67
UNITED NATIONS PUBLICATION
ISSN 1607-8291
Copyright © United Nations, 2014 All rights reserved
Empirical Insights on Market Access and Foreign Direct Investment iii
��������
Motivations for foreign direct investment (FDI) could be multiple. This paper conducts a
general examination of the influence of market access conditions on FDI decisions using a unique
data set on bilateral FDI outward stocks and novel measures of market access. We find that over
the period 1990–2010, export platform and complex-vertical investment strategies have been
driving FDI decisions around the world.
JEL Classification: C33, F21, F15
Keywords: Foreign direct investment, market access, panel econometrics

iv POLICY ISSUES IN INTERNATIONAL TRADE AND COMMODITIES
���� ����������
The authors wish to thank Masataka Fujita and Astrit Sulstarova for their helpful
comments and discussion.
The authors accept sole responsibility for any errors remaining.
Empirical Insights on Market Access and Foreign Direct Investment v
�� !� !"�
EXECUTIVE SUMMARY ......................................................................................................................... vii
1 INTRODUCTION .......................................................................................................................... 1
2 MOTIVATIONS FOR FDI AND THE ROLE OF MARKET ACCESS:
THEORETICAL INSIGHTS .......................................................................................................... 2
3 THE EMPIRICAL STRATEGY ..................................................................................................... 3
4 RESULTS ..................................................................................................................................... 8
4.1 Core specifications ............................................................................................................ 8
4.2 Robustness ...................................................................................................................... 14
5 CONCLUSIONS ......................................................................................................................... 17
REFERENCES ......................................................................................................................................... 18
vi POLICY ISSUES IN INTERNATIONAL TRADE AND COMMODITIES
List of tables
Table 1. FDI forms and market access conditions: Expected relationships ....................................... 3
Table 2. FDI outward stock by country of origin ................................................................................. 4
Table 3. Whole sample ........................................................................................................................ 9
Table 4. OECD versus non-OECD countries as exporters ................................................................ 11
Table 5. Subsamples: OECD exporters ............................................................................................. 12
Table 6. Subsamples: Non-OECD exporters ..................................................................................... 13
Table 7. Heckman model (two-step procedure) ................................................................................ 16
Empirical Insights on Market Access and Foreign Direct Investment vii
EXECUTIVE SUMMARY
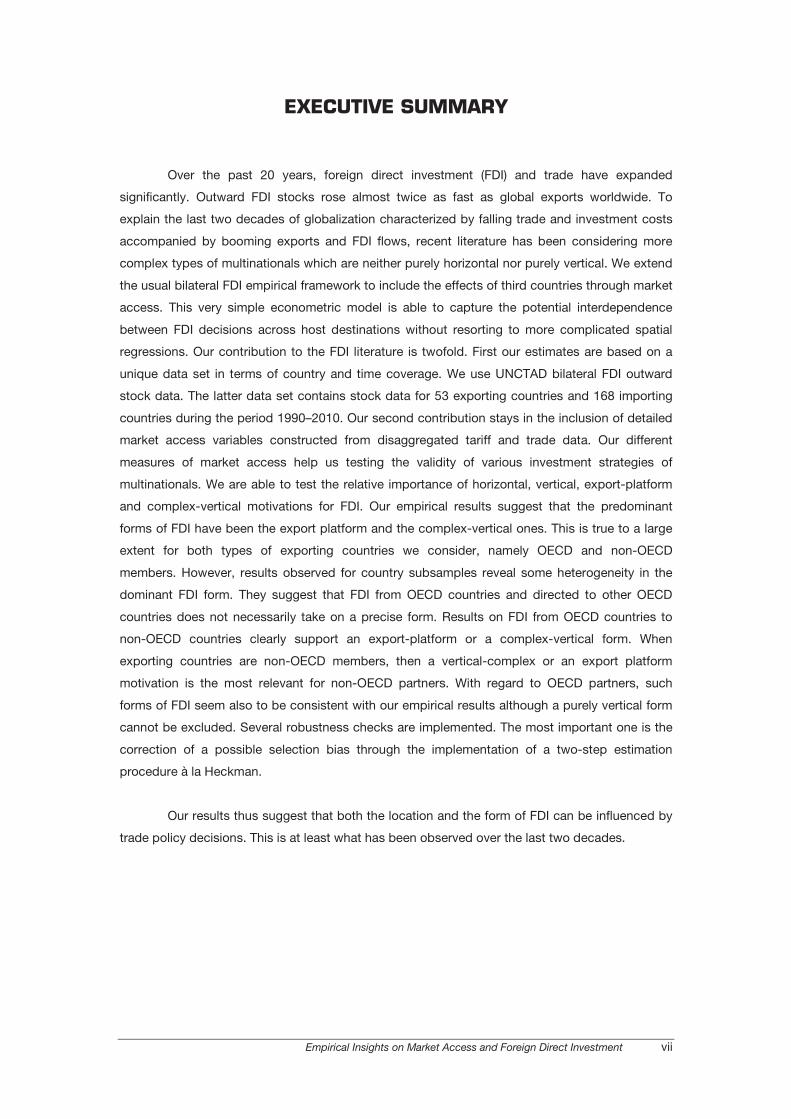
Over the past 20 years, foreign direct investment (FDI) and trade have expanded
significantly. Outward FDI stocks rose almost twice as fast as global exports worldwide. To
explain the last two decades of globalization characterized by falling trade and investment costs
accompanied by booming exports and FDI flows, recent literature has been considering more
complex types of multinationals which are neither purely horizontal nor purely vertical. We extend
the usual bilateral FDI empirical framework to include the effects of third countries through market
access. This very simple econometric model is able to capture the potential interdependence
between FDI decisions across host destinations without resorting to more complicated spatial
regressions. Our contribution to the FDI literature is twofold. First our estimates are based on a
unique data set in terms of country and time coverage. We use UNCTAD bilateral FDI outward
stock data. The latter data set contains stock data for 53 exporting countries and 168 importing
countries during the period 1990–2010. Our second contribution stays in the inclusion of detailed
market access variables constructed from disaggregated tariff and trade data. Our different
measures of market access help us testing the validity of various investment strategies of
multinationals. We are able to test the relative importance of horizontal, vertical, export-platform
and complex-vertical motivations for FDI. Our empirical results suggest that the predominant
forms of FDI have been the export platform and the complex-vertical ones. This is true to a large
extent for both types of exporting countries we consider, namely OECD and non-OECD
members. However, results observed for country subsamples reveal some heterogeneity in the
dominant FDI form. They suggest that FDI from OECD countries and directed to other OECD
countries does not necessarily take on a precise form. Results on FDI from OECD countries to
non-OECD countries clearly support an export-platform or a complex-vertical form. When
exporting countries are non-OECD members, then a vertical-complex or an export platform
motivation is the most relevant for non-OECD partners. With regard to OECD partners, such
forms of FDI seem also to be consistent with our empirical results although a purely vertical form
cannot be excluded. Several robustness checks are implemented. The most important one is the
correction of a possible selection bias through the implementation of a two-step estimation
procedure à la Heckman.
Our results thus suggest that both the location and the form of FDI can be influenced by
trade policy decisions. This is at least what has been observed over the last two decades.

Empirical Insights on Market Access and Foreign Direct Investment 1
1. INTRODUCTION
Over the past 20 years, foreign direct investment (FDI) and trade have expanded
significantly. Outward FDI stocks rose almost twice as fast as global exports worldwide
(UNCTAD, 2013). This is in apparent contradiction with the prominent theory of trade and FDI
based on the proximity-concentration trade-off (Helpman et al., 2004). According to this theory,
firms tend to substitute FDI for exports when transport costs are large and plant-level returns to
scale are small. As a consequence, falling trade costs should discourage FDI as the benefits of
concentrated production increasingly outweigh the gains from improved market access. On the
other hand, models considering vertically integrated enterprises (Helpman, 1984) – which engage
in trade and seek to exploit international factor price differentials – are not consistent with the
evidence showing that the bulk of FDI flows are concentrated in developed countries and take
place among similar high per capita income countries (Bergstrand and Egger, 2010).
To explain the last two decades of globalization characterized by falling trade and
investment costs accompanied by booming exports and FDI flows, recent literature has been
considering more complex types of multinationals which are neither purely horizontal nor purely
vertical. In all these models, the standard two countries by two factors setting has been extended
to explain FDI and trade complementarity to changes in factor endowments and market access.
In this literature, multinationals’ complex (or complex-vertical) integration strategies
create dependence between the level of FDI in one country and the characteristics and policies of
its neighbours, having important implications for the structure of FDI across countries (Yeaple,
2003). As a consequence, access to local as well as to third markets becomes a key determinant
of FDI. For example, Motta and Norman (1996), Raff (2004) and Neary (2002, 2008) elaborate
theoretical models predicting that when countries integrate regionally, they boost their
attractiveness for investors by increasing the size of their market. Under so-called export platform
investments, firms engage in FDI into the host country and also export from there to the partner
countries or back to the home country (Elkholm et al., 2007; Mukherjee, 2012). Thus, in contrast
to the proximity-concentration hypothesis, trade cost reduction may increase FDI and exports.
Recent empirical work confirms that exports and FDI flows are driven by a “common
process” (Bergstrand and Egger, 2007, 2010). However, results on their determinants and in
particular on market access have been more mixed. Blomstroem and Kokko (1997) review the
evidence on the impact on FDI of three regional integration agreements – United States-Canada
Free Trade Agreement, NAFTA and MERCOSUR – and find that while intraregional FDI
decreased, extraregional FDI increased. Head and Mayer (2004) find evidence that European
market integration in the nineties encouraged Japanese FDI. Similarly, Levy Yeyati et al. (2003)
shows a positive average impact of regional integration agreements on bilateral FDI. Elkholm et
al. (2007) find that foreign United States affiliates in North America concentrate on home-country
export platform while affiliates in Europe concentrate on third-country export platform. Blonigen
et al. (2007, 2008), Coughlin and Segev (2000) and Baltagi et al. (2007, 2008) use spatial models
to assess the impact of a host country’s neighbouring markets on FDI.
Our contribution to the FDI literature is twofold. First, our estimates are based on a
unique data set in terms of country and time coverage. While previous studies did focus mainly
on the regional integration strategies of developed countries, we are able to verify the importance
of market access for a wider set of countries for which factor price differences might still
represent a main determinant of investment. We use UNCTAD bilateral FDI outward stock data.
The latter data set contains stock data for 53 exporting countries and 168 importing countries
during the period 1990–2010. We are thus able to consider different samples of countries on both
the exporting and importing sides. This approach allows us to verify the validity of existing FDI
theories across differences in geographic characteristics and across different developmental
stages. The period covered captures the combined increase of FDI and trade as well as a
significant fall in tariffs observed worldwide due to the extension and deepening of the multilateral
2 POLICY ISSUES IN INTERNATIONAL TRADE AND COMMODITIES
trade system and the explosion of regional trade agreements. Our second contribution stays in
the inclusion of detailed market access variables constructed from disaggregated tariff and trade
data. Our different measures of market access help us in testing the validity of various investment
strategies of multinationals. We are able to test the relative importance of horizontal, vertical,
export-platform and complex-vertical motivations for FDI. The latter two forms of FDI would
involve exports to third markets. However, complex-vertical investment strategies are associated
with exports of intermediate inputs to third markets for further processing before being shipped
as a final good to the final destination.
Our empirical results suggest that the predominant forms of FDI have been the export
platform and the complex-vertical ones. This is true to a large extent for both types of exporting
countries we consider, namely OECD and non-OECD members. However, results observed for
country subsamples reveal some heterogeneity in the dominant FDI form. They suggest that FDI
from OECD countries and directed to other OECD countries does not necessarily take on a
precise form. Results on FDI from OECD countries to non-OECD countries clearly support an
export-platform or a complex-vertical form. When exporting countries are non-OECD members,
then a vertical-complex or an export platform motivation is the most relevant for non-OECD
partners. With regard to OECD partners, such forms of FDI also seem to be consistent with our
empirical results, although a purely vertical form cannot be excluded. Several robustness checks
are implemented. The most important one is the correction of a possible selection bias through
the implementation of a two-step estimation procedure à la Heckman.
The remainder of the paper proceeds as follows. In the next chapter we discuss
theoretical insights on the possible implications of market access conditions on FDI strategies.
Chapter 3 discusses the data and the empirical strategy adopted. Chapter 4 reports estimates
and underline the relevance of including market access variables in our set of explanatory
variables. Chapter 5 concludes.
2. MOTIVATIONS FOR FDI AND THE ROLE OF MARKET
ACCESS: THEORETICAL INSIGHTS
Based on theoretical investigations essentially referred to in the previous section, we
briefly review the expected relationship between possible forms of FDI and market
access/openness conditions. Four forms of FDI in line with the literature are considered: the
classical horizontal and vertical FDI as well as the most recently contemplated export-platform
and complex-vertical FDI.
In the horizontal FDI model, investment is motivated by market access and avoidance of
trade frictions such as transport costs and import protection in the host country. FDI would thus
respond positively to higher trade barriers in any destination country inducing a substitution
between trade and investment. This kind of investment is expected to predominate when relative
endowments of host and source countries are similar.
Vertical FDI is motivated by international factor price differentials. Accordingly,
multinationals invest in low production cost countries and then serve both the domestic and
foreign markets. Vertical FDI is considered to be a complement to trade and thus increase if the
parent country tariff is reduced. At the same time, the tariff-jumping motivation might still be valid,
thereby creating a bit of uncertainty on the sign of the host country tariffs. Theoretical
contributions usually adopt scenarios where host country tariffs are not high enough to eliminate
the cost advantage coming from the difference in endowments. However, higher tariffs could
erode the incentive to invest in labour abundant countries and thus we expect a negative
relationship between host country tariffs and FDI, becoming weaker the more similar the countries
are in terms of endowments.
Empirical Insights on Market Access and Foreign Direct Investment 3
Export-platform FDI refers to the situation in which multinationals invest in a country to
serve not only the local market and but also to serve the surrounding countries. Market access
conditions faced by the host country exporters in neighbouring countries are crucial. Easier
access would then translate into increased FDI. Export-platform production facilities could also
serve the parent country, and thus the tariff applied by the source country is also expected to be
positively correlated to FDI. As usual if the initial host country tariff is high, FDI could be
discouraged.
Complex-vertical are the most advanced investment strategies and are motivated by
minimization of production cost. Under this type of FDI, also known as fragmentation,
multinationals create many production locations specialized in different phases of production.
Consequently, third countries’ access to the host country and the host country’s openness to the
rest of the world are definitely important in determining FDI. Predictions on bilateral market
access measures are less clear cut, depending in which stage the host country is. For example,
for final assemblage countries it might be important to enjoy a low tariff for exporting back to the
headquarters country, while for other stages of production market access to third countries might
be more relevant.
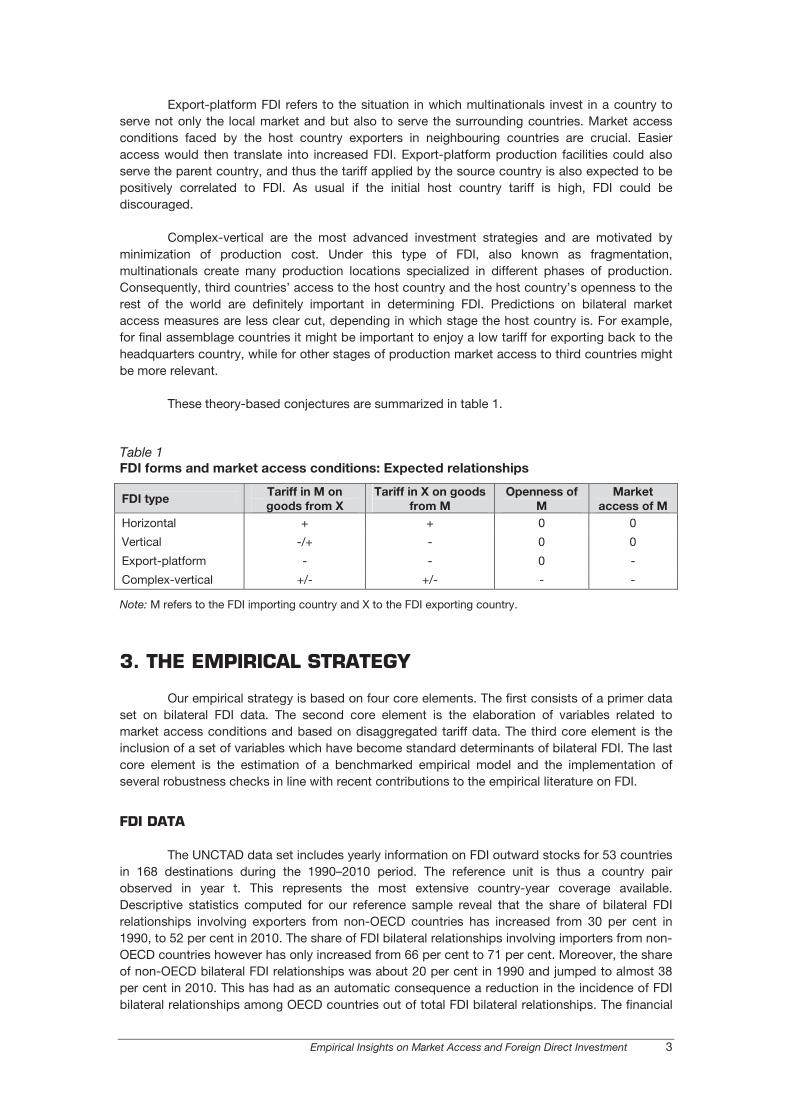
These theory-based conjectures are summarized in table 1.
Table 1
FDI forms and market access conditions: Expected relationships�
FDI type Tariff in M on
goods from X
Tariff in X on goods
from M
Openness of
M
Market
access of M
Horizontal + + 0 0
Vertical -/+ - 0 0
Export-platform - - 0 -
Complex-vertical +/- +/- - -
Note: M refers to the FDI importing country and X to the FDI exporting country.
�
3. THE EMPIRICAL STRATEGY
Our empirical strategy is based on four core elements. The first consists of a primer data
set on bilateral FDI data. The second core element is the elaboration of variables related to
market access conditions and based on disaggregated tariff data. The third core element is the
inclusion of a set of variables which have become standard determinants of bilateral FDI. The last
core element is the estimation of a benchmarked empirical model and the implementation of
several robustness checks in line with recent contributions to the empirical literature on FDI.
FDI DATA
The UNCTAD data set includes yearly information on FDI outward stocks for 53 countries
in 168 destinations during the 1990–2010 period. The reference unit is thus a country pair
observed in year t. This represents the most extensive country-year coverage available.
Descriptive statistics computed for our reference sample reveal that the share of bilateral FDI
relationships involving exporters from non-OECD countries has increased from 30 per cent in
1990, to 52 per cent in 2010. The share of FDI bilateral relationships involving importers from non-
OECD countries however has only increased from 66 per cent to 71 per cent. Moreover, the share
of non-OECD bilateral FDI relationships was about 20 per cent in 1990 and jumped to almost 38
per cent in 2010. This has had as an automatic consequence a reduction in the incidence of FDI
bilateral relationships among OECD countries out of total FDI bilateral relationships. The financial
4 POLICY ISSUES IN INTERNATIONAL TRADE AND COMMODITIES
crisis of 2008 certainly had an accelerating effect on the composition of FDI country pairs but the
tendency towards a rebalancing was already at work before.
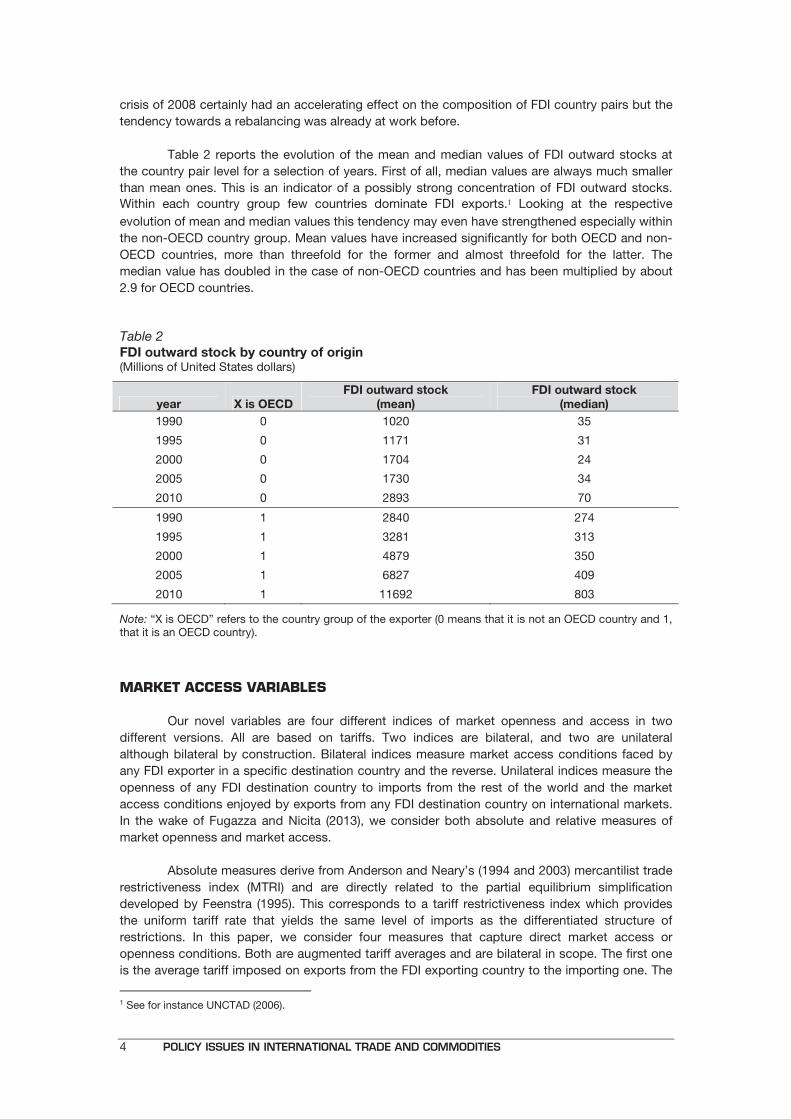
Table 2 reports the evolution of the mean and median values of FDI outward stocks at
the country pair level for a selection of years. First of all, median values are always much smaller
than mean ones. This is an indicator of a possibly strong concentration of FDI outward stocks.
Within each country group few countries dominate FDI exports.� Looking at the respective
evolution of mean and median values this tendency may even have strengthened especially within
the non-OECD country group. Mean values have increased significantly for both OECD and non-
OECD countries, more than threefold for the former and almost threefold for the latter. The
median value has doubled in the case of non-OECD countries and has been multiplied by about
2.9 for OECD countries.
Table 2
FDI outward stock by country of origin (Millions of United States dollars)
year X is OECD
FDI outward stock
(mean)
FDI outward stock
(median)
1990 0 1020 35
1995 0 1171 31
2000 0 1704 24
2005 0 1730 34
2010 0 2893 70
1990 1 2840 274
1995 1 3281 313
2000 1 4879 350
2005 1 6827 409
2010 1 11692 803
Note: “X is OECD” refers to the country group of the exporter (0 means that it is not an OECD country and 1, that it is an OECD country).
�
MARKET ACCESS VARIABLES
Our novel variables are four different indices of market openness and access in two
different versions. All are based on tariffs. Two indices are bilateral, and two are unilateral
although bilateral by construction. Bilateral indices measure market access conditions faced by
any FDI exporter in a specific destination country and the reverse. Unilateral indices measure the
openness of any FDI destination country to imports from the rest of the world and the market
access conditions enjoyed by exports from any FDI destination country on international markets.
In the wake of Fugazza and Nicita (2013), we consider both absolute and relative measures of
market openness and market access.
Absolute measures derive from Anderson and Neary’s (1994 and 2003) mercantilist trade
restrictiveness index (MTRI) and are directly related to the partial equilibrium simplification
developed by Feenstra (1995). This corresponds to a tariff restrictiveness index which provides
the uniform tariff rate that yields the same level of imports as the differentiated structure of
restrictions. In this paper, we consider four measures that capture direct market access or
openness conditions. Both are augmented tariff averages and are bilateral in scope. The first one
is the average tariff imposed on exports from the FDI exporting country to the importing one. The
1 See for instance UNCTAD (2006).
Empirical Insights on Market Access and Foreign Direct Investment 5
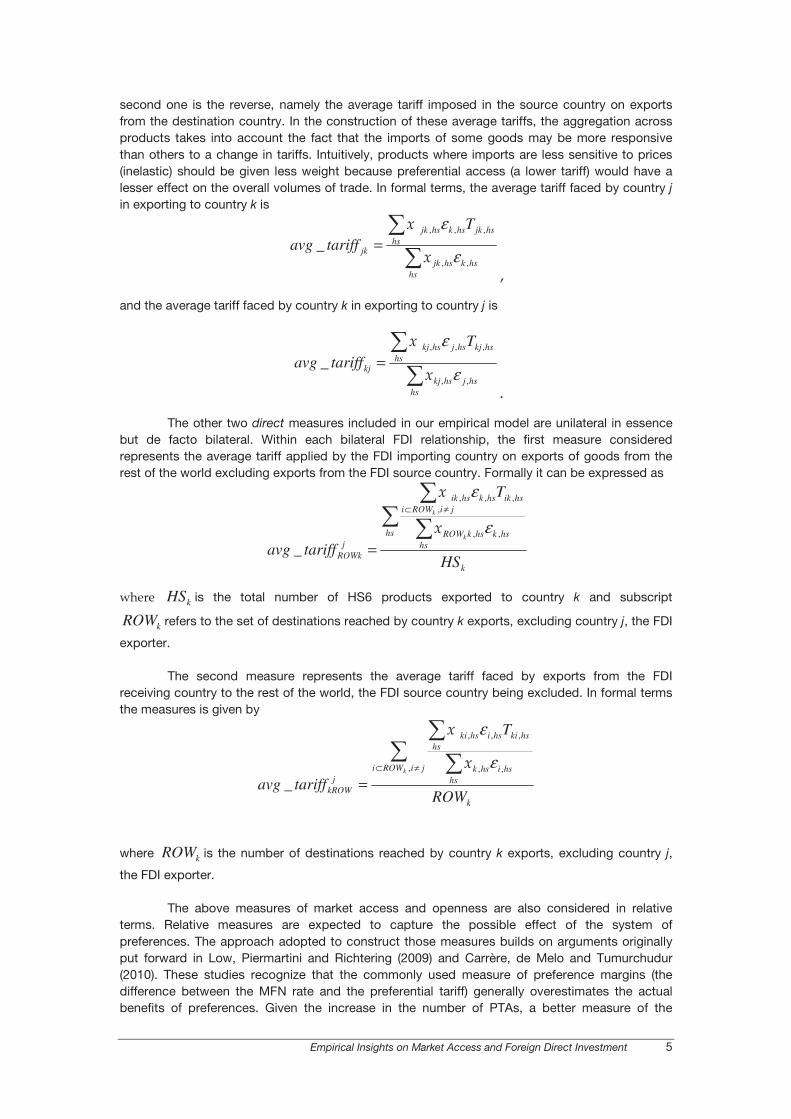
second one is the reverse, namely the average tariff imposed in the source country on exports
from the destination country. In the construction of these average tariffs, the aggregation across
products takes into account the fact that the imports of some goods may be more responsive
than others to a change in tariffs. Intuitively, products where imports are less sensitive to prices
(inelastic) should be given less weight because preferential access (a lower tariff) would have a
lesser effect on the overall volumes of trade. In formal terms, the average tariff faced by country j
in exporting to country k is
��
=
hshskhsjk
hsjkhs
hskhsjk
jk
Ttariffavg
,,
,,, _
ε
ε
�
�
�
�
and the average tariff faced by country k in exporting to country j is
��
=
hshsjhskj
hskjhs
hsjhskj
kj
Ttariffavg
,,
,,, _
ε
ε
�
�
��
The other two direct measures included in our empirical model are unilateral in essence
but de facto bilateral. Within each bilateral FDI relationship, the first measure considered
represents the average tariff applied by the FDI importing country on exports of goods from the
rest of the world excluding exports from the FDI source country. Formally it can be expressed as
k
hshs
hskhskROW
hsikjiROWi
hskhsik
jROWk HS
T
tariffavgk
k� ��
≠⊂
=,,
,,
,,
_ε
ε
�
�
�
����� kHS is the total number of HS6 products exported to country k and subscript
kROW refers to the set of destinations reached by country k exports, excluding country j, the FDI
exporter.�
The second measure represents the average tariff faced by exports from the FDI
receiving country to the rest of the world, the FDI source country being excluded. In formal terms
the measures is given by
k
jiROWihs
hsihsk
hskihs
hsihski
jkROW ROW
T
tariffavgk
� ��
≠⊂
=, ,,
,,,
_ε
ε
�
�
�
where� kROW is the number of destinations reached by country k exports, excluding country j,
the FDI exporter.
The above measures of market access and openness are also considered in relative
terms. Relative measures are expected to capture the possible effect of the system of
preferences. The approach adopted to construct those measures builds on arguments originally
put forward in Low, Piermartini and Richtering (2009) and Carrère, de Melo and Tumurchudur
(2010). These studies recognize that the commonly used measure of preference margins (the
difference between the MFN rate and the preferential tariff) generally overestimates the actual
benefits of preferences. Given the increase in the number of PTAs, a better measure of the
6 POLICY ISSUES IN INTERNATIONAL TRADE AND COMMODITIES
preferential margin is one where the counterfactual is not the MFN tariff, but the preferential
access provided to other foreign competitors. Generally speaking, relative measures are based on
the difference, in tariff percentage points, that a determined basket of goods faces when imported
from a given country relative to being imported from any other. Two sets of weights need to be
considered in the construction of these measures. First, the counterfactual (the tariff faced by
foreign competitors) is a weighted average of the tariffs imposed on all other trading partners.
Second, the overall tariff imposed on each exporter is a weighted average comprising the tariffs
of many products.�To calculate the counterfactual, the first step is to calculate the trade-weighted
average tariff at the tariff line level that one country imposes on all other countries except the
country for which the preferential margin is calculated. We use bilateral imports as weights, so as
to take into account the supply capacity of trading partners. The second step is to aggregate
across products. This is done by using exports so as to take into consideration the different
product compositions across partners. Moreover, demand responses to changes in the tariffs are
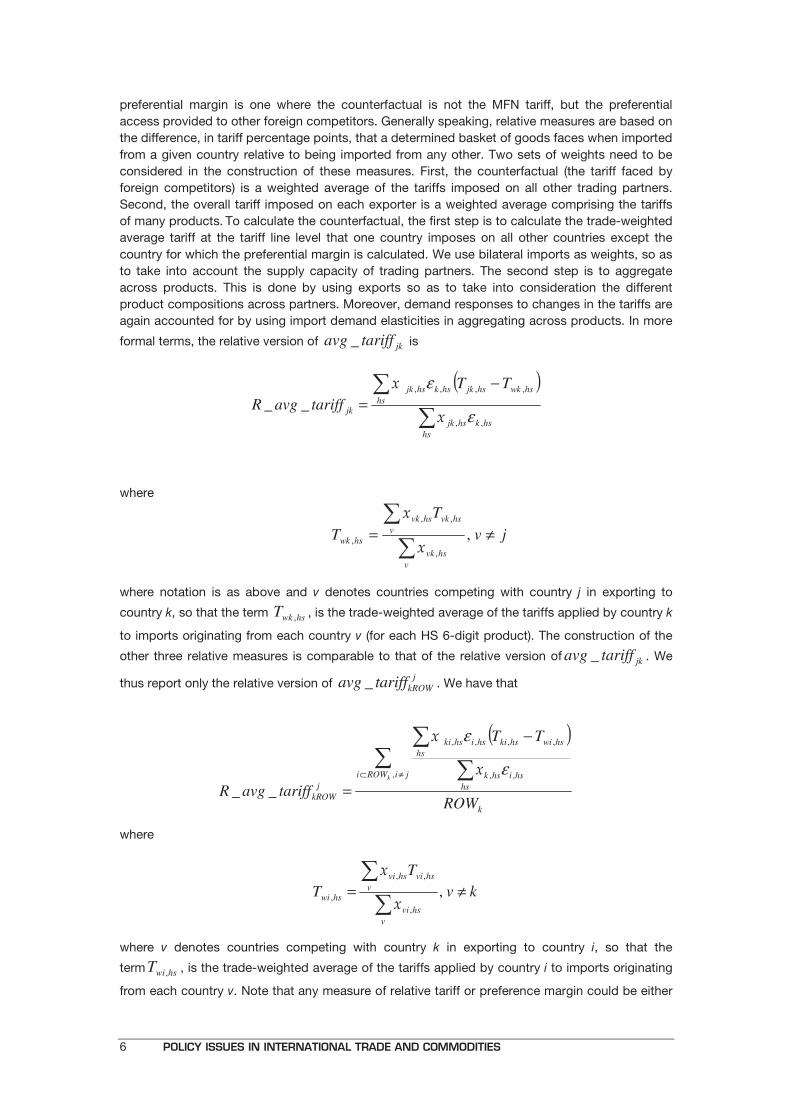
again accounted for by using import demand elasticities in aggregating across products. In more
formal terms, the relative version of jktariffavg _ is
( )�
� −=
hshskhsjk
hswkhsjkhs
hskhsjk
jk
TTtariffavgR
,,
,,,, __
ε
ε
�
��
� � �
where
jvT
T
vhsvk
vhsvkhsvk
hswk ≠=�
�,
,
,,
, �
��
where notation is as above and v denotes countries competing with country j in exporting to
country k, so that the term hswkT , , is the trade-weighted average of the tariffs applied by country k
to imports originating from each country v (for each HS 6-digit product). The construction of the
other three relative measures is comparable to that of the relative version of jktariffavg _ . We
thus report only the relative version of j
kROWtariffavg _ . We have that
( )
k
jiROWihs
hsihsk
hswihskihs
hsihski
jkROW ROW
TT
tariffavgRk
� ��
≠⊂
−
=, ,,
,,,,
__ε
ε
�
�
where
kvT
T
vhsvi
vhsvihsvi
hswi ≠=��
,,
,,
, �
�
�where v denotes countries competing with country k in exporting to country i, so that the
term hswiT , , is the trade-weighted average of the tariffs applied by country i to imports originating
from each country v. Note that any measure of relative tariff or preference margin could be either
Empirical Insights on Market Access and Foreign Direct Investment 7
positive or negative, depending on the disadvantage or advantage of the country with respect to
other competing exporters.
In summary, the four relative measures of market access and openness retained are:
- jktariffavgR __ : reflecting the overall tariff faced by exports from the parent
country to the host country relative to that faced by other foreign competitors;
- kjtariffavgR __ : reflecting the overall tariff faced by exports from the host
country to the parent country relative to that faced by other foreign competitors;
- jROWktariffavgR __ : reflecting the market access that exports from the rest of
the world (excluding the parent country) have to the host country;
- jkROWtariffavgR __ : reflecting the market access that exports from the host
country have to the rest of the world relative to that of foreign countries.
Summary statistics indicate that direct market access conditions have generally
improved during the period of analysis and that relative market access conditions have evolved
from a situation where few bilateral trade relationships enjoyed large preferential margins, to a
situation where the system of preferences is beneficial to a larger number of bilateral trade
relationships but is overall less discriminatory.
�
THE EMPIRICAL MODEL AND OTHER FDI DETERMINANTS
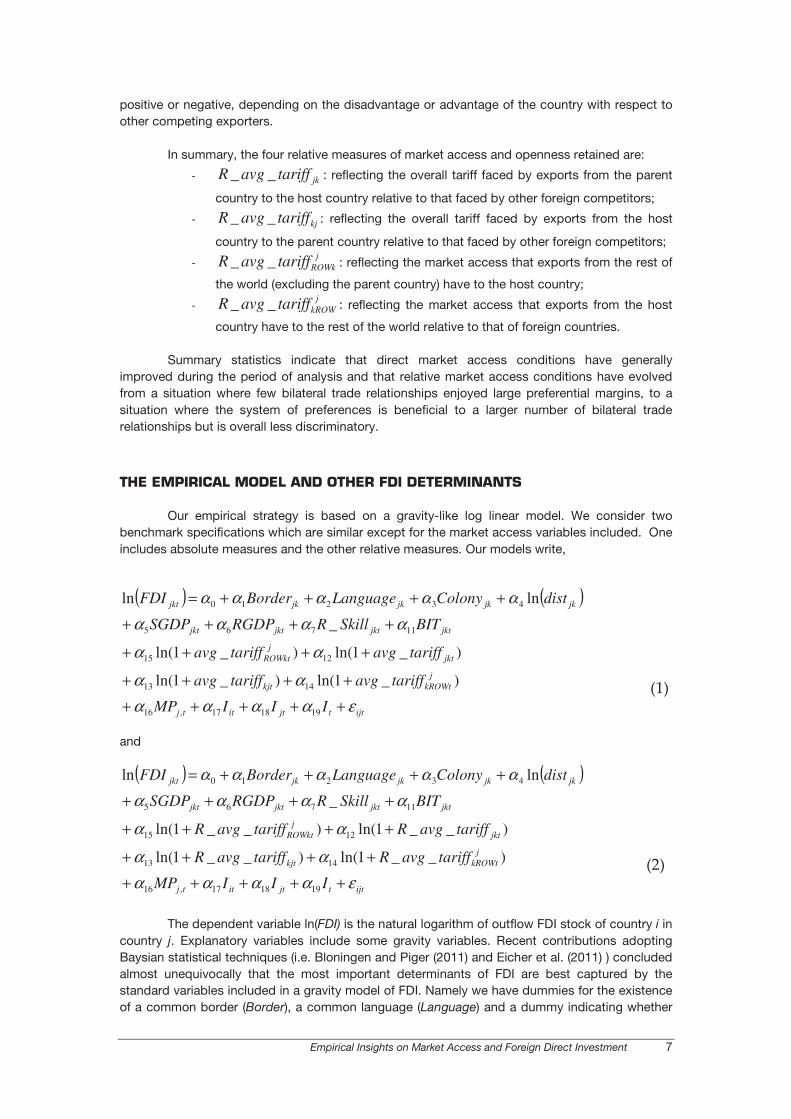
Our empirical strategy is based on a gravity-like log linear model. We consider two
benchmark specifications which are similar except for the market access variables included. One
includes absolute measures and the other relative measures. Our models write,
�
( ) ( )
ijttjtittj
jkROWtkjt
jktj
ROWkt
jktjktjktjkt
jkjkjkjkjkt
IIIMP
tariffavgtariffavg
tariffavgtariffavg
BITSkillRRGDPSGDP
distColonyLanguageBorderFDI
εαααααα
αα
ααααααααα
+++++
++++
++++
++++
++++=
191817,16
1413
1215
11765
43210
)_1ln()_1ln(
)_1ln()_1ln(
_
lnln
� � ����
and
( ) ( )
ijttjtittj
jkROWtkjt
jktj
ROWkt
jktjktjktjkt
jkjkjkjkjkt
IIIMP
tariffavgRtariffavgR
tariffavgRtariffavgR
BITSkillRRGDPSGDP
distColonyLanguageBorderFDI
εαααααα
αα
ααααααααα
+++++
++++
++++
++++
++++=
191817,16
1413
1215
11765
43210
)__1ln()__1ln(
)__1ln()__1ln(
_
lnln
� � ���
The dependent variable ln(FDI) is the natural logarithm of outflow FDI stock of country i in
country j. Explanatory variables include some gravity variables. Recent contributions adopting
Baysian statistical techniques (i.e. Bloningen and Piger (2011) and Eicher et al. (2011) ) concluded
almost unequivocally that the most important determinants of FDI are best captured by the
standard variables included in a gravity model of FDI. Namely we have dummies for the existence
of a common border (Border), a common language (Language) and a dummy indicating whether
8 POLICY ISSUES IN INTERNATIONAL TRADE AND COMMODITIES
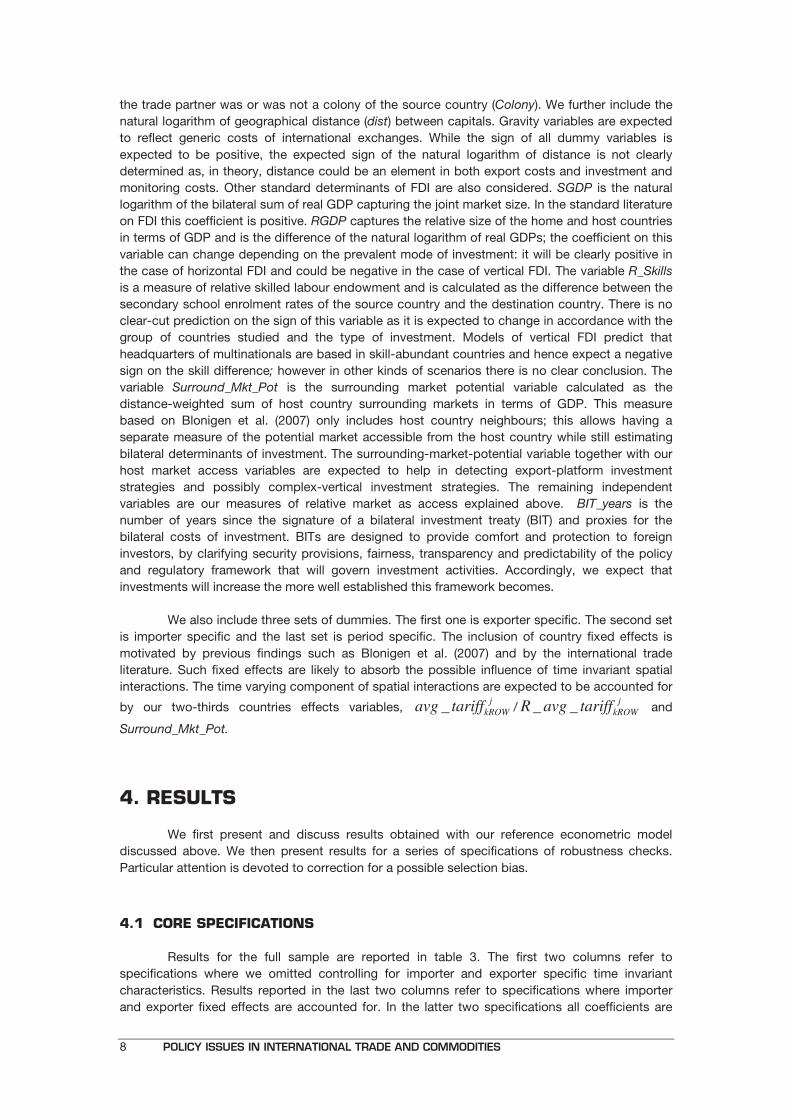
the trade partner was or was not a colony of the source country (Colony). We further include the
natural logarithm of geographical distance (dist) between capitals. Gravity variables are expected
to reflect generic costs of international exchanges. While the sign of all dummy variables is
expected to be positive, the expected sign of the natural logarithm of distance is not clearly
determined as, in theory, distance could be an element in both export costs and investment and
monitoring costs. Other standard determinants of FDI are also considered. SGDP is the natural
logarithm of the bilateral sum of real GDP capturing the joint market size. In the standard literature
on FDI this coefficient is positive. RGDP captures the relative size of the home and host countries
in terms of GDP and is the difference of the natural logarithm of real GDPs; the coefficient on this
variable can change depending on the prevalent mode of investment: it will be clearly positive in
the case of horizontal FDI and could be negative in the case of vertical FDI. The variable R_Skills
is a measure of relative skilled labour endowment and is calculated as the difference between the
secondary school enrolment rates of the source country and the destination country. There is no
clear-cut prediction on the sign of this variable as it is expected to change in accordance with the
group of countries studied and the type of investment. Models of vertical FDI predict that
headquarters of multinationals are based in skill-abundant countries and hence expect a negative
sign on the skill difference; however in other kinds of scenarios there is no clear conclusion. The
variable Surround_Mkt_Pot is the surrounding market potential variable calculated as the
distance-weighted sum of host country surrounding markets in terms of GDP. This measure
based on Blonigen et al. (2007) only includes host country neighbours; this allows having a
separate measure of the potential market accessible from the host country while still estimating
bilateral determinants of investment. The surrounding-market-potential variable together with our
host market access variables are expected to help in detecting export-platform investment
strategies and possibly complex-vertical investment strategies. The remaining independent
variables are our measures of relative market as access explained above. BIT_years is the
number of years since the signature of a bilateral investment treaty (BIT) and proxies for the
bilateral costs of investment. BITs are designed to provide comfort and protection to foreign
investors, by clarifying security provisions, fairness, transparency and predictability of the policy
and regulatory framework that will govern investment activities. Accordingly, we expect that
investments will increase the more well established this framework becomes.
We also include three sets of dummies. The first one is exporter specific. The second set
is importer specific and the last set is period specific. The inclusion of country fixed effects is
motivated by previous findings such as Blonigen et al. (2007) and by the international trade
literature. Such fixed effects are likely to absorb the possible influence of time invariant spatial
interactions. The time varying component of spatial interactions are expected to be accounted for
by our two-thirds countries effects variables, j
kROWtariffavg _ /j
kROWtariffavgR __
and
Surround_Mkt_Pot.
4. RESULTS
We first present and discuss results obtained with our reference econometric model
discussed above. We then present results for a series of specifications of robustness checks.
Particular attention is devoted to correction for a possible selection bias.
�
4.1 CORE SPECIFICATIONS
Results for the full sample are reported in table 3. The first two columns refer to
specifications where we omitted controlling for importer and exporter specific time invariant
characteristics. Results reported in the last two columns refer to specifications where importer
and exporter fixed effects are accounted for. In the latter two specifications all coefficients are
Empirical Insights on Market Access and Foreign Direct Investment 9
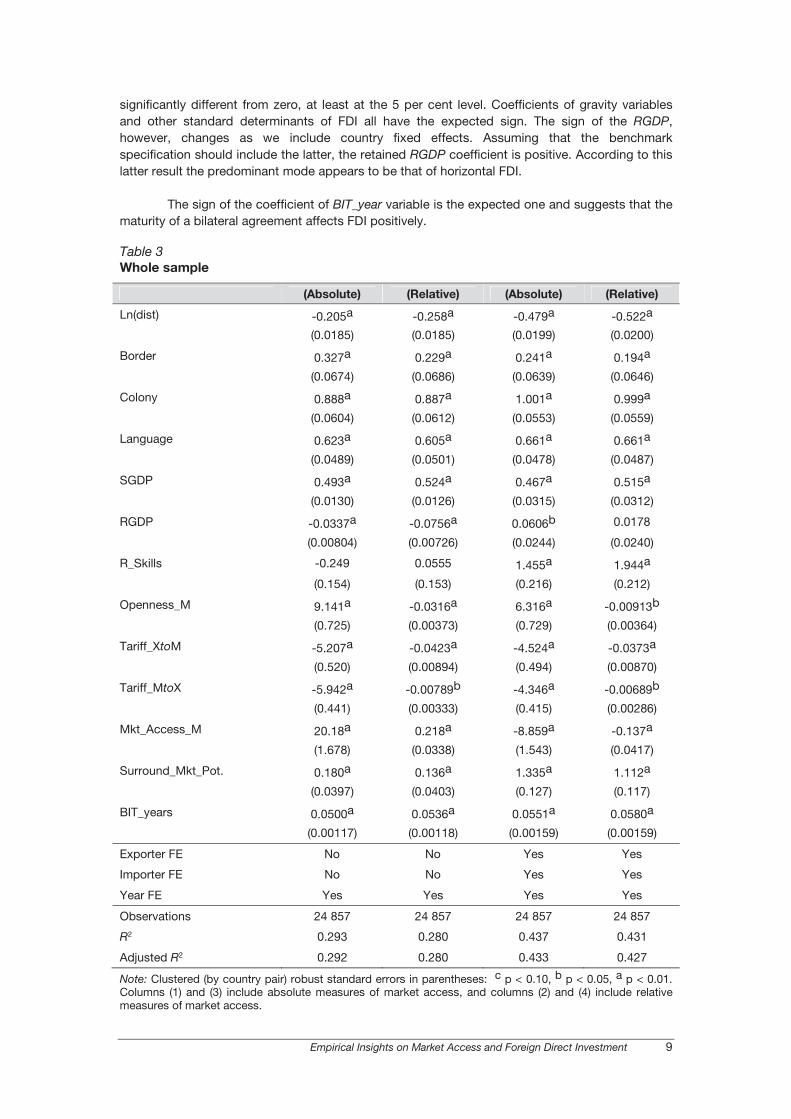
significantly different from zero, at least at the 5 per cent level. Coefficients of gravity variables
and other standard determinants of FDI all have the expected sign. The sign of the RGDP,
however, changes as we include country fixed effects. Assuming that the benchmark
specification should include the latter, the retained RGDP coefficient is positive. According to this
latter result the predominant mode appears to be that of horizontal FDI.
The sign of the coefficient of BIT_year variable is the expected one and suggests that the
maturity of a bilateral agreement affects FDI positively.
Table 3
Whole sample
(Absolute) (Relative) (Absolute) (Relative)
Ln(dist) -0.205a -0.258a -0.479a -0.522a
(0.0185) (0.0185) (0.0199) (0.0200)
Border 0.327a 0.229a 0.241a 0.194a
(0.0674) (0.0686) (0.0639) (0.0646)
Colony 0.888a 0.887a 1.001a 0.999a
(0.0604) (0.0612) (0.0553) (0.0559)
Language 0.623a 0.605a 0.661a 0.661a
(0.0489) (0.0501) (0.0478) (0.0487)
SGDP 0.493a 0.524a 0.467a 0.515a
(0.0130) (0.0126) (0.0315) (0.0312)
RGDP -0.0337a -0.0756a 0.0606b 0.0178
(0.00804) (0.00726) (0.0244) (0.0240)
R_Skills -0.249 0.0555 1.455a 1.944a
(0.154) (0.153) (0.216) (0.212)
Openness_M 9.141a -0.0316a 6.316a -0.00913b
(0.725) (0.00373) (0.729) (0.00364)
Tariff_XtoM -5.207a -0.0423a -4.524a -0.0373a
(0.520) (0.00894) (0.494) (0.00870)
Tariff_MtoX -5.942a -0.00789b -4.346a -0.00689b
(0.441) (0.00333) (0.415) (0.00286)
Mkt_Access_M 20.18a 0.218a -8.859a -0.137a
(1.678) (0.0338) (1.543) (0.0417)
Surround_Mkt_Pot. 0.180a 0.136a 1.335a 1.112a
(0.0397) (0.0403) (0.127) (0.117)
BIT_years 0.0500a 0.0536a 0.0551a 0.0580a
(0.00117) (0.00118) (0.00159) (0.00159)
Exporter FE No No Yes Yes
Importer FE No No Yes Yes
Year FE Yes Yes Yes Yes
Observations 24 857 24 857 24 857 24 857
R2 0.293 0.280 0.437 0.431
Adjusted R2 0.292 0.280 0.433 0.427
Note: Clustered (by country pair) robust standard errors in parentheses: c p < 0.10, b p < 0.05, a p < 0.01. Columns (1) and (3) include absolute measures of market access, and columns (2) and (4) include relative measures of market access.
10 POLICY ISSUES IN INTERNATIONAL TRADE AND COMMODITIES
Trade policy variables, whether they are introduced in their absolute (equation (1)) or
relative form (equation (2)), do generate similar results except for the trade openness variables.
The coefficient of the latter is positive when in its absolute version (j
ROWktariffavg _ ) and
negative when in its relative version (j
ROWktariffavgR __ ). According to table 3 mapping, the
former result remains somewhat puzzling although possibly consistent with any sort of FDI
strategy. The latter result is on the other hand in line with a complex-vertical FDI strategy. The
coefficient of the average tariff imposed by the FDI destination country on exports from the FDI
source country is always negative. This is also the case for the coefficient of the average tariff
imposed by the FDI source country on exports from the FDI destination country. These results are
compatible with any FDI form except horizontal FDI. Coefficients obtained for measures of market
access to the ROW of the FDI host country (j
kROWttariffavg _ and j
kROWttariffavgR __ ) and of
market potential (Surround_Mkt_Pot) suggest a similar qualitative impact on FDI. These findings
further point to the significant influence of export-platform motives in framing firms’ decisions to
invest abroad.
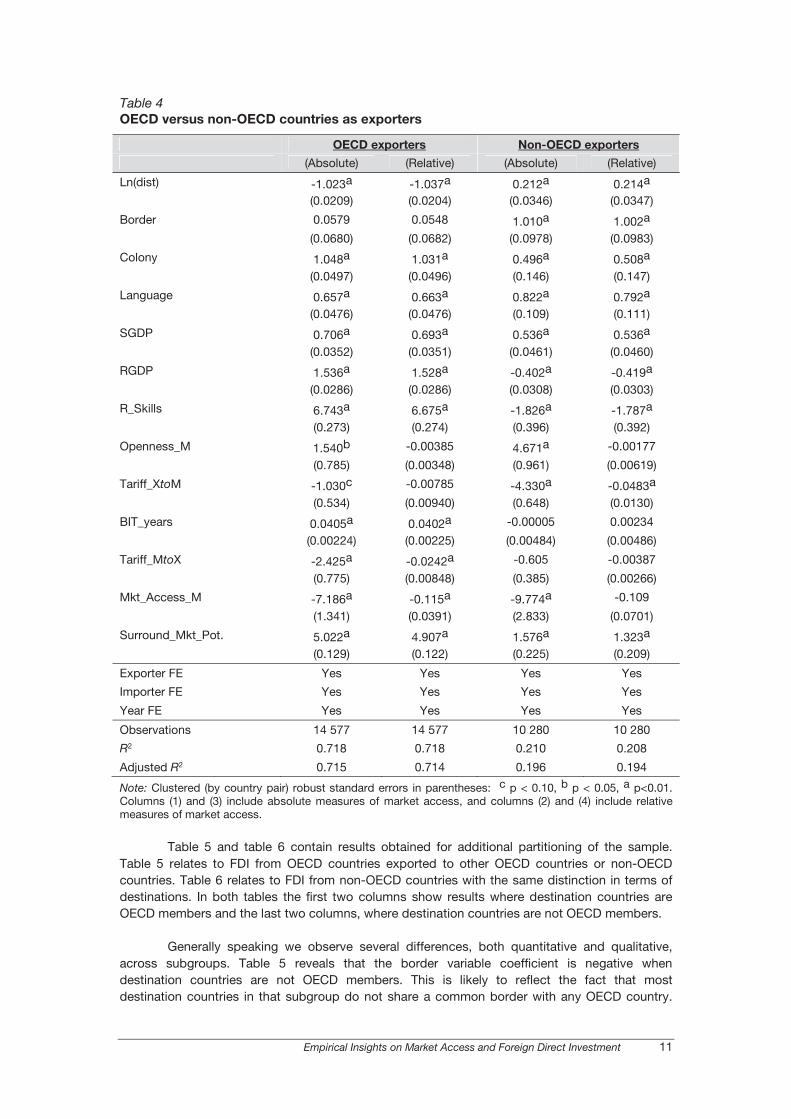
Results shown in table 4 are obtained for two subsamples. This is to account for the
possible issue of excessive pooling of countries.� In the wake of Bloningen et al. (2007), we
created several subsamples based on the OECD membership status of countries. We could
legitimately expect that motivations for FDI may differ across country types.
The first two columns of table 4 show results from specifications in which exporters are
exclusively OECD countries. Results obtained for this first subsample could be to a large extent
compared to those discussed in the literature. The last two columns report results referring to
non-OECD exporters. These are mostly novel results due to the very limited access to FDI data
for developing countries over a relatively long period of time. From a qualitative point of view, the
results are similar across subsamples and are in line with results obtained with the whole sample
except for two variables. Distance appears to affect FDI from non-OECD countries positively
while the impact is clearly negative for OECD countries. This may simply reflect a still high
concentration of FDI from non-OECD countries in OECD countries which are de facto relatively
further away than non-partner countries. Our measure of relative skills enters positively for OECD
exporting countries and negatively for non-OECD exporting countries. This could suggest that FDI
responds to essentially horizontal motives for OECD exporting countries and vertical motives for
non-OECD ones. However, as mentioned previously, interpretation remains mixed as these signs
could also be consistent with the FDI motivations of export platform or complex-vertical
strategies.
Quantitatively, results are often significantly different, with no particular pattern however.
Quantitative differences are important essentially for three variables. The border variable is not
significantly different from zero for OECD exporting countries, while it is positive and significant at
the 1 per cent level for non-OECD ones. The average tariff imposed on exports from the
destination country shows a negative coefficient in both subsamples. However, it is significant
only for OECD exporting countries. A comparable outcome is observed for the BIT_years variable.
Its coefficient is positive and significantly different from zero only for non-OECD countries. All in
all export-platform and complex-vertical strategies appear to be dominant even once we consider
OECD and non-OECD countries separately.
2 Results in Blonigen and Davies (2004) and Blonigen and Wang (2005) show substantial differences across samples of developed versus less-developed countries.
Empirical Insights on Market Access and Foreign Direct Investment 11
Table 4
OECD versus non-OECD countries as exporters
OECD exporters Non-OECD exporters
(Absolute) (Relative) (Absolute) (Relative)
Ln(dist) -1.023a -1.037a 0.212a 0.214a
(0.0209) (0.0204) (0.0346) (0.0347)
Border 0.0579 0.0548 1.010a 1.002a
(0.0680) (0.0682) (0.0978) (0.0983)
Colony 1.048a 1.031a 0.496a 0.508a
(0.0497) (0.0496) (0.146) (0.147)
Language 0.657a 0.663a 0.822a 0.792a
(0.0476) (0.0476) (0.109) (0.111)
SGDP 0.706a 0.693a 0.536a 0.536a
(0.0352) (0.0351) (0.0461) (0.0460)
RGDP 1.536a 1.528a -0.402a -0.419a
(0.0286) (0.0286) (0.0308) (0.0303)
R_Skills 6.743a 6.675a -1.826a -1.787a
(0.273) (0.274) (0.396) (0.392)
Openness_M 1.540b -0.00385 4.671a -0.00177
(0.785) (0.00348) (0.961) (0.00619)
Tariff_XtoM -1.030c -0.00785 -4.330a -0.0483a
(0.534) (0.00940) (0.648) (0.0130)
BIT_years 0.0405a 0.0402a -0.00005 0.00234
(0.00224) (0.00225) (0.00484) (0.00486)
Tariff_MtoX -2.425a -0.0242a -0.605 -0.00387
(0.775) (0.00848) (0.385) (0.00266)
Mkt_Access_M -7.186a -0.115a -9.774a -0.109
(1.341) (0.0391) (2.833) (0.0701)
Surround_Mkt_Pot. 5.022a 4.907a 1.576a 1.323a
(0.129) (0.122) (0.225) (0.209)
Exporter FE Yes Yes Yes Yes
Importer FE Yes Yes Yes Yes
Year FE Yes Yes Yes Yes
Observations 14 577 14 577 10 280 10 280
R2 0.718 0.718 0.210 0.208
Adjusted R2 0.715 0.714 0.196 0.194
Note: Clustered (by country pair) robust standard errors in parentheses: c p < 0.10, b p < 0.05, a p<0.01. Columns (1) and (3) include absolute measures of market access, and columns (2) and (4) include relative measures of market access.
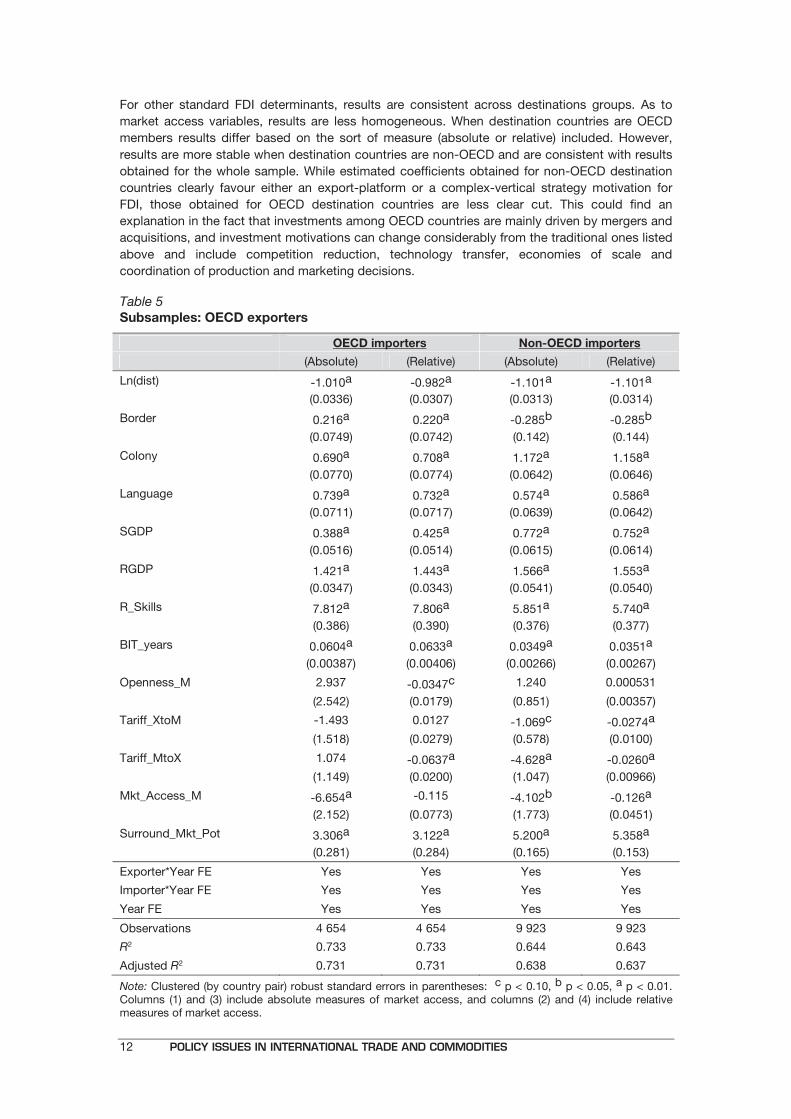
Table 5 and table 6 contain results obtained for additional partitioning of the sample.
Table 5 relates to FDI from OECD countries exported to other OECD countries or non-OECD
countries. Table 6 relates to FDI from non-OECD countries with the same distinction in terms of
destinations. In both tables the first two columns show results where destination countries are
OECD members and the last two columns, where destination countries are not OECD members.
Generally speaking we observe several differences, both quantitative and qualitative,
across subgroups. Table 5 reveals that the border variable coefficient is negative when
destination countries are not OECD members. This is likely to reflect the fact that most
destination countries in that subgroup do not share a common border with any OECD country.
12 POLICY ISSUES IN INTERNATIONAL TRADE AND COMMODITIES
For other standard FDI determinants, results are consistent across destinations groups. As to
market access variables, results are less homogeneous. When destination countries are OECD
members results differ based on the sort of measure (absolute or relative) included. However,
results are more stable when destination countries are non-OECD and are consistent with results
obtained for the whole sample. While estimated coefficients obtained for non-OECD destination
countries clearly favour either an export-platform or a complex-vertical strategy motivation for
FDI, those obtained for OECD destination countries are less clear cut. This could find an
explanation in the fact that investments among OECD countries are mainly driven by mergers and
acquisitions, and investment motivations can change considerably from the traditional ones listed
above and include competition reduction, technology transfer, economies of scale and
coordination of production and marketing decisions.
Table 5
Subsamples: OECD exporters
OECD importers Non-OECD importers
(Absolute) (Relative) (Absolute) (Relative)
Ln(dist) -1.010a -0.982a -1.101a -1.101a
(0.0336) (0.0307) (0.0313) (0.0314)
Border 0.216a 0.220a -0.285b -0.285b
(0.0749) (0.0742) (0.142) (0.144)
Colony 0.690a 0.708a 1.172a 1.158a
(0.0770) (0.0774) (0.0642) (0.0646)
Language 0.739a 0.732a 0.574a 0.586a
(0.0711) (0.0717) (0.0639) (0.0642)
SGDP 0.388a 0.425a 0.772a 0.752a
(0.0516) (0.0514) (0.0615) (0.0614)
RGDP 1.421a 1.443a 1.566a 1.553a
(0.0347) (0.0343) (0.0541) (0.0540)
R_Skills 7.812a 7.806a 5.851a 5.740a
(0.386) (0.390) (0.376) (0.377)
BIT_years 0.0604a 0.0633a 0.0349a 0.0351a
(0.00387) (0.00406) (0.00266) (0.00267)
Openness_M 2.937 -0.0347c 1.240 0.000531
(2.542) (0.0179) (0.851) (0.00357)
Tariff_XtoM -1.493 0.0127 -1.069c -0.0274a
(1.518) (0.0279) (0.578) (0.0100)
Tariff_MtoX 1.074 -0.0637a -4.628a -0.0260a
(1.149) (0.0200) (1.047) (0.00966)
Mkt_Access_M -6.654a -0.115 -4.102b -0.126a
(2.152) (0.0773) (1.773) (0.0451)
Surround_Mkt_Pot 3.306a 3.122a 5.200a 5.358a
(0.281) (0.284) (0.165) (0.153)
Exporter*Year FE Yes Yes Yes Yes
Importer*Year FE Yes Yes Yes Yes
Year FE Yes Yes Yes Yes
Observations 4 654 4 654 9 923 9 923
R2 0.733 0.733 0.644 0.643
Adjusted R2 0.731 0.731 0.638 0.637
Note: Clustered (by country pair) robust standard errors in parentheses: c p < 0.10, b p < 0.05, a p < 0.01. Columns (1) and (3) include absolute measures of market access, and columns (2) and (4) include relative measures of market access.
Empirical Insights on Market Access and Foreign Direct Investment 13
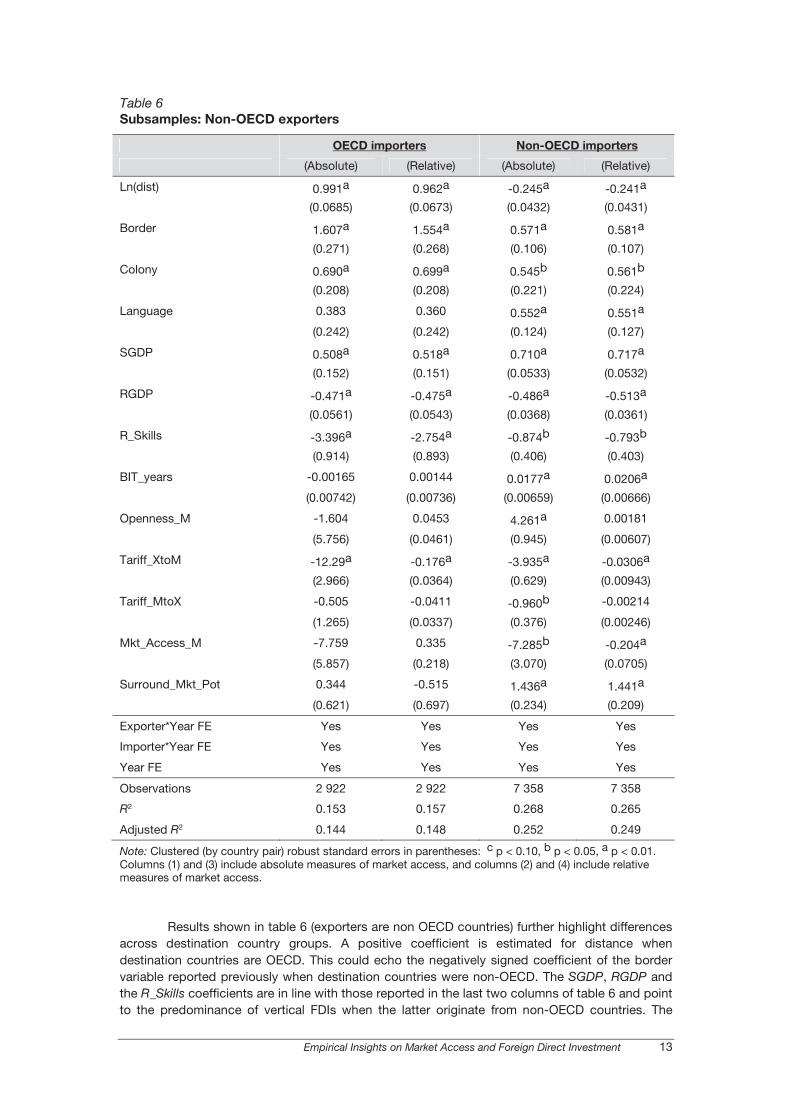
Table 6
Subsamples: Non-OECD exporters
OECD importers Non-OECD importers
(Absolute) (Relative) (Absolute) (Relative)
Ln(dist) 0.991a 0.962a -0.245a -0.241a
(0.0685) (0.0673) (0.0432) (0.0431)
Border 1.607a 1.554a 0.571a 0.581a
(0.271) (0.268) (0.106) (0.107)
Colony 0.690a 0.699a 0.545b 0.561b
(0.208) (0.208) (0.221) (0.224)
Language 0.383 0.360 0.552a 0.551a
(0.242) (0.242) (0.124) (0.127)
SGDP 0.508a 0.518a 0.710a 0.717a
(0.152) (0.151) (0.0533) (0.0532)
RGDP -0.471a -0.475a -0.486a -0.513a
(0.0561) (0.0543) (0.0368) (0.0361)
R_Skills -3.396a -2.754a -0.874b -0.793b
(0.914) (0.893) (0.406) (0.403)
BIT_years -0.00165 0.00144 0.0177a 0.0206a
(0.00742) (0.00736) (0.00659) (0.00666)
Openness_M -1.604 0.0453 4.261a 0.00181
(5.756) (0.0461) (0.945) (0.00607)
Tariff_XtoM -12.29a -0.176a -3.935a -0.0306a
(2.966) (0.0364) (0.629) (0.00943)
Tariff_MtoX -0.505 -0.0411 -0.960b -0.00214
(1.265) (0.0337) (0.376) (0.00246)
Mkt_Access_M -7.759 0.335 -7.285b -0.204a
(5.857) (0.218) (3.070) (0.0705)
Surround_Mkt_Pot 0.344 -0.515 1.436a 1.441a
(0.621) (0.697) (0.234) (0.209)
Exporter*Year FE Yes Yes Yes Yes
Importer*Year FE Yes Yes Yes Yes
Year FE Yes Yes Yes Yes
Observations 2 922 2 922 7 358 7 358
R2 0.153 0.157 0.268 0.265
Adjusted R2 0.144 0.148 0.252 0.249
Note: Clustered (by country pair) robust standard errors in parentheses: c p < 0.10, b p < 0.05, a p < 0.01. Columns (1) and (3) include absolute measures of market access, and columns (2) and (4) include relative measures of market access.
Results shown in table 6 (exporters are non OECD countries) further highlight differences
across destination country groups. A positive coefficient is estimated for distance when
destination countries are OECD. This could echo the negatively signed coefficient of the border
variable reported previously when destination countries were non-OECD. The SGDP, RGDP and
the R_Skills coefficients are in line with those reported in the last two columns of table 6 and point
to the predominance of vertical FDIs when the latter originate from non-OECD countries. The
14 POLICY ISSUES IN INTERNATIONAL TRADE AND COMMODITIES
latter interpretation would also be consistent with complex-vertical form. Results for market
access and openness suggest that the export-platform hypothesis and the complex-vertical form
hypothesis are verified only when destination countries are non-OECD. Indeed, better market
access and higher surrounding market potential are both found to increase FDIs when directed
towards non-OECD countries. In cases where partner countries are OECD, both variables are
found to have a nil impact. Also in the case of the BIT_years variable, its coefficient is significant
only for non-OECD destinations possibly pointing to the fact that non-OECD members are
associated with a higher investment risk than OECD members. The only coefficient which is
significant at least at the 5 per cent level across all subsamples is the one for the tariff applied on
exports from the FDI origin country directed to the host country. As in previous specifications, its
sign is negative. The latter result is compatible with all investment strategies but horizontal ones.
4.2. ROBUSTNESS
In order to test the robustness of our benchmark results, we estimated several additional
specifications. We considered in turn the inclusion of time trend variables, country pair fixed
effects, reformulated relative market access variables and a treatment of a possible selection
bias.
Time trend
We first follow Bloningen and al. (2007) by including a time trend plus its square in place
of year fixed effects. The results are similar to those obtained in our benchmark specifications of
table 3 and table 4.
Country pair fixed effects
We then consider country pair fixed effects instead of exporter and importer fixed effects
taken separately. On those remaining variables, meaning all non- bilateral or time varying ones,
the sign of the estimated coefficients is never affected. Levels change only marginally and
significance drops in only a few cases and never on variables related to market access.
Relative market access measures
We also test the empirical relevance of our relative measures of market access and
openness by taking the log of the ratio of the two components of each measure. Namely we use
���
����
�
++
jkt
wjkt
TTRI
T
1
1ln instead of ( )jkt
wjkt TTRIT − as our relative measure of either openness or
market access. The latter remains a satisfactory approximation of the former for small values of
both wjktT and jktTTRI . Again, signs of estimated coefficients are never reverted and significance
is maintained for all variables.
Selection bias
Recent developments in the literature have underlined the importance of accounting for
the selection bias induced by the structure of existing FDI data. As shown previously, there are
still few countries that are FDI exporters while there are a multitude of recipients. This could
reflect the fact that data are systematically missing. However, our country coverage is the most
3 See Eicher and al. (2012) for a comprehensive assessment utilizing Bayesian Model Averaging techniques.
Empirical Insights on Market Access and Foreign Direct Investment 15
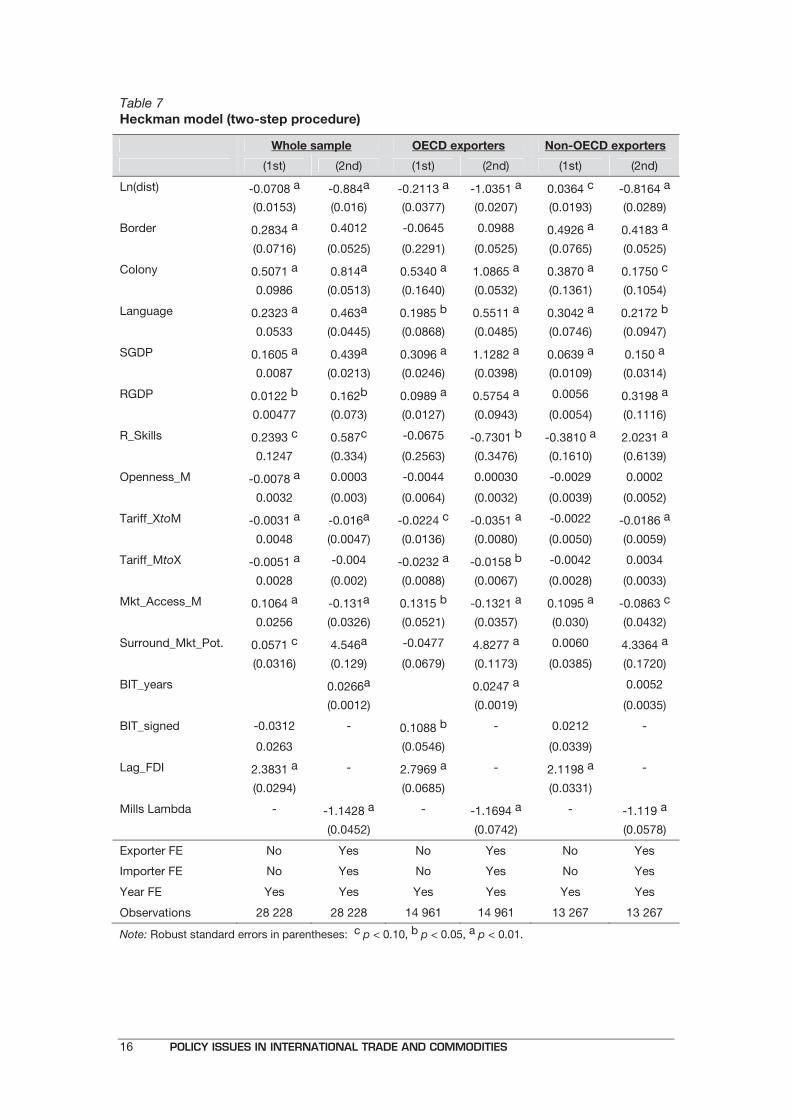
extensive one which is available. Then zeros are expected to reflect the non-profitability of FDI in
certain destinations. We adopt a standard Heckman selection methodology. The selected
regressors associated with the extensive margin of FDI are those retained for the intensive margin
except for the BIT_years variable. We include, however, a dummy variable indicating whether a
BIT has been signed and implemented. We believe the latter variable is more likely to explain
dynamics of the extensive margin than the BIT_years variable which better reflects the investment
risk associated with a specific destination. As such the signature variable can be considered as
our first exclusion restriction. We further include the exclusion restriction suggested in previous
work such as Razin et al. (2008) that is a dummy variable indicating whether there was FDI in the
previous year. Results are reported in table 7. We reported results obtained using the relative
version of openness and market access measures. When considering only significant estimates at
least at the 10 per cent levels some patterns in results can be identified. First of all, the inverse
Mill’s ratio variable is always highly significant implying that selection could play a significant role
in determining the impact of variables to explain the intensive margin of FDI. When considering
our exclusion restrictions, only the dummy variable for the existence of past FDI is found to affect
systematically and in the expected way the decision to invest. The dummy variable for the
existence of an implemented BIT enters significantly, and with the expected sign, into the first
step estimation for the OECD subsample only. Having a BIT in place with a given country does
affect positively the probability of investing there.
We also observe that coefficients of variables included in both estimation steps generally
keep the same sign across steps. There are few exceptions, such as distance and relative skills,
when exporters are from non-OECD countries and market access of the importing country in all
samples. Distance is found to affect positively the probability of investing abroad for exporters
from non-OECD countries. The explanation could be similar to the one provided for the positive
coefficient found in table 4 and referring to the same group of exporters. However, the
corresponding coefficient in the second step estimation is now negative and this is in contrast
with table 4 findings. Results for the relative skills variable suggest that the probability of investing
abroad decreases with the skills differential but that once investment has occurred its intensity
increases with the skills differential. Surrounding market access conditions have contrasting
effects on FDI margins. Better conditions affect FDI positively at its intensive margin but
negatively at its extensive margin. We cannot find any convincing explanation for the latter
results. Estimated coefficients of other market access and openness measures, when significant,
are in line with our benchmark results and there is no opposition between the extensive and
intensive margins of FDI.
As in the case of distance for non-OECD exporting countries, controlling for selection
could revert some of the results found in our benchmark estimations for the intensive margin of
FDI. The skills differential now affects the intensive margin of FDI negatively for OECD countries
and positively for that of non-OECD countries. The RGDP variable is now found to affect the level
of FDI positively for non-OECD exporting countries, privileging a horizontal mode of investment
instead of a vertical mode as shown in table 4.
16 POLICY ISSUES IN INTERNATIONAL TRADE AND COMMODITIES
Table 7
Heckman model (two-step procedure)
Whole sample OECD exporters Non-OECD exporters
(1st) (2nd) (1st) (2nd) (1st) (2nd)
Ln(dist) -0.0708 a -0.884a -0.2113 a -1.0351 a 0.0364 c -0.8164 a
(0.0153) (0.016) (0.0377) (0.0207) (0.0193) (0.0289)
Border 0.2834 a 0.4012 -0.0645 0.0988 0.4926 a 0.4183 a
(0.0716) (0.0525) (0.2291) (0.0525) (0.0765) (0.0525)
Colony 0.5071 a 0.814a 0.5340 a 1.0865 a 0.3870 a 0.1750 c
0.0986 (0.0513) (0.1640) (0.0532) (0.1361) (0.1054)
Language 0.2323 a 0.463a 0.1985 b 0.5511 a 0.3042 a 0.2172 b
0.0533 (0.0445) (0.0868) (0.0485) (0.0746) (0.0947)
SGDP 0.1605 a 0.439a 0.3096 a 1.1282 a 0.0639 a 0.150 a
0.0087 (0.0213) (0.0246) (0.0398) (0.0109) (0.0314)
RGDP 0.0122 b 0.162b 0.0989 a 0.5754 a 0.0056 0.3198 a
0.00477 (0.073) (0.0127) (0.0943) (0.0054) (0.1116)
R_Skills 0.2393 c 0.587c -0.0675 -0.7301 b -0.3810 a 2.0231 a
0.1247 (0.334) (0.2563) (0.3476) (0.1610) (0.6139)
Openness_M -0.0078 a 0.0003 -0.0044 0.00030 -0.0029 0.0002
0.0032 (0.003) (0.0064) (0.0032) (0.0039) (0.0052)
Tariff_XtoM -0.0031 a -0.016a -0.0224 c -0.0351 a -0.0022 -0.0186 a
0.0048 (0.0047) (0.0136) (0.0080) (0.0050) (0.0059)
Tariff_MtoX -0.0051 a -0.004 -0.0232 a -0.0158 b -0.0042 0.0034
0.0028 (0.002) (0.0088) (0.0067) (0.0028) (0.0033)
Mkt_Access_M 0.1064 a -0.131a 0.1315 b -0.1321 a 0.1095 a -0.0863 c
0.0256 (0.0326) (0.0521) (0.0357) (0.030) (0.0432)
Surround_Mkt_Pot. 0.0571 c 4.546a -0.0477 4.8277 a 0.0060 4.3364 a
(0.0316) (0.129) (0.0679) (0.1173) (0.0385) (0.1720)
BIT_years 0.0266a 0.0247 a 0.0052
(0.0012) (0.0019) (0.0035)
BIT_signed -0.0312 - 0.1088 b - 0.0212 -
0.0263 (0.0546) (0.0339)
Lag_FDI 2.3831 a - 2.7969 a - 2.1198 a -
(0.0294) (0.0685) (0.0331)
Mills Lambda - -1.1428 a - -1.1694 a - -1.119 a
(0.0452) (0.0742) (0.0578)
Exporter FE No Yes No Yes No Yes
Importer FE No Yes No Yes No Yes
Year FE Yes Yes Yes Yes Yes Yes
Observations 28 228 28 228 14 961 14 961 13 267 13 267
Note: Robust standard errors in parentheses: c p < 0.10, b p < 0.05, a p < 0.01.
Empirical Insights on Market Access and Foreign Direct Investment 17
5. CONCLUSIONS
This paper investigates empirically the importance of tariff-driven market access for FDI.
We consider both absolute and relative measures of market access. The use of relative measures
accounts for the influence of bilateral trade agreements on the access in effective terms that
trading partners have to each other’s market. Moreover they also account for the access the rest
of the world market has to the host market and vice versa. Over the last fifteen years, market
access conditions have increasingly been affected by bilateral trade agreements.
The empirical strategy we implement allows us to have a more comprehensive measure
of the effects of third countries on bilateral FDI and to verify the relative relevance of various FDI
theories.
Results are broadly in line with previous literature and coefficients show the expected
signs: bilateral FDI increases in the joint market size and in their difference, with the exception of
subsamples where source and host countries are relatively similar. The consolidation of the
bilateral relationship, captured by the years since the signature of the bilateral investment treaty,
enters positively in the regression, indicating a positive effect on the investment stocks. The
surrounding market potential variable always enters positively in the regression highlighting the
importance of location in the decisions of multinational enterprises. The market access of FDI-
receiving countries seems to be important for multinationals headquartered in OECD countries,
with the exception of across OECD investments where most probably market access is already
very high. This lends support to a tariff-jumping motive and is consistent with most literature on
developed economies and the prevalence among them of horizontal FDI. On the contrary, parent
market access is significant whenever the source country is non-OECD suggesting that emerging
investors export goods back to the home country. This can be the case of developing economies
investing in technology, know-how, natural resources or brand names abroad to better supply not
only domestic but also third markets. In fact, corporations based in non-OECD countries seem to
value most the host economy’s access to third countries. Surprisingly, especially when
considering investments targeting developed markets, estimates for non-OECD investors are
consistent with export-platform motives.
Our results thus suggest that both the location and the form of FDI can be influenced by
trade policy decisions. This is at least what has been observed over the last two decades.
18 POLICY ISSUES IN INTERNATIONAL TRADE AND COMMODITIES
REFERENCES
�Anderson JE and Neary P (1994). Measuring the restrictiveness of trade policies. World Bank
Economic Review. 8(2):151–169.
Anderson JE and Neary P (2003). The mercantilist index of trade policy. International Economic
Review. 44(2):627–649.
Anderson JE and Neary P (2005). Measuring Trade Restrictiveness of Trade Policy. MIT Press. Cambridge, Massachusetts.
Anderson JE and van Wincoop E (2003). Gravity with gravitas: A solution to the border puzzle.
American Economic Review. 93(1):70–192.
Baltagi BH, Egger P and Pfaffermayr M (2007). Estimating models of complex FDI: Are there third
country effects? Journal of Econometrics. 140:260–281.
Baltagi BH, Egger P and Pfaffermayr M (2008). Estimating regional trade agreement effects on FDI in an interdependent world. Journal of Econometrics. 145:194–208.
Bergstrand JH and Egger P (2007). A knowledge-and-physical-capital model of international trade
flows, foreign direct investment, and multinational enterprises. Journal of International
Economics. 73:278–308.
Bergstrand JH and Egger P (2010). A general equilibrium theory for estimating gravity equations
of bilateral FDI, final goods trade, and intermediate trade flows. In: Brakman, S. and P. V. Bergijk, eds. The Gravity Model in International Trade: Advances and Applications.
Cambridge University Press, Cambridge: 29–70.
Blonigen BA, Davies RB, Waddell G and Naughton H (2007). FDI in space. Spatial autoregressive relationships in foreign direct investment. European Economic Review 51 (5), 1303–
1325. Blonigen BA, Davies RB, Naughton HT, Waddell GR (2008). Spacey parents: Spatial
autoregressive patterns in inbound FDI. In: Brakman S, Garretsen H, eds. Foreign Direct Investment and the Multinational Enterprise. The MIT Press. Cambridge,
Massachusetts: 173–198.
Blonigen BA and Davies RB (2004). The effects of bilateral tax treaties on United States FDI activity. International Tax and Public Finance. 11(5):601–622.
Blonigen BA and Wang M (2005). Inappropriate pooling of wealthy and poor countries in empirical
FDI studies. In: Moran T, Graham E and Blomstrom M, eds. Does Foreign Direct
Investment Promote Development? Institute for International Economics. Washington,
D.C. Carrère C, de Melo J and Tumurchudur B (2008). Disentangling market access effects for ASEAN
members under an ASEAN-EU FTA. Discussion Paper No. 6762. CEPR. Carr DL, Markusen JR and Maskus KE (2001). Estimating the knowledge-capital model of the
multinational enterprise. American Economic Review. 91(3): 693–708.
Eicher TS, Helfman L and Lenkoski A (2012). Robust FDI determinants: Bayesian Model Averaging in the presence of selection bias. Journal of Macroeconomics. 34(3):637–
651. Ekholm K, Forslid R and Markusen JR (2007). Export-platform foreign direct investment. Journal
of European Economic Association. 5:776–795.
Empirical Insights on Market Access and Foreign Direct Investment 19
Feenstra R (1995). Estimating the effects of trade policy. In: Grossman G and Rogoff K, eds. Handbook of International Economics. 3. Elsevier, Amsterdam.
Fugazza M and Nicita A (2013). The direct and relative effects of preferential market access.
Journal of International Economics. 89(2): 357–368.
Head K and Mayer T (2004). Market potential and the location of Japanese investment in the European Union. Review of Economics and Statistics. 86(4): 959–972.
Helpman E (1984). A simple theory of international trade with multinational corporations. Journal
of Political Economy. 92(3):451–471.
Helpman E, Melitz MJ and Yeaple SR (2004). Export versus FDI with heterogeneous firms. American Economic Review. 94:300–316.
Low P, Piermartini R and Richtering J (2009). Multilateral solutions to the erosion of non-
reciprocal preferences in NAMA. In: Hoekman B, Martin W and Braga C, eds. Trade
Preference Erosion Measurement and Policy Response. Palgrave MacMillan.
Motta M and Norman G (1996). Does economic integration cause foreign direct investment?
International Economic Review. 37:757–783.
Neary JP (2002). Foreign direct investment and the single market. The Manchester School.
70:291–314.
Neary JP (2008). Trade costs and foreign direct investment. International Review of Economics and Finance. 18:207–218.
Raff H (2004). Preferential trade agreements and tax competition for foreign direct investment.
Journal of Public Economics. 88:2745–2763.
UNCTAD (2013). World Investment Report 2013. New York and Geneva.
Yeaple SR (2003). The complex integration strategies of multinational firms and cross-country dependencies in the structure of foreign direct investment. Journal of International
Economics. 60:293–314.

Empirical Insights on Market Access and Foreign Direct Investment 21
UNCTAD study series on
POLICY ISSUES IN INTERNATIONAL TRADE AND COMMODITIES
No. 30 Sam Laird, David Vanzetti and Santiago Fernández de Córdoba, Smoke and
mirrors: Making sense of the WTO industrial tariff negotiations, 2006, Sales No. E.05.II.D.16.
No. 31 David Vanzetti, Santiago Fernandez de Córdoba and Veronica Chau, Banana split:
How EU policies divide global producers, 2005, 27 p. Sales No. E.05.II.D.17. No. 32 Ralf Peters, Roadblock to reform: The persistence of agricultural export
subsidies, 2006, 43 p. Sales No. E.05.II.D.18. No. 33 Marco Fugazza and David Vanzetti, A South–South survival strategy: The
potential for trade among developing countries, 2006, 25 p. No. 34 Andrew Cornford, The global implementation of Basel II: Prospects and
outstanding problems, 2006, 30 p. No. 35 Lakshmi Puri, IBSA: An emerging trinity in the new geography of international
trade, 2007, 50 p. No. 36 Craig VanGrasstek, The challenges of trade policymaking: Analysis,
communication and representation, 2008, 45 p. No. 37 Sudip Ranjan Basu, A new way to link development to institutions, policies and
geography, 2008, 50 p. No. 38 Marco Fugazza and Jean-Christophe Maur, Non-tariff barriers in computable
general equilibrium modelling, 2008, 25 p. No. 39 Alberto Portugal-Perez, The costs of rules of origin in apparel: African
preferential exports to the United States and the European Union, 2008, 35 p. No. 40 Bailey Klinger, Is South–South trade a testing ground for structural
transformation?, 2009, 30 p. No. 41 Sudip Ranjan Basu, Victor Ognivtsev and Miho Shirotori, Building trade-relating
institutions and WTO accession, 2009, 50 p. No. 42 Sudip Ranjan Basu and Monica Das, Institution and development revisited: A
nonparametric approach, 2010, 26 p. No. 43 Marco Fugazza and Norbert Fiess, Trade liberalization and informality: New
stylized facts, 2010, 45 p.

22 POLICY ISSUES IN INTERNATIONAL TRADE AND COMMODITIES
No. 44 Miho Shirotori, Bolormaa Tumurchudur and Olivier Cadot, Revealed factor
intensity indices at the product level, 2010, 55 p.
No. 45 Marco Fugazza and Patrick Conway, The impact of removal of ATC Quotas on international trade in textiles and apparel, 2010, 50 p.
No. 46 Marco Fugazza and Ana Cristina Molina, On the determinants of exports
survival, 2011, 40 p. No. 47 Alessandro Nicita, Measuring the relative strength of preferential market
access, 2011, 30 p. No. 48 Sudip Ranjan Basu and Monica Das, Export structure and economic
performance in developing countries: Evidence from nonparametric methodology, 2011, 58 p.
No. 49 Alessandro Nicita and Bolormaa Tumurchudur-Klok, New and traditional trade
flows and the economic crisis, 2011, 22 p. No. 50 Marco Fugazza and Alessandro Nicita, On the importance of market access for
trade, 2011, 35 p. No. 51 Marco Fugazza and Frédéric Robert-Nicoud, The ‘Emulator Effect’ of the
Uruguay round on United States regionalism, 2011, 45 p. No. 52 Sudip Ranjan Basu, Hiroaki Kuwahara and Fabien Dumesnil, Evolution of non-
tariff measures: Emerging cases from selected developing countries, 2012, 38p. No. 53 Alessandro Nicita and Julien Gourdon, A preliminary analysis on newly collected
data on non-tariff measures, 2013, 31 p. No. 54 Alessandro Nicita, Miho Shirotori and Bolormaa Tumurchudur Klok, Survival
analysis of the exports of least developed countries: The role of comparative advantage, 2013, 25 p.
No. 55 Alessandro Nicita, Victor Ognivtsev and Miho Shirotori, Global supply chains:
Trade and Economic policies for developing countries, 2013, 33 p. No. 56 Alessandro Nicita, Exchange rates, international trade and trade policies, 2013,
29 p. No. 57 Marco Fugazza, The economics behind non-tariff measures: Theoretical
insights and empirical evidence, 2013, 33 p. No. 58 Marco Fugazza and Alain McLaren, Market access, export performance and
survival: Evidence from Peruvian firms, 2013, 39 p. No. 59 Patrick Conway, Marco Fugazza and M. Kerem Yuksel, Turkish enterprise-level
response to foreign trade liberalization: The removal of agreements on textiles and clothing quotas, 2013, 54 p.
No. 60 Alessandro Nicita and Valentina Rollo, Tariff preferences as a determinant for
exports from Sub-Saharan Africa, 2013, 30 p.
Empirical Insights on Market Access and Foreign Direct Investment 23
No. 61 Marco Fugazza, Jan Hoffmann and Rado Razafinombana, Building a dataset for
bilateral maritime connectivity, 2013, 31 p. No. 62 Alessandro Nicita, Marcelo Olarreaga and Peri Silva, Cooperation in the tariff
waters of the World Trade Organization, 2014, 39 p. No. 63 Marco Fugazza and Claudia Trentini, Empirical insights on market access and
foreign direct investment, 2014, 33 p.
Copies of UNCTAD study series on Policy Issues in International Trade and Commodities may be obtained from the Publications Assistant, Trade Analysis Branch, Division on International Trade in Goods and Services, and Commodities, United Nations Conference on Trade and Development, Palais des Nations, CH-1211 Geneva 10, Switzerland (Tel: +41 22 917 4644). These studies are accessible at http://unctad.org/tab.


Since 1999, the Trade Analysis Branch of the Division on International Trade in Goods and Services, and Commodities of UNCTAD has been carrying out policy-oriented analytical work aimed at improving the understanding of current and emerging issues in international trade and development. In order to improve the quality of the work of the Branch, it would be useful to receive the views of readers on this and other similar publications. It would therefore be greatly appreciated if you could complete the following questionnaire and return to:
Trade Analysis Branch, DITCRm. E-8065
United Nations Conference on Trade and Development�������������� ������������ �������������� �
(Fax: +41 22 917 0044; E-mail: [email protected])
1. Name and address of respondent (optional):
2. Which of the following describes your area of work?
Government Public enterprise Private enterprise institution Academic or research International organization Media� ���������������� ������ � � � ����������������������������������
��� � ���������� ���������������!�������������������������������������������
"�� #������� ��������$%������ �����������&���������%� ��������'������ ��������*�+%����� to your work?
5. What is your assessment of the contents of this publication? Excellent Good Adequate Poor
/�� ��������''� ��0��
QUESTIONNAIRE
UNCTAD Study series on
POLICY ISSUES IN INTERNATIONAL TRADEAND COMMODITIES
(Study series no. 63: Empirical insights on market accessand foreign direct investment)
Readership Survey

Printed at United Nations,Printed at United Nations, GenevaGenevaGE.14-50211 – March 2014 – 248GE.14-50211 – March 2014 – 248
UNCTUNCTAD/ITCD/TAD/ITCD/TAB/67AB/67
United Nations publicationUnited Nations publicationISSN 1607-8291ISSN 1607-8291