Embed Size (px)
Citation preview

Emission of suspended PM10 from laboratory-scale coal combustion
and its correlation with coal mineral properties
Lian Zhang, Yoshihiko Ninomiya *
Department of Applied Chemistry, College of Engineering, Chubu University, 1200 Matsumoto-cho, Kasugai, 487-8501 Aichi, Japan
Received 10 October 2004; received in revised form 29 November 2004; accepted 28 March 2005
Available online 15 September 2005
Abstract
Four pulverized coals were subjected to combustion in a laboratory-scale drop tube furnace to investigate the emission of suspended particulate
matter smaller than 10 mm (PM10) and to study the correlation of PM10 emission with mineral properties of the coals. Combustion conditions of
1200 8C, 2.4 s and 20% atmospheric oxygen content were used and all the carbon was consumed under given conditions. The properties of PM10
were studied including its concentration, particle size distribution and elemental composition. Two typical sizes were also subjected to Computer
controlled scanning electron microscopy (CCSEM) analysis for determination of chemical species within them. To investigate the influence of
coal mineral properties, the metallic elements in the raw coals were divided into three parts: organically bound, included inorganic particles and
excluded ones. The results indicated that during coal combustion, about 0.5–2.5 wt% of inherent minerals changed into the suspended PM10. With
an increase in the coal ash content, the concentration of PM10 increased proportionally. The resulting PM10 had a bimodal size distribution with
two peaks around 2.5 and 0.06 mm, respectively. SiO2 and Al2O3 dominated the large mode around 2.5 mm, which is formed by the direct
transformation of inherent minerals. On the other hand, SO3 and P2O5 were prevalent in the small mode around 0.06 mm, which is formed by
vaporization of these two elements. For other metals found in PM10, the refractory metals were enriched in the large mode, with concentrations
proportional to their content in the excluded minerals in the raw coal. Volatile metals were however enriched in the small mode since, they react
with gaseous SO2 and P2O5 to form sulfates and phosphates in the solid phase. The study showed that experimental observations agree with
thermodynamic equilibrium considerations.
q 2005 Elsevier Ltd. All rights reserved.
Keywords: Coal combustion; PM10; Coal mineral properties; Direct transformation; Vaporization
1. Introduction
The emission of PM10, particulates less than 10.0 (m in
diameter, is one of the major sources of pollution from the
combustion of coal [1]. Over the past few decades, standards
for control of PM10 have become progressively stringent [2].
Even so, there are still many fine particulates that elude control
devices and are emitted into the atmosphere [1]. This is a major
motivation for studies on the formation of coal combustion-
derived PM10 as well as their control.
Many studies have been carried out to investigate the
formation of PM10 from both fundamental and practical
points of view. In principle, PM10 are formed from changes
in inherent metallic elements during coal combustion. In
coal, a portion of inherent metallic elements has diameters
0016-2361/$ - see front matter q 2005 Elsevier Ltd. All rights reserved.
doi:10.1016/j.fuel.2005.03.034
* Corresponding author. Tel.: C81 568 51 9178; fax: C81 568 51 1499.
E-mail address: [email protected] (Y. Ninomiya).
smaller than 10.0 mm, which may directly transfer into PM10
without any chemical or physical changes. In addition, a
portion may undergo fragmentation to form fine particulates
as well, especially for refractory elements. This is termed as
the solid-to-particulate pathway governing the formation of
particulates larger than 1.0 mm [3–5]. On the other hand,
volatile metals initially undergo vaporization in the
combustion flame; the vapors produced subsequently
undergo nucleation, condensation, deposition and agglom-
eration to form particulates smaller than 1.0 mm; this is a
solid–vapor-particulate pathway [3–8]. This portion is toxic
because of the prevalence of heavy metals within the
particulates.
In addition to investigating the formation mechanisms,
parametric studies have been carried out to investigate the
influence of several factors affecting PM10 formation. Coal
combustion devices were thought to be paramount. The air
ratio, coal rank, and particle size of coal were of concern as
well. Coal combustion devices affect coal conversion
greatly. The higher the carbon conversion, the lower is the
Fuel 85 (2006) 194–203
www.fuelfirst.com

Table 1
Properties of the four coals used in this study
Ultimate analysis, daf, (wt%)
C H N SCOa
YZHS 77.85 1.75 1.60 18.80
YZLS 79.64 4.62 1.05 14.69
Baotou 77.05 4.82 1.25 16.88
Wangfg 88.52 5.47 2.22 3.79
Proximate analysis, as received, (wt%)
Ash Moisture Volatile Fixed carbona
YZHS 12.43 0.40 41.10 46.07
YZLS 7.29 4.01 34.00 54.70
Baotou 6.43 1.75 35.30 56.52
Wangfg 8.23 0.71 28.86 62.20
a By difference.
Table 2
Ash composition, wt% on basis of total ash
YZHS YZLS BT WFG
SiO2 11.98 27.91 32.88 34.07
Al2O3 5.77 11.14 6.71 17.24
Fe2O3 27.50 27.11 28.95 16.43
CaO 15.63 5.83 13.72 4.90
K2O 0.43 1.80 2.23 1.76
Na2O 0.17 0.29 0.68 0.71
TiO2 0.80 1.80 1.51 6.71
SO3 35.91 21.29 11.11 15.73
MgO 0.36 0.46 0.81 0.36
Cl 0.40 0.30 0.30 0.48
BaO 0.38 0.00 0.00 0.00
P2O5 0.14 1.21 0.29 0.47
MnO 0.22 0.29 0.44 0.21
ZrO2 0.13 0.26 0.00 0.29
CuO 0.08 0.08 0.13 0.24
ZnO 0.06 0.09 0.10 0.23
NiO 0.04 0.14 0.14 0.15
L. Zhang, Y. Ninomiya / Fuel 85 (2006) 194–203 195
PM10 concentration in the exhaust gas because less soot is
formed [9]. With increasing oxygen pressure, more of the
inherent metals directly transfer or vaporize to form PM10
[10,11]. Coal rank affects the distribution of inherent
minerals within as well as carbon conversion in combustion.
Accordingly, PM10 formation is affected as well [12].
Moreover, our previous study suggests that with decreasing
coal particle size, more of the inherent minerals change
into excluded particles, which preferentially transform into
PM10 [13].
There are still several little-understood mechanisms for
PM10 formation. Among them, the influence of coal properties,
especially its mineralogical composition, has not been
elucidated. Few studies have taken the heterogeneity of coal
minerals into account. Correspondingly, there is still a lack of
accurate guidelines for the selection of coal to minimize its
PM10 emission in industrial plants. Furthermore, the bulk
properties of PM10 have been studied until now whereas few
studies have given attention to its heterogeneity. A different
route, as discussed before, governs the formation of coarse
particles and fine/ultrafine particles. Accordingly, the sources
for the formation of different portions of PM10 must originate at
different parts of raw coal.
The present paper aims to link the formation of
suspended PM10 with the mineral properties of coal. PM10
was segregated into several groups according to elemental
composition. The coal mineral composition was analyzed by
several procedures to elucidate its heterogeneity: chemical
fractionation was conducted to quantify the contents of
organically bound elements in raw coals. Computer
controlled scanning electron microscopy (CCSEM) was
used to quantitatively determine the particle size distribution
and association of inorganic minerals in the coals. The
association of inorganic minerals is defined as included
particles existing in the carbonaceous matrix and excluded
particles not associated with the carbonaceous matrix [14].
The formation of each group of PM10 was linked with
different parts of inherent minerals quantified by the above-
mentioned analysis procedure. CCSEM speciation on two
sizes of PM10 and thermodynamic equilibrium calculations
were also conducted to further elucidate the relationship
between coal mineral properties and PM10 formation.
2. Experimental
2.1. Coal properties
Four Chinese coals, Yanzhou high-sulfur (YZHS), Yanzhou
low-sulfur (YZLS), Baotou (BT) and Wangfg (WFG), were
used in the investigation. The coals were ground to smaller
than 125 mm and dried overnight, prior to use. Their properties
are listed in Table 1. Clearly, the four coals have different
compositions with the ash content ranging from 6.43 wt% in
BT coal to 12.43 wt% in YZHS coal. The contents of the
volatile matter and fixed carbon vary greatly with the coal type.
The low-temperature ashing (LTA) ash compositions,
measured by X-ray fluorescence (XRF), are shown in
Table 2. The data further indicates the broad variation of the
coals selected for this study. SiO2 and Al2O3 are the most
prevalent oxides. The contents of the other major oxides,
including CaO, Fe2O3, SO3, P2O5, K2O and Na2O, however
vary greatly with coal type. Finally, the distributions of the
inherent minerals are listed in Table 3 for the four coals. The
percentage of organically bound metals was determined by
extracting raw coals with a solution of 1 M ammonia acetate.
Analysis of SEM images, obtained from CCSEM measure-
ments, was used for quantifying the included and excluded
inorganic minerals. It is noteworthy that the organically bound
metals are salts of organic acids in the raw coals. Thus, they are
too small to be detected by CCSEM due to the limitations of the
CCSEM. The included inorganic metals analyzed by CCSEM
are larger than 0.5 mm.
The mineral distribution varies greatly with the coal type.
YZHS coal has the greatest amount of organically bound
metals, the majority of which is sulfur. On the other hand,
WFG coal has the lowest amount of organically bound metals,
but a relatively large amount of included minerals, further
suggesting different particle size distributions of the minerals
in these coals.

Table 3
Distribution of inherent minerals in the four coals
Coal Total ash
(wt%)
Organically
bound (wt%)
Inorganic minerals (wt%)
Included Excluded
YZHS 12.43 4.97 0.96 6.50
YZLS 7.29 2.16 2.52 2.61
BT 6.43 3.91 0.40 2.11
WFG 8.23 1.25 2.72 4.26
0.5
0.6
0.7
g/g_
ash
YZHS YZLS BT WFG
L. Zhang, Y. Ninomiya / Fuel 85 (2006) 194–203196
2.2. Coal combustion procedure and collection of suspended
PM10
Coal combustion was carried out in a laboratory-scale drop
tube furnace, whose configuration and combustion procedure
have been described in detail elsewhere [15]. The reaction
temperature was maintained at 1200 8C, and the residence time
of gas in the furnace was 2.4 s for all runs. Coal was fed at
about 0.3 g/min into the furnace. An oxidizing atmosphere,
with 20% O2 and N2 being the balance, was used. All the coals
were burnt completely under these conditions.
The exiting gas, containing the solid products, was
initially quenched with N2 and collected by a water-cooling
probe. Subsequently, coarse ash particles were collected by a
cyclone. Meanwhile, the suspension of ultrafine particles
was further diluted with air, and immediately directed to a
Low-Pressure-Impactor (LPI) for size-segregated collection.
The LPI used here is composed of 13 stages having
aerodynamic cut-off diameters ranging from 0.03 to
12.1 mm. Each stage is composed of a filter above a
substrate and a substrate holder. The pressure after the final
stage is approximately 73.3 kPa.
The cut-off sizes of both the cyclone and the first stage of
LPI are noteworthy. The cyclone has a cut-off size of around
10.0 mm, which indicates that it collects the majority of coarse
particles having a sizeR10.0 mm. Meanwhile, a few of the finer
particles, smaller than 10.0 mm, were also collected by it. On
the other hand, the first stage of LPI collected particles around
its cut-off size of 12.1 mm. These collected particles were
added to those collected by the cyclone to form the total coarse
ash with a sizeR10.0 mm. In the present study, suspended
PM10 is defined as those particles collected by the other stages
of the LPI having a cut-off size smaller than 10.0 mm. The fine
particles collected by the cyclone were however ignored.
0.01 0.1 1 100.0
0.1
0.2
0.3
0.4
Con
cent
ratio
n, µ
Diameter, µm
Fig. 1. Particle size distribution of PM10 emitted by the combustion of the four
coals.
2.3. PM10 characterization
By the size-segregated collection using LPI, both the
concentration of PM10 and its particle size distribution were
obtained simultaneously. Each size of PM10 was also subjected
to XRF to quantify the elemental composition. Two typical
sizes, 2.5 and 0.13 mm, were also subjected to CCSEM to
determine their chemical forms. The procedures for CCSEM
analysis and the data interpretation have been previously
explained in detail [16].
2.4. Thermodynamic equilibrium calculation
To justify the formation routes of PM10 having different
sizes, thermodynamic calculations were carried out using the
Factsagee 5.1 software. The phase change of particulates
larger than 1.0 mm, the vaporization of volatile elements, and
chemical reactions among metallic vapors were investigated.
3. Results and discussion
3.1. Emission of PM10 in coal combustion and influence of coal
mineral properties
The emission of PM10 from the combustion of the four coals
is shown as a function of the particle size distribution in Fig. 1.
A bimodal distribution was obtained for each case regardless of
the coal type. The large mode is around 2.5 mm and the small
one around 0.06 mm. A 1.0 mm size acts as the boundary line
classifying PM10 into two groups: (1) a portion with size equal
to and greater than 1.0 mm, termed as PM1.0C hereafter, and (2)
particles smaller than 1.0 mm, termed as PM1. These findings
are similar to results reported elsewhere [17]. It can be
concluded that PM1C is derived from the direct transfer of
inherent minerals, whereas PM1.0 is mostly generated from the
vaporization of volatile metals within the coals. In addition, the
amounts of these two modes vary greatly with coal type,
implying their dependence on coal properties.
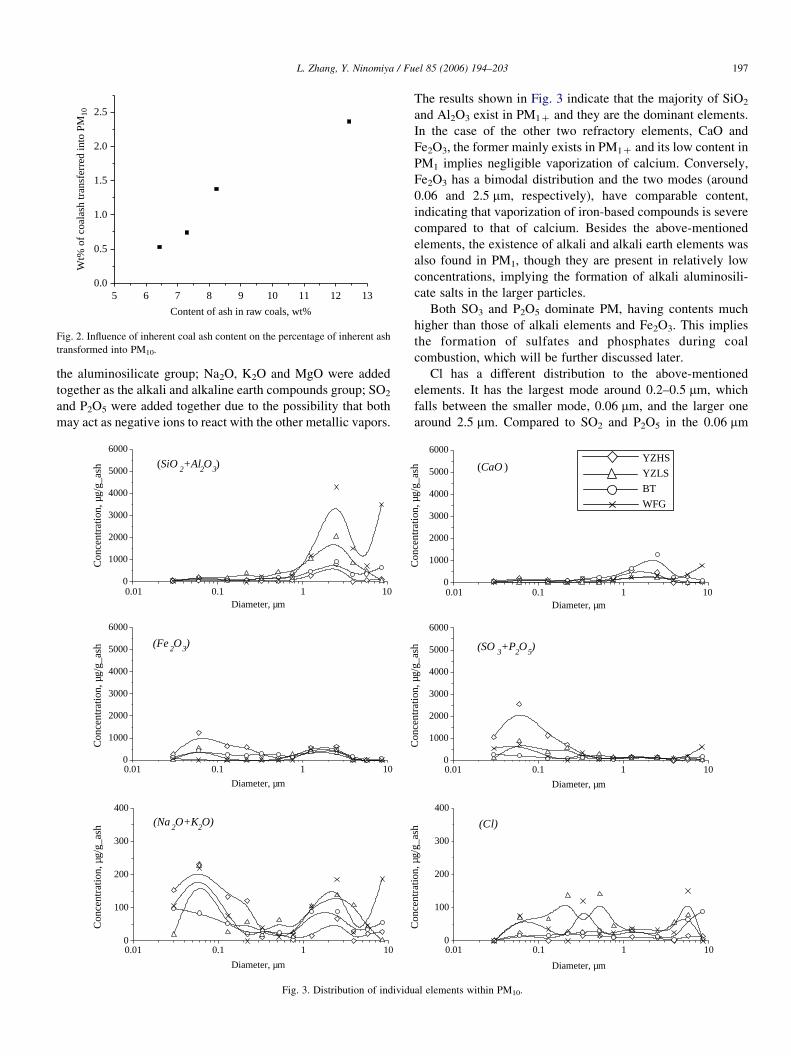
The influence of coal properties, specifically its ash content,
was initially plotted as a function of the percentage of ash
transformed into PM10 as shown in Fig. 2. A fairly linear
relationship was found, indicating that as the coal ash content
increased, the emitted PM10 concentration also proportionally
increased. In this study, it was found that about 0.5–2.5 wt% of
the inherent minerals were transformed into the suspended
PM10 during coal combustion, even after the collection of ashes
by the cyclone installed before LPI.
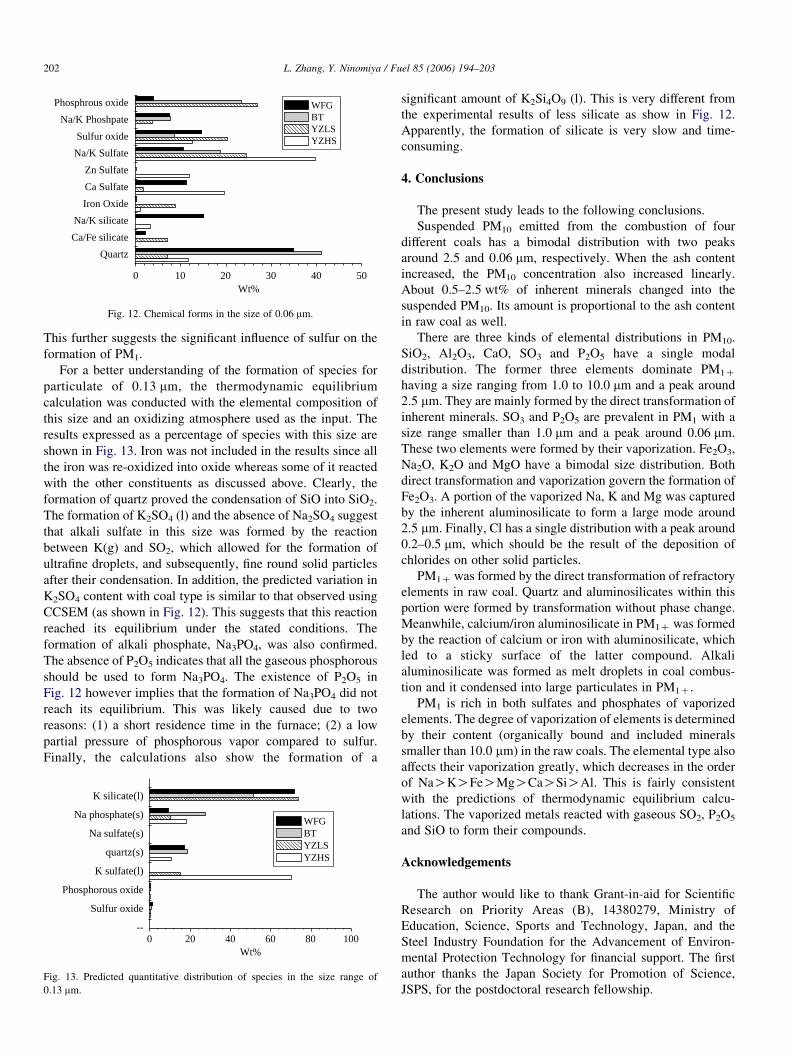
The distribution of individual elements is shown in Fig. 3.
The concentrations of SiO2 and Al2O3 were added together as
5 6 7 8 9 10 11 12 130.0
0.5
1.0
1.5
2.0
2.5
Wt%
of
coal
ash
tran
sfer
red
into
PM
10
Content of ash in raw coals, wt%
Fig. 2. Influence of inherent coal ash content on the percentage of inherent ash
transformed into PM10.
L. Zhang, Y. Ninomiya / Fuel 85 (2006) 194–203 197
the aluminosilicate group; Na2O, K2O and MgO were added
together as the alkali and alkaline earth compounds group; SO2
and P2O5 were added together due to the possibility that both
may act as negative ions to react with the other metallic vapors.
0
1000
2000
3000
4000
5000
6000
0.01 0.1 1 100
1000
2000
3000
4000
5000
6000
0.01 0.1 1 100
100
200
300
400
0.01 0.1 1 10Diameter, µm
Diameter, µm
Diameter, µm
Con
cent
ratio
n, µ
g/g_
ash
Con
cent
ratio
n, µ
g/g_
ash
Con
cent
ratio
n, µ
g/g_
ash
(SiO2+Al
2O
3)
(Fe2O
3)
(Na2O+K
2O)
Fig. 3. Distribution of individu
The results shown in Fig. 3 indicate that the majority of SiO2
and Al2O3 exist in PM1C and they are the dominant elements.
In the case of the other two refractory elements, CaO and
Fe2O3, the former mainly exists in PM1C and its low content in
PM1 implies negligible vaporization of calcium. Conversely,
Fe2O3 has a bimodal distribution and the two modes (around
0.06 and 2.5 mm, respectively), have comparable content,
indicating that vaporization of iron-based compounds is severe
compared to that of calcium. Besides the above-mentioned
elements, the existence of alkali and alkali earth elements was
also found in PM1, though they are present in relatively low
concentrations, implying the formation of alkali aluminosili-
cate salts in the larger particles.
Both SO3 and P2O5 dominate PM, having contents much
higher than those of alkali elements and Fe2O3. This implies
the formation of sulfates and phosphates during coal
combustion, which will be further discussed later.
Cl has a different distribution to the above-mentioned
elements. It has the largest mode around 0.2–0.5 mm, which
falls between the smaller mode, 0.06 mm, and the larger one
around 2.5 mm. Compared to SO2 and P2O5 in the 0.06 mm
0
1000
2000
3000
4000
5000
6000
0.01 0.1 1 100
1000
2000
3000
4000
5000
6000
0.01 0.1 1 100
100
200
300
400
YZHS
YZLS
BT
WFG
0.01 0.1 1 10Diameter, µm
Diameter, µm
Diameter, µm
Con
cent
ratio
n, µ
g/g_
ash
Con
cent
ratio
n, µ
g/g_
ash
Con
cent
ratio
n, µ
g/g_
ash
(CaO )
(SO3+P
2O
5)
(Cl)
al elements within PM10.

0 5 10 15 20 25 30 35 40 45 50 550
2000
4000
6000
8000
10000
PM1 vs. excluded mineralsPM1 vs. included minerals
Con
cent
ratio
n of
PM
10
Content of fine minerals (<10m) in raw coal, wt%
g/g_
ash
µ
Fig. 4. Relationship between the contents of PM1C with the content of minerals
in the raw coals.
0 5 10 15 20 250
2000
4000
6000
8000
Al2O
3
SiO2
Con
tent
in P
M1+
, g/
g_as
h
Content of excluded SiO2 and Al
2O
3in coal ash, wt%
Content of excluded CaO and Fe2O
3in coal ash, wt%
0 5 10 150
1000
2000
3000
4000
Fe2O
3
CaO
Con
tent
in P
M1+
, g/
g_as
hµ
µ
Fig. 5. Effect of excluded refractory metals smaller than 10.0 mm on their
concentrations in PM1C.
L. Zhang, Y. Ninomiya / Fuel 85 (2006) 194–203198
mode, the prevalence of Cl in the medium size range implies
the deposition of chloride on the medium-sized solid particles.
The results described above suggest that there are three
kinds of distribution of the elements in PM10. (1) SiO2, Al2O3,
CaO, SO3 and P2O5 have a single mode distribution; the former
three are prevalent in PM1C, whereas the latter two are
abundant in PM1. The transformation of the former three
metals was likely caused by the direct transformation of
inherent refractory metals within the coals. A solid-to-particles
pathway governs their transformation. Vaporization is however
the main formation route for SO3 and P2O5 in PM, the reactions
between them and the other vaporized metals allowed for the
formation of ultrafine solid particles following the solid–vapor-
particles pathway. (2) Fe2O3, Na2O, K2O and MgO have a
bimodal distribution. The transformation of Fe2O3 should be
governed by both the above-mentioned pathways, i.e. a portion
of it undergo direct transformation whereas the remaining
portion vaporizes and condenses into ultrafine particles. For the
other three metals, their presence in the large mode is likely
caused by adsorption of their vapors on the inherent minerals
such as kaolinite. In other words, the presence of these three
metals in PM10 likely resulted from their vaporization. (3) Cl
has a single mode around 0.5 mm, suggesting the agglomera-
tion of vaporized chloride or its deposition on the surfaces of
other solid particles.
As stated previously, the inherent minerals in raw coals are
generally assigned to two groups, organically bound and
inorganic. Inorganic minerals consist of included particles
embedded within the carbonaceous matrix, and the excluded
particles exist separate from the carbonaceous matrix. Coal
combustion is initiated by the release of volatile matter, which
is followed by char combustion. The formation of a flame
during char combustion causes a higher temperature around the
burning char than that of the furnace. The organically bound
and a portion of the included inorganic minerals within the char
then undergo vaporization leading to the formation of
submicron particles. Meanwhile, a portion of the excluded
minerals undergoes fragmentation in coal combustion, which
may lead to the formation of large particulates (in general
having size greater than 1.0 mm). The majority of included
inorganic minerals, however, undergo coalescence and
agglomeration to form coarse ash, having little effect on the
formation of large particulates. In this respect, it is plausible
that the formation of the large mode PM1C may be affected by
the content of the excluded minerals having sizes smaller than
10.0 mm. Meanwhile, PM1 may be affected by the contents of
both organically bound and included minerals smaller than
10.0 mm. Both of these will be discussed separately in the
following sections.
3.2. Formation of PM1C
The concentration of PM1C was plotted as a function of the
content of inherent minerals, smaller than 10.0 mm, as shown in
Fig. 4. No relationship was found for included minerals as a
function of the PM1C concentration. The included minerals
thus have little influence on the formation of the large mode
during combustion of these four coals. In contrast, the
relatively linear relationship for excluded minerals confirmed
their influence on the formation of PM1C.
The relationship between the content of individual elements
in raw coals (existing as excluded mineral particles smaller
than 10.0 mm) and their concentrations in PM1C is shown in
Fig. 5. These experimental results show that: (1) the transfer
rate of all elements except Ca is proportional to their content in
the raw coals; (2) the transfer rate of an individual element
depends on the elemental type.
The fitting lines for SiO2 and Al2O3 have the steepest slope
indicating that they have the greatest transformation rates
among all the elements. In addition, their similar gradient

100
L. Zhang, Y. Ninomiya / Fuel 85 (2006) 194–203 199
values suggest that these two elements have a nearly equal
transfer rate, which might be due to their co-existence as
aluminosilicate, e.g. kaolinite, in raw coals. The change in the
inherent aluminosilicate allowed the transfer of both into
PM1C.
The transformation of Ca is complex. The relationship
shown here, which is not very clear, implies that except for its
content, the reaction of Ca with other metals may be important
too. Though the extent of transformation of Fe is proportional
to its content in the excluded minerals, the nearly horizontal
fitting line suggests that less iron is transformed into PM1C
even for higher contents. The majority of iron might be
scavenged by aluminosilicate to form molten phases, which
undergo agglomeration to form coarse ash particles.
The chemical species in the large mode, 2.5 mm, were
quantified by CCSEM and the results are shown in Fig. 6. The
results shown are consistent with the elemental composition as
discussed above. That is, aluminosilicate dominates and its
salts, including calcium, iron and alkali elements, are relatively
prevalent too. For the YZHS coal, iron oxide and calcium
sulfate have minor contents. Both quartz and aluminosilicate
should be formed by direct transformation of the inherent
quartz and kaolinite in raw coals. Calcium sulfate should also
be the inherent mineral, as shown by CCSEM analysis on raw
coals reported elsewhere [15]. On the other hand, the existence
of aluminosilicate salts and iron oxide indicates that the
chemical reactions between different elements also play an
important role in the transformation of excluded minerals
during coal combustion.
The formation of iron oxide is likely caused by the oxidation
of pyrite. This reaction commences at 873 8C in an oxidizing
atmosphere, and magnetite and hematite are regarded as the
main products [4]. On the other hand, the formation of
aluminosilicate salts suggests that it is plausible that
aluminosilicate might react with the excluded calcium, iron,
and alkali vapors via collision in the gas atmosphere.
To better understand the formation mechanisms of
aluminosilicate salts, thermodynamic equilibrium calculations
were carried out to investigate the phases of these salts in the
combustion temperature windows. Calculations were con-
ducted by selecting the elemental composition of individual
Quartz
Al-silicate
Ca/Fe Al-silicate
Alkali Al-silicate
Iron Oxide
Ca sulfate
0 20 40 60 80 100Wt%
WFG BT YZLS YZHS
Fig. 6. Chemical species in the size of 2.5 mm.
particles as the input, which was obtained from CCSEM
analysis. An oxidizing atmosphere was used as the input as
well. The output was expressed in terms of percentage of liquid
phase in each particle. An average result was finally given for
each species. The calculated results are shown in Fig. 7. The Y-
axis unit is expressed as the weight percentage of liquid phase
in each compound. Less than 5 wt% of aluminosilicate was
maintained in the liquid phase, indicating a solid state for the
material. Therefore, the solid-to-particles pathway governs the
transformation of inherent quartz and kaolinite. About
10–40 wt% of Ca or Fe aluminosilicate was kept in a liquid
phase at 1200 8C, which indicates a semi-liquid phase, which
should be due to the reaction of calcium/iron and aluminosi-
licate on the surface of the latter compound. In the post-flame
zone, these partially molten particles condense again or
agglomerate with each other to form larger clusters. Hence, a
solid-semi-liquid-particles pathway should be the formation
route. Furthermore, more than 60 wt% of alkali aluminosili-
cates was kept as liquid phase. Clearly, the reaction of
vaporized alkali elements and aluminosilicate resulted in the
formation of a total melt phase, and the condensation of its
droplets led to formation of fine particulates in the exit gas.
Therefore, a pathway of solid–liquid-particles should be
adopted for the existence of alkali aluminosilicates in PM1C.
3.3. Formation of PM1
As suggested in Fig. 3, the major elements in PM are sulfur
and phosphorus. The influence of these two elements was
plotted as a function of the concentration of PM1, as shown in
Fig. 8. The linear relationship confirmed the significant
influence of these two elements.
For the other volatile elements shown in Fig. 3, in principle,
they may undergo physical and chemical changes after they
vaporize. In this respect, the formation of PM1 is discussed in
Sections 3.4 and 3.5.
700 800 900 1000 1100 1200 1300 1400 1500 16000
20
40
60
80Na/K Al-silicate
Ca/Fe Al-silicate
Al-silicate
Wt%
Reaction temperature, oC
Fig. 7. Predicted percentage of liquid amount in each phase in the size range of
2.5 mm.

0 1 2 543
6000
8000
10000
12000
14000
Con
cent
ratio
n of
PM
1,µ
g/g_
ash
Contents of S and P in raw coals, wt%
Fig. 8. Relationship between the formation of PM1 with the SO3 and P2O5
content in raw coals.
L. Zhang, Y. Ninomiya / Fuel 85 (2006) 194–203200
3.4. Vaporization of metals
Fig. 9 displays the degree of vaporization for the studied
elements, where the values for the Y-axis, i.e. the degree of
vaporization, was calculated using the following equation:
Degree of vapourization of Mð%Þ
Z Concentration of M in PM1=10½mg=m3N��
!exit gas amount½m3N=min��
!10K4=fcoal feed rate½g=min�
!concenration of M in coal½g=g�g
(1)
Here, M represents the individual elements listed on the X-axis
in Fig. 9. The vaporization of alkali elements was calculated on
the basis of their content in PM10; meanwhile the content of
other metals in PM1 was used for the vaporization calculation.
This is because a portion of the alkali metals is deposited on the
large mode as shown in Fig. 3. In addition, the results for each
metal are shown as a bar that represents the range of the degree
of vaporization for this metal. The upper end is the maximum
value and the lower end the minimum. The coal type
0
10
20
30
40
50
60
70
Al Si Ca Mg Fe K Na
Wt%
of
orga
nic
and
incl
uded
met
als
tran
sfer
red
into
PM
1
Fig. 9. Weight percentage of individual metals transferred into PM1.
significantly affected the vaporization of the elements as
discussed before.
The degree of vaporization of elements depends on the type
of element, which decreases in the order of NaOKOFeOMgOCaOSiOAl. The vaporization degree of Na ranges from
30 to 65%, the largest among the metals studied. It is followed
by K, for which the degree of vaporization ranges from 3 to
almost 20%. Fe has a similar range as that of K, suggesting it
has a relatively high degree of vaporization among the
refractory elements. 5% of Mg vaporized at most. Also, the
vaporization of Ca and Si is small, if not negligible. Al hardly
underwent any vaporization, accounting for its lowest value
shown here.
A thermodynamic equilibrium study was carried out to
justify the above conclusions from a qualitative viewpoint. For
simplification, a reducing gas atmosphere was adopted by
assuming that the oxygen diffusing to the char surface is
completely consumed. CO is the only product on the char
surface, and hence, a fixed partial pressure of CO, PCO, of
0.15 atm was used as an input. The content of each element
studied, M, and that of Si and Al in raw coal (both organically
bound and included discrete) were also used as the input. The
latter two elements are the most prevalent in char and they
could react with the vaporized metals in the char. A broad
temperature range from 1000 to 1800 8C was used for the
calculation considering the possibility that the char has a
temperature about 200–400 8C higher than that of gas.
The calculation results indicate that mullite (Al6Si2O13) is
the major compound formed in the char. SiO, Al and AlO are
the gaseous phases formed for elements Si and Al. For the other
two refractory elements, Ca and Fe, the majority of Ca is
scavenged by aluminosilicate to form various salts including
CaAl2Si2O8, Ca2Al2SiO7 and CaAl4O7. Meanwhile a small
amount of Ca is formed as vapor. Fe does not react with
aluminosilicate under the given conditions. It partitions into
solid Fe in the char as well as gaseous Fe. The formation of
Mg2Al4Si5O18 is also preferred. Its amount decreases gradually
as the temperature increases and consequently, more gaseous
Mg is formed. The formation of NaAlSi3O8(s) is only possible
at temperatures lower than 1300 8C. When the temperature
increases further, all the Na2O is transformed to gaseous Na.
The formation of KAlSi2O6(s) is however possible at
temperatures below 1600 8C and gaseous K is formed as its
equilibrium phase.
Fig. 10 shows the weight percent of the gas phases of
individual elements as a function of the reaction temperature.
Only the results for YZHS coal are shown here. Assuming that
the char temperature ranges from 1400 to 1600 8C, it is likely
that Na2O vaporizes completely, followed by K2O having 20%
of it vaporizes at 1400 8C, which goes up to 100% at 1600 8C.
SiO2 vaporizes as well to an extent ranging from 5 to 60%.
MgO and Fe2O3 vaporize to a relatively small extent, under
10%. In addition, CaO and Al2O3 do not vaporize since the
amounts of their gas phases are negligible.
Thus, from a qualitative viewpoint, the calculated results are
roughly the same as the results obtained experimentally. On the
other hand, there are differences between the calculated

0
20
40
60
80
100
1000 1100 1200 1300 1400 1500 1600 1700 1800Reaction temperature, oC
Wt %
tran
sfer
red
into
gas
0.0E+00
2.0E-02
4.0E-02
6.0E-02
8.0E-02
1.0E-01
Wt%
of
CaO
or
Al2
O3
tran
sfer
red
into
gas
Na2O K2O
SiO2
MgO
Fe 2
O3
CaO A
l 2O
3
Fig. 10. Predicted weight percentage of individual elements transformed into
gaseous phases (for YZHS coal).
Con
tent
in P
M1,
g/g_
ash
µC
onte
nt in
PM
1, g/
g_as
hµ
Con
tent
in P
M1,
g/g_
ash
µ
Fig. 11. Relationship between the content of inherent metals in the organic
matrix and their concentrations in PM.
L. Zhang, Y. Ninomiya / Fuel 85 (2006) 194–203 201
and experimental results from a quantitative viewpoint. One
plausible reason for this is that the calculations simplified the
elements as oxides in the char, rather than their original forms.
The original form of the metals is thought to be more important
for determining their vaporization [10]. Moreover, the
diffusion of the vaporized metals within the pores of the char
is another factor that might also lower the degree of
vaporization [3].
The relationship between the content of individual elements
in raw coal and their content in PM1 is shown in Fig. 11. The x-
axis in the figure refers to the content of individual metals in the
carbonaceous matrix of raw coals, and its unit is C.O.I. (content
of organically bound and included inorganic metal
(%10.0 mm)). A good linear relationship was not found for
several elements including SiO2, K2O, Na2O and MgO. This
suggests a complex process for the vaporization of these
metals. Even so, there is an upward trend wherein increasing
the C.O.I. of these elements resulted in the improvement of
their vaporization. For the other elements, including Al2O3,
Fe2O3 and CaO, their degree of vaporization is proportional to
their C.O.I. as expected. The elemental type affected its
vaporization as well. The gradient of the fitting line also varied
greatly with the elemental type, further indicating their
different vaporization rates during coal combustion.
3.5. Formation of chemical species in PM1
After leaving the char surface, the resultant metallic vapors
initially undergo re-oxidization to form oxides. These
subsequently react with the other constituents via their
heterogeneous agglomeration.
The chemical species for the particulate having the diameter
of 0.13 mm were quantified by CCSEM and the results are
shown in Fig. 12. The results show the existence of quartz,
silicates, sulfates and phosphates. Quartz should be formed by
the homogenous condensation of gaseous SiO. Silicates should
however be formed by chemical reactions between gaseous
SiO and other metallic vapors. The presence of iron oxide
indicates the re-oxidation of metallic iron. Sulfates are present
with the greatest amounts, suggestive of sulfation of the metals,
especially alkali elements. On the other hand, the amount of
phosphates is relatively low compared to solid P2O5. The effect
of reactions between P2O5 and other metals appears to be
minor. The existence of P2O5 likely resulted from the
condensation of its gaseous phase in the post-flame zone in
the furnace. The existence of SO2 can be attributed to the
formation of liquid sulfate droplets or ammonium sulfate,
considering the existence of moisture and nitrogen in coals.
The coal type affected the distribution of species as well. A
number of sulfates were formed for YZHS coal due to its high
sulfur content. The YZLS, WFG and BT coals follow it in
the decreasing order of sulfur content in the raw coals.
Quartz
Ca/Fe silicate
Na/K silicate
Iron Oxide
Ca Sulfate
Zn Sulfate
Na/K Sulfate
Sulfur oxide
Na/K Phoshpate
Phosphrous oxide
0 2010 30 40 50Wt%
WFG BT YZLS YZHS
Fig. 12. Chemical forms in the size of 0.06 mm.
L. Zhang, Y. Ninomiya / Fuel 85 (2006) 194–203202
This further suggests the significant influence of sulfur on the
formation of PM1.
For a better understanding of the formation of species for
particulate of 0.13 mm, the thermodynamic equilibrium
calculation was conducted with the elemental composition of
this size and an oxidizing atmosphere used as the input. The
results expressed as a percentage of species with this size are
shown in Fig. 13. Iron was not included in the results since all
the iron was re-oxidized into oxide whereas some of it reacted
with the other constituents as discussed above. Clearly, the
formation of quartz proved the condensation of SiO into SiO2.
The formation of K2SO4 (l) and the absence of Na2SO4 suggest
that alkali sulfate in this size was formed by the reaction
between K(g) and SO2, which allowed for the formation of
ultrafine droplets, and subsequently, fine round solid particles
after their condensation. In addition, the predicted variation in
K2SO4 content with coal type is similar to that observed using
CCSEM (as shown in Fig. 12). This suggests that this reaction
reached its equilibrium under the stated conditions. The
formation of alkali phosphate, Na3PO4, was also confirmed.
The absence of P2O5 indicates that all the gaseous phosphorous
should be used to form Na3PO4. The existence of P2O5 in
Fig. 12 however implies that the formation of Na3PO4 did not
reach its equilibrium. This was likely caused due to two
reasons: (1) a short residence time in the furnace; (2) a low
partial pressure of phosphorous vapor compared to sulfur.
Finally, the calculations also show the formation of a
--
Sulfur oxide
Phosphorous oxide
K sulfate(l)
quartz(s)
Na sulfate(s)
Na phosphate(s)
K silicate(l)
0 20 40 60 80 100Wt%
WFG BT YZLS YZHS
Fig. 13. Predicted quantitative distribution of species in the size range of
0.13 mm.
significant amount of K2Si4O9 (l). This is very different from
the experimental results of less silicate as show in Fig. 12.
Apparently, the formation of silicate is very slow and time-
consuming.
4. Conclusions
The present study leads to the following conclusions.
Suspended PM10 emitted from the combustion of four
different coals has a bimodal distribution with two peaks
around 2.5 and 0.06 mm, respectively. When the ash content
increased, the PM10 concentration also increased linearly.
About 0.5–2.5 wt% of inherent minerals changed into the
suspended PM10. Its amount is proportional to the ash content
in raw coal as well.
There are three kinds of elemental distributions in PM10.
SiO2, Al2O3, CaO, SO3 and P2O5 have a single modal
distribution. The former three elements dominate PM1C
having a size ranging from 1.0 to 10.0 mm and a peak around
2.5 mm. They are mainly formed by the direct transformation of
inherent minerals. SO3 and P2O5 are prevalent in PM1 with a
size range smaller than 1.0 mm and a peak around 0.06 mm.
These two elements were formed by their vaporization. Fe2O3,
Na2O, K2O and MgO have a bimodal size distribution. Both
direct transformation and vaporization govern the formation of
Fe2O3. A portion of the vaporized Na, K and Mg was captured
by the inherent aluminosilicate to form a large mode around
2.5 mm. Finally, Cl has a single distribution with a peak around
0.2–0.5 mm, which should be the result of the deposition of
chlorides on other solid particles.
PM1C was formed by the direct transformation of refractory
elements in raw coal. Quartz and aluminosilicates within this
portion were formed by transformation without phase change.
Meanwhile, calcium/iron aluminosilicate in PM1C was formed
by the reaction of calcium or iron with aluminosilicate, which
led to a sticky surface of the latter compound. Alkali
aluminosilicate was formed as melt droplets in coal combus-
tion and it condensed into large particulates in PM1C.
PM1 is rich in both sulfates and phosphates of vaporized
elements. The degree of vaporization of elements is determined
by their content (organically bound and included minerals
smaller than 10.0 mm) in the raw coals. The elemental type also
affects their vaporization greatly, which decreases in the order
of NaOKOFeOMgOCaOSiOAl. This is fairly consistent
with the predictions of thermodynamic equilibrium calcu-
lations. The vaporized metals reacted with gaseous SO2, P2O5
and SiO to form their compounds.
Acknowledgements
The author would like to thank Grant-in-aid for Scientific
Research on Priority Areas (B), 14380279, Ministry of
Education, Science, Sports and Technology, Japan, and the
Steel Industry Foundation for the Advancement of Environ-
mental Protection Technology for financial support. The first
author thanks the Japan Society for Promotion of Science,
JSPS, for the postdoctoral research fellowship.
L. Zhang, Y. Ninomiya / Fuel 85 (2006) 194–203 203
References
[1] Smith I M, and Sloss L L, PM10/PM2.5-emissions and effects, London,
UK: IEA Coal Research, 1998.
[2] Soud H N, Developments in particulate control for coal combustion,
London, UK: IEA Coal Research, 1995.
[3] Lockwood FC, Yousif S. Fuel Processing Technology 2000;65-66:
439–547.
[4] Tomeczek J and Palugniok H, Fuel, 2002, 81: 1251-1258.
[5] Nussbaumer T (editor), Aerosols from biomass combustion, Proceedings
of International Seminar of Bioenergy task 32: Biomass combustion and
cofiring, Zurich, Switzerland: IEA, 2001.
[6] Sloss L L and Gardner C A, Sampling and analysis of trace emissions
from coal-fired power stations, London, UK: IEA Coal Research, 1995.
[7] Senior C.L., Panagiotou T., et al., Preprints of Symposia, Division of Fuel
Chemistry 45 (1), American Chemical Society, USA, March 2000.
[8] Hein KRG, Wolski N, Hocquel M. Proceedings of trace element
workshop. Japan, July 17-18, p. 2002;141:154.
[9] Scott D and Nilsson P, Competitiveness of future coal-fired units in
different coutries, London, UK: IEA Coal Research, 1999.
[10] Zeng T. Sarofim A and Senior C L. Combustion and Flame 2001;126:
1714–24.
[11] Quann R J and Sarofim A F, proceedings of the 9th Symposium
(International) on Combustion, the Combustion Institute, USA, 1982,
1429-1440.
[12] Quann RJ. Neville M and Sarofim A F. Combustion Science and
Technology 1990;74:245–65.
[13] Ninomiya Y, Zhang L, et al, Fuel Processing Technology, 2004, 85 (8-
10): 1065-1088.
[14] Smoot L D (editor), Fundamentals of Coal Combustion for clean and
efficient use, Newyork, Elsevier Science, 1993, p. 302-306.
[15] Zhang L. Sato A and Ninomiya Y. Fuel 2002;81:1499–508.
[16] Zhang L. and Ninomiya Y., Proceedings of the 21st Pittsburgh Coal
Conference, Osaka, Japan, Sept. 13-17, 2004. CD-ROM.
[17] Kauppinen EI, Pakkanen TA. Environmental Science and Technology
1990;12:1811.

![Bericht zu PM10-Tagesmittelwerten und Überschreitungen …...28.04.2011 PM10 [µg/m³] 1 58 05.11.2011 PM10 [µg/m³] 5 62 12.11.2011 PM10 [µg/m³] 3 102 23.11.2011 PM10 [µg/m³]](https://img.dokumen.tips/doc/110x75/5feb2fd0c3ceb232dc68d90f/bericht-zu-pm10-tagesmittelwerten-und-oeberschreitungen-28042011-pm10-gm.jpg)