Embed Size (px)
Citation preview
IAEA/AQ/29
IAEA Analytical Quality in Nuclear Applications Series No. 29
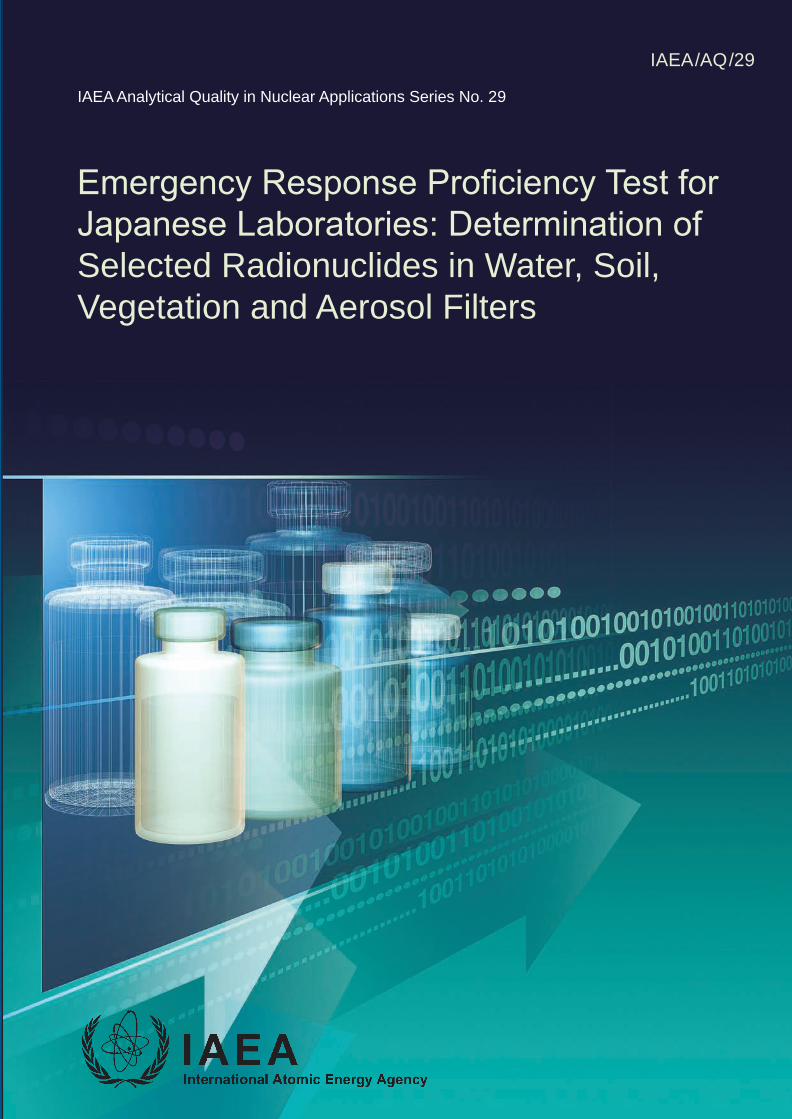
Emergency Response Proficiency Test for Japanese Laboratories: Determination of Selected Radionuclides in Water, Soil, Vegetation and Aerosol Filters
INTERNATIONAL ATOMIC ENERGY AGENCYVIENNA
ISSN 2074–7659
spine for 80 pages = 4,28 mm
emergency response proficiency test for japanese laboratories:
determination of selected radionuclides in water, soil,
vegetation and aerosol filters
afgHanistanalbaniaalgeriaangolaargentinaarmeniaaustraliaaustriaaZerbaijanbaHrainbangladesHbelarusbelgiumbeliZebeninboliviabosnia and HerZegovinabotswanabraZilbulgariaburKina fasoburundicambodiacamerooncanadacentral african
republiccHadcHilecHinacolombiacongocosta ricacÔte d’ivoirecroatiacubacypruscZecH republicdemocratic republic
of tHe congodenmarKdominicadominican republicecuadoregyptel salvadoreritreaestoniaetHiopiafijifinlandfrancegabongeorgiagermanygHanagreece
guatemalaHaitiHoly seeHondurasHungaryicelandindiaindonesiairan, islamic republic of iraQirelandisraelitalyjamaicajapanjordanKaZaKHstanKenyaKorea, republic ofKuwaitKyrgyZstanlao people’s democratic
republiclatvialebanonlesotHoliberialibyaliecHtensteinlitHuanialuXembourgmadagascarmalawimalaysiamalimaltamarsHall islandsmauritaniamauritiusmeXicomonacomongoliamontenegromoroccomoZambiQuemyanmarnamibianepalnetHerlandsnew ZealandnicaraguanigernigerianorwayomanpaKistanpalau
panamapapua new guineaparaguayperupHilippinespolandportugalQatarrepublic of moldovaromaniarussian federationrwandasaudi arabiasenegalserbiaseycHellessierra leonesingaporeslovaKiasloveniasoutH africaspainsri lanKasudanswaZilandswedenswitZerlandsyrian arab republictajiKistantHailandtHe former yugoslav
republic of macedoniatogotrinidad and tobagotunisiaturKeyugandauKraineunited arab emiratesunited Kingdom of
great britain and nortHern ireland
united republicof tanZania
united states of americauruguayuZbeKistanveneZuelavietnamyemenZambiaZimbabwe
the following states are members of the international atomic energy agency:
the agency’s statute was approved on 23 october 1956 by the conference on the statute of the iaea held at united nations Headquarters, new york; it entered into force on 29 july 1957. the Headquarters of the agency are situated in vienna. its principal objective is “to accelerate and enlarge the contribution of atomic energy to peace, health and prosperity throughout the world’’.
iaea/aQ/29
iaea analytical Quality in nuclear applications no. iaea/aQ/29
emergency response proficiency test for japanese laboratories:
determination of selected radionuclides in water, soil,
vegetation and aerosol filters
international atomic energy agencyvienna, 2013
COPYRIGHT NOTICE
All IAEA scientific and technical publications are protected by the terms of the Universal Copyright Convention as adopted in 1952 (Berne) and as revised in 1972 (Paris). The copyright has since been extended by the World Intellectual Property Organization (Geneva) to include electronic and virtual intellectual property. Permission to use whole or parts of texts contained in IAEA publications in printed or electronic form must be obtained and is usually subject to royalty agreements. Proposals for non-commercial reproductions and translations are welcomed and considered on a case-by-case basis. Enquiries should be addressed to the IAEA Publishing Section at:
Marketing and Sales Unit, Publishing SectionInternational Atomic Energy AgencyVienna International CentrePO Box 1001400 Vienna, Austriafax: +43 1 2600 29302tel.: +43 1 2600 22417email: [email protected] http://www.iaea.org/books
For further information on this publication, please contact:
Terrestrial Environment Laboratory, SeibersdorfInternational Atomic Energy Agency
2444 SeibersdorfAustria
© IAEA, 2013Printed by the IAEA in Austria
October 2013
EMERGENCY RESPONSE PROFICIENCY TEST FOR JAPANESE LABORATORIES: DETERMINATION OF SELECTED RADIONUCLIDES IN WATER, SOIL, VEGETATION AND AEROSOL FILTERS
IAEA, VIENNA, 2013IAEA/AQ/29
ISSN 2074–7659© IAEA, 2013
Printed by the IAEA in AustriaOctober 2013
FOREWORD
Reliable determination of natural and artificial radionuclides in environmental samples is necessary for compliance with radiation protection and environmental regulations. The IAEA assists Member State laboratories in maintaining and improving their readiness in this regard by producing reference materials, by developing standardized analytical methods, and by conducting interlaboratory comparisons and proficiency tests as tools for quality control. To fulfil this obligation and ensure a reliable, rapid and consistent worldwide response, the IAEA Terrestrial Environment Laboratory in Seibersdorf, Austria, organizes interlaboratory comparisons and proficiency tests. In addition, the IAEA coordinates the worldwide network of Analytical Laboratories for the Measurement of Environmental Radioactivity (ALMERA). After the accident at the Fukushima Daiichi nuclear power plant in March 2011, Japan requested the IAEA to organize an emergency response proficiency test for Japanese laboratories with the aim of assessing their capacity to rapidly and accurately measure radionuclides in environmental samples. The IAEA responded to the request by assembling a special sample set covering the main environmental samples and radionuclides of interest in the case of a nuclear emergency situation. Water, soil, vegetation and aerosol filter samples were made available to Japanese laboratories for analysis by gamma ray spectrometry. This report presents the results of the IAEA-TEL-2011-08 emergency response proficiency test for Japanese laboratories on the determination of selected radionuclides in water, soil, vegetation and aerosol filters. The report includes descriptions of the methodologies and data evaluation approach used, as well as summary evaluations of each radionuclide and individual evaluation reports of each laboratory. This proficiency test was designed to identify analytical problems and to support Member State laboratories in their efforts to improve the quality of their analytical results in the event of a nuclear emergency situation, and to provide a regular forum for discussion and technology transfer in this area. The number of samples, their matrix interferences and the concentration levels of the analytes were designed in a way that enables identification of potential analytical problems. The IAEA would like to express its appreciation to A. Shakhashiro for the design and preparation of this proficiency test, and to S. Tarjan for h is valuable assistance in the evaluation of results and report preparation. The support of Yuichi Onda (Japan) in the preparation of, and logistics for, this proficiency test is gratefully acknowledged. The IAEA officer responsible for this publication was A. Pitois of the IAEA Environment Laboratories.
EDITORIAL NOTE
This publication has been prepared from the original material as submitted by the authors. The views expressed do not necessarily reflect those of the IAEA, the governments of the nominating Member States or the nominating organizations.
This publication has not been edited by the editorial staff of the IAEA. It does not address questions of responsibility, legal or otherwise, for acts or omissions on the part of any person.
The use of particular designations of countries or territories does not imply any judgement by the publisher, the IAEA, as to the legal status of such countries or territories, of their authorities and institutions or of the delimitation of their boundaries.
The mention of names of specific companies or products (whether or not indicated as registered) does not imply any intention to infringe proprietary rights, nor should it be construed as an endorsement or recommendation on the part of the IAEA.
The authors are responsible for having obtained the necessary permission for the IAEA to reproduce, translate or use material from sources already protected by copyrights.
CONTENTS 1. INTRODUCTION ............................................................................................................... 1 2. MATERIALS AND METHODS ...................................................................................... 2 2.1. Proficiency test objectives .............................................................................................. 2 2.2. Participants ....................................................................................................................... 2 2.3. Composition of proficiency test materials .............................................................. 2 2.4. Water samples (Samples 01, 02 and 03) ................................................................. 4 2.4.1. Preparation of the spiked water samples ..................................................... 4 2.4.2. Target values and associated combined uncertainty ........................................ 4 2.5. Soil sample (Sample 04) ........................................................................................ 5 2.5.1. Preparation and homogeneity study of the soil sample ............................. 5 2.5.2. Target values and associated combined uncertainties ................................ 7 2.6. Grass samples (Samples 05, 06 and 07) .................................................................... 7 2.6.1. Preparation and homogeneity study of the grass samples .......................... 7 2.6.2. Target values and associated combined uncertainties ................................ 8 2.7. Simulated aerosol filter samples (Samples 08, 09 and 10) ....................................... 8 2.7.1. Preparation of the spiked simulated aerosol filters ..................................... 8 2.7.2. Target values and associated combined uncertainties ................................ 9 3. PERFORMANCE CRITERIA ........................................................................................................ 10 3.1. Relative bias ................................................................................................................ 11 3.2. Proficiency test evaluation criteria ............................................................................. 11 3.2.1. Trueness ..................................................................................................... 11 3.2.2. Precision ......................................................................................................... 11 3.3. The z-score value ....................................................................................................... 13 3.4. The u-score value ....................................................................................................... 14 4. RESULTS AND DISCUSSION ............................................................................................. 14 4.1. General ............................................................................................................................ 14 4.2. Recommendation for the calibrated energy range..................................................... 16 4.3. Recommendation related to true coincidence summing effect .............................. 17 4.4. Recommendation related to uncertainty budget ................................................... 19 4.5. Recommendation related to the role of the internal QC ............................................ 20 4.6. Final meeting with participants in Japan in October 2012 ........................................ 21 5. CONCLUSIONS ...................................................................................................................................................... 21 APPENDIX I: INDIVIDUAL EVALUATIONS ..................................................................... 23 APPENDIX II: EVALUATION PER ANALYTE ................................................................. 43 APPENDIX III: LIST OF PARTICIPATING LABORATORIES .......................................... 81 REFERENCES ......................................................................................................................... 85 LIST OF CONTRIBUTORS TO DRAFTING AND REVIEW ...................................................... 87

1
1. INTRODUCTION
The Fukushima nuclear reactor accident, which occurred in March 2011, brought into focus
the need for rapid and accurate measurement of a number of radionuclides in environmental
samples. In case of nuclear emergency situation, gamma ray spectrometry is the
radioanalytical method of choice to provide radionuclide selective information within a
reasonable short time period. For this reason, a special proficiency test was organised for the
Japanese laboratories taking part in the monitoring activities after the Fukushima accident,
and a special sample set was assembled, which covers the main radionuclides of interest for
this purpose in a wide range of environmental samples, i.e. water, soil, vegetation and aerosol
filters.
In this proficiency test, the sample set consisted of 10 samples: 3 water samples, 1 soil
sample, 3 grass samples and 3 simulated aerosol filters. The participating laboratories were
requested to analyse Co-60, Ba-133, Cs-134, Cs-137, Eu-152 and Am-241 in water, K-40 and
Cs-137 in soil, Cs-137 in grass, and Co-57, Cs-134, Cs-137, Eu-152 and Am-241 in simulated
aerosol filters.
These samples and radioisotopes for this proficiency test were selected for the following
reasons. Shortly after any nuclear emergency situation the radioactive pollutant may migrate
into the food chain causing the extra radiation hazard to the inhabitants. During the vegetation
period the direct contamination pathway by atmospheric fall-out has the strongest transfer
probability; therefore fresh agricultural products which are growing on open cultivated fields
or originated from the natural environment have to be included into the radiation monitoring.
The pasture and all of the raw materials of the animal feed are as important as the vegetation,
which is directly suitable for human consumption or used as foodstuff. The grass samples
represent this part of the food chain. The soil has only a secondary importance during that
period, but its contamination determines both the long term effects in the food chain and the
necessary remediation actions. The contamination of the water and the air points to the main
radiation pathway for the inhabitant from the early phase of the nuclear accident. Considering
these important facts, the four sample types grass, soil, water and aerosol filters were selected.
The selected soil and grass samples were contaminated as a consequence of the Chernobyl
accident, so their radioisotope contents were given. In case of the water and aerosol samples,
the spiking with 134
Cs and 137
Cs isotopes simulates the real contamination remaining for a
relatively long period of time in the environment. The Co-57, Co-60, Cs-134 and Eu-152
demonstrate the various cascade decaying radionuclides, and the Co-57 and Eu-152 even have
a spectral interference due to their overlapping main lines at 122.0 keV and 121.78 keV,
respectively. The Am-241 isotope was added to the samples to check the low energy
capabilities of the gamma ray spectrometry systems.
The test items were prepared and distributed in January 2012 to 21 Japanese laboratories and
the deadline for receiving the results from the participants was set to April 2012, in order to
allow time to the laboratories for performing the proficiency test in addition to their heavy
workload of monitoring activities.
Nineteen Japanese laboratories from 21 initially registered laboratories reported their results
to IAEA. This 90% participation rate is excellent compared with the typical reported rate in
other proficiency tests. All those participants who have reported their results are listed at the
end of this report in the Appendix III. The identification of the participating laboratories in
this proficiency test was however kept anonymous and it was known only by the organiser
and the laboratory itself.
2
2. MATERIALS AND METHODS
2.1. PROFICIENCY TEST OBJECTIVES
A special sample set was prepared for the laboratories covering the most important tasks in
case of emergency situations. These included the gamma ray spectrum analysis for samples of
water, soil, vegetation and aerosol filters. The water and aerosol filter sets were spiked with
artificial radionuclides to demonstrate the most typical radioanalytical difficulties:
• Calibration or efficiency transfer for different geometries;
• True coincidence summing effects and method of correction;
• Spectral interferences.
The soil and the dried vegetation samples were collected from areas contaminated with
Cs-137 via fall-out after the Chernobyl accident. The massic activities of these different
samples were in the same order of magnitude, but the densities were different both from each
other and from the typical calibration solutions. Therefore the participants had to apply the
self-attenuation correction to achieve precise measurement results.
This proficiency test aimed to assess the analytical performance of the laboratories in an
emergency situation. The reported results were evaluated in a short time frame and the
laboratories have been encouraged to take any corrective actions or technical improvements in
case of identification of any shortcomings.
2.2. PARTICIPANTS
Nineteen Japanese laboratories from 21 initially registered reported their results to IAEA.
A full listing of the participating laboratories, which reported their results in this proficiency
test, is given in Appendix III.
2.3. COMPOSITION OF PROFICIENCY TEST MATERIALS
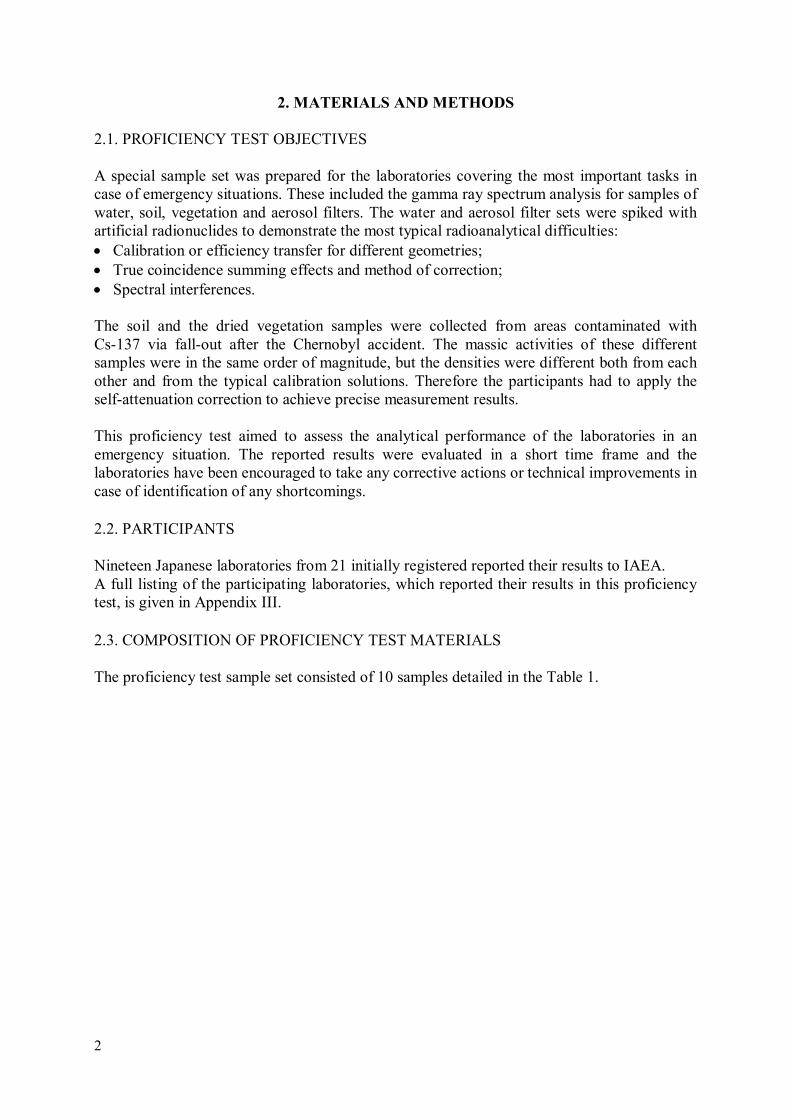
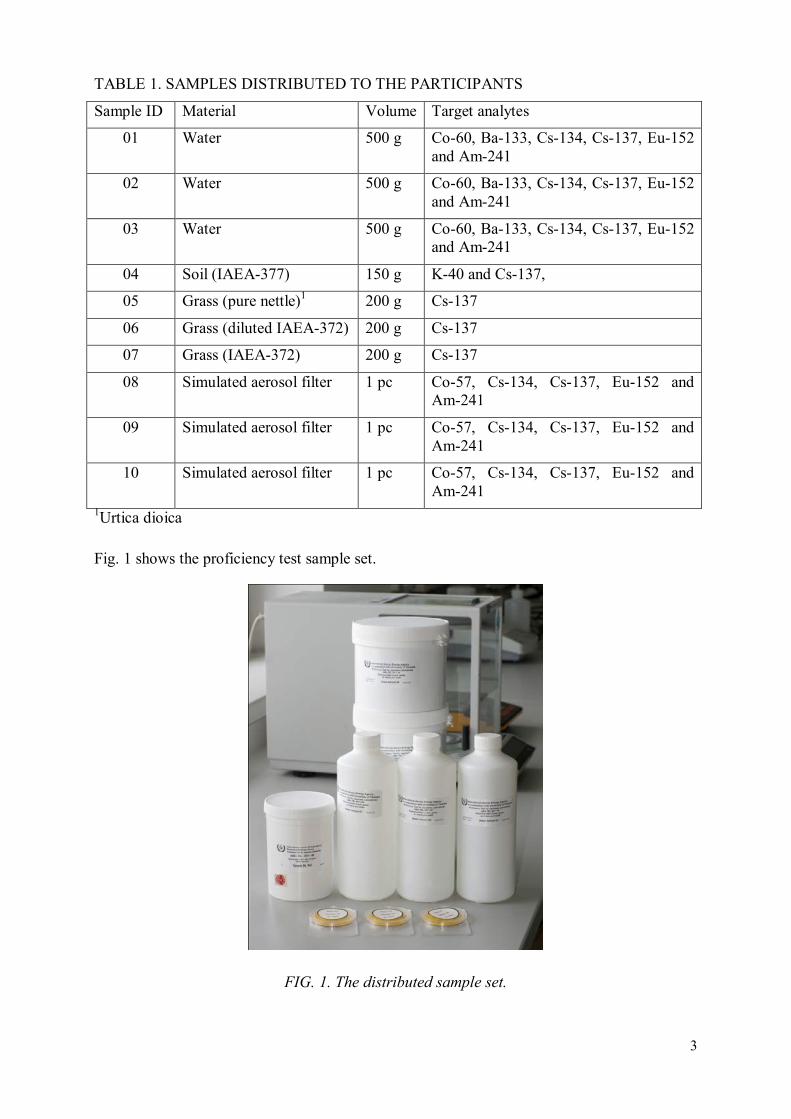
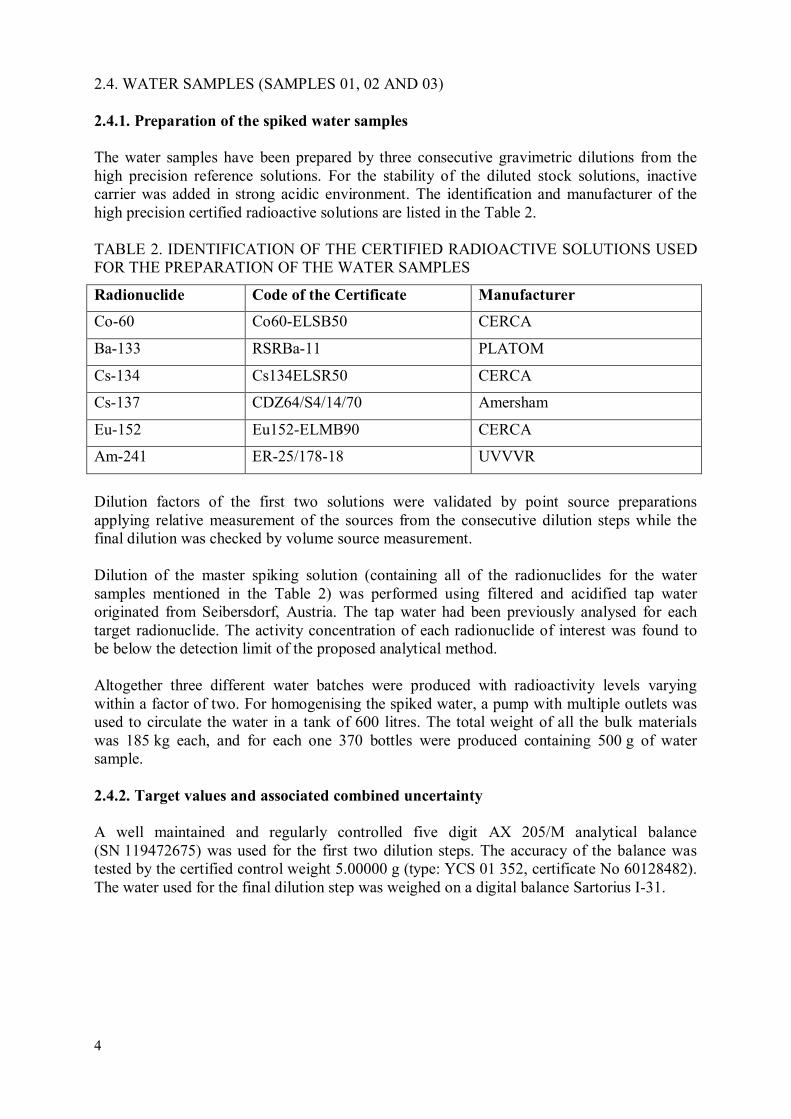
The proficiency test sample set consisted of 10 samples detailed in the Table 1.
3
TABLE 1. SAMPLES DISTRIBUTED TO THE PARTICIPANTS
Sample ID Material Volume Target analytes
01 Water 500 g Co-60, Ba-133, Cs-134, Cs-137, Eu-152
and Am-241
02 Water 500 g Co-60, Ba-133, Cs-134, Cs-137, Eu-152
and Am-241
03 Water 500 g Co-60, Ba-133, Cs-134, Cs-137, Eu-152
and Am-241
04 Soil (IAEA-377) 150 g K-40 and Cs-137,
05 Grass (pure nettle)1 200 g Cs-137
06 Grass (diluted IAEA-372) 200 g Cs-137
07 Grass (IAEA-372) 200 g Cs-137
08 Simulated aerosol filter 1 pc Co-57, Cs-134, Cs-137, Eu-152 and
Am-241
09 Simulated aerosol filter 1 pc Co-57, Cs-134, Cs-137, Eu-152 and
Am-241
10 Simulated aerosol filter 1 pc Co-57, Cs-134, Cs-137, Eu-152 and
Am-241
1Urtica dioica
Fig. 1 shows the proficiency test sample set.
FIG. 1. The distributed sample set.
4
2.4. WATER SAMPLES (SAMPLES 01, 02 AND 03)
2.4.1. Preparation of the spiked water samples
The water samples have been prepared by three consecutive gravimetric dilutions from the
high precision reference solutions. For the stability of the diluted stock solutions, inactive
carrier was added in strong acidic environment. The identification and manufacturer of the
high precision certified radioactive solutions are listed in the Table 2.
TABLE 2. IDENTIFICATION OF THE CERTIFIED RADIOACTIVE SOLUTIONS USED
FOR THE PREPARATION OF THE WATER SAMPLES
Radionuclide Code of the Certificate Manufacturer
Co-60 Co60-ELSB50 CERCA
Ba-133 RSRBa-11 PLATOM
Cs-134 Cs134ELSR50 CERCA
Cs-137 CDZ64/S4/14/70 Amersham
Eu-152 Eu152-ELMB90 CERCA
Am-241 ER-25/178-18 UVVVR
Dilution factors of the first two solutions were validated by point source preparations
applying relative measurement of the sources from the consecutive dilution steps while the
final dilution was checked by volume source measurement.
Dilution of the master spiking solution (containing all of the radionuclides for the water
samples mentioned in the Table 2) was performed using filtered and acidified tap water
originated from Seibersdorf, Austria. The tap water had been previously analysed for each
target radionuclide. The activity concentration of each radionuclide of interest was found to
be below the detection limit of the proposed analytical method.
Altogether three different water batches were produced with radioactivity levels varying
within a factor of two. For homogenising the spiked water, a pump with multiple outlets was
used to circulate the water in a tank of 600 litres. The total weight of all the bulk materials
was 185 kg each, and for each one 370 bottles were produced containing 500 g of water
sample.
2.4.2. Target values and associated combined uncertainty
A well maintained and regularly controlled five digit AX 205/M analytical balance
(SN 119472675) was used for the first two dilution steps. The accuracy of the balance was
tested by the certified control weight 5.00000 g (type: YCS 01 352, certificate No 60128482).
The water used for the final dilution step was weighed on a digital balance Sartorius I-31.
5
The target values of the analytes were derived from the original certified values for
traceability reasons. The uncertainties of each preparation step were determined and
propagated into the final uncertainty. The combined standard uncertainty has two main
contributors:
• Uncertainty of the certified radioactive solutions specified in the certificate;
• Uncertainty of the weight of water being spiked in the final dilution step.
According to the accuracy of the analytical balance the uncertainties of the first two dilution
steps are negligible as compared with the above mentioned components. As an independent
control of the gamma-emitting radionuclides, the point sources of these dilutions were
compared to certified point sources from the same radioisotope prepared by a metrological
institute. These results confirmed the certified values within the reported measurement results
uncertainties.
During the preparation the bottles were numbered according to their production order and the
total mass of each bottle was registered for further quality control purpose. One sample from
the beginning, one from the middle and one from the end were analysed for all radionuclides
of interest to investigate any potential production trend. The standard deviations of all
analytes were below the repeatability of the methods, showing the satisfactory homogeneity
of the samples on the one hand and no production trend during the preparation on the other
hand. The results of the control measurements were also in agreement with the derived target
values and demonstrated that the entire preparation process was well controlled. The target
values and associated uncertainties for water samples at the reference date 15 November 2011
are given in Table 3.
TABLE 3. TARGET VALUES AND ASSOCIATED UNCERTAINTIES FOR WATER
SAMPLES AT THE REFERENCE DATE 15 NOVEMBER 2011
Nuclide
Sample 01 Sample 02 Sample 03
Activity1,
Bq/kg
Uncertainty2,
Bq/kg
Activity1,
Bq/kg
Uncertainty2,
Bq/kg
Activity1,
Bq/kg
Uncertainty2,
Bq/kg
Co-60 15.3 0.2 7.6 0.1 10.7 0.2
Ba-133 5.0 0.1 2.5 0.1 3.5 0.1
Cs-134 7.7 0.1 3.8 0.1 5.4 0.1
Cs-137 6.2 0.1 3.1 0.1 4.4 0.1
Eu-152 15.4 0.2 7.7 0.1 10.8 0.2
Am-241 4.7 0.1 2.4 0.1 3.3 0.1
1Activity = massic activity
2Uncertainty = standard combined uncertainty (with k = 1 coverage factor)
2.5. SOIL SAMPLE (SAMPLE 04)
2.5.1. Preparation and homogeneity study of the soil sample
The soil was collected from the Chernobyl area for a reference material purpose. It was
treated by the ‘Collaboration Centre for Reference Material of Terrestrial Origin (Hungary)’.
The preparation included the following steps: drying, milling, sieving below the 150 micron
6
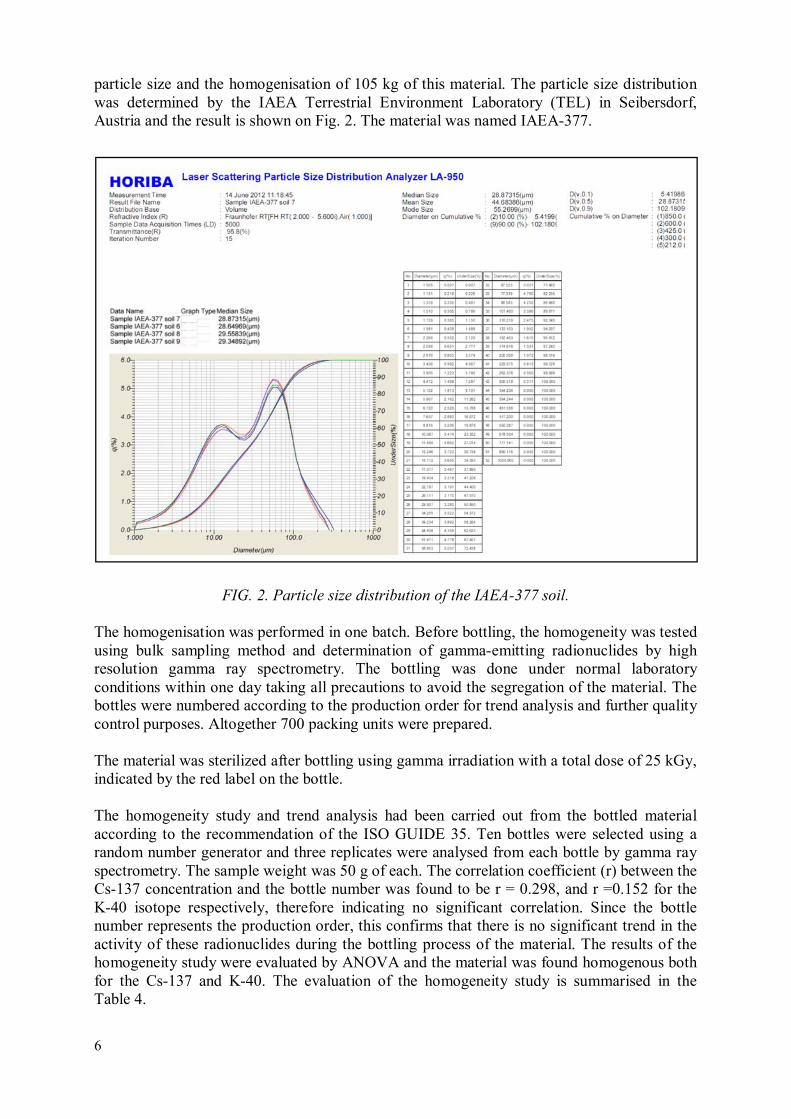
particle size and the homogenisation of 105 kg of this material. The particle size distribution
was determined by the IAEA Terrestrial Environment Laboratory (TEL) in Seibersdorf,
Austria and the result is shown on Fig. 2. The material was named IAEA-377.
FIG. 2. Particle size distribution of the IAEA-377 soil.
The homogenisation was performed in one batch. Before bottling, the homogeneity was tested
using bulk sampling method and determination of gamma-emitting radionuclides by high
resolution gamma ray spectrometry. The bottling was done under normal laboratory
conditions within one day taking all precautions to avoid the segregation of the material. The
bottles were numbered according to the production order for trend analysis and further quality
control purposes. Altogether 700 packing units were prepared.
The material was sterilized after bottling using gamma irradiation with a total dose of 25 kGy,
indicated by the red label on the bottle.
The homogeneity study and trend analysis had been carried out from the bottled material
according to the recommendation of the ISO GUIDE 35. Ten bottles were selected using a
random number generator and three replicates were analysed from each bottle by gamma ray
spectrometry. The sample weight was 50 g of each. The correlation coefficient (r) between the
Cs-137 concentration and the bottle number was found to be r = 0.298, and r =0.152 for the
K-40 isotope respectively, therefore indicating no significant correlation. Since the bottle
number represents the production order, this confirms that there is no significant trend in the
activity of these radionuclides during the bottling process of the material. The results of the
homogeneity study were evaluated by ANOVA and the material was found homogenous both
for the Cs-137 and K-40. The evaluation of the homogeneity study is summarised in the
Table 4.
7
TABLE 4. RESULTS OF THE HOMOGENEITY STUDY FOR THE SOIL SAMPLE
Nuclide K-40 Cs-137
F value 0.382 0.600
F (crit) 2.393 2.393
Arithmetical mean, Bq/kg 385.7 2595
SD, Bq/kg 10.3 2.7 % 48 1.85 %
Repeatability within bottles, swb Bq/kg 10.0 2.6 % 42 1.62 %
Repeatability between bottles, sbb Bq/kg 4.6 1.2 % 14 0.55 %
Determined on 16 June 2009
2.5.2. Target values and associated combined uncertainties
The target values and associated combined uncertainties are given in the Table 5, as
characterized in the reference material IAEA-377.
TABLE 5. TARGET VALUES AND ASSOCIATED UNCERTAINTIES FOR THE SOIL
SAMPLE AT THE REFERENCE DATE 15 NOVEMBER 2011
Nuclide
Sample 04
Activity1,
Bq/kg
Uncertainty2,
Bq/kg
K-40 385 20
Cs-137 2440 30
1Activity = massic activity based on dry mass
2Uncertainty = standard combined uncertainty (with k = 1 coverage factor)
2.6. GRASS SAMPLES (SAMPLES 05, 06 AND 07)
2.6.1. Preparation and homogeneity study of the grass samples
The grass ‘Sample 05’ was a freshly collected and treated nettle (Urtica dioica). The grass
‘Sample 07’ was the IAEA-372 certified reference material. The characterisation of the
IAEA-372 was done as a supplementary comparison involving 7 metrological institutes under
the umbrella of CCQM [1]. The grass ‘Sample 06’ was obtained by gravimetrical dilution of
the IAEA-372 CRM using the dried, milled and homogenised nettle ‘Sample 05’ with a ratio
of 3 parts of IAEA-372 to 7 parts of Sample 05 (per weight).
The distributed vegetation samples were the following:
Sample 05 the pure nettle sample
Sample 06 the diluted IAEA-372
Sample 07 the original IAEA-372.
8
The nettle sample was collected and treated in Hungary, then the dilution process was
performed in one step at TEL, using a big TURBULA mixer. To avoid any segregation
between the nettle and the grass during the preparation of the ‘Sample 06’, the particle size of
these materials were adjusted to the same range, i.e. 150-250 micron. The same technological
preparation chain was used for the nettle and grass samples. The homogeneity of these
samples was tested by gamma ray spectrometry applying an automatic sample changer
system. The data were evaluated by ANOVA. The results are summarised in Table 6. The
activity value of the Sample 06 (diluted material) was derived from the certified value of the
IAEA-372.
TABLE 6. RESULTS OF THE HOMOGENEITY STUDY FOR CS-137
CONCENTRATION OF THE DILUTED GRASS SAMPLE CALCULATED TO THE
REFERENCE DATE 15 NOVEMBER 2011
Nuclide Cs-137
F value 0.398
F (crit) 2.393
Arithmetical mean, Bq/kg 3001
SD, Bq/kg 40.9 1.36 %
Repeatability within bottles, swb Bq/kg 39.7 1.32 %
Repeatability between bottles, sbb Bq/kg 17.8 0.59 %
The bottling was performed during normal laboratory condition within one working day into
special plastic SECURY boxes as shown on Fig. 1.
2.6.2. Target values and associated combined uncertainties
The target values and associated combined uncertainties for the grass samples are given in the
Table 7.
TABLE 7. TARGET VALUES AND ASSOCIATED UNCERTAINTIES FOR GRASS
SAMPLES AT THE REFERENCE DATE 15 NOVEMBER 2011
Nuclide
Sample 05 Sample 06 Sample 07
Activity1,
Bq/kg
Uncertainty2,
Bq/kg
Activity1,
Bq/kg
Uncertainty2,
Bq/kg
Activity1,
Bq/kg
Uncertainty2,
Bq/kg
Cs-137 2 0.4 3000 120 10000 340
1Activity = massic activity
2Uncertainty = standard combined uncertainty (with k = 1 coverage factor)
2.7. SIMULATED AEROSOL FILTER SAMPLES (SAMPLES 08, 09 AND 10)
2.7.1. Preparation of the spiked simulated aerosol filters
In the frame of this proficiency test three simulated aerosol filters were distributed. The filters
were prepared by an expert team in 2009 for a special proficiency test purpose, and each piece
was tested by gamma ray spectrometry [2].
9
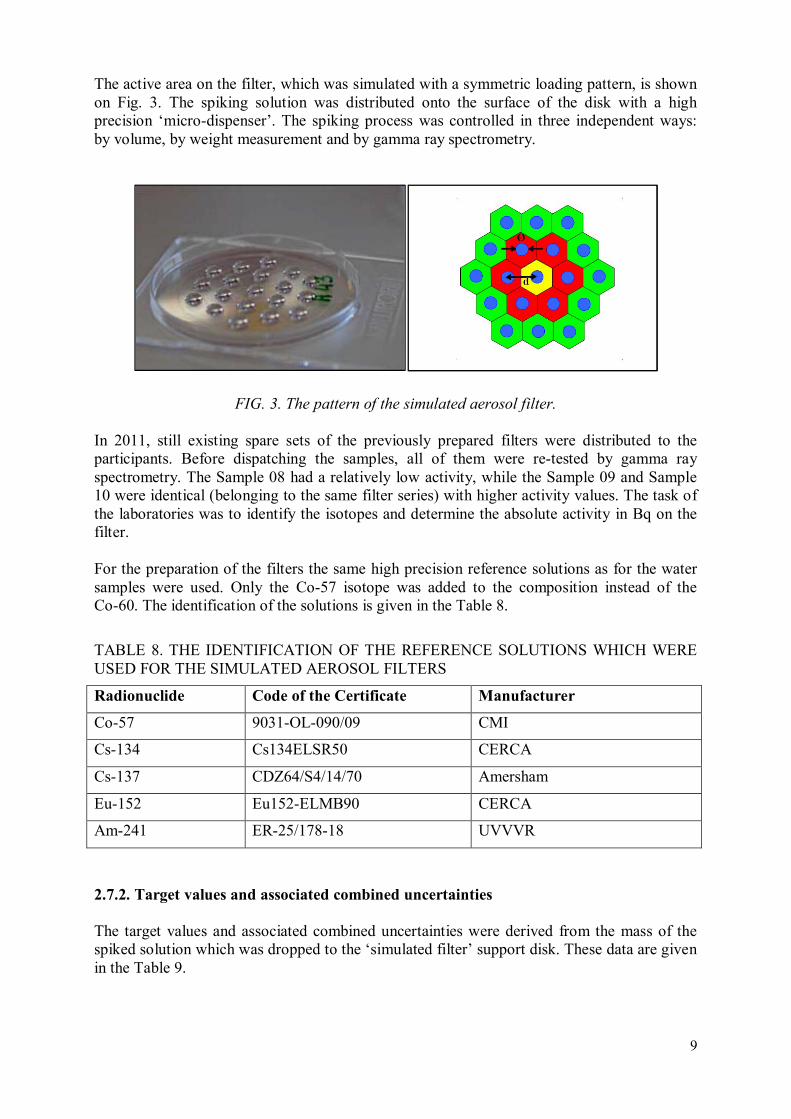
The active area on the filter, which was simulated with a symmetric loading pattern, is shown
on Fig. 3. The spiking solution was distributed onto the surface of the disk with a high
precision ‘micro-dispenser’. The spiking process was controlled in three independent ways:
by volume, by weight measurement and by gamma ray spectrometry.
FIG. 3. The pattern of the simulated aerosol filter.
In 2011, still existing spare sets of the previously prepared filters were distributed to the
participants. Before dispatching the samples, all of them were re-tested by gamma ray
spectrometry. The Sample 08 had a relatively low activity, while the Sample 09 and Sample
10 were identical (belonging to the same filter series) with higher activity values. The task of
the laboratories was to identify the isotopes and determine the absolute activity in Bq on the
filter.
For the preparation of the filters the same high precision reference solutions as for the water
samples were used. Only the Co-57 isotope was added to the composition instead of the
Co-60. The identification of the solutions is given in the Table 8.
TABLE 8. THE IDENTIFICATION OF THE REFERENCE SOLUTIONS WHICH WERE
USED FOR THE SIMULATED AEROSOL FILTERS
Radionuclide Code of the Certificate Manufacturer
Co-57 9031-OL-090/09 CMI
Cs-134 Cs134ELSR50 CERCA
Cs-137 CDZ64/S4/14/70 Amersham
Eu-152 Eu152-ELMB90 CERCA
Am-241 ER-25/178-18 UVVVR
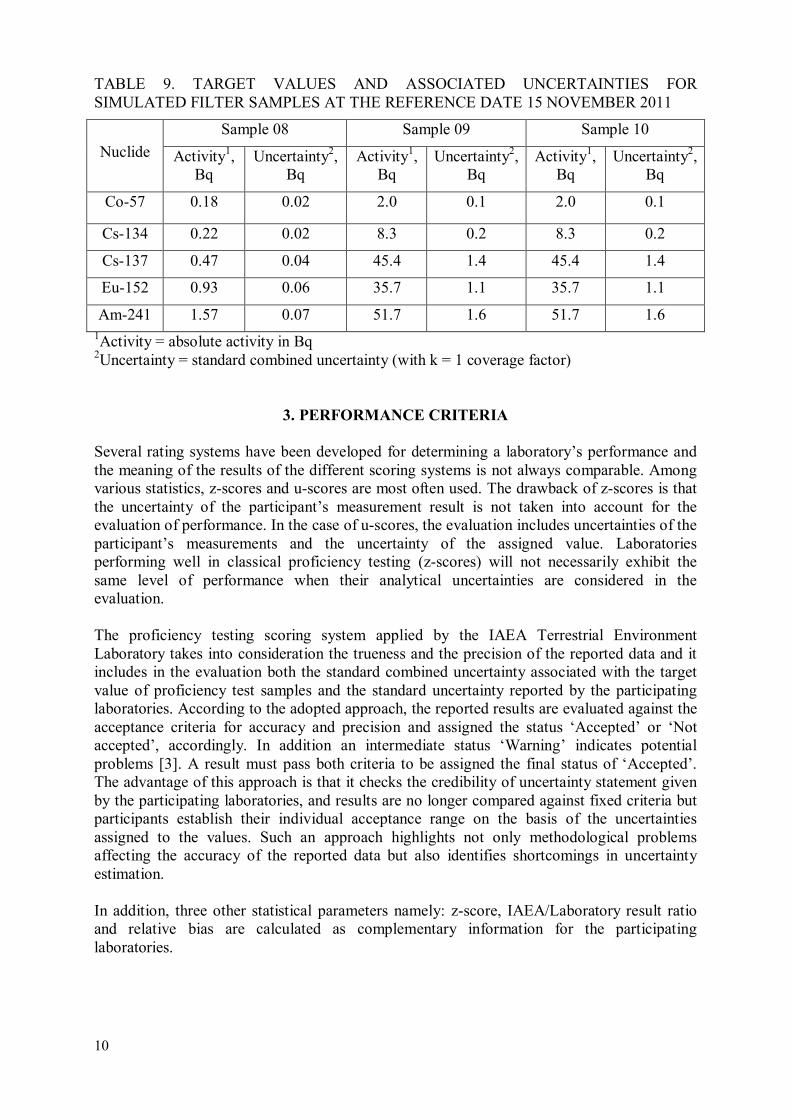
2.7.2. Target values and associated combined uncertainties
The target values and associated combined uncertainties were derived from the mass of the
spiked solution which was dropped to the ‘simulated filter’ support disk. These data are given
in the Table 9.
10
TABLE 9. TARGET VALUES AND ASSOCIATED UNCERTAINTIES FOR
SIMULATED FILTER SAMPLES AT THE REFERENCE DATE 15 NOVEMBER 2011
Nuclide
Sample 08 Sample 09 Sample 10
Activity1,
Bq
Uncertainty2,
Bq
Activity1,
Bq
Uncertainty2,
Bq
Activity1,
Bq
Uncertainty2,
Bq
Co-57 0.18 0.02 2.0 0.1 2.0 0.1
Cs-134 0.22 0.02 8.3 0.2 8.3 0.2
Cs-137 0.47 0.04 45.4 1.4 45.4 1.4
Eu-152 0.93 0.06 35.7 1.1 35.7 1.1
Am-241 1.57 0.07 51.7 1.6 51.7 1.6
1Activity = absolute activity in Bq
2Uncertainty = standard combined uncertainty (with k = 1 coverage factor)
3. PERFORMANCE CRITERIA
Several rating systems have been developed for determining a laboratory’s performance and
the meaning of the results of the different scoring systems is not always comparable. Among
various statistics, z-scores and u-scores are most often used. The drawback of z-scores is that
the uncertainty of the participant’s measurement result is not taken into account for the
evaluation of performance. In the case of u-scores, the evaluation includes uncertainties of the
participant’s measurements and the uncertainty of the assigned value. Laboratories
performing well in classical proficiency testing (z-scores) will not necessarily exhibit the
same level of performance when their analytical uncertainties are considered in the
evaluation.
The proficiency testing scoring system applied by the IAEA Terrestrial Environment
Laboratory takes into consideration the trueness and the precision of the reported data and it
includes in the evaluation both the standard combined uncertainty associated with the target
value of proficiency test samples and the standard uncertainty reported by the participating
laboratories. According to the adopted approach, the reported results are evaluated against the
acceptance criteria for accuracy and precision and assigned the status ‘Accepted’ or ‘Not
accepted’, accordingly. In addition an intermediate status ‘Warning’ indicates potential
problems [3]. A result must pass both criteria to be assigned the final status of ‘Accepted’.
The advantage of this approach is that it checks the credibility of uncertainty statement given
by the participating laboratories, and results are no longer compared against fixed criteria but
participants establish their individual acceptance range on the basis of the uncertainties
assigned to the values. Such an approach highlights not only methodological problems
affecting the accuracy of the reported data but also identifies shortcomings in uncertainty
estimation.
In addition, three other statistical parameters namely: z-score, IAEA/Laboratory result ratio
and relative bias are calculated as complementary information for the participating
laboratories.
11
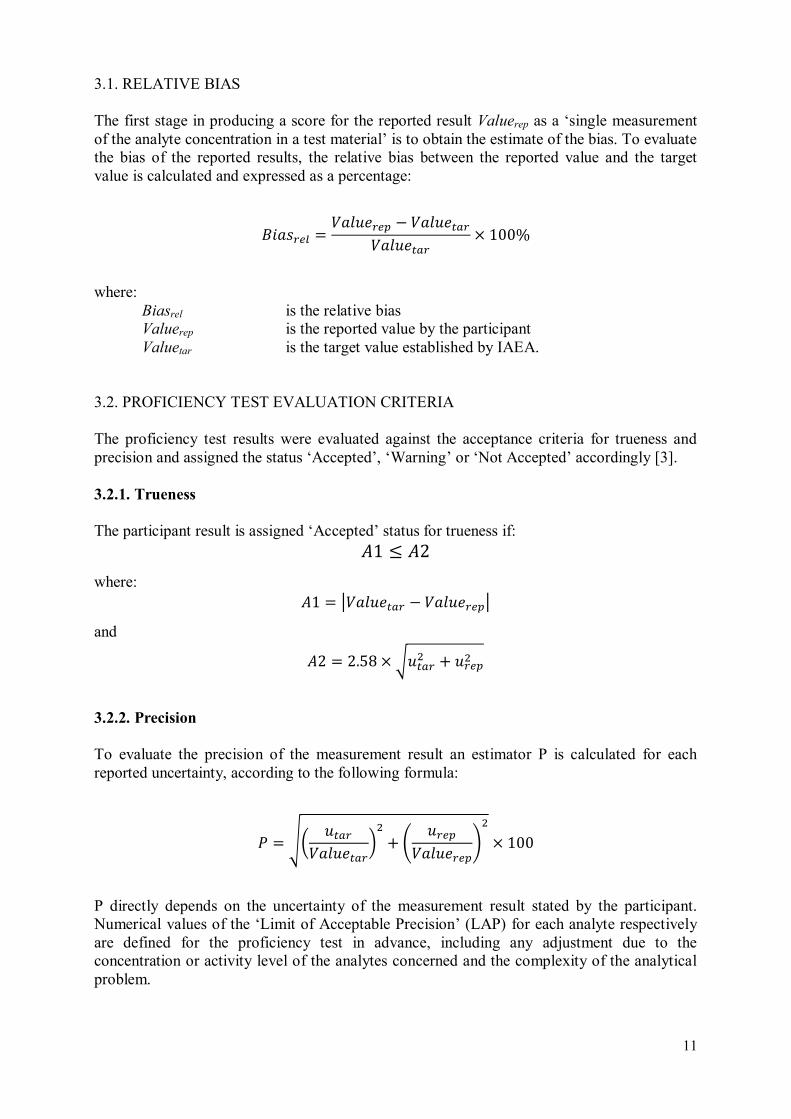
3.1. RELATIVE BIAS
The first stage in producing a score for the reported result Valuerep as a ‘single measurement
of the analyte concentration in a test material’ is to obtain the estimate of the bias. To evaluate
the bias of the reported results, the relative bias between the reported value and the target
value is calculated and expressed as a percentage:
������� = ����� − ������������ × 100%
where:
Biasrel is the relative bias
Valuerep is the reported value by the participant
Valuetar is the target value established by IAEA.
3.2. PROFICIENCY TEST EVALUATION CRITERIA
The proficiency test results were evaluated against the acceptance criteria for trueness and
precision and assigned the status ‘Accepted’, ‘Warning’ or ‘Not Accepted’ accordingly [3].
3.2.1. Trueness
The participant result is assigned ‘Accepted’ status for trueness if: �1 ≤ �2
where: �1 = ������� − ����� � and
�2 = 2.58 × ������ + ��� �
3.2.2. Precision
To evaluate the precision of the measurement result an estimator P is calculated for each
reported uncertainty, according to the following formula:
� = ! ����������"� + # ��� ����� $
� × 100
P directly depends on the uncertainty of the measurement result stated by the participant.
Numerical values of the ‘Limit of Acceptable Precision’ (LAP) for each analyte respectively
are defined for the proficiency test in advance, including any adjustment due to the
concentration or activity level of the analytes concerned and the complexity of the analytical
problem.
12
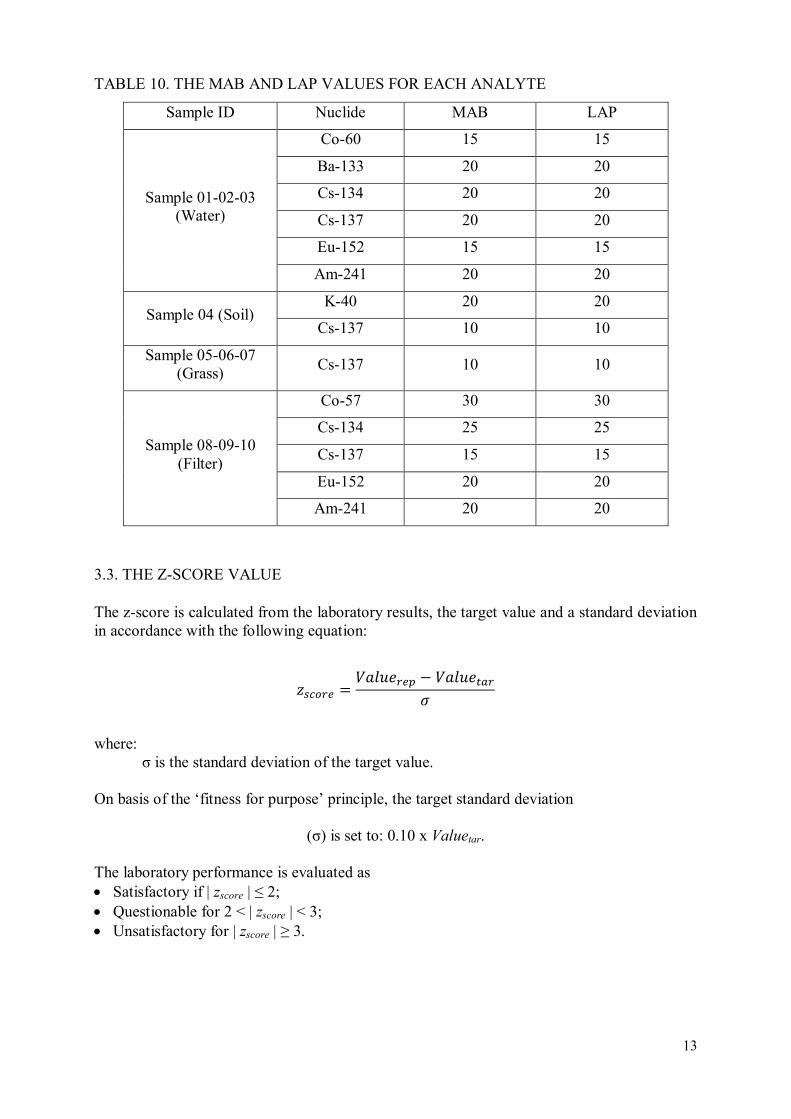
Participants’ results are scored as ‘Accepted’ for the stated uncertainty when P ≤ LAP. The
LAP values used in the evaluation of all radionuclides are listed in Table 10. In the final
evaluation, both scores for trueness and precision are combined. A result must obtain an
‘Accepted’ score in both criteria to be assigned the final score ‘Accepted’. Obviously, if a
score of ‘Not accepted’ was obtained for both trueness and precision, the final score will also
be ‘Not accepted’. In cases where either precision or trueness is ‘Not accepted’, a further
check is applied. The reported relative bias (Biasrel) is compared with the maximum
acceptable bias (MAB). If Biasrel ≤ MAB, the final score will be ‘Accepted with warning’.
‘Warning’ will reflect mainly two situations. The first situation will be a result with small
measurement uncertainty; however its bias is still within MAB. The second situation will
appear when a result close to the assigned property value is reported, but the associated
uncertainty is large.
If Bias > MAB, the result will be ‘Not accepted’. The MAB values used in the evaluation of
all radionuclides are listed in Table 10.
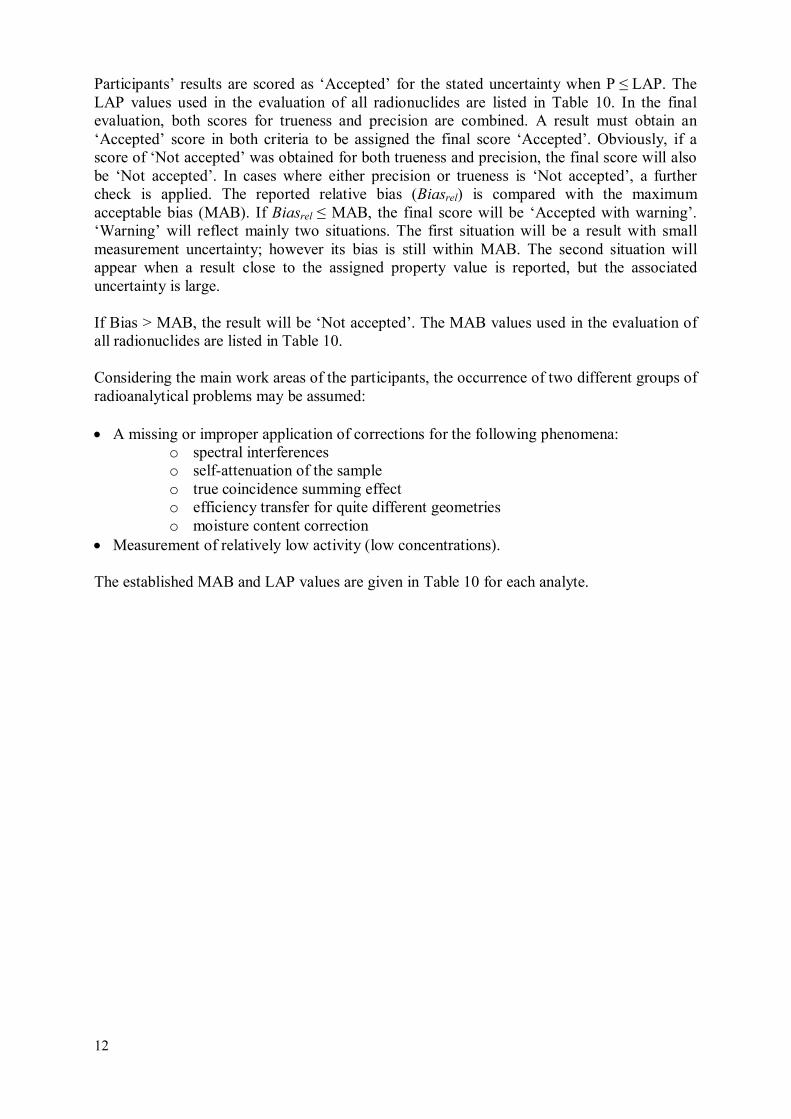
Considering the main work areas of the participants, the occurrence of two different groups of
radioanalytical problems may be assumed:
• A missing or improper application of corrections for the following phenomena:
o spectral interferences
o self-attenuation of the sample
o true coincidence summing effect
o efficiency transfer for quite different geometries
o moisture content correction
• Measurement of relatively low activity (low concentrations).
The established MAB and LAP values are given in Table 10 for each analyte.
13
TABLE 10. THE MAB AND LAP VALUES FOR EACH ANALYTE
Sample ID Nuclide MAB LAP
Sample 01-02-03
(Water)
Co-60 15 15
Ba-133 20 20
Cs-134 20 20
Cs-137 20 20
Eu-152 15 15
Am-241 20 20
Sample 04 (Soil) K-40 20 20
Cs-137
10 10
Sample 05-06-07
(Grass) Cs-137
10 10
Sample 08-09-10
(Filter)
Co-57
30 30
Cs-134
25 25
Cs-137
15 15
Eu-152
20 20
Am-241
20 20
3.3. THE Z-SCORE VALUE
The z-score is calculated from the laboratory results, the target value and a standard deviation
in accordance with the following equation:
%&'(�� = ����� − ������)
where:
σ is the standard deviation of the target value.
On basis of the ‘fitness for purpose’ principle, the target standard deviation
(σ) is set to: 0.10 x Valuetar.
The laboratory performance is evaluated as
• Satisfactory if | zscore | ≤ 2;
• Questionable for 2 < | zscore | < 3;
• Unsatisfactory for | zscore | ≥ 3.
14
3.4. THE U-SCORE VALUE
The value of the utest was calculated according to the following equation:
���&� = ������� − ����� ������� + ��� �
where:
utest is the value of the u-test
utar is the uncertainty of the target value
urep is the uncertainty of the reported value.
This value was compared with the critical value listed in the t-statistic tables to determine if
the reported result differs significantly from the expected value at a given level of probability.
The advantage of the utest is that it takes into consideration the propagation of measurement
uncertainties when defining the combined standard uncertainty. This is especially useful when
evaluating results, which uncertainty may overlap with the reference interval.
The limiting value for the u-test parameter has been set to 2.58 for this proficiency test for a
level of probability at 99%. A result passes the test if u < 2.58.
4. RESULTS AND DISCUSSION
4.1. GENERAL
During the IAEA-TEL-2011-08 proficiency test 21 sample sets were distributed to the
participants and 19 of them reported back their measurement results. Altogether 521
measurement results were evaluated for the assessment of the laboratories’ performance.
The individual evaluation of each laboratory has been sent shortly after the reporting deadline
and closing of the database to give to each laboratory an opportunity to identify any analytical
problem and to take any rapid action for necessary improvement. These evaluations are
summarised in the Appendix I.
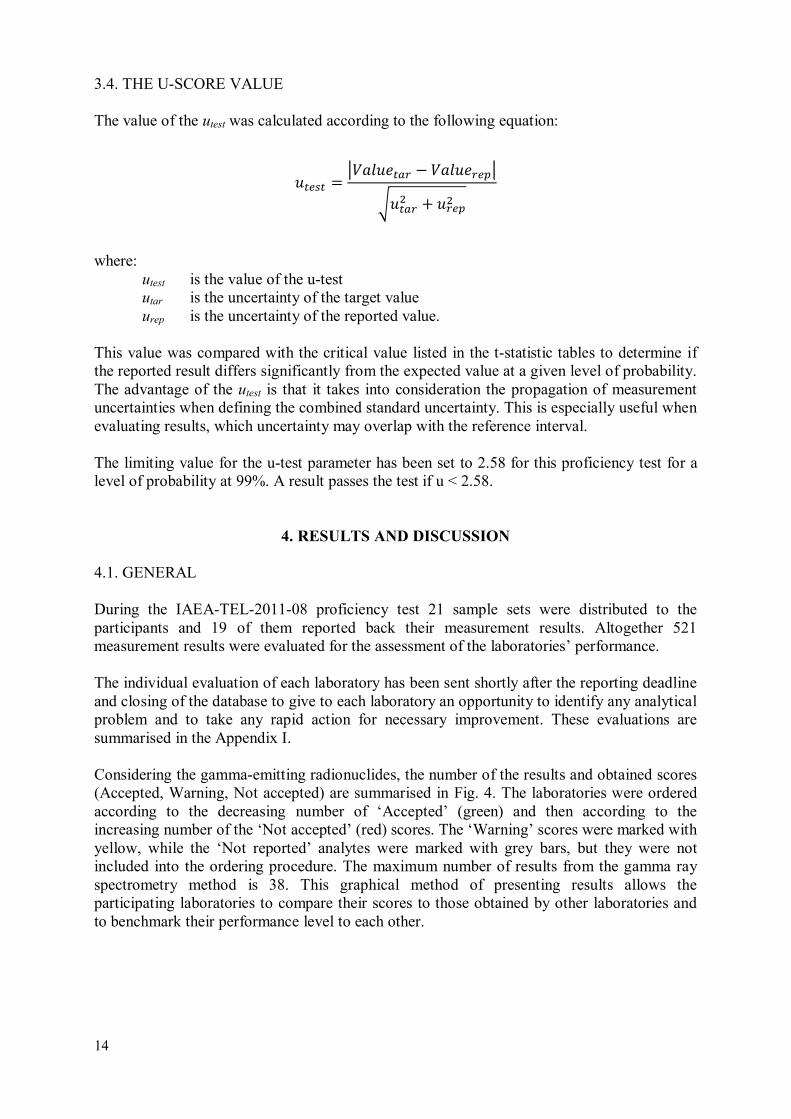
Considering the gamma-emitting radionuclides, the number of the results and obtained scores
(Accepted, Warning, Not accepted) are summarised in Fig. 4. The laboratories were ordered
according to the decreasing number of ‘Accepted’ (green) and then according to the
increasing number of the ‘Not accepted’ (red) scores. The ‘Warning’ scores were marked with
yellow, while the ‘Not reported’ analytes were marked with grey bars, but they were not
included into the ordering procedure. The maximum number of results from the gamma ray
spectrometry method is 38. This graphical method of presenting results allows the
participating laboratories to compare their scores to those obtained by other laboratories and
to benchmark their performance level to each other.
15
FIG. 4. Overall performance of the laboratories.
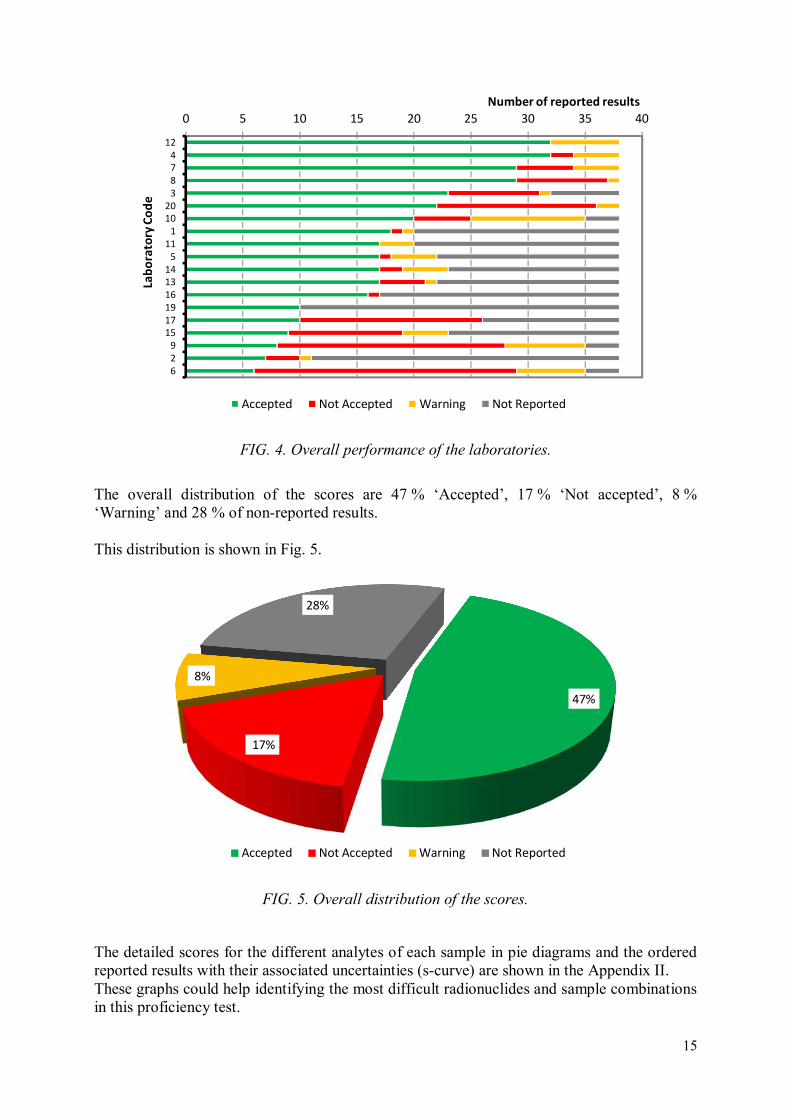
The overall distribution of the scores are 47 % ‘Accepted’, 17 % ‘Not accepted’, 8 %
‘Warning’ and 28 % of non-reported results.
This distribution is shown in Fig. 5.
FIG. 5. Overall distribution of the scores.
The detailed scores for the different analytes of each sample in pie diagrams and the ordered
reported results with their associated uncertainties (s-curve) are shown in the Appendix II.
These graphs could help identifying the most difficult radionuclides and sample combinations
in this proficiency test.
0 5 10 15 20 25 30 35 40
12
4
7
8
3
20
10
1
11
5
14
13
16
19
17
15
9
2
6
Number of reported results
Lab
ora
tory
Co
de
Accepted Not Accepted Warning Not Reported
47%
17%
8%
28%
Accepted Not Accepted Warning Not Reported
16
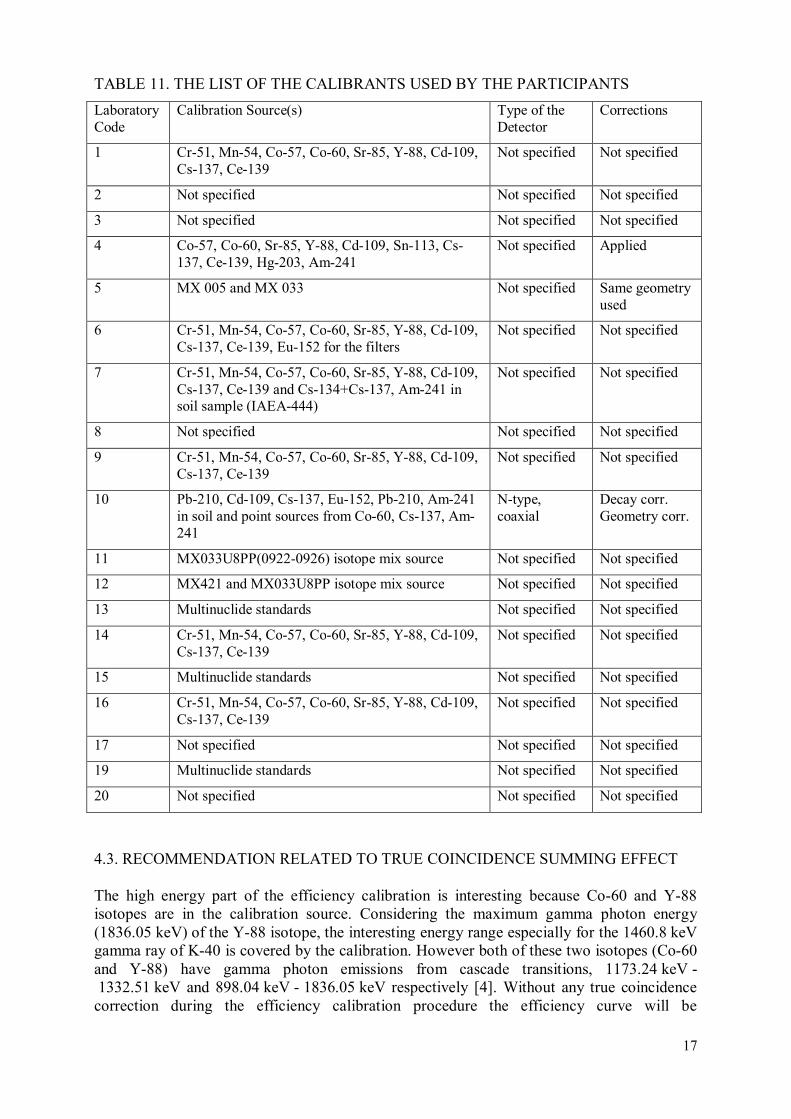
4.2. RECOMMENDATION FOR THE CALIBRATED ENERGY RANGE
The reported information about the calibration used by the laboratories is summarised in the
Table 11. The calibration source which is available at most of the laboratories contains Cr-51,
Mn-54, Co-57, Co-60, Sr-85, Y-88, Cd-109, Cs-137 and Ce-139 isotopes. In this calibration
source the Cd-109 represents the lowest energy point at 88.03 keV. If the gamma ray
spectrometer system is equipped with a n-type, or XtRA, or BEGe (broad energy) detector, it
is sensitive enough for the low energy range down to 15-25 keV, depending on the material of
the end-cup, the entrance window, and the internal structure of the detector. If the monitoring
task includes the determination of the low energy gamma-emitting isotopes, or if the
laboratory wishes to use the full energy range of the detector, the calibration source should
contain in addition the Pb-210 (46.54 keV) and Am-241 (59.54 keV) isotopes. Only the
laboratories No.4 and 10 had this possibility.
The efficiency calculated by an extrapolation process (out of the calibrated range) may be
subject to a serious uncontrolled bias.
17
TABLE 11. THE LIST OF THE CALIBRANTS USED BY THE PARTICIPANTS
Laboratory
Code
Calibration Source(s) Type of the
Detector
Corrections
1 Cr-51, Mn-54, Co-57, Co-60, Sr-85, Y-88, Cd-109,
Cs-137, Ce-139
Not specified Not specified
2 Not specified Not specified Not specified
3 Not specified Not specified Not specified
4 Co-57, Co-60, Sr-85, Y-88, Cd-109, Sn-113, Cs-
137, Ce-139, Hg-203, Am-241
Not specified Applied
5 MX 005 and MX 033 Not specified Same geometry
used
6 Cr-51, Mn-54, Co-57, Co-60, Sr-85, Y-88, Cd-109,
Cs-137, Ce-139, Eu-152 for the filters
Not specified Not specified
7 Cr-51, Mn-54, Co-57, Co-60, Sr-85, Y-88, Cd-109,
Cs-137, Ce-139 and Cs-134+Cs-137, Am-241 in soil sample (IAEA-444)
Not specified Not specified
8 Not specified Not specified Not specified
9 Cr-51, Mn-54, Co-57, Co-60, Sr-85, Y-88, Cd-109,
Cs-137, Ce-139
Not specified Not specified
10 Pb-210, Cd-109, Cs-137, Eu-152, Pb-210, Am-241
in soil and point sources from Co-60, Cs-137, Am-
241
N-type,
coaxial
Decay corr.
Geometry corr.
11 MX033U8PP(0922-0926) isotope mix source Not specified Not specified
12 MX421 and MX033U8PP isotope mix source Not specified Not specified
13 Multinuclide standards Not specified Not specified
14 Cr-51, Mn-54, Co-57, Co-60, Sr-85, Y-88, Cd-109,
Cs-137, Ce-139
Not specified Not specified
15 Multinuclide standards Not specified Not specified
16 Cr-51, Mn-54, Co-57, Co-60, Sr-85, Y-88, Cd-109,
Cs-137, Ce-139
Not specified Not specified
17 Not specified Not specified Not specified
19 Multinuclide standards Not specified Not specified
20 Not specified Not specified Not specified
4.3. RECOMMENDATION RELATED TO TRUE COINCIDENCE SUMMING EFFECT
The high energy part of the efficiency calibration is interesting because Co-60 and Y-88
isotopes are in the calibration source. Considering the maximum gamma photon energy
(1836.05 keV) of the Y-88 isotope, the interesting energy range especially for the 1460.8 keV
gamma ray of K-40 is covered by the calibration. However both of these two isotopes (Co-60
and Y-88) have gamma photon emissions from cascade transitions, 1173.24 keV -
1332.51 keV and 898.04 keV - 1836.05 keV respectively [4]. Without any true coincidence
correction during the efficiency calibration procedure the efficiency curve will be
18
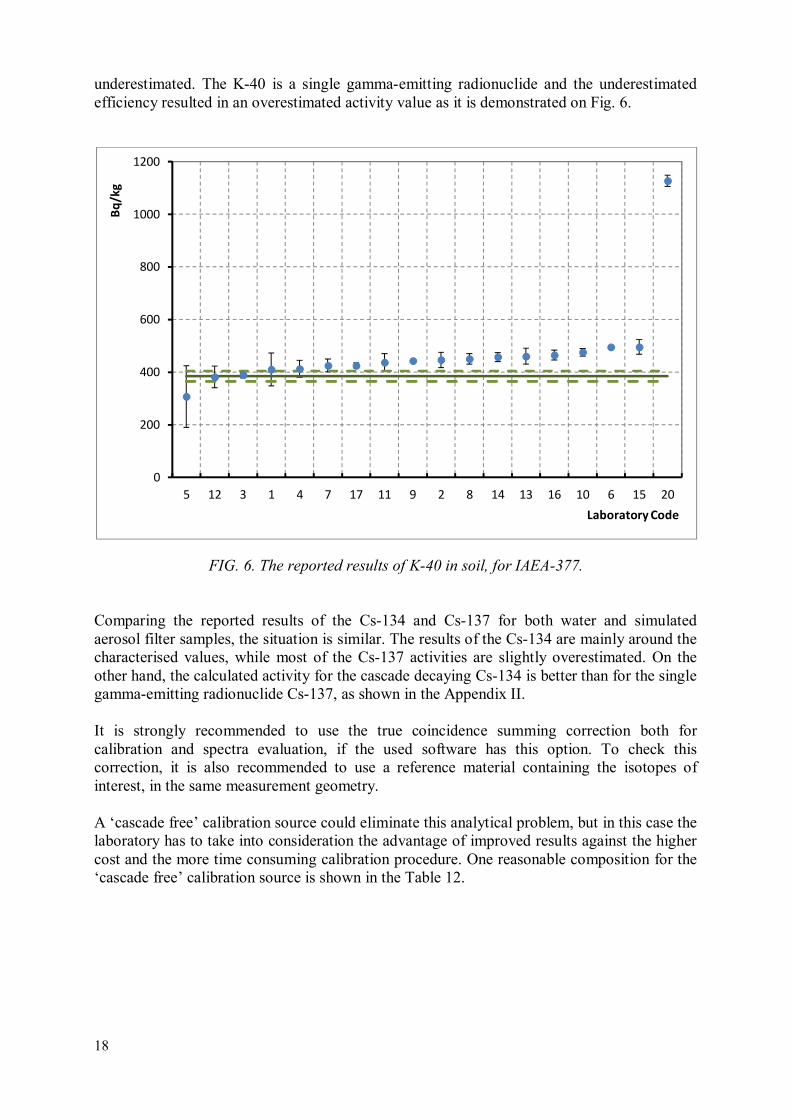
underestimated. The K-40 is a single gamma-emitting radionuclide and the underestimated
efficiency resulted in an overestimated activity value as it is demonstrated on Fig. 6.
FIG. 6. The reported results of K-40 in soil, for IAEA-377.
Comparing the reported results of the Cs-134 and Cs-137 for both water and simulated
aerosol filter samples, the situation is similar. The results of the Cs-134 are mainly around the
characterised values, while most of the Cs-137 activities are slightly overestimated. On the
other hand, the calculated activity for the cascade decaying Cs-134 is better than for the single
gamma-emitting radionuclide Cs-137, as shown in the Appendix II.
It is strongly recommended to use the true coincidence summing correction both for
calibration and spectra evaluation, if the used software has this option. To check this
correction, it is also recommended to use a reference material containing the isotopes of
interest, in the same measurement geometry.
A ‘cascade free’ calibration source could eliminate this analytical problem, but in this case the
laboratory has to take into consideration the advantage of improved results against the higher
cost and the more time consuming calibration procedure. One reasonable composition for the
‘cascade free’ calibration source is shown in the Table 12.
0
200
400
600
800
1000
1200
5 12 3 1 4 7 17 11 9 2 8 14 13 16 10 6 15 20
Bq
/kg
Laboratory Code
19
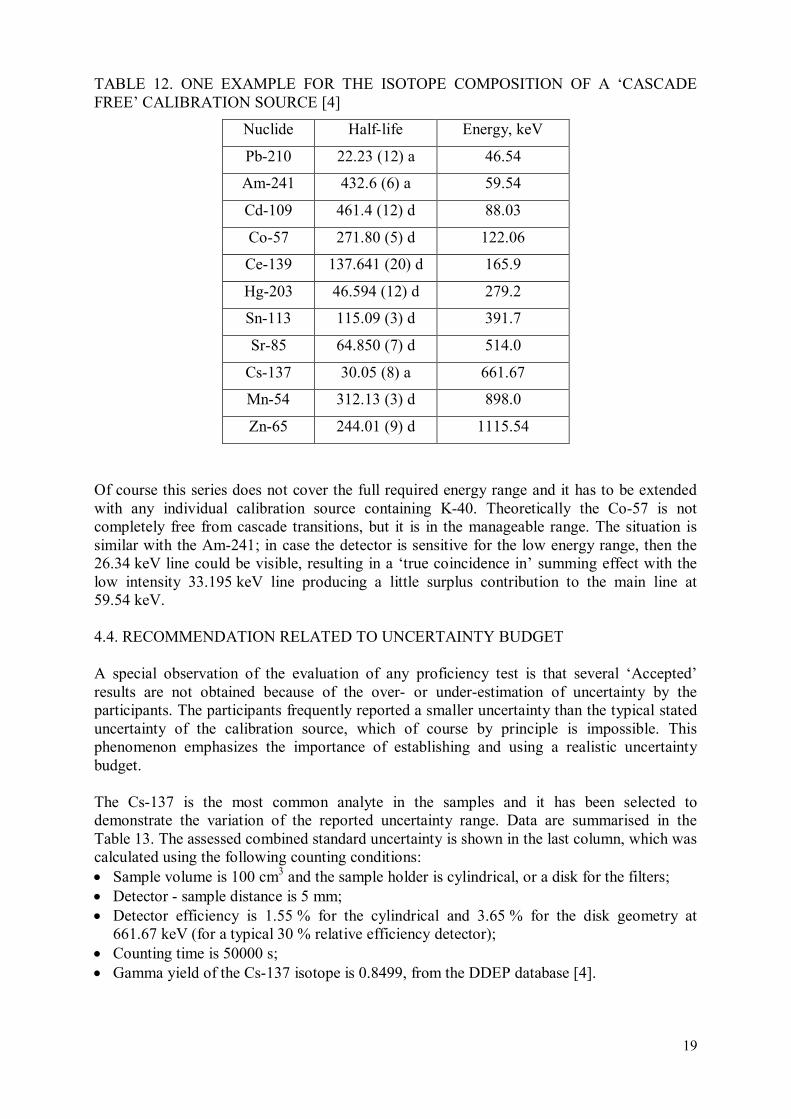
TABLE 12. ONE EXAMPLE FOR THE ISOTOPE COMPOSITION OF A ‘CASCADE
FREE’ CALIBRATION SOURCE [4]
Nuclide Half-life Energy, keV
Pb-210 22.23 (12) a 46.54
Am-241 432.6 (6) a 59.54
Cd-109 461.4 (12) d 88.03
Co-57 271.80 (5) d 122.06
Ce-139 137.641 (20) d 165.9
Hg-203 46.594 (12) d 279.2
Sn-113 115.09 (3) d 391.7
Sr-85 64.850 (7) d 514.0
Cs-137 30.05 (8) a 661.67
Mn-54 312.13 (3) d 898.0
Zn-65 244.01 (9) d 1115.54
Of course this series does not cover the full required energy range and it has to be extended
with any individual calibration source containing K-40. Theoretically the Co-57 is not
completely free from cascade transitions, but it is in the manageable range. The situation is
similar with the Am-241; in case the detector is sensitive for the low energy range, then the
26.34 keV line could be visible, resulting in a ‘true coincidence in’ summing effect with the
low intensity 33.195 keV line producing a little surplus contribution to the main line at
59.54 keV.
4.4. RECOMMENDATION RELATED TO UNCERTAINTY BUDGET
A special observation of the evaluation of any proficiency test is that several ‘Accepted’
results are not obtained because of the over- or under-estimation of uncertainty by the
participants. The participants frequently reported a smaller uncertainty than the typical stated
uncertainty of the calibration source, which of course by principle is impossible. This
phenomenon emphasizes the importance of establishing and using a realistic uncertainty
budget.
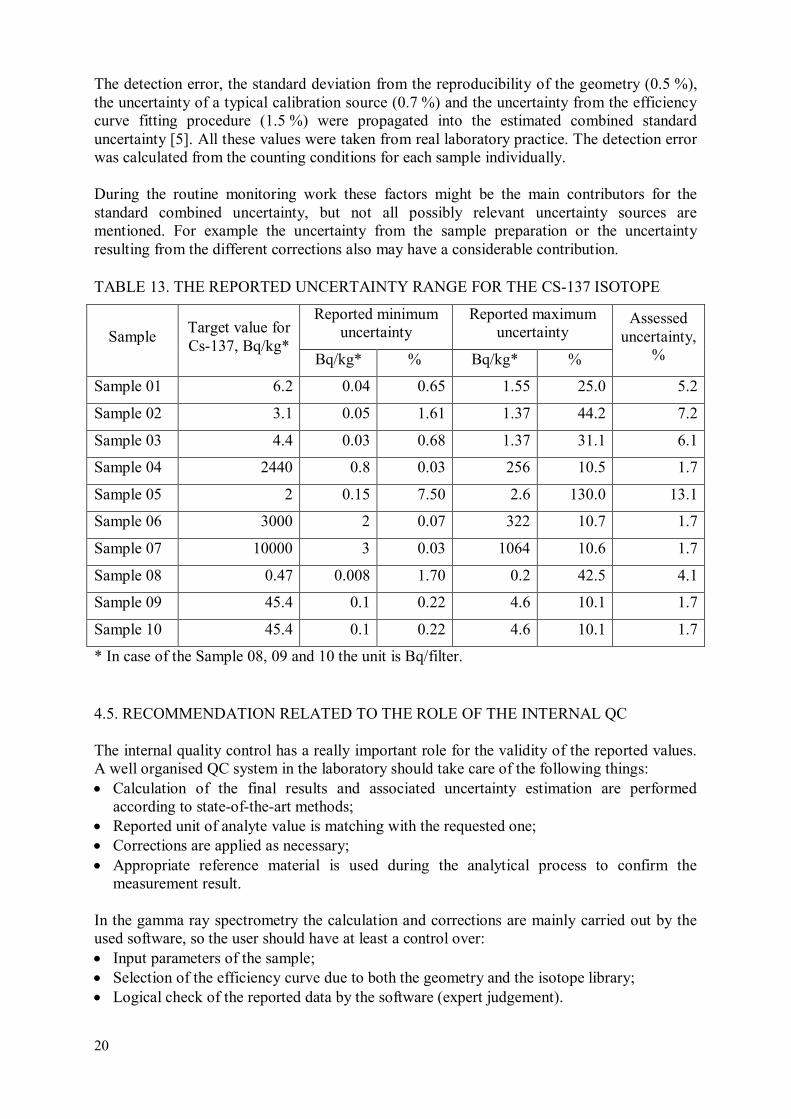
The Cs-137 is the most common analyte in the samples and it has been selected to
demonstrate the variation of the reported uncertainty range. Data are summarised in the
Table 13. The assessed combined standard uncertainty is shown in the last column, which was
calculated using the following counting conditions:
• Sample volume is 100 cm3 and the sample holder is cylindrical, or a disk for the filters;
• Detector - sample distance is 5 mm;
• Detector efficiency is 1.55 % for the cylindrical and 3.65 % for the disk geometry at
661.67 keV (for a typical 30 % relative efficiency detector);
• Counting time is 50000 s;
• Gamma yield of the Cs-137 isotope is 0.8499, from the DDEP database [4].
20
The detection error, the standard deviation from the reproducibility of the geometry (0.5 %),
the uncertainty of a typical calibration source (0.7 %) and the uncertainty from the efficiency
curve fitting procedure (1.5 %) were propagated into the estimated combined standard
uncertainty [5]. All these values were taken from real laboratory practice. The detection error
was calculated from the counting conditions for each sample individually.
During the routine monitoring work these factors might be the main contributors for the
standard combined uncertainty, but not all possibly relevant uncertainty sources are
mentioned. For example the uncertainty from the sample preparation or the uncertainty
resulting from the different corrections also may have a considerable contribution.
TABLE 13. THE REPORTED UNCERTAINTY RANGE FOR THE CS-137 ISOTOPE
Sample Target value for
Cs-137, Bq/kg*
Reported minimum
uncertainty
Reported maximum
uncertainty Assessed
uncertainty,
% Bq/kg* % Bq/kg* %
Sample 01 6.2 0.04 0.65 1.55 25.0 5.2
Sample 02 3.1 0.05 1.61 1.37 44.2 7.2
Sample 03 4.4 0.03 0.68 1.37 31.1 6.1
Sample 04 2440 0.8 0.03 256 10.5 1.7
Sample 05 2 0.15 7.50 2.6 130.0 13.1
Sample 06 3000 2 0.07 322 10.7 1.7
Sample 07 10000 3 0.03 1064 10.6 1.7
Sample 08 0.47 0.008 1.70 0.2 42.5 4.1
Sample 09 45.4 0.1 0.22 4.6 10.1 1.7
Sample 10 45.4 0.1 0.22 4.6 10.1 1.7
* In case of the Sample 08, 09 and 10 the unit is Bq/filter.
4.5. RECOMMENDATION RELATED TO THE ROLE OF THE INTERNAL QC
The internal quality control has a really important role for the validity of the reported values.
A well organised QC system in the laboratory should take care of the following things:
• Calculation of the final results and associated uncertainty estimation are performed
according to state-of-the-art methods;
• Reported unit of analyte value is matching with the requested one;
• Corrections are applied as necessary;
• Appropriate reference material is used during the analytical process to confirm the
measurement result.
In the gamma ray spectrometry the calculation and corrections are mainly carried out by the
used software, so the user should have at least a control over:
• Input parameters of the sample;
• Selection of the efficiency curve due to both the geometry and the isotope library;
• Logical check of the reported data by the software (expert judgement).
21
A major goal for the measurement of reference materials is to keep the bias under control. For
this purpose, several requirements for suitable reference materials are listed below:
• Both the assigned value and its uncertainty should be stated in the certificate for the
analyte;
• Homogeneity and stability of the reference material should be documented;
• Matrix should be similar to the sample (at least the density of the matrix);
• Range of the activity concentration or massic activity should be in the same order of
magnitude as for the sample.
The characterised value of the reference material should be independent from the calibration
source.
4.6. FINAL MEETING WITH PARTICIPANTS IN JAPAN IN OCTOBER 2012
On 11 October 2012, on invitation of the University of Tsukuba, Japan, one author (S. Tarjan)
attended a seminar at their Faculty of Life and Environmental Sciences in Japan and provided
a lecture on the results of the proficiency test. The seminar was attended by 45 participants.
The participants expressed their strong interest for similar future proficiency tests on special
samples originated from Japan, like rice, soil and seafood (seaweed, fish).
5. CONCLUSIONS
The IAEA-TEL-2011-08 proficiency test dedicated to Japanese laboratories on emergency
response environmental radioactivity measurements in a wide range of environmental
matrices was successfully completed. The laboratories taking part in this proficiency test in
general could perform the most important radioanalytical monitoring tasks in emergency
situations using gamma ray spectrometry. This is demonstrated by the 70-84 % fraction of
accepted results for Cs-134 and Cs-137 in water, grass and soil samples.
One important finding of this proficiency test is the identification of shortcomings of the
performance of certain laboratories. Future improvements may include the application of
necessary method specific corrections, quality control mechanism, method validation and the
implementation of an appropriate uncertainty estimation process.

23
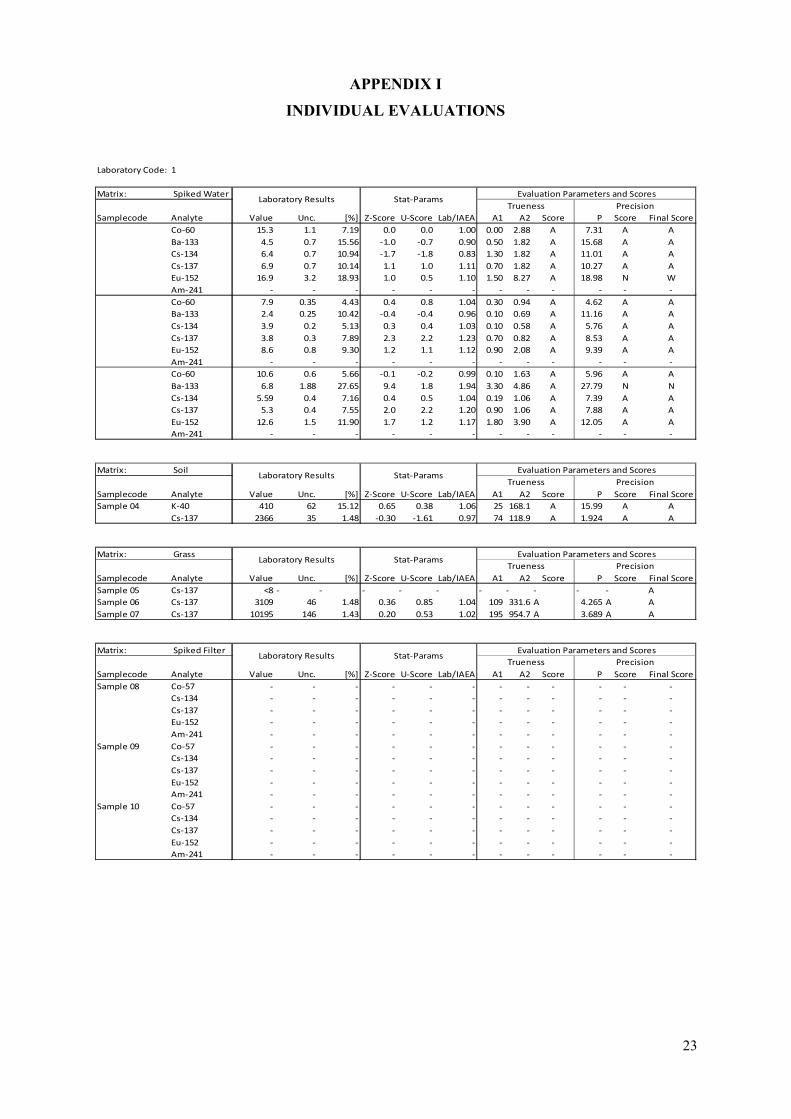
APPENDIX I
INDIVIDUAL EVALUATIONS
Laboratory Code: 1
Matrix: Spiked Water
Samplecode Analyte Value Unc. [%] Z-Score U-Score Lab/IAEA A1 A2 Score P Score Final Score
Co-60 15.3 1.1 7.19 0.0 0.0 1.00 0.00 2.88 A 7.31 A A
Ba-133 4.5 0.7 15.56 -1.0 -0.7 0.90 0.50 1.82 A 15.68 A A
Cs-134 6.4 0.7 10.94 -1.7 -1.8 0.83 1.30 1.82 A 11.01 A A
Cs-137 6.9 0.7 10.14 1.1 1.0 1.11 0.70 1.82 A 10.27 A A
Eu-152 16.9 3.2 18.93 1.0 0.5 1.10 1.50 8.27 A 18.98 N W
Am-241 - - - - - - - - - - - -
Co-60 7.9 0.35 4.43 0.4 0.8 1.04 0.30 0.94 A 4.62 A A
Ba-133 2.4 0.25 10.42 -0.4 -0.4 0.96 0.10 0.69 A 11.16 A A
Cs-134 3.9 0.2 5.13 0.3 0.4 1.03 0.10 0.58 A 5.76 A A
Cs-137 3.8 0.3 7.89 2.3 2.2 1.23 0.70 0.82 A 8.53 A A
Eu-152 8.6 0.8 9.30 1.2 1.1 1.12 0.90 2.08 A 9.39 A A
Am-241 - - - - - - - - - - - -
Co-60 10.6 0.6 5.66 -0.1 -0.2 0.99 0.10 1.63 A 5.96 A A
Ba-133 6.8 1.88 27.65 9.4 1.8 1.94 3.30 4.86 A 27.79 N N
Cs-134 5.59 0.4 7.16 0.4 0.5 1.04 0.19 1.06 A 7.39 A A
Cs-137 5.3 0.4 7.55 2.0 2.2 1.20 0.90 1.06 A 7.88 A A
Eu-152 12.6 1.5 11.90 1.7 1.2 1.17 1.80 3.90 A 12.05 A A
Am-241 - - - - - - - - - - - -
Matrix: Soil
Samplecode Analyte Value Unc. [%] Z-Score U-Score Lab/IAEA A1 A2 Score P Score Final Score
Sample 04 K-40 410 62 15.12 0.65 0.38 1.06 25 168.1 A 15.99 A A
Cs-137 2366 35 1.48 -0.30 -1.61 0.97 74 118.9 A 1.924 A A
Matrix: Grass
Samplecode Analyte Value Unc. [%] Z-Score U-Score Lab/IAEA A1 A2 Score P Score Final Score
Sample 05 Cs-137 <8 - - - - - - - - - - A
Sample 06 Cs-137 3109 46 1.48 0.36 0.85 1.04 109 331.6 A 4.265 A A
Sample 07 Cs-137 10195 146 1.43 0.20 0.53 1.02 195 954.7 A 3.689 A A
Matrix: Spiked Filter
Samplecode Analyte Value Unc. [%] Z-Score U-Score Lab/IAEA A1 A2 Score P Score Final Score
Sample 08 Co-57 - - - - - - - - - - - -
Cs-134 - - - - - - - - - - - -
Cs-137 - - - - - - - - - - - -
Eu-152 - - - - - - - - - - - -
Am-241 - - - - - - - - - - - -
Sample 09 Co-57 - - - - - - - - - - - -
Cs-134 - - - - - - - - - - - -
Cs-137 - - - - - - - - - - - -
Eu-152 - - - - - - - - - - - -
Am-241 - - - - - - - - - - - -
Sample 10 Co-57 - - - - - - - - - - - -
Cs-134 - - - - - - - - - - - -
Cs-137 - - - - - - - - - - - -
Eu-152 - - - - - - - - - - - -
Am-241 - - - - - - - - - - - -
Laboratory Results Stat-ParamsEvaluation Parameters and Scores
Trueness Precision
Laboratory Results Stat-ParamsEvaluation Parameters and Scores
Trueness Precision
Laboratory Results Stat-ParamsEvaluation Parameters and Scores
Trueness Precision
Laboratory Results Stat-ParamsEvaluation Parameters and Scores
Trueness Precision
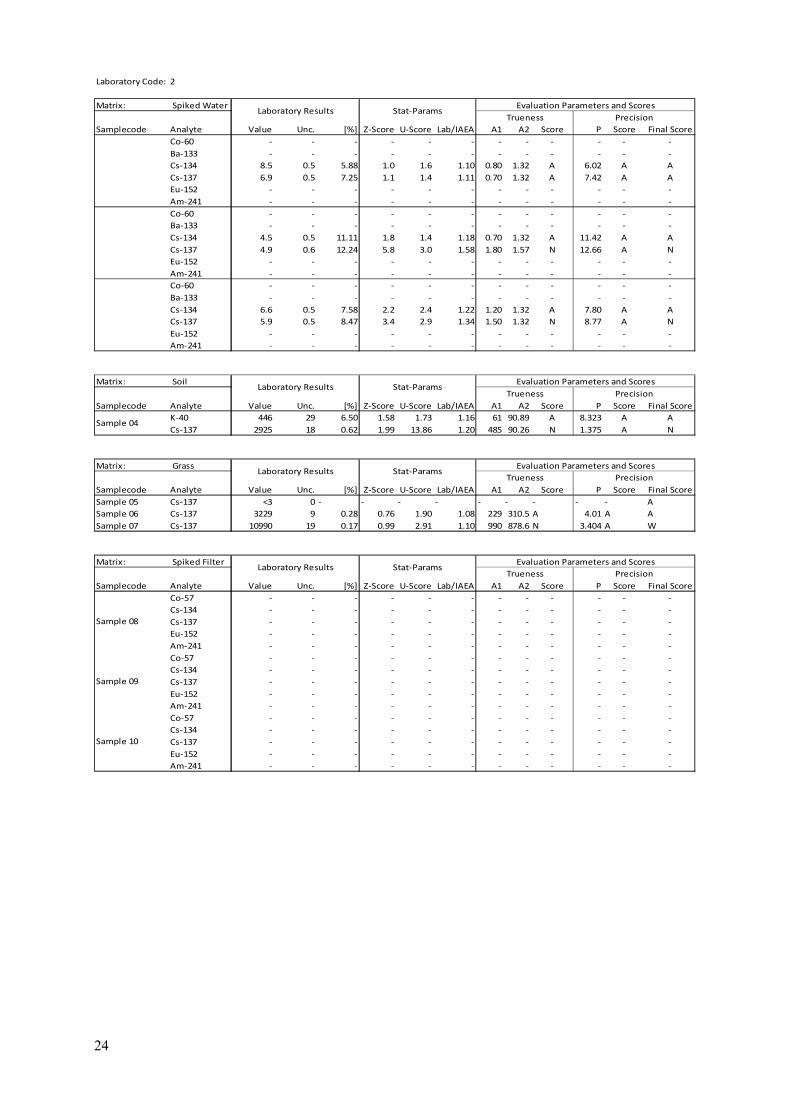
24
Laboratory Code: 2
Matrix: Spiked Water
Samplecode Analyte Value Unc. [%] Z-Score U-Score Lab/IAEA A1 A2 Score P Score Final Score
Co-60 - - - - - - - - - - - -
Ba-133 - - - - - - - - - - - -
Cs-134 8.5 0.5 5.88 1.0 1.6 1.10 0.80 1.32 A 6.02 A A
Cs-137 6.9 0.5 7.25 1.1 1.4 1.11 0.70 1.32 A 7.42 A A
Eu-152 - - - - - - - - - - - -
Am-241 - - - - - - - - - - - -
Co-60 - - - - - - - - - - - -
Ba-133 - - - - - - - - - - - -
Cs-134 4.5 0.5 11.11 1.8 1.4 1.18 0.70 1.32 A 11.42 A A
Cs-137 4.9 0.6 12.24 5.8 3.0 1.58 1.80 1.57 N 12.66 A N
Eu-152 - - - - - - - - - - - -
Am-241 - - - - - - - - - - - -
Co-60 - - - - - - - - - - - -
Ba-133 - - - - - - - - - - - -
Cs-134 6.6 0.5 7.58 2.2 2.4 1.22 1.20 1.32 A 7.80 A A
Cs-137 5.9 0.5 8.47 3.4 2.9 1.34 1.50 1.32 N 8.77 A N
Eu-152 - - - - - - - - - - - -
Am-241 - - - - - - - - - - - -
Matrix: Soil
Samplecode Analyte Value Unc. [%] Z-Score U-Score Lab/IAEA A1 A2 Score P Score Final Score
K-40 446 29 6.50 1.58 1.73 1.16 61 90.89 A 8.323 A A
Cs-137 2925 18 0.62 1.99 13.86 1.20 485 90.26 N 1.375 A N
Matrix: Grass
Samplecode Analyte Value Unc. [%] Z-Score U-Score Lab/IAEA A1 A2 Score P Score Final Score
Sample 05 Cs-137 <3 0 - - - - - - - - - A
Sample 06 Cs-137 3229 9 0.28 0.76 1.90 1.08 229 310.5 A 4.01 A A
Sample 07 Cs-137 10990 19 0.17 0.99 2.91 1.10 990 878.6 N 3.404 A W
Matrix: Spiked Filter
Samplecode Analyte Value Unc. [%] Z-Score U-Score Lab/IAEA A1 A2 Score P Score Final Score
Co-57 - - - - - - - - - - - -
Cs-134 - - - - - - - - - - - -
Cs-137 - - - - - - - - - - - -
Eu-152 - - - - - - - - - - - -
Am-241 - - - - - - - - - - - -
Co-57 - - - - - - - - - - - -
Cs-134 - - - - - - - - - - - -
Cs-137 - - - - - - - - - - - -
Eu-152 - - - - - - - - - - - -
Am-241 - - - - - - - - - - - -
Co-57 - - - - - - - - - - - -
Cs-134 - - - - - - - - - - - -
Cs-137 - - - - - - - - - - - -
Eu-152 - - - - - - - - - - - -
Am-241 - - - - - - - - - - - -
Sample 09
Sample 10
Laboratory Results Stat-ParamsEvaluation Parameters and Scores
Trueness Precision
Sample 08
Sample 04
Laboratory Results Stat-ParamsEvaluation Parameters and Scores
Trueness Precision
Laboratory Results Stat-ParamsEvaluation Parameters and Scores
Trueness Precision
Laboratory Results Stat-ParamsEvaluation Parameters and Scores
Trueness Precision
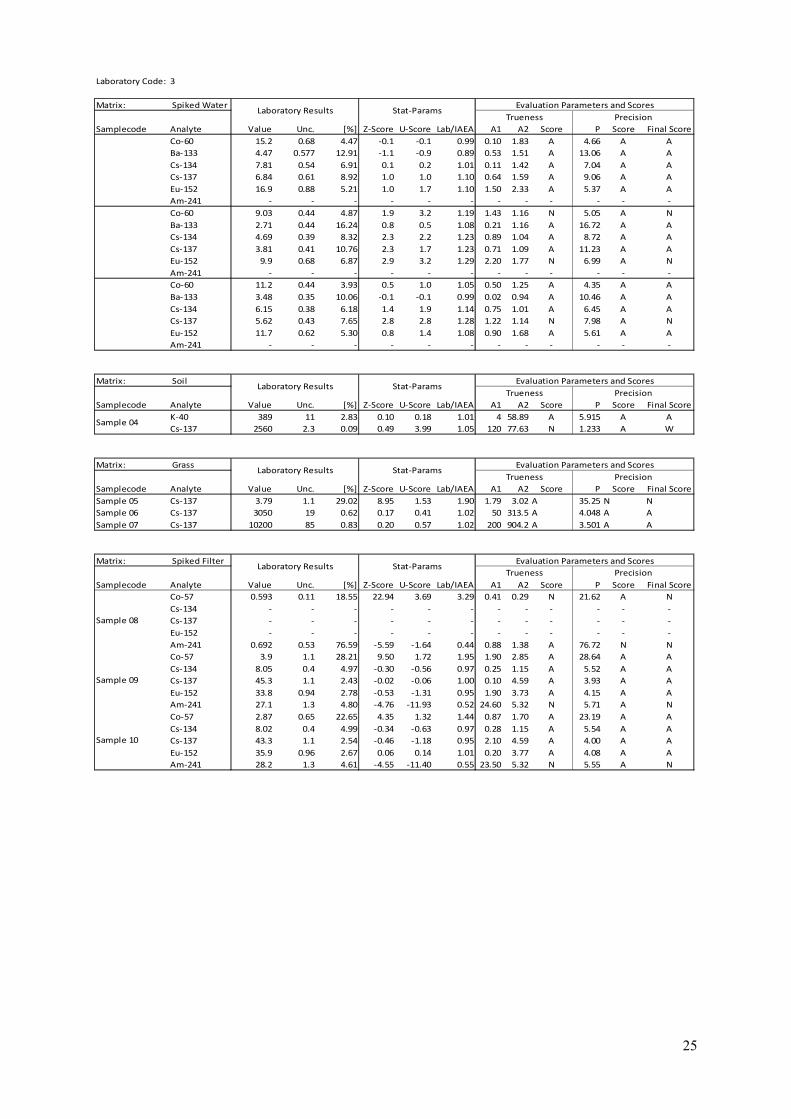
25
Laboratory Code: 3
Matrix: Spiked Water
Samplecode Analyte Value Unc. [%] Z-Score U-Score Lab/IAEA A1 A2 Score P Score Final Score
Co-60 15.2 0.68 4.47 -0.1 -0.1 0.99 0.10 1.83 A 4.66 A A
Ba-133 4.47 0.577 12.91 -1.1 -0.9 0.89 0.53 1.51 A 13.06 A A
Cs-134 7.81 0.54 6.91 0.1 0.2 1.01 0.11 1.42 A 7.04 A A
Cs-137 6.84 0.61 8.92 1.0 1.0 1.10 0.64 1.59 A 9.06 A A
Eu-152 16.9 0.88 5.21 1.0 1.7 1.10 1.50 2.33 A 5.37 A A
Am-241 - - - - - - - - - - - -
Co-60 9.03 0.44 4.87 1.9 3.2 1.19 1.43 1.16 N 5.05 A N
Ba-133 2.71 0.44 16.24 0.8 0.5 1.08 0.21 1.16 A 16.72 A A
Cs-134 4.69 0.39 8.32 2.3 2.2 1.23 0.89 1.04 A 8.72 A A
Cs-137 3.81 0.41 10.76 2.3 1.7 1.23 0.71 1.09 A 11.23 A A
Eu-152 9.9 0.68 6.87 2.9 3.2 1.29 2.20 1.77 N 6.99 A N
Am-241 - - - - - - - - - - - -
Co-60 11.2 0.44 3.93 0.5 1.0 1.05 0.50 1.25 A 4.35 A A
Ba-133 3.48 0.35 10.06 -0.1 -0.1 0.99 0.02 0.94 A 10.46 A A
Cs-134 6.15 0.38 6.18 1.4 1.9 1.14 0.75 1.01 A 6.45 A A
Cs-137 5.62 0.43 7.65 2.8 2.8 1.28 1.22 1.14 N 7.98 A N
Eu-152 11.7 0.62 5.30 0.8 1.4 1.08 0.90 1.68 A 5.61 A A
Am-241 - - - - - - - - - - - -
Matrix: Soil
Samplecode Analyte Value Unc. [%] Z-Score U-Score Lab/IAEA A1 A2 Score P Score Final Score
K-40 389 11 2.83 0.10 0.18 1.01 4 58.89 A 5.915 A A
Cs-137 2560 2.3 0.09 0.49 3.99 1.05 120 77.63 N 1.233 A W
Matrix: Grass
Samplecode Analyte Value Unc. [%] Z-Score U-Score Lab/IAEA A1 A2 Score P Score Final Score
Sample 05 Cs-137 3.79 1.1 29.02 8.95 1.53 1.90 1.79 3.02 A 35.25 N N
Sample 06 Cs-137 3050 19 0.62 0.17 0.41 1.02 50 313.5 A 4.048 A A
Sample 07 Cs-137 10200 85 0.83 0.20 0.57 1.02 200 904.2 A 3.501 A A
Matrix: Spiked Filter
Samplecode Analyte Value Unc. [%] Z-Score U-Score Lab/IAEA A1 A2 Score P Score Final Score
Co-57 0.593 0.11 18.55 22.94 3.69 3.29 0.41 0.29 N 21.62 A N
Cs-134 - - - - - - - - - - - -
Cs-137 - - - - - - - - - - - -
Eu-152 - - - - - - - - - - - -
Am-241 0.692 0.53 76.59 -5.59 -1.64 0.44 0.88 1.38 A 76.72 N N
Co-57 3.9 1.1 28.21 9.50 1.72 1.95 1.90 2.85 A 28.64 A A
Cs-134 8.05 0.4 4.97 -0.30 -0.56 0.97 0.25 1.15 A 5.52 A A
Cs-137 45.3 1.1 2.43 -0.02 -0.06 1.00 0.10 4.59 A 3.93 A A
Eu-152 33.8 0.94 2.78 -0.53 -1.31 0.95 1.90 3.73 A 4.15 A A
Am-241 27.1 1.3 4.80 -4.76 -11.93 0.52 24.60 5.32 N 5.71 A N
Co-57 2.87 0.65 22.65 4.35 1.32 1.44 0.87 1.70 A 23.19 A A
Cs-134 8.02 0.4 4.99 -0.34 -0.63 0.97 0.28 1.15 A 5.54 A A
Cs-137 43.3 1.1 2.54 -0.46 -1.18 0.95 2.10 4.59 A 4.00 A A
Eu-152 35.9 0.96 2.67 0.06 0.14 1.01 0.20 3.77 A 4.08 A A
Am-241 28.2 1.3 4.61 -4.55 -11.40 0.55 23.50 5.32 N 5.55 A N
Laboratory Results Stat-ParamsEvaluation Parameters and Scores
Trueness Precision
Laboratory Results Stat-ParamsEvaluation Parameters and Scores
Trueness Precision
Sample 04
Laboratory Results Stat-ParamsEvaluation Parameters and Scores
Trueness Precision
Sample 09
Sample 10
Laboratory Results Stat-ParamsEvaluation Parameters and Scores
Trueness Precision
Sample 08
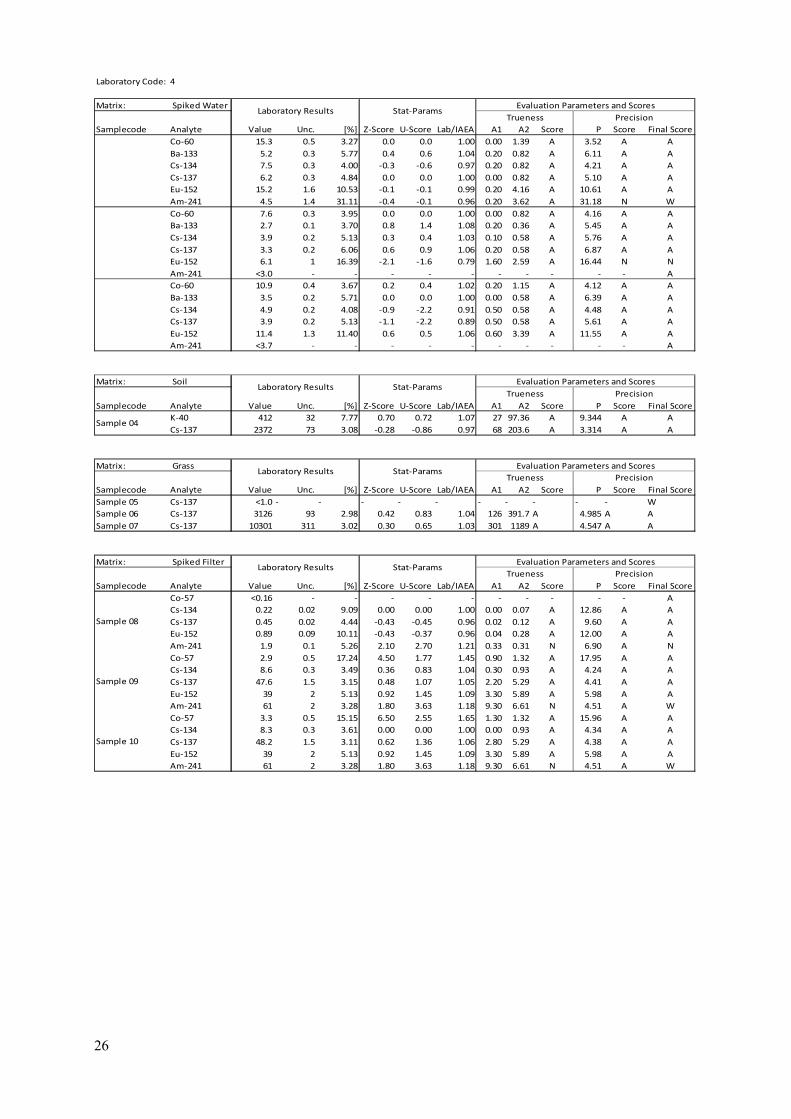
26
Laboratory Code: 4
Matrix: Spiked Water
Samplecode Analyte Value Unc. [%] Z-Score U-Score Lab/IAEA A1 A2 Score P Score Final Score
Co-60 15.3 0.5 3.27 0.0 0.0 1.00 0.00 1.39 A 3.52 A A
Ba-133 5.2 0.3 5.77 0.4 0.6 1.04 0.20 0.82 A 6.11 A A
Cs-134 7.5 0.3 4.00 -0.3 -0.6 0.97 0.20 0.82 A 4.21 A A
Cs-137 6.2 0.3 4.84 0.0 0.0 1.00 0.00 0.82 A 5.10 A A
Eu-152 15.2 1.6 10.53 -0.1 -0.1 0.99 0.20 4.16 A 10.61 A A
Am-241 4.5 1.4 31.11 -0.4 -0.1 0.96 0.20 3.62 A 31.18 N W
Co-60 7.6 0.3 3.95 0.0 0.0 1.00 0.00 0.82 A 4.16 A A
Ba-133 2.7 0.1 3.70 0.8 1.4 1.08 0.20 0.36 A 5.45 A A
Cs-134 3.9 0.2 5.13 0.3 0.4 1.03 0.10 0.58 A 5.76 A A
Cs-137 3.3 0.2 6.06 0.6 0.9 1.06 0.20 0.58 A 6.87 A A
Eu-152 6.1 1 16.39 -2.1 -1.6 0.79 1.60 2.59 A 16.44 N N
Am-241 <3.0 - - - - - - - - - - A
Co-60 10.9 0.4 3.67 0.2 0.4 1.02 0.20 1.15 A 4.12 A A
Ba-133 3.5 0.2 5.71 0.0 0.0 1.00 0.00 0.58 A 6.39 A A
Cs-134 4.9 0.2 4.08 -0.9 -2.2 0.91 0.50 0.58 A 4.48 A A
Cs-137 3.9 0.2 5.13 -1.1 -2.2 0.89 0.50 0.58 A 5.61 A A
Eu-152 11.4 1.3 11.40 0.6 0.5 1.06 0.60 3.39 A 11.55 A A
Am-241 <3.7 - - - - - - - - - - A
Matrix: Soil
Samplecode Analyte Value Unc. [%] Z-Score U-Score Lab/IAEA A1 A2 Score P Score Final Score
K-40 412 32 7.77 0.70 0.72 1.07 27 97.36 A 9.344 A A
Cs-137 2372 73 3.08 -0.28 -0.86 0.97 68 203.6 A 3.314 A A
Matrix: Grass
Samplecode Analyte Value Unc. [%] Z-Score U-Score Lab/IAEA A1 A2 Score P Score Final Score
Sample 05 Cs-137 <1.0 - - - - - - - - - - W
Sample 06 Cs-137 3126 93 2.98 0.42 0.83 1.04 126 391.7 A 4.985 A A
Sample 07 Cs-137 10301 311 3.02 0.30 0.65 1.03 301 1189 A 4.547 A A
Matrix: Spiked Filter
Samplecode Analyte Value Unc. [%] Z-Score U-Score Lab/IAEA A1 A2 Score P Score Final Score
Co-57 <0.16 - - - - - - - - - - A
Cs-134 0.22 0.02 9.09 0.00 0.00 1.00 0.00 0.07 A 12.86 A A
Cs-137 0.45 0.02 4.44 -0.43 -0.45 0.96 0.02 0.12 A 9.60 A A
Eu-152 0.89 0.09 10.11 -0.43 -0.37 0.96 0.04 0.28 A 12.00 A A
Am-241 1.9 0.1 5.26 2.10 2.70 1.21 0.33 0.31 N 6.90 A N
Co-57 2.9 0.5 17.24 4.50 1.77 1.45 0.90 1.32 A 17.95 A A
Cs-134 8.6 0.3 3.49 0.36 0.83 1.04 0.30 0.93 A 4.24 A A
Cs-137 47.6 1.5 3.15 0.48 1.07 1.05 2.20 5.29 A 4.41 A A
Eu-152 39 2 5.13 0.92 1.45 1.09 3.30 5.89 A 5.98 A A
Am-241 61 2 3.28 1.80 3.63 1.18 9.30 6.61 N 4.51 A W
Co-57 3.3 0.5 15.15 6.50 2.55 1.65 1.30 1.32 A 15.96 A A
Cs-134 8.3 0.3 3.61 0.00 0.00 1.00 0.00 0.93 A 4.34 A A
Cs-137 48.2 1.5 3.11 0.62 1.36 1.06 2.80 5.29 A 4.38 A A
Eu-152 39 2 5.13 0.92 1.45 1.09 3.30 5.89 A 5.98 A A
Am-241 61 2 3.28 1.80 3.63 1.18 9.30 6.61 N 4.51 A W
Sample 09
Sample 10
Laboratory Results Stat-ParamsEvaluation Parameters and Scores
Trueness Precision
Sample 08
Sample 04
Laboratory Results Stat-ParamsEvaluation Parameters and Scores
Trueness Precision
Laboratory Results Stat-ParamsEvaluation Parameters and Scores
Trueness Precision
Laboratory Results Stat-ParamsEvaluation Parameters and Scores
Trueness Precision
27
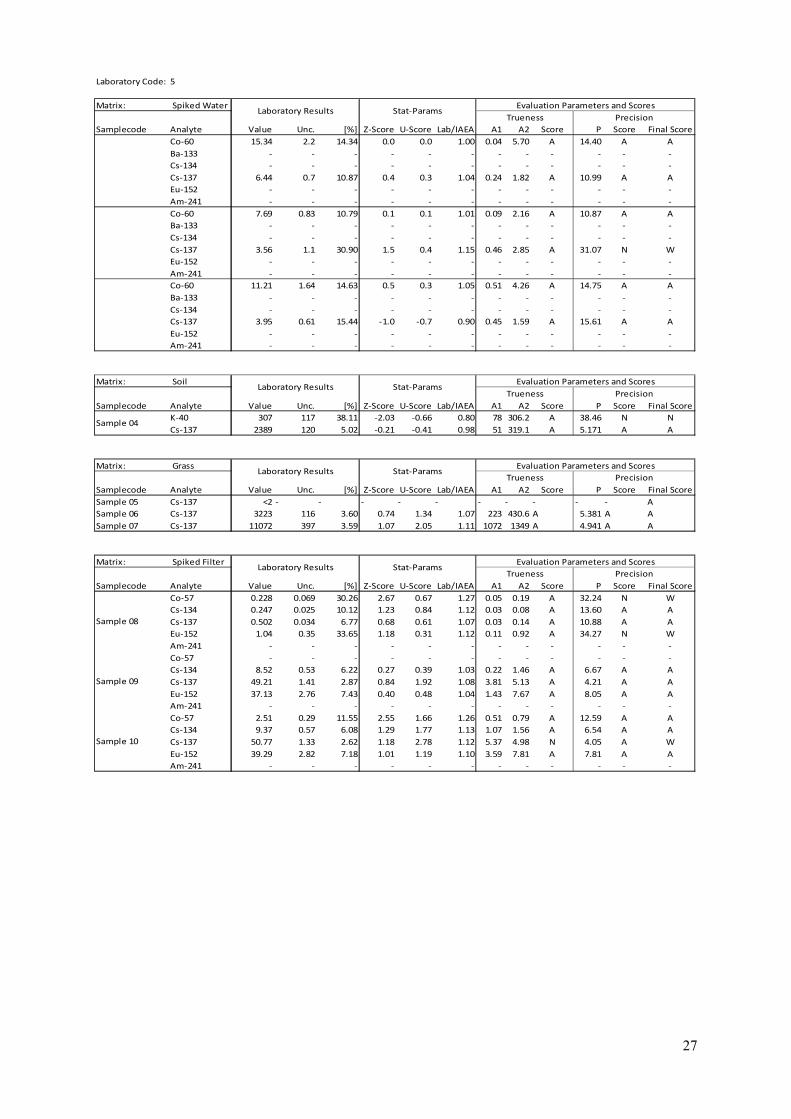
Laboratory Code: 5
Matrix: Spiked Water
Samplecode Analyte Value Unc. [%] Z-Score U-Score Lab/IAEA A1 A2 Score P Score Final Score
Co-60 15.34 2.2 14.34 0.0 0.0 1.00 0.04 5.70 A 14.40 A A
Ba-133 - - - - - - - - - - - -
Cs-134 - - - - - - - - - - - -
Cs-137 6.44 0.7 10.87 0.4 0.3 1.04 0.24 1.82 A 10.99 A A
Eu-152 - - - - - - - - - - - -
Am-241 - - - - - - - - - - - -
Co-60 7.69 0.83 10.79 0.1 0.1 1.01 0.09 2.16 A 10.87 A A
Ba-133 - - - - - - - - - - - -
Cs-134 - - - - - - - - - - - -
Cs-137 3.56 1.1 30.90 1.5 0.4 1.15 0.46 2.85 A 31.07 N W
Eu-152 - - - - - - - - - - - -
Am-241 - - - - - - - - - - - -
Co-60 11.21 1.64 14.63 0.5 0.3 1.05 0.51 4.26 A 14.75 A A
Ba-133 - - - - - - - - - - - -
Cs-134 - - - - - - - - - - - -
Cs-137 3.95 0.61 15.44 -1.0 -0.7 0.90 0.45 1.59 A 15.61 A A
Eu-152 - - - - - - - - - - - -
Am-241 - - - - - - - - - - - -
Matrix: Soil
Samplecode Analyte Value Unc. [%] Z-Score U-Score Lab/IAEA A1 A2 Score P Score Final Score
K-40 307 117 38.11 -2.03 -0.66 0.80 78 306.2 A 38.46 N N
Cs-137 2389 120 5.02 -0.21 -0.41 0.98 51 319.1 A 5.171 A A
Matrix: Grass
Samplecode Analyte Value Unc. [%] Z-Score U-Score Lab/IAEA A1 A2 Score P Score Final Score
Sample 05 Cs-137 <2 - - - - - - - - - - A
Sample 06 Cs-137 3223 116 3.60 0.74 1.34 1.07 223 430.6 A 5.381 A A
Sample 07 Cs-137 11072 397 3.59 1.07 2.05 1.11 1072 1349 A 4.941 A A
Matrix: Spiked Filter
Samplecode Analyte Value Unc. [%] Z-Score U-Score Lab/IAEA A1 A2 Score P Score Final Score
Co-57 0.228 0.069 30.26 2.67 0.67 1.27 0.05 0.19 A 32.24 N W
Cs-134 0.247 0.025 10.12 1.23 0.84 1.12 0.03 0.08 A 13.60 A A
Cs-137 0.502 0.034 6.77 0.68 0.61 1.07 0.03 0.14 A 10.88 A A
Eu-152 1.04 0.35 33.65 1.18 0.31 1.12 0.11 0.92 A 34.27 N W
Am-241 - - - - - - - - - - - -
Co-57 - - - - - - - - - - - -
Cs-134 8.52 0.53 6.22 0.27 0.39 1.03 0.22 1.46 A 6.67 A A
Cs-137 49.21 1.41 2.87 0.84 1.92 1.08 3.81 5.13 A 4.21 A A
Eu-152 37.13 2.76 7.43 0.40 0.48 1.04 1.43 7.67 A 8.05 A A
Am-241 - - - - - - - - - - - -
Co-57 2.51 0.29 11.55 2.55 1.66 1.26 0.51 0.79 A 12.59 A A
Cs-134 9.37 0.57 6.08 1.29 1.77 1.13 1.07 1.56 A 6.54 A A
Cs-137 50.77 1.33 2.62 1.18 2.78 1.12 5.37 4.98 N 4.05 A W
Eu-152 39.29 2.82 7.18 1.01 1.19 1.10 3.59 7.81 A 7.81 A A
Am-241 - - - - - - - - - - - -
Laboratory Results Stat-ParamsEvaluation Parameters and Scores
Trueness Precision
Laboratory Results Stat-ParamsEvaluation Parameters and Scores
Trueness Precision
Sample 04
Laboratory Results Stat-ParamsEvaluation Parameters and Scores
Trueness Precision
Sample 09
Sample 10
Laboratory Results Stat-ParamsEvaluation Parameters and Scores
Trueness Precision
Sample 08
28
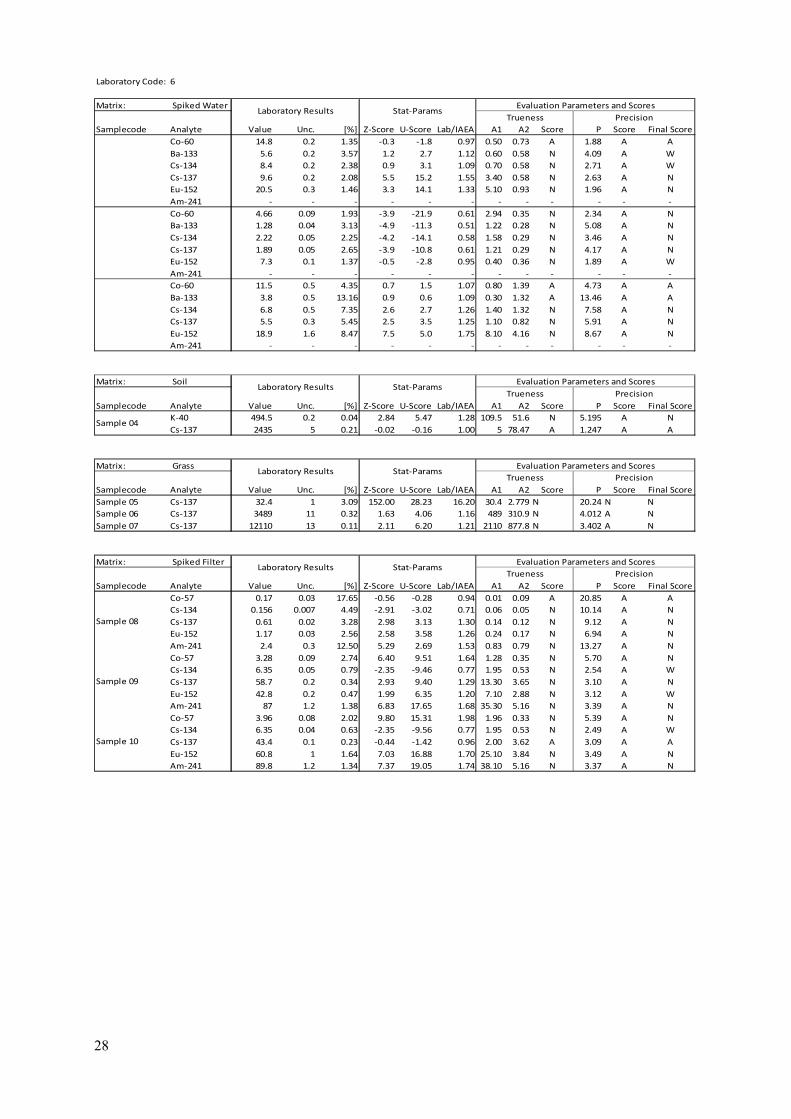
Laboratory Code: 6
Matrix: Spiked Water
Samplecode Analyte Value Unc. [%] Z-Score U-Score Lab/IAEA A1 A2 Score P Score Final Score
Co-60 14.8 0.2 1.35 -0.3 -1.8 0.97 0.50 0.73 A 1.88 A A
Ba-133 5.6 0.2 3.57 1.2 2.7 1.12 0.60 0.58 N 4.09 A W
Cs-134 8.4 0.2 2.38 0.9 3.1 1.09 0.70 0.58 N 2.71 A W
Cs-137 9.6 0.2 2.08 5.5 15.2 1.55 3.40 0.58 N 2.63 A N
Eu-152 20.5 0.3 1.46 3.3 14.1 1.33 5.10 0.93 N 1.96 A N
Am-241 - - - - - - - - - - - -
Co-60 4.66 0.09 1.93 -3.9 -21.9 0.61 2.94 0.35 N 2.34 A N
Ba-133 1.28 0.04 3.13 -4.9 -11.3 0.51 1.22 0.28 N 5.08 A N
Cs-134 2.22 0.05 2.25 -4.2 -14.1 0.58 1.58 0.29 N 3.46 A N
Cs-137 1.89 0.05 2.65 -3.9 -10.8 0.61 1.21 0.29 N 4.17 A N
Eu-152 7.3 0.1 1.37 -0.5 -2.8 0.95 0.40 0.36 N 1.89 A W
Am-241 - - - - - - - - - - - -
Co-60 11.5 0.5 4.35 0.7 1.5 1.07 0.80 1.39 A 4.73 A A
Ba-133 3.8 0.5 13.16 0.9 0.6 1.09 0.30 1.32 A 13.46 A A
Cs-134 6.8 0.5 7.35 2.6 2.7 1.26 1.40 1.32 N 7.58 A N
Cs-137 5.5 0.3 5.45 2.5 3.5 1.25 1.10 0.82 N 5.91 A N
Eu-152 18.9 1.6 8.47 7.5 5.0 1.75 8.10 4.16 N 8.67 A N
Am-241 - - - - - - - - - - - -
Matrix: Soil
Samplecode Analyte Value Unc. [%] Z-Score U-Score Lab/IAEA A1 A2 Score P Score Final Score
K-40 494.5 0.2 0.04 2.84 5.47 1.28 109.5 51.6 N 5.195 A N
Cs-137 2435 5 0.21 -0.02 -0.16 1.00 5 78.47 A 1.247 A A
Matrix: Grass
Samplecode Analyte Value Unc. [%] Z-Score U-Score Lab/IAEA A1 A2 Score P Score Final Score
Sample 05 Cs-137 32.4 1 3.09 152.00 28.23 16.20 30.4 2.779 N 20.24 N N
Sample 06 Cs-137 3489 11 0.32 1.63 4.06 1.16 489 310.9 N 4.012 A N
Sample 07 Cs-137 12110 13 0.11 2.11 6.20 1.21 2110 877.8 N 3.402 A N
Matrix: Spiked Filter
Samplecode Analyte Value Unc. [%] Z-Score U-Score Lab/IAEA A1 A2 Score P Score Final Score
Co-57 0.17 0.03 17.65 -0.56 -0.28 0.94 0.01 0.09 A 20.85 A A
Cs-134 0.156 0.007 4.49 -2.91 -3.02 0.71 0.06 0.05 N 10.14 A N
Cs-137 0.61 0.02 3.28 2.98 3.13 1.30 0.14 0.12 N 9.12 A N
Eu-152 1.17 0.03 2.56 2.58 3.58 1.26 0.24 0.17 N 6.94 A N
Am-241 2.4 0.3 12.50 5.29 2.69 1.53 0.83 0.79 N 13.27 A N
Co-57 3.28 0.09 2.74 6.40 9.51 1.64 1.28 0.35 N 5.70 A N
Cs-134 6.35 0.05 0.79 -2.35 -9.46 0.77 1.95 0.53 N 2.54 A W
Cs-137 58.7 0.2 0.34 2.93 9.40 1.29 13.30 3.65 N 3.10 A N
Eu-152 42.8 0.2 0.47 1.99 6.35 1.20 7.10 2.88 N 3.12 A W
Am-241 87 1.2 1.38 6.83 17.65 1.68 35.30 5.16 N 3.39 A N
Co-57 3.96 0.08 2.02 9.80 15.31 1.98 1.96 0.33 N 5.39 A N
Cs-134 6.35 0.04 0.63 -2.35 -9.56 0.77 1.95 0.53 N 2.49 A W
Cs-137 43.4 0.1 0.23 -0.44 -1.42 0.96 2.00 3.62 A 3.09 A A
Eu-152 60.8 1 1.64 7.03 16.88 1.70 25.10 3.84 N 3.49 A N
Am-241 89.8 1.2 1.34 7.37 19.05 1.74 38.10 5.16 N 3.37 A N
Sample 09
Sample 10
Laboratory Results Stat-ParamsEvaluation Parameters and Scores
Trueness Precision
Sample 08
Sample 04
Laboratory Results Stat-ParamsEvaluation Parameters and Scores
Trueness Precision
Laboratory Results Stat-ParamsEvaluation Parameters and Scores
Trueness Precision
Laboratory Results Stat-ParamsEvaluation Parameters and Scores
Trueness Precision

29
Laboratory Code: 7
Matrix: Spiked Water
Samplecode Analyte Value Unc. [%] Z-Score U-Score Lab/IAEA A1 A2 Score P Score Final Score
Co-60 15.9 0.59 3.71 0.4 1.0 1.04 0.60 1.61 A 3.93 A A
Ba-133 4.93 0.26 5.27 -0.1 -0.3 0.99 0.07 0.72 A 5.64 A A
Cs-134 8.07 0.44 5.45 0.5 0.8 1.05 0.37 1.16 A 5.60 A A
Cs-137 6.08 0.34 5.59 -0.2 -0.3 0.98 0.12 0.91 A 5.82 A A
Eu-152 15.01 0.7 4.66 -0.3 -0.5 0.97 0.39 1.88 A 4.84 A A
Am-241 6 1.3 21.67 2.8 1.0 1.28 1.30 3.36 A 21.77 N N
Co-60 7.93 0.37 4.67 0.4 0.9 1.04 0.33 0.99 A 4.85 A A
Ba-133 3.42 0.23 6.73 3.7 3.7 1.37 0.92 0.65 N 7.82 A N
Cs-134 3.9 0.24 6.15 0.3 0.4 1.03 0.10 0.67 A 6.69 A A
Cs-137 2.69 0.26 9.67 -1.3 -1.5 0.87 0.41 0.72 A 10.19 A A
Eu-152 7.6 0.52 6.84 -0.1 -0.2 0.99 0.10 1.37 A 6.96 A A
Am-241 2.4 1.2 50.00 0.0 0.0 1.00 0.00 3.11 A 50.17 N W
Co-60 10.61 0.48 4.52 -0.1 -0.2 0.99 0.09 1.34 A 4.89 A A
Ba-133 3.66 0.2 5.46 0.5 0.7 1.05 0.16 0.58 A 6.17 A A
Cs-134 5.66 0.34 6.01 0.5 0.7 1.05 0.26 0.91 A 6.29 A A
Cs-137 3.8 0.29 7.63 -1.4 -2.0 0.86 0.60 0.79 A 7.96 A A
Eu-152 9.85 0.48 4.87 -0.9 -1.8 0.91 0.95 1.34 A 5.21 A A
Am-241 3.3 1.5 45.45 0.0 0.0 1.00 0.00 3.88 A 45.56 N W
Matrix: Soil
Samplecode Analyte Value Unc. [%] Z-Score U-Score Lab/IAEA A1 A2 Score P Score Final Score
K-40 425 24 5.65 1.04 1.28 1.10 40 80.6 A 7.673 A A
Cs-137 2460 110 4.47 0.08 0.18 1.01 20 294.2 A 4.637 A A
Matrix: Grass
Samplecode Analyte Value Unc. [%] Z-Score U-Score Lab/IAEA A1 A2 Score P Score Final Score
Sample 05 Cs-137 <2 - - - - - - - - - - A
Sample 06 Cs-137 3590 170 4.74 1.97 2.84 1.20 590 536.9 N 6.199 A N
Sample 07 Cs-137 11350 520 4.58 1.35 2.17 1.14 1350 1603 A 5.705 A A
Matrix: Spiked Filter
Samplecode Analyte Value Unc. [%] Z-Score U-Score Lab/IAEA A1 A2 Score P Score Final Score
Co-57 0.133 0.042 31.58 -2.61 -1.01 0.74 0.05 0.12 A 33.48 N W
Cs-134 0.207 0.023 11.11 -0.59 -0.43 0.94 0.01 0.08 A 14.36 A A
Cs-137 0.459 0.018 3.92 -0.23 -0.25 0.98 0.01 0.11 A 9.37 A A
Eu-152 0.901 0.062 6.88 -0.31 -0.34 0.97 0.03 0.22 A 9.43 A A
Am-241 1.247 0.056 4.49 -2.06 -3.60 0.79 0.32 0.23 N 6.33 A N
Co-57 2.12 0.14 6.60 0.60 0.70 1.06 0.12 0.44 A 8.28 A A
Cs-134 8.34 0.65 7.79 0.05 0.06 1.00 0.04 1.75 A 8.16 A A
Cs-137 46.9 1.4 2.99 0.33 0.76 1.03 1.50 5.11 A 4.29 A A
Eu-152 35.8 2.2 6.15 0.03 0.04 1.00 0.10 6.35 A 6.87 A A
Am-241 41.1 1.3 3.16 -2.05 -5.14 0.79 10.60 5.32 N 4.43 A N
Co-57 1.98 0.2 10.10 -0.10 -0.09 0.99 0.02 0.58 A 11.27 A A
Cs-134 8.18 0.52 6.36 -0.14 -0.22 0.99 0.12 1.44 A 6.80 A A
Cs-137 46.5 1.4 3.01 0.24 0.56 1.02 1.10 5.11 A 4.31 A A
Eu-152 36.7 1.6 4.36 0.28 0.52 1.03 1.00 5.01 A 5.34 A A
Am-241 41.6 1.3 3.13 -1.95 -4.90 0.80 10.10 5.32 N 4.40 A W
Laboratory Results Stat-ParamsEvaluation Parameters and Scores
Trueness Precision
Laboratory Results Stat-ParamsEvaluation Parameters and Scores
Trueness Precision
Sample 04
Laboratory Results Stat-ParamsEvaluation Parameters and Scores
Trueness Precision
Sample 09
Sample 10
Laboratory Results Stat-ParamsEvaluation Parameters and Scores
Trueness Precision
Sample 08
30
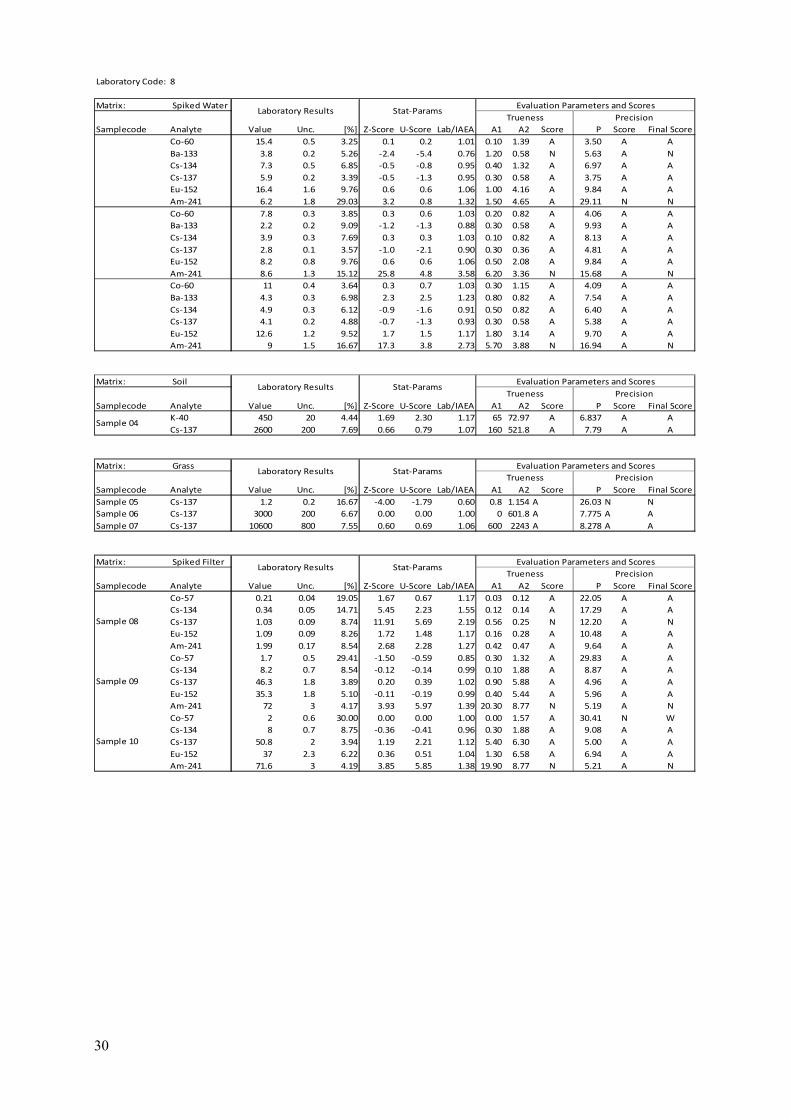
Laboratory Code: 8
Matrix: Spiked Water
Samplecode Analyte Value Unc. [%] Z-Score U-Score Lab/IAEA A1 A2 Score P Score Final Score
Co-60 15.4 0.5 3.25 0.1 0.2 1.01 0.10 1.39 A 3.50 A A
Ba-133 3.8 0.2 5.26 -2.4 -5.4 0.76 1.20 0.58 N 5.63 A N
Cs-134 7.3 0.5 6.85 -0.5 -0.8 0.95 0.40 1.32 A 6.97 A A
Cs-137 5.9 0.2 3.39 -0.5 -1.3 0.95 0.30 0.58 A 3.75 A A
Eu-152 16.4 1.6 9.76 0.6 0.6 1.06 1.00 4.16 A 9.84 A A
Am-241 6.2 1.8 29.03 3.2 0.8 1.32 1.50 4.65 A 29.11 N N
Co-60 7.8 0.3 3.85 0.3 0.6 1.03 0.20 0.82 A 4.06 A A
Ba-133 2.2 0.2 9.09 -1.2 -1.3 0.88 0.30 0.58 A 9.93 A A
Cs-134 3.9 0.3 7.69 0.3 0.3 1.03 0.10 0.82 A 8.13 A A
Cs-137 2.8 0.1 3.57 -1.0 -2.1 0.90 0.30 0.36 A 4.81 A A
Eu-152 8.2 0.8 9.76 0.6 0.6 1.06 0.50 2.08 A 9.84 A A
Am-241 8.6 1.3 15.12 25.8 4.8 3.58 6.20 3.36 N 15.68 A N
Co-60 11 0.4 3.64 0.3 0.7 1.03 0.30 1.15 A 4.09 A A
Ba-133 4.3 0.3 6.98 2.3 2.5 1.23 0.80 0.82 A 7.54 A A
Cs-134 4.9 0.3 6.12 -0.9 -1.6 0.91 0.50 0.82 A 6.40 A A
Cs-137 4.1 0.2 4.88 -0.7 -1.3 0.93 0.30 0.58 A 5.38 A A
Eu-152 12.6 1.2 9.52 1.7 1.5 1.17 1.80 3.14 A 9.70 A A
Am-241 9 1.5 16.67 17.3 3.8 2.73 5.70 3.88 N 16.94 A N
Matrix: Soil
Samplecode Analyte Value Unc. [%] Z-Score U-Score Lab/IAEA A1 A2 Score P Score Final Score
K-40 450 20 4.44 1.69 2.30 1.17 65 72.97 A 6.837 A A
Cs-137 2600 200 7.69 0.66 0.79 1.07 160 521.8 A 7.79 A A
Matrix: Grass
Samplecode Analyte Value Unc. [%] Z-Score U-Score Lab/IAEA A1 A2 Score P Score Final Score
Sample 05 Cs-137 1.2 0.2 16.67 -4.00 -1.79 0.60 0.8 1.154 A 26.03 N N
Sample 06 Cs-137 3000 200 6.67 0.00 0.00 1.00 0 601.8 A 7.775 A A
Sample 07 Cs-137 10600 800 7.55 0.60 0.69 1.06 600 2243 A 8.278 A A
Matrix: Spiked Filter
Samplecode Analyte Value Unc. [%] Z-Score U-Score Lab/IAEA A1 A2 Score P Score Final Score
Co-57 0.21 0.04 19.05 1.67 0.67 1.17 0.03 0.12 A 22.05 A A
Cs-134 0.34 0.05 14.71 5.45 2.23 1.55 0.12 0.14 A 17.29 A A
Cs-137 1.03 0.09 8.74 11.91 5.69 2.19 0.56 0.25 N 12.20 A N
Eu-152 1.09 0.09 8.26 1.72 1.48 1.17 0.16 0.28 A 10.48 A A
Am-241 1.99 0.17 8.54 2.68 2.28 1.27 0.42 0.47 A 9.64 A A
Co-57 1.7 0.5 29.41 -1.50 -0.59 0.85 0.30 1.32 A 29.83 A A
Cs-134 8.2 0.7 8.54 -0.12 -0.14 0.99 0.10 1.88 A 8.87 A A
Cs-137 46.3 1.8 3.89 0.20 0.39 1.02 0.90 5.88 A 4.96 A A
Eu-152 35.3 1.8 5.10 -0.11 -0.19 0.99 0.40 5.44 A 5.96 A A
Am-241 72 3 4.17 3.93 5.97 1.39 20.30 8.77 N 5.19 A N
Co-57 2 0.6 30.00 0.00 0.00 1.00 0.00 1.57 A 30.41 N W
Cs-134 8 0.7 8.75 -0.36 -0.41 0.96 0.30 1.88 A 9.08 A A
Cs-137 50.8 2 3.94 1.19 2.21 1.12 5.40 6.30 A 5.00 A A
Eu-152 37 2.3 6.22 0.36 0.51 1.04 1.30 6.58 A 6.94 A A
Am-241 71.6 3 4.19 3.85 5.85 1.38 19.90 8.77 N 5.21 A N
Sample 09
Sample 10
Laboratory Results Stat-ParamsEvaluation Parameters and Scores
Trueness Precision
Sample 08
Sample 04
Laboratory Results Stat-ParamsEvaluation Parameters and Scores
Trueness Precision
Laboratory Results Stat-ParamsEvaluation Parameters and Scores
Trueness Precision
Laboratory Results Stat-ParamsEvaluation Parameters and Scores
Trueness Precision

31
Laboratory Code: 9
Matrix: Spiked Water
Samplecode Analyte Value Unc. [%] Z-Score U-Score Lab/IAEA A1 A2 Score P Score Final Score
Co-60 11.5 0.1 0.87 -2.5 -17.0 0.75 3.80 0.58 N 1.57 A N
Ba-133 4.41 0.05 1.13 -1.2 -5.3 0.88 0.59 0.29 N 2.30 A W
Cs-134 4.06 0.04 0.99 -4.7 -33.8 0.53 3.64 0.28 N 1.63 A N
Cs-137 5.15 0.04 0.78 -1.7 -9.7 0.83 1.05 0.28 N 1.79 A W
Eu-152 12.5 0.1 0.80 -1.9 -13.0 0.81 2.90 0.58 N 1.53 A N
Am-241 - - - - - - - - - - - -
Co-60 7.92 0.05 0.63 0.4 2.9 1.04 0.32 0.29 N 1.46 A W
Ba-133 1.63 0.03 1.84 -3.5 -8.3 0.65 0.87 0.27 N 4.40 A N
Cs-134 1.75 0.02 1.14 -5.4 -20.1 0.46 2.05 0.26 N 2.87 A N
Cs-137 2.82 0.03 1.06 -0.9 -2.7 0.91 0.28 0.27 N 3.40 A W
Eu-152 5.98 0.08 1.34 -2.2 -13.4 0.78 1.72 0.33 N 1.86 A N
Am-241 - - - - - - - - - - - -
Co-60 9.41 0.05 0.53 -1.2 -6.3 0.88 1.29 0.53 N 1.94 A W
Ba-133 2.78 0.04 1.44 -2.1 -6.7 0.79 0.72 0.28 N 3.20 A N
Cs-134 3.6 0.03 0.83 -3.3 -17.2 0.67 1.80 0.27 N 2.03 A N
Cs-137 2.98 0.03 1.01 -3.2 -13.6 0.68 1.42 0.27 N 2.49 A N
Eu-152 9.14 0.1 1.09 -1.5 -7.4 0.85 1.66 0.58 N 2.15 A N
Am-241 - - - - - - - - - - - -
Matrix: Soil
Samplecode Analyte Value Unc. [%] Z-Score U-Score Lab/IAEA A1 A2 Score P Score Final Score
K-40 442.2 0.9 0.20 1.49 2.86 1.15 57.2 51.65 N 5.199 A W
Cs-137 2385.3 0.8 0.03 -0.22 -1.82 0.98 54.7 77.43 A 1.23 A A
Matrix: Grass
Samplecode Analyte Value Unc. [%] Z-Score U-Score Lab/IAEA A1 A2 Score P Score Final Score
Sample 05 Cs-137 <1.91 - - - - - - - - - - A
Sample 06 Cs-137 3004 2 0.07 0.01 0.03 1.00 4 309.6 A 4.001 A A
Sample 07 Cs-137 10105 3 0.03 0.11 0.31 1.01 105 877.2 A 3.4 A A
Matrix: Spiked Filter
Samplecode Analyte Value Unc. [%] Z-Score U-Score Lab/IAEA A1 A2 Score P Score Final Score
Co-57 0.358 0.001 0.28 9.89 8.89 1.99 0.18 0.05 N 11.11 A N
Cs-134 0.162 0.004 2.47 -2.64 -2.84 0.74 0.06 0.05 N 9.42 A N
Cs-137 0.485 0.008 1.65 0.32 0.37 1.03 0.02 0.11 A 8.67 A A
Eu-152 0.726 0.017 2.34 -2.19 -3.27 0.78 0.20 0.16 N 6.86 A N
Am-241 <0.526 - - - - - - - - - - N
Co-57 11.6 0.1 0.86 48.00 67.88 5.80 9.60 0.36 N 5.07 A N
Cs-134 5.39 0.04 0.74 -3.51 -14.27 0.65 2.91 0.53 N 2.52 A N
Cs-137 47.5 0.1 0.21 0.46 1.50 1.05 2.10 3.62 A 3.09 A A
Eu-152 33.7 0.2 0.59 -0.56 -1.79 0.94 2.00 2.88 A 3.14 A A
Am-241 15.8 0.1 0.63 -6.94 -22.39 0.31 35.90 4.14 N 3.16 A N
Co-57 12.3 0.1 0.81 51.50 72.83 6.15 10.30 0.36 N 5.07 A N
Cs-134 5.61 0.04 0.71 -3.24 -13.19 0.68 2.69 0.53 N 2.51 A N
Cs-137 51 0.1 0.20 1.23 3.99 1.12 5.60 3.62 N 3.09 A W
Eu-152 34 0.2 0.59 -0.48 -1.52 0.95 1.70 2.88 A 3.14 A A
Am-241 17.4 0.1 0.57 -6.63 -21.40 0.34 34.30 4.14 N 3.15 A N
Laboratory Results Stat-ParamsEvaluation Parameters and Scores
Trueness Precision
Laboratory Results Stat-ParamsEvaluation Parameters and Scores
Trueness Precision
Sample 04
Laboratory Results Stat-ParamsEvaluation Parameters and Scores
Trueness Precision
Sample 09
Sample 10
Laboratory Results Stat-ParamsEvaluation Parameters and Scores
Trueness Precision
Sample 08
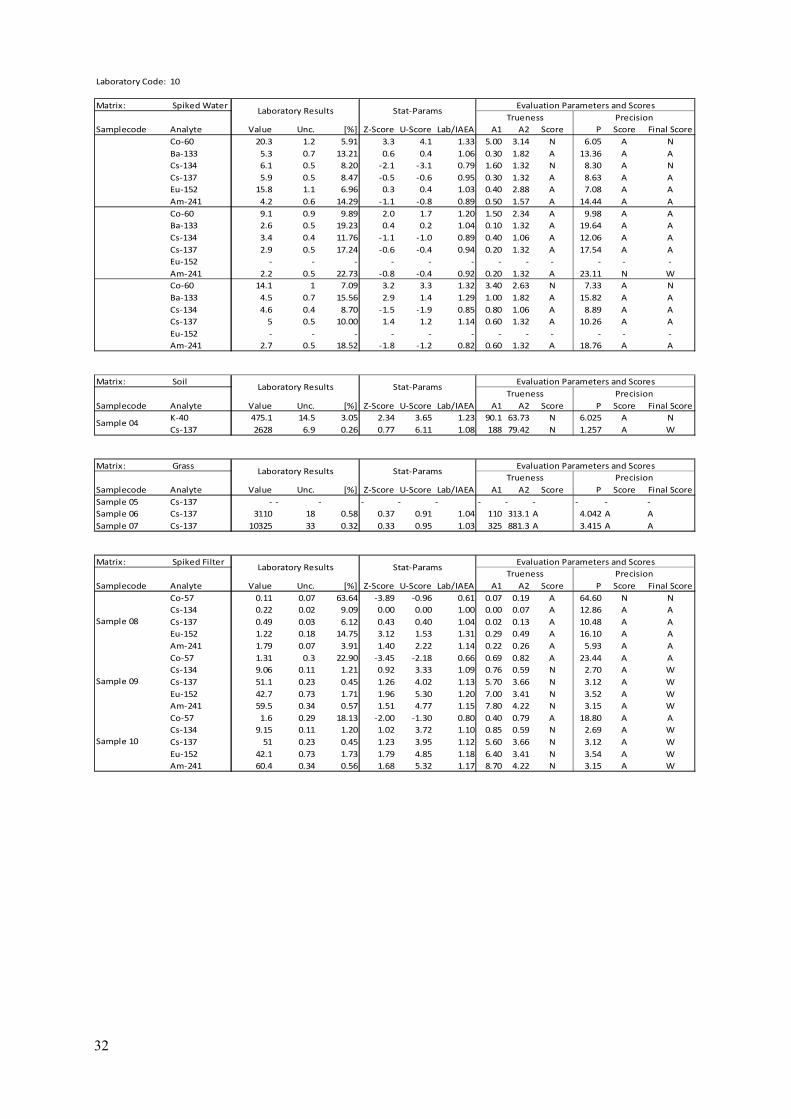
32
Laboratory Code: 10
Matrix: Spiked Water
Samplecode Analyte Value Unc. [%] Z-Score U-Score Lab/IAEA A1 A2 Score P Score Final Score
Co-60 20.3 1.2 5.91 3.3 4.1 1.33 5.00 3.14 N 6.05 A N
Ba-133 5.3 0.7 13.21 0.6 0.4 1.06 0.30 1.82 A 13.36 A A
Cs-134 6.1 0.5 8.20 -2.1 -3.1 0.79 1.60 1.32 N 8.30 A N
Cs-137 5.9 0.5 8.47 -0.5 -0.6 0.95 0.30 1.32 A 8.63 A A
Eu-152 15.8 1.1 6.96 0.3 0.4 1.03 0.40 2.88 A 7.08 A A
Am-241 4.2 0.6 14.29 -1.1 -0.8 0.89 0.50 1.57 A 14.44 A A
Co-60 9.1 0.9 9.89 2.0 1.7 1.20 1.50 2.34 A 9.98 A A
Ba-133 2.6 0.5 19.23 0.4 0.2 1.04 0.10 1.32 A 19.64 A A
Cs-134 3.4 0.4 11.76 -1.1 -1.0 0.89 0.40 1.06 A 12.06 A A
Cs-137 2.9 0.5 17.24 -0.6 -0.4 0.94 0.20 1.32 A 17.54 A A
Eu-152 - - - - - - - - - - - -
Am-241 2.2 0.5 22.73 -0.8 -0.4 0.92 0.20 1.32 A 23.11 N W
Co-60 14.1 1 7.09 3.2 3.3 1.32 3.40 2.63 N 7.33 A N
Ba-133 4.5 0.7 15.56 2.9 1.4 1.29 1.00 1.82 A 15.82 A A
Cs-134 4.6 0.4 8.70 -1.5 -1.9 0.85 0.80 1.06 A 8.89 A A
Cs-137 5 0.5 10.00 1.4 1.2 1.14 0.60 1.32 A 10.26 A A
Eu-152 - - - - - - - - - - - -
Am-241 2.7 0.5 18.52 -1.8 -1.2 0.82 0.60 1.32 A 18.76 A A
Matrix: Soil
Samplecode Analyte Value Unc. [%] Z-Score U-Score Lab/IAEA A1 A2 Score P Score Final Score
K-40 475.1 14.5 3.05 2.34 3.65 1.23 90.1 63.73 N 6.025 A N
Cs-137 2628 6.9 0.26 0.77 6.11 1.08 188 79.42 N 1.257 A W
Matrix: Grass
Samplecode Analyte Value Unc. [%] Z-Score U-Score Lab/IAEA A1 A2 Score P Score Final Score
Sample 05 Cs-137 - - - - - - - - - - - -
Sample 06 Cs-137 3110 18 0.58 0.37 0.91 1.04 110 313.1 A 4.042 A A
Sample 07 Cs-137 10325 33 0.32 0.33 0.95 1.03 325 881.3 A 3.415 A A
Matrix: Spiked Filter
Samplecode Analyte Value Unc. [%] Z-Score U-Score Lab/IAEA A1 A2 Score P Score Final Score
Co-57 0.11 0.07 63.64 -3.89 -0.96 0.61 0.07 0.19 A 64.60 N N
Cs-134 0.22 0.02 9.09 0.00 0.00 1.00 0.00 0.07 A 12.86 A A
Cs-137 0.49 0.03 6.12 0.43 0.40 1.04 0.02 0.13 A 10.48 A A
Eu-152 1.22 0.18 14.75 3.12 1.53 1.31 0.29 0.49 A 16.10 A A
Am-241 1.79 0.07 3.91 1.40 2.22 1.14 0.22 0.26 A 5.93 A A
Co-57 1.31 0.3 22.90 -3.45 -2.18 0.66 0.69 0.82 A 23.44 A A
Cs-134 9.06 0.11 1.21 0.92 3.33 1.09 0.76 0.59 N 2.70 A W
Cs-137 51.1 0.23 0.45 1.26 4.02 1.13 5.70 3.66 N 3.12 A W
Eu-152 42.7 0.73 1.71 1.96 5.30 1.20 7.00 3.41 N 3.52 A W
Am-241 59.5 0.34 0.57 1.51 4.77 1.15 7.80 4.22 N 3.15 A W
Co-57 1.6 0.29 18.13 -2.00 -1.30 0.80 0.40 0.79 A 18.80 A A
Cs-134 9.15 0.11 1.20 1.02 3.72 1.10 0.85 0.59 N 2.69 A W
Cs-137 51 0.23 0.45 1.23 3.95 1.12 5.60 3.66 N 3.12 A W
Eu-152 42.1 0.73 1.73 1.79 4.85 1.18 6.40 3.41 N 3.54 A W
Am-241 60.4 0.34 0.56 1.68 5.32 1.17 8.70 4.22 N 3.15 A W
Sample 09
Sample 10
Laboratory Results Stat-ParamsEvaluation Parameters and Scores
Trueness Precision
Sample 08
Sample 04
Laboratory Results Stat-ParamsEvaluation Parameters and Scores
Trueness Precision
Laboratory Results Stat-ParamsEvaluation Parameters and Scores
Trueness Precision
Laboratory Results Stat-ParamsEvaluation Parameters and Scores
Trueness Precision
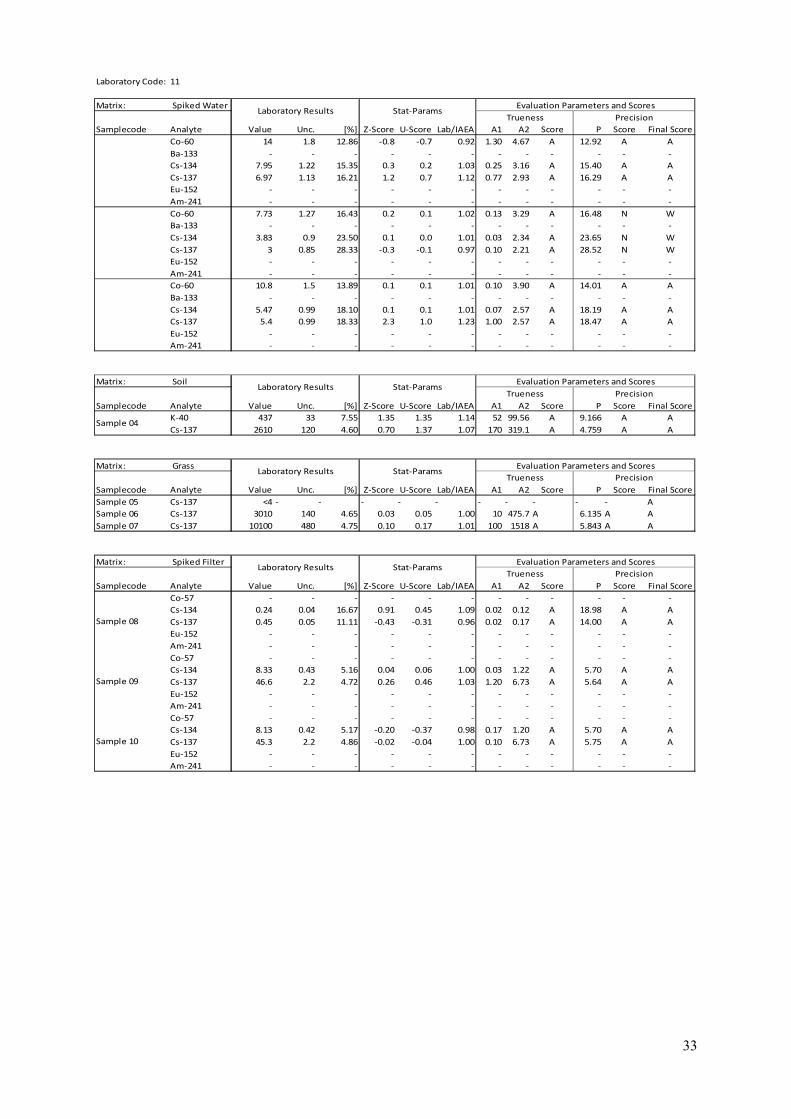
33
Laboratory Code: 11
Matrix: Spiked Water
Samplecode Analyte Value Unc. [%] Z-Score U-Score Lab/IAEA A1 A2 Score P Score Final Score
Co-60 14 1.8 12.86 -0.8 -0.7 0.92 1.30 4.67 A 12.92 A A
Ba-133 - - - - - - - - - - - -
Cs-134 7.95 1.22 15.35 0.3 0.2 1.03 0.25 3.16 A 15.40 A A
Cs-137 6.97 1.13 16.21 1.2 0.7 1.12 0.77 2.93 A 16.29 A A
Eu-152 - - - - - - - - - - - -
Am-241 - - - - - - - - - - - -
Co-60 7.73 1.27 16.43 0.2 0.1 1.02 0.13 3.29 A 16.48 N W
Ba-133 - - - - - - - - - - - -
Cs-134 3.83 0.9 23.50 0.1 0.0 1.01 0.03 2.34 A 23.65 N W
Cs-137 3 0.85 28.33 -0.3 -0.1 0.97 0.10 2.21 A 28.52 N W
Eu-152 - - - - - - - - - - - -
Am-241 - - - - - - - - - - - -
Co-60 10.8 1.5 13.89 0.1 0.1 1.01 0.10 3.90 A 14.01 A A
Ba-133 - - - - - - - - - - - -
Cs-134 5.47 0.99 18.10 0.1 0.1 1.01 0.07 2.57 A 18.19 A A
Cs-137 5.4 0.99 18.33 2.3 1.0 1.23 1.00 2.57 A 18.47 A A
Eu-152 - - - - - - - - - - - -
Am-241 - - - - - - - - - - - -
Matrix: Soil
Samplecode Analyte Value Unc. [%] Z-Score U-Score Lab/IAEA A1 A2 Score P Score Final Score
K-40 437 33 7.55 1.35 1.35 1.14 52 99.56 A 9.166 A A
Cs-137 2610 120 4.60 0.70 1.37 1.07 170 319.1 A 4.759 A A
Matrix: Grass
Samplecode Analyte Value Unc. [%] Z-Score U-Score Lab/IAEA A1 A2 Score P Score Final Score
Sample 05 Cs-137 <4 - - - - - - - - - - A
Sample 06 Cs-137 3010 140 4.65 0.03 0.05 1.00 10 475.7 A 6.135 A A
Sample 07 Cs-137 10100 480 4.75 0.10 0.17 1.01 100 1518 A 5.843 A A
Matrix: Spiked Filter
Samplecode Analyte Value Unc. [%] Z-Score U-Score Lab/IAEA A1 A2 Score P Score Final Score
Co-57 - - - - - - - - - - - -
Cs-134 0.24 0.04 16.67 0.91 0.45 1.09 0.02 0.12 A 18.98 A A
Cs-137 0.45 0.05 11.11 -0.43 -0.31 0.96 0.02 0.17 A 14.00 A A
Eu-152 - - - - - - - - - - - -
Am-241 - - - - - - - - - - - -
Co-57 - - - - - - - - - - - -
Cs-134 8.33 0.43 5.16 0.04 0.06 1.00 0.03 1.22 A 5.70 A A
Cs-137 46.6 2.2 4.72 0.26 0.46 1.03 1.20 6.73 A 5.64 A A
Eu-152 - - - - - - - - - - - -
Am-241 - - - - - - - - - - - -
Co-57 - - - - - - - - - - - -
Cs-134 8.13 0.42 5.17 -0.20 -0.37 0.98 0.17 1.20 A 5.70 A A
Cs-137 45.3 2.2 4.86 -0.02 -0.04 1.00 0.10 6.73 A 5.75 A A
Eu-152 - - - - - - - - - - - -
Am-241 - - - - - - - - - - - -
Laboratory Results Stat-ParamsEvaluation Parameters and Scores
Trueness Precision
Laboratory Results Stat-ParamsEvaluation Parameters and Scores
Trueness Precision
Sample 04
Laboratory Results Stat-ParamsEvaluation Parameters and Scores
Trueness Precision
Sample 09
Sample 10
Laboratory Results Stat-ParamsEvaluation Parameters and Scores
Trueness Precision
Sample 08
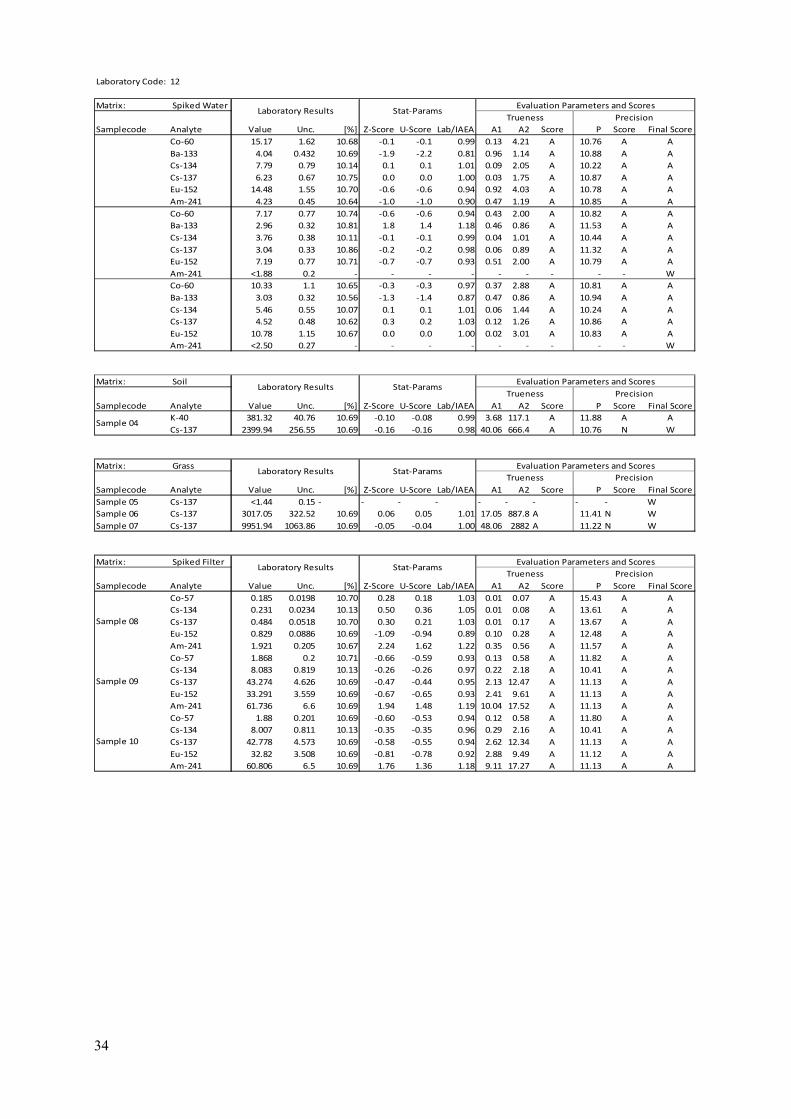
34
Laboratory Code: 12
Matrix: Spiked Water
Samplecode Analyte Value Unc. [%] Z-Score U-Score Lab/IAEA A1 A2 Score P Score Final Score
Co-60 15.17 1.62 10.68 -0.1 -0.1 0.99 0.13 4.21 A 10.76 A A
Ba-133 4.04 0.432 10.69 -1.9 -2.2 0.81 0.96 1.14 A 10.88 A A
Cs-134 7.79 0.79 10.14 0.1 0.1 1.01 0.09 2.05 A 10.22 A A
Cs-137 6.23 0.67 10.75 0.0 0.0 1.00 0.03 1.75 A 10.87 A A
Eu-152 14.48 1.55 10.70 -0.6 -0.6 0.94 0.92 4.03 A 10.78 A A
Am-241 4.23 0.45 10.64 -1.0 -1.0 0.90 0.47 1.19 A 10.85 A A
Co-60 7.17 0.77 10.74 -0.6 -0.6 0.94 0.43 2.00 A 10.82 A A
Ba-133 2.96 0.32 10.81 1.8 1.4 1.18 0.46 0.86 A 11.53 A A
Cs-134 3.76 0.38 10.11 -0.1 -0.1 0.99 0.04 1.01 A 10.44 A A
Cs-137 3.04 0.33 10.86 -0.2 -0.2 0.98 0.06 0.89 A 11.32 A A
Eu-152 7.19 0.77 10.71 -0.7 -0.7 0.93 0.51 2.00 A 10.79 A A
Am-241 <1.88 0.2 - - - - - - - - - W
Co-60 10.33 1.1 10.65 -0.3 -0.3 0.97 0.37 2.88 A 10.81 A A
Ba-133 3.03 0.32 10.56 -1.3 -1.4 0.87 0.47 0.86 A 10.94 A A
Cs-134 5.46 0.55 10.07 0.1 0.1 1.01 0.06 1.44 A 10.24 A A
Cs-137 4.52 0.48 10.62 0.3 0.2 1.03 0.12 1.26 A 10.86 A A
Eu-152 10.78 1.15 10.67 0.0 0.0 1.00 0.02 3.01 A 10.83 A A
Am-241 <2.50 0.27 - - - - - - - - - W
Matrix: Soil
Samplecode Analyte Value Unc. [%] Z-Score U-Score Lab/IAEA A1 A2 Score P Score Final Score
K-40 381.32 40.76 10.69 -0.10 -0.08 0.99 3.68 117.1 A 11.88 A A
Cs-137 2399.94 256.55 10.69 -0.16 -0.16 0.98 40.06 666.4 A 10.76 N W
Matrix: Grass
Samplecode Analyte Value Unc. [%] Z-Score U-Score Lab/IAEA A1 A2 Score P Score Final Score
Sample 05 Cs-137 <1.44 0.15 - - - - - - - - - W
Sample 06 Cs-137 3017.05 322.52 10.69 0.06 0.05 1.01 17.05 887.8 A 11.41 N W
Sample 07 Cs-137 9951.94 1063.86 10.69 -0.05 -0.04 1.00 48.06 2882 A 11.22 N W
Matrix: Spiked Filter
Samplecode Analyte Value Unc. [%] Z-Score U-Score Lab/IAEA A1 A2 Score P Score Final Score
Co-57 0.185 0.0198 10.70 0.28 0.18 1.03 0.01 0.07 A 15.43 A A
Cs-134 0.231 0.0234 10.13 0.50 0.36 1.05 0.01 0.08 A 13.61 A A
Cs-137 0.484 0.0518 10.70 0.30 0.21 1.03 0.01 0.17 A 13.67 A A
Eu-152 0.829 0.0886 10.69 -1.09 -0.94 0.89 0.10 0.28 A 12.48 A A
Am-241 1.921 0.205 10.67 2.24 1.62 1.22 0.35 0.56 A 11.57 A A
Co-57 1.868 0.2 10.71 -0.66 -0.59 0.93 0.13 0.58 A 11.82 A A
Cs-134 8.083 0.819 10.13 -0.26 -0.26 0.97 0.22 2.18 A 10.41 A A
Cs-137 43.274 4.626 10.69 -0.47 -0.44 0.95 2.13 12.47 A 11.13 A A
Eu-152 33.291 3.559 10.69 -0.67 -0.65 0.93 2.41 9.61 A 11.13 A A
Am-241 61.736 6.6 10.69 1.94 1.48 1.19 10.04 17.52 A 11.13 A A
Co-57 1.88 0.201 10.69 -0.60 -0.53 0.94 0.12 0.58 A 11.80 A A
Cs-134 8.007 0.811 10.13 -0.35 -0.35 0.96 0.29 2.16 A 10.41 A A
Cs-137 42.778 4.573 10.69 -0.58 -0.55 0.94 2.62 12.34 A 11.13 A A
Eu-152 32.82 3.508 10.69 -0.81 -0.78 0.92 2.88 9.49 A 11.12 A A
Am-241 60.806 6.5 10.69 1.76 1.36 1.18 9.11 17.27 A 11.13 A A
Sample 09
Sample 10
Laboratory Results Stat-ParamsEvaluation Parameters and Scores
Trueness Precision
Sample 08
Sample 04
Laboratory Results Stat-ParamsEvaluation Parameters and Scores
Trueness Precision
Laboratory Results Stat-ParamsEvaluation Parameters and Scores
Trueness Precision
Laboratory Results Stat-ParamsEvaluation Parameters and Scores
Trueness Precision
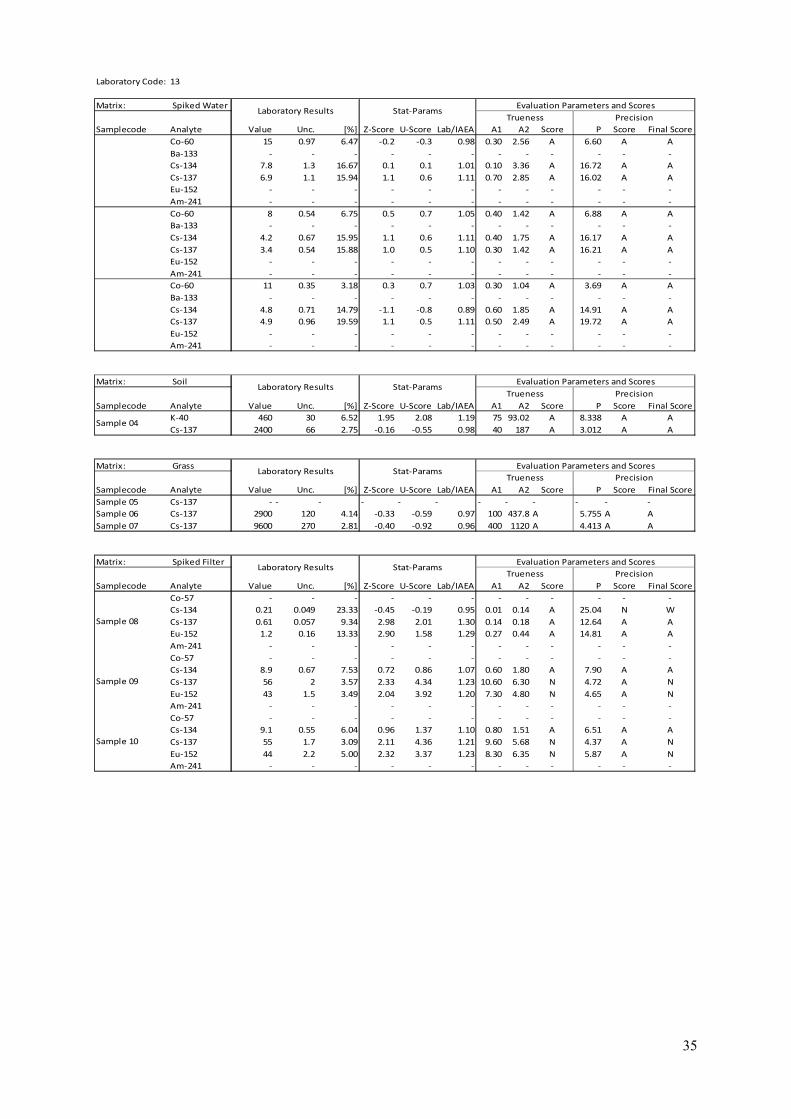
35
Laboratory Code: 13
Matrix: Spiked Water
Samplecode Analyte Value Unc. [%] Z-Score U-Score Lab/IAEA A1 A2 Score P Score Final Score
Co-60 15 0.97 6.47 -0.2 -0.3 0.98 0.30 2.56 A 6.60 A A
Ba-133 - - - - - - - - - - - -
Cs-134 7.8 1.3 16.67 0.1 0.1 1.01 0.10 3.36 A 16.72 A A
Cs-137 6.9 1.1 15.94 1.1 0.6 1.11 0.70 2.85 A 16.02 A A
Eu-152 - - - - - - - - - - - -
Am-241 - - - - - - - - - - - -
Co-60 8 0.54 6.75 0.5 0.7 1.05 0.40 1.42 A 6.88 A A
Ba-133 - - - - - - - - - - - -
Cs-134 4.2 0.67 15.95 1.1 0.6 1.11 0.40 1.75 A 16.17 A A
Cs-137 3.4 0.54 15.88 1.0 0.5 1.10 0.30 1.42 A 16.21 A A
Eu-152 - - - - - - - - - - - -
Am-241 - - - - - - - - - - - -
Co-60 11 0.35 3.18 0.3 0.7 1.03 0.30 1.04 A 3.69 A A
Ba-133 - - - - - - - - - - - -
Cs-134 4.8 0.71 14.79 -1.1 -0.8 0.89 0.60 1.85 A 14.91 A A
Cs-137 4.9 0.96 19.59 1.1 0.5 1.11 0.50 2.49 A 19.72 A A
Eu-152 - - - - - - - - - - - -
Am-241 - - - - - - - - - - - -
Matrix: Soil
Samplecode Analyte Value Unc. [%] Z-Score U-Score Lab/IAEA A1 A2 Score P Score Final Score
K-40 460 30 6.52 1.95 2.08 1.19 75 93.02 A 8.338 A A
Cs-137 2400 66 2.75 -0.16 -0.55 0.98 40 187 A 3.012 A A
Matrix: Grass
Samplecode Analyte Value Unc. [%] Z-Score U-Score Lab/IAEA A1 A2 Score P Score Final Score
Sample 05 Cs-137 - - - - - - - - - - - -
Sample 06 Cs-137 2900 120 4.14 -0.33 -0.59 0.97 100 437.8 A 5.755 A A
Sample 07 Cs-137 9600 270 2.81 -0.40 -0.92 0.96 400 1120 A 4.413 A A
Matrix: Spiked Filter
Samplecode Analyte Value Unc. [%] Z-Score U-Score Lab/IAEA A1 A2 Score P Score Final Score
Co-57 - - - - - - - - - - - -
Cs-134 0.21 0.049 23.33 -0.45 -0.19 0.95 0.01 0.14 A 25.04 N W
Cs-137 0.61 0.057 9.34 2.98 2.01 1.30 0.14 0.18 A 12.64 A A
Eu-152 1.2 0.16 13.33 2.90 1.58 1.29 0.27 0.44 A 14.81 A A
Am-241 - - - - - - - - - - - -
Co-57 - - - - - - - - - - - -
Cs-134 8.9 0.67 7.53 0.72 0.86 1.07 0.60 1.80 A 7.90 A A
Cs-137 56 2 3.57 2.33 4.34 1.23 10.60 6.30 N 4.72 A N
Eu-152 43 1.5 3.49 2.04 3.92 1.20 7.30 4.80 N 4.65 A N
Am-241 - - - - - - - - - - - -
Co-57 - - - - - - - - - - - -
Cs-134 9.1 0.55 6.04 0.96 1.37 1.10 0.80 1.51 A 6.51 A A
Cs-137 55 1.7 3.09 2.11 4.36 1.21 9.60 5.68 N 4.37 A N
Eu-152 44 2.2 5.00 2.32 3.37 1.23 8.30 6.35 N 5.87 A N
Am-241 - - - - - - - - - - - -
Laboratory Results Stat-ParamsEvaluation Parameters and Scores
Trueness Precision
Laboratory Results Stat-ParamsEvaluation Parameters and Scores
Trueness Precision
Sample 04
Laboratory Results Stat-ParamsEvaluation Parameters and Scores
Trueness Precision
Sample 09
Sample 10
Laboratory Results Stat-ParamsEvaluation Parameters and Scores
Trueness Precision
Sample 08
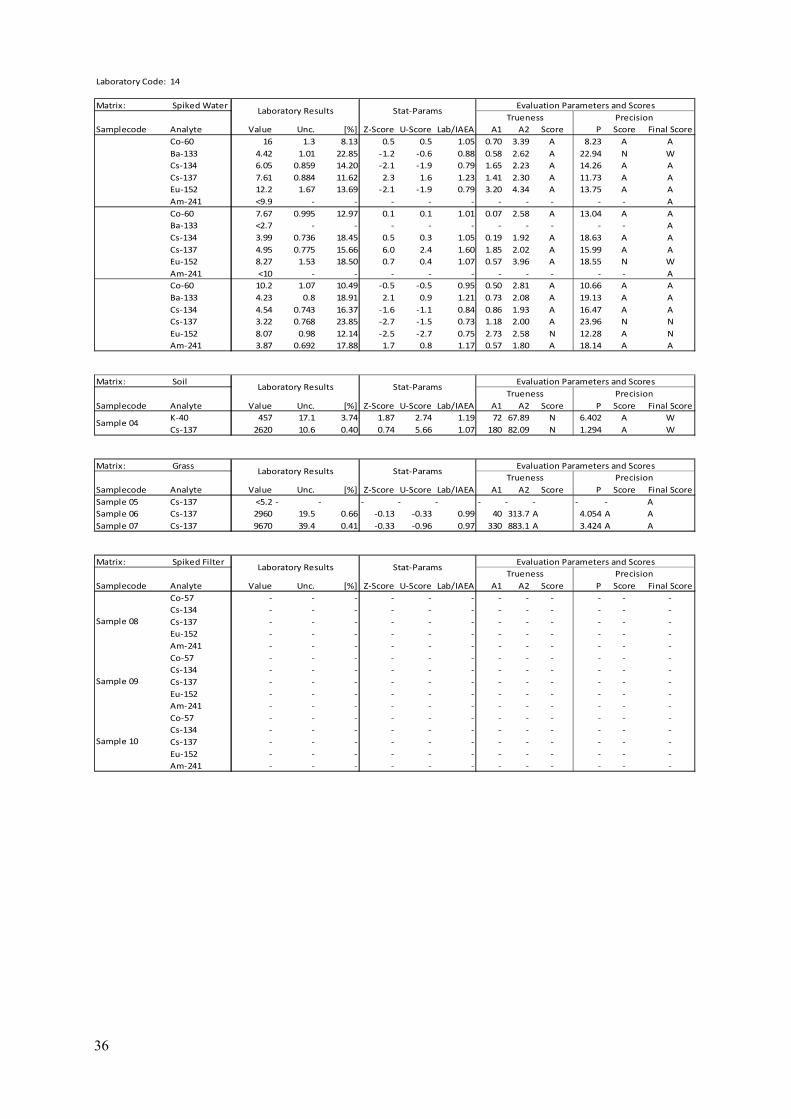
36
Laboratory Code: 14
Matrix: Spiked Water
Samplecode Analyte Value Unc. [%] Z-Score U-Score Lab/IAEA A1 A2 Score P Score Final Score
Co-60 16 1.3 8.13 0.5 0.5 1.05 0.70 3.39 A 8.23 A A
Ba-133 4.42 1.01 22.85 -1.2 -0.6 0.88 0.58 2.62 A 22.94 N W
Cs-134 6.05 0.859 14.20 -2.1 -1.9 0.79 1.65 2.23 A 14.26 A A
Cs-137 7.61 0.884 11.62 2.3 1.6 1.23 1.41 2.30 A 11.73 A A
Eu-152 12.2 1.67 13.69 -2.1 -1.9 0.79 3.20 4.34 A 13.75 A A
Am-241 <9.9 - - - - - - - - - - A
Co-60 7.67 0.995 12.97 0.1 0.1 1.01 0.07 2.58 A 13.04 A A
Ba-133 <2.7 - - - - - - - - - - A
Cs-134 3.99 0.736 18.45 0.5 0.3 1.05 0.19 1.92 A 18.63 A A
Cs-137 4.95 0.775 15.66 6.0 2.4 1.60 1.85 2.02 A 15.99 A A
Eu-152 8.27 1.53 18.50 0.7 0.4 1.07 0.57 3.96 A 18.55 N W
Am-241 <10 - - - - - - - - - - A
Co-60 10.2 1.07 10.49 -0.5 -0.5 0.95 0.50 2.81 A 10.66 A A
Ba-133 4.23 0.8 18.91 2.1 0.9 1.21 0.73 2.08 A 19.13 A A
Cs-134 4.54 0.743 16.37 -1.6 -1.1 0.84 0.86 1.93 A 16.47 A A
Cs-137 3.22 0.768 23.85 -2.7 -1.5 0.73 1.18 2.00 A 23.96 N N
Eu-152 8.07 0.98 12.14 -2.5 -2.7 0.75 2.73 2.58 N 12.28 A N
Am-241 3.87 0.692 17.88 1.7 0.8 1.17 0.57 1.80 A 18.14 A A
Matrix: Soil
Samplecode Analyte Value Unc. [%] Z-Score U-Score Lab/IAEA A1 A2 Score P Score Final Score
K-40 457 17.1 3.74 1.87 2.74 1.19 72 67.89 N 6.402 A W
Cs-137 2620 10.6 0.40 0.74 5.66 1.07 180 82.09 N 1.294 A W
Matrix: Grass
Samplecode Analyte Value Unc. [%] Z-Score U-Score Lab/IAEA A1 A2 Score P Score Final Score
Sample 05 Cs-137 <5.2 - - - - - - - - - - A
Sample 06 Cs-137 2960 19.5 0.66 -0.13 -0.33 0.99 40 313.7 A 4.054 A A
Sample 07 Cs-137 9670 39.4 0.41 -0.33 -0.96 0.97 330 883.1 A 3.424 A A
Matrix: Spiked Filter
Samplecode Analyte Value Unc. [%] Z-Score U-Score Lab/IAEA A1 A2 Score P Score Final Score
Co-57 - - - - - - - - - - - -
Cs-134 - - - - - - - - - - - -
Cs-137 - - - - - - - - - - - -
Eu-152 - - - - - - - - - - - -
Am-241 - - - - - - - - - - - -
Co-57 - - - - - - - - - - - -
Cs-134 - - - - - - - - - - - -
Cs-137 - - - - - - - - - - - -
Eu-152 - - - - - - - - - - - -
Am-241 - - - - - - - - - - - -
Co-57 - - - - - - - - - - - -
Cs-134 - - - - - - - - - - - -
Cs-137 - - - - - - - - - - - -
Eu-152 - - - - - - - - - - - -
Am-241 - - - - - - - - - - - -
Sample 09
Sample 10
Laboratory Results Stat-ParamsEvaluation Parameters and Scores
Trueness Precision
Sample 08
Sample 04
Laboratory Results Stat-ParamsEvaluation Parameters and Scores
Trueness Precision
Laboratory Results Stat-ParamsEvaluation Parameters and Scores
Trueness Precision
Laboratory Results Stat-ParamsEvaluation Parameters and Scores
Trueness Precision

37
Laboratory Code: 15
Matrix: Spiked Water
Samplecode Analyte Value Unc. [%] Z-Score U-Score Lab/IAEA A1 A2 Score P Score Final Score
Co-60 16.74 2.21 13.20 0.9 0.6 1.09 1.44 5.73 A 13.27 A A
Ba-133 6.14 1.63 26.55 2.3 0.7 1.23 1.14 4.21 A 26.62 N N
Cs-134 9.89 1.66 16.78 2.8 1.3 1.28 2.19 4.29 A 16.83 A A
Cs-137 9.06 1.55 17.11 4.6 1.8 1.46 2.86 4.01 A 17.18 A A
Eu-152 17.83 3.56 19.97 1.6 0.7 1.16 2.43 9.20 A 20.01 N N
Am-241 <7.73 - - - - - - - - - - A
Co-60 6.87 1.66 24.16 -1.0 -0.4 0.90 0.73 4.29 A 24.20 N W
Ba-133 2.32 1.42 61.21 -0.7 -0.1 0.93 0.18 3.67 A 61.34 N W
Cs-134 5.33 1.32 24.77 4.0 1.2 1.40 1.53 3.42 A 24.90 N N
Cs-137 6.64 1.37 20.63 11.4 2.6 2.14 3.54 3.54 A 20.88 N N
Eu-152 5.7 3.13 54.91 -2.6 -0.6 0.74 2.00 8.08 A 54.93 N N
Am-241 <7.18 - - - - - - - - - - A
Co-60 11.84 2.03 17.15 1.1 0.6 1.11 1.14 5.26 A 17.25 N W
Ba-133 3.81 1.37 35.96 0.9 0.2 1.09 0.31 3.54 A 36.07 N W
Cs-134 6.91 1.45 20.98 2.8 1.0 1.28 1.51 3.75 A 21.07 N N
Cs-137 5.96 1.37 22.99 3.5 1.1 1.35 1.56 3.54 A 23.10 N N
Eu-152 8.79 3.41 38.79 -1.9 -0.6 0.81 2.01 8.81 A 38.84 N N
Am-241 <7.46 - - - - - - - - - - A
Matrix: Soil
Samplecode Analyte Value Unc. [%] Z-Score U-Score Lab/IAEA A1 A2 Score P Score Final Score
K-40 495 28 5.66 2.86 3.20 1.29 110 88.78 N 7.68 A N
Cs-137 2561 121 4.72 0.50 0.97 1.05 121 321.6 A 4.882 A A
Matrix: Grass
Samplecode Analyte Value Unc. [%] Z-Score U-Score Lab/IAEA A1 A2 Score P Score Final Score
Sample 05 Cs-137 5.2 2.34 45.00 16.00 1.35 2.60 3.2 6.125 A 49.24 N N
Sample 06 Cs-137 2710 130 4.80 -0.97 -1.64 0.90 290 456.4 A 6.246 A A
Sample 07 Cs-137 8866 420 4.74 -1.13 -2.10 0.89 1134 1394 A 5.831 A A
Matrix: Spiked Filter
Samplecode Analyte Value Unc. [%] Z-Score U-Score Lab/IAEA A1 A2 Score P Score Final Score
Co-57 - - - - - - - - - - - -
Cs-134 - - - - - - - - - - - -
Cs-137 - - - - - - - - - - - -
Eu-152 - - - - - - - - - - - -
Am-241 - - - - - - - - - - - -
Co-57 - - - - - - - - - - - -
Cs-134 - - - - - - - - - - - -
Cs-137 - - - - - - - - - - - -
Eu-152 - - - - - - - - - - - -
Am-241 - - - - - - - - - - - -
Co-57 - - - - - - - - - - - -
Cs-134 - - - - - - - - - - - -
Cs-137 - - - - - - - - - - - -
Eu-152 - - - - - - - - - - - -
Am-241 - - - - - - - - - - - -
Laboratory Results Stat-ParamsEvaluation Parameters and Scores
Trueness Precision
Laboratory Results Stat-ParamsEvaluation Parameters and Scores
Trueness Precision
Sample 04
Laboratory Results Stat-ParamsEvaluation Parameters and Scores
Trueness Precision
Sample 09
Sample 10
Laboratory Results Stat-ParamsEvaluation Parameters and Scores
Trueness Precision
Sample 08
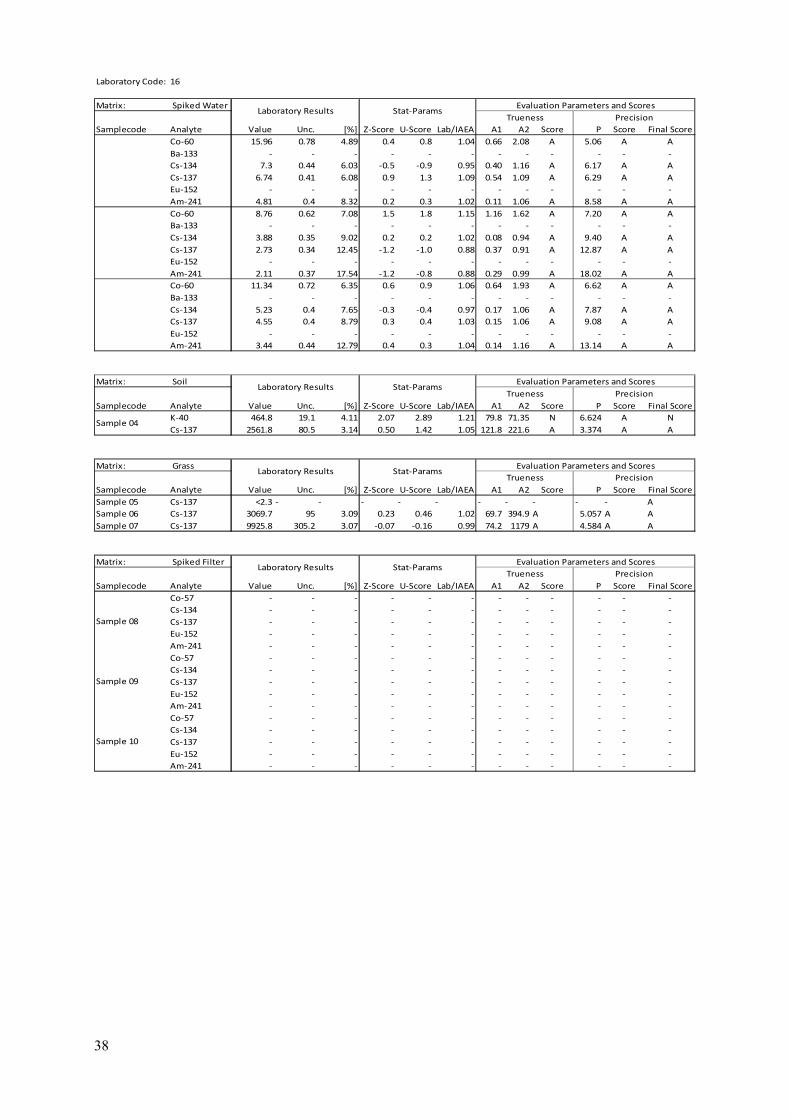
38
Laboratory Code: 16
Matrix: Spiked Water
Samplecode Analyte Value Unc. [%] Z-Score U-Score Lab/IAEA A1 A2 Score P Score Final Score
Co-60 15.96 0.78 4.89 0.4 0.8 1.04 0.66 2.08 A 5.06 A A
Ba-133 - - - - - - - - - - - -
Cs-134 7.3 0.44 6.03 -0.5 -0.9 0.95 0.40 1.16 A 6.17 A A
Cs-137 6.74 0.41 6.08 0.9 1.3 1.09 0.54 1.09 A 6.29 A A
Eu-152 - - - - - - - - - - - -
Am-241 4.81 0.4 8.32 0.2 0.3 1.02 0.11 1.06 A 8.58 A A
Co-60 8.76 0.62 7.08 1.5 1.8 1.15 1.16 1.62 A 7.20 A A
Ba-133 - - - - - - - - - - - -
Cs-134 3.88 0.35 9.02 0.2 0.2 1.02 0.08 0.94 A 9.40 A A
Cs-137 2.73 0.34 12.45 -1.2 -1.0 0.88 0.37 0.91 A 12.87 A A
Eu-152 - - - - - - - - - - - -
Am-241 2.11 0.37 17.54 -1.2 -0.8 0.88 0.29 0.99 A 18.02 A A
Co-60 11.34 0.72 6.35 0.6 0.9 1.06 0.64 1.93 A 6.62 A A
Ba-133 - - - - - - - - - - - -
Cs-134 5.23 0.4 7.65 -0.3 -0.4 0.97 0.17 1.06 A 7.87 A A
Cs-137 4.55 0.4 8.79 0.3 0.4 1.03 0.15 1.06 A 9.08 A A
Eu-152 - - - - - - - - - - - -
Am-241 3.44 0.44 12.79 0.4 0.3 1.04 0.14 1.16 A 13.14 A A
Matrix: Soil
Samplecode Analyte Value Unc. [%] Z-Score U-Score Lab/IAEA A1 A2 Score P Score Final Score
K-40 464.8 19.1 4.11 2.07 2.89 1.21 79.8 71.35 N 6.624 A N
Cs-137 2561.8 80.5 3.14 0.50 1.42 1.05 121.8 221.6 A 3.374 A A
Matrix: Grass
Samplecode Analyte Value Unc. [%] Z-Score U-Score Lab/IAEA A1 A2 Score P Score Final Score
Sample 05 Cs-137 <2.3 - - - - - - - - - - A
Sample 06 Cs-137 3069.7 95 3.09 0.23 0.46 1.02 69.7 394.9 A 5.057 A A
Sample 07 Cs-137 9925.8 305.2 3.07 -0.07 -0.16 0.99 74.2 1179 A 4.584 A A
Matrix: Spiked Filter
Samplecode Analyte Value Unc. [%] Z-Score U-Score Lab/IAEA A1 A2 Score P Score Final Score
Co-57 - - - - - - - - - - - -
Cs-134 - - - - - - - - - - - -
Cs-137 - - - - - - - - - - - -
Eu-152 - - - - - - - - - - - -
Am-241 - - - - - - - - - - - -
Co-57 - - - - - - - - - - - -
Cs-134 - - - - - - - - - - - -
Cs-137 - - - - - - - - - - - -
Eu-152 - - - - - - - - - - - -
Am-241 - - - - - - - - - - - -
Co-57 - - - - - - - - - - - -
Cs-134 - - - - - - - - - - - -
Cs-137 - - - - - - - - - - - -
Eu-152 - - - - - - - - - - - -
Am-241 - - - - - - - - - - - -
Sample 09
Sample 10
Laboratory Results Stat-ParamsEvaluation Parameters and Scores
Trueness Precision
Sample 08
Sample 04
Laboratory Results Stat-ParamsEvaluation Parameters and Scores
Trueness Precision
Laboratory Results Stat-ParamsEvaluation Parameters and Scores
Trueness Precision
Laboratory Results Stat-ParamsEvaluation Parameters and Scores
Trueness Precision
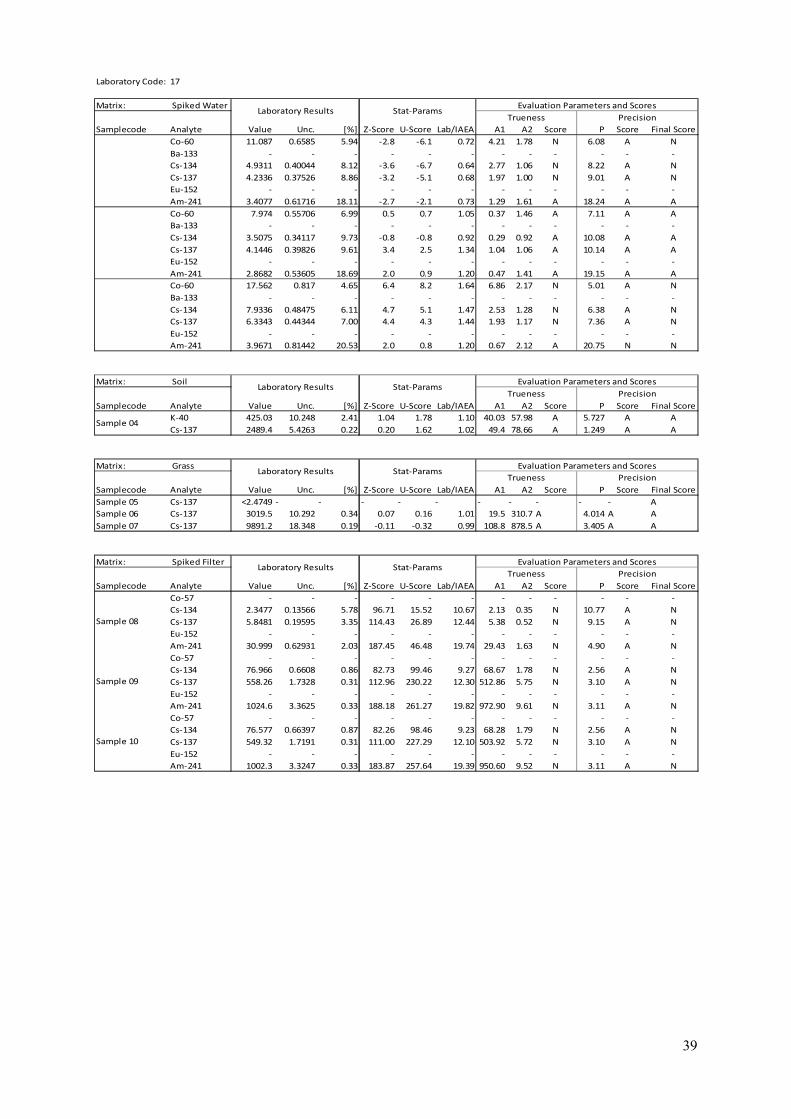
39
Laboratory Code: 17
Matrix: Spiked Water
Samplecode Analyte Value Unc. [%] Z-Score U-Score Lab/IAEA A1 A2 Score P Score Final Score
Co-60 11.087 0.6585 5.94 -2.8 -6.1 0.72 4.21 1.78 N 6.08 A N
Ba-133 - - - - - - - - - - - -
Cs-134 4.9311 0.40044 8.12 -3.6 -6.7 0.64 2.77 1.06 N 8.22 A N
Cs-137 4.2336 0.37526 8.86 -3.2 -5.1 0.68 1.97 1.00 N 9.01 A N
Eu-152 - - - - - - - - - - - -
Am-241 3.4077 0.61716 18.11 -2.7 -2.1 0.73 1.29 1.61 A 18.24 A A
Co-60 7.974 0.55706 6.99 0.5 0.7 1.05 0.37 1.46 A 7.11 A A
Ba-133 - - - - - - - - - - - -
Cs-134 3.5075 0.34117 9.73 -0.8 -0.8 0.92 0.29 0.92 A 10.08 A A
Cs-137 4.1446 0.39826 9.61 3.4 2.5 1.34 1.04 1.06 A 10.14 A A
Eu-152 - - - - - - - - - - - -
Am-241 2.8682 0.53605 18.69 2.0 0.9 1.20 0.47 1.41 A 19.15 A A
Co-60 17.562 0.817 4.65 6.4 8.2 1.64 6.86 2.17 N 5.01 A N
Ba-133 - - - - - - - - - - - -
Cs-134 7.9336 0.48475 6.11 4.7 5.1 1.47 2.53 1.28 N 6.38 A N
Cs-137 6.3343 0.44344 7.00 4.4 4.3 1.44 1.93 1.17 N 7.36 A N
Eu-152 - - - - - - - - - - - -
Am-241 3.9671 0.81442 20.53 2.0 0.8 1.20 0.67 2.12 A 20.75 N N
Matrix: Soil
Samplecode Analyte Value Unc. [%] Z-Score U-Score Lab/IAEA A1 A2 Score P Score Final Score
K-40 425.03 10.248 2.41 1.04 1.78 1.10 40.03 57.98 A 5.727 A A
Cs-137 2489.4 5.4263 0.22 0.20 1.62 1.02 49.4 78.66 A 1.249 A A
Matrix: Grass
Samplecode Analyte Value Unc. [%] Z-Score U-Score Lab/IAEA A1 A2 Score P Score Final Score
Sample 05 Cs-137 <2.4749 - - - - - - - - - - A
Sample 06 Cs-137 3019.5 10.292 0.34 0.07 0.16 1.01 19.5 310.7 A 4.014 A A
Sample 07 Cs-137 9891.2 18.348 0.19 -0.11 -0.32 0.99 108.8 878.5 A 3.405 A A
Matrix: Spiked Filter
Samplecode Analyte Value Unc. [%] Z-Score U-Score Lab/IAEA A1 A2 Score P Score Final Score
Co-57 - - - - - - - - - - - -
Cs-134 2.3477 0.13566 5.78 96.71 15.52 10.67 2.13 0.35 N 10.77 A N
Cs-137 5.8481 0.19595 3.35 114.43 26.89 12.44 5.38 0.52 N 9.15 A N
Eu-152 - - - - - - - - - - - -
Am-241 30.999 0.62931 2.03 187.45 46.48 19.74 29.43 1.63 N 4.90 A N
Co-57 - - - - - - - - - - - -
Cs-134 76.966 0.6608 0.86 82.73 99.46 9.27 68.67 1.78 N 2.56 A N
Cs-137 558.26 1.7328 0.31 112.96 230.22 12.30 512.86 5.75 N 3.10 A N
Eu-152 - - - - - - - - - - - -
Am-241 1024.6 3.3625 0.33 188.18 261.27 19.82 972.90 9.61 N 3.11 A N
Co-57 - - - - - - - - - - - -
Cs-134 76.577 0.66397 0.87 82.26 98.46 9.23 68.28 1.79 N 2.56 A N
Cs-137 549.32 1.7191 0.31 111.00 227.29 12.10 503.92 5.72 N 3.10 A N
Eu-152 - - - - - - - - - - - -
Am-241 1002.3 3.3247 0.33 183.87 257.64 19.39 950.60 9.52 N 3.11 A N
Laboratory Results Stat-ParamsEvaluation Parameters and Scores
Trueness Precision
Laboratory Results Stat-ParamsEvaluation Parameters and Scores
Trueness Precision
Sample 04
Laboratory Results Stat-ParamsEvaluation Parameters and Scores
Trueness Precision
Sample 09
Sample 10
Laboratory Results Stat-ParamsEvaluation Parameters and Scores
Trueness Precision
Sample 08
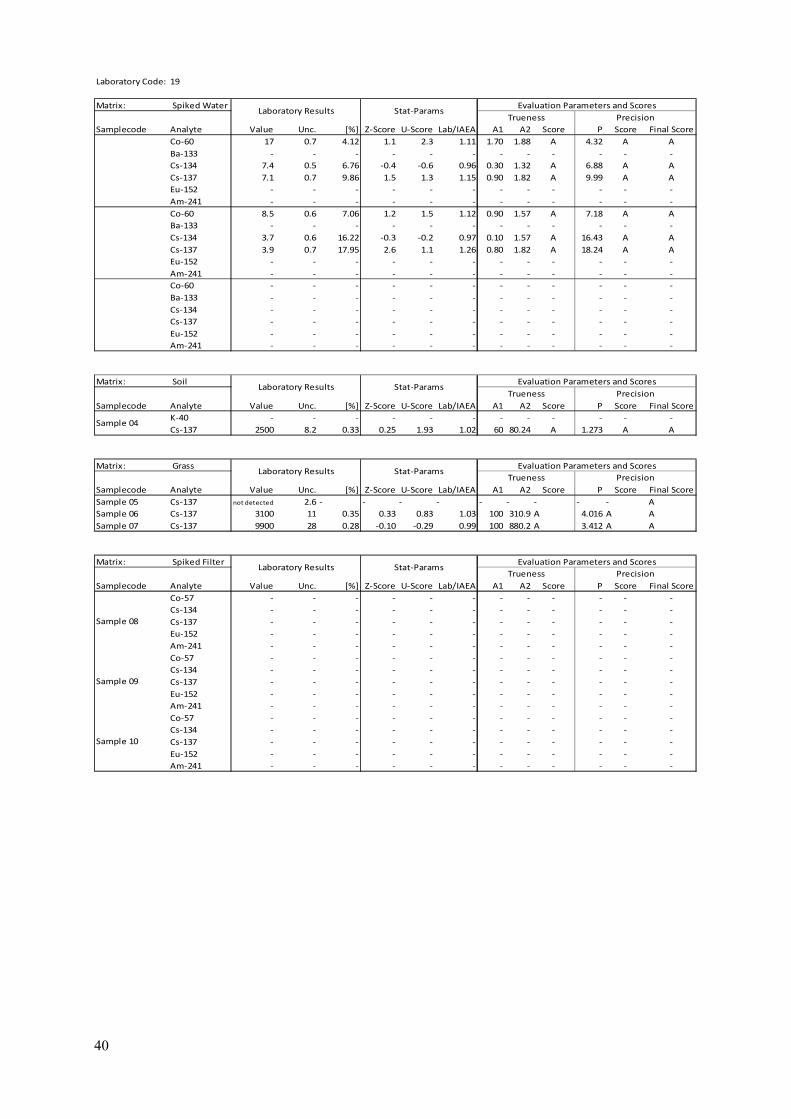
40
Laboratory Code: 19
Matrix: Spiked Water
Samplecode Analyte Value Unc. [%] Z-Score U-Score Lab/IAEA A1 A2 Score P Score Final Score
Co-60 17 0.7 4.12 1.1 2.3 1.11 1.70 1.88 A 4.32 A A
Ba-133 - - - - - - - - - - - -
Cs-134 7.4 0.5 6.76 -0.4 -0.6 0.96 0.30 1.32 A 6.88 A A
Cs-137 7.1 0.7 9.86 1.5 1.3 1.15 0.90 1.82 A 9.99 A A
Eu-152 - - - - - - - - - - - -
Am-241 - - - - - - - - - - - -
Co-60 8.5 0.6 7.06 1.2 1.5 1.12 0.90 1.57 A 7.18 A A
Ba-133 - - - - - - - - - - - -
Cs-134 3.7 0.6 16.22 -0.3 -0.2 0.97 0.10 1.57 A 16.43 A A
Cs-137 3.9 0.7 17.95 2.6 1.1 1.26 0.80 1.82 A 18.24 A A
Eu-152 - - - - - - - - - - - -
Am-241 - - - - - - - - - - - -
Co-60 - - - - - - - - - - - -
Ba-133 - - - - - - - - - - - -
Cs-134 - - - - - - - - - - - -
Cs-137 - - - - - - - - - - - -
Eu-152 - - - - - - - - - - - -
Am-241 - - - - - - - - - - - -
Matrix: Soil
Samplecode Analyte Value Unc. [%] Z-Score U-Score Lab/IAEA A1 A2 Score P Score Final Score
K-40 - - - - - - - - - - - -
Cs-137 2500 8.2 0.33 0.25 1.93 1.02 60 80.24 A 1.273 A A
Matrix: Grass
Samplecode Analyte Value Unc. [%] Z-Score U-Score Lab/IAEA A1 A2 Score P Score Final Score
Sample 05 Cs-137 not detected 2.6 - - - - - - - - - A
Sample 06 Cs-137 3100 11 0.35 0.33 0.83 1.03 100 310.9 A 4.016 A A
Sample 07 Cs-137 9900 28 0.28 -0.10 -0.29 0.99 100 880.2 A 3.412 A A
Matrix: Spiked Filter
Samplecode Analyte Value Unc. [%] Z-Score U-Score Lab/IAEA A1 A2 Score P Score Final Score
Co-57 - - - - - - - - - - - -
Cs-134 - - - - - - - - - - - -
Cs-137 - - - - - - - - - - - -
Eu-152 - - - - - - - - - - - -
Am-241 - - - - - - - - - - - -
Co-57 - - - - - - - - - - - -
Cs-134 - - - - - - - - - - - -
Cs-137 - - - - - - - - - - - -
Eu-152 - - - - - - - - - - - -
Am-241 - - - - - - - - - - - -
Co-57 - - - - - - - - - - - -
Cs-134 - - - - - - - - - - - -
Cs-137 - - - - - - - - - - - -
Eu-152 - - - - - - - - - - - -
Am-241 - - - - - - - - - - - -
Sample 09
Sample 10
Laboratory Results Stat-ParamsEvaluation Parameters and Scores
Trueness Precision
Sample 08
Sample 04
Laboratory Results Stat-ParamsEvaluation Parameters and Scores
Trueness Precision
Laboratory Results Stat-ParamsEvaluation Parameters and Scores
Trueness Precision
Laboratory Results Stat-ParamsEvaluation Parameters and Scores
Trueness Precision
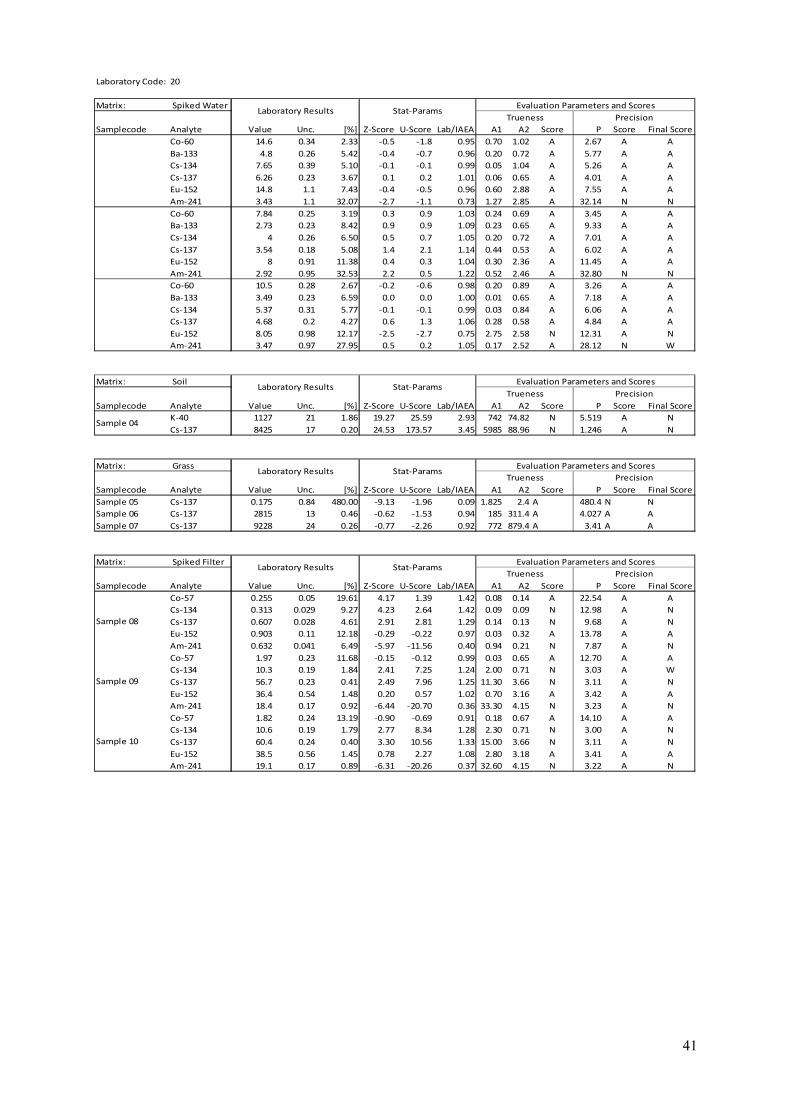
41
Laboratory Code: 20
Matrix: Spiked Water
Samplecode Analyte Value Unc. [%] Z-Score U-Score Lab/IAEA A1 A2 Score P Score Final Score
Co-60 14.6 0.34 2.33 -0.5 -1.8 0.95 0.70 1.02 A 2.67 A A
Ba-133 4.8 0.26 5.42 -0.4 -0.7 0.96 0.20 0.72 A 5.77 A A
Cs-134 7.65 0.39 5.10 -0.1 -0.1 0.99 0.05 1.04 A 5.26 A A
Cs-137 6.26 0.23 3.67 0.1 0.2 1.01 0.06 0.65 A 4.01 A A
Eu-152 14.8 1.1 7.43 -0.4 -0.5 0.96 0.60 2.88 A 7.55 A A
Am-241 3.43 1.1 32.07 -2.7 -1.1 0.73 1.27 2.85 A 32.14 N N
Co-60 7.84 0.25 3.19 0.3 0.9 1.03 0.24 0.69 A 3.45 A A
Ba-133 2.73 0.23 8.42 0.9 0.9 1.09 0.23 0.65 A 9.33 A A
Cs-134 4 0.26 6.50 0.5 0.7 1.05 0.20 0.72 A 7.01 A A
Cs-137 3.54 0.18 5.08 1.4 2.1 1.14 0.44 0.53 A 6.02 A A
Eu-152 8 0.91 11.38 0.4 0.3 1.04 0.30 2.36 A 11.45 A A
Am-241 2.92 0.95 32.53 2.2 0.5 1.22 0.52 2.46 A 32.80 N N
Co-60 10.5 0.28 2.67 -0.2 -0.6 0.98 0.20 0.89 A 3.26 A A
Ba-133 3.49 0.23 6.59 0.0 0.0 1.00 0.01 0.65 A 7.18 A A
Cs-134 5.37 0.31 5.77 -0.1 -0.1 0.99 0.03 0.84 A 6.06 A A
Cs-137 4.68 0.2 4.27 0.6 1.3 1.06 0.28 0.58 A 4.84 A A
Eu-152 8.05 0.98 12.17 -2.5 -2.7 0.75 2.75 2.58 N 12.31 A N
Am-241 3.47 0.97 27.95 0.5 0.2 1.05 0.17 2.52 A 28.12 N W
Matrix: Soil
Samplecode Analyte Value Unc. [%] Z-Score U-Score Lab/IAEA A1 A2 Score P Score Final Score
K-40 1127 21 1.86 19.27 25.59 2.93 742 74.82 N 5.519 A N
Cs-137 8425 17 0.20 24.53 173.57 3.45 5985 88.96 N 1.246 A N
Matrix: Grass
Samplecode Analyte Value Unc. [%] Z-Score U-Score Lab/IAEA A1 A2 Score P Score Final Score
Sample 05 Cs-137 0.175 0.84 480.00 -9.13 -1.96 0.09 1.825 2.4 A 480.4 N N
Sample 06 Cs-137 2815 13 0.46 -0.62 -1.53 0.94 185 311.4 A 4.027 A A
Sample 07 Cs-137 9228 24 0.26 -0.77 -2.26 0.92 772 879.4 A 3.41 A A
Matrix: Spiked Filter
Samplecode Analyte Value Unc. [%] Z-Score U-Score Lab/IAEA A1 A2 Score P Score Final Score
Co-57 0.255 0.05 19.61 4.17 1.39 1.42 0.08 0.14 A 22.54 A A
Cs-134 0.313 0.029 9.27 4.23 2.64 1.42 0.09 0.09 N 12.98 A N
Cs-137 0.607 0.028 4.61 2.91 2.81 1.29 0.14 0.13 N 9.68 A N
Eu-152 0.903 0.11 12.18 -0.29 -0.22 0.97 0.03 0.32 A 13.78 A A
Am-241 0.632 0.041 6.49 -5.97 -11.56 0.40 0.94 0.21 N 7.87 A N
Co-57 1.97 0.23 11.68 -0.15 -0.12 0.99 0.03 0.65 A 12.70 A A
Cs-134 10.3 0.19 1.84 2.41 7.25 1.24 2.00 0.71 N 3.03 A W
Cs-137 56.7 0.23 0.41 2.49 7.96 1.25 11.30 3.66 N 3.11 A N
Eu-152 36.4 0.54 1.48 0.20 0.57 1.02 0.70 3.16 A 3.42 A A
Am-241 18.4 0.17 0.92 -6.44 -20.70 0.36 33.30 4.15 N 3.23 A N
Co-57 1.82 0.24 13.19 -0.90 -0.69 0.91 0.18 0.67 A 14.10 A A
Cs-134 10.6 0.19 1.79 2.77 8.34 1.28 2.30 0.71 N 3.00 A N
Cs-137 60.4 0.24 0.40 3.30 10.56 1.33 15.00 3.66 N 3.11 A N
Eu-152 38.5 0.56 1.45 0.78 2.27 1.08 2.80 3.18 A 3.41 A A
Am-241 19.1 0.17 0.89 -6.31 -20.26 0.37 32.60 4.15 N 3.22 A N
Laboratory Results Stat-ParamsEvaluation Parameters and Scores
Trueness Precision
Laboratory Results Stat-ParamsEvaluation Parameters and Scores
Trueness Precision
Sample 04
Laboratory Results Stat-ParamsEvaluation Parameters and Scores
Trueness Precision
Sample 09
Sample 10
Laboratory Results Stat-ParamsEvaluation Parameters and Scores
Trueness Precision
Sample 08

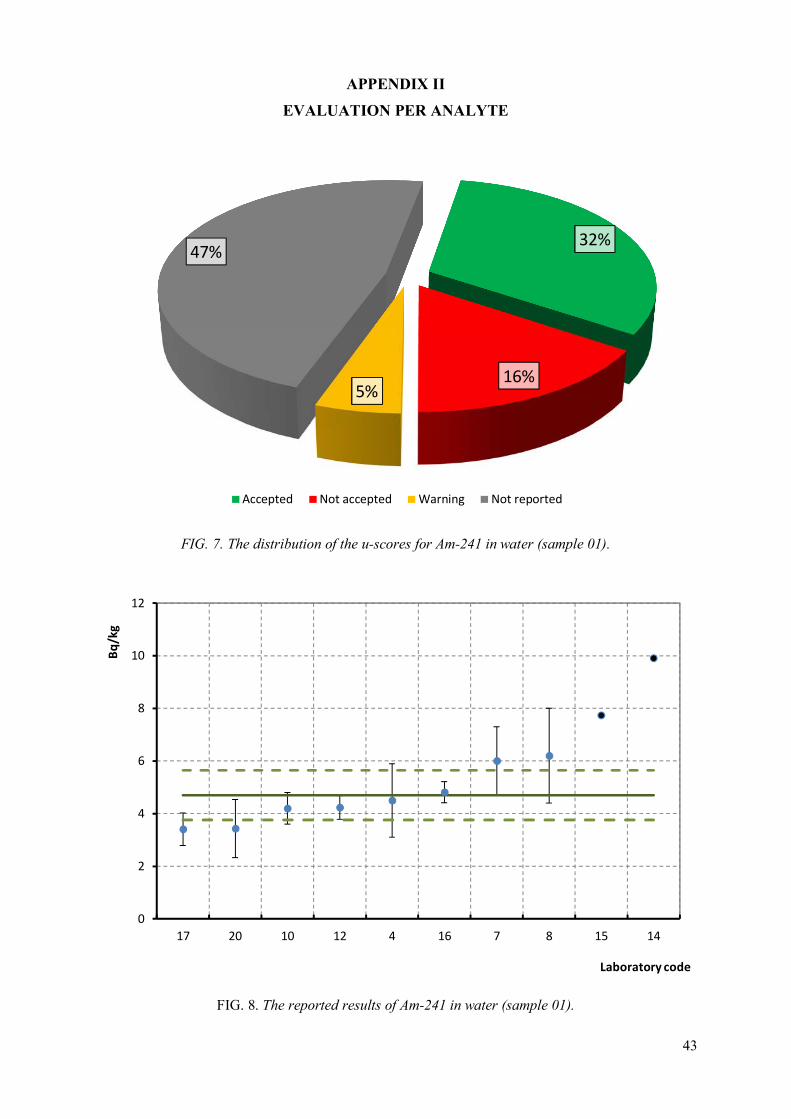
43
APPENDIX II
EVALUATION PER ANALYTE
FIG. 7. The distribution of the u-scores for Am-241 in water (sample 01).
FIG. 8. The reported results of Am-241 in water (sample 01).
32%
16%5%
47%
Accepted Not accepted Warning Not reported
0
2
4
6
8
10
12
17 20 10 12 4 16 7 8 15 14
Bq
/kg
Laboratory code
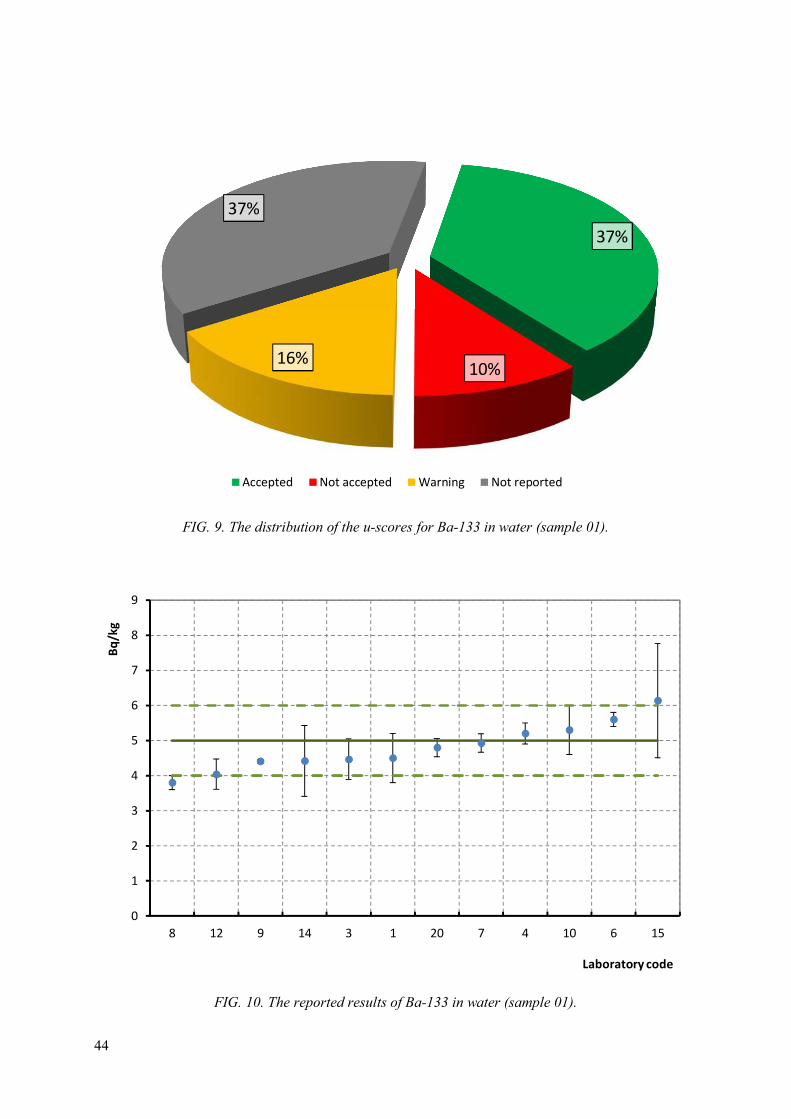
44
FIG. 9. The distribution of the u-scores for Ba-133 in water (sample 01).
FIG. 10. The reported results of Ba-133 in water (sample 01).
37%
10%16%
37%
Accepted Not accepted Warning Not reported
0
1
2
3
4
5
6
7
8
9
8 12 9 14 3 1 20 7 4 10 6 15
Bq
/kg
Laboratory code
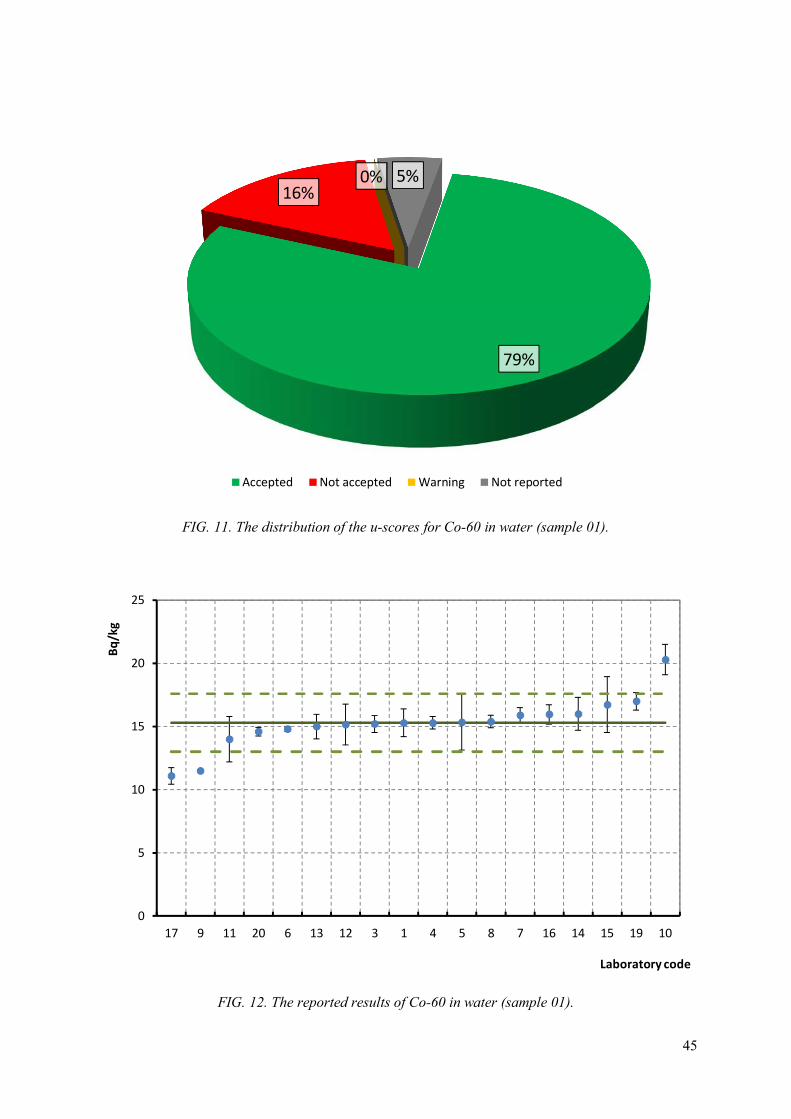
45
FIG. 11. The distribution of the u-scores for Co-60 in water (sample 01).
FIG. 12. The reported results of Co-60 in water (sample 01).
79%
16%0% 5%
Accepted Not accepted Warning Not reported
0
5
10
15
20
25
17 9 11 20 6 13 12 3 1 4 5 8 7 16 14 15 19 10
Bq
/kg
Laboratory code
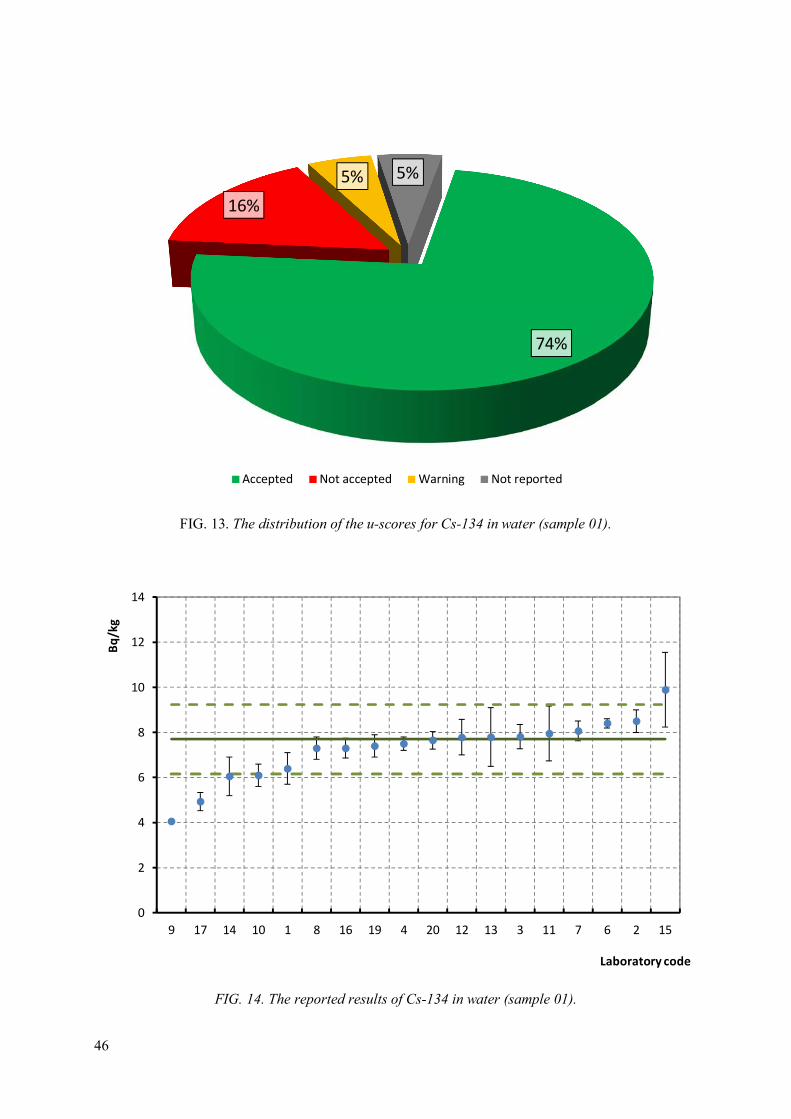
46
FIG. 13. The distribution of the u-scores for Cs-134 in water (sample 01).
FIG. 14. The reported results of Cs-134 in water (sample 01).
74%
16%
5% 5%
Accepted Not accepted Warning Not reported
0
2
4
6
8
10
12
14
9 17 14 10 1 8 16 19 4 20 12 13 3 11 7 6 2 15
Bq
/kg
Laboratory code
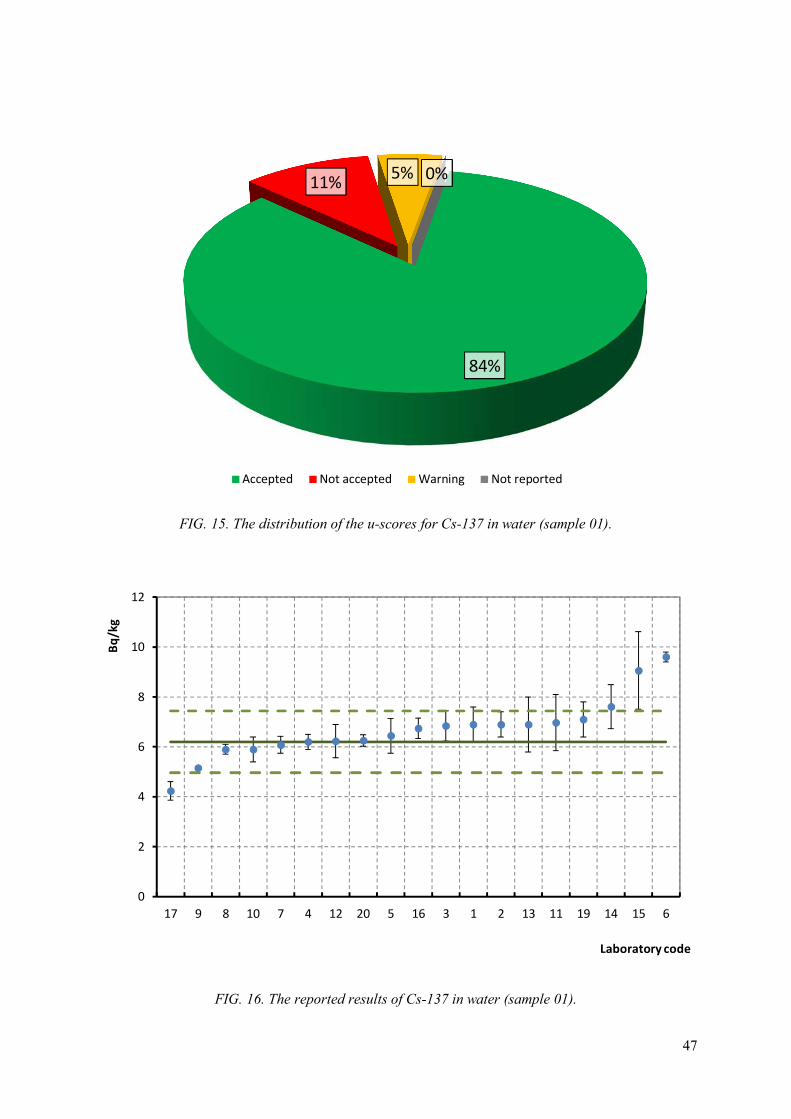
47
FIG. 15. The distribution of the u-scores for Cs-137 in water (sample 01).
FIG. 16. The reported results of Cs-137 in water (sample 01).
84%
11%5% 0%
Accepted Not accepted Warning Not reported
0
2
4
6
8
10
12
17 9 8 10 7 4 12 20 5 16 3 1 2 13 11 19 14 15 6
Bq
/kg
Laboratory code
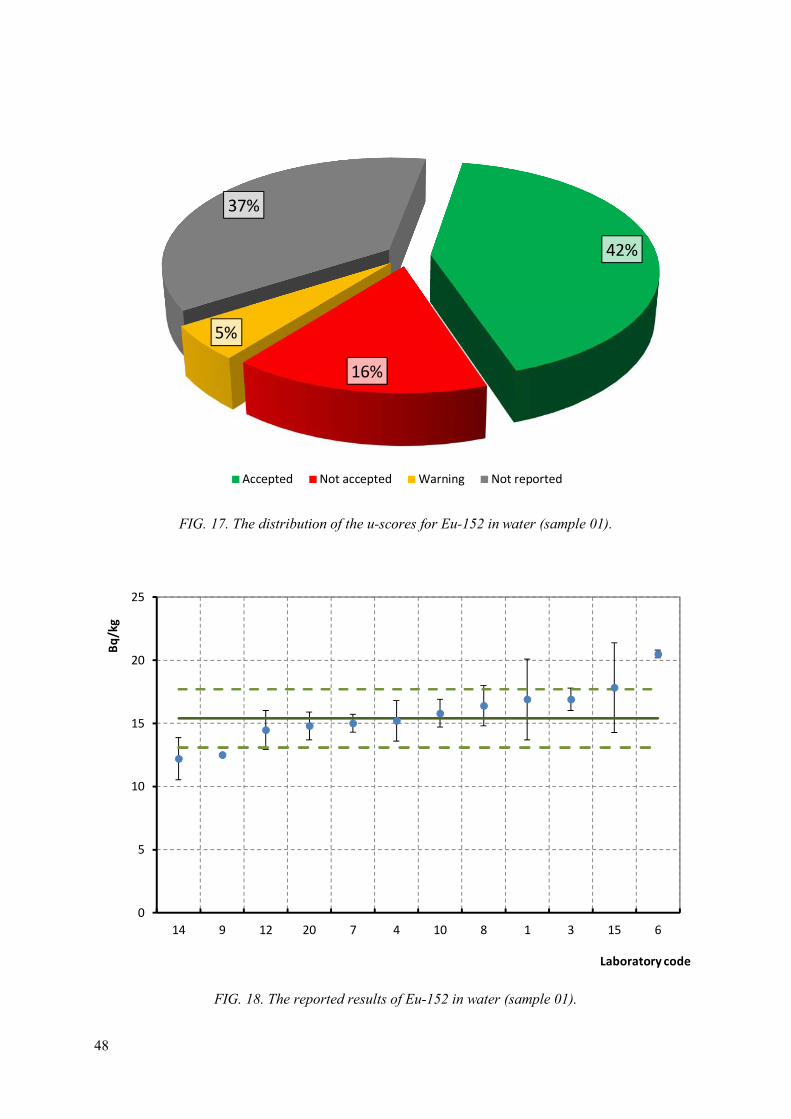
48
FIG. 17. The distribution of the u-scores for Eu-152 in water (sample 01).
FIG. 18. The reported results of Eu-152 in water (sample 01).
42%
16%
5%
37%
Accepted Not accepted Warning Not reported
0
5
10
15
20
25
14 9 12 20 7 4 10 8 1 3 15 6
Bq
/kg
Laboratory code
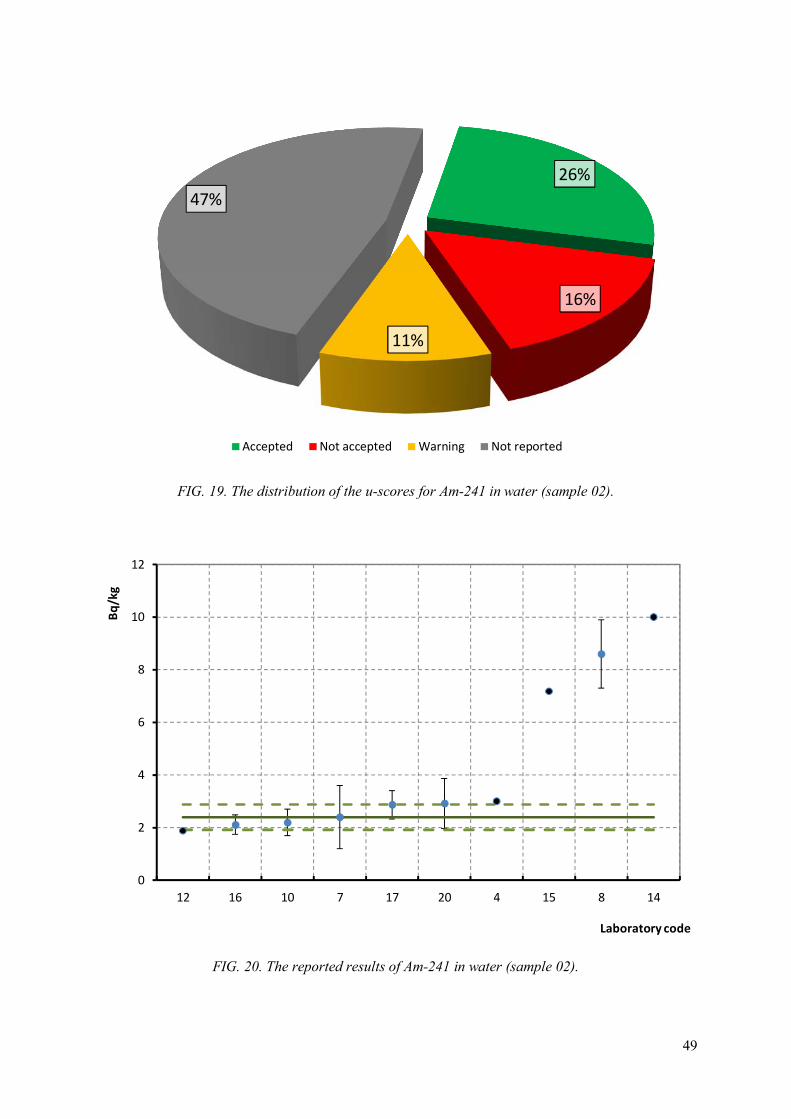
49
FIG. 19. The distribution of the u-scores for Am-241 in water (sample 02).
FIG. 20. The reported results of Am-241 in water (sample 02).
26%
16%
11%
47%
Accepted Not accepted Warning Not reported
0
2
4
6
8
10
12
12 16 10 7 17 20 4 15 8 14
Bq
/kg
Laboratory code
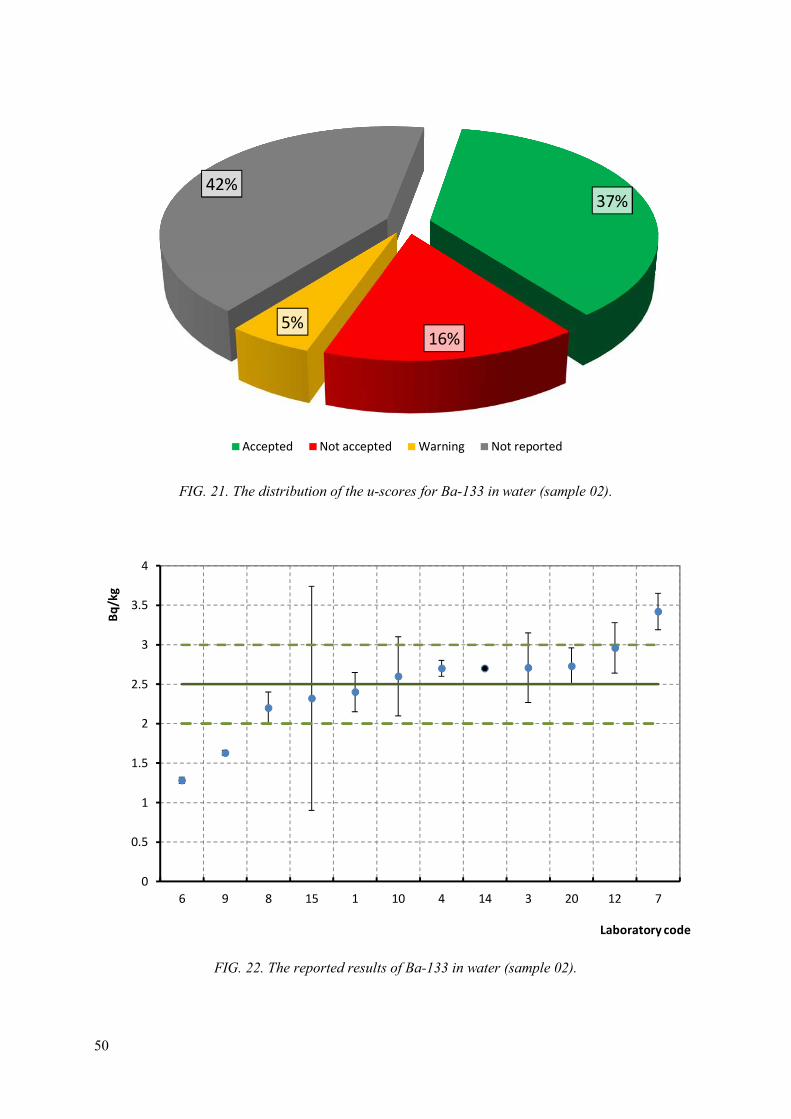
50
FIG. 21. The distribution of the u-scores for Ba-133 in water (sample 02).
FIG. 22. The reported results of Ba-133 in water (sample 02).
37%
16%5%
42%
Accepted Not accepted Warning Not reported
0
0.5
1
1.5
2
2.5
3
3.5
4
6 9 8 15 1 10 4 14 3 20 12 7
Bq
/kg
Laboratory code
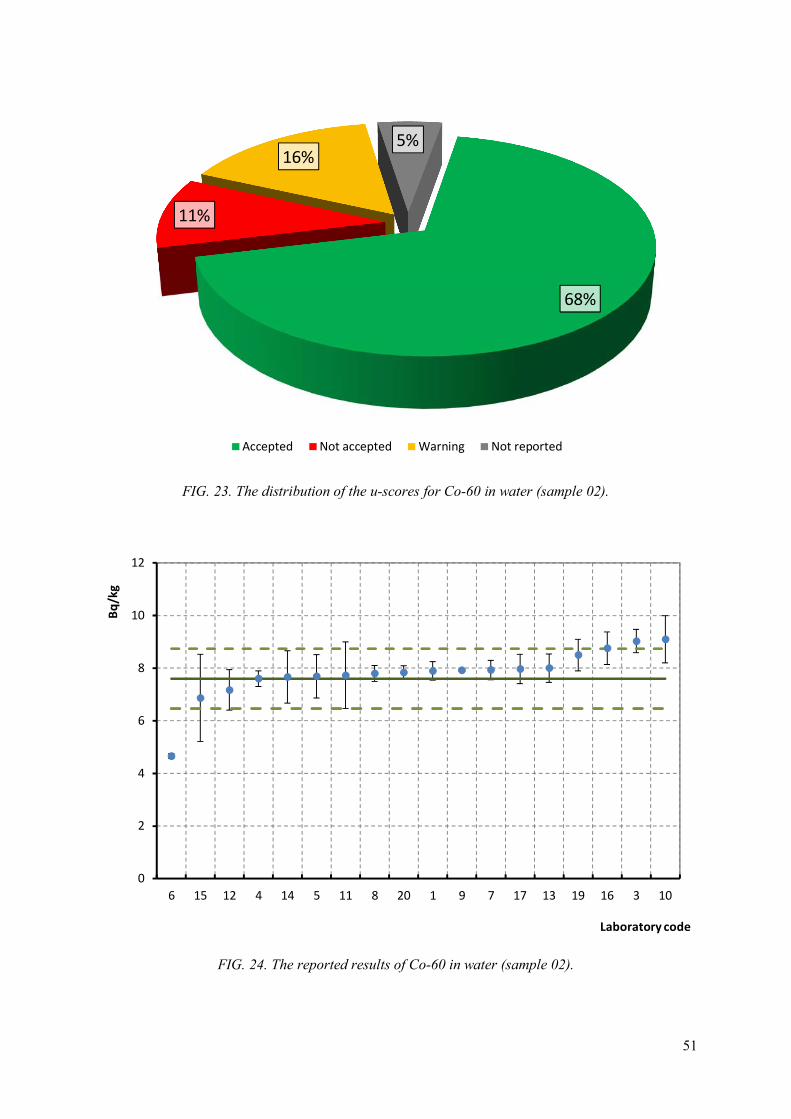
51
FIG. 23. The distribution of the u-scores for Co-60 in water (sample 02).
FIG. 24. The reported results of Co-60 in water (sample 02).
68%
11%
16%5%
Accepted Not accepted Warning Not reported
0
2
4
6
8
10
12
6 15 12 4 14 5 11 8 20 1 9 7 17 13 19 16 3 10
Bq
/kg
Laboratory code
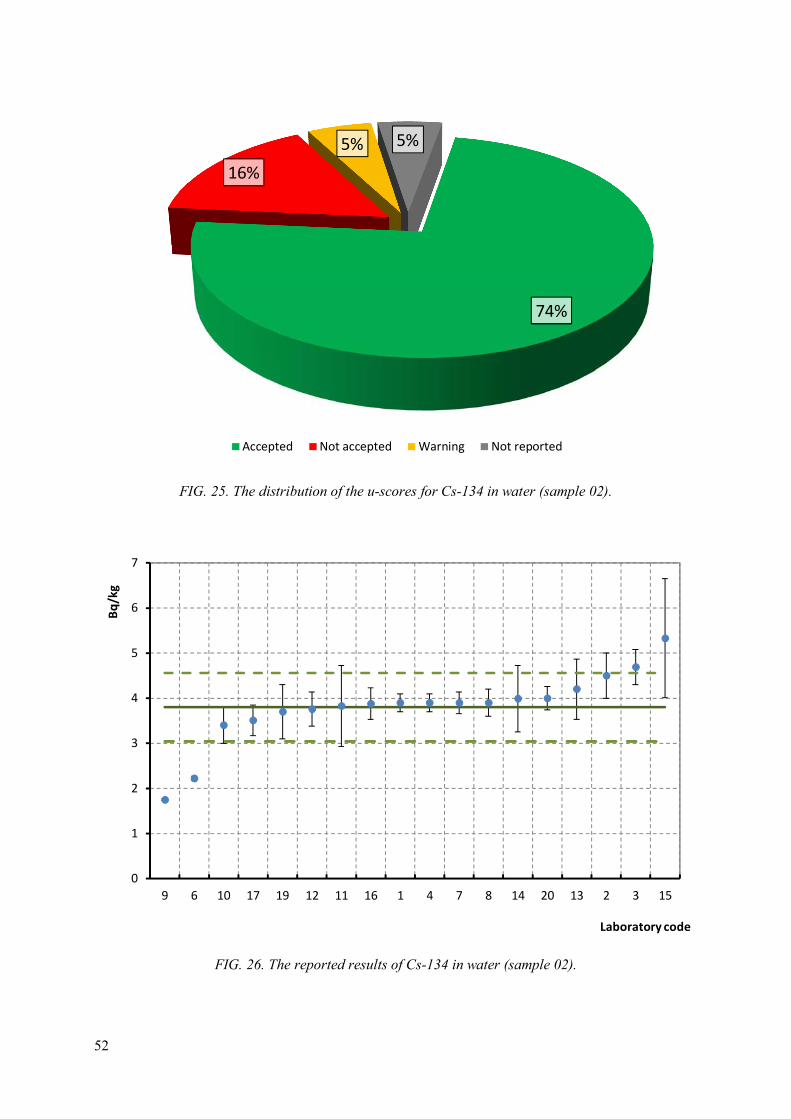
52
FIG. 25. The distribution of the u-scores for Cs-134 in water (sample 02).
FIG. 26. The reported results of Cs-134 in water (sample 02).
74%
16%
5% 5%
Accepted Not accepted Warning Not reported
0
1
2
3
4
5
6
7
9 6 10 17 19 12 11 16 1 4 7 8 14 20 13 2 3 15
Bq
/kg
Laboratory code
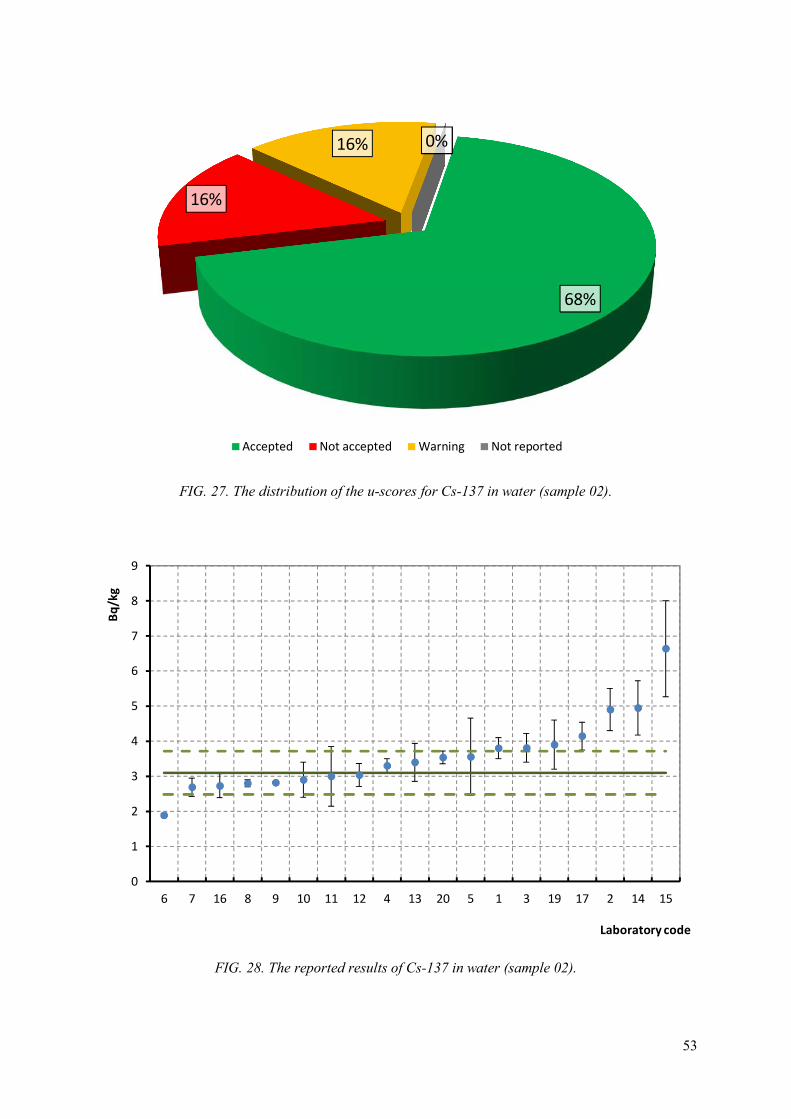
53
FIG. 27. The distribution of the u-scores for Cs-137 in water (sample 02).
FIG. 28. The reported results of Cs-137 in water (sample 02).
68%
16%
16% 0%
Accepted Not accepted Warning Not reported
0
1
2
3
4
5
6
7
8
9
6 7 16 8 9 10 11 12 4 13 20 5 1 3 19 17 2 14 15
Bq
/kg
Laboratory code
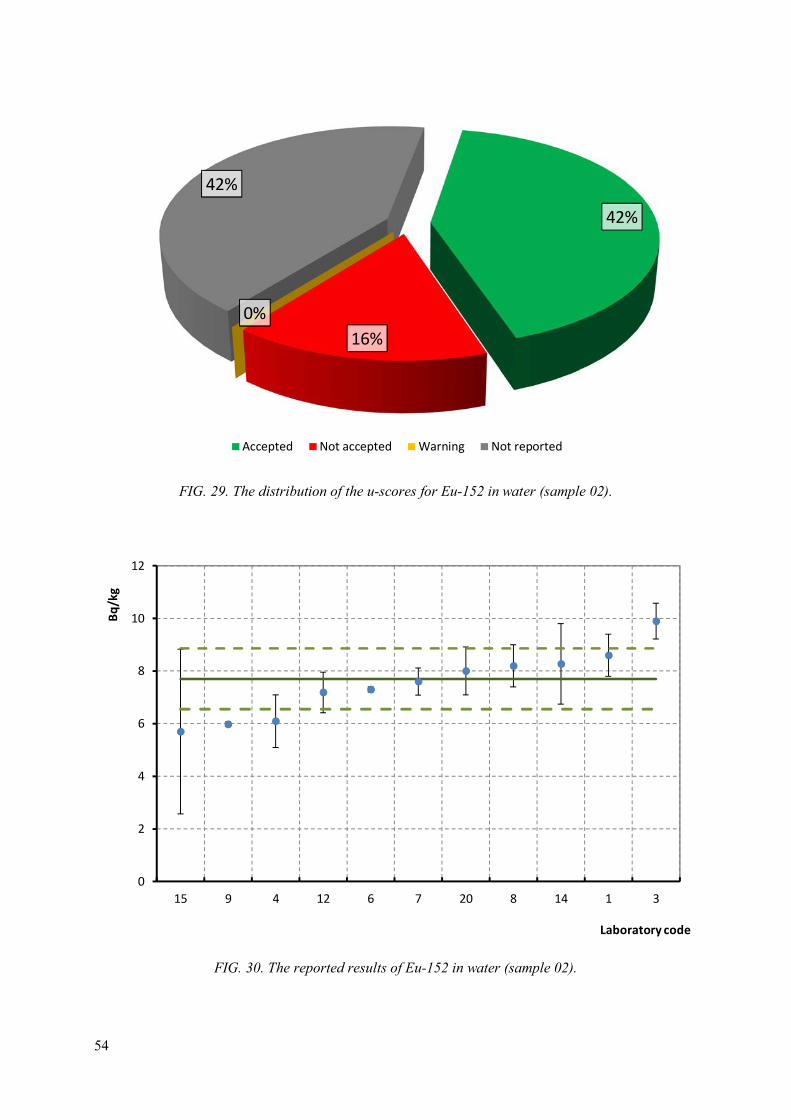
54
FIG. 29. The distribution of the u-scores for Eu-152 in water (sample 02).
FIG. 30. The reported results of Eu-152 in water (sample 02).
42%
16%
0%
42%
Accepted Not accepted Warning Not reported
0
2
4
6
8
10
12
15 9 4 12 6 7 20 8 14 1 3
Bq
/kg
Laboratory code

55
FIG. 31. The distribution of the u-scores for Am-241 in water (sample 03).
FIG. 32. The reported results of Am-241 in water (sample 03).
21%
21%
11%
47%
Accepted Not accepted Warning Not reported
0
2
4
6
8
10
12
12 10 7 16 20 4 14 17 15 8
Bq
/kg
Laboratory code
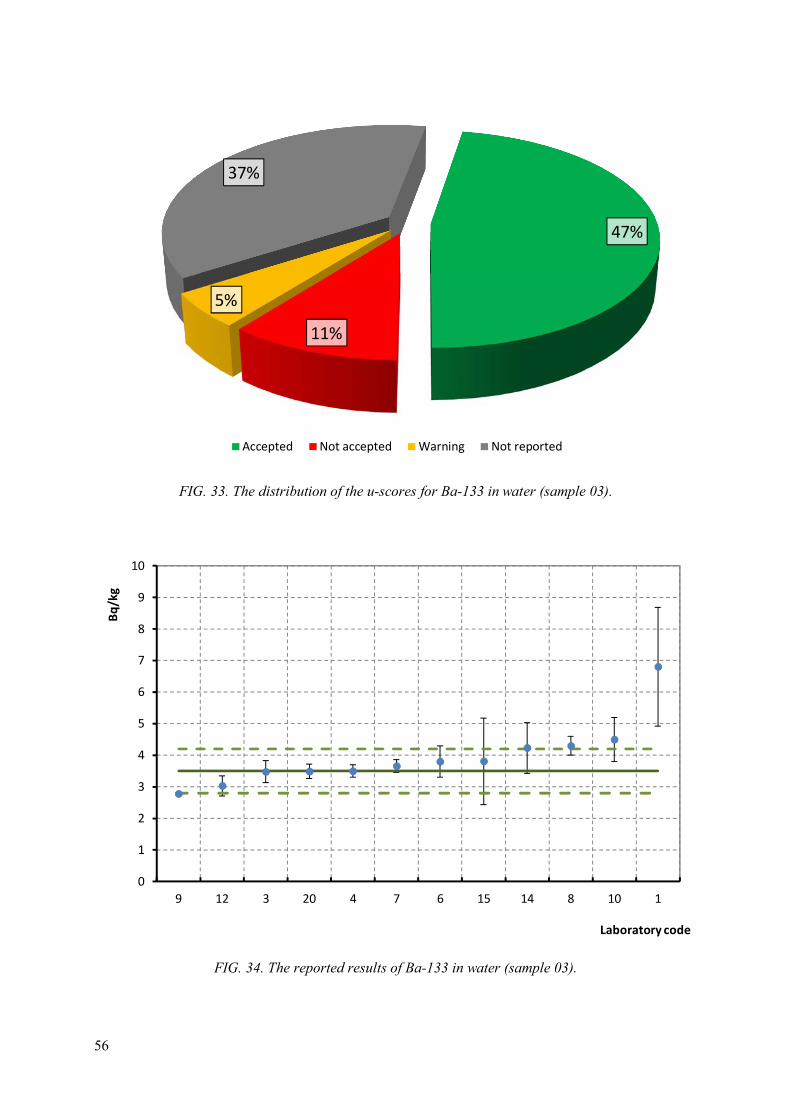
56
FIG. 33. The distribution of the u-scores for Ba-133 in water (sample 03).
FIG. 34. The reported results of Ba-133 in water (sample 03).
47%
11%
5%
37%
Accepted Not accepted Warning Not reported
0
1
2
3
4
5
6
7
8
9
10
9 12 3 20 4 7 6 15 14 8 10 1
Bq
/kg
Laboratory code

57
FIG. 35. The distribution of the u-scores for Co-60 in water (sample 03).
FIG. 36. The reported results of Co-60 in water (sample 03).
69%
10%
10%
11%
Accepted Not accepted Warning Not reported
0
2
4
6
8
10
12
14
16
18
20
9 14 12 20 1 7 11 4 8 13 3 5 16 6 15 10 17
Bq
/kg
Laboratory code
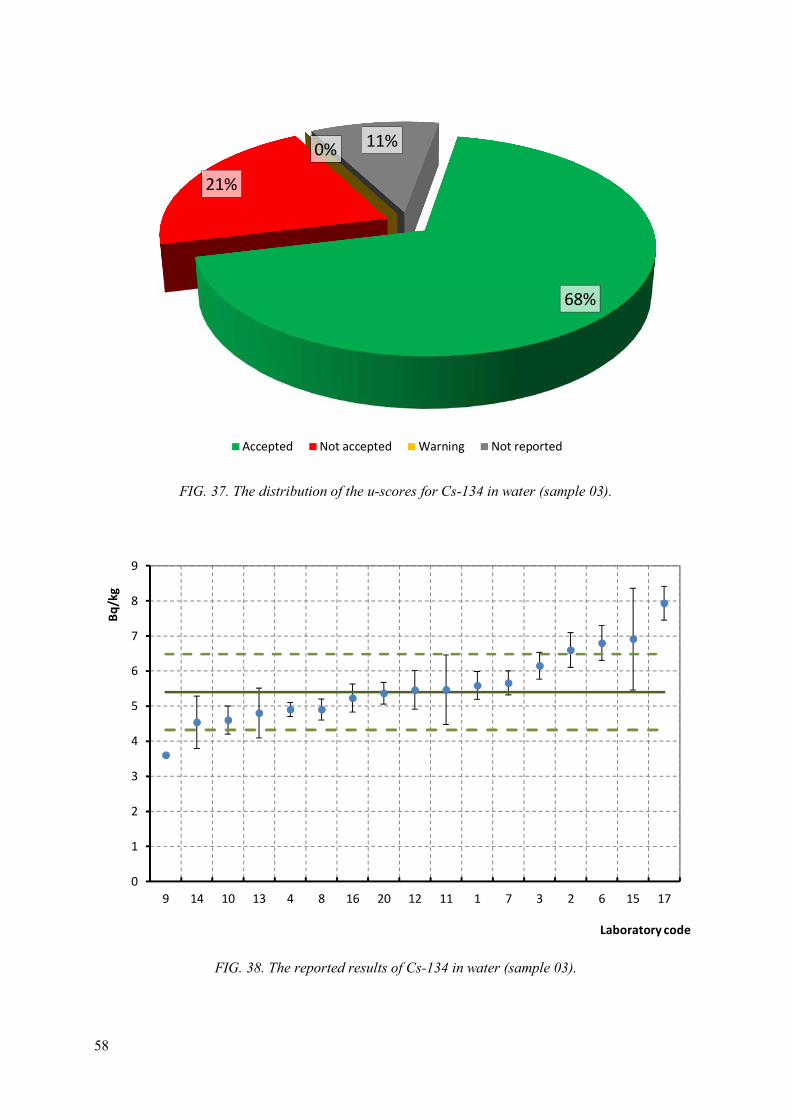
58
FIG. 37. The distribution of the u-scores for Cs-134 in water (sample 03).
FIG. 38. The reported results of Cs-134 in water (sample 03).
68%
21%
0%11%
Accepted Not accepted Warning Not reported
0
1
2
3
4
5
6
7
8
9
9 14 10 13 4 8 16 20 12 11 1 7 3 2 6 15 17
Bq
/kg
Laboratory code
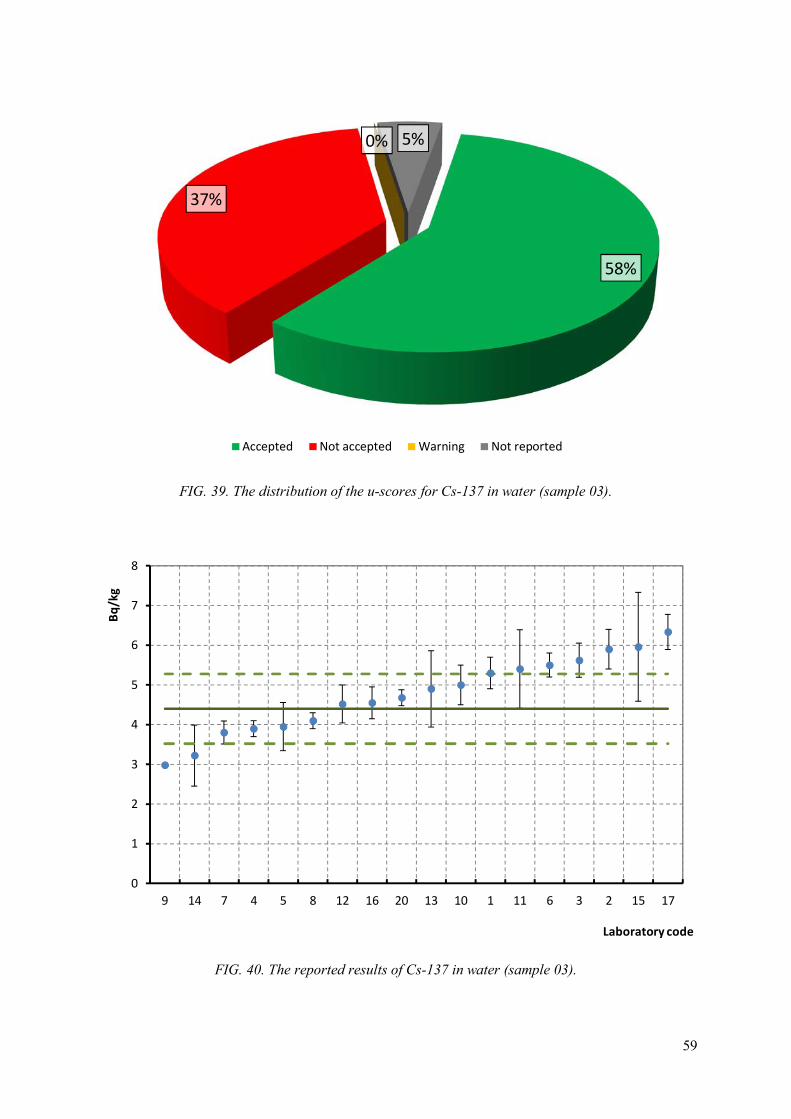
59
FIG. 39. The distribution of the u-scores for Cs-137 in water (sample 03).
FIG. 40. The reported results of Cs-137 in water (sample 03).
58%
37%
0% 5%
Accepted Not accepted Warning Not reported
0
1
2
3
4
5
6
7
8
9 14 7 4 5 8 12 16 20 13 10 1 11 6 3 2 15 17
Bq
/kg
Laboratory code
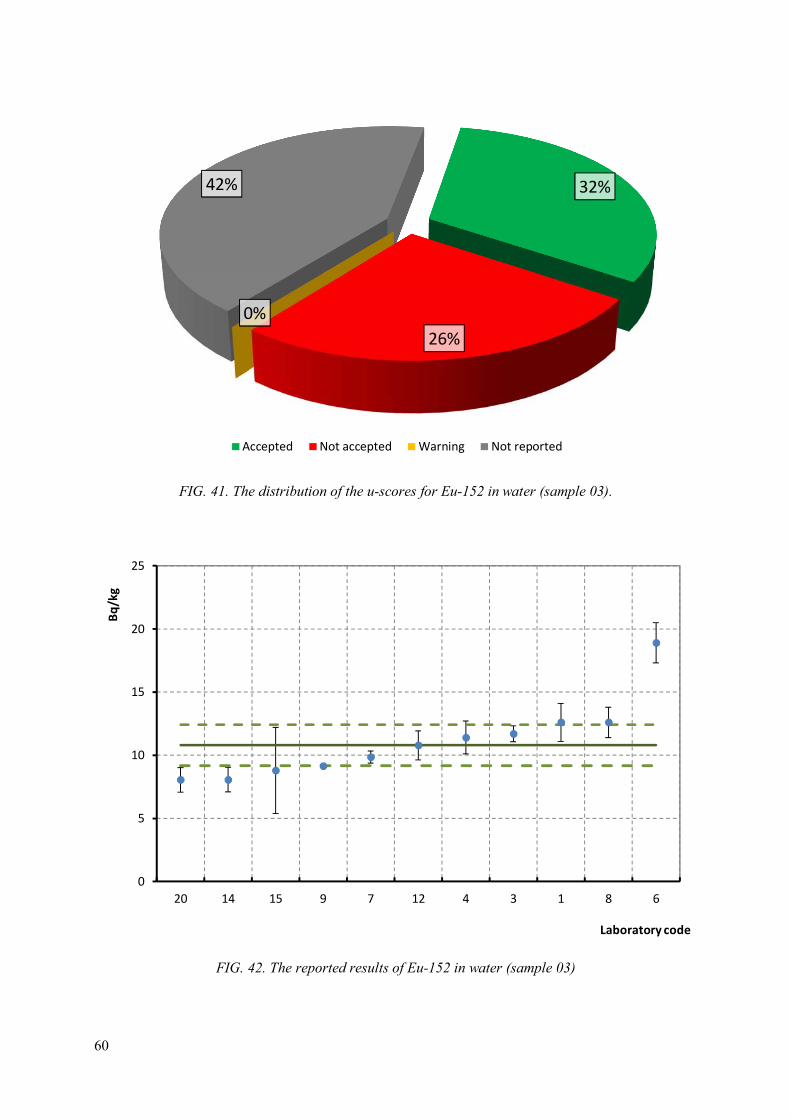
60
FIG. 41. The distribution of the u-scores for Eu-152 in water (sample 03).
FIG. 42. The reported results of Eu-152 in water (sample 03)
32%
26%
0%
42%
Accepted Not accepted Warning Not reported
0
5
10
15
20
25
20 14 15 9 7 12 4 3 1 8 6
Bq
/kg
Laboratory code
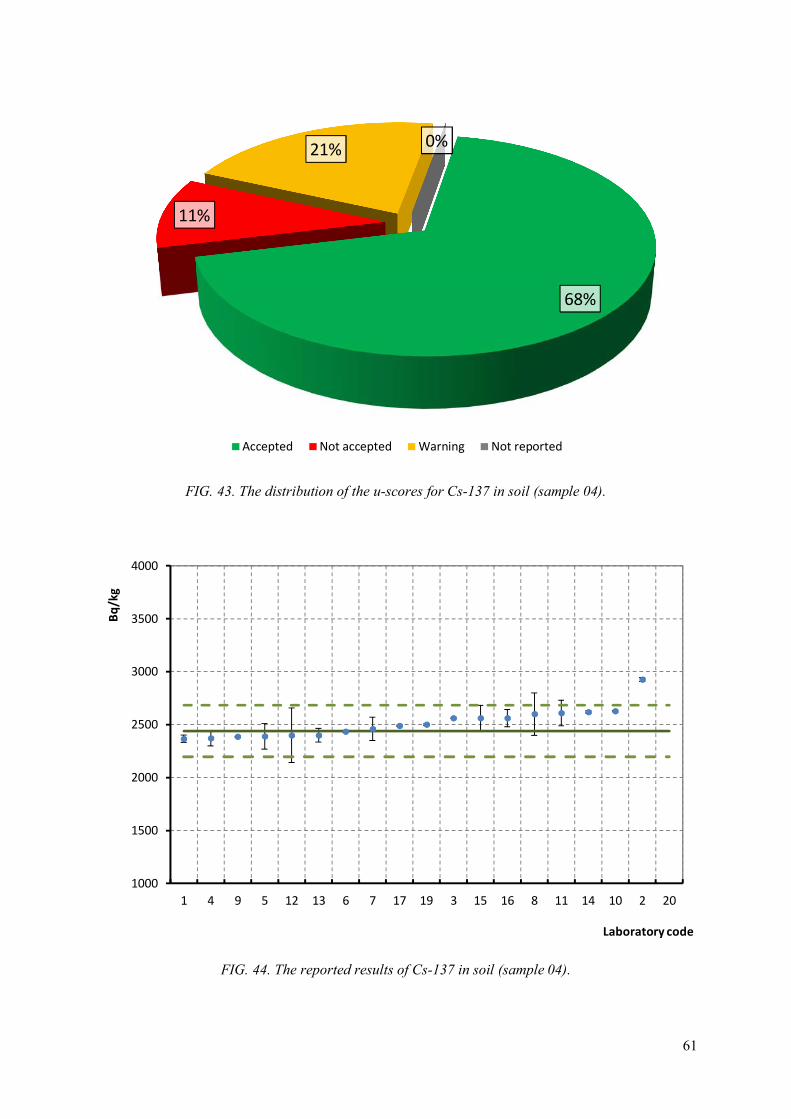
61
FIG. 43. The distribution of the u-scores for Cs-137 in soil (sample 04).
FIG. 44. The reported results of Cs-137 in soil (sample 04).
68%
11%
21%0%
Accepted Not accepted Warning Not reported
1000
1500
2000
2500
3000
3500
4000
1 4 9 5 12 13 6 7 17 19 3 15 16 8 11 14 10 2 20
Bq
/kg
Laboratory code
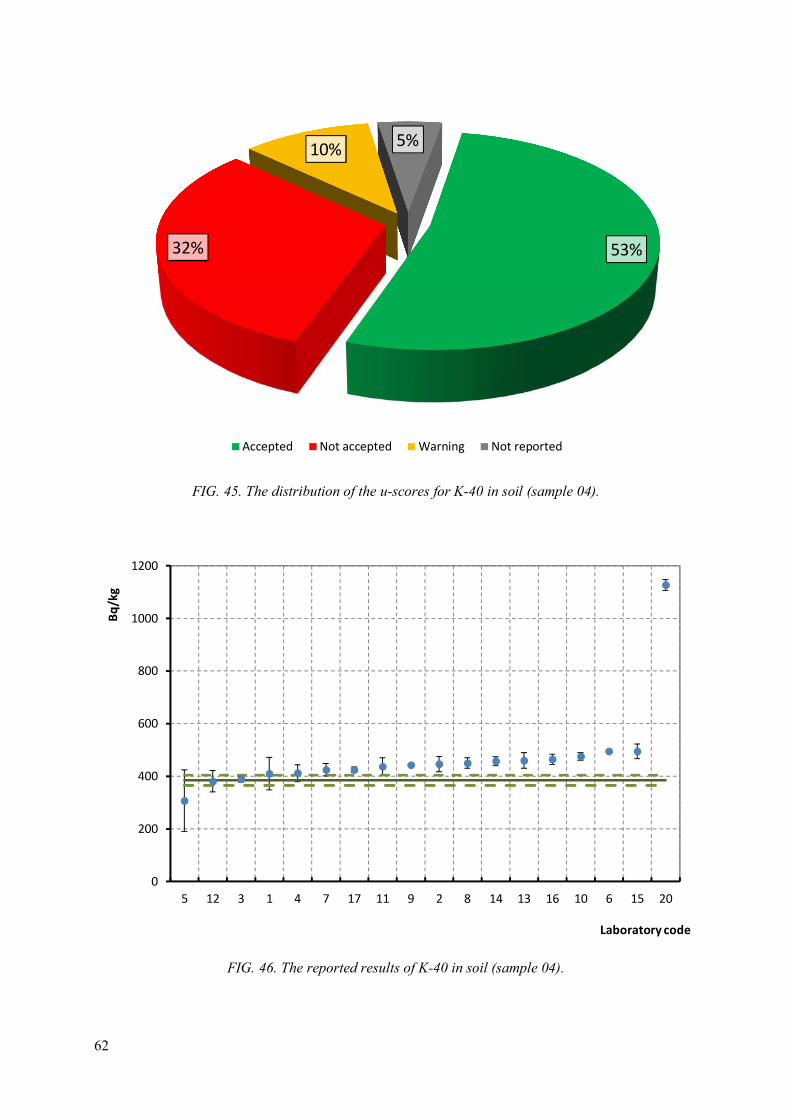
62
FIG. 45. The distribution of the u-scores for K-40 in soil (sample 04).
FIG. 46. The reported results of K-40 in soil (sample 04).
53%32%
10%5%
Accepted Not accepted Warning Not reported
0
200
400
600
800
1000
1200
5 12 3 1 4 7 17 11 9 2 8 14 13 16 10 6 15 20
Bq
/kg
Laboratory code
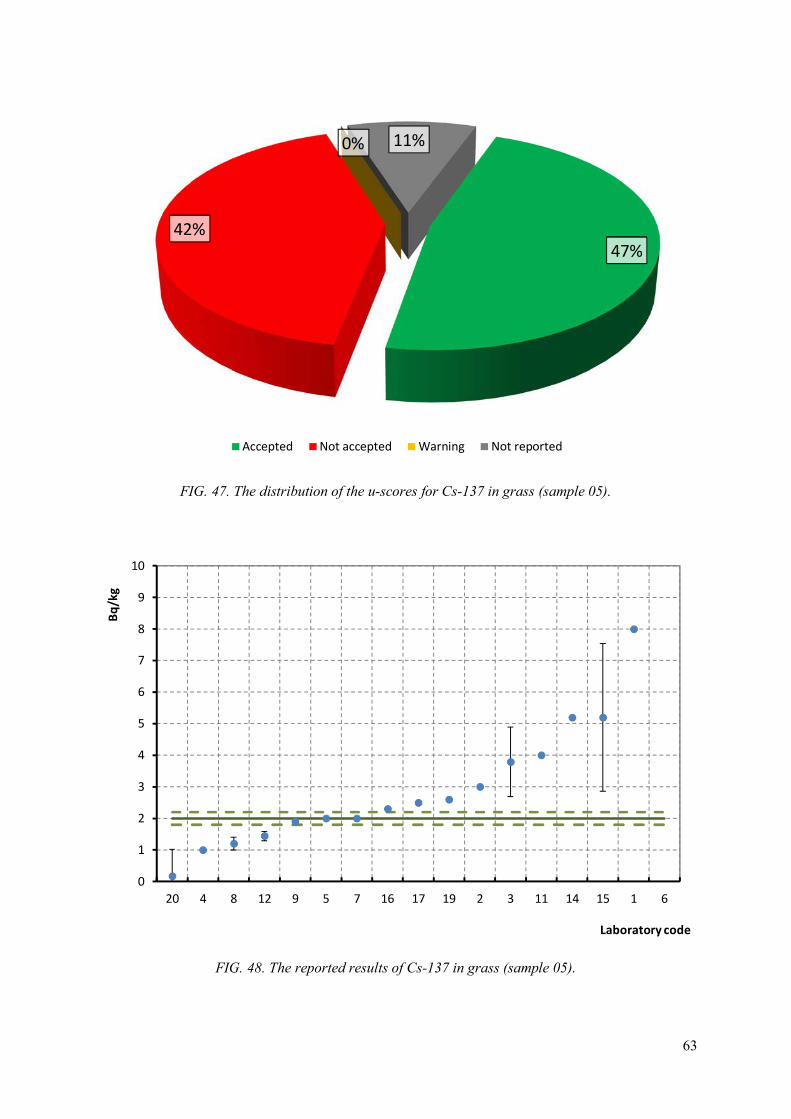
63
FIG. 47. The distribution of the u-scores for Cs-137 in grass (sample 05).
FIG. 48. The reported results of Cs-137 in grass (sample 05).
47%
42%
0% 11%
Accepted Not accepted Warning Not reported
0
1
2
3
4
5
6
7
8
9
10
20 4 8 12 9 5 7 16 17 19 2 3 11 14 15 1 6
Bq
/kg
Laboratory code
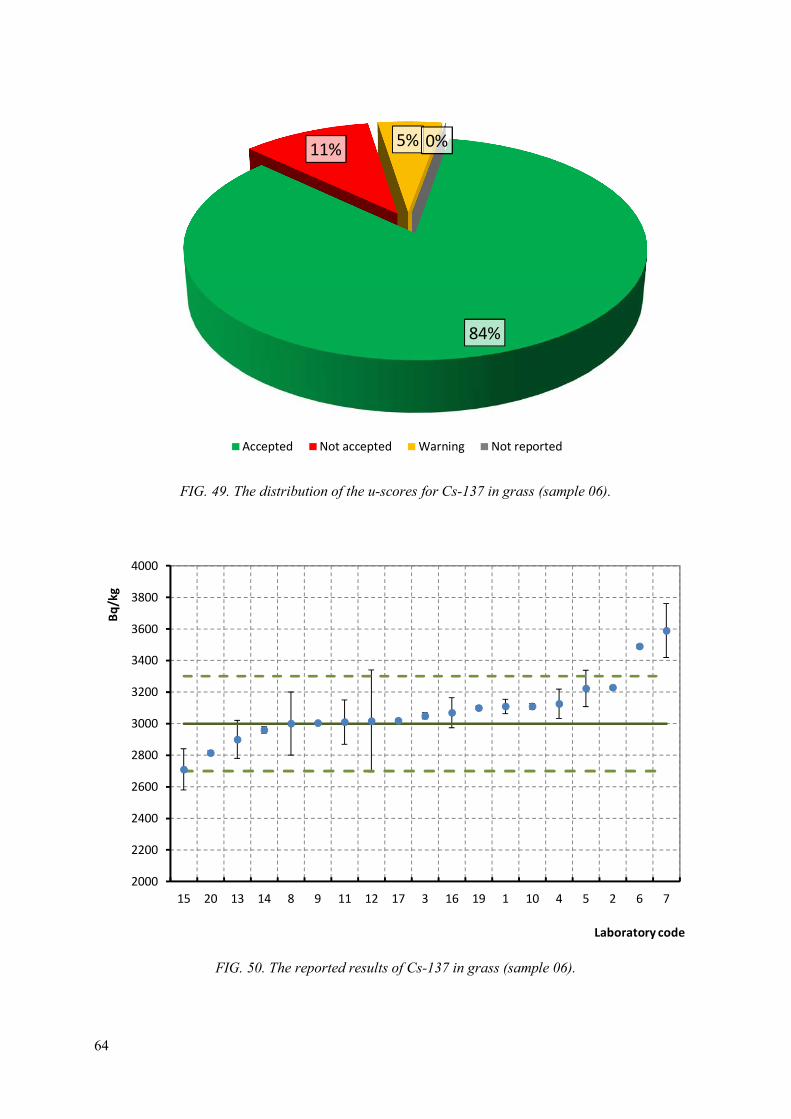
64
FIG. 49. The distribution of the u-scores for Cs-137 in grass (sample 06).
FIG. 50. The reported results of Cs-137 in grass (sample 06).
84%
11%5% 0%
Accepted Not accepted Warning Not reported
2000
2200
2400
2600
2800
3000
3200
3400
3600
3800
4000
15 20 13 14 8 9 11 12 17 3 16 19 1 10 4 5 2 6 7
Bq
/kg
Laboratory code
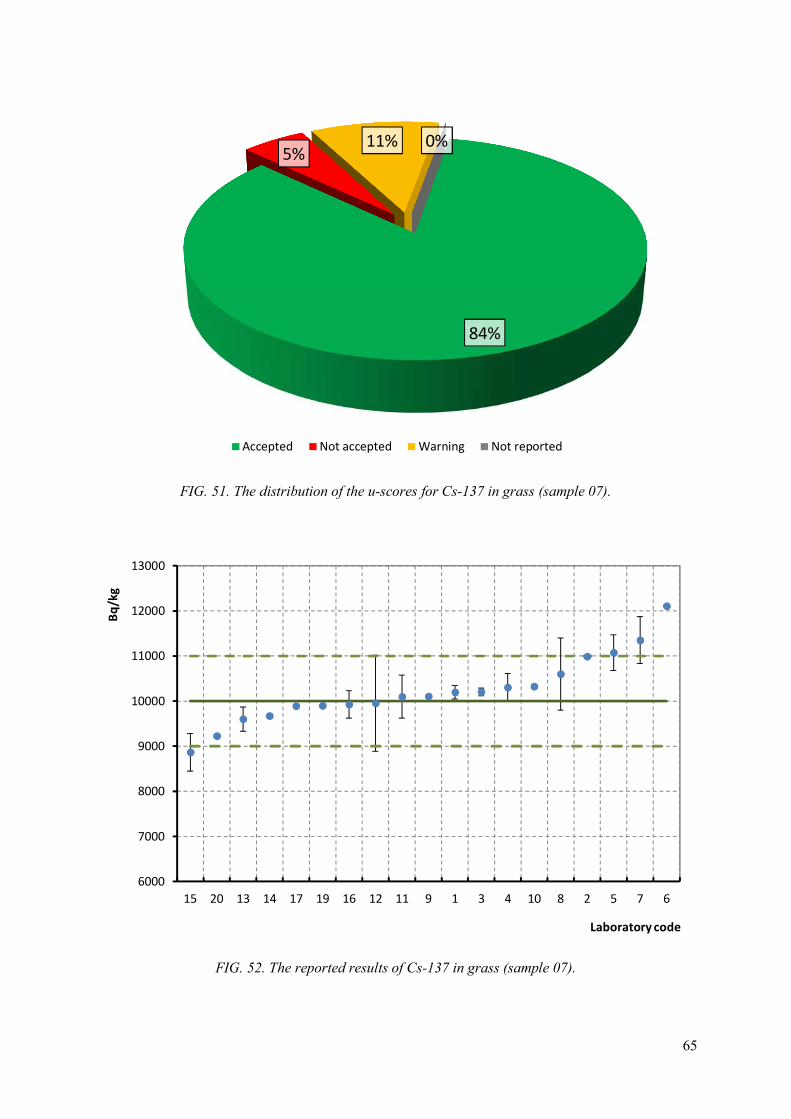
65
FIG. 51. The distribution of the u-scores for Cs-137 in grass (sample 07).
FIG. 52. The reported results of Cs-137 in grass (sample 07).
84%
5%11% 0%
Accepted Not accepted Warning Not reported
6000
7000
8000
9000
10000
11000
12000
13000
15 20 13 14 17 19 16 12 11 9 1 3 4 10 8 2 5 7 6
Bq
/kg
Laboratory code
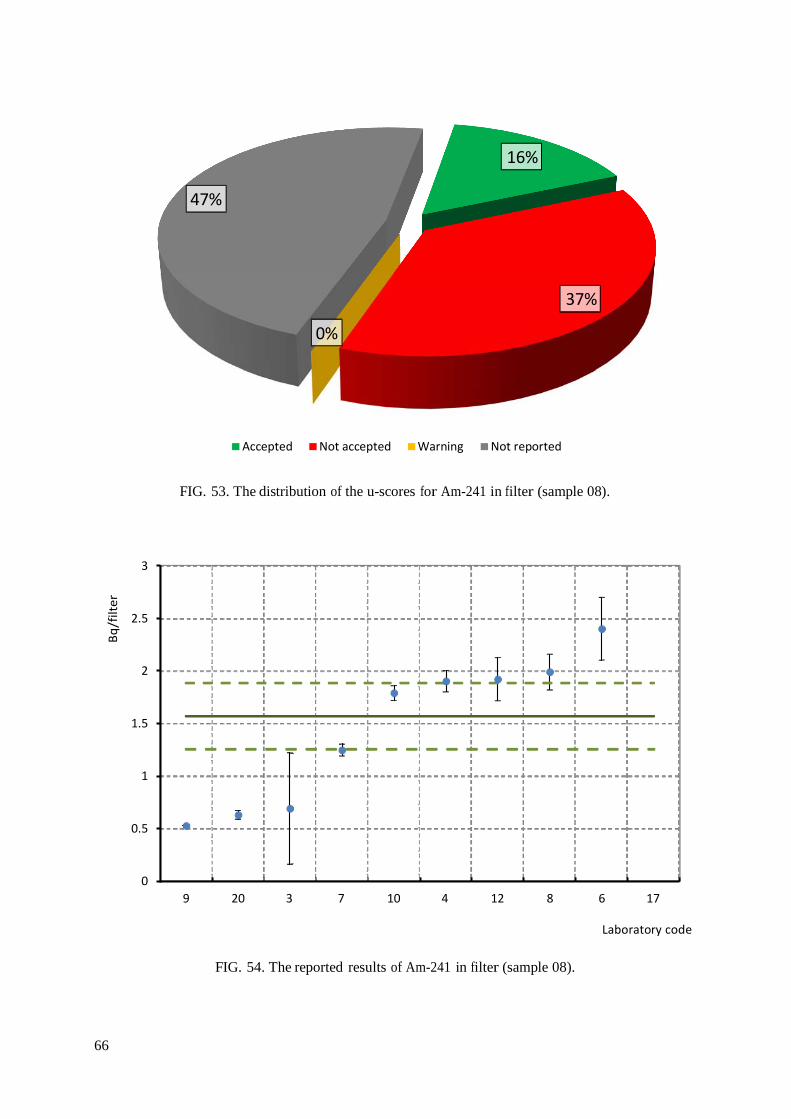
66
Bq/
filte
r
16%
47%
37%
0%
Accepted Not accepted Warning Not reported
FIG. 53. The distribution of the u-scores for Am-241 in filter (sample 08).
3
2.5
2
1.5
1
0.5
0 9 20 3 7 10 4 12 8 6 17
Laboratory code
FIG. 54. The reported results of Am-241 in filter (sample 08).
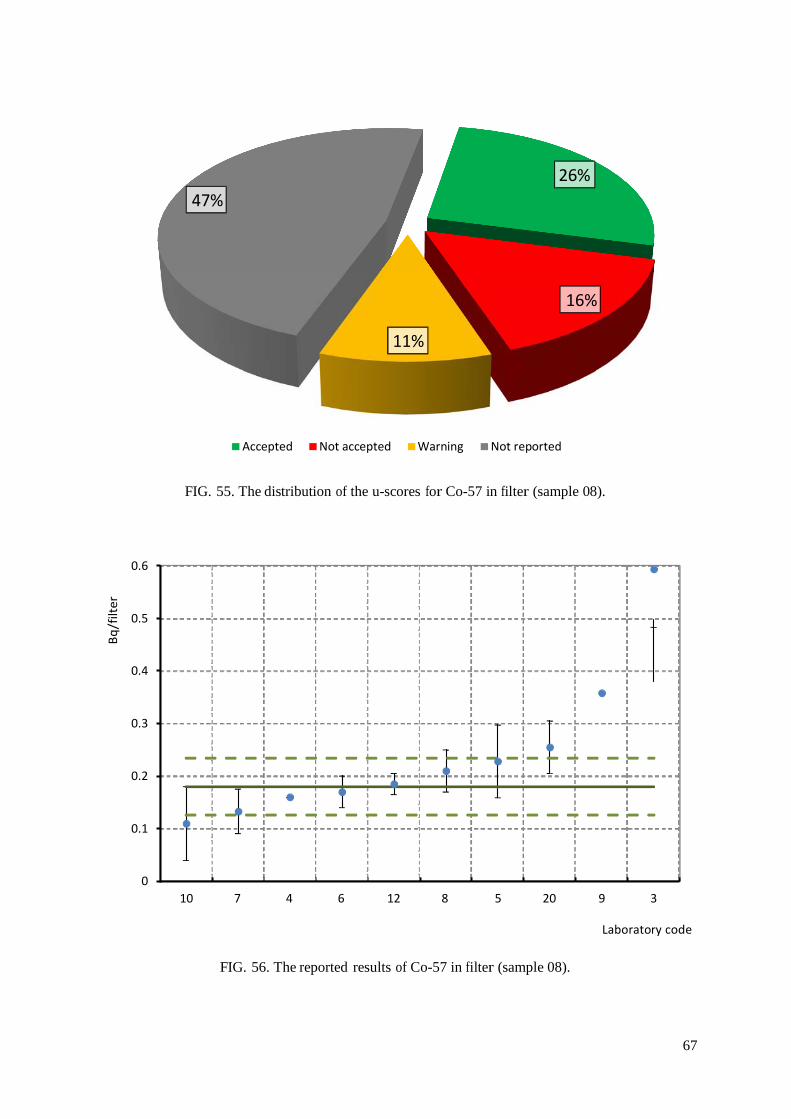
67
Bq/
filte
r
47% 26%
16%
11%
Accepted Not accepted Warning Not reported
FIG. 55. The distribution of the u-scores for Co-57 in filter (sample 08).
0.6
0.5
0.4
0.3
0.2
0.1
0 10 7 4 6 12 8 5 20 9 3
Laboratory code
FIG. 56. The reported results of Co-57 in filter (sample 08).
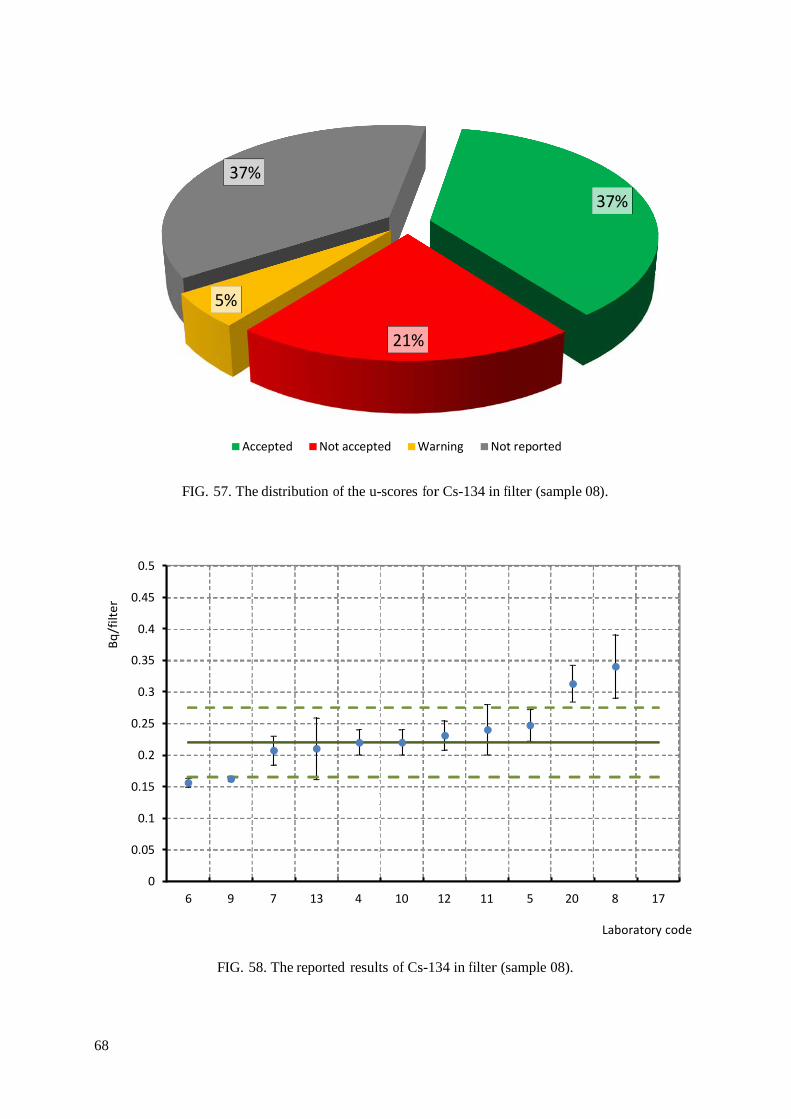
68
Bq/f
ilter
37% 37%
5%
21%
Accepted Not accepted Warning Not reported
FIG. 57. The distribution of the u-scores for Cs-134 in filter (sample 08).
0.5
0.45
0.4
0.35
0.3
0.25
0.2
0.15
0.1
0.05
0 6 9 7 13 4 10 12 11 5 20 8 17
Laboratory code
FIG. 58. The reported results of Cs-134 in filter (sample 08).
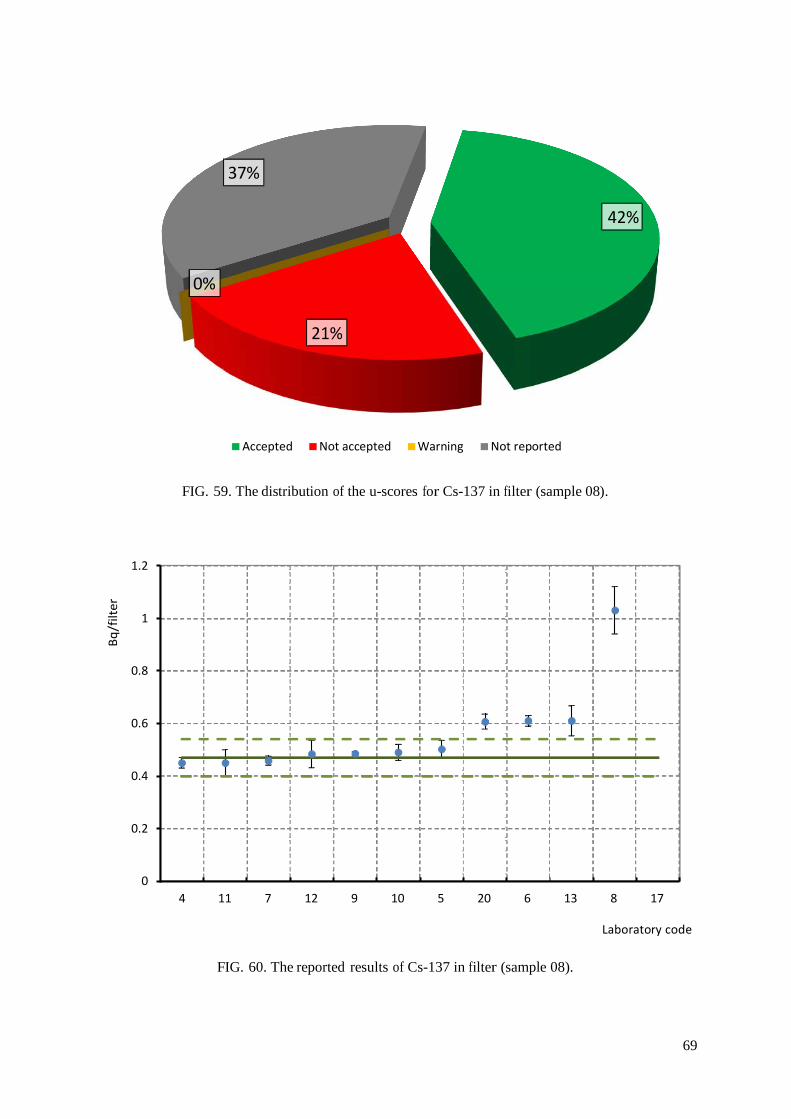
69
Bq/f
ilter
37%
42%
0%
21%
Accepted Not accepted Warning Not reported
FIG. 59. The distribution of the u-scores for Cs-137 in filter (sample 08).
1.2
1
0.8
0.6
0.4
0.2
0 4 11 7 12 9 10 5 20 6 13 8 17
Laboratory code
FIG. 60. The reported results of Cs-137 in filter (sample 08).
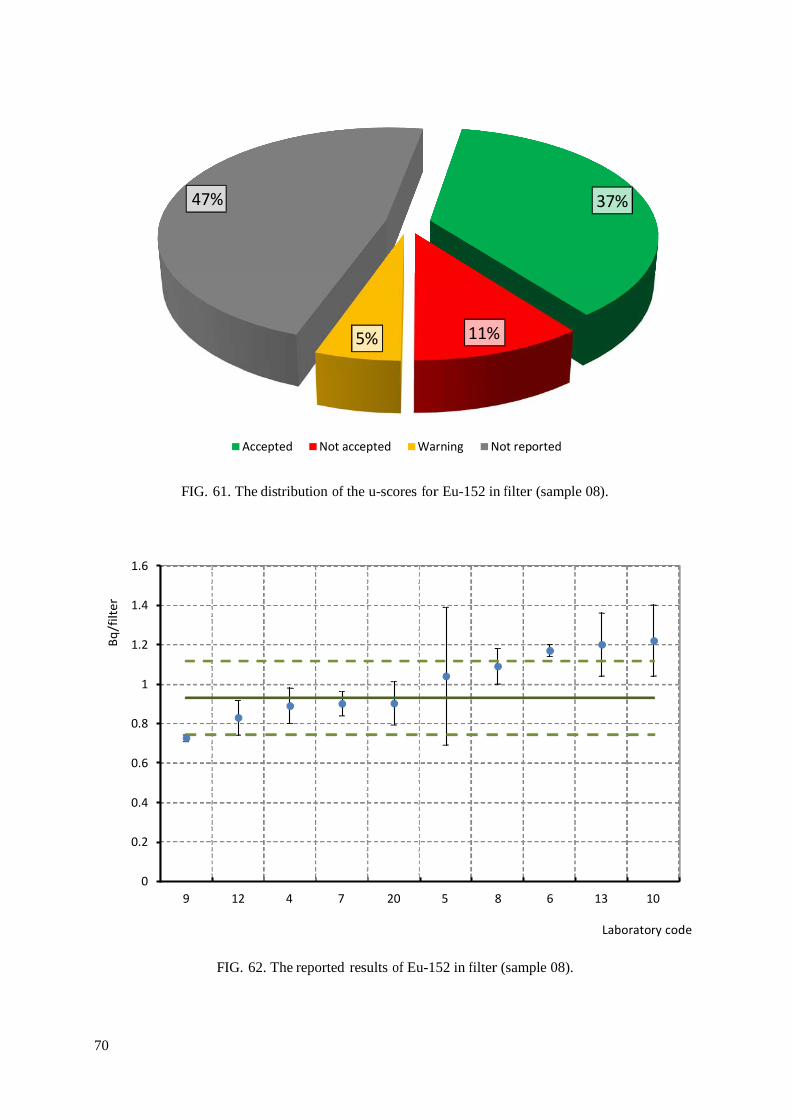
70
Bq/f
ilter
47% 37%
5% 11%
Accepted Not accepted Warning Not reported
FIG. 61. The distribution of the u-scores for Eu-152 in filter (sample 08).
1.6
1.4
1.2
1
0.8
0.6
0.4
0.2
0 9 12 4 7 20 5 8 6 13 10
Laboratory code
FIG. 62. The reported results of Eu-152 in filter (sample 08).
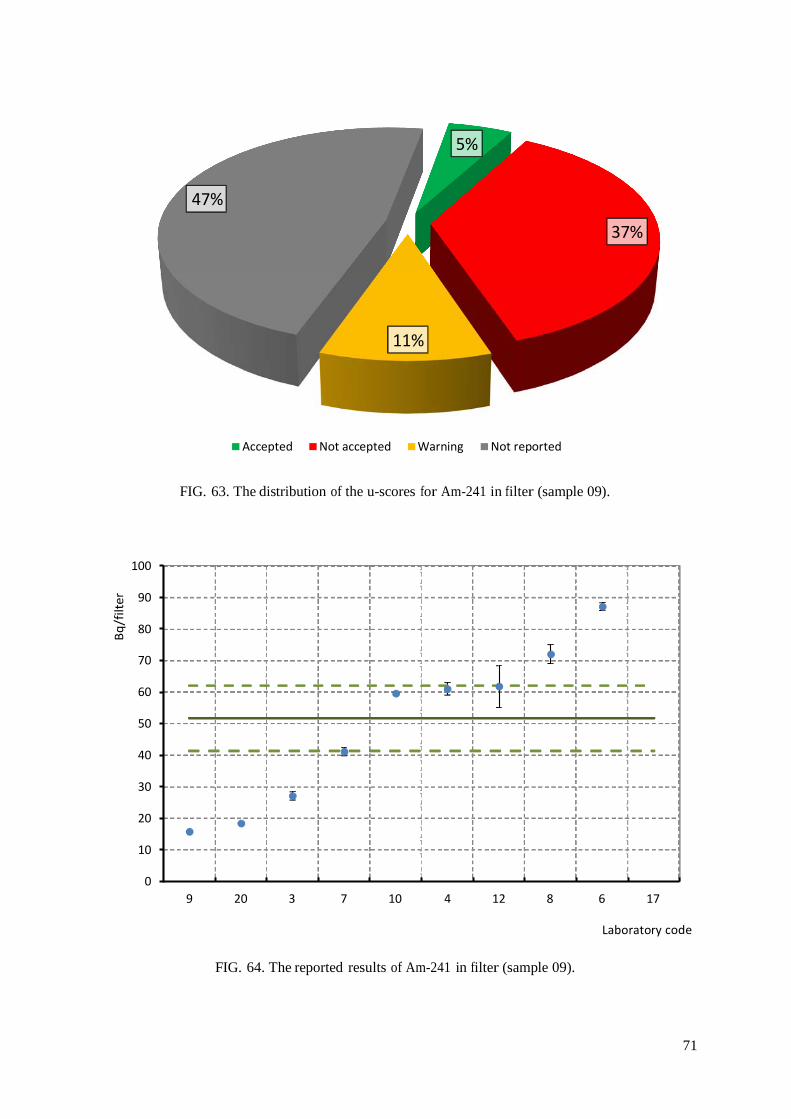
71
Bq/
filte
r
5%
47% 37%
11%
Accepted Not accepted Warning Not reported
FIG. 63. The distribution of the u-scores for Am-241 in filter (sample 09).
100
90
80
70
60
50
40
30
20
10
0 9 20 3 7 10 4 12 8 6 17
Laboratory code
FIG. 64. The reported results of Am-241 in filter (sample 09).

72
Bq/f
ilter
53% 37%
0% 10%
Accepted Not accepted Warning Not reported
FIG. 65. The distribution of the u-scores for Co-57 in filter (sample 09).
6
5
4
3
2
1
0 10 8 12 20 7 4 6 3 9
Laboratory code
FIG. 66. The reported results of Co-57 in filter (sample 09).
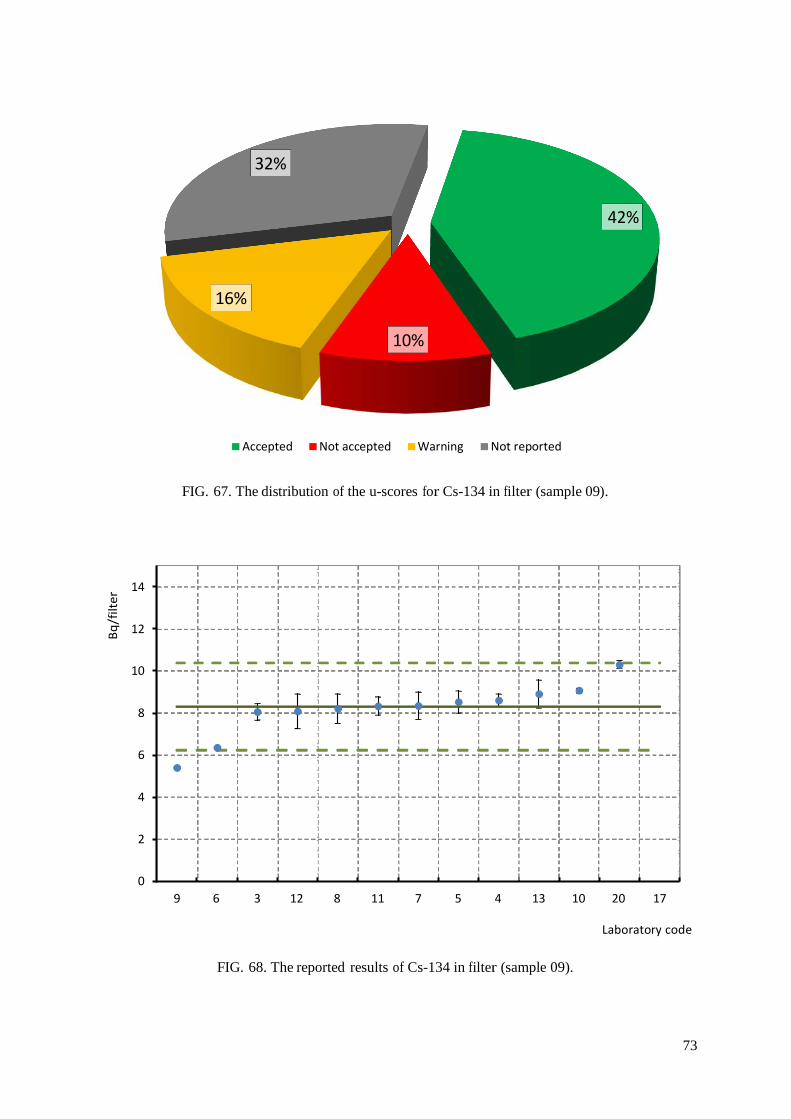
73
Bq/
filte
r
32%
42%
16%
10%
Accepted Not accepted Warning Not reported
FIG. 67. The distribution of the u-scores for Cs-134 in filter (sample 09).
14
12
10
8
6
4
2
0 9 6 3 12 8 11 7 5 4 13 10 20 17
Laboratory code
FIG. 68. The reported results of Cs-134 in filter (sample 09).
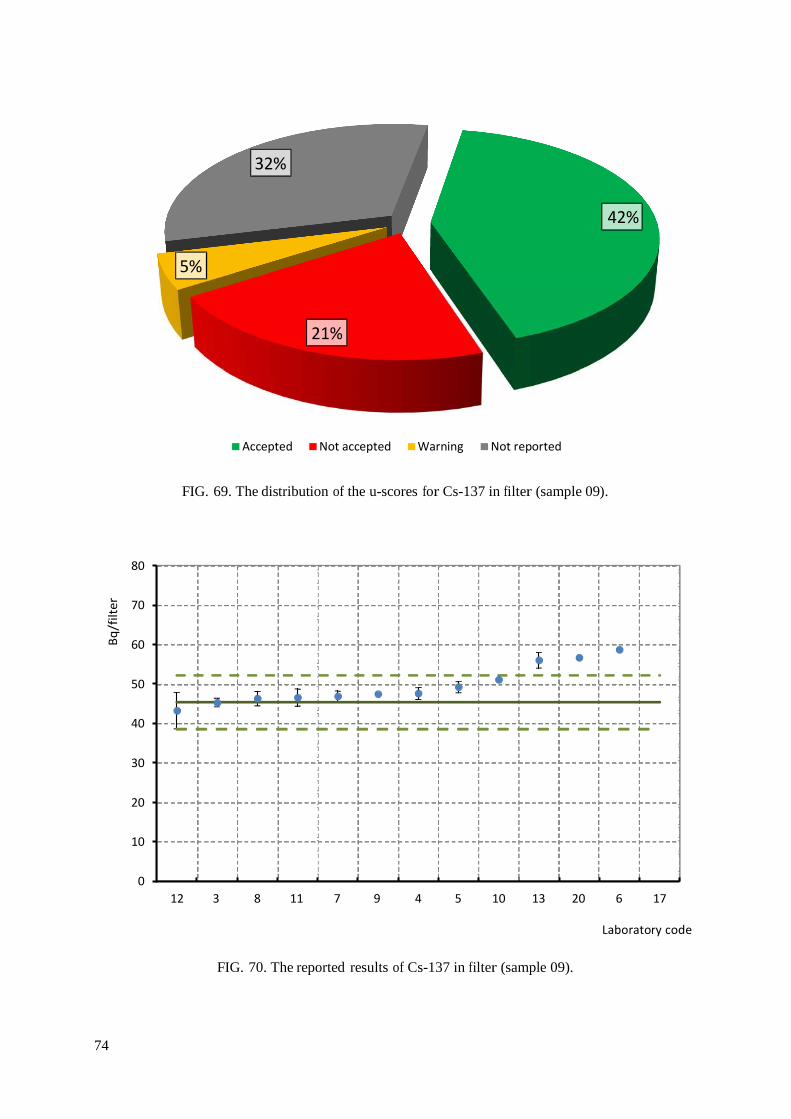
74
Bq/f
ilter
32%
42%
5%
21%
Accepted Not accepted Warning Not reported
FIG. 69. The distribution of the u-scores for Cs-137 in filter (sample 09).
80
70
60
50
40
30
20
10
0 12 3 8 11 7 9 4 5 10 13 20 6 17
Laboratory code
FIG. 70. The reported results of Cs-137 in filter (sample 09).
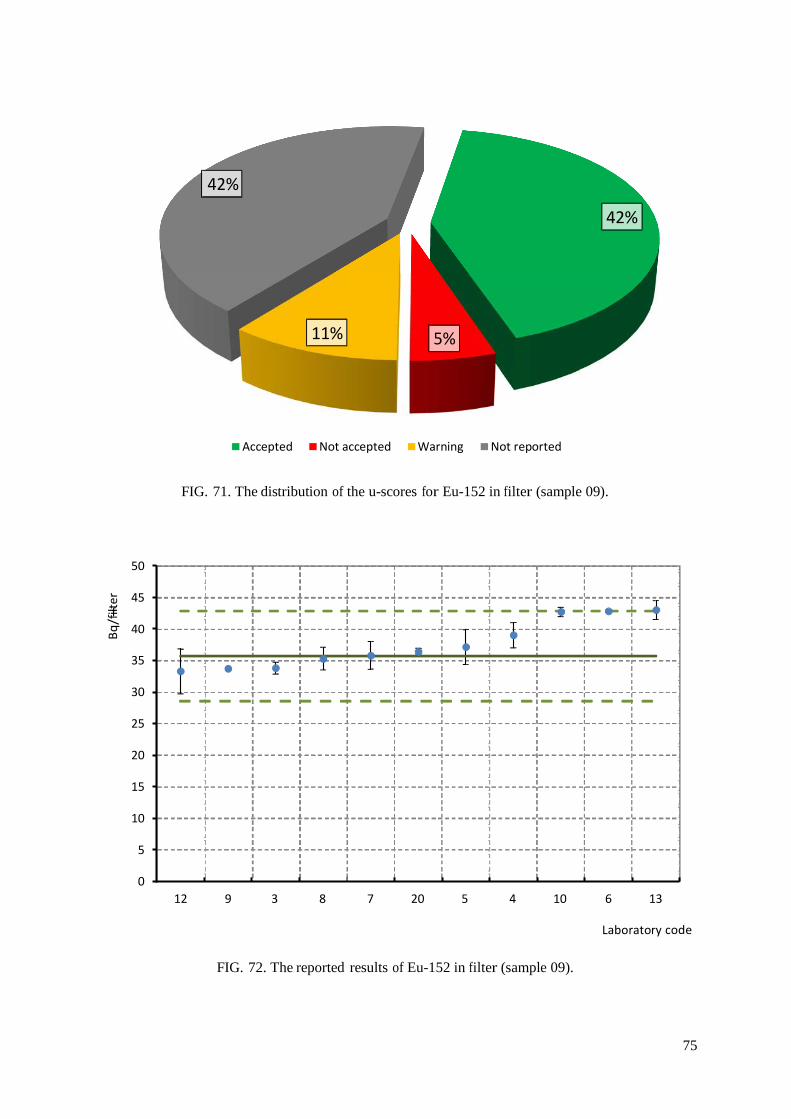
75
Bq/f
ilter
42% 42%
11% 5%
Accepted Not accepted Warning Not reported
FIG. 71. The distribution of the u-scores for Eu-152 in filter (sample 09).
50
45 f
40
35
30
25
20
15
10
5
0 12 9 3 8 7 20 5 4 10 6 13
Laboratory code
FIG. 72. The reported results of Eu-152 in filter (sample 09).
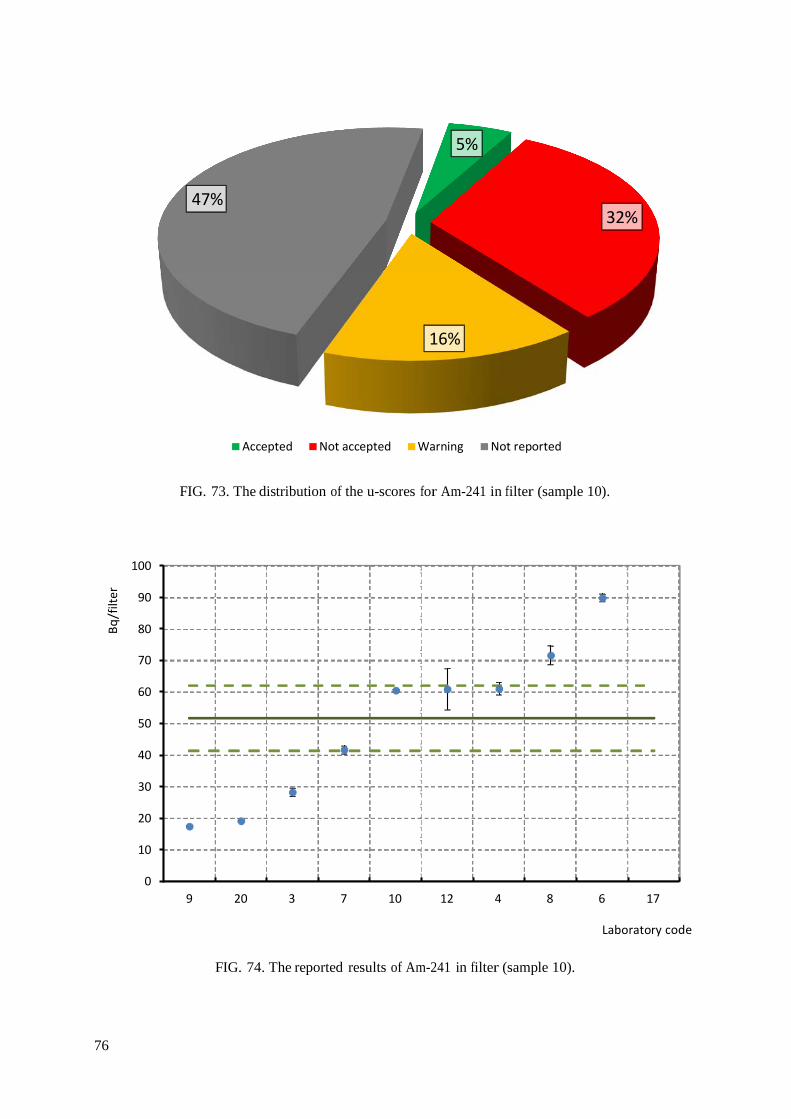
76
Bq/f
ilter
5%
47% 32%
16%
Accepted Not accepted Warning Not reported
FIG. 73. The distribution of the u-scores for Am-241 in filter (sample 10).
100
90
80
70
60
50
40
30
20
10
0 9 20 3 7 10 12 4 8 6 17
Laboratory code
FIG. 74. The reported results of Am-241 in filter (sample 10).
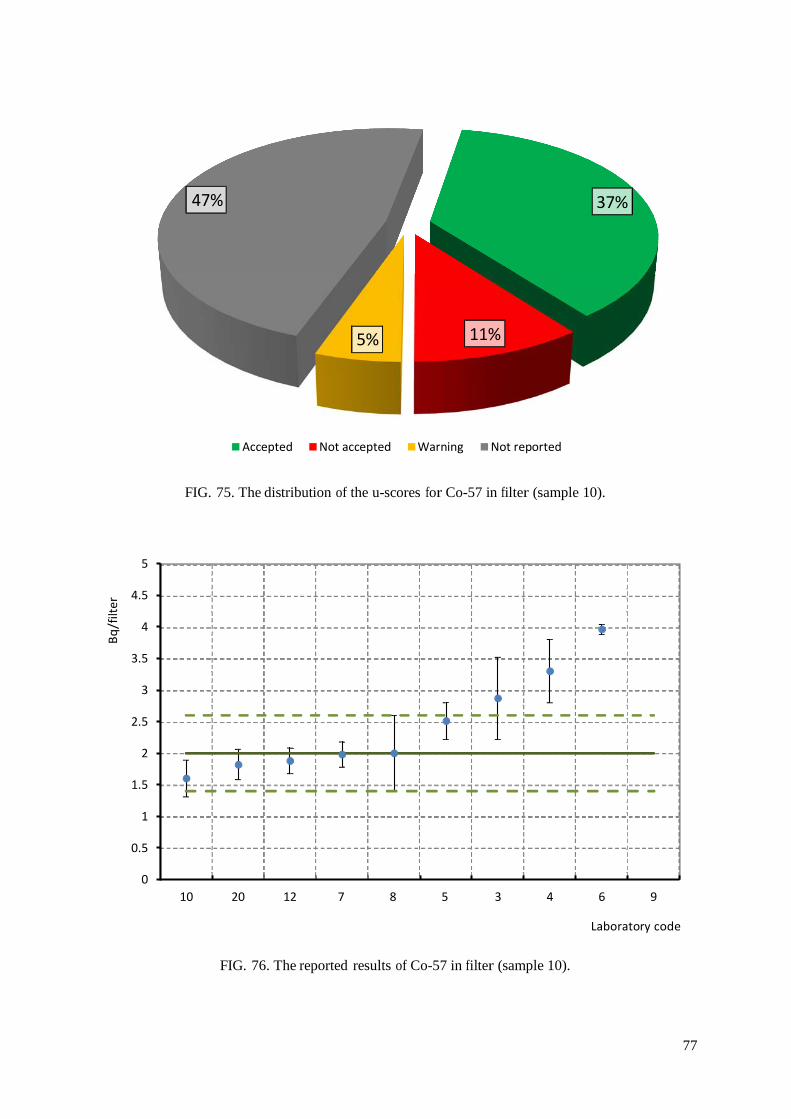
77
Bq/
filte
r
47% 37%
5% 11%
Accepted Not accepted Warning Not reported
FIG. 75. The distribution of the u-scores for Co-57 in filter (sample 10).
5
4.5
4
3.5
3
2.5
2
1.5
1
0.5
0 10 20 12 7 8 5 3 4 6 9
Laboratory code
FIG. 76. The reported results of Co-57 in filter (sample 10).
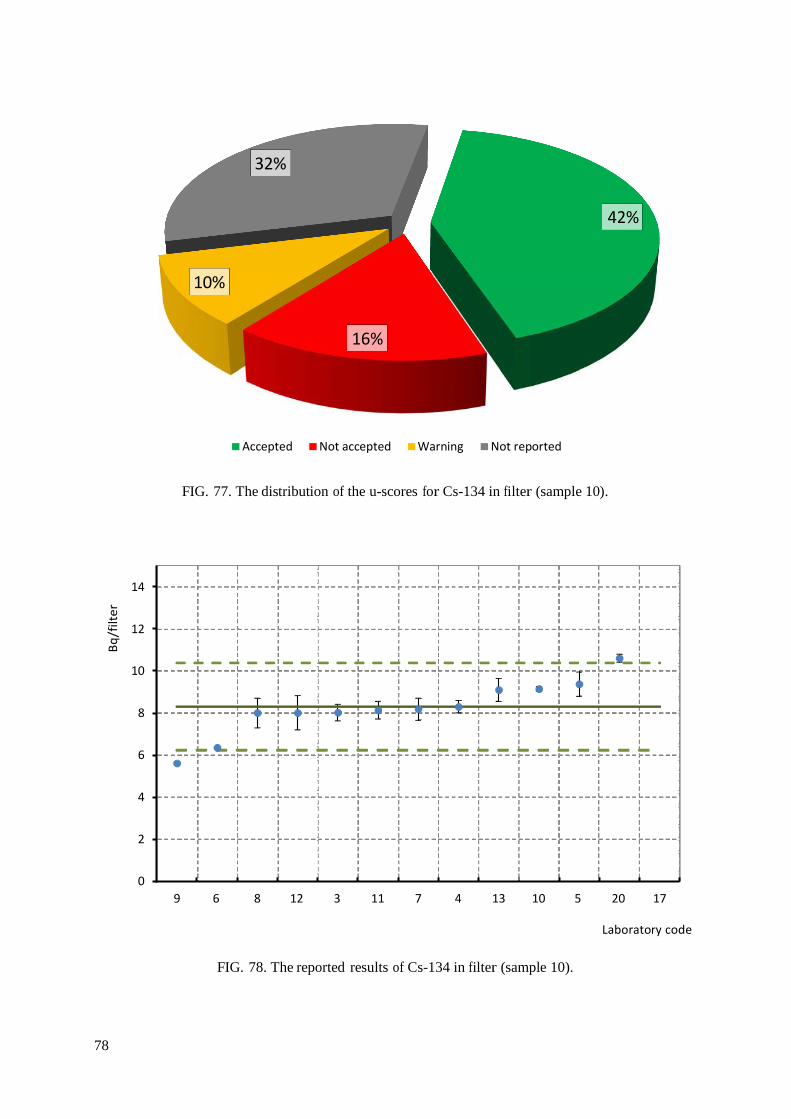
78
Bq/f
ilter
32%
42%
10%
16%
Accepted Not accepted Warning Not reported
FIG. 77. The distribution of the u-scores for Cs-134 in filter (sample 10).
14
12
10
8
6
4
2
0 9 6 8 12 3 11 7 4 13 10 5 20 17
Laboratory code
FIG. 78. The reported results of Cs-134 in filter (sample 10).
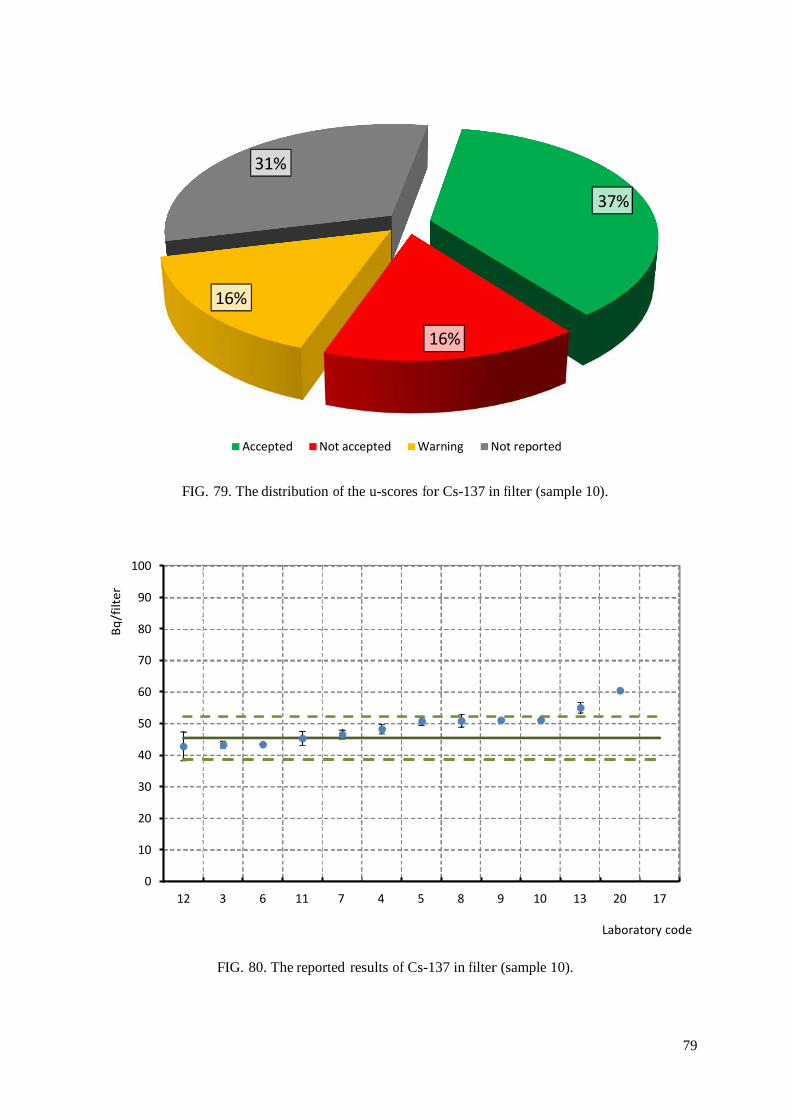
79
Bq/f
ilter
31%
37%
16%
16%
Accepted Not accepted Warning Not reported
FIG. 79. The distribution of the u-scores for Cs-137 in filter (sample 10).
100
90
80
70
60
50
40
30
20
10
0 12 3 6 11 7 4 5 8 9 10 13 20 17
Laboratory code
FIG. 80. The reported results of Cs-137 in filter (sample 10).

80
Bq/
filte
r
42% 42%
5% 11%
Accepted Not accepted Warning Not reported
FIG. 81. The distribution of the u-scores for Eu-152 in filter (sample 10).
70
60
50
40
30
20
10
0 12 9 3 7 8 20 4 5 10 13 6
Laboratory code
FIG. 82. The reported results of Eu-152 in filter (sample 10).
81
APPENDIX III
LIST OF PARTICIPATING LABORATORIES
(Names of contact persons in alphabetical order, not related to the laboratory code) Ichikawa, K. IDEA Consultants, Inc. 3-15-1 Komazawa,
Setagaya-Ward, Tokyo-Metropolice 154-8585, Japan
Igarashi, Y. Meteorological Research Institute, 1-1,
Nagamine, Tsukuba, Ibaraki, 305-0052, Japan
Kitamura, A. Graduate School of Maritime Sciences, Kobe University, 5-1-1 Fukaeminami-machi, Higashinada-ku, Kobe 658-0022, Japan
Matsunaga, T. JAEA,
2-4 Shirakata Shirane Tokai-Mura, Naka-Gun Ibaraki 319-1195, Japan
Matsuoka, K. Environmental Control Center Co., Ltd. 323-1 Shimo-ongata-machi,
Hachiouji-shi, Tokyo 192-0154, Japan
Namba, K. Fukushima University,
Dept. Sci&Eng, Kanayagawa, Fukushima 960-1296, Japan
Ohishi, K. Nihonsoken Co., Ltd 1622, Nishijimacho,
Minami-ku, Hamamamatsu-shi, Shizuoka, 430-083, Japan
Ohtsuki, T. Tohoku University,
1-2-1 Mikamine Taihaku, Sendai 982-0826, Japan
82
Onda, Y. School of Life and Environmental Sciences, University of Tsukuba, Japan
Onodera, A. NS Environmental Science Consultant Co.
Tohoku Branch 140, Nakanoaza-asiguro,
Miyagino-ku, Sendai-city, Miyagi Pref., 983-0013, Japan
Oura, Y. Department of Chemistry,
Tokyo Met. University, 1-1 Minamiosawa Hachioji, Tokyo 192-0397, Japan
Seki, T. Nihon Environmental Services Co., Ltd 2-1-13 Sachiura,
Kanazawa-ku, Yokohama-shi, Kanagawa, Postal code 236-0003, Japan
Sekiguchi, K. NAITOH Environmental Science Co., Ltd 2051-2, Daitakubo,
Minami-ku, Saitama-shi, Saitama, 336-0015, Japan
Shinohara, A. School of Science,
Osaka University, 1-1 Machikaneyama-cho Toyonaka, Osaka 560-0043, Japan
Takahashi, Y. Graduate School of Science,
Hiroshima University, Kagamiyama, Higashi-Hiroshima, Hiroshima 739-8526, Japan
Takenaka, C. Graduate School of Bioagricultural Sciences,
Nagoya University, FurouChoChigusa-Ku, Nagoya 464-8601, Japan
83
Tanoi, K. Biotechnology Research Center, Tokyo University,
1-1-1 Yayoi Bunkyo, Tokyo 113-8657, Japan
Tokuda, K. UNITIKA Environmental
Technical Center, Ltd 23, Uji-Kozakura, Uji-Shi, Kyoto, Japan
Yokoyama, A. Advanced Science Research
Center, Kanazawa University,
Kakuma Kanazawa, Ishikawa 920-1192,
Japan

85
REFERENCES
[1] SHAKHASHIRO, A., SANSONE, U., ARNOLD, D., DRYAK, P., LAROSA, J., JEROME, S.M., MAKAREWICZ, J., MENTCHEVA, J., SATO, K., TARJAN, S., The new IAEA-372 grass-certified reference material for 40K and 137Cs, Applied Radiation and Isotopes, 66 (2008) 1718-1721.
[2] INTERNATIONAL ATOMIC ENERGY AGENCY, ALMERA Proficiency Test: Determination of Gamma Emitting Radionuclides in Simulated Air Filters IAEA-CU- 2009-04, IAEA Analytical Quality in Nuclear Applications Series No. 16, IAEA, Vienna (2010).
[3] SHAKHASHIRO, A., FAJGELJ, A., SANSONE, U., Comparison of Different Approaches To Evaluate Proficiency Test Data, presented and accepted in the publications of the International Workshop on Combining and Reporting Analytical Results. The Role of (metrological) Traceability and (measurement) Uncertainty for Comparing Analytical Results, Combining and Reporting Analytical Results, The Royal Society of Chemistry (2007).
[4] LABORATOIRE NATIONAL HENRI BECQUEREL, Atomic and Nuclear Data, Gamma and alpha spectrometry on-line library (2012). http://www.nucleide.org/DDEP_WG/DDEPdata.htm
[5] JOINT COMMITTEE FOR GUIDES IN METROLOGY (JGCM), Evaluation of measurement data - Guide to the expression of uncertainty in measurement, JGCM 100:2008 (GUM with minor corrections) (2008). http://www.bipm.org/utils/common/documents/jcgm/JCGM_100_2008_E.pdf

87
CONTRIBUTORS TO DRAFTING AND REVIEW A. Ceccatelli International Atomic Energy Agency
M. Gröning International Atomic Energy Agency
G. Kis-Benedek International Atomic Energy Agency
A. Pitois International Atomic Energy Agency
R. Schorn International Atomic Energy Agency
J. Seufzenecker International Atomic Energy Agency
A. Shakhashiro International Atomic Energy Agency
S. Tarjan International Atomic Energy Agency
A. Trinkl International Atomic Energy Agency

@ No. 23
ORDERING LOCALLYIn the following countries, IAEA priced publications may be purchased from the sources listed below, or from major local booksellers. Orders for unpriced publications should be made directly to the IAEA. The contact details are given at the end of this list.
AUSTRALIADA Information Services648 Whitehorse Road, Mitcham, VIC 3132, AUSTRALIA Telephone: +61 3 9210 7777 Fax: +61 3 9210 7788 Email: [email protected] Web site: http://www.dadirect.com.au
BELGIUMJean de LannoyAvenue du Roi 202, 1190 Brussels, BELGIUM Telephone: +32 2 5384 308 Fax: +61 2 5380 841 Email: [email protected] Web site: http://www.jean-de-lannoy.be
CANADARenouf Publishing Co. Ltd.Telephone: +1 613 745 2665 Fax: +1 643 745 7660 5369 Canotek Road, Ottawa, ON K1J 9J3, CANADA Email: [email protected] Web site: http://www.renoufbooks.com
Bernan Associates4501 Forbes Blvd., Suite 200, Lanham, MD 20706-4391, USA Telephone: +1 800 865 3457 Fax: +1 800 865 3450 Email: [email protected] Web site: http://www.bernan.com
CZECH REPUBLICSuweco CZ, spol. S.r.o.Klecakova 347, 180 21 Prague 9, CZECH REPUBLIC Telephone: +420 242 459 202 Fax: +420 242 459 203 Email: [email protected] Web site: http://www.suweco.cz
FINLANDAkateeminen KirjakauppaPO Box 128 (Keskuskatu 1), 00101 Helsinki, FINLAND Telephone: +358 9 121 41 Fax: +358 9 121 4450 Email: [email protected] Web site: http://www.akateeminen.com
FRANCEForm-Edit5, rue Janssen, PO Box 25, 75921 Paris CEDEX, FRANCE Telephone: +33 1 42 01 49 49 Fax: +33 1 42 01 90 90 Email: [email protected] Web site: http://www.formedit.fr
Lavoisier SAS14, rue de Provigny, 94236 Cachan CEDEX, FRANCE Telephone: +33 1 47 40 67 00 Fax: +33 1 47 40 67 02 Email: [email protected] Web site: http://www.lavoisier.fr
L’Appel du livre99, rue de Charonne, 75011 Paris, FRANCE Telephone: +33 1 43 07 50 80 Fax: +33 1 43 07 50 80 Email: [email protected] Web site: http://www.appeldulivre.fr
GERMANYGoethe Buchhandlung Teubig GmbHSchweitzer Fachinformationen Willstaetterstrasse 15, 40549 Duesseldorf, GERMANY Telephone: +49 (0) 211 49 8740 Fax: +49 (0) 211 49 Email: [email protected] Web site: http://www. http://www.goethebuch.de/
HUNGARYLibrotade Ltd., Book ImportPF 126, 1656 Budapest, HUNGARY Telephone: +36 1 257 7777 Fax: +36 1 257 7472 Email: [email protected] Web site: http://www.librotade.hu
INDIAAllied Publishers1st Floor, Dubash House, 15, J.N. Heredi Marg Ballard Estate, Mumbai 400001, INDIA Telephone: +91 22 2261 7926/27 Fax: +91 22 2261 7928 Email: [email protected] Web site: http://www.alliedpublishers.com
Bookwell3/79 Nirankari, Dehli 110009, INDIA Tel.: +91 11 2760 1283 +91 11 27604536 Email: [email protected] Web site: http://www.bookwellindia.com/
ITALYLibreria Scientifica “AEIOU”Via Vincenzo Maria Coronelli 6, 20146 Milan, ITALY Tel.: +39 02 48 95 45 52 Fax: +39 02 48 95 45 48 Email: [email protected] Web site: http://www.libreriaaeiou.eu/
JAPANMaruzen Co., Ltd.1-9-18 Kaigan, Minato-ku, Tokyo 105-0022, JAPAN Tel.: +81 3 6367 6047 Fax: +81 3 6367 6160 Email: [email protected] Web site: http://maruzen.co.jp
NETHERLANDSMartinus Nijhoff InternationalKoraalrood 50, Postbus 1853, 2700 CZ Zoetermeer, NETHERLANDS Tel.: +31 793 684 400 Fax: +31 793 615 698 Email: [email protected] Web site: http://www.nijhoff.nl
Swets PO Box 26, 2300 AA Leiden Dellaertweg 9b, 2316 WZ Leiden, NETHERLANDS Telephone: +31 88 4679 263 Fax: +31 88 4679 388 Email: [email protected] Web site: www.swets.com
SLOVENIACankarjeva Zalozba ddKopitarjeva 2, 1515 Ljubljana, SLOVENIA Tel.: +386 1 432 31 44 Fax: +386 1 230 14 35 Email: [email protected] Web site: http://www.mladinska.com/cankarjeva_zalozba
SPAINDiaz de Santos, S.A.Librerias Bookshop Departamento de pedidos Calle Albasanz 2, esquina Hermanos Garcia Noblejas 21, 28037 Madrid, SPAIN Telephone: +34 917 43 48 90 Email: [email protected] Web site: http://www.diazdesantos.es/
UNITED KINGDOMThe Stationery Office Ltd. (TSO)PO Box 29, Norwich, Norfolk, NR3 1PD, UNITED KINGDOM Telephone: +44 870 600 5552 Email (orders): [email protected] (enquiries): [email protected] Web site: http://www.tso.co.uk
On-line orders:DELTA International Ltd.39, Alexandra Road, Addlestone, Surrey, KT15 2PQ, UNITED KINGDOM Email: [email protected] Web site: http://www.profbooks.com
United Nations (UN)300 East 42nd Street, IN-919J, New York, NY 1001, USA Telephone: +1 212 963 8302 Fax: 1 212 963 3489 Email: [email protected] Web site: http://www.unp.un.org
UNITED STATES OF AMERICABernan Associates4501 Forbes Blvd., Suite 200, Lanham, MD 20706-4391, USA Tel.: +1 800 865 3457 Fax: +1 800 865 3450 Email: [email protected] Web site: http://www.bernan.com
Renouf Publishing Co. Ltd.812 Proctor Avenue, Ogdensburg, NY 13669, USA Tel.: +800 551 7470 (toll free) +800 568 8546 (toll free) Email: [email protected] Web site: http://www.renoufbooks.com
Orders for both priced and unpriced publications may be addressed directly to:IAEA Publishing Section, Marketing and Sales Unit, International Atomic Energy Agency Vienna International Centre, PO Box 100, 1400 Vienna, Austria Telephone: +43 1 2600 22529 or 22488 • Fax: +43 1 2600 29302 Email: [email protected] • Web site: http://www.iaea.org/books


13-32481

IAEA/AQ/29
IAEA Analytical Quality in Nuclear Applications Series No. 29
Emergency Response Proficiency Test for Japanese Laboratories: Determination of Selected Radionuclides in Water, Soil, Vegetation and Aerosol Filters
INTERNATIONAL ATOMIC ENERGY AGENCYVIENNA
ISSN 2074–7659
spine for 80 pages = 4,28 mm