Embed Size (px)
Citation preview

2 0 0 0 A N N U A L P R O G R E S S R E P O R T
U.S. Department of Energy
Energy Efficiency and Renewable Energy
Office of Transportation Technologies
TRAN
SPOR
TATIO
NFU
ELCE
LLPO
WER
SYST
EMS
TRAN
SPOR
TATIO
NFU
ELCE
LLPO
WER
SYST
EMS

A C K N O W L E D G E M E N T
We would like to express our sincere appreciation to Argonne NationalLaboratory and Computer Systems Management, Inc., for their artistic andtechnical contributions in preparing and publishing this report.
In addition, we would like to thank all our program participants for theircontributions to the programs and all the authors who prepared the project abstracts that comprise this report.

U.S. Department of EnergyOffice of Advanced Automotive Technologies1000 Independence Avenue, S.W.Washington, DC 20585-0121
FY 2000
Progress Report for Fuel Cell Power Systems
Energy Efficiency and Renewable EnergyOffice of Transportation Technologies
Approved by Steven Chalk Energy Conversion Team Leader
October 2000
Fuel Cell Power Systems FY 2000 Progress Report
iii
CONTENTS
Page
I. INTRODUCTION......................................................................................................................... 1
II. FUEL CELL POWER SYSTEM DEVELOPMENT ................................................................ 9
A. Atmospheric Fuel Cell Power System for Transportation ...................................................... 9B. Pressurized Fuel Cell Power System for Transportation ........................................................ 12C. Cost Analyses of Fuel Cell Stack/Systems ............................................................................. 16D. Fuel Cell Systems Analysis .................................................................................................... 21
III. FUEL PROCESSING SUBSYSTEM .......................................................................................... 27
A. Advanced Fuel Processor Development for Next Millennium Fuel Processor™for Transportation Fuel Cell Power Systems .......................................................................... 27
B. Multifuel Processor for Fuel Cell Electric-Vehicle Applications ........................................... 32C. Fuel-Flexible, UOB™ Fuel Processor System: Development and Status .............................. 36D. Integrated Fuel Processor Development ................................................................................. 40E. Microchannel Fuel Processor Components............................................................................. 44F. Catalysts for Improved Fuel Processing ................................................................................. 49G. R&D on a Novel Breadboard Device Suitable for Carbon Monoxide Remediation
in an Automotive PEM Fuel Cell Power Plant ....................................................................... 53H. CO Clean-up Development..................................................................................................... 57I. Evaluation of Partial Oxidation Fuel Cell Reformer Emissions ............................................. 62J. Catalytic Autothermal Reforming........................................................................................... 65K. Alternative Water-Gas Shift Catalyst Development ............................................................... 70
IV. FUEL CELL STACK SUBSYSTEM .......................................................................................... 75
A. R&D on a 50-kW, High-Efficiency, High-Power-Density, CO-TolerantPEM Fuel Cell Stack System.................................................................................................. 75
B. Development of Advanced, Low-Cost PEM Fuel Cell Stack and SystemDesign for Operation on Reformate Used in Vehicle Power Systems.................................... 79
C. Cold-Start Dynamics of a PEM Fuel Cell Stack..................................................................... 85D. Efficient Fuel Cell Systems .................................................................................................... 88E. Direct Methanol Fuel Cells..................................................................................................... 91
Fuel Cell Power Systems FY 2000 Progress Report
iv
CONTENTS (Cont.)
Page
V. PEM STACK COMPONENT COST REDUCTION ................................................................ 95
A. High-Performance, Matching PEM Fuel Cell Components andIntegrated Pilot Manufacturing Process .................................................................................. 95
B. Design and Installation of a Pilot Plant for High-Volume Electrode Production ................... 100C. Low-Cost, High Temperature, Solid-Polymer Electrolyte Membrane for Fuel Cells ............ 103D. Development and Optimization of Porous Carbon Papers Suitable for
Gas Diffusion Electrodes ........................................................................................................ 108E. Electrodes for PEM Operation on Reformate/Air................................................................... 111F. New Electrocatalysts for Fuel Cells........................................................................................ 115G. Development of a $10/kW Bipolar Separator Plate ................................................................ 119H. Layered PEM Stack Development .......................................................................................... 123
VI. AIR MANAGEMENT SUBSYSTEMS....................................................................................... 127
A. Turbocompressor for PEM Fuel Cells .................................................................................... 127B. Development of a Scroll Compressor/Expander Module for
Pressurization of 50-kW Automotive Fuel Cell Systems........................................................ 130C. Variable Delivery Compressor/Expander Development......................................................... 133D. Turbocompressor for Vehicular Fuel Cell Service ................................................................. 137E. Innovative, High-Efficiency Integrated Compressor/Expander Based on
TIVM Geometry ..................................................................................................................... 143
VII. HYDROGEN STORAGE............................................................................................................. 147
A. High-Pressure Conformable Hydrogen Storage for Fuel Cell Vehicles ................................. 147B. Advanced Chemical Hydride Hydrogen-Generation/Storage System
for PEM Fuel Cell Vehicles .................................................................................................... 150
APPENDIX A: ACRONYMS, INITIALISMS, AND ABBREVIATIONS....................................... 157
APPENDIX B: DOE TECHNICAL TARGETS FOR FUEL CELL SYSTEMS,SUBSYSTEMS, AND COMPONENTS .................................................................... 161
Fuel Cell Power Systems FY 2000 Progress Report
1
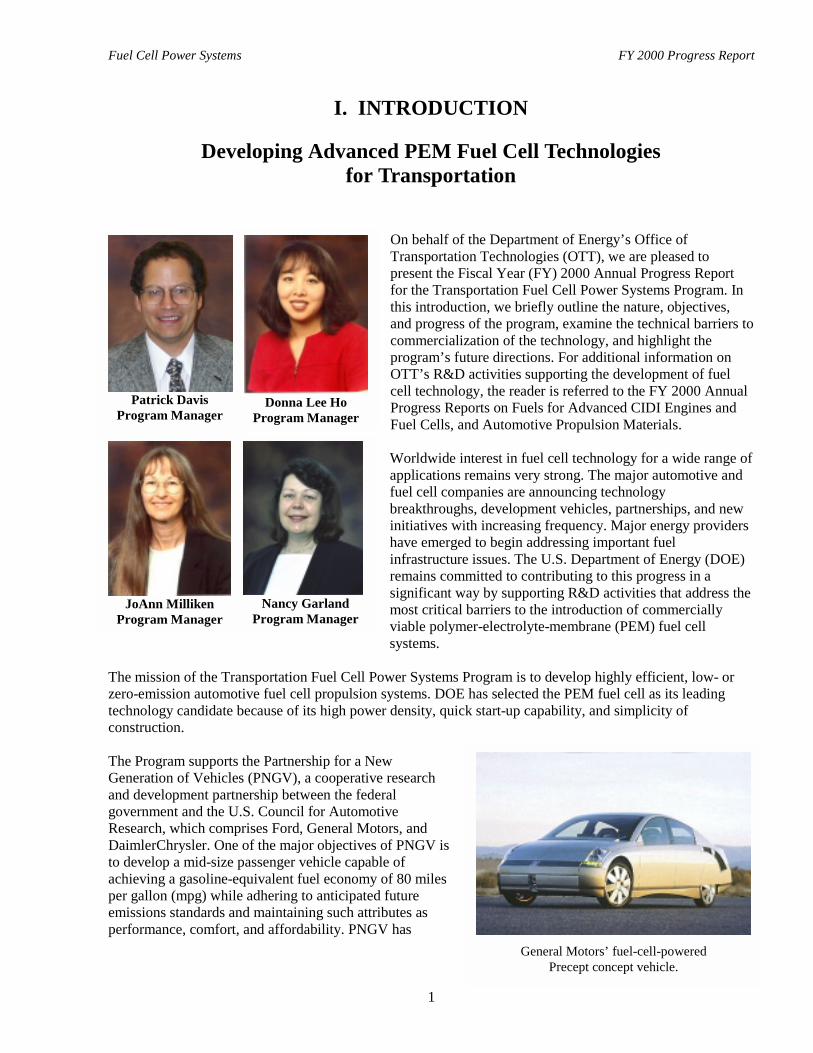
General Motors’ fuel-cell-poweredPrecept concept vehicle.
JoAnn MillikenProgram Manager
Patrick DavisProgram Manager
Donna Lee HoProgram Manager
Nancy GarlandProgram Manager
I. INTRODUCTION
Developing Advanced PEM Fuel Cell Technologiesfor Transportation
On behalf of the Department of Energy’s Office ofTransportation Technologies (OTT), we are pleased topresent the Fiscal Year (FY) 2000 Annual Progress Reportfor the Transportation Fuel Cell Power Systems Program. Inthis introduction, we briefly outline the nature, objectives,and progress of the program, examine the technical barriers tocommercialization of the technology, and highlight theprogram’s future directions. For additional information onOTT’s R&D activities supporting the development of fuelcell technology, the reader is referred to the FY 2000 AnnualProgress Reports on Fuels for Advanced CIDI Engines andFuel Cells, and Automotive Propulsion Materials.
Worldwide interest in fuel cell technology for a wide range ofapplications remains very strong. The major automotive andfuel cell companies are announcing technologybreakthroughs, development vehicles, partnerships, and newinitiatives with increasing frequency. Major energy providershave emerged to begin addressing important fuelinfrastructure issues. The U.S. Department of Energy (DOE)remains committed to contributing to this progress in asignificant way by supporting R&D activities that address themost critical barriers to the introduction of commerciallyviable polymer-electrolyte-membrane (PEM) fuel cellsystems.
The mission of the Transportation Fuel Cell Power Systems Program is to develop highly efficient, low- orzero-emission automotive fuel cell propulsion systems. DOE has selected the PEM fuel cell as its leadingtechnology candidate because of its high power density, quick start-up capability, and simplicity ofconstruction.
The Program supports the Partnership for a NewGeneration of Vehicles (PNGV), a cooperative researchand development partnership between the federalgovernment and the U.S. Council for AutomotiveResearch, which comprises Ford, General Motors, andDaimlerChrysler. One of the major objectives of PNGV isto develop a mid-size passenger vehicle capable ofachieving a gasoline-equivalent fuel economy of 80 milesper gallon (mpg) while adhering to anticipated futureemissions standards and maintaining such attributes asperformance, comfort, and affordability. PNGV has

Fuel Cell Power Systems FY 2000 Progress Report
2
targeted PEM fuel cell power systems as one of the promisingtechnologies for achieving this objective.
The primary purpose of this report is to document the progressmade by the DOE Transportation Fuel Cell Power SystemsR&D Program during FY 2000 against the R&D barriers andtasks identified in the Office of Advanced AutomotiveTechnologies R&D Plan. We would be remiss, however, if weneglected to note the advances in fuel cell technology beingmade through other private and public initiatives throughout theyear. In January 2000, General Motors introduced the Precept,its second fuel-cell-powered concept vehicle. Designed tooperate on hydrogen stored aboard the vehicle as a chemicalhydride, the Precept has a projected fuel economy in excess of 100 mpg (gasoline equivalent) and a range of500 miles. In the fall of 1999, Ford unveiled the FC5 fuel cell vehicle, designed — unlike their previouslyintroduced P2000 — to operate on hydrogen extracted from methanol by means of an onboard fuel processor.
The California Fuel Cell Partnership, a program announced last year, is continuing to generate a high level ofinterest by industry and governments to accelerate the development of fuel cell vehicles. The Partnershipplans to put about 70 fuel cell vehicles — cars and buses — on the road between 2000 and 2003. Over thepast year, several new members have joined the Partnership, including DOE and the U.S. Department ofTransportation (DOT). Membership now includes six auto companies (DaimlerChrysler, Ford, Honda,Hyundai, Nissan, and Volkswagen); two technology developers (Ballard and International Fuel Cells); sevenfuel and fuel infrastructure interests (BP, Shell Hydrogen, Texaco, Air Products, Linde AG, Methanex, andPraxair); two transit agencies (AC Transit and SunLine), and five government agencies (California EnergyCommission, California Air Resources Board, South Coast Air Quality Management District, DOE, andDOT). A 55,000-square-foot fuel cell vehicle headquarters and hydrogen refueling facility in WestSacramento, California, is expected to open in the fall of 2000. Initially, up to 18 fuel cell vehicles will beregularly driven throughout the Sacramento area to gain "real world" road experience and increase publicawareness.
The DOE Transportation Fuel Cell Power Systems Program is implemented through cost-shared contractswith automotive suppliers and fuel cell and component developers. Furthermore, DOE national laboratoriesand universities throughout the United States conduct R&D activities to increase the knowledge base anddevelop enabling technologies for PEM fuel cells.
The Ford FC5 fuel cell concept vehicle.
Fuel Cell Power Systems FY 2000 Progress Report
3
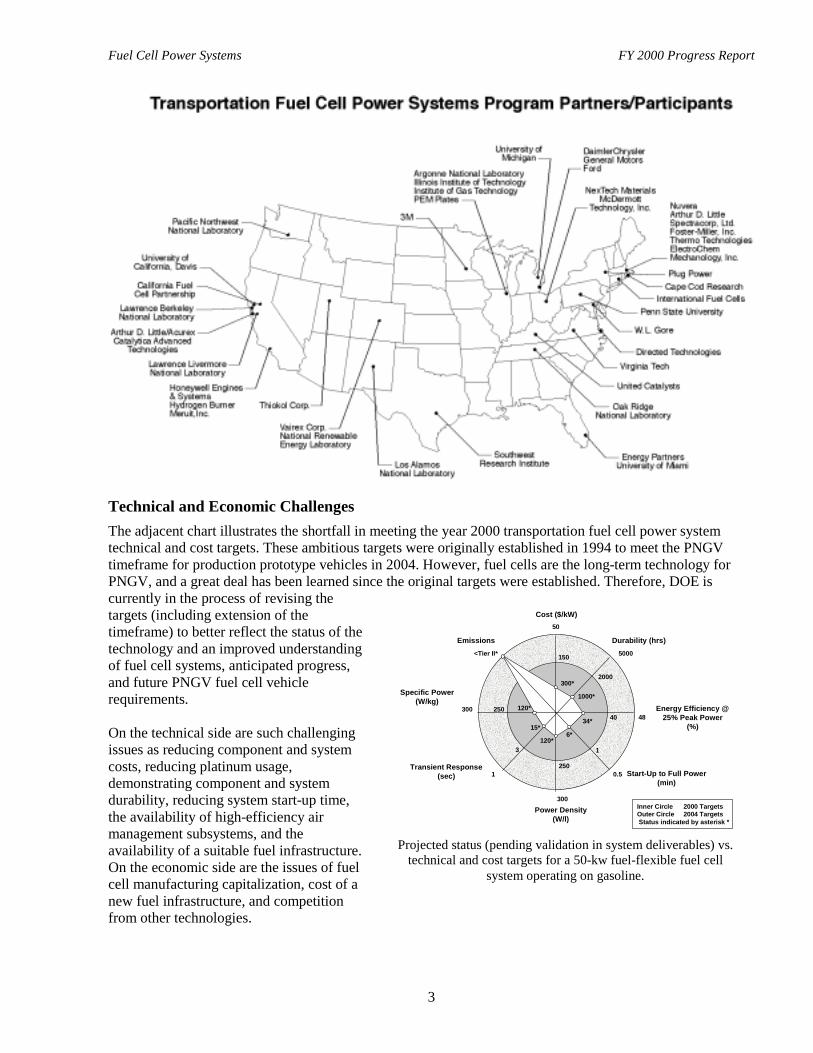
Technical and Economic ChallengesThe adjacent chart illustrates the shortfall in meeting the year 2000 transportation fuel cell power systemtechnical and cost targets. These ambitious targets were originally established in 1994 to meet the PNGVtimeframe for production prototype vehicles in 2004. However, fuel cells are the long-term technology forPNGV, and a great deal has been learned since the original targets were established. Therefore, DOE iscurrently in the process of revising thetargets (including extension of thetimeframe) to better reflect the status of thetechnology and an improved understandingof fuel cell systems, anticipated progress,and future PNGV fuel cell vehiclerequirements.
On the technical side are such challengingissues as reducing component and systemcosts, reducing platinum usage,demonstrating component and systemdurability, reducing system start-up time,the availability of high-efficiency airmanagement subsystems, and theavailability of a suitable fuel infrastructure.On the economic side are the issues of fuelcell manufacturing capitalization, cost of anew fuel infrastructure, and competitionfrom other technologies.
Cost ($/kW)50
Durability (hrs)
Transient Response(sec) Start-Up to Full Power
(min)
Energy Efficiency @25% Peak Power
(%)
Emissions
Power Density(W/l)
Specific Power(W/kg)
300
300
5000
48
1 0.5
15*
120*
120*13
300*2000
1000*
6*
<Tier II*
Inner Circle 2000 TargetsOuter Circle 2004 Targets Status indicated by asterisk *
40
250
250
150
34*
Projected status (pending validation in system deliverables) vs.technical and cost targets for a 50-kw fuel-flexible fuel cell
system operating on gasoline.
Fuel Cell Power Systems FY 2000 Progress Report
4
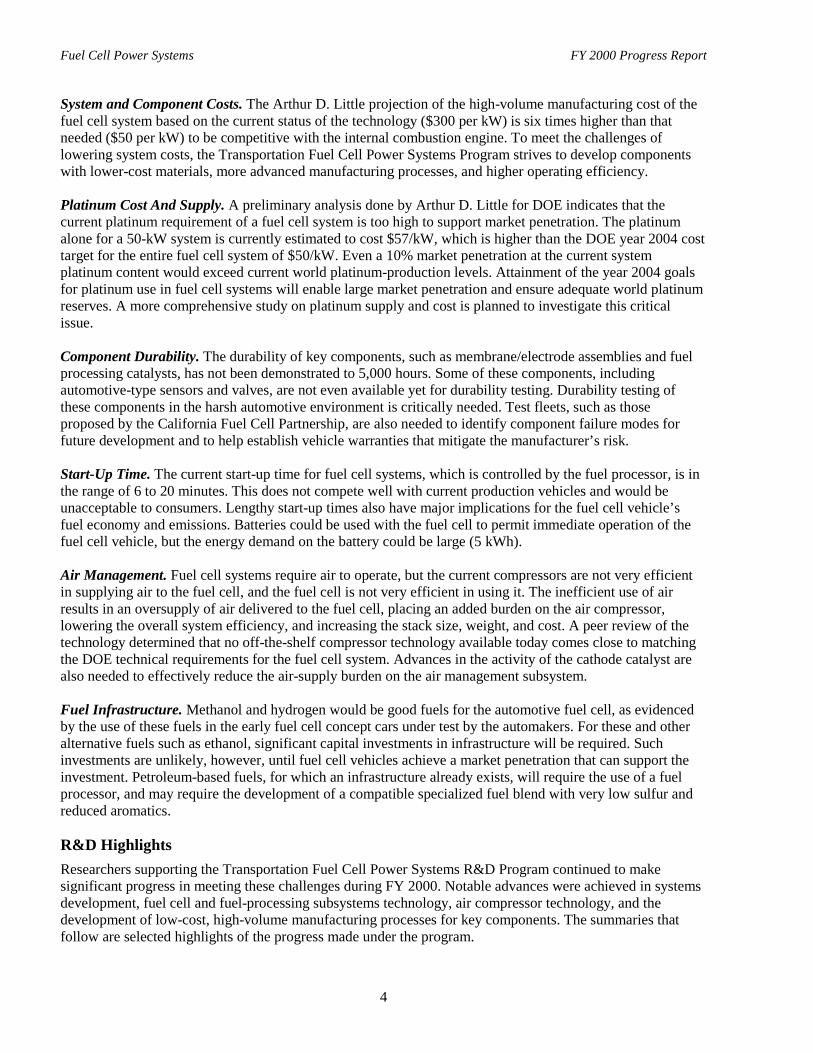
System and Component Costs. The Arthur D. Little projection of the high-volume manufacturing cost of thefuel cell system based on the current status of the technology ($300 per kW) is six times higher than thatneeded ($50 per kW) to be competitive with the internal combustion engine. To meet the challenges oflowering system costs, the Transportation Fuel Cell Power Systems Program strives to develop componentswith lower-cost materials, more advanced manufacturing processes, and higher operating efficiency.
Platinum Cost And Supply. A preliminary analysis done by Arthur D. Little for DOE indicates that thecurrent platinum requirement of a fuel cell system is too high to support market penetration. The platinumalone for a 50-kW system is currently estimated to cost $57/kW, which is higher than the DOE year 2004 costtarget for the entire fuel cell system of $50/kW. Even a 10% market penetration at the current systemplatinum content would exceed current world platinum-production levels. Attainment of the year 2004 goalsfor platinum use in fuel cell systems will enable large market penetration and ensure adequate world platinumreserves. A more comprehensive study on platinum supply and cost is planned to investigate this criticalissue.
Component Durability. The durability of key components, such as membrane/electrode assemblies and fuelprocessing catalysts, has not been demonstrated to 5,000 hours. Some of these components, includingautomotive-type sensors and valves, are not even available yet for durability testing. Durability testing ofthese components in the harsh automotive environment is critically needed. Test fleets, such as thoseproposed by the California Fuel Cell Partnership, are also needed to identify component failure modes forfuture development and to help establish vehicle warranties that mitigate the manufacturer’s risk.
Start-Up Time. The current start-up time for fuel cell systems, which is controlled by the fuel processor, is inthe range of 6 to 20 minutes. This does not compete well with current production vehicles and would beunacceptable to consumers. Lengthy start-up times also have major implications for the fuel cell vehicle’sfuel economy and emissions. Batteries could be used with the fuel cell to permit immediate operation of thefuel cell vehicle, but the energy demand on the battery could be large (5 kWh).
Air Management. Fuel cell systems require air to operate, but the current compressors are not very efficientin supplying air to the fuel cell, and the fuel cell is not very efficient in using it. The inefficient use of airresults in an oversupply of air delivered to the fuel cell, placing an added burden on the air compressor,lowering the overall system efficiency, and increasing the stack size, weight, and cost. A peer review of thetechnology determined that no off-the-shelf compressor technology available today comes close to matchingthe DOE technical requirements for the fuel cell system. Advances in the activity of the cathode catalyst arealso needed to effectively reduce the air-supply burden on the air management subsystem.
Fuel Infrastructure. Methanol and hydrogen would be good fuels for the automotive fuel cell, as evidencedby the use of these fuels in the early fuel cell concept cars under test by the automakers. For these and otheralternative fuels such as ethanol, significant capital investments in infrastructure will be required. Suchinvestments are unlikely, however, until fuel cell vehicles achieve a market penetration that can support theinvestment. Petroleum-based fuels, for which an infrastructure already exists, will require the use of a fuelprocessor, and may require the development of a compatible specialized fuel blend with very low sulfur andreduced aromatics.
R&D HighlightsResearchers supporting the Transportation Fuel Cell Power Systems R&D Program continued to makesignificant progress in meeting these challenges during FY 2000. Notable advances were achieved in systemsdevelopment, fuel cell and fuel-processing subsystems technology, air compressor technology, and thedevelopment of low-cost, high-volume manufacturing processes for key components. The summaries thatfollow are selected highlights of the progress made under the program.

Fuel Cell Power Systems FY 2000 Progress Report
5
0.0
1.0
2.0
3.0
4.0
5.0
6.0
7.0
8.0
1.4 1.6 1.8 2.0 2.2 2.4
1000/Reactor Temp. (1000/°K)
ln (r
ate
cons
tant
, min
-1) n.-p. metal/mixed oxide inc. temp.
n.-p. metal/mixed oxide after 400°C
0.14 wt% Pt/Mixed Oxide/Alumina
180°C400°C
Activity of ANL nonprecious-metal/mixed oxidecatalyst compared to that of Pt/mixed oxide/alumina.
Honeywell 50-kW CO-tolerantPEMFC stack system design.
Atmospheric Fuel Cell Power System. DuringFY 2000, International Fuel Cells (IFC) successfullydelivered a 50-kW (net) gasoline-fueled power plantconfigured for system verification testing. Thelaboratory power plant, designed to operate at near-ambient pressure, consists of a fully tested 50-kW-equivalent fuel-flexible fuel processing system (FPS)and a 50-kW PEM stack assembly. The FPS wastested at steady state throughout the required fuel flowrange, as well as during start/stop and transient cycles.Demonstrated fuel conversion was 98%, with overallfuel processor efficiency exceeding 83%. CO levels inthe reformate were consistent with required lowlevels. Separate testing of the 50-kW stackdemonstrated a gross power output of ~67 kW dc at astack voltage of approximately 280 V dc and a currentdensity of ~650 mA/cm2. Assembly and installation of the integrated power plant in the IFC test stand iscomplete. Verification testing of the system will be performed once the planned checkout procedure iscomplete.
Fuel Processor CO Clean-up Catalysts. In a majorbreakthrough, Argonne National Laboratory (ANL) hasidentified a nonprecious-metal/mixed oxide water-gasshift (WGS) catalyst that does not lose activity attemperatures up to 400°C and is air-stable. The cost ofthis catalyst is comparable to the current lowtemperature WGS catalyst, copper/zinc oxide. Althoughnoble metal catalysts have desirable air and temperaturestability, their high cost may limit their acceptability fortransportation applications. The nonprecious-metal/mixed oxide catalyst has WGS activitycomparable with that of the platinum/mixed oxide at afraction of the cost. Although the nonpreciousmetal/mixed oxide catalyst is not as active ascopper/zinc oxide, it does not lose its activity afterexposure to air at 230°C as does the copper/zinc oxidecatalyst.
CO-Tolerant PEM Fuel Cell Stack System. DuringFY 2000, Honeywell (formerly AlliedSignal) madesignificant advances in the development of a 50-kWCO-tolerant fuel cell stack system. Design of the 50-kWbrassboard system, which includes the PEM stack andthe supporting gas-, thermal-, and water-managementsubsystems, has been completed. The projected nominalefficiency of the brassboard system is 45%. Insupporting stack development activities, Honeywell hasdemonstrated that its cells can tolerate greater than200-ppm CO contamination in the anode fuel gaswithout appreciable performance loss; an 82-cell stack
IFC 50-kW gasoline-fueled, PEM fuel cell power plantready for verification testing.
Fuel Cell Power Systems FY 2000 Progress Report
6
0.3
0.4
0.5
0.6
0.7
0.8
0.9
1
0 250 500 750 1000 1250 1500 1750 2000Current density (mA/cm2)
Cel
l pot
entia
l (V)
cell1cell2cell3cell4
Compression-moldedplates
Injection-molded
Active area(cm2) :292H2/Air stoich. :1.5/2.5Temp. (deg. C):60Pressure (kPa) :308
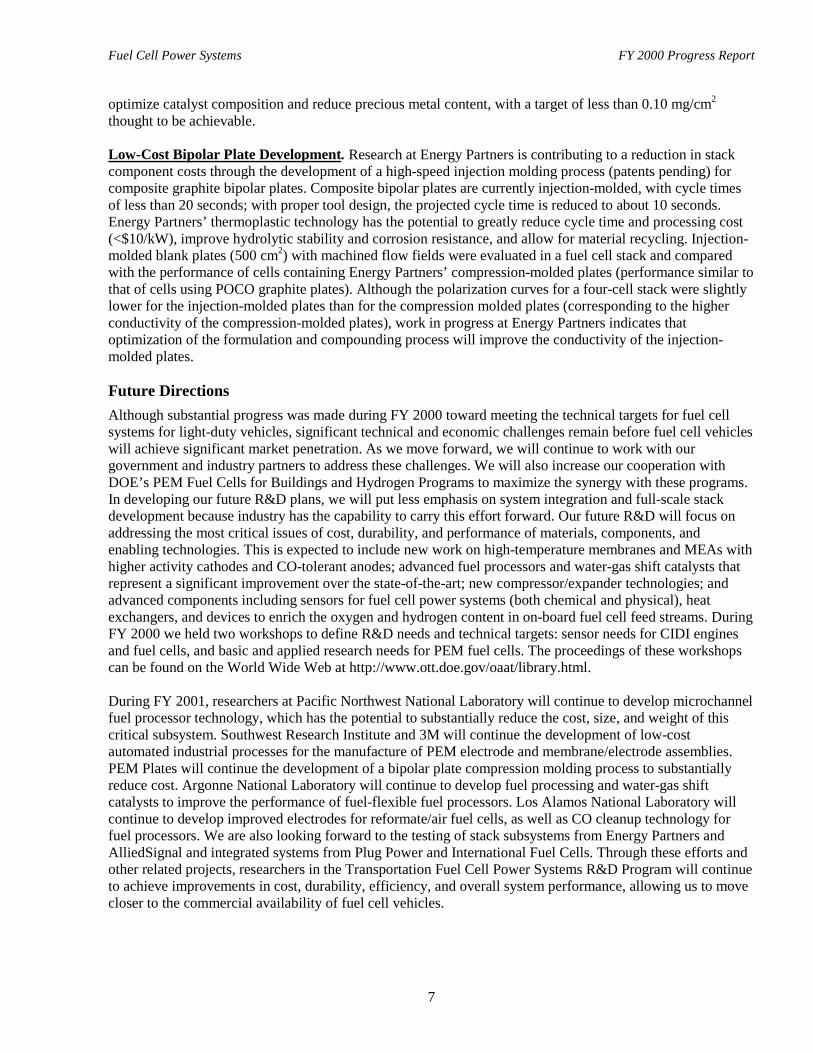
Characteristic cell performance of Energy Partners’ injectionvs. compression molded plates.
was successfully operated for 250 hours on CO-containing reformate. A subscale stack was also subjected toseveral freeze-thaw cycles to -40ºC without damage. A 10-kW (112-cell) class stack containing compositebipolar plates with a new flowfield design demonstrated lower stoichiometry capability, a 13% increase inactive cell area, and substantial improvements in weight (specific power of 0.87 kW/kg), volume (powerdensity of 1.6 kW/L), and manufacturability.
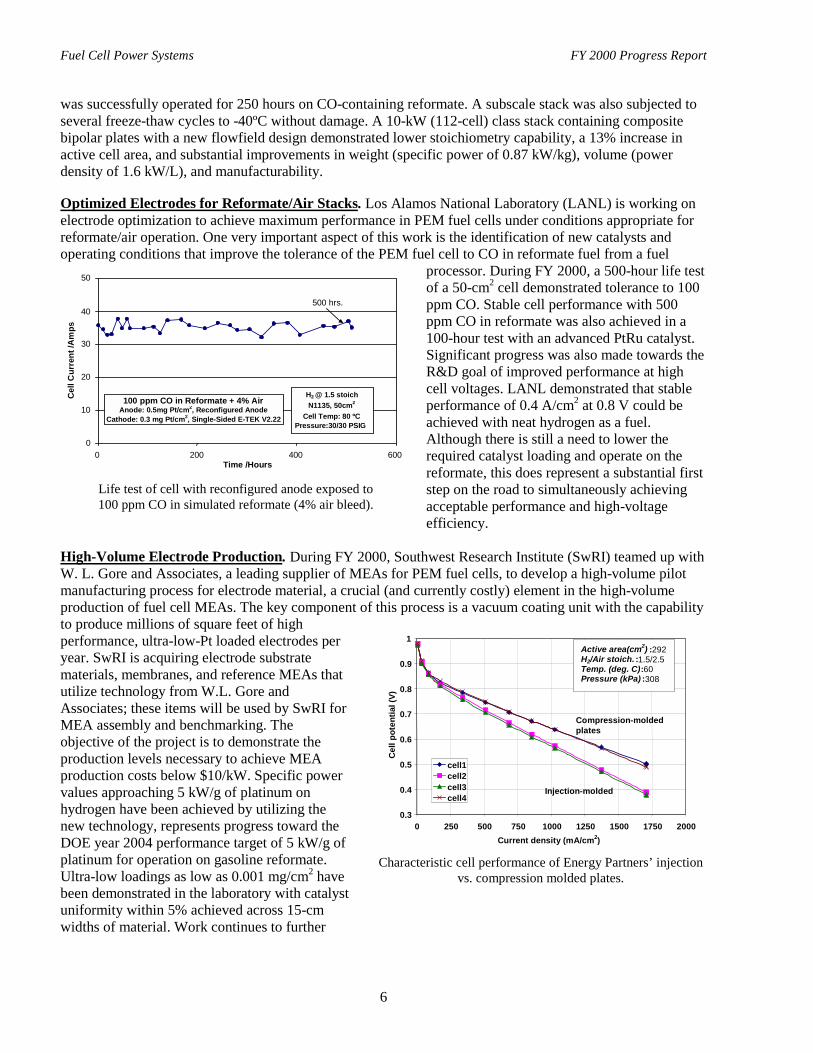
Optimized Electrodes for Reformate/Air Stacks. Los Alamos National Laboratory (LANL) is working onelectrode optimization to achieve maximum performance in PEM fuel cells under conditions appropriate forreformate/air operation. One very important aspect of this work is the identification of new catalysts andoperating conditions that improve the tolerance of the PEM fuel cell to CO in reformate fuel from a fuel
processor. During FY 2000, a 500-hour life testof a 50-cm2 cell demonstrated tolerance to 100ppm CO. Stable cell performance with 500ppm CO in reformate was also achieved in a100-hour test with an advanced PtRu catalyst.Significant progress was also made towards theR&D goal of improved performance at highcell voltages. LANL demonstrated that stableperformance of 0.4 A/cm2 at 0.8 V could beachieved with neat hydrogen as a fuel.Although there is still a need to lower therequired catalyst loading and operate on thereformate, this does represent a substantial firststep on the road to simultaneously achievingacceptable performance and high-voltageefficiency.
High-Volume Electrode Production. During FY 2000, Southwest Research Institute (SwRI) teamed up withW. L. Gore and Associates, a leading supplier of MEAs for PEM fuel cells, to develop a high-volume pilotmanufacturing process for electrode material, a crucial (and currently costly) element in the high-volumeproduction of fuel cell MEAs. The key component of this process is a vacuum coating unit with the capabilityto produce millions of square feet of highperformance, ultra-low-Pt loaded electrodes peryear. SwRI is acquiring electrode substratematerials, membranes, and reference MEAs thatutilize technology from W.L. Gore andAssociates; these items will be used by SwRI forMEA assembly and benchmarking. Theobjective of the project is to demonstrate theproduction levels necessary to achieve MEAproduction costs below $10/kW. Specific powervalues approaching 5 kW/g of platinum onhydrogen have been achieved by utilizing thenew technology, represents progress toward theDOE year 2004 performance target of 5 kW/g ofplatinum for operation on gasoline reformate.Ultra-low loadings as low as 0.001 mg/cm2 havebeen demonstrated in the laboratory with catalystuniformity within 5% achieved across 15-cmwidths of material. Work continues to further
100 ppm CO in Reformate + 4% AirAnode: 0.5mg Pt/cm2, Reconfigured Anode
Cathode: 0.3 mg Pt/cm2, Single-Sided E-TEK V2.22
0
10
20
30
40
50
0 200 400 600Time /Hours
Cel
l Cur
rent
/Am
ps
500 hrs.
H2 @ 1.5 stoichN1135, 50cm2
Cell Temp: 80 ºCPressure:30/30 PSIG
Life test of cell with reconfigured anode exposed to100 ppm CO in simulated reformate (4% air bleed).
Fuel Cell Power Systems FY 2000 Progress Report
7
optimize catalyst composition and reduce precious metal content, with a target of less than 0.10 mg/cm2
thought to be achievable.
Low-Cost Bipolar Plate Development. Research at Energy Partners is contributing to a reduction in stackcomponent costs through the development of a high-speed injection molding process (patents pending) forcomposite graphite bipolar plates. Composite bipolar plates are currently injection-molded, with cycle timesof less than 20 seconds; with proper tool design, the projected cycle time is reduced to about 10 seconds.Energy Partners’ thermoplastic technology has the potential to greatly reduce cycle time and processing cost(<$10/kW), improve hydrolytic stability and corrosion resistance, and allow for material recycling. Injection-molded blank plates (500 cm2) with machined flow fields were evaluated in a fuel cell stack and comparedwith the performance of cells containing Energy Partners’ compression-molded plates (performance similar tothat of cells using POCO graphite plates). Although the polarization curves for a four-cell stack were slightlylower for the injection-molded plates than for the compression molded plates (corresponding to the higherconductivity of the compression-molded plates), work in progress at Energy Partners indicates thatoptimization of the formulation and compounding process will improve the conductivity of the injection-molded plates.
Future DirectionsAlthough substantial progress was made during FY 2000 toward meeting the technical targets for fuel cellsystems for light-duty vehicles, significant technical and economic challenges remain before fuel cell vehicleswill achieve significant market penetration. As we move forward, we will continue to work with ourgovernment and industry partners to address these challenges. We will also increase our cooperation withDOE’s PEM Fuel Cells for Buildings and Hydrogen Programs to maximize the synergy with these programs.In developing our future R&D plans, we will put less emphasis on system integration and full-scale stackdevelopment because industry has the capability to carry this effort forward. Our future R&D will focus onaddressing the most critical issues of cost, durability, and performance of materials, components, andenabling technologies. This is expected to include new work on high-temperature membranes and MEAs withhigher activity cathodes and CO-tolerant anodes; advanced fuel processors and water-gas shift catalysts thatrepresent a significant improvement over the state-of-the-art; new compressor/expander technologies; andadvanced components including sensors for fuel cell power systems (both chemical and physical), heatexchangers, and devices to enrich the oxygen and hydrogen content in on-board fuel cell feed streams. DuringFY 2000 we held two workshops to define R&D needs and technical targets: sensor needs for CIDI enginesand fuel cells, and basic and applied research needs for PEM fuel cells. The proceedings of these workshopscan be found on the World Wide Web at http://www.ott.doe.gov/oaat/library.html.
During FY 2001, researchers at Pacific Northwest National Laboratory will continue to develop microchannelfuel processor technology, which has the potential to substantially reduce the cost, size, and weight of thiscritical subsystem. Southwest Research Institute and 3M will continue the development of low-costautomated industrial processes for the manufacture of PEM electrode and membrane/electrode assemblies.PEM Plates will continue the development of a bipolar plate compression molding process to substantiallyreduce cost. Argonne National Laboratory will continue to develop fuel processing and water-gas shiftcatalysts to improve the performance of fuel-flexible fuel processors. Los Alamos National Laboratory willcontinue to develop improved electrodes for reformate/air fuel cells, as well as CO cleanup technology forfuel processors. We are also looking forward to the testing of stack subsystems from Energy Partners andAlliedSignal and integrated systems from Plug Power and International Fuel Cells. Through these efforts andother related projects, researchers in the Transportation Fuel Cell Power Systems R&D Program will continueto achieve improvements in cost, durability, efficiency, and overall system performance, allowing us to movecloser to the commercial availability of fuel cell vehicles.

Fuel Cell Power Systems FY 2000 Progress Report
8
The remainder of this report presents project abstracts that highlight progress achieved during FY 2000 underthe Transportation Fuel Cell Power Systems Program. The abstracts summarize both industry and nationallaboratory projects, providing an overview of the work being conducted to overcome the technical barriersassociated with the development of fuel cell power systems. Each project abstract identifies the relatedbarriers in the Office of Advanced Automotive Technologies R&D Plan.
Patrick Davis JoAnn Milliken
Donna Lee Ho Nancy GarlandProgram ManagersEnergy Conversion TeamOffice of Advanced Automotive TechnologiesOffice of Transportation Technologies
Fuel Cell Power Systems FY 2000 Progress Report
9
II. FUEL CELL POWER SYSTEM DEVELOPMENT1
A. Atmospheric Fuel Cell Power System for Transportation
Murdo J. SmithInternational Fuel Cells195 Governor’s HighwaySouth Windsor, CT 06074(860) 727-2269, fax: (860) 727-2399, e-mail: [email protected]
DOE Program Manager: Patrick Davis(202) 586-8061, fax: (202) 586-9811, e-mail: [email protected]
ANL Technical Advisor: Walter Podolski(630) 252-7558, fax: (630) 972-4430, e-mail: [email protected]
Contractor: International Fuel Cells, South Windsor, ConnecticutPrime Contract No. DE-AC02-99EE50567, October 1999-November 2002
ObjectiveThe objective of this contract is to deliver to the U.S. Department of Energy (DOE) a 50-kW-equivalent gasolinefuel processing system and a fully integrated, gasoline-fueled, 50-kW polymer electrolyte membrane (PEM) powerplant for functional demonstration testing. The fuel processing system will utilize fuel-flexible reforming technologythat can be modified to accommodate such fuels as methanol, ethanol, and natural gas. Demonstration testing ofeach of the units will be performed at International Fuel Cells (IFC). After IFC’s testing, the PEM power plant willbe delivered to Argonne National Laboratory (ANL) for additional operational tests by DOE.
OAAT R&D Plan: Tasks 5, 8, and 11; Barrier J
Approach• Build and test autothermal fuel processor.
• Build and test an ambient-pressure integrated power plant.
Accomplishments• Delivered and tested a 50-kW-equivalent gasoline fuel processing system.
• Delivered and tested a 50-kW PEM cell stack assembly for incorporation into the integrated power plant.
• Delivered a 50-kW integrated power plant configured for system verification testing.
Future Directions• Complete verification testing of the 50-kW PEM power plant at IFC.
• Deliver the power plant to DOE for follow-on testing at ANL.
1 The DOE technical targets for integrated fuel cell power systems can be found in Table 1, Appendix B.

Fuel Cell Power Systems FY 2000 Progress Report
10
IntroductionInternational Fuel Cells is committed to the
commercialization of PEM fuel cell power plants fortransportation applications. We have in place aprogram that addresses technology development andverification for each of the necessary componentsand subsystems, and ultimately for the fullyintegrated power plant itself. The focus of IFC’sprogram is an ambient-pressure PEM power plantsystem operating on gasoline fuel and delivering50-kW net direct-current (dc) power to theautomotive electrical system.
Project DeliverablesUnder the contract, IFC will deliver to DOE a
50-kW-equivalent gasoline fuel processing system(FPS) and a 50-kW PEM power plant.
Planned Approach
Fuel Processing SystemAssembly of the gasoline fuel processing system
(FPS) deliverable was completed in December 1999.The FPS consists of a fuel desulfurizer, anautothermal fuel reformer, a shift converter, aselective oxidizer, and the balance-of-plantequipment and controls necessary to operate thesystem. The FPS is sized to provide sufficienthydrogen to meet the requirements of the PEM fuelcell for generating 50 kW of dc electrical power. Theobjective of the FPS test program was to verify thatthe operation of the integrated FPS system met thepower-plant requirements.
Figures 1 and 2 are photographs of the deliveredFPS test article. The locations of the major FPScomponents are identified.
The FPS was tested against a specific test plan,using gasoline with the characteristics of Californiareformulated gasoline (RFG) II. The programincluded steady-state performance demonstrationsthroughout the required fuel flow range, from idle torated power conditions, as well as start/stop andtransient cycles. Figure 3 illustrates steady-statehydrogen production as a function of gasoline flow.Demonstrated fuel conversion was 98%, with overallfuel processor efficiency exceeding 83%. The FPSefficiency is the ratio of energy delivered by the FPSin the form of hydrogen (LHV 51,574 Btu/lb) to theenergy delivered to the FPS in the form of gasoline
CA-0421
SHIFTCONVERTER
DESULFURIZER
AUTOTHERMALREFORMER
Figure 1. Fuel processing system, showing location ofthe desulfurizer, autothermal reformer, andshift converter.
CA-0422
SHIFTCONVERTER
SELECTIVEOXIDIZER
FC42012990912
Figure 2. Location of FPS shift converter and selectiveoxidizer.
1
2
3
4
5
6
7
8
9
10
11
4 8 12 16 20 24 28 32 36 40Gasoline Flow (pph)
Hyd
roge
n Pr
oduc
tion
(pph
)
Lines with hollow markers indicate design goal, solid markers indicate test data
Figure 3. FPS steady-state hydrogen production.
Fuel Cell Power Systems FY 2000 Progress Report
11
(LHV 18,900 Btu/lb). Exit CO levels wereconsistent with required levels.
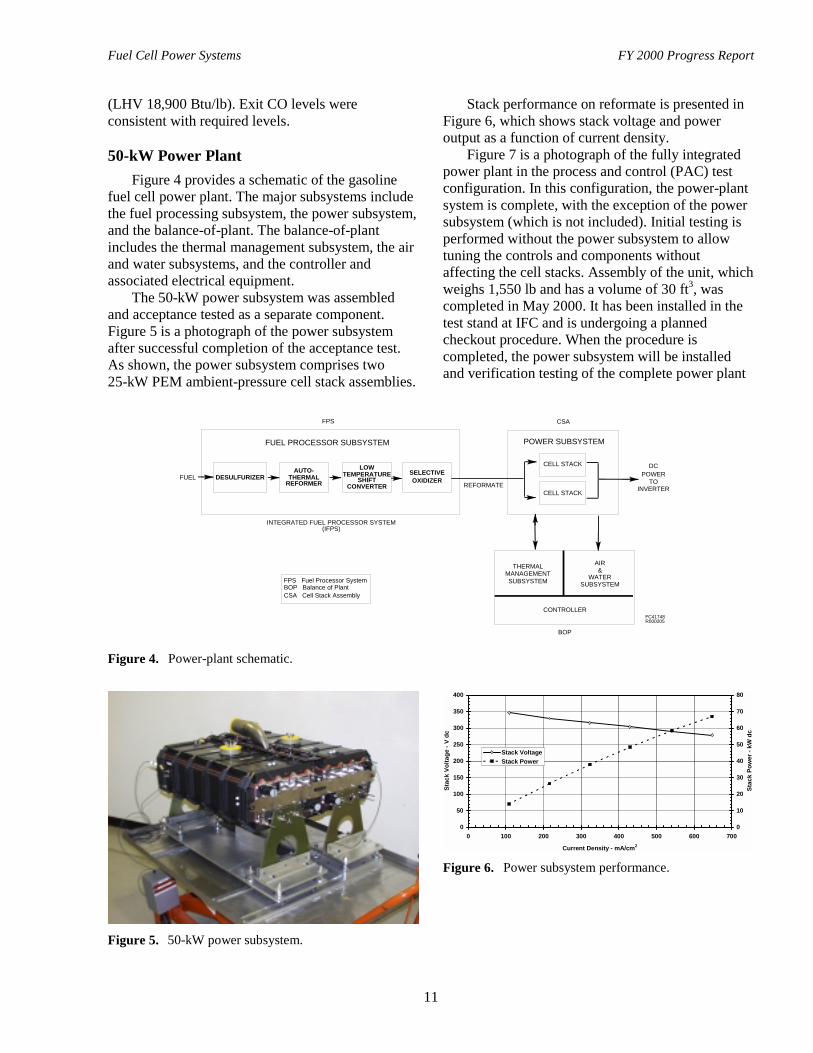
50-kW Power PlantFigure 4 provides a schematic of the gasoline
fuel cell power plant. The major subsystems includethe fuel processing subsystem, the power subsystem,and the balance-of-plant. The balance-of-plantincludes the thermal management subsystem, the airand water subsystems, and the controller andassociated electrical equipment.
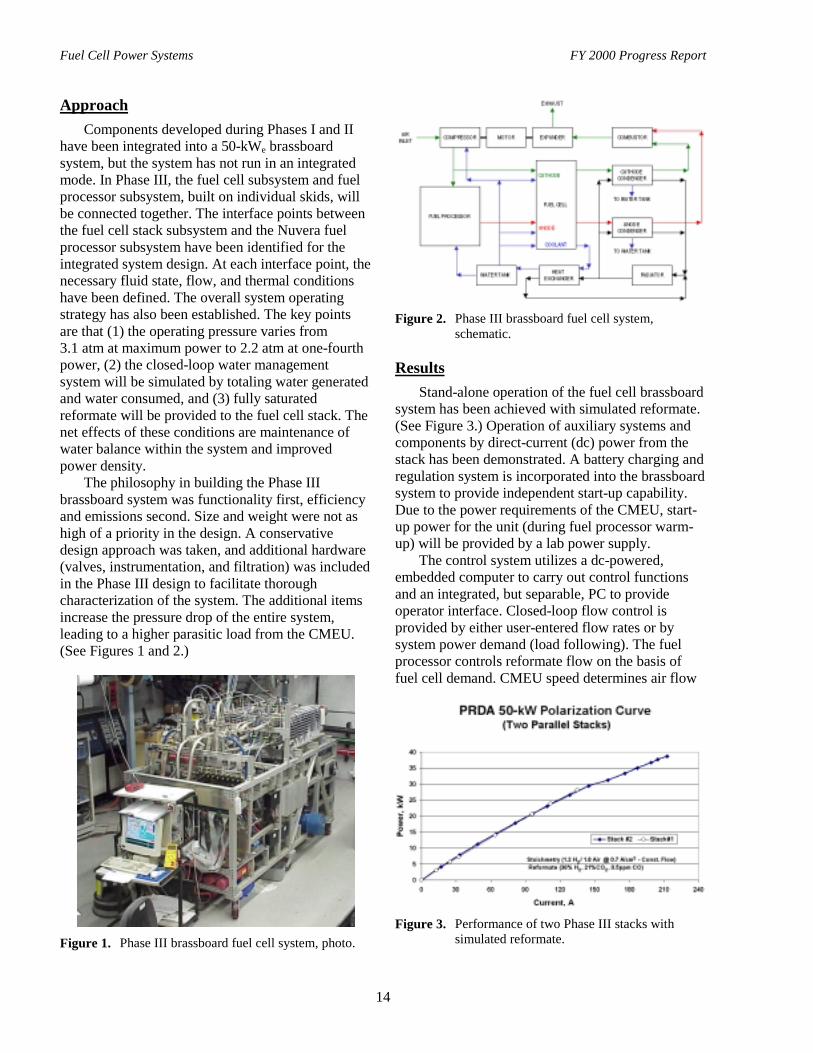
The 50-kW power subsystem was assembledand acceptance tested as a separate component.Figure 5 is a photograph of the power subsystemafter successful completion of the acceptance test.As shown, the power subsystem comprises two25-kW PEM ambient-pressure cell stack assemblies.
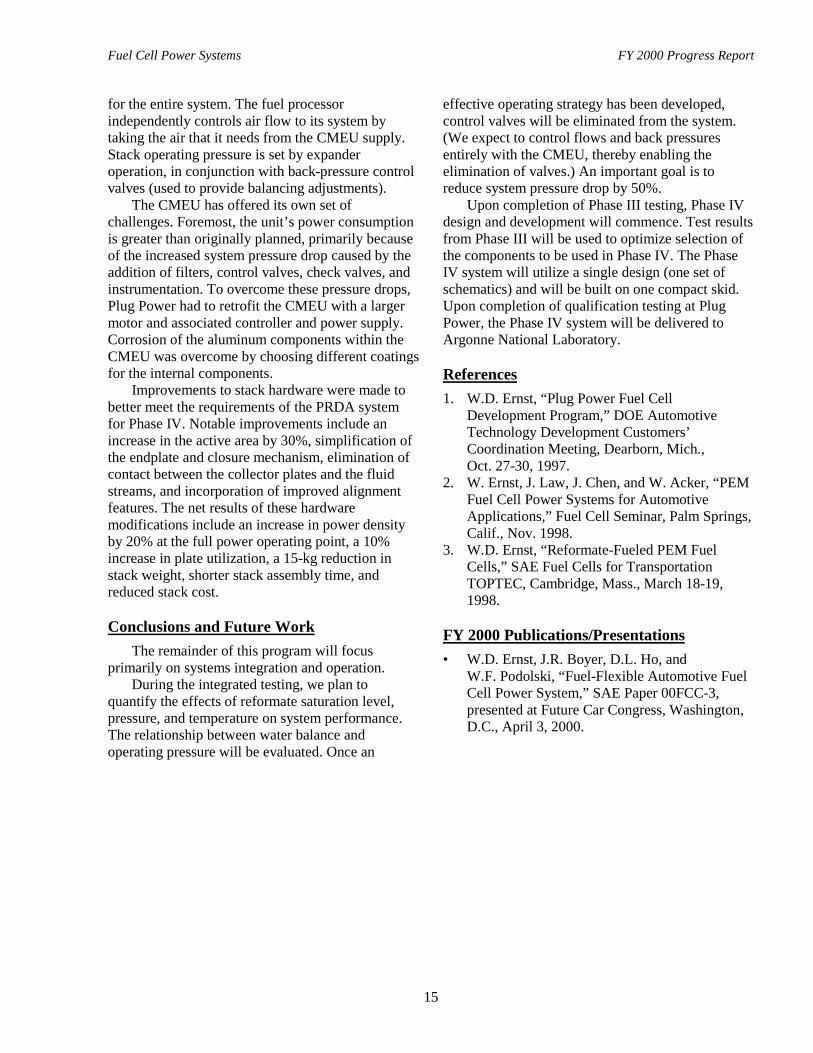
Stack performance on reformate is presented inFigure 6, which shows stack voltage and poweroutput as a function of current density.
Figure 7 is a photograph of the fully integratedpower plant in the process and control (PAC) testconfiguration. In this configuration, the power-plantsystem is complete, with the exception of the powersubsystem (which is not included). Initial testing isperformed without the power subsystem to allowtuning the controls and components withoutaffecting the cell stacks. Assembly of the unit, whichweighs 1,550 lb and has a volume of 30 ft3, wascompleted in May 2000. It has been installed in thetest stand at IFC and is undergoing a plannedcheckout procedure. When the procedure iscompleted, the power subsystem will be installedand verification testing of the complete power plant
FUEL
FUEL PROCESSOR SUBSYSTEM POWER SUBSYSTEM
FPS Fuel Processor System
CSA Cell Stack AssemblyBOP Balance of Plant
FPS CSA
BOP
DESULFURIZER
CELL STACK
CELL STACK
INTEGRATED FUEL PROCESSOR SYSTEM(IFPS)
CONTROLLER
TEMPERATURESHIFT
CONVERTER
LOWAUTO-THERMAL
REFORMER
FC41748R000205
THERMALMANAGEMENTSUBSYSTEM SUBSYSTEM
AIR&
WATER
REFORMATE TOINVERTER
DCPOWER
OXIDIZERSELECTIVE
Figure 4. Power-plant schematic.
Figure 5. 50-kW power subsystem.
0
50
100
150
200
250
300
350
400
0 100 200 300 400 500 600 700
Current Density - mA/cm2
Stac
k Vo
ltage
- V
dc
0
10
20
30
40
50
60
70
80
Stac
k Po
wer
- kW
dc
Stack VoltageStack Power
Figure 6. Power subsystem performance.

Fuel Cell Power Systems FY 2000 Progress Report
12
will be performed. The efficiency of the power plantwill be determined during the testing program.
Figure 7. 50-kW gasoline-fueled power plant.
ConclusionsIFC is committed to the commercialization of
PEM fuel cell power plants for transportationapplications. The focus of IFC’s program is anambient-pressure PEM power plant system operatingon gasoline fuel. The assembly and testing of a50-kW equivalent fuel processing system wascompleted. The test results confirmed that theoperation of the FPS system met the power-plantrequirements. A 50-kW power subsystem was alsoassembled and acceptance tested as a separatecomponent. The fully integrated power plantconfigured for system verification is nowundergoing testing. Following the verification test,the power subsystem will be installed andverification testing of the complete power plant willbe performed.
B. Pressurized Fuel Cell Power System for Transportation
William D. ErnstPlug Power, LLCLatham, NY 12110(518) 782-7700, fax: (518) 782-7914, e-mail: [email protected]
DOE Program Manager: Donna Lee Ho(202) 586-8000, fax: (202) 586-9811, e-mail: [email protected]
DOE Program Support: Larry Blair(202) 586-0626, fax: (202) 586-9811, e-mail: [email protected]
ANL Technical Advisor: Walter Podolski(630) 252-7558, fax: (630) 972-4430, e-mail: [email protected]
Contractor: Plug Power, Inc., Latham, New York 12110Prime Contract No. DE-FC02-97EE50472, September 30, 1997-December 31, 2000Major Subcontractor: Nuvera Fuel Cells, Cambridge, Massachusetts 02140
Objectives• Research and develop a fully integrated fuel cell system that operates on common transportation fuels (gasoline,
methanol, ethanol, and natural gas) for automotive applications.
• Deliver a fully integrated, 50-kWe (net) system consisting of a polymer electrolyte membrane (PEM) fuel cellstack, with balance-of-plant components, and a 50-kWe (net) fuel-flexible reformer.

Fuel Cell Power Systems FY 2000 Progress Report
13
OAAT R&D Plan: Tasks 5, 8, and 11; Barriers A-H and J
ApproachThe integrated fuel cell system is being pursued in four phases:
• Phase I: Define overall system; build and demonstrate a 10-kWe system.• Phase II: Develop components for 50-kWe system.• Phase III: Integrate all components into 50-kWe brassboard system.• Phase IV: Build and test integrated 50-kWe power system in a test stand.
Accomplishments• Built 50-kWe (net) brassboard fuel cell power subsystem, using commercially available components.
• Achieved functional operation with simulated reformate.
• 50-kWe (net) fuel cell and fuel processing subsystems are built, characterized, and ready to be integrated witheach other.
Fuel Cell Power System(including fuel processor, stack and auxiliaries; excluding gasoline tank and DC-DC converter)
Characteristic Status DOE Technical Target
Net Power (kWe) 50 50Energy Efficiency @ 25% Peak Power (%) 40 (predicted) 40Power Density (W/L) 250 (predicted) 250Specific Power (W/kg) 250 (predicted) 250Durability (hours) 2000 (predicted) 2000
Future Directions• Integrate fuel cell subsystem with fuel processor subsystem.• During integration, gain experience with compressor/motor/expander unit (CMEU) integration, water balance,
system control strategy, and power distribution.
• On the basis of integration experience, develop an integrated system with increased fuel cell and fuel processorefficiency and improve overall system power density.
• Design, build, and test a highly integrated, 50-kWe gasoline-powered fuel cell system (Phase IV).
IntroductionThe goal of Phase I of this program is to develop
fundamental knowledge about the individualcomponents in the fuel cell system, culminating inthe integration of a 10-kWe (net) PEM fuel cell stackwith a partial oxidation fuel processor. Phase II isthe development of components at the 50-kWe level,followed by brassboard system integration of thevarious components in Phase III. Phase IV willconsist of building a fully integrated, compact50-kWe system that incorporates the results of
Phase III testing; this system will be used forperformance and emissions testing.
Phase I was completed during fiscal year (FY)1998, and Phase II was completed during FY 1999;Phase III, currently in progress, will conclude withthe integration of Plug Power’s 50-kW (net)brassboard system with a 50-kWe (net) fuelprocessor brassboard system developed and built byNuvera Fuel Cells (formerly known as ADL/Epyx).
Fuel Cell Power Systems FY 2000 Progress Report
14
ApproachComponents developed during Phases I and II
have been integrated into a 50-kWe brassboardsystem, but the system has not run in an integratedmode. In Phase III, the fuel cell subsystem and fuelprocessor subsystem, built on individual skids, willbe connected together. The interface points betweenthe fuel cell stack subsystem and the Nuvera fuelprocessor subsystem have been identified for theintegrated system design. At each interface point, thenecessary fluid state, flow, and thermal conditionshave been defined. The overall system operatingstrategy has also been established. The key pointsare that (1) the operating pressure varies from3.1 atm at maximum power to 2.2 atm at one-fourthpower, (2) the closed-loop water managementsystem will be simulated by totaling water generatedand water consumed, and (3) fully saturatedreformate will be provided to the fuel cell stack. Thenet effects of these conditions are maintenance ofwater balance within the system and improvedpower density.
The philosophy in building the Phase IIIbrassboard system was functionality first, efficiencyand emissions second. Size and weight were not ashigh of a priority in the design. A conservativedesign approach was taken, and additional hardware(valves, instrumentation, and filtration) was includedin the Phase III design to facilitate thoroughcharacterization of the system. The additional itemsincrease the pressure drop of the entire system,leading to a higher parasitic load from the CMEU.(See Figures 1 and 2.)
Figure 1. Phase III brassboard fuel cell system, photo.
Figure 2. Phase III brassboard fuel cell system,schematic.
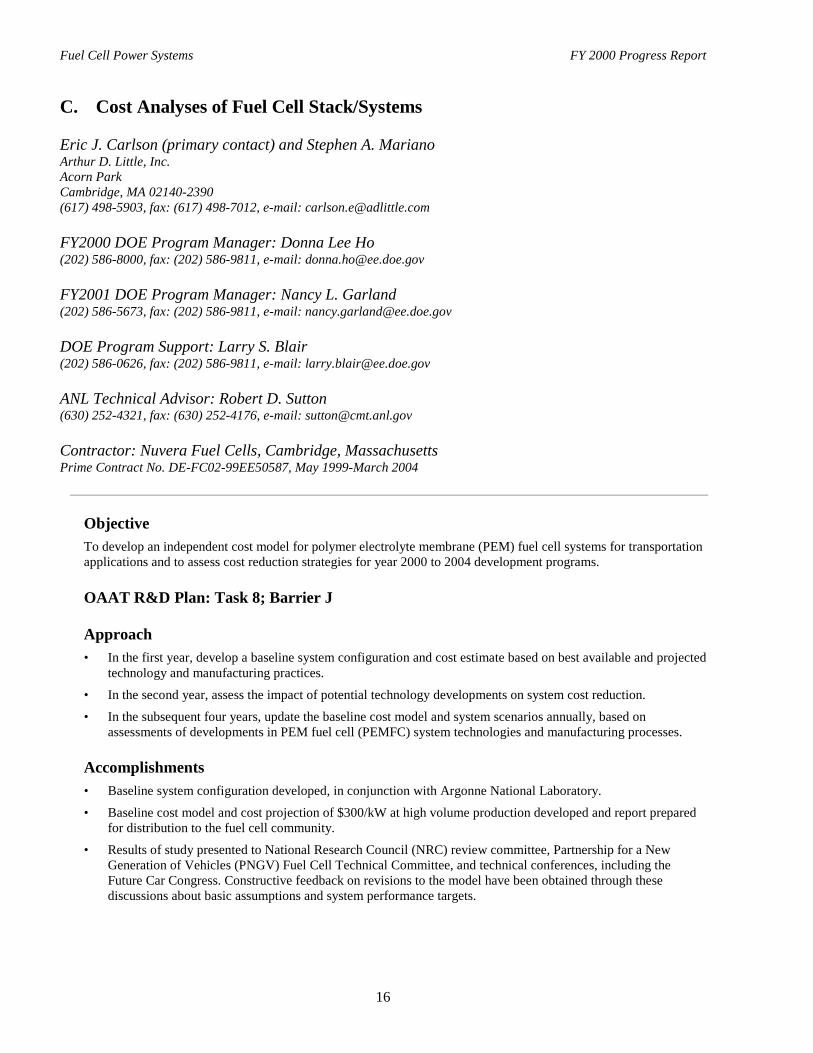
ResultsStand-alone operation of the fuel cell brassboard
system has been achieved with simulated reformate.(See Figure 3.) Operation of auxiliary systems andcomponents by direct-current (dc) power from thestack has been demonstrated. A battery charging andregulation system is incorporated into the brassboardsystem to provide independent start-up capability.Due to the power requirements of the CMEU, start-up power for the unit (during fuel processor warm-up) will be provided by a lab power supply.
The control system utilizes a dc-powered,embedded computer to carry out control functionsand an integrated, but separable, PC to provideoperator interface. Closed-loop flow control isprovided by either user-entered flow rates or bysystem power demand (load following). The fuelprocessor controls reformate flow on the basis offuel cell demand. CMEU speed determines air flow
Figure 3. Performance of two Phase III stacks withsimulated reformate.
Fuel Cell Power Systems FY 2000 Progress Report
15
for the entire system. The fuel processorindependently controls air flow to its system bytaking the air that it needs from the CMEU supply.Stack operating pressure is set by expanderoperation, in conjunction with back-pressure controlvalves (used to provide balancing adjustments).
The CMEU has offered its own set ofchallenges. Foremost, the unit’s power consumptionis greater than originally planned, primarily becauseof the increased system pressure drop caused by theaddition of filters, control valves, check valves, andinstrumentation. To overcome these pressure drops,Plug Power had to retrofit the CMEU with a largermotor and associated controller and power supply.Corrosion of the aluminum components within theCMEU was overcome by choosing different coatingsfor the internal components.
Improvements to stack hardware were made tobetter meet the requirements of the PRDA systemfor Phase IV. Notable improvements include anincrease in the active area by 30%, simplification ofthe endplate and closure mechanism, elimination ofcontact between the collector plates and the fluidstreams, and incorporation of improved alignmentfeatures. The net results of these hardwaremodifications include an increase in power densityby 20% at the full power operating point, a 10%increase in plate utilization, a 15-kg reduction instack weight, shorter stack assembly time, andreduced stack cost.
Conclusions and Future WorkThe remainder of this program will focus
primarily on systems integration and operation.During the integrated testing, we plan to
quantify the effects of reformate saturation level,pressure, and temperature on system performance.The relationship between water balance andoperating pressure will be evaluated. Once an
effective operating strategy has been developed,control valves will be eliminated from the system.(We expect to control flows and back pressuresentirely with the CMEU, thereby enabling theelimination of valves.) An important goal is toreduce system pressure drop by 50%.
Upon completion of Phase III testing, Phase IVdesign and development will commence. Test resultsfrom Phase III will be used to optimize selection ofthe components to be used in Phase IV. The PhaseIV system will utilize a single design (one set ofschematics) and will be built on one compact skid.Upon completion of qualification testing at PlugPower, the Phase IV system will be delivered toArgonne National Laboratory.
References1. W.D. Ernst, “Plug Power Fuel Cell
Development Program,” DOE AutomotiveTechnology Development Customers’Coordination Meeting, Dearborn, Mich.,Oct. 27-30, 1997.
2. W. Ernst, J. Law, J. Chen, and W. Acker, “PEMFuel Cell Power Systems for AutomotiveApplications,” Fuel Cell Seminar, Palm Springs,Calif., Nov. 1998.
3. W.D. Ernst, “Reformate-Fueled PEM FuelCells,” SAE Fuel Cells for TransportationTOPTEC, Cambridge, Mass., March 18-19,1998.
FY 2000 Publications/Presentations• W.D. Ernst, J.R. Boyer, D.L. Ho, and
W.F. Podolski, “Fuel-Flexible Automotive FuelCell Power System,” SAE Paper 00FCC-3,presented at Future Car Congress, Washington,D.C., April 3, 2000.
Fuel Cell Power Systems FY 2000 Progress Report
16
C. Cost Analyses of Fuel Cell Stack/Systems
Eric J. Carlson (primary contact) and Stephen A. MarianoArthur D. Little, Inc.Acorn ParkCambridge, MA 02140-2390(617) 498-5903, fax: (617) 498-7012, e-mail: [email protected]
FY2000 DOE Program Manager: Donna Lee Ho(202) 586-8000, fax: (202) 586-9811, e-mail: [email protected]
FY2001 DOE Program Manager: Nancy L. Garland(202) 586-5673, fax: (202) 586-9811, e-mail: [email protected]
DOE Program Support: Larry S. Blair(202) 586-0626, fax: (202) 586-9811, e-mail: [email protected]
ANL Technical Advisor: Robert D. Sutton(630) 252-4321, fax: (630) 252-4176, e-mail: [email protected]
Contractor: Nuvera Fuel Cells, Cambridge, MassachusettsPrime Contract No. DE-FC02-99EE50587, May 1999-March 2004
ObjectiveTo develop an independent cost model for polymer electrolyte membrane (PEM) fuel cell systems for transportationapplications and to assess cost reduction strategies for year 2000 to 2004 development programs.
OAAT R&D Plan: Task 8; Barrier J
Approach• In the first year, develop a baseline system configuration and cost estimate based on best available and projected
technology and manufacturing practices.
• In the second year, assess the impact of potential technology developments on system cost reduction.
• In the subsequent four years, update the baseline cost model and system scenarios annually, based onassessments of developments in PEM fuel cell (PEMFC) system technologies and manufacturing processes.
Accomplishments• Baseline system configuration developed, in conjunction with Argonne National Laboratory.
• Baseline cost model and cost projection of $300/kW at high volume production developed and report preparedfor distribution to the fuel cell community.
• Results of study presented to National Research Council (NRC) review committee, Partnership for a NewGeneration of Vehicles (PNGV) Fuel Cell Technical Committee, and technical conferences, including theFuture Car Congress. Constructive feedback on revisions to the model have been obtained through thesediscussions about basic assumptions and system performance targets.
Fuel Cell Power Systems FY 2000 Progress Report
17
Future DirectionsDevelop projections of future system performance and cost on the basis of continued industry feedback andprojected technology developments. Projections of future system performance and cost include, at a minimum, thefollowing scenarios:
• An increase in ambient temperature to 120°F resulting in an increase in the size and weight of heat exchangers.
• A stack optimized for high power output (higher current density, but lower cell voltage) resulting in a lessefficient but smaller and less costly stack system.
• System hybridization (fuel cell/battery) and the subsequent dependence of system cost ($/kW) on rated power.
• Effect of total pressure on system cost to determine if technical targets can be met at an operating pressure of 2or 2.5 atm.
• Effect of a high temperature membrane (150°C) on system design and cost.
IntroductionA baseline cost estimate for a 50-kW PEM fuel
cell system for passenger vehicles was developed onthe basis of technology available in the year 2000,but using a high production volume scenario(i.e., 500,000 units per year). The baseline systemcost estimate presented here is the first step in amultiyear program to assess the impact oftechnology advances on system cost and to monitorprogress over the next four years. In 2000, we willbe soliciting feedback from system developers andoriginal equipment manufacturers (OEMs), as wellas identifying cost reduction opportunities.
ApproachThe first step in the construction of the baseline
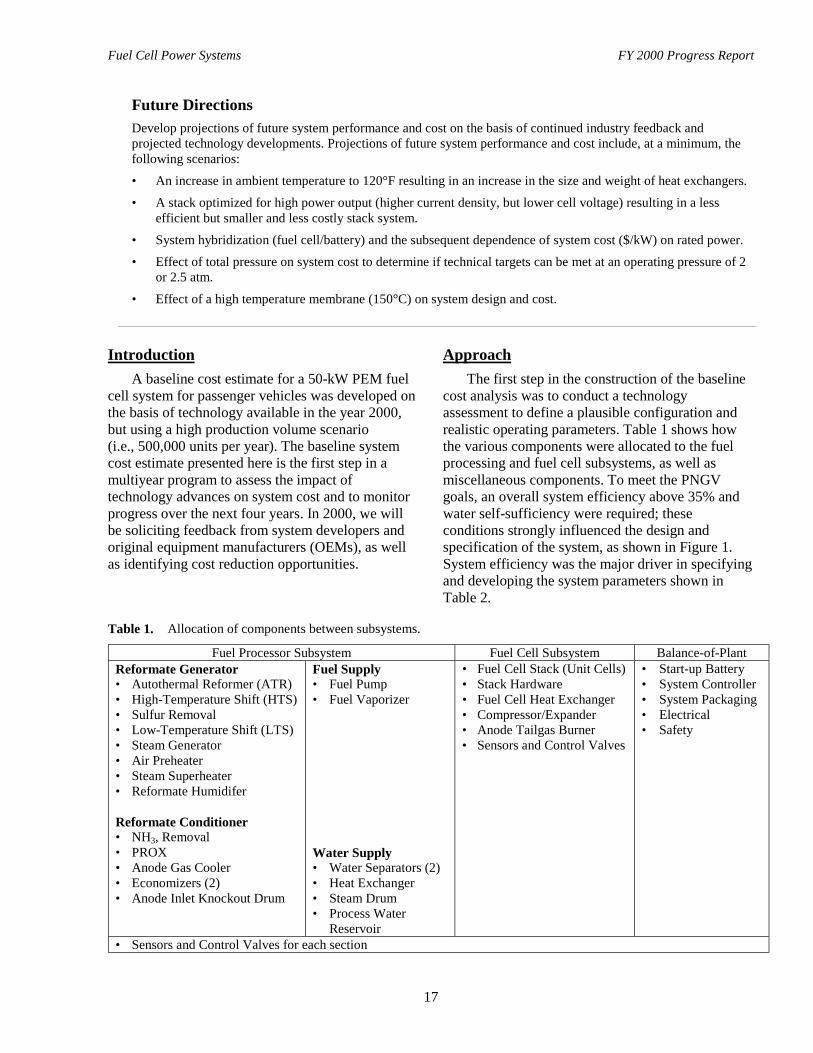
cost analysis was to conduct a technologyassessment to define a plausible configuration andrealistic operating parameters. Table 1 shows howthe various components were allocated to the fuelprocessing and fuel cell subsystems, as well asmiscellaneous components. To meet the PNGVgoals, an overall system efficiency above 35% andwater self-sufficiency were required; theseconditions strongly influenced the design andspecification of the system, as shown in Figure 1.System efficiency was the major driver in specifyingand developing the system parameters shown inTable 2.
Table 1. Allocation of components between subsystems.
Fuel Processor Subsystem Fuel Cell Subsystem Balance-of-PlantReformate Generator• Autothermal Reformer (ATR)• High-Temperature Shift (HTS)• Sulfur Removal• Low-Temperature Shift (LTS)• Steam Generator• Air Preheater• Steam Superheater• Reformate Humidifer
Reformate Conditioner• NH3, Removal• PROX• Anode Gas Cooler• Economizers (2)• Anode Inlet Knockout Drum
Fuel Supply• Fuel Pump• Fuel Vaporizer
Water Supply• Water Separators (2)• Heat Exchanger• Steam Drum• Process Water
Reservoir
• Fuel Cell Stack (Unit Cells)• Stack Hardware• Fuel Cell Heat Exchanger• Compressor/Expander• Anode Tailgas Burner• Sensors and Control Valves
• Start-up Battery• System Controller• System Packaging• Electrical• Safety
• Sensors and Control Valves for each section

Fuel Cell Power Systems FY 2000 Progress Report
18
Figure 1. Block diagram of overall system.
Table 2. Important system parameters and design goals.
System Requirements• Fuel Flexible (gasoline)• System Efficiency >35%• Water self-sufficiency• 3-atm operation• Turbocompressor/Expander
Fuel Cell Module• 50-kW (net) 300 V @ full power• 80°C• Reformate fuel
Fuel Cell Stack• 0.8 V per cell 310 mA/cm2 current density One cooling plate per cell Total power, 56 kWe• 85% H2, utilization
• Specified by DOE Established during technology assessment
The factory cost estimate of the fuel cell systemand components presented in this paper includesfixed and variable manufacturing costs, but itexcludes corporate expenses (e.g., research anddevelopment, sales, marketing, general andadministrative) and profits. A bottom-upmanufacturing model, identifying criticalmanufacturing operations, was used to estimate thecost of major fuel processor and fuel cellcomponents. The cost of the balance of the systemcomponents (e.g. heat exchangers, control valves,sensors) is based on discussions with potentialsuppliers. However, many of the components neededin the system (such as valves and sensors) are notreadily available and will have to be developed.Others are available but will likely require redesign
for high-volume manufacturing. In those cases, thecosts in the model are based on Arthur D. Little’sbest estimates.
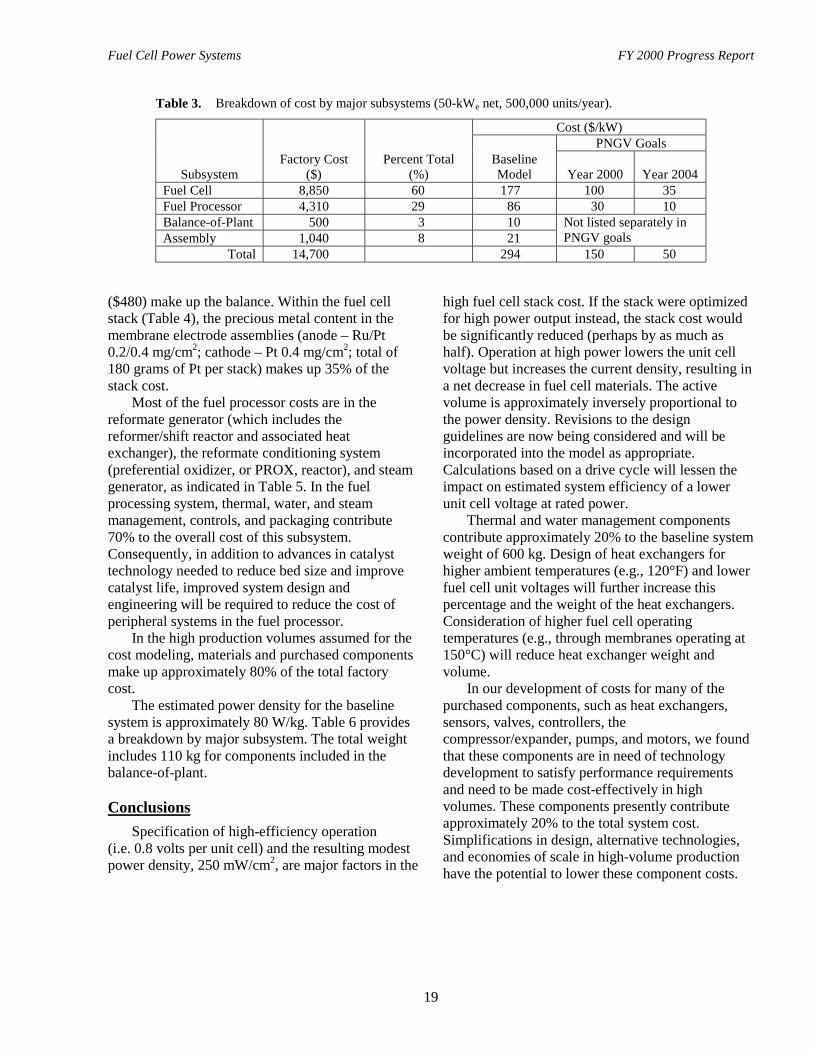
ResultsThe model results indicate that the overall
system cost for the baseline year 2000 is $14,700 (or$294/kW). As shown in Table 3, the cost of the fuelcell subsystem represents 60% of the overall systemcost; the fuel processor subsystem, about 30%; andthe balance-of-plant and assembly, the remaining10%.
The fuel cell stack represents approximately80% of the fuel cell subsystem cost, while theintegrated tailgas burner ($460), compressed airsupply ($860), and stack cooling system
Fuel Cell Power Systems FY 2000 Progress Report
19
Table 3. Breakdown of cost by major subsystems (50-kWe net, 500,000 units/year).
Cost ($/kW)PNGV Goals
SubsystemFactory Cost
($)Percent Total
(%)BaselineModel Year 2000 Year 2004
Fuel Cell 8,850 60 177 100 35Fuel Processor 4,310 29 86 30 10Balance-of-Plant 500 3 10Assembly 1,040 8 21
Not listed separately inPNGV goals
Total 14,700 294 150 50
($480) make up the balance. Within the fuel cellstack (Table 4), the precious metal content in themembrane electrode assemblies (anode – Ru/Pt0.2/0.4 mg/cm2; cathode – Pt 0.4 mg/cm2; total of180 grams of Pt per stack) makes up 35% of thestack cost.
Most of the fuel processor costs are in thereformate generator (which includes thereformer/shift reactor and associated heatexchanger), the reformate conditioning system(preferential oxidizer, or PROX, reactor), and steamgenerator, as indicated in Table 5. In the fuelprocessing system, thermal, water, and steammanagement, controls, and packaging contribute70% to the overall cost of this subsystem.Consequently, in addition to advances in catalysttechnology needed to reduce bed size and improvecatalyst life, improved system design andengineering will be required to reduce the cost ofperipheral systems in the fuel processor.
In the high production volumes assumed for thecost modeling, materials and purchased componentsmake up approximately 80% of the total factorycost.
The estimated power density for the baselinesystem is approximately 80 W/kg. Table 6 providesa breakdown by major subsystem. The total weightincludes 110 kg for components included in thebalance-of-plant.
ConclusionsSpecification of high-efficiency operation
(i.e. 0.8 volts per unit cell) and the resulting modestpower density, 250 mW/cm2, are major factors in the
high fuel cell stack cost. If the stack were optimizedfor high power output instead, the stack cost wouldbe significantly reduced (perhaps by as much ashalf). Operation at high power lowers the unit cellvoltage but increases the current density, resulting ina net decrease in fuel cell materials. The activevolume is approximately inversely proportional tothe power density. Revisions to the designguidelines are now being considered and will beincorporated into the model as appropriate.Calculations based on a drive cycle will lessen theimpact on estimated system efficiency of a lowerunit cell voltage at rated power.
Thermal and water management componentscontribute approximately 20% to the baseline systemweight of 600 kg. Design of heat exchangers forhigher ambient temperatures (e.g., 120°F) and lowerfuel cell unit voltages will further increase thispercentage and the weight of the heat exchangers.Consideration of higher fuel cell operatingtemperatures (e.g., through membranes operating at150°C) will reduce heat exchanger weight andvolume.
In our development of costs for many of thepurchased components, such as heat exchangers,sensors, valves, controllers, thecompressor/expander, pumps, and motors, we foundthat these components are in need of technologydevelopment to satisfy performance requirementsand need to be made cost-effectively in highvolumes. These components presently contributeapproximately 20% to the total system cost.Simplifications in design, alternative technologies,and economies of scale in high-volume productionhave the potential to lower these component costs.

Fuel Cell Power Systems FY 2000 Progress Report
20
Table 4. Breakdown of fuel cell stack costs (50-kWe net, 500,000 units per year).
CostComponent % $ $/kW
Anode and Cathode Layers 50 3,625 75Electrolyte 20 1,310 25
MEA
Gas Diffusion Layers 5 420 5Bipolar Plates 15 1,035 20
Gaskets 5 380 10Other 5 280 5Total 100 7,050 140
Table 5. Breakdown of fuel processor costs (50-kWe net, 500,000 units peryear).
CostComponent % $ $/kWFuel Supply 2 100 2
Reformate Generation 47 2,035 40Reformate Conditioning 24 1,015 20
Water Supply 27 1,160 24Total 100 4,310 86
Table 6. Increased power density of individual subsystems needed to meet PNGVperformance targets (50-kWe net)
Specific Power, Year 2000 (W/kg)
Subsystem Weight (kg)Baseline System
Estimate PNGV TargetFuel Cell 295 169 350
Fuel Processor 215 233 600Total* 620 80 250
*Total includes 110 kg for balance-of-plant components.
Fuel Cell Power Systems FY 2000 Progress Report
21
D. Fuel Cell Systems Analysis
Romesh Kumar (primary contact), E. Danial Doss, Rajesh Ahluwalia, Howard Geyer, andMichael KrumpeltArgonne National Laboratory9700 South Cass AvenueArgonne, IL 60439-4837(630) 252-4342, fax: (630) 252-4176; e-mail: [email protected]
DOE Program Manager: JoAnn Milliken(202) 586-2480, fax: (202) 586-9811, e-mail: [email protected]
Objectives• Identify key design parameters and operating efficiencies.
• Assess design, part-load, and dynamic performance.
• Support U.S. Department of Energy (DOE)/Partnership for a New Generation of Vehicles (PNGV)developmental efforts.
OAAT R&D Plan: Task 8; Barrier J
Approach• Develop, document, and make available an efficient, versatile system design and analysis code.
• Develop models of different fidelity (mechanistic detail).• Apply models and modeling to issues of current interest as they evolve.
Accomplishments• Defined a base-case system for the detailed manufacturing cost study being undertaken by Arthur D. Little, Inc.,
including system configuration, operating conditions, and state points.
• Completed a detailed analysis of a generic autothermal gasoline fuel processor, including effects of reformingtemperature, steam-to-carbon ratio, and operating pressure.
• Analyzed fuel cell vehicles on drive cycles to assess fuel cell performance parameters that are needed to meetPNGV Goal 3, fuel economy up to 80 miles per gallon (mpg).
Future Directions• Influence of vehicle weight and other parameters on onboard fuel storage requirements.
• Effects of revised performance targets for the compressor-expander module.
• Design/configuration issues for high ambient temperatures.
• Component weight and volume trade-offs vs. system parameters and efficiency.
• Additional trade-offs with respect to cost.
Fuel Cell Power Systems FY 2000 Progress Report
22
IntroductionWhile individual developers are addressing
improvements in fuel cells and stacks, fuelprocessors, compressor/expander modules, and otherfuel cell system components, in this work we usemodeling and analysis to address issues of systemintegration, thermal management, design point andpart-load operation, and component, system, andvehicle-level efficiencies and fuel economies. Weprovide modeling results and analytical support toDOE program managers, fuel cell developers, therelevant PNGV technical teams, and otherresearchers in the field.
ApproachFor this work, we use the GCtool software
package developed at Argonne National Laboratory1
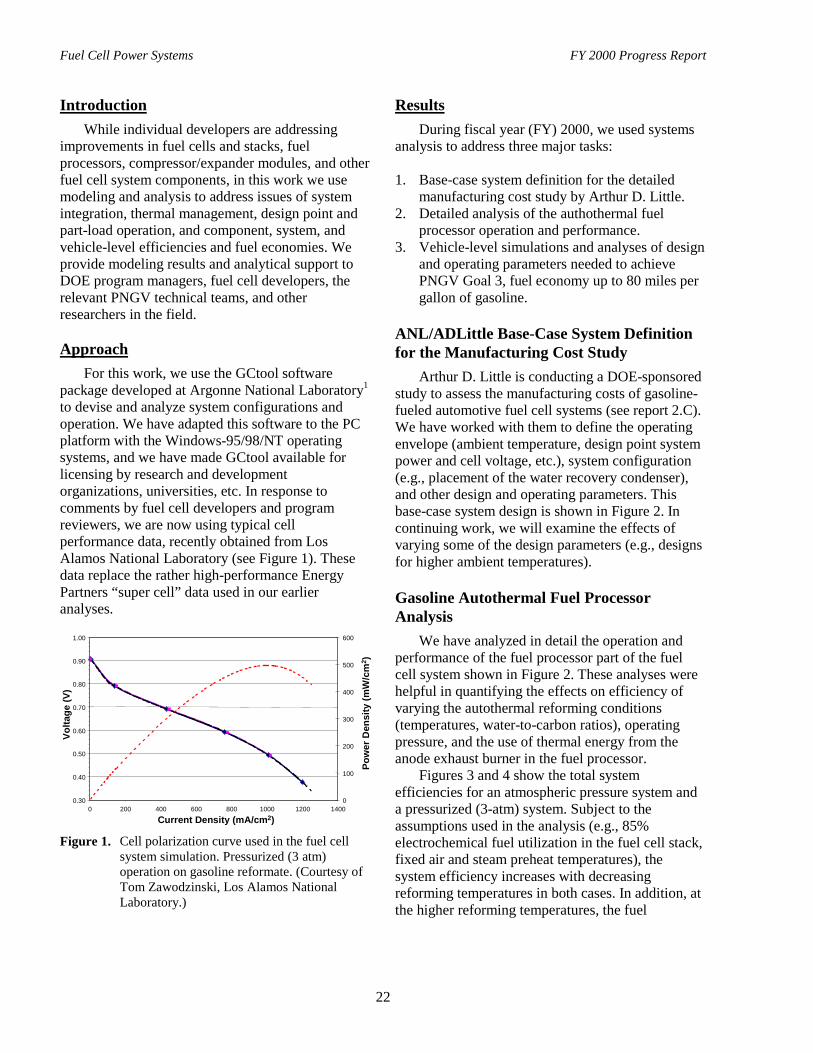
to devise and analyze system configurations andoperation. We have adapted this software to the PCplatform with the Windows-95/98/NT operatingsystems, and we have made GCtool available forlicensing by research and developmentorganizations, universities, etc. In response tocomments by fuel cell developers and programreviewers, we are now using typical cellperformance data, recently obtained from LosAlamos National Laboratory (see Figure 1). Thesedata replace the rather high-performance EnergyPartners “super cell” data used in our earlieranalyses.
0.30
0.40
0.50
0.60
0.70
0.80
0.90
1.00
0 200 400 600 800 1000 1200 1400
Current Density (mA/cm2)
Volta
ge (V
)
0
100
200
300
400
500
600
Pow
er D
ensi
ty (m
W/c
m2 )
Figure 1. Cell polarization curve used in the fuel cellsystem simulation. Pressurized (3 atm)operation on gasoline reformate. (Courtesy ofTom Zawodzinski, Los Alamos NationalLaboratory.)
ResultsDuring fiscal year (FY) 2000, we used systems
analysis to address three major tasks:
1. Base-case system definition for the detailedmanufacturing cost study by Arthur D. Little.
2. Detailed analysis of the authothermal fuelprocessor operation and performance.
3. Vehicle-level simulations and analyses of designand operating parameters needed to achievePNGV Goal 3, fuel economy up to 80 miles pergallon of gasoline.
ANL/ADLittle Base-Case System Definitionfor the Manufacturing Cost Study
Arthur D. Little is conducting a DOE-sponsoredstudy to assess the manufacturing costs of gasoline-fueled automotive fuel cell systems (see report 2.C).We have worked with them to define the operatingenvelope (ambient temperature, design point systempower and cell voltage, etc.), system configuration(e.g., placement of the water recovery condenser),and other design and operating parameters. Thisbase-case system design is shown in Figure 2. Incontinuing work, we will examine the effects ofvarying some of the design parameters (e.g., designsfor higher ambient temperatures).
Gasoline Autothermal Fuel ProcessorAnalysis
We have analyzed in detail the operation andperformance of the fuel processor part of the fuelcell system shown in Figure 2. These analyses werehelpful in quantifying the effects on efficiency ofvarying the autothermal reforming conditions(temperatures, water-to-carbon ratios), operatingpressure, and the use of thermal energy from theanode exhaust burner in the fuel processor.
Figures 3 and 4 show the total systemefficiencies for an atmospheric pressure system anda pressurized (3-atm) system. Subject to theassumptions used in the analysis (e.g., 85%electrochemical fuel utilization in the fuel cell stack,fixed air and steam preheat temperatures), thesystem efficiency increases with decreasingreforming temperatures in both cases. In addition, atthe higher reforming temperatures, the fuel

Fuel Cell Power Systems FY 2000 Progress Report
23
Figu
re 2
. R
efer
ence
syst
em d
esig
n an
d co
nfig
urat
ion
for t
he a
utot
herm
al-r
efor
med
, gas
olin
e-fu
eled
, aut
omot
ive
poly
mer
ele
ctro
lyte
fuel
cel
l sys
tem
.

Fuel Cell Power Systems FY 2000 Progress Report
24
32
34
36
38
40
42
0 1 2 3 4
Water-to-Carbon Ratio (mole)
Syst
em E
ffic
ienc
y (%
)
T_pox= 1300 K,with after-burn
T_pox= 1200 K,with after-burn
T_pox= 1100 K,with after-burn
T_pox= 1000 K,with after-burn
Figure 3. The overall system efficiency as a function ofthe water-to-carbon ratio and reformingtemperature for an atmospheric pressuresystem.
y
32
34
36
38
40
42
0 1 2 3 4
Water-to-Carbon Ratio (mole)
Syst
em E
ffic
ienc
y (%
)
T_pox= 1300 K, with after-burnT_pox= 1300 K, no after-burnT_pox= 1100 K, with after-burnT_pox= 1100 K, no after-burn
Figure 4. Total system efficiency as a function of thewater-to-carbon ratio and reformingtemperature for a pressurized system.
processor efficiency decreases with increasingamounts of water used in the fuel processor. For apressurized fuel cell system, Figure 4 shows that thesystem efficiency actually increases if the thermalenergy at the anode exhaust burner is not used in thefuel processor (but is recovered more effectively inthe expander). Thus, these results show that theoptimum fuel processor design and configurationwould be different for pressurized andnonpressurized fuel cell systems.
Achieving PNGV Goal 3Our earlier modeling results had shown that to
achieve the target efficiencies of 38.4% at ratedpower and 48% at one-fourth of rated power,average operating cell voltages of 0.772 V and
0.896 V would be needed at the respective powerlevels. At these rather high cell voltages, thecorresponding current and power densities in today’sfuel cells are low, requiring a large active area and aconcomitantly high-cost fuel cell stack. Wereanalyzed the gasoline-fueled systems, using themore conservative fuel cell performance curveshown in Figure 1. Vehicle-level analyses were thenconducted for three different vehicles, a lightweightvehicle, a heavier but more aerodynamic vehicle,and a lightweight and aerodynamic vehicle. Forthese vehicles, the fuel economies on the FederalUrban Driving Schedule (FUDS) and highwaycycles, as well as the combined fuel economies,were determined. The key vehicle parameters usedin the analyses are given in Table 1. This table alsoshows that the maximum and average powerrequirements for the three vehicles on the twodriving schedules are approximately 22–35 kW and3–8 kW, respectively.
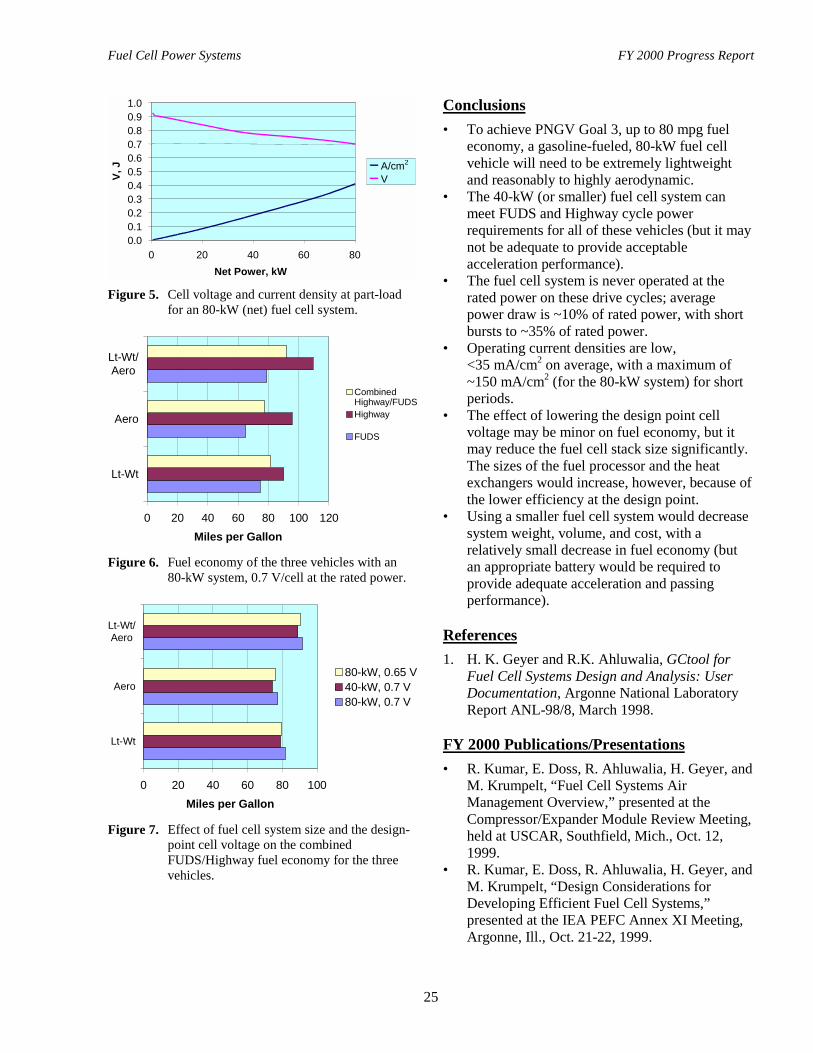
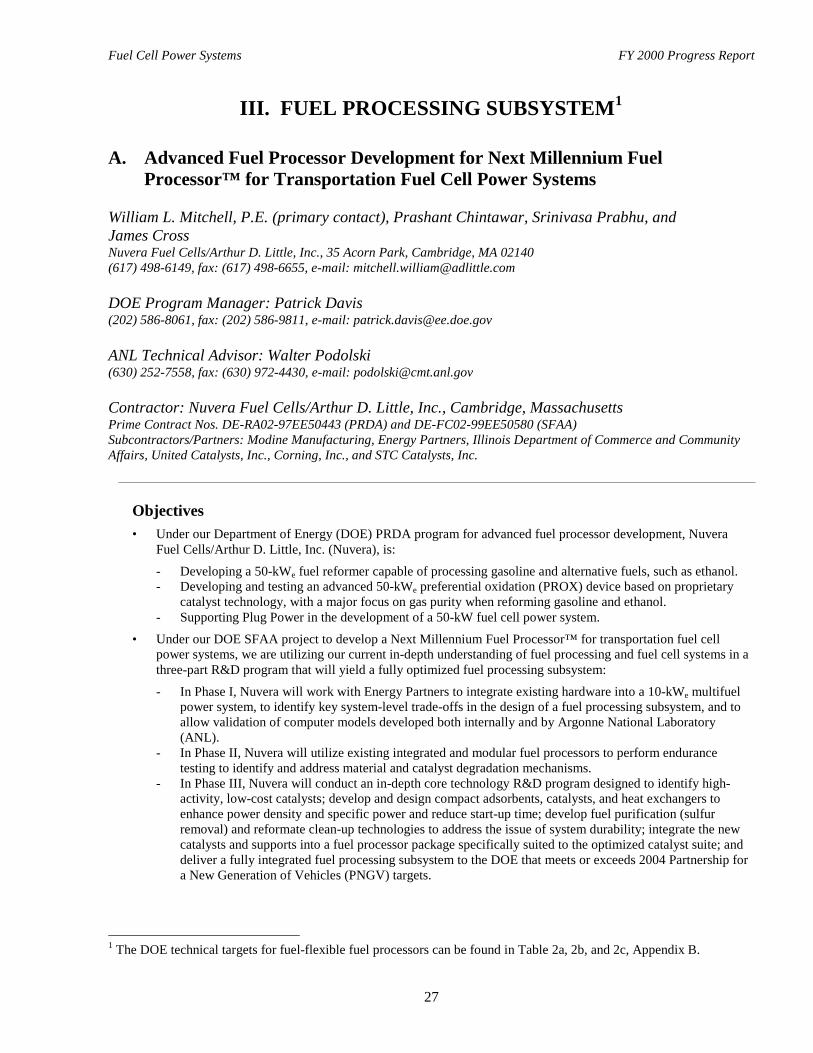
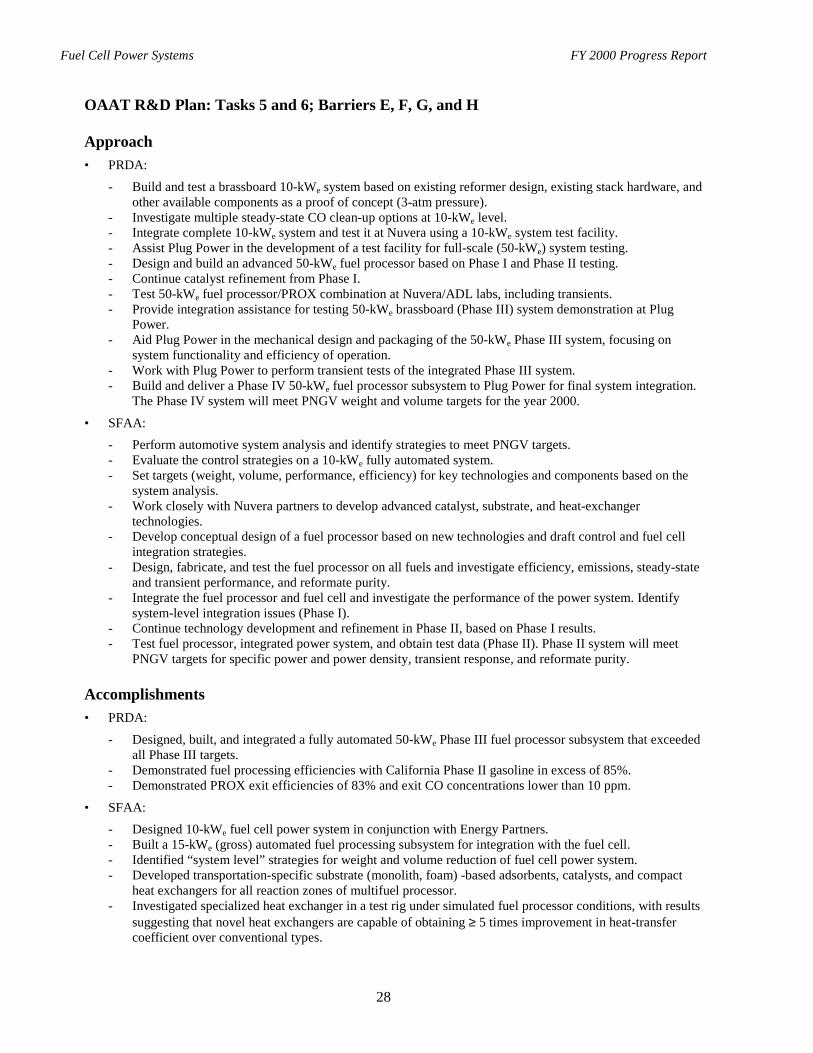
We first analyzed an 80-kW (net) fuel cellsystem, with 0.7 V/cell at the rated power (ratherthan the 0.772 V/cell used in the earlier analyses).Figure 5 shows the cell voltage and thecorresponding current density for part-load operationbetween 0 and 80 kW, as would be needed on theprescribed driving schedules. At the maximumrequired power output of 35 kW or less, the currentdensities are less than ~150 mA/cm2. At the averagepower requirement of <8 kW, the current densitiesare less than ~35 mA/cm2. The combined fueleconomy for the three vehicles is shown in Figure 6.The effect of using a smaller fuel cell system (40 kWinstead of 80 kW), as well as the effect of a lowerdesign-point cell voltage (0.65 V instead of 0.7 V) isshown in Figure 7.
Table 1. Vehicle parameters used in the PNGV Goal 3analyses and the vehicle power requirementsover the FUDS and Highway cycles.
Vehicle
Parameter Lightweight AerodynamicLightweight &Aerodynamic
Test weight, kg 1043 1379 1043Frontal area, m2 2.18 2.18 2.18Drag coefficient 0.25 0.163 0.163Rolling resistance
coefficient0.0064 0.0064 0.0064
Wheel radius, mm 326 326 326Auxiliary power, kW 0.5 0.5 0.5Max (avg) power FUDS,
kW27.7 (3.97) 35.2 (4.54) 27.3 (3.77)
Max (avg) powerHighway, kW
22.9 (8.17) 28.7 (7.68) 22.4 (6.75)
Fuel Cell Power Systems FY 2000 Progress Report
25
0.00.10.20.30.40.50.60.70.80.91.0
0 20 40 60 80Net Power, kW
V, J A/cm2
V
Figure 5. Cell voltage and current density at part-loadfor an 80-kW (net) fuel cell system.
0 20 40 60 80 100 120
Lt-Wt
Aero
Lt-Wt/Aero
Miles per Gallon
CombinedHighway/FUDSHighway
FUDS
Figure 6. Fuel economy of the three vehicles with an80-kW system, 0.7 V/cell at the rated power.
0 20 40 60 80 100
Lt-Wt
Aero
Lt-Wt/Aero
Miles per Gallon
80-kW, 0.65 V40-kW, 0.7 V80-kW, 0.7 V
Figure 7. Effect of fuel cell system size and the design-point cell voltage on the combinedFUDS/Highway fuel economy for the threevehicles.
Conclusions• To achieve PNGV Goal 3, up to 80 mpg fuel
economy, a gasoline-fueled, 80-kW fuel cellvehicle will need to be extremely lightweightand reasonably to highly aerodynamic.
• The 40-kW (or smaller) fuel cell system canmeet FUDS and Highway cycle powerrequirements for all of these vehicles (but it maynot be adequate to provide acceptableacceleration performance).
• The fuel cell system is never operated at therated power on these drive cycles; averagepower draw is ~10% of rated power, with shortbursts to ~35% of rated power.
• Operating current densities are low,<35 mA/cm2 on average, with a maximum of~150 mA/cm2 (for the 80-kW system) for shortperiods.
• The effect of lowering the design point cellvoltage may be minor on fuel economy, but itmay reduce the fuel cell stack size significantly.The sizes of the fuel processor and the heatexchangers would increase, however, because ofthe lower efficiency at the design point.
• Using a smaller fuel cell system would decreasesystem weight, volume, and cost, with arelatively small decrease in fuel economy (butan appropriate battery would be required toprovide adequate acceleration and passingperformance).
References1. H. K. Geyer and R.K. Ahluwalia, GCtool for
Fuel Cell Systems Design and Analysis: UserDocumentation, Argonne National LaboratoryReport ANL-98/8, March 1998.
FY 2000 Publications/Presentations• R. Kumar, E. Doss, R. Ahluwalia, H. Geyer, and
M. Krumpelt, “Fuel Cell Systems AirManagement Overview,” presented at theCompressor/Expander Module Review Meeting,held at USCAR, Southfield, Mich., Oct. 12,1999.
• R. Kumar, E. Doss, R. Ahluwalia, H. Geyer, andM. Krumpelt, “Design Considerations forDeveloping Efficient Fuel Cell Systems,”presented at the IEA PEFC Annex XI Meeting,Argonne, Ill., Oct. 21-22, 1999.

Fuel Cell Power Systems FY 2000 Progress Report
26
• R. Kumar, “Fuel Processing Considerations:Cold Start, Transients, Coking, and RelatedIssues,” presented at the NRC/Fuel Cell ReviewMeeting, held at USCAR, Southfield, Mich.,Jan. 12, 2000.
• E. Doss, R. Ahluwalia, R. Kumar, and M.Krumpelt, “Automotive Fuel Cell SystemDesign Points, Efficiency Targets, and Tradeoffsto Achieve PNGV Goal 3,” presented at the FuelCell Targets Workshop, held in conjunction with
the 2000 Future Car Congress and Exposition,Arlington, Va., April 2-6, 2000.
• E. Doss, R. Ahluwalia, H. Geyer, R. Kumar, andM. Krumpelt, “Transportation Fuel Cell SystemsModeling and Analysis,” presented at the 2000Annual National Laboratory R&D Meeting, FuelCells for Transportation Program, held at PacificNorthwest National Laboratory, Richland,Wash., June 7-8, 2000.
Fuel Cell Power Systems FY 2000 Progress Report
27
III. FUEL PROCESSING SUBSYSTEM1
A. Advanced Fuel Processor Development for Next Millennium FuelProcessor™ for Transportation Fuel Cell Power Systems
William L. Mitchell, P.E. (primary contact), Prashant Chintawar, Srinivasa Prabhu, andJames CrossNuvera Fuel Cells/Arthur D. Little, Inc., 35 Acorn Park, Cambridge, MA 02140(617) 498-6149, fax: (617) 498-6655, e-mail: [email protected]
DOE Program Manager: Patrick Davis(202) 586-8061, fax: (202) 586-9811, e-mail: [email protected]
ANL Technical Advisor: Walter Podolski(630) 252-7558, fax: (630) 972-4430, e-mail: [email protected]
Contractor: Nuvera Fuel Cells/Arthur D. Little, Inc., Cambridge, MassachusettsPrime Contract Nos. DE-RA02-97EE50443 (PRDA) and DE-FC02-99EE50580 (SFAA)Subcontractors/Partners: Modine Manufacturing, Energy Partners, Illinois Department of Commerce and CommunityAffairs, United Catalysts, Inc., Corning, Inc., and STC Catalysts, Inc.
Objectives• Under our Department of Energy (DOE) PRDA program for advanced fuel processor development, Nuvera
Fuel Cells/Arthur D. Little, Inc. (Nuvera), is:
- Developing a 50-kWe fuel reformer capable of processing gasoline and alternative fuels, such as ethanol.- Developing and testing an advanced 50-kWe preferential oxidation (PROX) device based on proprietary
catalyst technology, with a major focus on gas purity when reforming gasoline and ethanol.- Supporting Plug Power in the development of a 50-kW fuel cell power system.
• Under our DOE SFAA project to develop a Next Millennium Fuel Processor™ for transportation fuel cellpower systems, we are utilizing our current in-depth understanding of fuel processing and fuel cell systems in athree-part R&D program that will yield a fully optimized fuel processing subsystem:
- In Phase I, Nuvera will work with Energy Partners to integrate existing hardware into a 10-kWe multifuelpower system, to identify key system-level trade-offs in the design of a fuel processing subsystem, and toallow validation of computer models developed both internally and by Argonne National Laboratory(ANL).
- In Phase II, Nuvera will utilize existing integrated and modular fuel processors to perform endurancetesting to identify and address material and catalyst degradation mechanisms.
- In Phase III, Nuvera will conduct an in-depth core technology R&D program designed to identify high-activity, low-cost catalysts; develop and design compact adsorbents, catalysts, and heat exchangers toenhance power density and specific power and reduce start-up time; develop fuel purification (sulfurremoval) and reformate clean-up technologies to address the issue of system durability; integrate the newcatalysts and supports into a fuel processor package specifically suited to the optimized catalyst suite; anddeliver a fully integrated fuel processing subsystem to the DOE that meets or exceeds 2004 Partnership fora New Generation of Vehicles (PNGV) targets.
1 The DOE technical targets for fuel-flexible fuel processors can be found in Table 2a, 2b, and 2c, Appendix B.
Fuel Cell Power Systems FY 2000 Progress Report
28
OAAT R&D Plan: Tasks 5 and 6; Barriers E, F, G, and H
Approach• PRDA:
- Build and test a brassboard 10-kWe system based on existing reformer design, existing stack hardware, andother available components as a proof of concept (3-atm pressure).
- Investigate multiple steady-state CO clean-up options at 10-kWe level.- Integrate complete 10-kWe system and test it at Nuvera using a 10-kWe system test facility.- Assist Plug Power in the development of a test facility for full-scale (50-kWe) system testing.- Design and build an advanced 50-kWe fuel processor based on Phase I and Phase II testing.- Continue catalyst refinement from Phase I.- Test 50-kWe fuel processor/PROX combination at Nuvera/ADL labs, including transients.- Provide integration assistance for testing 50-kWe brassboard (Phase III) system demonstration at Plug
Power.- Aid Plug Power in the mechanical design and packaging of the 50-kWe Phase III system, focusing on
system functionality and efficiency of operation.- Work with Plug Power to perform transient tests of the integrated Phase III system.- Build and deliver a Phase IV 50-kWe fuel processor subsystem to Plug Power for final system integration.
The Phase IV system will meet PNGV weight and volume targets for the year 2000.
• SFAA:- Perform automotive system analysis and identify strategies to meet PNGV targets.- Evaluate the control strategies on a 10-kWe fully automated system.- Set targets (weight, volume, performance, efficiency) for key technologies and components based on the
system analysis.- Work closely with Nuvera partners to develop advanced catalyst, substrate, and heat-exchanger
technologies.- Develop conceptual design of a fuel processor based on new technologies and draft control and fuel cell
integration strategies.- Design, fabricate, and test the fuel processor on all fuels and investigate efficiency, emissions, steady-state
and transient performance, and reformate purity.- Integrate the fuel processor and fuel cell and investigate the performance of the power system. Identify
system-level integration issues (Phase I).- Continue technology development and refinement in Phase II, based on Phase I results.- Test fuel processor, integrated power system, and obtain test data (Phase II). Phase II system will meet
PNGV targets for specific power and power density, transient response, and reformate purity.
Accomplishments• PRDA:
- Designed, built, and integrated a fully automated 50-kWe Phase III fuel processor subsystem that exceededall Phase III targets.
- Demonstrated fuel processing efficiencies with California Phase II gasoline in excess of 85%.- Demonstrated PROX exit efficiencies of 83% and exit CO concentrations lower than 10 ppm.
• SFAA:- Designed 10-kWe fuel cell power system in conjunction with Energy Partners.- Built a 15-kWe (gross) automated fuel processing subsystem for integration with the fuel cell.- Identified “system level” strategies for weight and volume reduction of fuel cell power system.- Developed transportation-specific substrate (monolith, foam) -based adsorbents, catalysts, and compact
heat exchangers for all reaction zones of multifuel processor.- Investigated specialized heat exchanger in a test rig under simulated fuel processor conditions, with results
suggesting that novel heat exchangers are capable of obtaining ≥ 5 times improvement in heat-transfercoefficient over conventional types.

Fuel Cell Power Systems FY 2000 Progress Report
29
- Developed a compact gasoline desulfurizer, designed for 5,000 miles at change-out.- Performed catalyst studies in disintegrated fuel processor at 130-kWth firing rate. Results show that the new
catalysts have about an order of magnitude lower thermal mass and pressure drop, and need about an orderof magnitude lower contact time, than the conventional catalysts.
- Established that with advanced technologies, ≥ 750 W/L power density and ≤ 2 min start-up time should beattainable for the fuel cell power system, and other PNGV targets can be met or exceeded.
Future Directions• PRDA:
- Integrate Phase III unit with 60-kWe stack from Plug Power and evaluate system efficiency and thermaland water balance issues.
- Develop Phase IV fuel processing system, based on performance of the Phase III integrated system.
• SFAA:
- Integrate 15-kWe fuel processing system with Energy Partners’ stack.- Conduct detailed system trade-off and control strategy evaluation.- Commence conceptual and detailed design of 50-kWe fuel cell power system.- Improve core technology and system models to fully exploit the benefits of lightweight and low-thermal-
mass media.
IntroductionNuvera Fuel Cells (NFC) is a leading supplier of
fuel cell power systems in the stationary andtransportation markets. Widespread implementationof fuel cell systems requires significantimprovements in many aspects of the technology,including power density, specific power, response,efficiency, and cost. In addition, the ability tooperate on a number of hydrocarbon fuels that areavailable through the existing infrastructure is a keyenabler for commercializing fuel cell systems. NFCis working with the DOE to develop efficient, low-emission multifuel processors for transportationapplications. The fuels include gasoline, methanol,ethanol, and natural gas.
In the PRDA program, NFC is developingreformer subsystems (fuel processor, CO clean-up,and exhaust clean-up) and integrating them with fuelcells for system-level evaluation of issues likeefficiency, water balance, transient response,thermal integration, and parasitic power. The resultsof this program will identify and quantify the keytechnology challenges that need to be addressed indeveloping fuel processing systems for automotiveapplications. The deliverable of the program is anintegrated power system that meets PNGV targetsfor year 2000.
In the SFAA program, the challenges identifiedin the PRDA program will be addressed through anintensive technology development program.
Catalysis, novel heat-exchange media, and theirintegration will be developed through internal effortsand partnerships with leading companies in thisfield. Two generations of fuel processors will bedeveloped and tested with fuel cells. The deliverableof this program is an integrated fuel processingsystem that exceeds PNGV targets for year 2004.
PRDA Phase III ResultsThe performance targets for the Nuvera
Phase III fuel processor are shown in Table 1. Themeasured performance of the Phase III fuelprocessing system is shown in Figures 1 and 2. Theoverall efficiency of the fuel processor is defined asthe LHV of hydrogen output of the fuel processordivided by the LHV of fuel input.
Table 1. PRDA Phase III fuel processor system targets.
Fuel Processor (kW) 175 40 18Overall Fuel ProcessorEfficiency, % 68 68 55
Exit Hydrogen FlowConcentration, % 35 35 28
Exit Hydrogen FlowRate, kg/hr 3.65 0.81 0.3
Pressure Drop, psi 5 2 1Emissions < Tier II < Tier II < Tier IIParasitics, kW 0.5 0.2 0.2
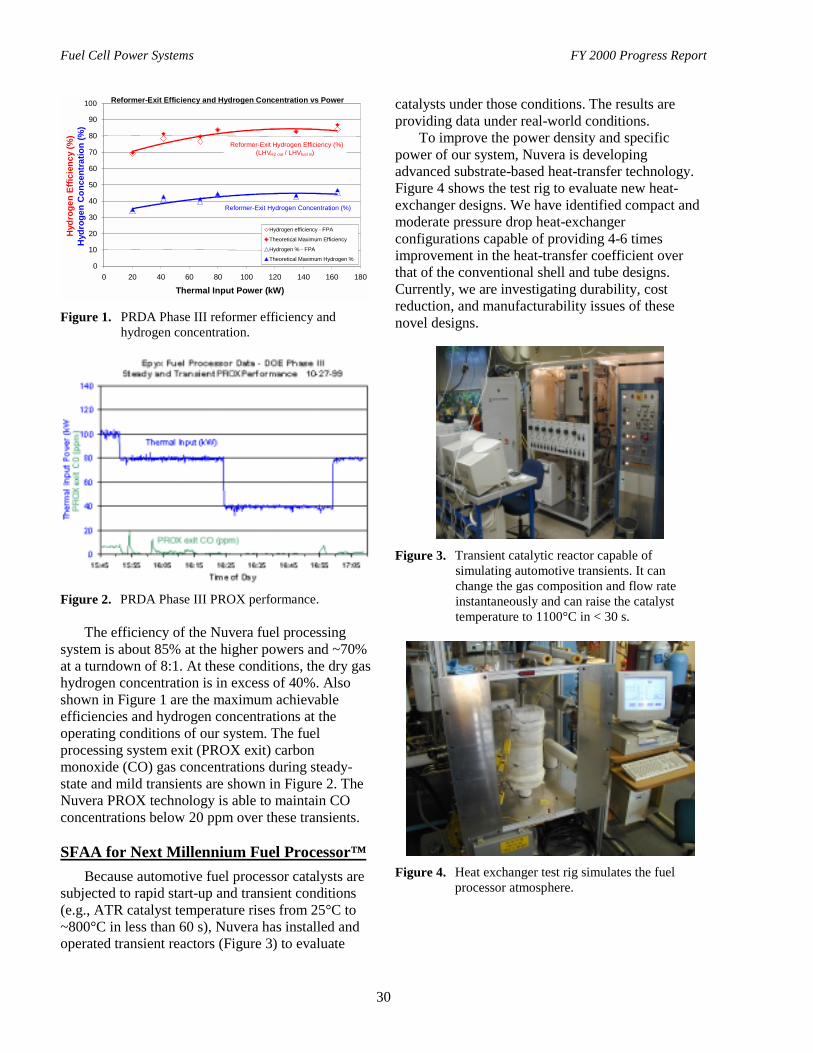
Fuel Cell Power Systems FY 2000 Progress Report
30
Reformer-Exit Efficiency and Hydrogen Concentration vs Power
0
10
20
30
40
50
60
70
80
90
100
0 20 40 60 80 100 120 140 160 180
Thermal Input Power (kW)
Hyd
roge
n Ef
ficie
ncy
(%)
Hyd
roge
n C
once
ntra
tion
(%)
Hydrogen efficiency - FPA
Theoretical Maximum Efficiency
Hydrogen % - FPA
Theoretical Maximum Hydrogen %
Reformer-Exit Hydrogen Concentration (%)
Reformer-Exit Hydrogen Efficiency (%)(LHVH2 out / LHVfuel in)
Figure 1. PRDA Phase III reformer efficiency andhydrogen concentration.
Figure 2. PRDA Phase III PROX performance.
The efficiency of the Nuvera fuel processingsystem is about 85% at the higher powers and ~70%at a turndown of 8:1. At these conditions, the dry gashydrogen concentration is in excess of 40%. Alsoshown in Figure 1 are the maximum achievableefficiencies and hydrogen concentrations at theoperating conditions of our system. The fuelprocessing system exit (PROX exit) carbonmonoxide (CO) gas concentrations during steady-state and mild transients are shown in Figure 2. TheNuvera PROX technology is able to maintain COconcentrations below 20 ppm over these transients.
SFAA for Next Millennium Fuel Processor™Because automotive fuel processor catalysts are
subjected to rapid start-up and transient conditions(e.g., ATR catalyst temperature rises from 25°C to~800°C in less than 60 s), Nuvera has installed andoperated transient reactors (Figure 3) to evaluate
catalysts under those conditions. The results areproviding data under real-world conditions.
To improve the power density and specificpower of our system, Nuvera is developingadvanced substrate-based heat-transfer technology.Figure 4 shows the test rig to evaluate new heat-exchanger designs. We have identified compact andmoderate pressure drop heat-exchangerconfigurations capable of providing 4-6 timesimprovement in the heat-transfer coefficient overthat of the conventional shell and tube designs.Currently, we are investigating durability, costreduction, and manufacturability issues of thesenovel designs.
Figure 3. Transient catalytic reactor capable ofsimulating automotive transients. It canchange the gas composition and flow rateinstantaneously and can raise the catalysttemperature to 1100°C in < 30 s.
Figure 4. Heat exchanger test rig simulates the fuelprocessor atmosphere.
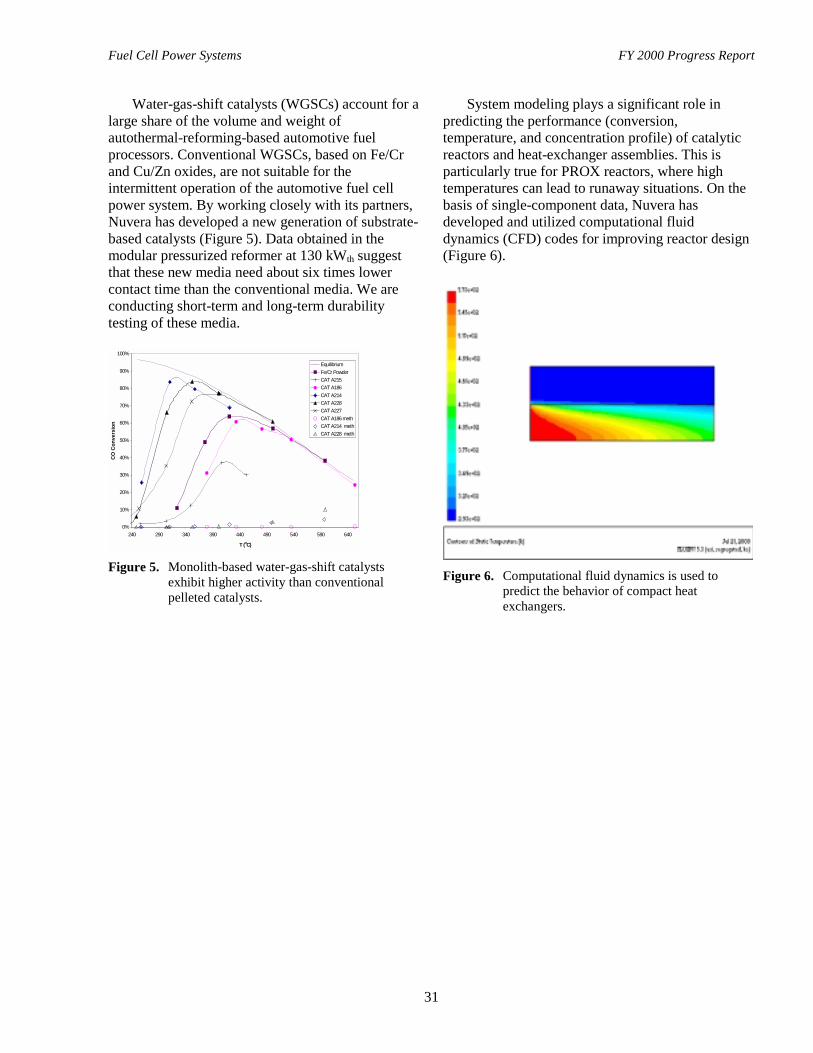
Fuel Cell Power Systems FY 2000 Progress Report
31
Water-gas-shift catalysts (WGSCs) account for alarge share of the volume and weight ofautothermal-reforming-based automotive fuelprocessors. Conventional WGSCs, based on Fe/Crand Cu/Zn oxides, are not suitable for theintermittent operation of the automotive fuel cellpower system. By working closely with its partners,Nuvera has developed a new generation of substrate-based catalysts (Figure 5). Data obtained in themodular pressurized reformer at 130 kWth suggestthat these new media need about six times lowercontact time than the conventional media. We areconducting short-term and long-term durabilitytesting of these media.
0%
10%
20%
30%
40%
50%
60%
70%
80%
90%
100%
240 290 340 390 440 490 540 590 640
T (oC)
CO
Con
vers
ion
EquilibriumFe/Cr PowderCAT A215CAT A186CAT A214CAT A228CAT A227CAT A186 methCAT A214 methCAT A228 meth
Figure 5. Monolith-based water-gas-shift catalystsexhibit higher activity than conventionalpelleted catalysts.
System modeling plays a significant role inpredicting the performance (conversion,temperature, and concentration profile) of catalyticreactors and heat-exchanger assemblies. This isparticularly true for PROX reactors, where hightemperatures can lead to runaway situations. On thebasis of single-component data, Nuvera hasdeveloped and utilized computational fluiddynamics (CFD) codes for improving reactor design(Figure 6).
Figure 6. Computational fluid dynamics is used topredict the behavior of compact heatexchangers.

Fuel Cell Power Systems FY 2000 Progress Report
32
B. Multifuel Processor for Fuel Cell Electric-Vehicle Applications
Tom Flynn (primary contact)McDermott Technology, Inc.1562 Beeson StreetAlliance, OH 44601-2196(330) 829-7622, fax: (330) 829-7283, e-mail:[email protected]
Brian Engleman (subcontractor)Catalytica Advanced Technologies430 Ferguson DriveMountain View, CA 94043-5272(650) 940-6391, fax: (650) 968-7129, e-mail: [email protected]
DOE Program Manager: Nancy Garland(202) 586-5673, fax: (202) 586-9811, e-mail: [email protected]
ANL Technical Advisor: Walter Podolski(630) 252-7558, fax: (630) 972-4430, e-mail: [email protected]
Contractor: McDermott Technology, Inc., Alliance, OhioPrime Contract No. DE-FC02-99EE50586, June 1999-September 2001
ObjectivesDesign, build, and demonstrate a fully integrated, 50-kWe catalytic fuel processor system. The fuel processor willproduce a hydrogen-rich gas for direct use in polymer electrolyte membrane (PEM) fuel cell systems for electric-vehicle applications.
OAAT R&D Plan: Task 5; Barriers E, F, G, and H
Approach• Develop preliminary design of 50-kWe fuel processor system, as well as performance goals for individual
components.• Evaluate alternative approaches for the major catalytic components (e.g., desulfurizer, reformer, shift reactor,
and selective oxidation reactor).
• Conduct subsystem testing of major components, utilizing best catalyst approach.
• Develop final design of overall system and design specifications for individual components.
• Assemble 50-kWe fuel processor system.
• Perform demonstration testing, using gasoline and methanol as fuels.
• Ship fuel processor system to Argonne National Laboratory (ANL).
Accomplishments• Developed process flow models for single-catalyst bed autothermal reformer (ATR) and plate reformer designs.
• Demonstrated liquid-phase gasoline desulfurizer that uses specifically tailored zeolitic adsorbents.
• Performed screening tests for candidate ATR catalysts and plate reforming catalysts.
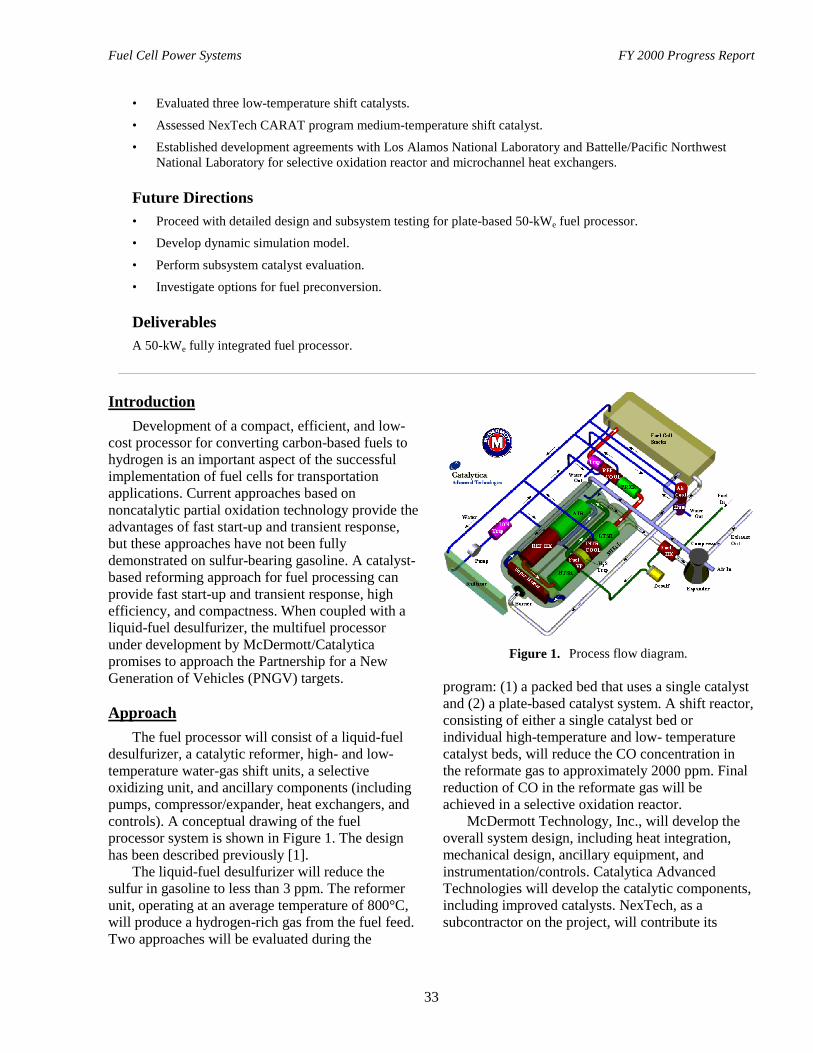
Fuel Cell Power Systems FY 2000 Progress Report
33
• Evaluated three low-temperature shift catalysts.
• Assessed NexTech CARAT program medium-temperature shift catalyst.
• Established development agreements with Los Alamos National Laboratory and Battelle/Pacific NorthwestNational Laboratory for selective oxidation reactor and microchannel heat exchangers.
Future Directions• Proceed with detailed design and subsystem testing for plate-based 50-kWe fuel processor.
• Develop dynamic simulation model.
• Perform subsystem catalyst evaluation.
• Investigate options for fuel preconversion.
DeliverablesA 50-kWe fully integrated fuel processor.
IntroductionDevelopment of a compact, efficient, and low-
cost processor for converting carbon-based fuels tohydrogen is an important aspect of the successfulimplementation of fuel cells for transportationapplications. Current approaches based onnoncatalytic partial oxidation technology provide theadvantages of fast start-up and transient response,but these approaches have not been fullydemonstrated on sulfur-bearing gasoline. A catalyst-based reforming approach for fuel processing canprovide fast start-up and transient response, highefficiency, and compactness. When coupled with aliquid-fuel desulfurizer, the multifuel processorunder development by McDermott/Catalyticapromises to approach the Partnership for a NewGeneration of Vehicles (PNGV) targets.
ApproachThe fuel processor will consist of a liquid-fuel
desulfurizer, a catalytic reformer, high- and low-temperature water-gas shift units, a selectiveoxidizing unit, and ancillary components (includingpumps, compressor/expander, heat exchangers, andcontrols). A conceptual drawing of the fuelprocessor system is shown in Figure 1. The designhas been described previously [1].
The liquid-fuel desulfurizer will reduce thesulfur in gasoline to less than 3 ppm. The reformerunit, operating at an average temperature of 800°C,will produce a hydrogen-rich gas from the fuel feed.Two approaches will be evaluated during the
Figure 1. Process flow diagram.
program: (1) a packed bed that uses a single catalystand (2) a plate-based catalyst system. A shift reactor,consisting of either a single catalyst bed orindividual high-temperature and low- temperaturecatalyst beds, will reduce the CO concentration inthe reformate gas to approximately 2000 ppm. Finalreduction of CO in the reformate gas will beachieved in a selective oxidation reactor.
McDermott Technology, Inc., will develop theoverall system design, including heat integration,mechanical design, ancillary equipment, andinstrumentation/controls. Catalytica AdvancedTechnologies will develop the catalytic components,including improved catalysts. NexTech, as asubcontractor on the project, will contribute its

Fuel Cell Power Systems FY 2000 Progress Report
34
expertise and technology in the area of shiftcatalysts. The program consists of five major tasks:preliminary design, catalyst development, subsystemtesting, final design, and prototype assembly anddemonstration.
ResultsDuring this reporting period, the first two tasks
were completed.
Preliminary DesignSteady-state ASPEN process simulation models
were generated for the catalyst-bed and plate-reformer concepts. The system using the catalyst-bed concept had a predicted efficiency of 87% at25% load, assuming 70% hydrogen utilization in thefuel cell and 50% fuel-cell efficiency. Actualperformance data for the fuel pump, humidifier,compressor/expander, and fuel cell wereincorporated into the simulation model. The systempower density and specific power are 564 W/L and316 W/kg, respectively. The compressor/expander,humidification system, and start-up burner areincluded in the fuel processor scope.
The plate concept showed a comparable systemefficiency. The plate approach yields a smaller-sizesystem with comparable weight.
For both systems, the heat-exchanger types andsizes have been selected. A control system vendorhas also been selected.
Catalyst Development
DesulfurizerWe demonstrated removal of thiophenes and
methyl-substituted thiophenes from aromaticsolvents by using zeolitic adsorbents. Thethiophenes are most difficult to remove because ofsteric hindrance around sulfur and competitiveadsorption by aromatics. A typical adsorptionprofile, illustrating the adsorption of thiophene witha low-aluminum ZSM5 zeolite, is shown in Figure 2.Proprietary modifications of zeolites provided thebest performance. We obtained promising resultswith California CARB Phase 2 gasoline (30 ppmsulfur reduced to < 3 ppm sulfur).
Adsorption Profile For Low-Aluminum ZSM5 ZeoliteFeed: 1% S (as Thiophene) in Toluene at 60ºC
0.0
0.2
0.4
0.6
0.8
1.0
1.2
0 0.002 0.004 0.006 0.008 0.01 0.012 0.014 0.016 0.018
g Sulfur Fed / g Adsorbent
Sulfu
r in
Efflu
ent /
Sul
fur i
n Fe
ed
BreakthroughPoint
Figure 2. Typical adsorption profile.
Reforming CatalystWe completed a successful 100-hour test with
California CARB gasoline. The catalystdemonstrated a capacity of approximately 5 kWe/kg.Equilibrium conversions were maintainedthroughout the run (Figure 3.)
We also demonstrated the feasibility of usingCatalytica’s Xonon™ combustion catalyst, incombination with a reforming catalyst, in the platearrangement.
An evaluation of the advantages anddisadvantages of the two approaches was made. Theresults are summarized in Table 1.
0
10
20
30
40
50
60
70
0 1 2 3Time, h
Com
posi
tion,
% H2
CO
CO2
CH4
H2 eq.
CO eg
CO2 eq.
CH4 eq.
Feed, ml/min: N2-64;O2-16;Fuel-0.04,H2O-0.04. H2O/fuel=9.2; O2/fuel=2.9. P=11 psig
Tin=529oC, Tcen=697oC, Tout=800oC.Productivity: 1mol H2/kg min (1.7 kW/kg)
Figure 3. Approach to equilibrium for CatalyticaATR-10 catalyst.
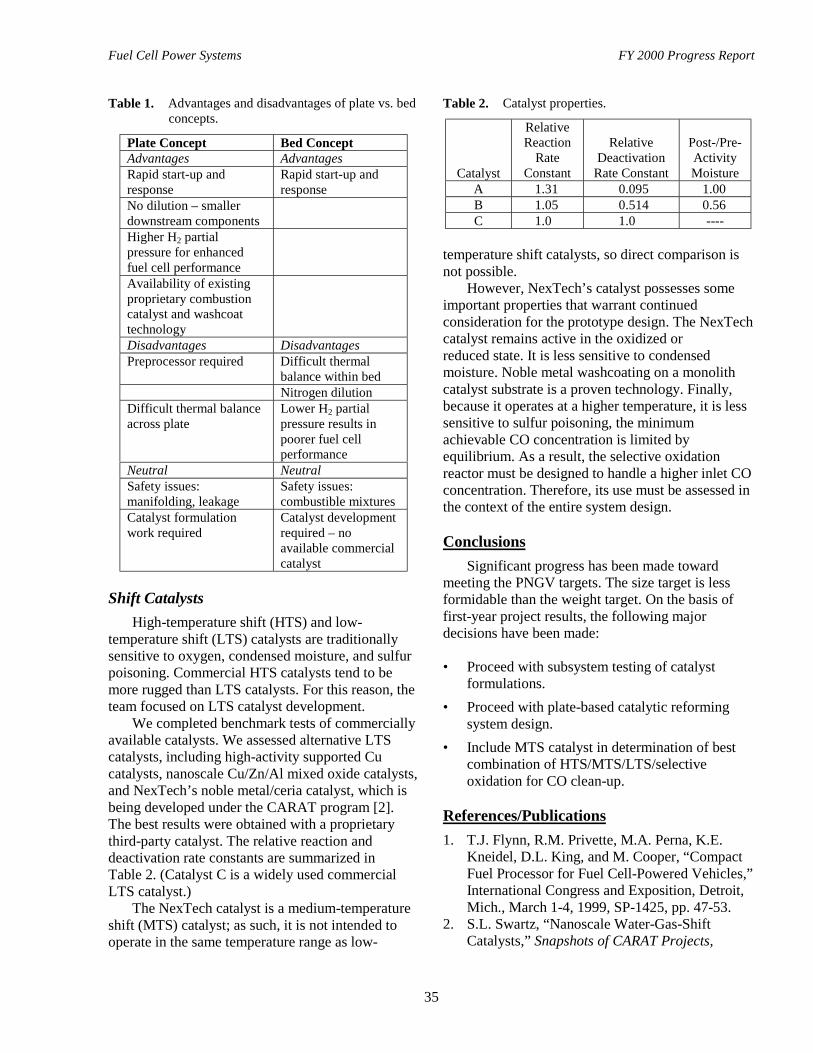
Fuel Cell Power Systems FY 2000 Progress Report
35
Table 1. Advantages and disadvantages of plate vs. bedconcepts.
Plate Concept Bed ConceptAdvantages AdvantagesRapid start-up andresponse
Rapid start-up andresponse
No dilution – smallerdownstream componentsHigher H2 partialpressure for enhancedfuel cell performanceAvailability of existingproprietary combustioncatalyst and washcoattechnologyDisadvantages DisadvantagesPreprocessor required Difficult thermal
balance within bedNitrogen dilution
Difficult thermal balanceacross plate
Lower H2 partialpressure results inpoorer fuel cellperformance
Neutral NeutralSafety issues:manifolding, leakage
Safety issues:combustible mixtures
Catalyst formulationwork required
Catalyst developmentrequired – noavailable commercialcatalyst
Shift CatalystsHigh-temperature shift (HTS) and low-
temperature shift (LTS) catalysts are traditionallysensitive to oxygen, condensed moisture, and sulfurpoisoning. Commercial HTS catalysts tend to bemore rugged than LTS catalysts. For this reason, theteam focused on LTS catalyst development.
We completed benchmark tests of commerciallyavailable catalysts. We assessed alternative LTScatalysts, including high-activity supported Cucatalysts, nanoscale Cu/Zn/Al mixed oxide catalysts,and NexTech’s noble metal/ceria catalyst, which isbeing developed under the CARAT program [2].The best results were obtained with a proprietarythird-party catalyst. The relative reaction anddeactivation rate constants are summarized inTable 2. (Catalyst C is a widely used commercialLTS catalyst.)
The NexTech catalyst is a medium-temperatureshift (MTS) catalyst; as such, it is not intended tooperate in the same temperature range as low-
Table 2. Catalyst properties.
Catalyst
RelativeReaction
RateConstant
RelativeDeactivation
Rate Constant
Post-/Pre-ActivityMoisture
A 1.31 0.095 1.00B 1.05 0.514 0.56C 1.0 1.0 ----
temperature shift catalysts, so direct comparison isnot possible.
However, NexTech’s catalyst possesses someimportant properties that warrant continuedconsideration for the prototype design. The NexTechcatalyst remains active in the oxidized orreduced state. It is less sensitive to condensedmoisture. Noble metal washcoating on a monolithcatalyst substrate is a proven technology. Finally,because it operates at a higher temperature, it is lesssensitive to sulfur poisoning, the minimumachievable CO concentration is limited byequilibrium. As a result, the selective oxidationreactor must be designed to handle a higher inlet COconcentration. Therefore, its use must be assessed inthe context of the entire system design.
ConclusionsSignificant progress has been made toward
meeting the PNGV targets. The size target is lessformidable than the weight target. On the basis offirst-year project results, the following majordecisions have been made:
• Proceed with subsystem testing of catalystformulations.
• Proceed with plate-based catalytic reformingsystem design.
• Include MTS catalyst in determination of bestcombination of HTS/MTS/LTS/selectiveoxidation for CO clean-up.
References/Publications1. T.J. Flynn, R.M. Privette, M.A. Perna, K.E.
Kneidel, D.L. King, and M. Cooper, “CompactFuel Processor for Fuel Cell-Powered Vehicles,”International Congress and Exposition, Detroit,Mich., March 1-4, 1999, SP-1425, pp. 47-53.
2. S.L. Swartz, “Nanoscale Water-Gas-ShiftCatalysts,” Snapshots of CARAT Projects,
Fuel Cell Power Systems FY 2000 Progress Report
36
Phase 2, published by Argonne NationalLaboratory, Transportation Technology R&DCenter, March 2000, pp. 11-12.
C. Fuel-Flexible, UOB™ Fuel Processor System: Development and Status
Richard Woods (primary contact), John Cuzens, and Josh MauzeyHydrogen Burner Technology, Inc.3925 Vernon StreetLong Beach, CA 90815(562) 597-2442, fax: (562) 597-8780, e-mail: [email protected]
DOE Program Manager: Patrick Davis(202) 586-8061, fax: (202) 586-9811, e-mail: [email protected]
ANL Technical Advisor: William Swift(630) 252-5964, fax: (630) 252-4176, e-mail: [email protected]
Contractor: Hydrogen Burner Technology, Long Beach, CaliforniaPrime Contract No. DE-FC02-97EE50482, October 1997-December 1999
Objectives• Research, develop, assemble, and test a 50-kWe net (12-kWe nominal), fuel-flexible fuel-processing (F3P)
subsystem.
• Conduct performance mapping of the subsystem on various fuels, including natural gas, gasoline, ethanol, andmethanol.
• Verify the humidified low-temperature shift (HLTS) concept and assess its applicability.
• Coordinate with fuel cell system developers in preparation for system-level integration activities.
OAAT R&D Plan: Task 5; Barriers E, F, G, and H
ApproachThis program includes process and hardware design for a F3P subsystem, assessment of alternative materials andcatalysts, fabrication of integrated hardware assemblies, and evaluation of alternative carbon monoxide (CO)polishing approaches.
• The hardware design approach selected for the prototype F3P subsystem includes three assemblies – the F3Passembly, fuel vaporizer assembly, and CO polishing assembly. A breadboard control package is also includedto allow automatic control of the subsystem.
• The F3P assembly integrates the primary systems/functions required for a fuel processor – reformer reactor,thermal management, shift reactors, and integrated steam generation.
• The fuel vaporizer assembly integrates the functions of fuel vaporization and anode off-gas combustion.• The CO polishing concepts being evaluated include methanation and preferential oxidation (PROX) of CO.
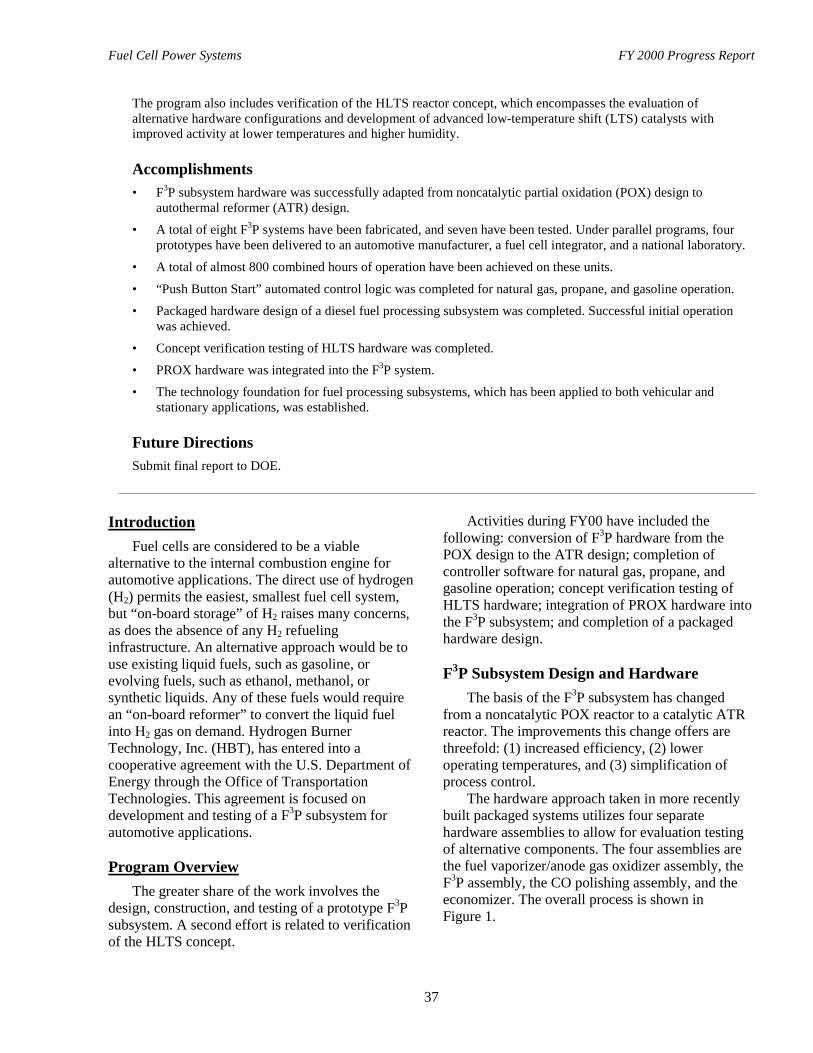
Fuel Cell Power Systems FY 2000 Progress Report
37
The program also includes verification of the HLTS reactor concept, which encompasses the evaluation ofalternative hardware configurations and development of advanced low-temperature shift (LTS) catalysts withimproved activity at lower temperatures and higher humidity.
Accomplishments• F3P subsystem hardware was successfully adapted from noncatalytic partial oxidation (POX) design to
autothermal reformer (ATR) design.
• A total of eight F3P systems have been fabricated, and seven have been tested. Under parallel programs, fourprototypes have been delivered to an automotive manufacturer, a fuel cell integrator, and a national laboratory.
• A total of almost 800 combined hours of operation have been achieved on these units.
• “Push Button Start” automated control logic was completed for natural gas, propane, and gasoline operation.
• Packaged hardware design of a diesel fuel processing subsystem was completed. Successful initial operationwas achieved.
• Concept verification testing of HLTS hardware was completed.
• PROX hardware was integrated into the F3P system.
• The technology foundation for fuel processing subsystems, which has been applied to both vehicular andstationary applications, was established.
Future DirectionsSubmit final report to DOE.
IntroductionFuel cells are considered to be a viable
alternative to the internal combustion engine forautomotive applications. The direct use of hydrogen(H2) permits the easiest, smallest fuel cell system,but “on-board storage” of H2 raises many concerns,as does the absence of any H2 refuelinginfrastructure. An alternative approach would be touse existing liquid fuels, such as gasoline, orevolving fuels, such as ethanol, methanol, orsynthetic liquids. Any of these fuels would requirean “on-board reformer” to convert the liquid fuelinto H2 gas on demand. Hydrogen BurnerTechnology, Inc. (HBT), has entered into acooperative agreement with the U.S. Department ofEnergy through the Office of TransportationTechnologies. This agreement is focused ondevelopment and testing of a F3P subsystem forautomotive applications.
Program OverviewThe greater share of the work involves the
design, construction, and testing of a prototype F3Psubsystem. A second effort is related to verificationof the HLTS concept.
Activities during FY00 have included thefollowing: conversion of F3P hardware from thePOX design to the ATR design; completion ofcontroller software for natural gas, propane, andgasoline operation; concept verification testing ofHLTS hardware; integration of PROX hardware intothe F3P subsystem; and completion of a packagedhardware design.
F3P Subsystem Design and HardwareThe basis of the F3P subsystem has changed
from a noncatalytic POX reactor to a catalytic ATRreactor. The improvements this change offers arethreefold: (1) increased efficiency, (2) loweroperating temperatures, and (3) simplification ofprocess control.
The hardware approach taken in more recentlybuilt packaged systems utilizes four separatehardware assemblies to allow for evaluation testingof alternative components. The four assemblies arethe fuel vaporizer/anode gas oxidizer assembly, theF3P assembly, the CO polishing assembly, and theeconomizer. The overall process is shown inFigure 1.
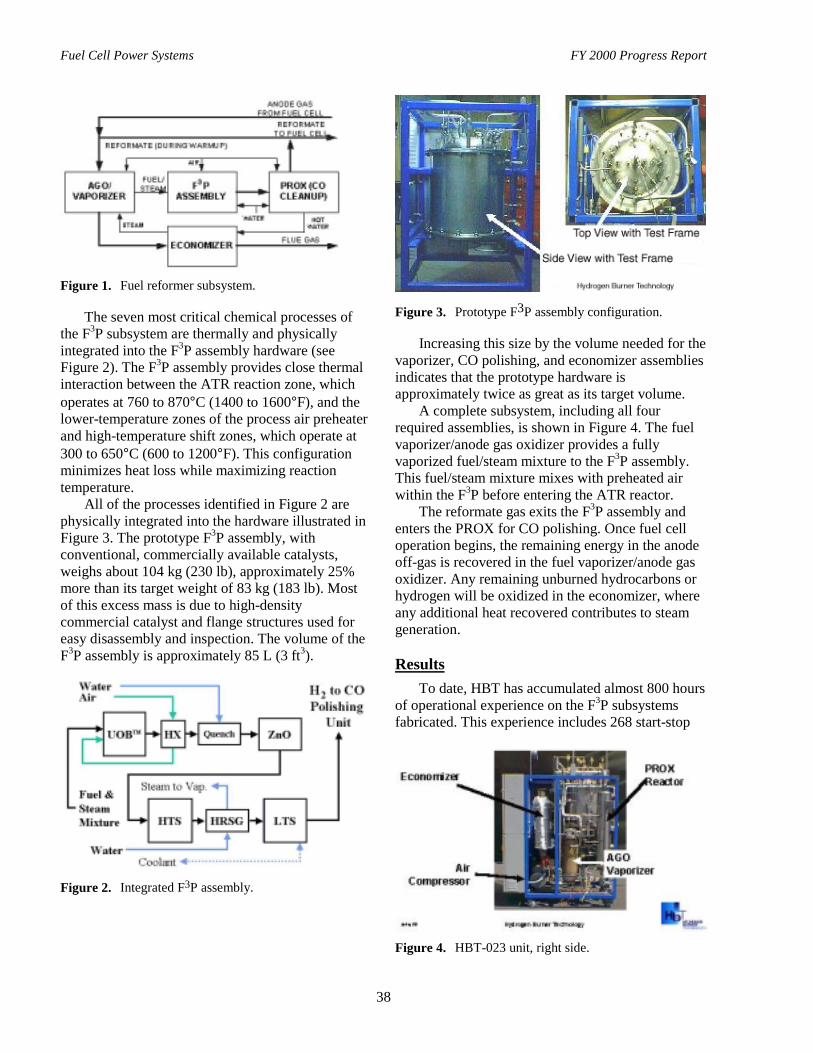
Fuel Cell Power Systems FY 2000 Progress Report
38
Figure 1. Fuel reformer subsystem.
The seven most critical chemical processes ofthe F3P subsystem are thermally and physicallyintegrated into the F3P assembly hardware (seeFigure 2). The F3P assembly provides close thermalinteraction between the ATR reaction zone, whichoperates at 760 to 870°C (1400 to 1600°F), and thelower-temperature zones of the process air preheaterand high-temperature shift zones, which operate at300 to 650°C (600 to 1200°F). This configurationminimizes heat loss while maximizing reactiontemperature.
All of the processes identified in Figure 2 arephysically integrated into the hardware illustrated inFigure 3. The prototype F3P assembly, withconventional, commercially available catalysts,weighs about 104 kg (230 lb), approximately 25%more than its target weight of 83 kg (183 lb). Mostof this excess mass is due to high-densitycommercial catalyst and flange structures used foreasy disassembly and inspection. The volume of theF3P assembly is approximately 85 L (3 ft3).
Figure 2. Integrated F3P assembly.
Figure 3. Prototype F3P assembly configuration.
Increasing this size by the volume needed for thevaporizer, CO polishing, and economizer assembliesindicates that the prototype hardware isapproximately twice as great as its target volume.
A complete subsystem, including all fourrequired assemblies, is shown in Figure 4. The fuelvaporizer/anode gas oxidizer provides a fullyvaporized fuel/steam mixture to the F3P assembly.This fuel/steam mixture mixes with preheated airwithin the F3P before entering the ATR reactor.
The reformate gas exits the F3P assembly andenters the PROX for CO polishing. Once fuel celloperation begins, the remaining energy in the anodeoff-gas is recovered in the fuel vaporizer/anode gasoxidizer. Any remaining unburned hydrocarbons orhydrogen will be oxidized in the economizer, whereany additional heat recovered contributes to steamgeneration.
ResultsTo date, HBT has accumulated almost 800 hours
of operational experience on the F3P subsystemsfabricated. This experience includes 268 start-stop
Figure 4. HBT-023 unit, right side.

Fuel Cell Power Systems FY 2000 Progress Report
39
cycles, and operation on five fuels: gasoline,methanol, natural gas, propane, and diesel.
Table 1 provides a summary of operatingexperience achieved to date. The summaryrepresents testing performed with both manual andautomatic controls.
This operating experience has partially mappedthe performance characteristics of the F3P subsystemon five fuels. A summary of achievements to date isgiven in Table 2. Results shown are from tests inwhich the ATR configuration of the F3P was usedfor all fuels except methanol, which has only beentested with the noncatalytic POX configuration.
Figure 5 shows example test data taken over thecourse of six tests. The F3P subsystem used wasS/N 001. California reformulated gasoline was usedas the fuel.
Table 1. Operating experience on F3P summary.
S/N 001 S/N 002 S/N 003 S/N 004Customer HBT/DOE Auto
Mfg’erLANL FC Devel
Fabrication 12/30/98 2/20/99 3/9/99 7/1/99Delivered 1/1/99 3/5/99 5/28/99 9/13/99Runs 90 14 43 45Hours 175 20 102 150Fuels NG,
GasolineNG,
GasolineNG,
GasolineMethanol
NG
S/N 005 S/N 006 S/N 007 S/N 008
Customer FC Devel FC Devel CeCert SMUDFabrication 9/20/99 1/20/00 3/31/00 TBDDelivered 10/19/99 TBD 4/10/00 TBDRuns 40 25 11 N/AHours 250 58 33 N/AFuels NG,
PropaneNG,
DieselNG,
DieselDiesel
Table 2. Performance of F3P subsystem for five fuels.
Item Nat. Gas LPG Gasoline Diesel MethanolEfficiency1 81% 75% 75-80% 73% 76%Max H2, % dry 49.5% 44.0% 41-42% 42-42% 40%Min. CO LTS Out 0.8% 0.2% 0.5-0.6% 1% 0.1-0.3%Capacity kWe
2,3 35 3.5 35 15 381 Efficiency = (LHV H2 out)/(LHV Fuel into Reformer)2 Estimated power based on fuel cell operational assumptions.3 These are maximum capacities tested thus far. Max. subsystem
capacity is probably in the range of 40-50 kWe.
Figure 5. H2 concentration on gasoline.
ConclusionsTo date, the F3P subsystem has successfully
demonstrated operation and fuel flexibility, and ithas approached its performance targets. Theseefforts have provided the technology foundation foradvanced fuel processing subsystems beingfabricated at HBT; testing is due to begin in June2000. This hardware represents the next leapforward with respect to efficiency, size, and weightperformance targets.

Fuel Cell Power Systems FY 2000 Progress Report
40
D. Integrated Fuel Processor Development
S. Ahmed, S.H.D. Lee, E. Doss, C. Pereira, D. Colombo, and M. KrumpeltArgonne National Laboratory, 9700 S. Cass Ave., Argonne, IL 60439(630) 252-4553; fax: (630) 972-4553, e-mail: [email protected]
DOE Program Manager: JoAnn Milliken(202) 586-2480, fax: (202) 586-9811, e-mail: [email protected]
ObjectivesDetermine the design and operating conditions for an integrated fuel processor that can meet the targets of thePartnership for a New Generation of Vehicles (PNGV):
• With a microreactor process train (100 W).• With an engineering-scale integrated reactor (5-10 kWe)
OAAT R&D Plan: Task 3; Barriers F and G
Approach• Study fuel processing steps individually in microreactors to determine suitable catalysts, their kinetic
parameters, and desirable operating conditions.• Verify component performance in the integrated reactor, validate the reactor model, and identify concepts that
could improve fuel processor performance.
Accomplishments• Demonstrated fuel processor functions in the microreactor process train:
- Demonstrated conversion of hydrocarbon fuel to produce reformate containing 1% (dry basis) carbonmonoxide.
- Evaluated preferential oxidation catalysts for use in the integrated reactor.
• Developed algorithm to determine the optimal temperature profile for the shift reactor.
• Demonstrated operation of an integrated reactor with methanol at the 7-kWe level, with reformate containing46% hydrogen.
• Demonstrated operation of an integrated reactor with hydrocarbon fuel at the 4-kWe level, 75% efficiency, withreformate containing 40% hydrogen.
Future Directions• Study fuel processing steps in the microreactor to evaluate catalysts and determine kinetics and favorable
operating conditions.
• Integrate a preferential oxidation unit into the engineering scale reactor.
• Transfer technology to industrial partners.
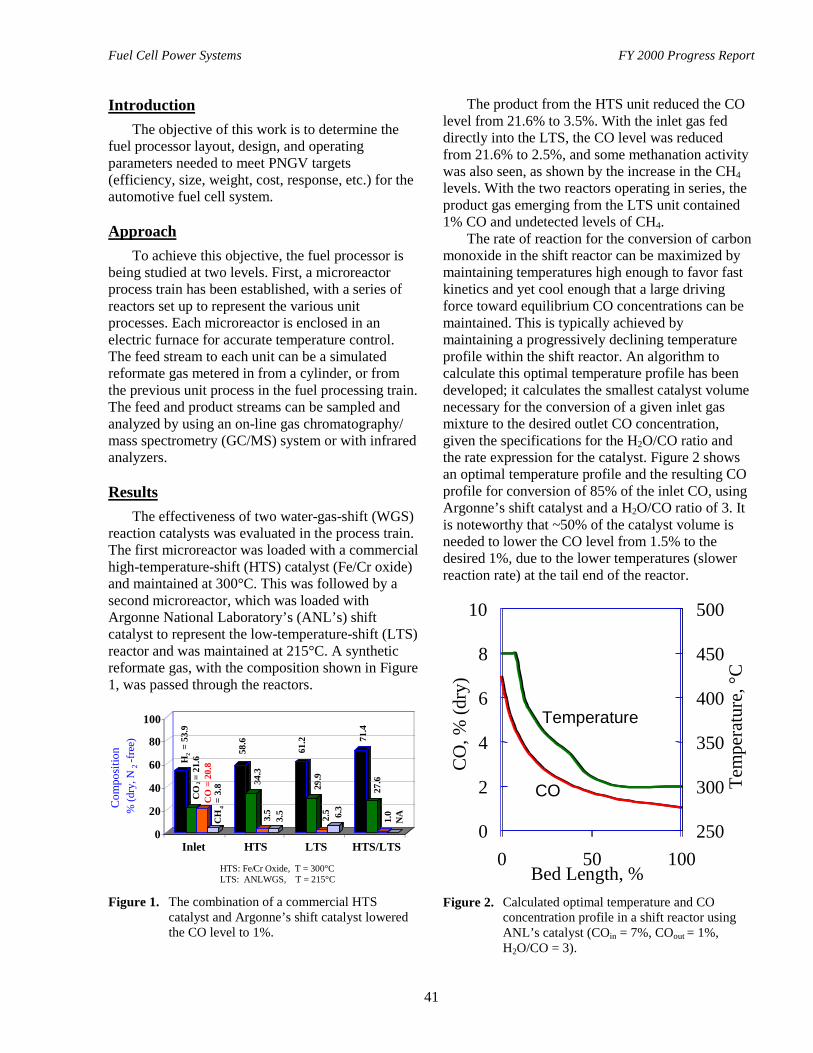
Fuel Cell Power Systems FY 2000 Progress Report
41
IntroductionThe objective of this work is to determine the
fuel processor layout, design, and operatingparameters needed to meet PNGV targets(efficiency, size, weight, cost, response, etc.) for theautomotive fuel cell system.
ApproachTo achieve this objective, the fuel processor is
being studied at two levels. First, a microreactorprocess train has been established, with a series ofreactors set up to represent the various unitprocesses. Each microreactor is enclosed in anelectric furnace for accurate temperature control.The feed stream to each unit can be a simulatedreformate gas metered in from a cylinder, or fromthe previous unit process in the fuel processing train.The feed and product streams can be sampled andanalyzed by using an on-line gas chromatography/mass spectrometry (GC/MS) system or with infraredanalyzers.
ResultsThe effectiveness of two water-gas-shift (WGS)
reaction catalysts was evaluated in the process train.The first microreactor was loaded with a commercialhigh-temperature-shift (HTS) catalyst (Fe/Cr oxide)and maintained at 300°C. This was followed by asecond microreactor, which was loaded withArgonne National Laboratory’s (ANL’s) shiftcatalyst to represent the low-temperature-shift (LTS)reactor and was maintained at 215°C. A syntheticreformate gas, with the composition shown in Figure1, was passed through the reactors.
HTS: Fe/Cr Oxide, T = 300°CLTS: ANLWGS, T = 215°C
H2 =
53.
9C
O2 =
21.
6
CH
4 = 3
.8
58.6
34.3
3.5
3.5
61.2
29.9
2.5 6.3
71.4
27.6
1.0
NA
0
20
40
60
80
100
Inlet HTS LTS HTS/LTS
CO
= 2
0.8
Com
posi
tion
% (d
ry, N
2-f
ree)
Figure 1. The combination of a commercial HTScatalyst and Argonne’s shift catalyst loweredthe CO level to 1%.
The product from the HTS unit reduced the COlevel from 21.6% to 3.5%. With the inlet gas feddirectly into the LTS, the CO level was reducedfrom 21.6% to 2.5%, and some methanation activitywas also seen, as shown by the increase in the CH4levels. With the two reactors operating in series, theproduct gas emerging from the LTS unit contained1% CO and undetected levels of CH4.
The rate of reaction for the conversion of carbonmonoxide in the shift reactor can be maximized bymaintaining temperatures high enough to favor fastkinetics and yet cool enough that a large drivingforce toward equilibrium CO concentrations can bemaintained. This is typically achieved bymaintaining a progressively declining temperatureprofile within the shift reactor. An algorithm tocalculate this optimal temperature profile has beendeveloped; it calculates the smallest catalyst volumenecessary for the conversion of a given inlet gasmixture to the desired outlet CO concentration,given the specifications for the H2O/CO ratio andthe rate expression for the catalyst. Figure 2 showsan optimal temperature profile and the resulting COprofile for conversion of 85% of the inlet CO, usingArgonne’s shift catalyst and a H2O/CO ratio of 3. Itis noteworthy that ~50% of the catalyst volume isneeded to lower the CO level from 1.5% to thedesired 1%, due to the lower temperatures (slowerreaction rate) at the tail end of the reactor.
0
2
4
6
8
10
0 50 100Bed Length, %
CO
, % (d
ry)
250
300
350
400
450
500
Tem
pera
ture
, °C
Temperature
CO
Figure 2. Calculated optimal temperature and COconcentration profile in a shift reactor usingANL’s catalyst (COin = 7%, COout = 1%,H2O/CO = 3).
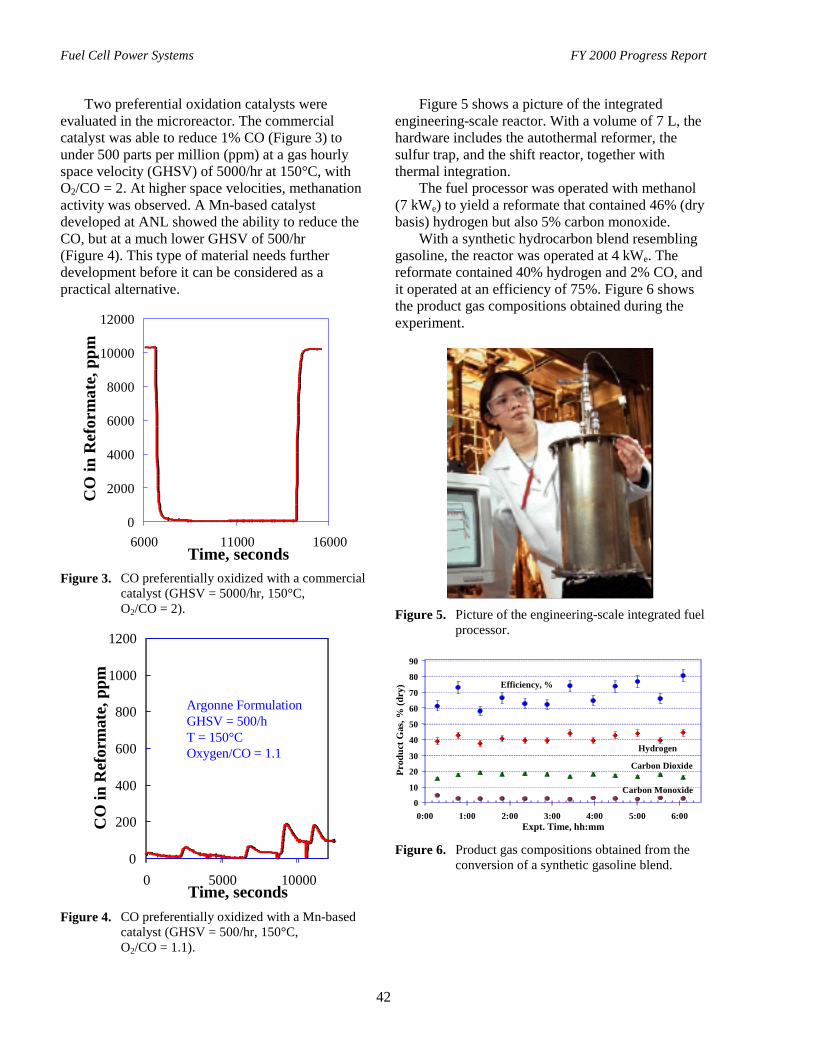
Fuel Cell Power Systems FY 2000 Progress Report
42
Two preferential oxidation catalysts wereevaluated in the microreactor. The commercialcatalyst was able to reduce 1% CO (Figure 3) tounder 500 parts per million (ppm) at a gas hourlyspace velocity (GHSV) of 5000/hr at 150°C, withO2/CO = 2. At higher space velocities, methanationactivity was observed. A Mn-based catalystdeveloped at ANL showed the ability to reduce theCO, but at a much lower GHSV of 500/hr(Figure 4). This type of material needs furtherdevelopment before it can be considered as apractical alternative.
0
2000
4000
6000
8000
10000
12000
6000 11000 16000Time, seconds
CO
in R
efor
mat
e, p
pm
Figure 3. CO preferentially oxidized with a commercialcatalyst (GHSV = 5000/hr, 150°C,O2/CO = 2).
0
200
400
600
800
1000
1200
0 5000 10000Time, seconds
CO
in R
efor
mat
e, p
pm
Argonne FormulationGHSV = 500/hT = 150°COxygen/CO = 1.1
Figure 4. CO preferentially oxidized with a Mn-basedcatalyst (GHSV = 500/hr, 150°C,O2/CO = 1.1).
Figure 5 shows a picture of the integratedengineering-scale reactor. With a volume of 7 L, thehardware includes the autothermal reformer, thesulfur trap, and the shift reactor, together withthermal integration.
The fuel processor was operated with methanol(7 kWe) to yield a reformate that contained 46% (drybasis) hydrogen but also 5% carbon monoxide.
With a synthetic hydrocarbon blend resemblinggasoline, the reactor was operated at 4 kWe. Thereformate contained 40% hydrogen and 2% CO, andit operated at an efficiency of 75%. Figure 6 showsthe product gas compositions obtained during theexperiment.
Figure 5. Picture of the engineering-scale integrated fuelprocessor.
0
10
20
30
40
50
60
70
80
90
0:00 1:00 2:00 3:00 4:00 5:00 6:00Expt. Time, hh:mm
Prod
uct G
as, %
(dry
)
Hydrogen
Carbon Dioxide
Carbon Monoxide
Efficiency, %
Figure 6. Product gas compositions obtained from theconversion of a synthetic gasoline blend.
Fuel Cell Power Systems FY 2000 Progress Report
43
ConclusionsFuel processors are being studied with reactors
at the 100-W and 10-kW levels. The microreactorhas been used to study the kinetics and effectivenessof WGS catalysts. An algorithm has been developedfor determining the optimal temperature profile inthe shift reactor, and this has been approximatedwith two reactors in series. Commercial preferentialoxidation catalysts have also been evaluated in themicroreactor.
The engineering-scale integrated fuel processorhas been tested with methanol, iso-octane, and ahydrocarbon blend resembling gasoline. The unitwas operated with hydrocarbon fuels at over 75%efficiency, where the reformate contained >40%hydrogen and ~2% carbon monoxide. Thisengineering-scale integrated hardware currentlylacks the preferential oxidation unit and the spentanode gas burner. A collaborative effort with LosAlamos National Laboratory is under way toincorporate the preferential oxidizer into the ANLfuel processor.
Publications1. S. Ahmed, B. Bergin, T. Krause, J.D. Carter,
J-M. Bae, L. Ruscic, D. Applegate, J. Kopasz,D. Myers, J. Krebs, C. Pereira, S.H.D. Lee, andM. Krumpelt, “Fuel Processor Development atArgonne National Laboratory,” presented at theArmy Research Office Workshop, Detroit,Mich., June 19-21, 2000.
2. S. Ahmed, J.P. Kopasz, B.J. Russell, and H.L.Tomlinson, “Gas-to-Liquids Synthetic Fuels forUse in Fuel Cells: Reformability, EnergyDensity, and Infrastructure Compatibility,” to bepublished in the Proceedings of the 3rd
International Fuel Cell Conference, Nagoya,Japan, held Nov. 30–Dec. 3, 1999.
3. M. Krumpelt, S. Ahmed, R. Kumar, S. Chalk,and J. Milliken, “Partial Oxidation FuelReforming for Automotive Power Systems,” tobe published in the Proceedings of the 3rd
International Fuel Cell Conference, Nagoya,Japan, held Nov. 30–Dec. 3, 1999.
4. S. Ahmed, R. Kumar, and M. Krumpelt, “FuelProcessing for Fuel Cell Power Systems,” FuelCells Bulletin, Elsevier Press, London, U.K.,Sept. 1999.
5. S. Ahmed, J. Kopasz, B.J. Russell, andH.L. Tomlinson (Syntroleum Corp.), “Cobalt-Based Fischer-Tropsch Paraffin Fuels for FuelCell Power,” poster paper presented at the SixthGrove Fuel Cell Symposium, London, U.K.,Sept. 13-16, 1999.
6. S. Ahmed, S.H.D. Lee, R. Kumar, J.D. Carter,R. Wilkenhoener, and M. Krumpelt, “TheArgonne Catalytic Fuel Processor forAutomotive and Small Fuel Cell PowerSystems,” poster paper presented at the SixthGrove Fuel Cell Symposium, London, U.K.,Sept. 13-16, 1999.
7. J. Kopasz, R. Wilkenhoener, S. Ahmed,J.D. Carter, and M. Krumpelt, “Fuel FlexiblePartial Oxidation Reforming of Hydrocarbonsfor Automotive Applications,” preprints of theSymposium on Hydrogen Production, Storage,and Utilization, 218th ACS National Meeting,Vol. 44, No. 4, pp. 899-904, New Orleans, La.,Aug. 22-26, 1999.
Patents Issued1. S. Ahmed, R. Kumar, and M. Krumpelt,
“Methanol Partial Oxidation Reformer,” PatentNo. 5,942,346, issued on Aug. 24, 1999.
2. S. Ahmed, R. Kumar, and M. Krumpelt,“Methanol Partial Oxidation Reformer,” PatentNo. 5,939,025, issued on Aug. 17, 1999.
3. M. Krumpelt, S. Ahmed, R. Kumar, and R.Doshi, “Method for Making Hydrogen-Rich Gasfrom Hydrocarbon Fuel,” Patent No. 5,929,286,issued on July 27, 1999.
Awards/Recognitions1. Best Poster Award at the Grove Symposium,
London, U.K., September 1999.2. Annual National Laboratory R&D Award from
DOE/OTT/OAAT, Richland, Wash., June 2000.
Fuel Cell Power Systems FY 2000 Progress Report
44
E. Microchannel Fuel Processor Components
Greg A. Whyatt, Ward E. TeGrotenhuis, Robert S. Wegeng, Victoria S. Stencamp, James M. Davis,John G.H. Geeting, and Larry R. Pederson (primary contact)Pacific Northwest National Laboratory, P.O. Box 999, Richland, WA 99352(509) 375-2731, fax: (509) 375-2167, e-mail: [email protected]
DOE Program Manager: JoAnn Milliken(202) 586-2480, fax: (202) 586-9811, e-mail: [email protected]
ObjectivesDevelop compact reactors, separators, and heat exchangers for the onboard automotive production of hydrogen fromliquid hydrocarbons.
OAAT R&D Plan: Task 3; Barriers F, G, and H
ApproachUtilize unique heat and mass transport advantages available in engineered microstructures to develop anddemonstrate an integrated steam reforming subsystem. The integrated subsystem consists of multiple microchannelreactors, combustors, multistream recuperative heat exchangers, fuel and water vaporizers, and vapor/liquidseparators.
Accomplishments• High hydrogen selectivity and low methane slip were achieved for steam reforming of iso-octane in a
microchannel reactor at a rate sufficient to support a 0.5- to 1.0-kWe fuel cell.
• An integrated microchannel steam reformer subsystem consisting of a four-cell reactor, multistreamrecuperative heat exchangers, and water/fuel vaporizers was designed and fabricated. Conservatively designedto reform iso-octane to supply a 10-kWe fuel cell, the steam reforming subsystem incorporates an innovativecombustion gas reinjection approach that allows it to operate in an energy-efficient manner, a significantimprovement over previous designs.
• Integrated, multistream recuperative heat exchangers were developed to support operation of an energy-efficient steam reformer. The exchangers recover heat from either the reformate or the combustion streams topreheat reactants and combustion air and to vaporize fuel and water. Except for a low-temperature air preheater,these heat exchangers provide all of the recuperator and vaporizer functions needed for the steam reformingsubsystem.
• A microchannel vapor-liquid separation concept was demonstrated in a single-microchannel device. Capillaryand surface forces were utilized to achieve qualitatively complete phase separation. Heat-exchange channelswere also incorporated in the single-channel phase separator, resulting in technology capable of performingcondensation and phase separation in a single compact device. The technology is projected to be substantiallysmaller, with a lower pressure drop, than competing technologies.
Future Directions• Demonstrate highly efficient operation of the steam reforming subsystem at 10 kWe and higher.
• Design and demonstrate steam generators and vapor/liquid separators to be incorporated into the integratedsteam reforming subsystem, or other systems, with target pressure drops of <0.1 psi.
• Evaluate long-term reactor, heat exchanger, and catalyst performance.
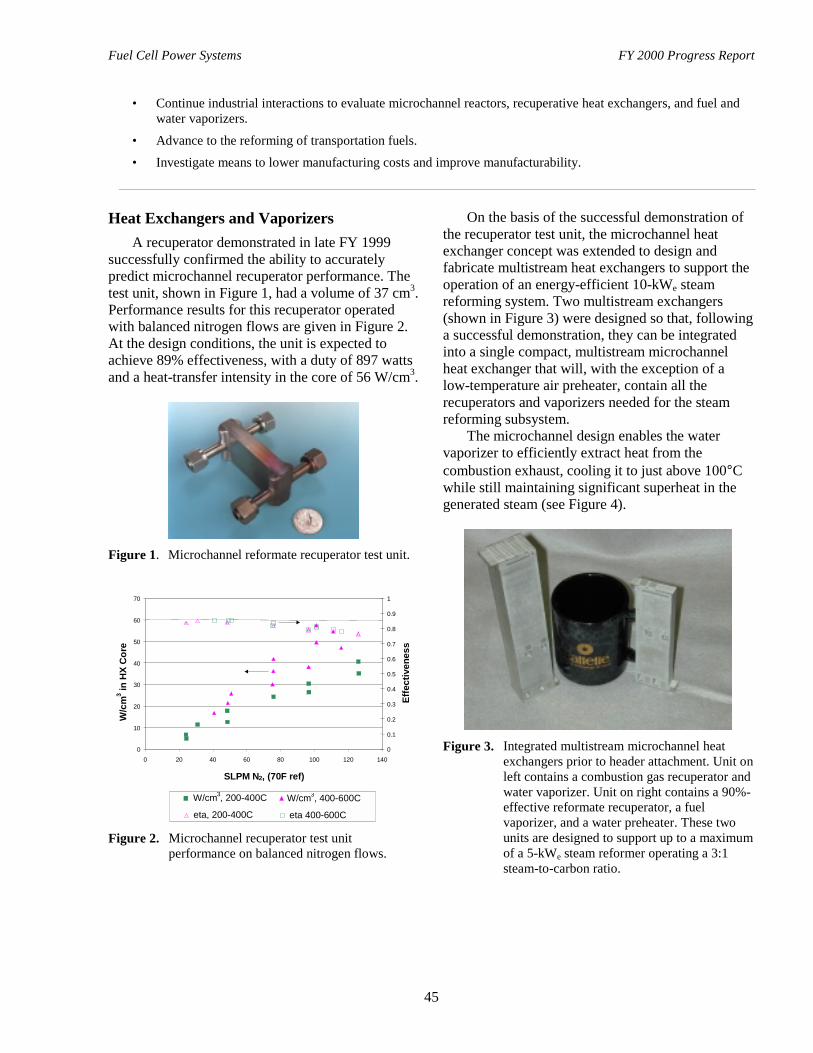
Fuel Cell Power Systems FY 2000 Progress Report
45
• Continue industrial interactions to evaluate microchannel reactors, recuperative heat exchangers, and fuel andwater vaporizers.
• Advance to the reforming of transportation fuels.
• Investigate means to lower manufacturing costs and improve manufacturability.
Heat Exchangers and VaporizersA recuperator demonstrated in late FY 1999
successfully confirmed the ability to accuratelypredict microchannel recuperator performance. Thetest unit, shown in Figure 1, had a volume of 37 cm3.Performance results for this recuperator operatedwith balanced nitrogen flows are given in Figure 2.At the design conditions, the unit is expected toachieve 89% effectiveness, with a duty of 897 wattsand a heat-transfer intensity in the core of 56 W/cm3.
Figure 1. Microchannel reformate recuperator test unit.
0
10
20
30
40
50
60
70
0 20 40 60 80 100 120 140
SLPM N2, (70F ref)
W/c
m3 in
HX
Cor
e
__
0
0.1
0.2
0.3
0.4
0.5
0.6
0.7
0.8
0.9
1
Effe
ctiv
enes
s
W/cm3, 200-400C W/cm3, 400-600C
eta, 200-400C eta 400-600C
Figure 2. Microchannel recuperator test unitperformance on balanced nitrogen flows.
On the basis of the successful demonstration ofthe recuperator test unit, the microchannel heatexchanger concept was extended to design andfabricate multistream heat exchangers to support theoperation of an energy-efficient 10-kWe steamreforming system. Two multistream exchangers(shown in Figure 3) were designed so that, followinga successful demonstration, they can be integratedinto a single compact, multistream microchannelheat exchanger that will, with the exception of alow-temperature air preheater, contain all therecuperators and vaporizers needed for the steamreforming subsystem.
The microchannel design enables the watervaporizer to efficiently extract heat from thecombustion exhaust, cooling it to just above 100°Cwhile still maintaining significant superheat in thegenerated steam (see Figure 4).
Figure 3. Integrated multistream microchannel heatexchangers prior to header attachment. Unit onleft contains a combustion gas recuperator andwater vaporizer. Unit on right contains a 90%-effective reformate recuperator, a fuelvaporizer, and a water preheater. These twounits are designed to support up to a maximumof a 5-kWe steam reformer operating a 3:1steam-to-carbon ratio.

Fuel Cell Power Systems FY 2000 Progress Report
46
100
150
200
250
300
350
400
0 0.005 0.01 0.015 0.02 0.025 0.03
mol/s Steam
Stea
m/G
as E
xit T
emp,
C
__
0
200
400
600
800
1000
1200
1400
Stea
m D
uty,
wat
ts
gas steam out duty
Figure 4. Performance data on water vaporizer sectionof integrated exchanger.
Steam Reformer Reactor TestingThe microchannel steam reforming reactor that
was designed, fabricated, and operated in FY 1999was tested over a range of operating conditions. Theobjective was to collect performance data for designof the next-generation steam reformer at the 10-kWescale. The data demonstrated the reforming capacityof the first-generation reactor design to validateprojections for power density, and it was used todevelop predictive models for microchannelreforming for incorporation into models of the steamreforming fuel processor.
The statistically designed experiment employeda four-factor, full-factorial design using iso-octaneflow, water flow, combustor temperature, andcombustion air flow as variables. These variablestranslate into the design parameters, reactantresidence time, steam-to-carbon ratio, reactoroperating temperature, and heat-transfer efficiency.The steam-to-carbon ratio was varied between 3:1and 12:1. Figure 5 shows a summary of selectivitydata over the range of conditions tested. Iso-octaneconversion ranged from about 50% to slightly over90%. The equivalent power output ranged from 500to 975 We (assuming 90% conversion and 100%selectivity in the low-temperature-shift reactor, and48% fuel cell stack efficiency), which translates to aproductivity sufficient to supply 16 to 32 kWe offuel cell capacity per liter of reactor core. Statisticalanalysis of the data indicated that for iso-octaneconversion, the order of importance of the variablesis (1) fuel flow rate, (2) operating temperature,(3) water flow rate, and (4) combustion air flow rate.
0
20
40
60
80
100
620 640 660 680 700 720 740
SR Reactor Outlet Temperature (C)
Sele
ctiv
ity (%
)
Figure 5. Summary of selectivity data for thestatistically designed experiment operatedusing the first-generation microchannel steamreforming reactor. Data reflect a range ofoperating conditions for reactant flows andtemperatures.
10-kWe Steam Reforming SubsystemThe 10-kWe steam reforming subsystem was
designed on the basis of data discussed in theprevious sections. The objectives of the 10-kWesteam reforming system are to substantially scale upthe earlier steam reformer and, through an integratedheat exchanger network and a redesign of thereactor, produce a system that is energy-efficient.This system has been designed and fabricated, andwill be tested in late FY 2000. It is designed tooperate at pressures up to 5 bar on the reaction side.The 10-kWe system hardware is shown in Figure 6.
The 10-kWe reactor contains four independentcells, each with 2.5-kWe capacity. The reactants andproducts are processed through these four cells inparallel, while the combustion gases providing theheat to drive the reaction pass through the cells inseries. As the combustion gases pass from one cellto the next, a small amount of additional fuel isinjected and burned to restore the temperature to thedesired level prior to entering the next cell. Thisapproach increases the product of (mass flow) ×(heat capacity) of the combustion gases passingthrough a single cell, which reduces the temperaturedrop across the reactor and dramatically reduces theincoming temperature required to sustain a givenreaction rate. It also reduces the overall amount ofcombustion air used, thereby reducing the amount ofheat lost to the combustion exhaust. This approachalso allows test units to be manufactured and

Fuel Cell Power Systems FY 2000 Progress Report
47
Figure 6. Integrated 10-kWe steam reformingsubsystem. Reactor containing four cells islocated on the bottom, with one pair ofintegrated exchangers provided for each cell ofthe reactor. All reactor connections are madeon one face of the reactor for ease ofinsulation and to reduce overall heat loss. Themany vertical tubes are for thermocouples andpressure sensors for the experimental system,and would not be part of a final commercialsystem.
operated using 316L stainless steel. The optimaloperating temperature involves a trade-off betweenreactor cost, productivity, efficiency, and operatinglifetime; this trade-off has not yet been resolved.However, it is expected that the series use ofcombustion gases will allow lower-cost alloys to beused, compared to those required if 1,000°Ccombustion temperatures were utilized.
Microchannel Condenser with Vapor/LiquidSeparation
Pacific Northwest National Laboratory (PNNL)expanded efforts toward size and weight reductionof balance-of-plant items by developing anddemonstrating a concept for combining partialcondensation with vapor/liquid phase separationwithin a single compact microchannel device. Thisapproach would surpass conventional phaseseparation technologies, such as centrifugalseparators, in capacity per unit hardware mass andvolume. The result is increased power density andspecific power for the overall fuel processor/fuel cell
system, regardless of the choice of reformingtechnology.
This PNNL study demonstrated the concept of,and collected performance data for, vapor/liquidseparation in a single-channel microchannel device.Subsequently, heat-exchange channels wereincorporated to accomplish the combined functionsof partial condensation and phase separation. Futurework will include scale-up to multichannel devices.
Figure 7 shows flow capacity curves for twoconfigurations of the single-channel phaseseparation device, indicating the maximum gas andliquid flow rates that can be processed within thedevice while achieving qualitatively complete phaseseparation. Performance was compared to that of aconventional centrifugal separator. A separationachieved in 0.08 s residence time in themicrochannel device is projected to require 0.4 s inthe centrifugal separator. This corresponds to avolume of 0.5 L for a full-scale device capable oftreating reformate stream from a steam reformer,compared to a volume of > 2 L for a centrifugalseparator. Channel pressure drop was calculated tobe 0.08 in. of water, based on slit flow, while thecentrifugal separator is rated at 1.4 in. of water.
Microchannel Fuel Processing SystemImplications
The current steam reforming subsystem isprojected to meet the Department of Energy’s(DOE’s) targets for power density and fuelprocessor efficiency, but improvements are neededto meet specific power and cost targets.
0
2
4
6
8
10
12
0 500 1000 1500 2000Gas flow (mL/min)
Max
imum
Wat
er fl
ow (m
L/m
in)
Figure 7. Flow capacities for 100%-efficient phaseseparation of a dispersed gas and liquid feedstream for two configurations of the single-channel microchannel phase separator.

Fuel Cell Power Systems FY 2000 Progress Report
48
Performance targets, current status, and short- andlong-term project goals are summarized in Table 1.
The overall system efficiency, including thecurrent fuel processor and PEM fuel cell, isprojected to be 39-41%. High system efficiency isusually equated with high hydrogen utilization butwith relatively low stack current density. However,because unused hydrogen from the fuel cell isrecycled to the fuel processor to provide heat forreforming, system studies have shown the overallefficiency to be relatively insensitive to hydrogenutilization in the stack. Thus, it is expected that acompact, microchannel steam reforming systemcoupled with a fuel cell can ultimately provide bothhigh efficiency and high power density.
Table 1. Comparison of DOE-OAAT targets for anautomotive fuel processor.
TechnicalTarget
DOE 2004Target
PNNLStatus
PNNLFY 2001
Goals
PNNLLong-Term
GoalsPowerDensity(We/L)
750 1500 3000 >6000a
SpecificPower(We/kg)
750 280 600 >1500a
Cost ($/kW)10 60b 30b <4a,b
FuelProcessorEfficiency
80% 83-85% 83-85% 83-85%
a Requires improvements to catalyst performance and/ormanufacturing costs.
b Based on cost of bonded unit only (no catalyst costs).
Publications and Presentations• R.S. Wegeng, “Microchannel Fuel Processor
Hardware Development Status,” F-CELLS2000, Palm Springs, Calif., May 22-26, 2000.
• R.S. Wegeng, “Reducing the Size ofAutomotive Fuel Reformers,” Fuel CellsInfrastructure Workshop, Chicago, Ill., Dec. 6-7,1999.
• J.L. Zilka-Marco, A.Y. Tonkovich,M.J. Lamont, S.P. Fitzgerald, D.P. VanderWiel,Y. Wang, and R.S. Wegeng, “CompactMicrochannel Fuel Vaporizer for AutomotiveApplications,” 4th International Conference onMicroreaction Technology,AICHE/DECHEMA, Atlanta, Ga., March 2000.
• M.K. Drost, R.S. Wegeng, P.M. Martin,K.P. Brooks, J.L. Martin, and C. Call,“MicroHeater,” 4th International Conference onMicroreaction Technology,AICHE/DECHEMA, Atlanta, Ga., March 2000.
• D.L. Brenchley, R.S. Wegeng, and M.K. Drost,“Development of Micro-Chemical and ThermalSystems,” 4th International Conference onMicroreaction Technology,AICHE/DECHEMA, Atlanta, Ga., March 2000.
• S.P. Fitzgerald, R.S. Wegeng, A.Y. Tonkovich,Y. Wang, H.D. Freeman, J.L. Marco,G.L. Roberts, and D.P. VanderWeil, “ACompact Steam Reforming Reactor for Use inan Automotive Fuel Processor,” 4thInternational Conference on MicroreactionTechnology, AICHE/DECHEMA, Atlanta, Ga.,March 2000.
• E.A. Daymo, D.P. VanderWiel, S.P. Fitzgerald,Y. Wang, R.T. Rozmiarek, M.J. Lamont, andA.Y. Tonkovich, “Microchannel FuelProcessing for Man Portable Power,” 4thInternational Conference on MicroreactionTechnology, AICHE/DECHEMA, Atlanta, Ga.,March 2000.
• T.M. Werner, S.C. Schmitt, E.A. Daymo, andR.S. Wegeng, “Microchannel GasolineVaporizer Unit Manufacturing Cost Study,”PNNL-12226, June 1999.
Fuel Cell Power Systems FY 2000 Progress Report
49
F. Catalysts for Improved Fuel Processing
Rod Borup (primary contact), Michael Inbody, Byron Morton, JinKi Hong, and José TafoyaESA-EPE, MS J580P.O. Box 1663Los Alamos National Laboratory, Los Alamos, NM 87545(505) 667-2823, fax: (505) 665-6173; e-mail: [email protected]
DOE Program Manager: JoAnn Milliken(202) 586-2480, e-mail: [email protected]
Objectives• Understand fuel processor catalyst durability and causes for catalyst degradation.
- Examine fuel effects on fuel processor catalyst performance and durability. Of interest are effects oncatalyst activity associated with fuel composition, component, and impurities.
- Evaluate short-residence-time reaction events, leading to unique fuel processor designs and concepts.- Evaluate catalysts to determine variation in rates and reaction mechanisms during use.- Delineate catalyst degradation mechanisms.
OAAT R&D Plan: Task 3; Barrier E
Approach• Understand and document catalyst performance over a range of relevant conditions.
- Measure adiabatic reforming performance under real operating conditions.- Determine activity, kinetic rates, durability, and performance under isothermal conditions.- Study the effects of varying fuel constituents and contaminants within candidate fuels.- Examine combinations of catalyst and catalyst supports to understand catalyst component degradation.
• Utilize catalyst characterization and surface analytical techniques to help delineate catalyst degradationmechanisms.
- Characterize catalyst’s elemental composition, particle size, and surface area before and after testing.- Evaluate catalyst structural changes.
Accomplishments• Tested and characterized catalysts with various fuel components.
- Nickel and rhodium catalysts (commercial and in-house).- With individual fuel components.- With fuel impurity (sulfur).
• Utilized catalyst characterization and surface analytical techniques to delineate catalyst degradationmechanisms.
- Characterized catalysts and quantified surface area.- Evaluated kinetic vs. equilibrium data for candidate catalysts for partial oxidation.
Future Directions• Study fuel processor catalyst operation with petroleum-based fuels to evaluate effects of fuel constituents.
- Measure fuel processor catalyst activity and durability with individual fuel constituents and fuel blends, aswell as with fuel impurities.

Fuel Cell Power Systems FY 2000 Progress Report
50
- Monitor carbon formation in situ in adiabatic reactor with laser-scattering extinction apparatus. Map carbontendencies of individual catalysts, catalyst supports, and fuels constituents, and examine commercialcatalysts to observe carbon formation tendencies.
• Automate microscale test equipment, reactant mixtures, and sample injection system.- Initiate long-term, unattended and automated catalyst testing for durability measurements.- Evaluate fuel processing catalysts in both microscale and macroscale reactors to compare molecular-level
degradation mechanisms.
IntroductionThis report covers technical progress during
fiscal year (FY) 2000 on fuel processing catalystcharacterization. These development efforts supportU.S. Department of Energy (DOE) activities in thedevelopment of compact, transient-capablereformers for on-board hydrogen generation startingfrom candidate fuels. The long-term objectivesinclude increased durability and lifetime, in additionto smaller volume, improved performance, and otherspecifications required for meeting fuel processorgoals.
The technical barriers to compact fuel processorsize, transient capability, and compact, efficientthermal management are all functions of catalystperformance. Significantly, work at Los AlamosNational Laboratory (LANL) now involves testinglarge-scale fuel processors for performance anddurability, as influenced by fuels and fuelconstituents, and complements that testing withmicroscale catalyst evaluation, accomplished underwell-controlled conditions.
ApproachThe fundamental tools for our research on fuel
processing catalysts are reactor test beds and catalystcharacterization techniques. Catalyst activity andperformance are measured in two different types ofreactor test beds, which serve complementary rolesin our laboratory. An adiabatic reactor exposescatalysts to fuel processing conditions under actualsystem conditions and relatively high power levels,while an isothermal microscale reactor, in whichcatalysts are used under extremely well defined andcontrolled conditions, exposes the catalyst toindividual operating conditions. In addition, catalystcharacterization techniques are used to define thecatalyst structure and structural changes uponexposure to fuel processor conditions in the reactortest beds. These techniques, all available at LANL,
include elemental analysis techniques andtechniques to quantify surface area and particle sizechanges, such as X-ray Photoelectron Spectroscopy(XPS), BET/H2 or CO chemisorption, X-rayDiffraction (XRD), and Scanning ElectronMicroscopy and Energy Dispersive Spectroscopy(SEM/EDS). Other techniques available at LANLinclude Transmission Electron Microscopy (TEM),X-ray Fluorescence Spectroscopy (XRF), andtemperature-programmed desorption (TPD), whichwill be used as required to further delineate catalystdegradation mechanisms.
The adiabatic reactor used to evaluate catalystsand fuel components, including the tendency forcarbon formation, is shown in Figure 1. This reactorfeatures ease of catalyst replacement, the ability toincorporate catalysts supported on commerciallyused substrates (such as corderite monoliths or pellet
Figure 1. Adiabatic partial oxidation reactor.

Fuel Cell Power Systems FY 2000 Progress Report
51
and powder catalysts), in situ carbon formationmonitoring, and gas and temperature measurementswith radial and axial profiles. The reactor firstbecame operational in May 2000; the in situ carbonformation monitoring will be added in the fourthquarter of FY 2000. For in situ carbon formationmonitoring, an argon ion laser will be used withextinction monitoring to observe the onset of carbonformation. Scattering will also be utilized to observerelative carbon particle-size distributions and theinitial onset of carbon formation, and spectraldetection will allow for fluorescence detection ofpolycyclic aromatic hydrocarbons (PAHs).
The isothermal microscale catalyst reactor foruse in fuel and catalyst measurements under well-defined, controlled conditions is shown in Figure 2.This reactor is constructed of a quartz tube and anisothermal oven. Typical catalyst samples are 300–500 milligrams. Vapor or liquid fuels combined withoxidant (air) are mixed and preheated prior tointroduction into the catalyst, while the temperatureof the catalyst remains essentially constant becauseof the isothermal furnace, small catalyst quantities,and small reactant volumes.
ResultsResults using two different metal catalyst
samples, rhodium and nickel, are described in thisreport. The rhodium catalyst was a commercial0.5-wt% catalyst supported on alumina; nickelcatalysts were prepared at Los Alamos with variablenickel loadings from 0.5 wt% to 5 wt%. Initial testswere conducted to measure catalyst performance
Figure 2. Microscale catalyst test station.
with partial oxidation and steam reformingreactions. An example of these measurements isshown in Figure 3 for the isothermal partialoxidation of methane on a nickel catalyst. Methaneconversion reached nearly 100 % at 700°C, whilethe selectivity for hydrogen production was highestat 600°C. The isothermal partial oxidation ofmethane on a rhodium catalyst is shown in Figure 4.The rhodium catalyst shows slower oxidationkinetics, and therefore less methane conversion, thanthe nickel catalyst at similar temperatures, and itdoes not reach 100% methane conversion, even at750°C. However, the rhodium loading was an orderof magnitude less than the nickel, so the TON (turn-over number) for each catalyst site was much higherfor the rhodium catalyst than the nickel catalyst;thus, the rhodium has higher intrinsic activity thanthe nickel. In Figures 3 and 4, XCH4 is the fraction ofmethane converted, SH2 is the selectivity forhydrogen production, and SCO is the selectivity forCO production, as defined below.
SH2 = 0.5 H2, out /(CH4, in - CH4,out) (1)
SCO = CO, out /(CH4,in - CH4, out) (2)
Figure 5 shows XRD of nickel catalysts beforeand after testing with iso-octane and methane. Themain nickel diffraction peak occurs at a 2 Theta of44 degrees. The diffraction of the new nickelcatalyst is broad, indicating small dispersed nickelparticles, while after testing with methane, the peakhas grown sharper, and after testing with iso-octane,
500 550 600 650 700 750 800Temperature(oC)
0.0
0.2
0.4
0.6
0.8
1.0
1.2
X CH4,S
CO
andS
H2 XCH4
SCO
SH2
Figure 3. Isothermal POX of CH4 with temperature onNi/Al2O3 catalyst.
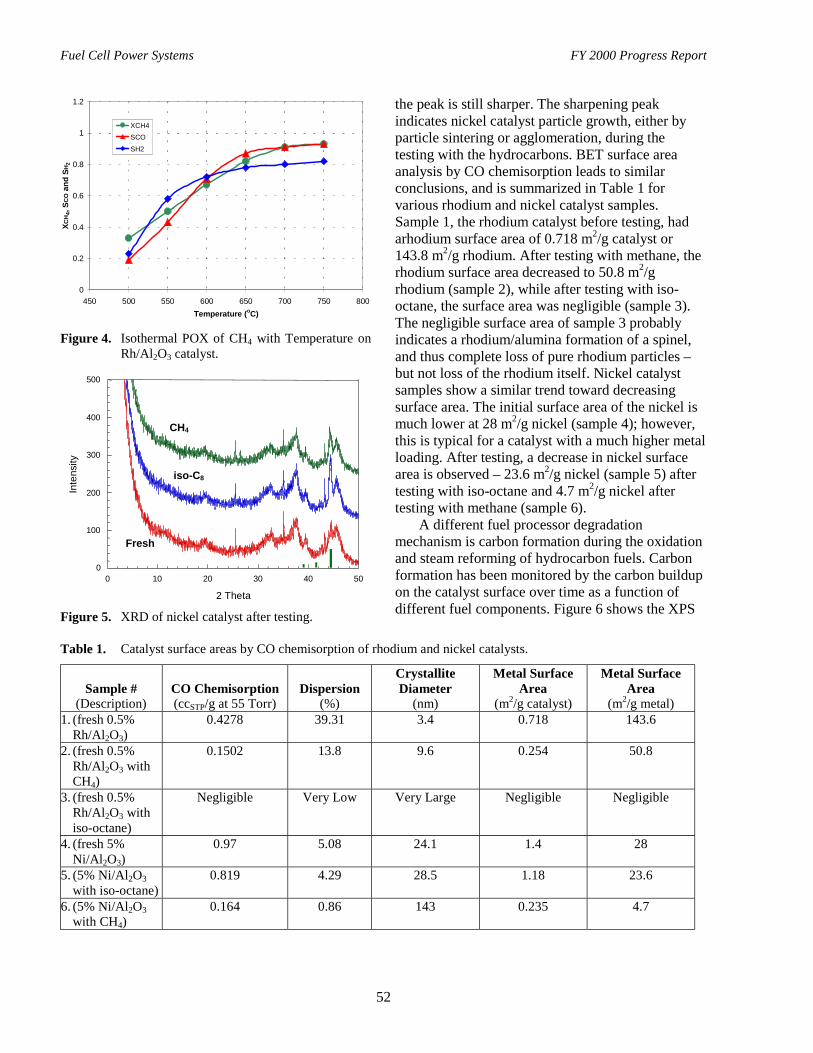
Fuel Cell Power Systems FY 2000 Progress Report
52
0
0.2
0.4
0.6
0.8
1
1.2
450 500 550 600 650 700 750 800Temperature (oC)
XCH
4, SC
O a
nd S
H 2
XCH4SCOSH2
Figure 4. Isothermal POX of CH4 with Temperature onRh/Al2O3 catalyst.
Figure 5. XRD of nickel catalyst after testing.
the peak is still sharper. The sharpening peakindicates nickel catalyst particle growth, either byparticle sintering or agglomeration, during thetesting with the hydrocarbons. BET surface areaanalysis by CO chemisorption leads to similarconclusions, and is summarized in Table 1 forvarious rhodium and nickel catalyst samples.Sample 1, the rhodium catalyst before testing, hadarhodium surface area of 0.718 m2/g catalyst or143.8 m2/g rhodium. After testing with methane, therhodium surface area decreased to 50.8 m2/grhodium (sample 2), while after testing with iso-octane, the surface area was negligible (sample 3).The negligible surface area of sample 3 probablyindicates a rhodium/alumina formation of a spinel,and thus complete loss of pure rhodium particles –but not loss of the rhodium itself. Nickel catalystsamples show a similar trend toward decreasingsurface area. The initial surface area of the nickel ismuch lower at 28 m2/g nickel (sample 4); however,this is typical for a catalyst with a much higher metalloading. After testing, a decrease in nickel surfacearea is observed – 23.6 m2/g nickel (sample 5) aftertesting with iso-octane and 4.7 m2/g nickel aftertesting with methane (sample 6).
A different fuel processor degradationmechanism is carbon formation during the oxidationand steam reforming of hydrocarbon fuels. Carbonformation has been monitored by the carbon buildupon the catalyst surface over time as a function ofdifferent fuel components. Figure 6 shows the XPS
Table 1. Catalyst surface areas by CO chemisorption of rhodium and nickel catalysts.
Sample #(Description)
CO Chemisorption(ccSTP/g at 55 Torr)
Dispersion(%)
CrystalliteDiameter
(nm)
Metal SurfaceArea
(m2/g catalyst)
Metal SurfaceArea
(m2/g metal)1. (fresh 0.5%
Rh/Al2O3)0.4278 39.31 3.4 0.718 143.6
2. (fresh 0.5%Rh/Al2O3 withCH4)
0.1502 13.8 9.6 0.254 50.8
3. (fresh 0.5%Rh/Al2O3 withiso-octane)
Negligible Very Low Very Large Negligible Negligible
4. (fresh 5%Ni/Al2O3)
0.97 5.08 24.1 1.4 28
5. (5% Ni/Al2O3with iso-octane)
0.819 4.29 28.5 1.18 23.6
6. (5% Ni/Al2O3with CH4)
0.164 0.86 143 0.235 4.7
0
100
200
300
400
500
0 10 20 30 40 50
2 Theta
Inte
nsity
CH4
iso-C8
Fresh

Fuel Cell Power Systems FY 2000 Progress Report
53
Figure 6. XPS of catalysts, (a) initial carbon signal andafter partial oxidation with (b) iso-octane, (c)1-pentene, (d) methylcyclohexane, and (e) p-xylene.
C1s signal for nickel catalyst samples tested withiso-octane, pentene, methylcyclohexane, and xylene.This shows relative carbon formation to be muchhigher with the aromatic and unsaturated compoundsthan with the aliphatic hydrocarbons. All nickelsamples after testing showed at least a small amountof carbon present.
ConclusionsCatalyst characterization techniques and
different catalyst test beds are employed tounderstand catalyst durability and degradationmechanisms, leading to the development of fuelprocessing catalysts with longer durability. Testingof catalysts to observe their degradation under well-defined conditions and actual fuel processingconditions leads to a better understanding of suchdegradation. The catalysts are examined todetermine their relative activity and degradationduring fuel processing reactions under differentconditions, including different fuel components andfuel impurities.
Both noble metal (rhodium) and base metal(nickel) catalysts have been shown to decrease insurface area during fuel processing reactions. Thedecrease in surface area is catalyst- and fuel-dependent. The rhodium catalyst, after testing withiso-octane, showed a complete loss of pure rhodiumparticles.
Carbon formation has also been observed to be adegradation mechanism. The tendency towardcarbon formation has been observed to be a functionof the fuel component; the general trend is asfollows: xylene > methylcyclohexane > pentene >iso-octane.
G. R&D on a Novel Breadboard Device Suitable for Carbon MonoxideRemediation in an Automotive PEM Fuel Cell Power Plant
Nguyen Minh (primary contact) and Stan Simpson (co-principal investigator)Honeywell Engines and Systems2525 W. 190th Street, MS-36-1-93140Torrance, CA 90504-6099Nguyen Minh: (310) 512-3515, fax: (310) 512-3432, e-mail: [email protected] Simpson: (310) 512-4604, fax: (310) 512-4128, e-mail: Stan.Simpson@ honeywell.com
Di-Jia Liu (co-principal investigator)Honeywell Des Plaines Technology Center50 E. Algonquin RoadDes Plaines, IL 60017-5016
DOE Program Manager: Patrick Davis(202) 586-8061, fax: (202) 586-9811, e-mail: [email protected]
Fuel Cell Power Systems FY 2000 Progress Report
54
ANL Technical Advisor: William Swift(630) 252-5964, fax: (630) 252-4473, e-mail: [email protected]
Contractor: Honeywell Engines and Systems, Torrance, CaliforniaPrime Contract No. DE-FC02-99EE50578, October 1999-December 2001
ObjectivesDevelop, implement, and demonstrate a new carbon monoxide removal system for use in polymer electrolytemembrane fuel cell (PEMFC) systems that provides high carbon monoxide (CO) removal efficiency, low parasitichydrogen consumption, and tolerance to CO input variation in an easily controlled manner. The system will bedesigned for removal of CO from a continuous reformate flow sized for a 10-kW PEMFC stack with a CO inputlevel of 5000 to 8000 parts per million (ppm).
OAAT R&D Plan: Task 7; Barrier E
Approach• In a 27-month program, Honeywell will research and develop a novel technology to selectively remove CO
from reformate fuel for use in PEMFCs. Two approaches to CO removal will be explored and developed: theadsorption/catalytic oxidation of CO (ACO) and the adsorption/electrocatalytic oxidation of CO (ECO).Following an initial 12-month R&D phase, the two approaches will be evaluated critically for downselection onthe basis of efficiency, system compatibility, and cost criteria. A breadboard CO-remediation system sized for a10-kW PEMFC stack will then be constructed and tested on both synthetic reformate and reformate obtainedfrom an operating fuel processor.
• The program consists of four major tasks:
- Research and development on two potentially viable approaches to remove CO from reformate.- Downselection of the most promising technique, on the basis of performance and cost.- Design and fabrication of a brassboard CO-removal device based upon the selected technology of choice.- Testing of the CO-removal system.
Accomplishments• Proof-of-principle experiments for both technologies have been demonstrated.
• CO-removal efficiency for both ACO and ECO has been increased significantly through optimization ofcatalyst, support, and active adsorption surface.
• Significant progress has been made in preliminary ACO/ECO engineering design.
Future Directions• Catalyst aging studies (currently in progress).
• Evaluation of parasitic hydrogen consumption and tolerance to CO transients.
• System engineering to reduce pressure drop and volume.
IntroductionThe PEMFC continues to benefit from intense
development efforts for its potential application inautomobiles. PEMFCs offer a number of inherentadvantages, including high efficiency, low noise,
low chemical emissions, and low operatingtemperature. Hydrogen is the most energetic fuel forthe PEMFC, but the lack of an existinginfrastructure for the routine handling anddistribution of hydrogen severely limits its utility.Alternatively, such hydrocarbon fuels as gasoline or
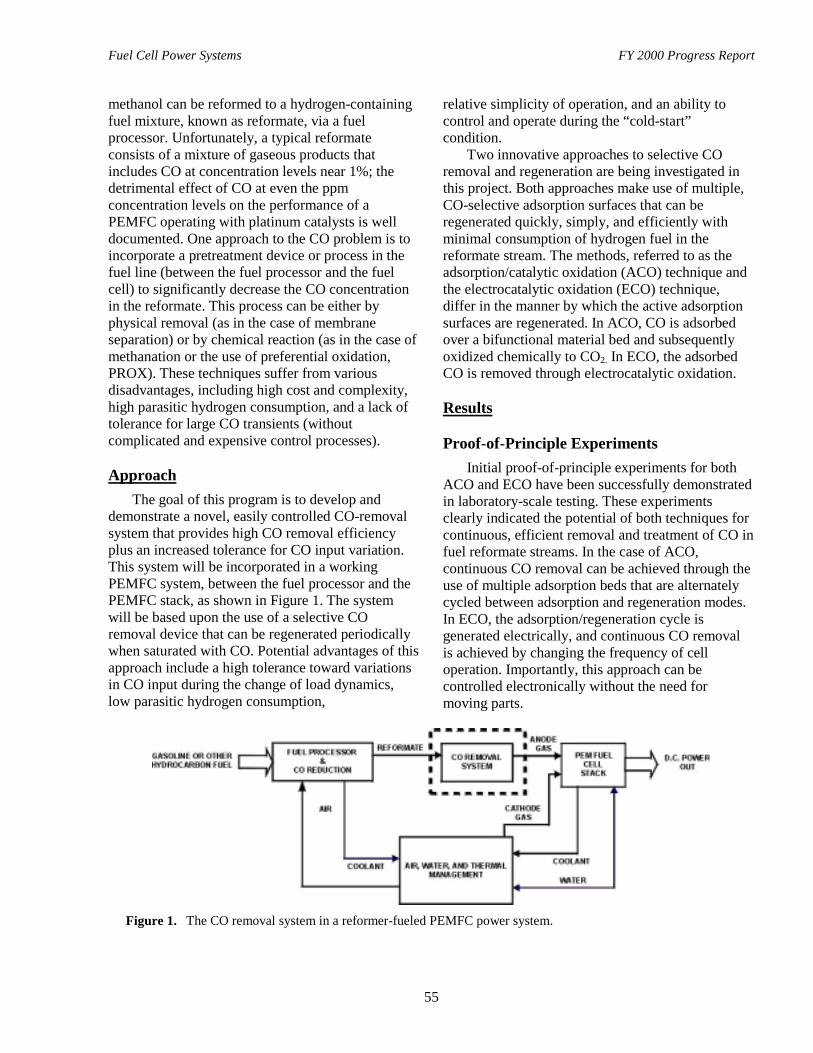
Fuel Cell Power Systems FY 2000 Progress Report
55
methanol can be reformed to a hydrogen-containingfuel mixture, known as reformate, via a fuelprocessor. Unfortunately, a typical reformateconsists of a mixture of gaseous products thatincludes CO at concentration levels near 1%; thedetrimental effect of CO at even the ppmconcentration levels on the performance of aPEMFC operating with platinum catalysts is welldocumented. One approach to the CO problem is toincorporate a pretreatment device or process in thefuel line (between the fuel processor and the fuelcell) to significantly decrease the CO concentrationin the reformate. This process can be either byphysical removal (as in the case of membraneseparation) or by chemical reaction (as in the case ofmethanation or the use of preferential oxidation,PROX). These techniques suffer from variousdisadvantages, including high cost and complexity,high parasitic hydrogen consumption, and a lack oftolerance for large CO transients (withoutcomplicated and expensive control processes).
ApproachThe goal of this program is to develop and
demonstrate a novel, easily controlled CO-removalsystem that provides high CO removal efficiencyplus an increased tolerance for CO input variation.This system will be incorporated in a workingPEMFC system, between the fuel processor and thePEMFC stack, as shown in Figure 1. The systemwill be based upon the use of a selective COremoval device that can be regenerated periodicallywhen saturated with CO. Potential advantages of thisapproach include a high tolerance toward variationsin CO input during the change of load dynamics,low parasitic hydrogen consumption,
relative simplicity of operation, and an ability tocontrol and operate during the “cold-start”condition.
Two innovative approaches to selective COremoval and regeneration are being investigated inthis project. Both approaches make use of multiple,CO-selective adsorption surfaces that can beregenerated quickly, simply, and efficiently withminimal consumption of hydrogen fuel in thereformate stream. The methods, referred to as theadsorption/catalytic oxidation (ACO) technique andthe electrocatalytic oxidation (ECO) technique,differ in the manner by which the active adsorptionsurfaces are regenerated. In ACO, CO is adsorbedover a bifunctional material bed and subsequentlyoxidized chemically to CO2. In ECO, the adsorbedCO is removed through electrocatalytic oxidation.
Results
Proof-of-Principle ExperimentsInitial proof-of-principle experiments for both
ACO and ECO have been successfully demonstratedin laboratory-scale testing. These experimentsclearly indicated the potential of both techniques forcontinuous, efficient removal and treatment of CO infuel reformate streams. In the case of ACO,continuous CO removal can be achieved through theuse of multiple adsorption beds that are alternatelycycled between adsorption and regeneration modes.In ECO, the adsorption/regeneration cycle isgenerated electrically, and continuous CO removalis achieved by changing the frequency of celloperation. Importantly, this approach can becontrolled electronically without the need formoving parts.
Figure 1. The CO removal system in a reformer-fueled PEMFC power system.
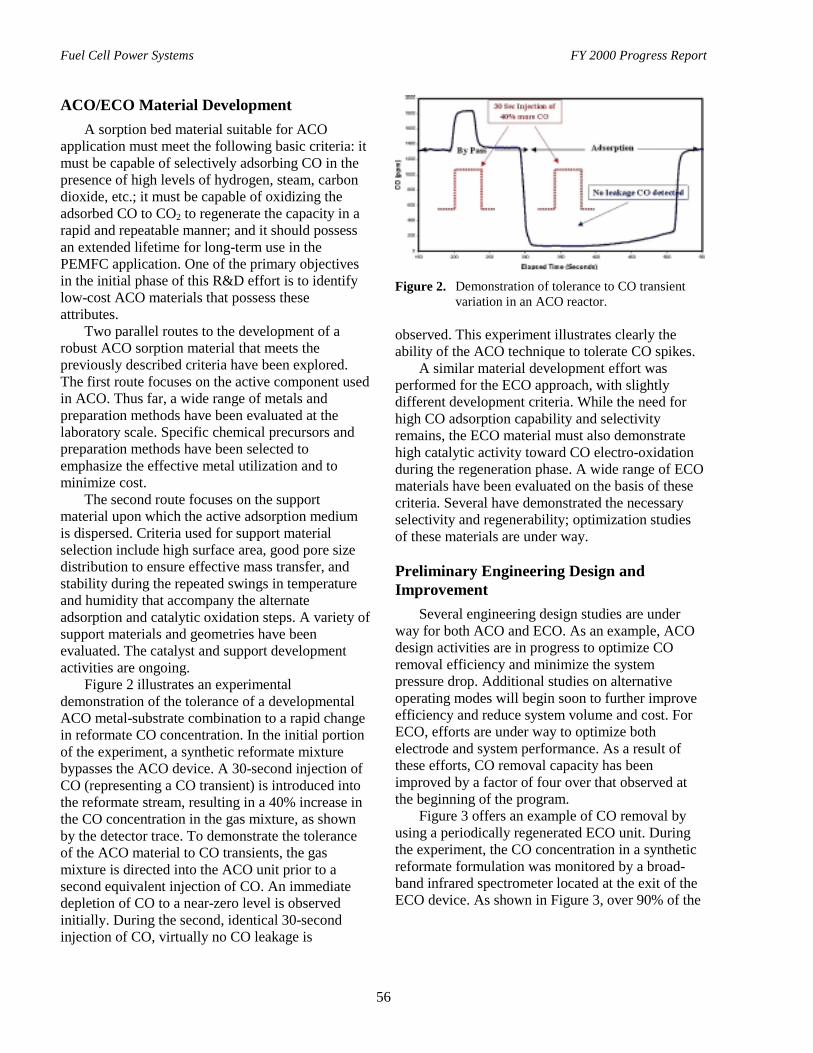
Fuel Cell Power Systems FY 2000 Progress Report
56
ACO/ECO Material DevelopmentA sorption bed material suitable for ACO
application must meet the following basic criteria: itmust be capable of selectively adsorbing CO in thepresence of high levels of hydrogen, steam, carbondioxide, etc.; it must be capable of oxidizing theadsorbed CO to CO2 to regenerate the capacity in arapid and repeatable manner; and it should possessan extended lifetime for long-term use in thePEMFC application. One of the primary objectivesin the initial phase of this R&D effort is to identifylow-cost ACO materials that possess theseattributes.
Two parallel routes to the development of arobust ACO sorption material that meets thepreviously described criteria have been explored.The first route focuses on the active component usedin ACO. Thus far, a wide range of metals andpreparation methods have been evaluated at thelaboratory scale. Specific chemical precursors andpreparation methods have been selected toemphasize the effective metal utilization and tominimize cost.
The second route focuses on the supportmaterial upon which the active adsorption mediumis dispersed. Criteria used for support materialselection include high surface area, good pore sizedistribution to ensure effective mass transfer, andstability during the repeated swings in temperatureand humidity that accompany the alternateadsorption and catalytic oxidation steps. A variety ofsupport materials and geometries have beenevaluated. The catalyst and support developmentactivities are ongoing.
Figure 2 illustrates an experimentaldemonstration of the tolerance of a developmentalACO metal-substrate combination to a rapid changein reformate CO concentration. In the initial portionof the experiment, a synthetic reformate mixturebypasses the ACO device. A 30-second injection ofCO (representing a CO transient) is introduced intothe reformate stream, resulting in a 40% increase inthe CO concentration in the gas mixture, as shownby the detector trace. To demonstrate the toleranceof the ACO material to CO transients, the gasmixture is directed into the ACO unit prior to asecond equivalent injection of CO. An immediatedepletion of CO to a near-zero level is observedinitially. During the second, identical 30-secondinjection of CO, virtually no CO leakage is
Figure 2. Demonstration of tolerance to CO transientvariation in an ACO reactor.
observed. This experiment illustrates clearly theability of the ACO technique to tolerate CO spikes.
A similar material development effort wasperformed for the ECO approach, with slightlydifferent development criteria. While the need forhigh CO adsorption capability and selectivityremains, the ECO material must also demonstratehigh catalytic activity toward CO electro-oxidationduring the regeneration phase. A wide range of ECOmaterials have been evaluated on the basis of thesecriteria. Several have demonstrated the necessaryselectivity and regenerability; optimization studiesof these materials are under way.
Preliminary Engineering Design andImprovement
Several engineering design studies are underway for both ACO and ECO. As an example, ACOdesign activities are in progress to optimize COremoval efficiency and minimize the systempressure drop. Additional studies on alternativeoperating modes will begin soon to further improveefficiency and reduce system volume and cost. ForECO, efforts are under way to optimize bothelectrode and system performance. As a result ofthese efforts, CO removal capacity has beenimproved by a factor of four over that observed atthe beginning of the program.
Figure 3 offers an example of CO removal byusing a periodically regenerated ECO unit. Duringthe experiment, the CO concentration in a syntheticreformate formulation was monitored by a broad-band infrared spectrometer located at the exit of theECO device. As shown in Figure 3, over 90% of the

Fuel Cell Power Systems FY 2000 Progress Report
57
Figure 3. Demonstration of removal of CO by aregenerated ECO unit.
CO in the reformate stream was removed during thecontinuous period of ECO operation.
ConclusionsTwo new technologies for the removal of CO
from processed hydrocarbon reformate for thePEMFC application have been introduced. Thefeasibility of both approaches, adsorption/catalyticoxidation and adsorption/electrocatalytic oxidation,was demonstrated through proof-of-concept
experiments. Significant progress has been made inimproving CO removal efficiency, capacity, andselectivity for both technologies. Preliminaryengineering studies have demonstrated the benefit ofboth approaches and have identified directions forfurther improvement.
Publications/Presentations/Patents• D-J Liu, J. Williams, M. Kaiser, D. Winstead,
J. Kudart, S.F. Simpson, and T.J. Rehg, “TwoNew Approaches for CO Removal fromReformate Fuel for the PEM Fuel CellApplication,” Society of Automotive Engineers,Paper No. 2000-01-0379, Detroit, Mich., 2000.
• D-J Liu, D. Winstead, M. Kaiser, and T.J. Rehg,“Removing CO from Reformate for Fuel CellApplication using a Regenerable COAdsorption/Catalytic Oxidation Bed Device,”U.S. Patent Pending.
• T.J. Rehg, D-J Liu, M. Kaiser, and J. Williams,“An Electro-Catalytic Oxidation (ECO) Deviceto Remove CO from Reformate for Fuel CellApplication,” U.S. Patent Pending.
H. CO Clean-Up Development
Michael Inbody (primary contact), Rod Borup, James Hedstrom, Byron Morton, JinKi Hong, andJosé TafoyaESA-EPE, MS J576Los Alamos National Laboratory, Los Alamos, NM 87545(505) 665-7853, fax: (505) 665-9507, e-mail: [email protected]
DOE Program Manager: JoAnn Milliken(202) 586-2480, fax: (202) 586-9811, e-mail: [email protected]
ObjectivesResearch and develop carbon monoxide clean-up technology for integration into fuel processor systems to enablethem to meet the fuel purity requirements for a fuel cell stack by:
• Removing trace contaminants to purity levels required by the fuel cell stack.
• Maintaining system efficiency by minimizing hydrogen consumption.
• Operating effectively through automotive transients – changes in power level, start-up, and shutdown.
• Meeting overall fuel processor targets for energy efficiency, power density, specific power, and cost.

Fuel Cell Power Systems FY 2000 Progress Report
58
OAAT R&D Plan: Task 3; Barrier E
Approach• Combine laboratory investigation with industrial collaboration to develop working processes and hardware for
fuel processor systems.
• Investigate and develop CO clean-up technology.
- Investigate catalysts and catalyst performance to improve baseline performance.- Use carefully instrumented and controlled experiments at the component level to measure performance.- Develop proof-of-concept hardware on a laboratory scale.- Develop design tools and models for application to specific design problems.
• Work with fuel processor developers to integrate CO clean-up technology into fuel processor systems.
- Collaborate on specific designs for automotive hardware and system integration.- Fabricate hardware and test performance of integrated CO clean-up technology.
Accomplishments• Developed a laboratory PROX system for testing PROX concepts and catalysts, based on a multistage reactor
approach.
• Conducted catalyst evaluation in a single-stage PROX configuration.
- Measured temperature and gas composition profiles of catalyst volumes in the baseline PROXconfiguration.
- Conducted initial series of tests on catalyzed ceramic foams.
• Conducted transient PROX experiments in the four-stage configuration; measured dynamic response to inletCO concentration variation.
• Measured kinetic data on precious metal catalysts in a microscale isothermal catalyst test reactor.
Future Directions• Work on technology transfer through industrial collaborations; integrate PROX technology into developer fuel
processor designs.
• Continue testing of catalysts and of multistage PROX hardware.
- Measure reformate composition effects, hydrogen consumption, and CO conversion.- Conduct transient tests, including power transients and start-up transients.- Test catalysts and catalyst supports for compact automotive designs.
• Continue development of PROX design methodology to delineate successful understanding of PROXmechanisms.
• Address further challenges to automotive implementation; develop technology to reduce start-up times andenable cold starts.
IntroductionThis report describes research conducted
during fiscal year (FY) 2000 on the development ofcarbon monoxide clean-up technologies as a subsetof reformate clean-up technology for integration intoautomotive fuel processor systems. Reformate clean-up typically is the last unit operation in the fuelprocessor process stream in most fuel processor-fuel
cell system architectures. Its function is to removethe trace contaminants from the fuel processor outletstream to meet the fuel purity requirements of thefuel cell stack. The research objective then is todevelop reformate clean-up technology that not onlyremoves the trace contaminants, but does so withminimal hydrogen consumption to maintain systemefficiency. Automotive applications require that thetechnology enable the fuel processor to meet the fuel
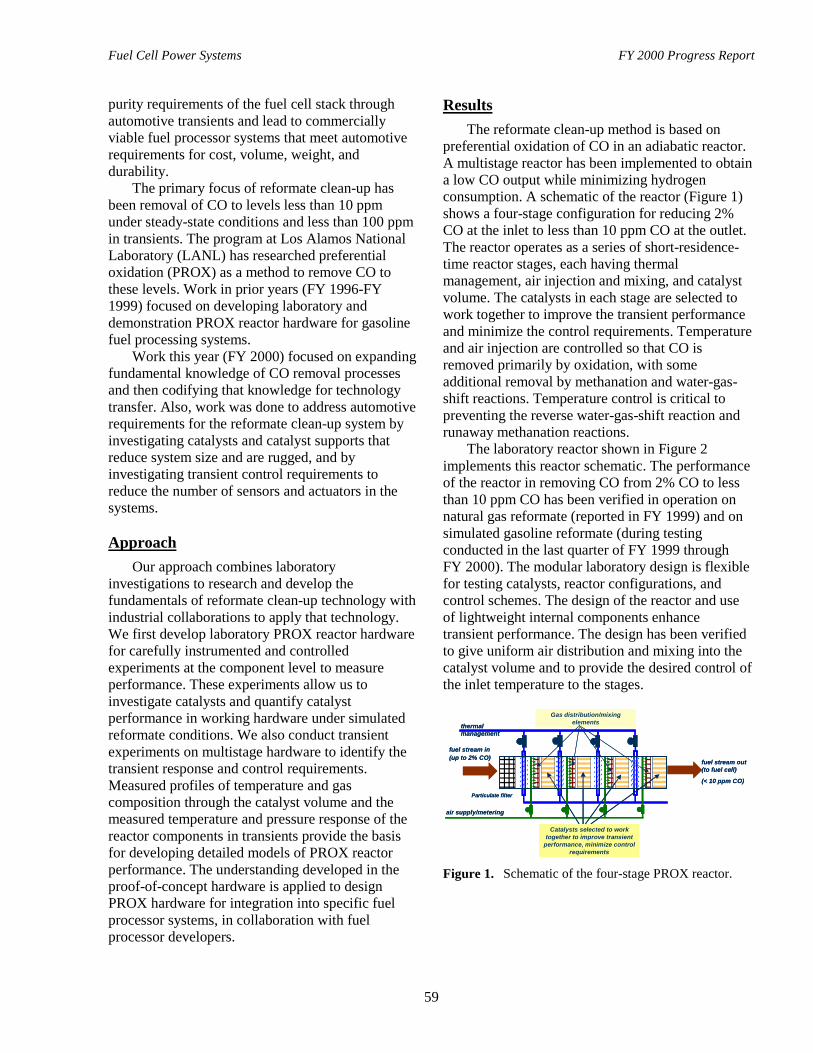
Fuel Cell Power Systems FY 2000 Progress Report
59
purity requirements of the fuel cell stack throughautomotive transients and lead to commerciallyviable fuel processor systems that meet automotiverequirements for cost, volume, weight, anddurability.
The primary focus of reformate clean-up hasbeen removal of CO to levels less than 10 ppmunder steady-state conditions and less than 100 ppmin transients. The program at Los Alamos NationalLaboratory (LANL) has researched preferentialoxidation (PROX) as a method to remove CO tothese levels. Work in prior years (FY 1996-FY1999) focused on developing laboratory anddemonstration PROX reactor hardware for gasolinefuel processing systems.
Work this year (FY 2000) focused on expandingfundamental knowledge of CO removal processesand then codifying that knowledge for technologytransfer. Also, work was done to address automotiverequirements for the reformate clean-up system byinvestigating catalysts and catalyst supports thatreduce system size and are rugged, and byinvestigating transient control requirements toreduce the number of sensors and actuators in thesystems.
ApproachOur approach combines laboratory
investigations to research and develop thefundamentals of reformate clean-up technology withindustrial collaborations to apply that technology.We first develop laboratory PROX reactor hardwarefor carefully instrumented and controlledexperiments at the component level to measureperformance. These experiments allow us toinvestigate catalysts and quantify catalystperformance in working hardware under simulatedreformate conditions. We also conduct transientexperiments on multistage hardware to identify thetransient response and control requirements.Measured profiles of temperature and gascomposition through the catalyst volume and themeasured temperature and pressure response of thereactor components in transients provide the basisfor developing detailed models of PROX reactorperformance. The understanding developed in theproof-of-concept hardware is applied to designPROX hardware for integration into specific fuelprocessor systems, in collaboration with fuelprocessor developers.
ResultsThe reformate clean-up method is based on
preferential oxidation of CO in an adiabatic reactor.A multistage reactor has been implemented to obtaina low CO output while minimizing hydrogenconsumption. A schematic of the reactor (Figure 1)shows a four-stage configuration for reducing 2%CO at the inlet to less than 10 ppm CO at the outlet.The reactor operates as a series of short-residence-time reactor stages, each having thermalmanagement, air injection and mixing, and catalystvolume. The catalysts in each stage are selected towork together to improve the transient performanceand minimize the control requirements. Temperatureand air injection are controlled so that CO isremoved primarily by oxidation, with someadditional removal by methanation and water-gas-shift reactions. Temperature control is critical topreventing the reverse water-gas-shift reaction andrunaway methanation reactions.
The laboratory reactor shown in Figure 2implements this reactor schematic. The performanceof the reactor in removing CO from 2% CO to lessthan 10 ppm CO has been verified in operation onnatural gas reformate (reported in FY 1999) and onsimulated gasoline reformate (during testingconducted in the last quarter of FY 1999 throughFY 2000). The modular laboratory design is flexiblefor testing catalysts, reactor configurations, andcontrol schemes. The design of the reactor and useof lightweight internal components enhancetransient performance. The design has been verifiedto give uniform air distribution and mixing into thecatalyst volume and to provide the desired control ofthe inlet temperature to the stages.
air supply/metering
fuel stream out (to fuel cell)
(< 10 ppm CO)
thermal management
fuel stream in(up to 2% CO)
Particulate filter
Catalysts selected to work together to improve transient
performance, minimize control requirements
Gas distribution/mixing elements
air supply/metering
fuel stream out (to fuel cell)
(< 10 ppm CO)
thermal management
fuel stream in(up to 2% CO)
Particulate filter
Catalysts selected to work together to improve transient
performance, minimize control requirements
Gas distribution/mixing elements
Figure 1. Schematic of the four-stage PROX reactor.
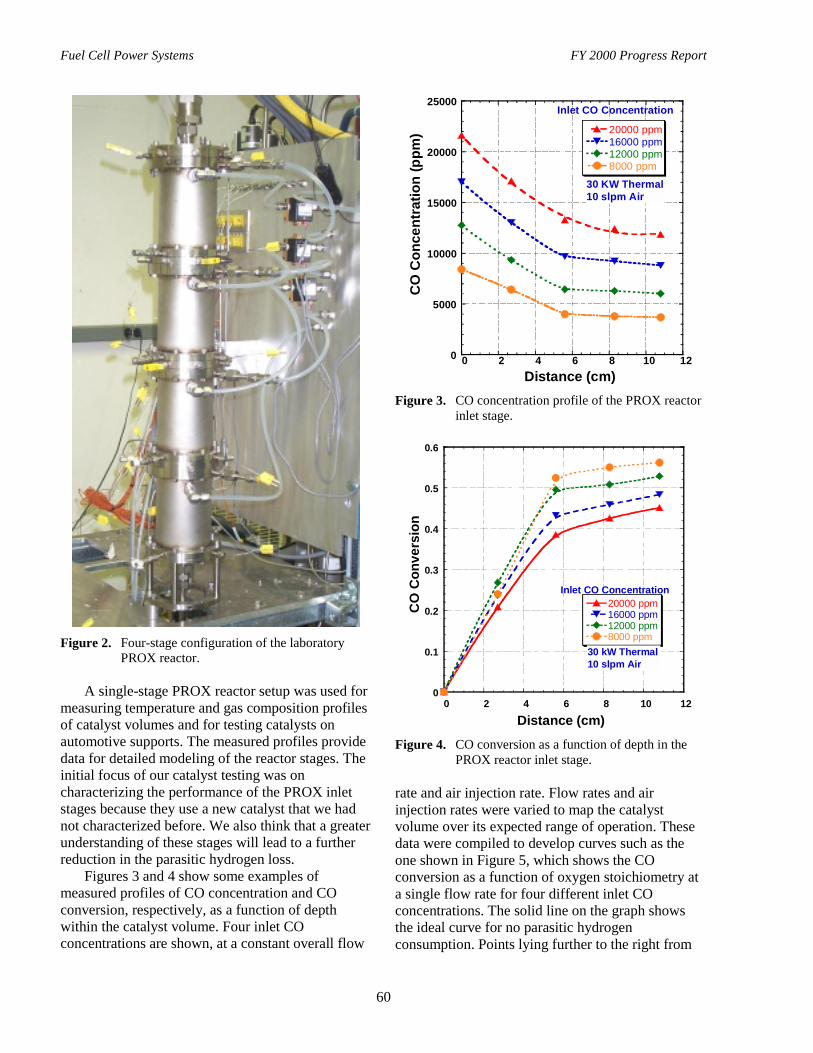
Fuel Cell Power Systems FY 2000 Progress Report
60
Figure 2. Four-stage configuration of the laboratoryPROX reactor.
A single-stage PROX reactor setup was used formeasuring temperature and gas composition profilesof catalyst volumes and for testing catalysts onautomotive supports. The measured profiles providedata for detailed modeling of the reactor stages. Theinitial focus of our catalyst testing was oncharacterizing the performance of the PROX inletstages because they use a new catalyst that we hadnot characterized before. We also think that a greaterunderstanding of these stages will lead to a furtherreduction in the parasitic hydrogen loss.
Figures 3 and 4 show some examples ofmeasured profiles of CO concentration and COconversion, respectively, as a function of depthwithin the catalyst volume. Four inlet COconcentrations are shown, at a constant overall flow
0
5000
10000
15000
20000
25000
0 2 4 6 8 10 12
20000 ppm16000 ppm12000 ppm8000 ppm
CO
Con
cent
ratio
n (p
pm)
Distance (cm)
30 KW Thermal10 slpm Air
Inlet CO Concentration
Figure 3. CO concentration profile of the PROX reactorinlet stage.
0
0.1
0.2
0.3
0.4
0.5
0.6
0 2 4 6 8 10 12
20000 ppm16000 ppm12000 ppm8000 ppm
CO
Con
vers
ion
Distance (cm)
30 kW Thermal10 slpm Air
Inlet CO Concentration
Figure 4. CO conversion as a function of depth in thePROX reactor inlet stage.
rate and air injection rate. Flow rates and airinjection rates were varied to map the catalystvolume over its expected range of operation. Thesedata were compiled to develop curves such as theone shown in Figure 5, which shows the COconversion as a function of oxygen stoichiometry ata single flow rate for four different inlet COconcentrations. The solid line on the graph showsthe ideal curve for no parasitic hydrogenconsumption. Points lying further to the right from
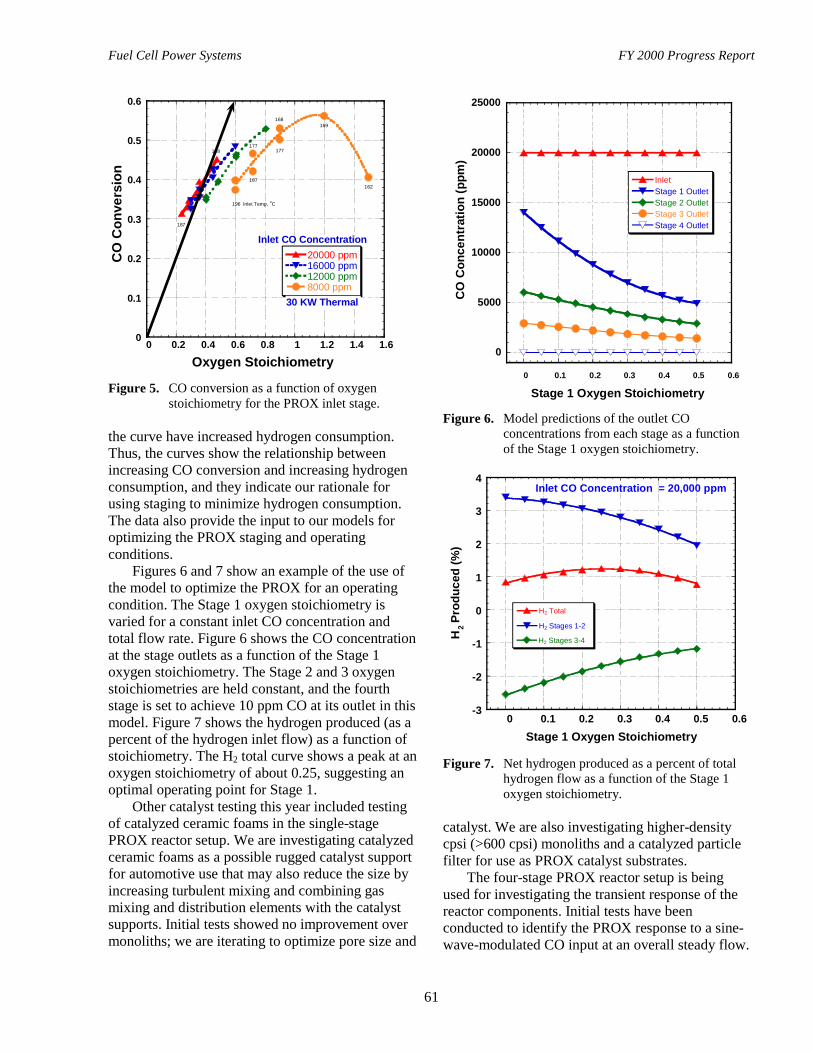
Fuel Cell Power Systems FY 2000 Progress Report
61
0
0.1
0.2
0.3
0.4
0.5
0.6
0 0.2 0.4 0.6 0.8 1 1.2 1.4 1.6
20000 ppm16000 ppm12000 ppm8000 ppm
CO
Con
vers
ion
Oxygen Stoichiometry
30 KW Thermal
Inlet CO Concentration187
196 Inlet Temp, oC
177177
187
168169
162
168
Figure 5. CO conversion as a function of oxygenstoichiometry for the PROX inlet stage.
the curve have increased hydrogen consumption.Thus, the curves show the relationship betweenincreasing CO conversion and increasing hydrogenconsumption, and they indicate our rationale forusing staging to minimize hydrogen consumption.The data also provide the input to our models foroptimizing the PROX staging and operatingconditions.
Figures 6 and 7 show an example of the use ofthe model to optimize the PROX for an operatingcondition. The Stage 1 oxygen stoichiometry isvaried for a constant inlet CO concentration andtotal flow rate. Figure 6 shows the CO concentrationat the stage outlets as a function of the Stage 1oxygen stoichiometry. The Stage 2 and 3 oxygenstoichiometries are held constant, and the fourthstage is set to achieve 10 ppm CO at its outlet in thismodel. Figure 7 shows the hydrogen produced (as apercent of the hydrogen inlet flow) as a function ofstoichiometry. The H2 total curve shows a peak at anoxygen stoichiometry of about 0.25, suggesting anoptimal operating point for Stage 1.
Other catalyst testing this year included testingof catalyzed ceramic foams in the single-stagePROX reactor setup. We are investigating catalyzedceramic foams as a possible rugged catalyst supportfor automotive use that may also reduce the size byincreasing turbulent mixing and combining gasmixing and distribution elements with the catalystsupports. Initial tests showed no improvement overmonoliths; we are iterating to optimize pore size and
0
5000
10000
15000
20000
25000
0 0.1 0.2 0.3 0.4 0.5 0.6
InletStage 1 OutletStage 2 OutletStage 3 OutletStage 4 Outlet
CO
Con
cent
ratio
n (p
pm)
Stage 1 Oxygen Stoichiometry
Figure 6. Model predictions of the outlet COconcentrations from each stage as a functionof the Stage 1 oxygen stoichiometry.
-3
-2
-1
0
1
2
3
4
0 0.1 0.2 0.3 0.4 0.5 0.6
H2 Total
H2 Stages 1-2
H2 Stages 3-4H2 P
rodu
ced
(%)
Stage 1 Oxygen Stoichiometry
Inlet CO Concentration = 20,000 ppm
Figure 7. Net hydrogen produced as a percent of totalhydrogen flow as a function of the Stage 1oxygen stoichiometry.
catalyst. We are also investigating higher-densitycpsi (>600 cpsi) monoliths and a catalyzed particlefilter for use as PROX catalyst substrates.
The four-stage PROX reactor setup is beingused for investigating the transient response of thereactor components. Initial tests have beenconducted to identify the PROX response to a sine-wave-modulated CO input at an overall steady flow.
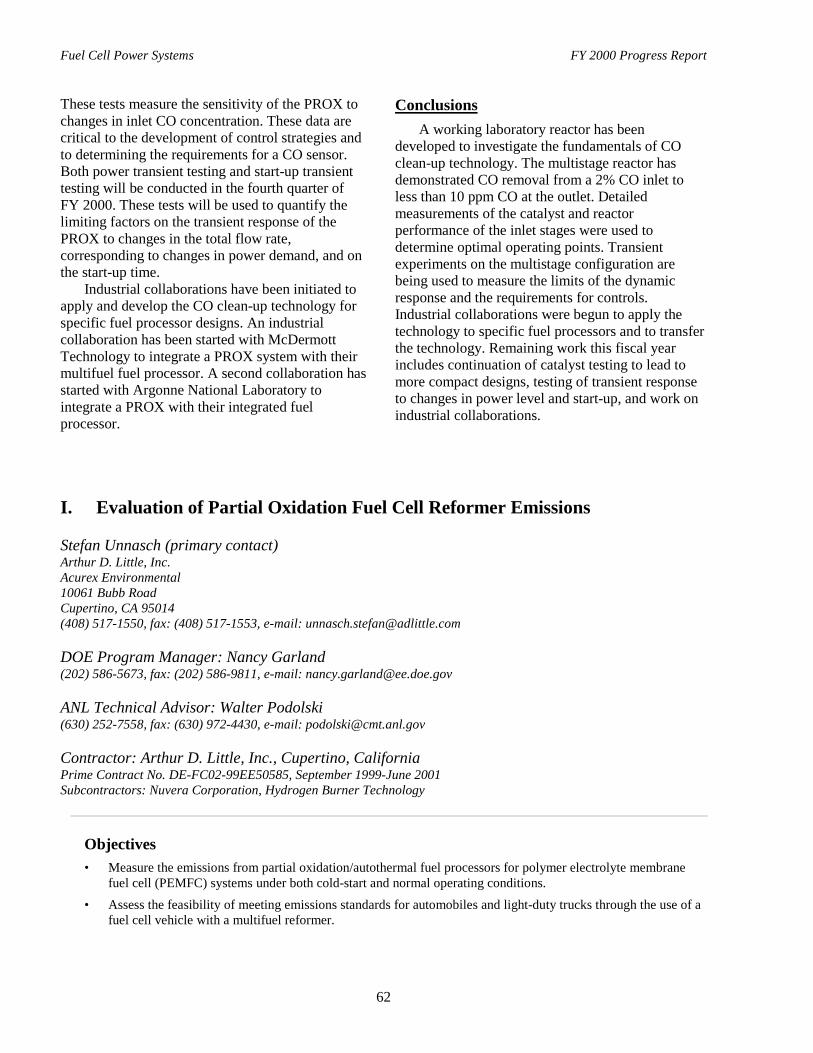
Fuel Cell Power Systems FY 2000 Progress Report
62
These tests measure the sensitivity of the PROX tochanges in inlet CO concentration. These data arecritical to the development of control strategies andto determining the requirements for a CO sensor.Both power transient testing and start-up transienttesting will be conducted in the fourth quarter ofFY 2000. These tests will be used to quantify thelimiting factors on the transient response of thePROX to changes in the total flow rate,corresponding to changes in power demand, and onthe start-up time.
Industrial collaborations have been initiated toapply and develop the CO clean-up technology forspecific fuel processor designs. An industrialcollaboration has been started with McDermottTechnology to integrate a PROX system with theirmultifuel fuel processor. A second collaboration hasstarted with Argonne National Laboratory tointegrate a PROX with their integrated fuelprocessor.
ConclusionsA working laboratory reactor has been
developed to investigate the fundamentals of COclean-up technology. The multistage reactor hasdemonstrated CO removal from a 2% CO inlet toless than 10 ppm CO at the outlet. Detailedmeasurements of the catalyst and reactorperformance of the inlet stages were used todetermine optimal operating points. Transientexperiments on the multistage configuration arebeing used to measure the limits of the dynamicresponse and the requirements for controls.Industrial collaborations were begun to apply thetechnology to specific fuel processors and to transferthe technology. Remaining work this fiscal yearincludes continuation of catalyst testing to lead tomore compact designs, testing of transient responseto changes in power level and start-up, and work onindustrial collaborations.
I. Evaluation of Partial Oxidation Fuel Cell Reformer Emissions
Stefan Unnasch (primary contact)Arthur D. Little, Inc.Acurex Environmental10061 Bubb RoadCupertino, CA 95014(408) 517-1550, fax: (408) 517-1553, e-mail: [email protected]
DOE Program Manager: Nancy Garland(202) 586-5673, fax: (202) 586-9811, e-mail: [email protected]
ANL Technical Advisor: Walter Podolski(630) 252-7558, fax: (630) 972-4430, e-mail: [email protected]
Contractor: Arthur D. Little, Inc., Cupertino, CaliforniaPrime Contract No. DE-FC02-99EE50585, September 1999-June 2001Subcontractors: Nuvera Corporation, Hydrogen Burner Technology
Objectives• Measure the emissions from partial oxidation/autothermal fuel processors for polymer electrolyte membrane
fuel cell (PEMFC) systems under both cold-start and normal operating conditions.• Assess the feasibility of meeting emissions standards for automobiles and light-duty trucks through the use of a
fuel cell vehicle with a multifuel reformer.

Fuel Cell Power Systems FY 2000 Progress Report
63
OAAT R&D Plan: Task 5; Barriers F and G
Approach• Define a representative test cycle consisting of both cold-start and normal operating conditions.
• Use the established test cycle to quantify emissions from a partial oxidation (POX) reformer before and afteranode-gas-burner treatment.
• Perform the test procedure using four different feed fuels in the reformer (gasoline, methanol, ethanol, andnatural gas), as well as different catalyst formulations for the anode gas burner.
• Perform the test procedure on both Nuvera (formerly Epyx) and Hydrogen Burner Technology (HBT) fuelprocessors to quantify the emissions impact of fuel reformer design.
• Use reasonable approximations and estimates to convert emissions data from a gram-per-unit fuel basis to apredicted gram-per-mile basis.
Accomplishments• Assessed sensitivity of gas chromatograph.
• Identified sampling procedures.
Future DirectionsDevelop control strategies to minimize emissions.
IntroductionThe operation of fuel reformers is generally
divided into two operating modes: start-up andnormal partial oxidation. During start-up, the fuelprocessor burns fuel at near-stoichiometricconditions until critical system temperatures andpressures stabilize to target values. Once the targetconditions are reached, the reformer operates in thenormal mode, in which the fuel processor burns fuelat very rich conditions. Since the two modesencompass considerably different operatingconditions, it follows that the emissions associatedwith each of these modes also differ considerably.
The combustor is typically cold under start-upconditions, so the emissions produced during thisbrief period (target times are under 30 seconds) canbe substantially higher than those produced duringthe remaining, much longer portion of the drivingcycle. The pollutant emissions produced in thisoperating mode include NOx, CO, formaldehyde,and organic compounds. These organic compounds,which include hydrocarbons, alcohols, andaldehydes, are referred to in California and areregulated as nonmethane organic gases (NMOG).
Under normal operating conditions, in which thecombustor is sufficiently warm and operated under
fuel-rich conditions, virtually no NOx is formed(although the formation of ammonia is possible).Most hydrocarbons are converted to carbon dioxide(or methane, if the reaction is incomplete); however,trace levels of hydrocarbons can pass through thefuel processor and fuel cell. The shift reactors andthe preferential oxidation (PROX) reactor reduceCO in the product gas, resulting in a feedconcentration to the fuel cell that can be less than20 ppm. The fuel cell may also convert CO to CO2,thereby further reducing exhaust CO levels. Thus, ofthe criteria pollutants (NOx, CO, and hydrocarbons[NMOG]), NOx and CO levels are generally wellbelow the most aggressive standards. NMOGconcentrations, however, can exceed emission goalsunless these compounds are efficiently eliminated inthe catalytic burner.
Figure 1 shows estimated NMOG emissionsfrom partial oxidation (POX) systems fueled bycompressed natural gas (CNG) and gasoline [1]. Thefigure clearly indicates the trend described abovewith respect to the relative contribution of start-upemissions and the emissions levels over the totaldriving cycle. Furthermore, the figure also indicatesthe importance of catalyst performance in reducingNMOG emissions. For example, if the catalyst
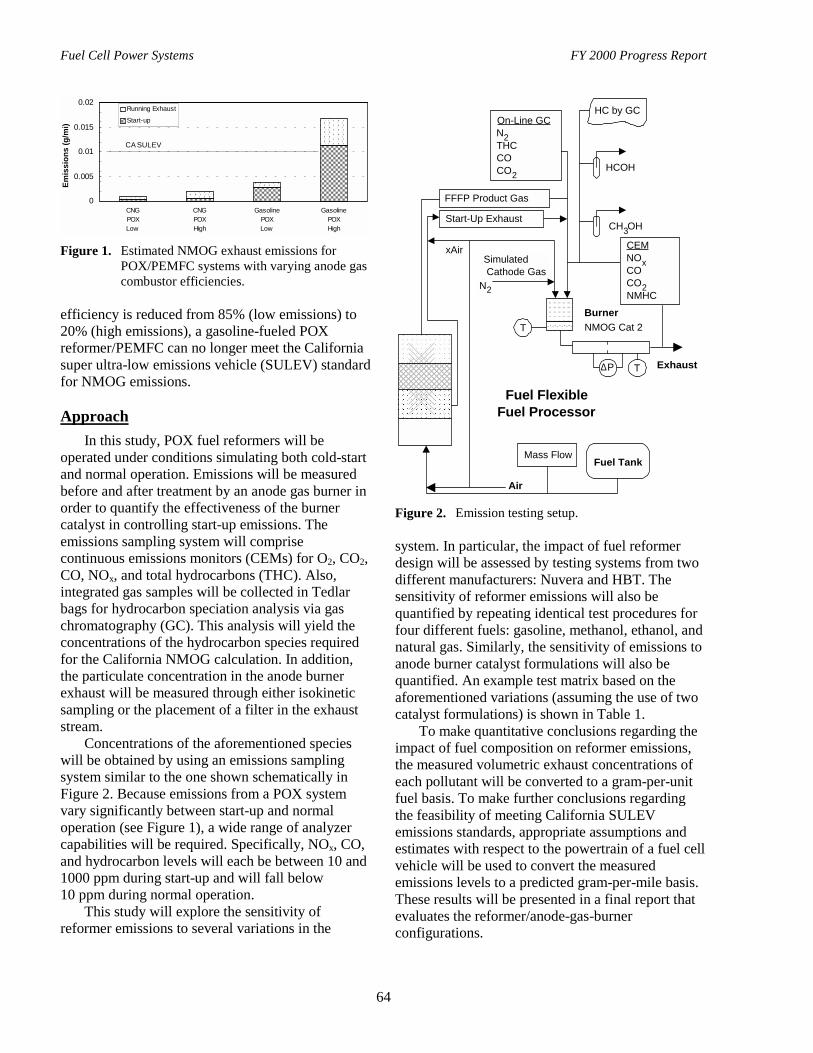
Fuel Cell Power Systems FY 2000 Progress Report
64
0
0.005
0.01
0.015
0.02
CNGPOXLow
CNGPOXHigh
GasolinePOXLow
GasolinePOXHigh
Emis
sion
s (g
/mi)
.
Running Exhaust Start-up
CA SULEV
Figure 1. Estimated NMOG exhaust emissions forPOX/PEMFC systems with varying anode gascombustor efficiencies.
efficiency is reduced from 85% (low emissions) to20% (high emissions), a gasoline-fueled POXreformer/PEMFC can no longer meet the Californiasuper ultra-low emissions vehicle (SULEV) standardfor NMOG emissions.
ApproachIn this study, POX fuel reformers will be
operated under conditions simulating both cold-startand normal operation. Emissions will be measuredbefore and after treatment by an anode gas burner inorder to quantify the effectiveness of the burnercatalyst in controlling start-up emissions. Theemissions sampling system will comprisecontinuous emissions monitors (CEMs) for O2, CO2,CO, NOx, and total hydrocarbons (THC). Also,integrated gas samples will be collected in Tedlarbags for hydrocarbon speciation analysis via gaschromatography (GC). This analysis will yield theconcentrations of the hydrocarbon species requiredfor the California NMOG calculation. In addition,the particulate concentration in the anode burnerexhaust will be measured through either isokineticsampling or the placement of a filter in the exhauststream.
Concentrations of the aforementioned specieswill be obtained by using an emissions samplingsystem similar to the one shown schematically inFigure 2. Because emissions from a POX systemvary significantly between start-up and normaloperation (see Figure 1), a wide range of analyzercapabilities will be required. Specifically, NOx, CO,and hydrocarbon levels will each be between 10 and1000 ppm during start-up and will fall below10 ppm during normal operation.
This study will explore the sensitivity ofreformer emissions to several variations in the
Air
Exhaust
Burner
FFFP Product Gas
Start-Up Exhaust
Simulated Cathode Gas
N2
NMOG Cat 2
∆P T
CH3OH
HCOH
HC by GC
CEMNOxCOCO2NMHC
On-Line GCN2THCCOCO2
T
Fuel Flexible Fuel Processor
Fuel Tank
xAir
Mass Flow
Figure 2. Emission testing setup.
system. In particular, the impact of fuel reformerdesign will be assessed by testing systems from twodifferent manufacturers: Nuvera and HBT. Thesensitivity of reformer emissions will also bequantified by repeating identical test procedures forfour different fuels: gasoline, methanol, ethanol, andnatural gas. Similarly, the sensitivity of emissions toanode burner catalyst formulations will also bequantified. An example test matrix based on theaforementioned variations (assuming the use of twocatalyst formulations) is shown in Table 1.
To make quantitative conclusions regarding theimpact of fuel composition on reformer emissions,the measured volumetric exhaust concentrations ofeach pollutant will be converted to a gram-per-unitfuel basis. To make further conclusions regardingthe feasibility of meeting California SULEVemissions standards, appropriate assumptions andestimates with respect to the powertrain of a fuel cellvehicle will be used to convert the measuredemissions levels to a predicted gram-per-mile basis.These results will be presented in a final report thatevaluates the reformer/anode-gas-burnerconfigurations.
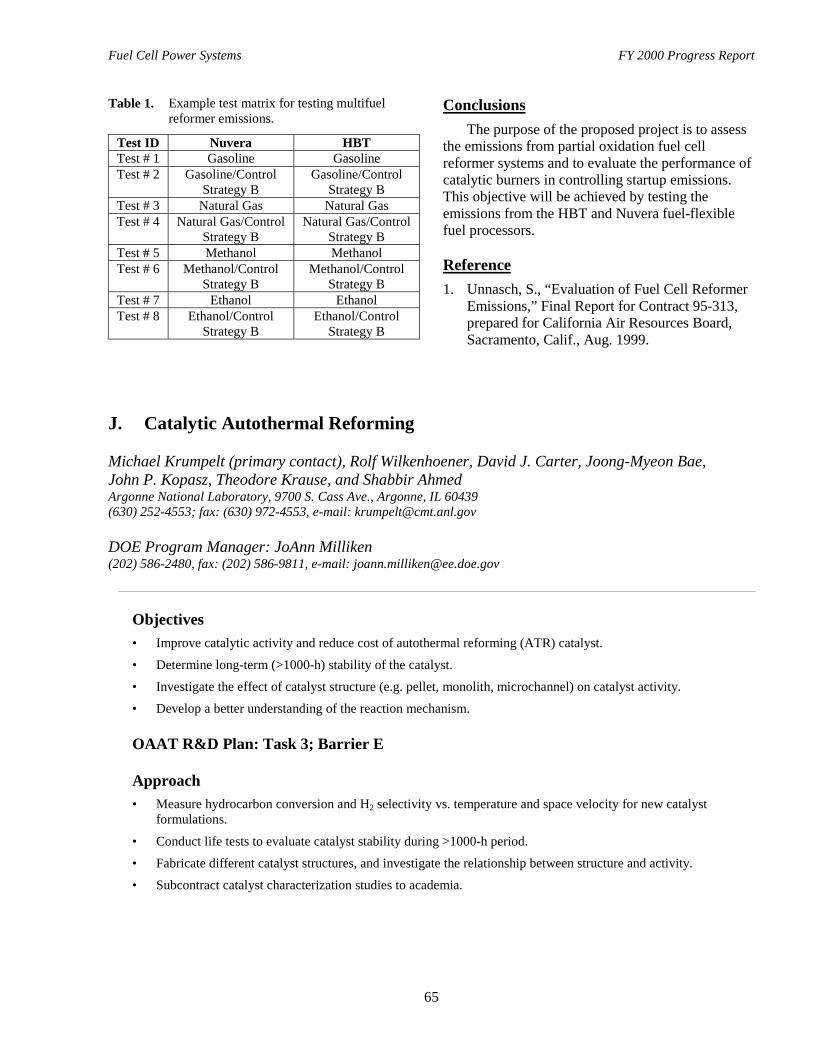
Fuel Cell Power Systems FY 2000 Progress Report
65
Table 1. Example test matrix for testing multifuelreformer emissions.
Test ID Nuvera HBTTest # 1 Gasoline GasolineTest # 2 Gasoline/Control
Strategy BGasoline/Control
Strategy BTest # 3 Natural Gas Natural GasTest # 4 Natural Gas/Control
Strategy BNatural Gas/Control
Strategy BTest # 5 Methanol MethanolTest # 6 Methanol/Control
Strategy BMethanol/Control
Strategy BTest # 7 Ethanol EthanolTest # 8 Ethanol/Control
Strategy BEthanol/Control
Strategy B
ConclusionsThe purpose of the proposed project is to assess
the emissions from partial oxidation fuel cellreformer systems and to evaluate the performance ofcatalytic burners in controlling startup emissions.This objective will be achieved by testing theemissions from the HBT and Nuvera fuel-flexiblefuel processors.
Reference1. Unnasch, S., “Evaluation of Fuel Cell Reformer
Emissions,” Final Report for Contract 95-313,prepared for California Air Resources Board,Sacramento, Calif., Aug. 1999.
J. Catalytic Autothermal Reforming
Michael Krumpelt (primary contact), Rolf Wilkenhoener, David J. Carter, Joong-Myeon Bae,John P. Kopasz, Theodore Krause, and Shabbir AhmedArgonne National Laboratory, 9700 S. Cass Ave., Argonne, IL 60439(630) 252-4553; fax: (630) 972-4553, e-mail: [email protected]
DOE Program Manager: JoAnn Milliken(202) 586-2480, fax: (202) 586-9811, e-mail: [email protected]
Objectives• Improve catalytic activity and reduce cost of autothermal reforming (ATR) catalyst.
• Determine long-term (>1000-h) stability of the catalyst.
• Investigate the effect of catalyst structure (e.g. pellet, monolith, microchannel) on catalyst activity.
• Develop a better understanding of the reaction mechanism.
OAAT R&D Plan: Task 3; Barrier E
Approach• Measure hydrocarbon conversion and H2 selectivity vs. temperature and space velocity for new catalyst
formulations.
• Conduct life tests to evaluate catalyst stability during >1000-h period.
• Fabricate different catalyst structures, and investigate the relationship between structure and activity.
• Subcontract catalyst characterization studies to academia.
Fuel Cell Power Systems FY 2000 Progress Report
66
Accomplishments• Several non-noble metal formulations with excellent activity were identified.
• The importance of oxide ion conductivity in the catalyst substrate was clearly established.
• Catalyst stability during 1,000 h was demonstrated.
• With the catalyst in a microchannel configuration, an H2 selectivity of >50% (dry, N2-free basis) was observedat a space velocity of 125,000 h-1.
• Strong metal-support interactions were observed by using x-ray photoelectron spectroscopy (XPS) andextended x-ray absorption fine structure (EXAFS) methods.
• Patent for catalyst formulation was licensed to United Catalysts (now known by SudChemie, Inc.)
Future Directions• Catalyst cost vs. activity issues will be addressed.
• Work will continue on determining optimal metal(s) and support composition that maximizes catalytic activity,provides long-term stability, and provides tolerance to catalyst poisons.
• Surface area will be increased.
• Surface stability and mechanical properties need more attention.
• Relationship between structure (supported vs. free-standing configurations) and catalytic activity will beevaluated.
• Understanding of the chemical and physical properties of the catalyst and how these properties influencecatalytic activity will be increased.
IntroductionIn prior years, Argonne National Laboratory has
articulated the merits of autothermal reforming forautomotive fuel cell systems in terms of reactorvolume and weight, as well as for fast transientresponse and start-up. We have reported goodsuccess with a catalyst derived from solid oxide fuelcell technology, where the metal is a transition metalelement and the substrate is an oxide ion conductor,such as zirconia, ceria, or lanthanum gallate. Wehave also shown that a good operating temperatureis 700oC, which requires catalytic enhancement ofthe reaction rates.
ApproachDuring the past year, we have synthesized new
catalyst formulations in which either the metal or thesubstrate composition was varied. We haveevaluated the catalytic activity of these new catalystformulations by measuring the hydrocarbonconversion and H2 selectivity as a function oftemperature and space velocity in a microreactorsystem. We have conducted life tests (>1000 h) toevaluate the stability of these catalysts toward
deactivation. We have fabricated new structuredforms of the catalyst, such as a monolith or a spiralmicrochannel configuration, to improve catalystdurability and to minimize diffusional resistances.Using characterization techniques, such asinductively coupled plasma (ICP), energy-dispersivex-ray spectroscopy (EDX), XPS/Auger, EXAFS,x-ray absorption near-edge spectroscopy (XANES),and transmission electron microscopy (TEM), abetter understanding of the chemical and physicalproperties of the ATR catalyst and how theseproperties influence the catalytic activity has begunto develop.
ResultsA major focus of the work during this period
was to identify potential non-noble transition metalsto replace precious metals, such as Pt, in order toreduce the cost of the catalyst. The catalytic activityof various metals supported on a doped ceriasubstrate was evaluated by measuring thehydrocarbon (2,2,4-trimethylpentane) conversionand H2 selectivity as a function of temperature andspace velocity. The percent conversion of
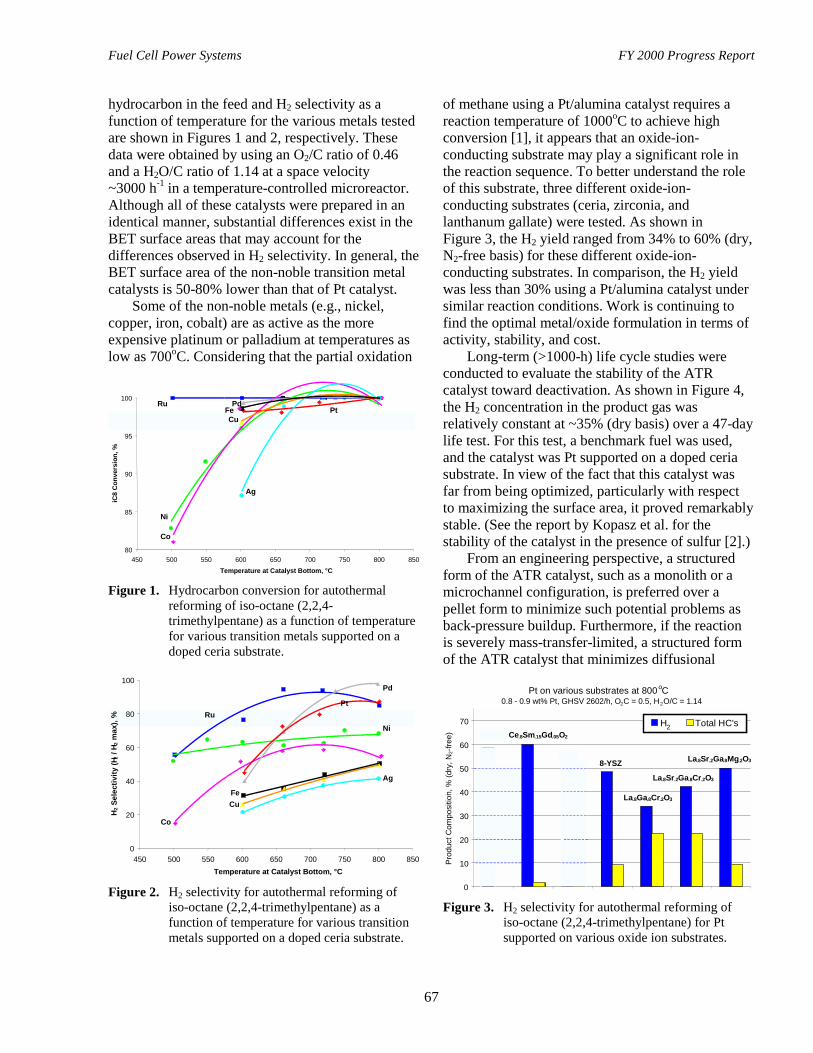
Fuel Cell Power Systems FY 2000 Progress Report
67
hydrocarbon in the feed and H2 selectivity as afunction of temperature for the various metals testedare shown in Figures 1 and 2, respectively. Thesedata were obtained by using an O2/C ratio of 0.46and a H2O/C ratio of 1.14 at a space velocity~3000 h-1 in a temperature-controlled microreactor.Although all of these catalysts were prepared in anidentical manner, substantial differences exist in theBET surface areas that may account for thedifferences observed in H2 selectivity. In general, theBET surface area of the non-noble transition metalcatalysts is 50-80% lower than that of Pt catalyst.
Some of the non-noble metals (e.g., nickel,copper, iron, cobalt) are as active as the moreexpensive platinum or palladium at temperatures aslow as 700oC. Considering that the partial oxidation
80
85
90
95
100
450 500 550 600 650 700 750 800 850Temperature at Catalyst Bottom, °C
iC8
Con
vers
ion,
%
RuPt
Pd
Ni
FeCu
Co
Ag
Figure 1. Hydrocarbon conversion for autothermalreforming of iso-octane (2,2,4-trimethylpentane) as a function of temperaturefor various transition metals supported on adoped ceria substrate.
0
20
40
60
80
100
450 500 550 600 650 700 750 800 850Temperature at Catalyst Bottom, °C
H 2 S
elec
tivity
(H2 /
H2 m
ax),
% RuPt
Pd
Ni
FeCu
Co
Ag
Figure 2. H2 selectivity for autothermal reforming ofiso-octane (2,2,4-trimethylpentane) as afunction of temperature for various transitionmetals supported on a doped ceria substrate.
of methane using a Pt/alumina catalyst requires areaction temperature of 1000oC to achieve highconversion [1], it appears that an oxide-ion-conducting substrate may play a significant role inthe reaction sequence. To better understand the roleof this substrate, three different oxide-ion-conducting substrates (ceria, zirconia, andlanthanum gallate) were tested. As shown inFigure 3, the H2 yield ranged from 34% to 60% (dry,N2-free basis) for these different oxide-ion-conducting substrates. In comparison, the H2 yieldwas less than 30% using a Pt/alumina catalyst undersimilar reaction conditions. Work is continuing tofind the optimal metal/oxide formulation in terms ofactivity, stability, and cost.
Long-term (>1000-h) life cycle studies wereconducted to evaluate the stability of the ATRcatalyst toward deactivation. As shown in Figure 4,the H2 concentration in the product gas wasrelatively constant at ~35% (dry basis) over a 47-daylife test. For this test, a benchmark fuel was used,and the catalyst was Pt supported on a doped ceriasubstrate. In view of the fact that this catalyst wasfar from being optimized, particularly with respectto maximizing the surface area, it proved remarkablystable. (See the report by Kopasz et al. for thestability of the catalyst in the presence of sulfur [2].)
From an engineering perspective, a structuredform of the ATR catalyst, such as a monolith or amicrochannel configuration, is preferred over apellet form to minimize such potential problems asback-pressure buildup. Furthermore, if the reactionis severely mass-transfer-limited, a structured formof the ATR catalyst that minimizes diffusional
Pt on various substrates at 800oC0.8 - 0.9 wt% Pt, GHSV 2602/h, O2C = 0.5, H2O/C = 1.14
0
10
20
30
40
50
60
70
Prod
uct C
ompo
sitio
n, %
(dry
, N2-
free)
H2 Total HC's
8-YSZZrO2
Ce.8Sm.15Gd.05O2CeO2
La.8Ga.8Cr.2O3
La.8Sr.2Ga.8Cr.2O3
La.8Sr.2Ga.8Mg.2O3
Figure 3. H2 selectivity for autothermal reforming ofiso-octane (2,2,4-trimethylpentane) for Ptsupported on various oxide ion substrates.
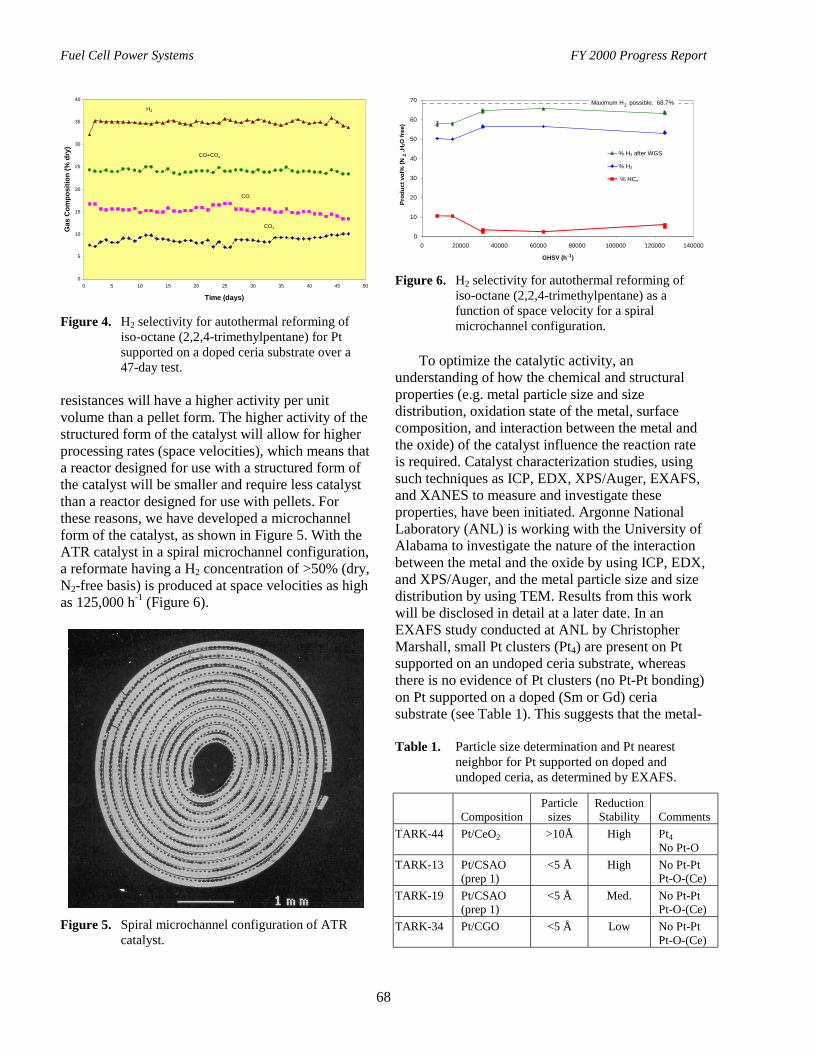
Fuel Cell Power Systems FY 2000 Progress Report
68
0
5
10
15
20
25
30
35
40
0 5 10 15 20 25 30 35 40 45 50
Time (days)
Gas
Com
posi
tion
(% d
ry)
CO
H2
CO+COx
CO2
Figure 4. H2 selectivity for autothermal reforming ofiso-octane (2,2,4-trimethylpentane) for Ptsupported on a doped ceria substrate over a47-day test.
resistances will have a higher activity per unitvolume than a pellet form. The higher activity of thestructured form of the catalyst will allow for higherprocessing rates (space velocities), which means thata reactor designed for use with a structured form ofthe catalyst will be smaller and require less catalystthan a reactor designed for use with pellets. Forthese reasons, we have developed a microchannelform of the catalyst, as shown in Figure 5. With theATR catalyst in a spiral microchannel configuration,a reformate having a H2 concentration of >50% (dry,N2-free basis) is produced at space velocities as highas 125,000 h-1 (Figure 6).
Figure 5. Spiral microchannel configuration of ATRcatalyst.
0
10
20
30
40
50
60
70
0 20000 40000 60000 80000 100000 120000 140000
GHSV (h-1)
Prod
uct v
ol%
(N2
,H2O
free
)
% H2 after WGS
% H2
% HCs
Maximum H2 possible: 68.7%
Figure 6. H2 selectivity for autothermal reforming ofiso-octane (2,2,4-trimethylpentane) as afunction of space velocity for a spiralmicrochannel configuration.
To optimize the catalytic activity, anunderstanding of how the chemical and structuralproperties (e.g. metal particle size and sizedistribution, oxidation state of the metal, surfacecomposition, and interaction between the metal andthe oxide) of the catalyst influence the reaction rateis required. Catalyst characterization studies, usingsuch techniques as ICP, EDX, XPS/Auger, EXAFS,and XANES to measure and investigate theseproperties, have been initiated. Argonne NationalLaboratory (ANL) is working with the University ofAlabama to investigate the nature of the interactionbetween the metal and the oxide by using ICP, EDX,and XPS/Auger, and the metal particle size and sizedistribution by using TEM. Results from this workwill be disclosed in detail at a later date. In anEXAFS study conducted at ANL by ChristopherMarshall, small Pt clusters (Pt4) are present on Ptsupported on an undoped ceria substrate, whereasthere is no evidence of Pt clusters (no Pt-Pt bonding)on Pt supported on a doped (Sm or Gd) ceriasubstrate (see Table 1). This suggests that the metal-
Table 1. Particle size determination and Pt nearestneighbor for Pt supported on doped andundoped ceria, as determined by EXAFS.
CompositionParticle
sizesReductionStability Comments
TARK-44 Pt/CeO2 >10Å High Pt4No Pt-O
TARK-13 Pt/CSAO(prep 1)
<5 Å High No Pt-PtPt-O-(Ce)
TARK-19 Pt/CSAO(prep 1)
<5 Å Med. No Pt-PtPt-O-(Ce)
TARK-34 Pt/CGO <5 Å Low No Pt-PtPt-O-(Ce)

Fuel Cell Power Systems FY 2000 Progress Report
69
support interaction is stronger between Pt on dopedceria than Pt on undoped ceria [3]. Experimentalwork is continuing to explore how the metal-supportinteraction influences the reaction mechanism aswell as the reaction rate.
ConclusionsWe have demonstrated that high hydrocarbon
conversions and H2 selectivity, comparable withthose observed with Pt, can be achieved with certainless costly, non-noble metals supported on oxide ionconductors. Long-term reactor tests demonstratedthat the Pt catalyst is stable, with little evidence fordeactivation. The Pt catalyst does not appear to bepoisoned by sulfur at concentrations in the fuelcomparable to fiscal year (FY) 2004 sulfur targets[2].
We have developed structured forms of thecatalyst, including a monolith and a spiralmicrochannel configuration, and demonstrated that areformate containing >50% H2 (dry, N2-free basis)can be produced at a space velocity of 125,000 h-1
using the microchannel configuration. We haveobserved that the addition of a dopant, such as Sm orGd, to ceria results in a strong metal-supportinteraction that minimizes the formation of Ptclusters and strongly influences the reaction rate.
Future work will focus on developing anonprecious-metal catalyst to reduce the cost. Newformulations of these nonprecious-metal catalystsand oxide ion conductors will be investigated tomaximize catalytic activity, provide long-termstability, and minimize the effects of sulfurpoisoning. Characterization and reaction mechanismstudies will continue to determine which chemicaland physical properties of the catalyst should beoptimized. Work will continue on optimizing thecatalytic activity and improving the mechanicalproperties of new structured forms of the catalyst.
References1. P.M. Torniainen, X. Chu, and L.D. Schmidt,
J. Catal. 146:1-10 (1994).2. J.P. Kopasz, D. Applegate, L. Ruscic,
S. Ahmed, and M. Krumpelt, “Effects ofFuels/Contaminants on Reforming CatalystPerformance and Durability,” presented at the
Annual National Laboratory R&D Meeting ofthe DOE Fuel Cells for Transportation Program,Richland, Wash., June 7-8, 2000 [to bepublished in Advanced Petroleum-Based andAlternative Fuels – 2000, Annual ProgressReport, Energy Conversion Team,U.S. Department of Energy, Office of AdvancedAutomotive Technologies, Washington, D.C.,2000].
3. S. Bernal, J.J. Calvino, M.A. Cauqui,J.M. Gatica, C. Larses, J.A. Perez Omil, andJ.M. Pintado, Catal. Today 50:175-206 (1999).
Publications1. S. Ahmed, B. Bergin, T. Krause, J.D. Carter,
J-M. Bae, L. Ruscic, D. Applegate, J. Kopasz,D. Myers, J. Krebs, C. Pereira, S.H.D. Lee, andM. Krumpelt, “Fuel Processor Development atArgonne National Laboratory,” presented at theArmy Research Office Workshop, Detroit,Mich., June 19-21, 2000.
2. M. Krumpelt, S. Ahmed, R. Kumar, S. Chalk,and J. Milliken, “Partial oxidation fuelreforming for automotive power systems,” to bepublished in Proceedings of the 3rd InternationalFuel Cell Conference, Nagoya, Japan,Nov. 30-Dec. 3, 1999.
3. S. Ahmed, J. Kopasz, B.J. Russell, andH.L. Tomlinson (Syntroleum Corporation),“Cobalt-based Fischer-Tropsch Paraffin Fuelsfor Fuel Cell Power,” poster paper presented atthe Sixth Grove Fuel Cell Symposium, London,U.K., Sept. 13-16, 1999.
4. S. Ahmed, S.H.D. Lee, R. Kumar, J.D. Carter,R. Wilkenhoener, and M. Krumpelt, “TheArgonne Catalytic Fuel Processor forAutomotive and Small Fuel Cell PowerSystems,” poster paper presented at the SixthGrove Fuel Cell Symposium, London, U.K.,Sept. 13-16, 1999.
5. J. Kopasz, R. Wilkenhoener, S. Ahmed,J.D. Carter, and M. Krumpelt, “Fuel flexiblepartial oxidation reforming of hydrocarbons forautomotive applications,” preprints of theSymposium on Hydrogen Production, Storage,and Utilization, 218th ACS National Meeting,44(4):899-904, New Orleans, La., Aug. 22-26,1999.

Fuel Cell Power Systems FY 2000 Progress Report
70
Patents Issued1. M. Krumpelt, S. Ahmed, R. Kumar, and R.
Doshi, “Method for making hydrogen-rich gasfrom hydrocarbon fuel,” Patent No. 5,929,286,issued on July 27, 1999.
2. M. Krumpelt, S. Ahmed, R. Kumar, and R.Doshi, “Partial Oxidation Catalyst,” patentapplication pending.
Awards/Recognitions1. Best Poster Award at the Grove Symposium,
London, U.K., Sept. 1999.2. Annual National Laboratory R&D Award from
DOE/OTT/OAAT, Richland, Wash., June 2000.
K. Alternative Water-Gas Shift Catalyst Development
Deborah J. Myers, John F. Krebs, Theodore R. Krause, and Michael KrumpeltArgonne National Laboratory, Argonne, IL 60439-4837(630) 252-4261, fax: (630) 252-4176, e-mail: [email protected]
DOE Program Manager: JoAnn Milliken(202) 586-2480, fax: (202) 586-9811, e-mail: [email protected]
Objectives• Develop alternative water-gas shift (WGS) catalysts to:
- Eliminate the need to sequester catalyst during system shutdown.- Eliminate the need to activate catalyst in situ.- Increase tolerance to temperature excursions.- Reduce size and weight of the shift reactor(s).- Extend lifetime of the catalyst.
OAAT R&D Plan: Task 3; Barriers E and G
Approach• Develop metal-support combinations to promote bifunctional mechanism of catalyst action:
- One component to adsorb CO (e.g., metal with intermediate CO adsorption strength).- Second component to adsorb and dissociate H2O (e.g., mixed-valence oxides with redox properties under
reformate conditions).
• Develop bimetallic or polymetallic oxide mixtures to perform the regenerative WGS mechanism:
- Each metal oxide catalyzes one-half of the WGS reaction.- Metals need to be in intimate contact for efficient electron transfer.
Accomplishments• Demonstrated <1% CO at 230-300°C from diesel and 1.1% CO from simulated reformate (Nov. 1999
milestone).
• ANL Pt/mixed oxide shift catalyst reduces WGS catalyst volume to 68% of Fe/Cr - Cu/ZnO combination anddoes not lose activity with exposure to air (not pyrophoric).
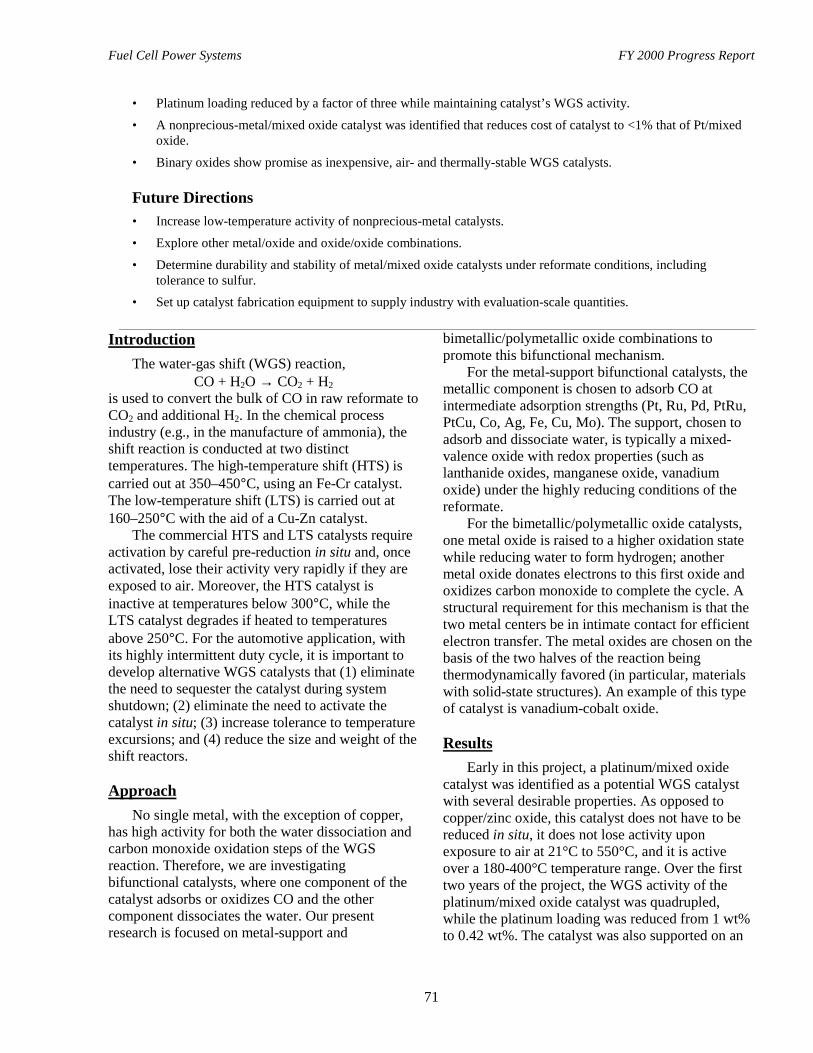
Fuel Cell Power Systems FY 2000 Progress Report
71
• Platinum loading reduced by a factor of three while maintaining catalyst’s WGS activity.
• A nonprecious-metal/mixed oxide catalyst was identified that reduces cost of catalyst to <1% that of Pt/mixedoxide.
• Binary oxides show promise as inexpensive, air- and thermally-stable WGS catalysts.
Future Directions• Increase low-temperature activity of nonprecious-metal catalysts.
• Explore other metal/oxide and oxide/oxide combinations.
• Determine durability and stability of metal/mixed oxide catalysts under reformate conditions, includingtolerance to sulfur.
• Set up catalyst fabrication equipment to supply industry with evaluation-scale quantities.
IntroductionThe water-gas shift (WGS) reaction,
CO + H2O → CO2 + H2is used to convert the bulk of CO in raw reformate toCO2 and additional H2. In the chemical processindustry (e.g., in the manufacture of ammonia), theshift reaction is conducted at two distincttemperatures. The high-temperature shift (HTS) iscarried out at 350–450°C, using an Fe-Cr catalyst.The low-temperature shift (LTS) is carried out at160–250°C with the aid of a Cu-Zn catalyst.
The commercial HTS and LTS catalysts requireactivation by careful pre-reduction in situ and, onceactivated, lose their activity very rapidly if they areexposed to air. Moreover, the HTS catalyst isinactive at temperatures below 300°C, while theLTS catalyst degrades if heated to temperaturesabove 250°C. For the automotive application, withits highly intermittent duty cycle, it is important todevelop alternative WGS catalysts that (1) eliminatethe need to sequester the catalyst during systemshutdown; (2) eliminate the need to activate thecatalyst in situ; (3) increase tolerance to temperatureexcursions; and (4) reduce the size and weight of theshift reactors.
ApproachNo single metal, with the exception of copper,
has high activity for both the water dissociation andcarbon monoxide oxidation steps of the WGSreaction. Therefore, we are investigatingbifunctional catalysts, where one component of thecatalyst adsorbs or oxidizes CO and the othercomponent dissociates the water. Our presentresearch is focused on metal-support and
bimetallic/polymetallic oxide combinations topromote this bifunctional mechanism.
For the metal-support bifunctional catalysts, themetallic component is chosen to adsorb CO atintermediate adsorption strengths (Pt, Ru, Pd, PtRu,PtCu, Co, Ag, Fe, Cu, Mo). The support, chosen toadsorb and dissociate water, is typically a mixed-valence oxide with redox properties (such aslanthanide oxides, manganese oxide, vanadiumoxide) under the highly reducing conditions of thereformate.
For the bimetallic/polymetallic oxide catalysts,one metal oxide is raised to a higher oxidation statewhile reducing water to form hydrogen; anothermetal oxide donates electrons to this first oxide andoxidizes carbon monoxide to complete the cycle. Astructural requirement for this mechanism is that thetwo metal centers be in intimate contact for efficientelectron transfer. The metal oxides are chosen on thebasis of the two halves of the reaction beingthermodynamically favored (in particular, materialswith solid-state structures). An example of this typeof catalyst is vanadium-cobalt oxide.
ResultsEarly in this project, a platinum/mixed oxide
catalyst was identified as a potential WGS catalystwith several desirable properties. As opposed tocopper/zinc oxide, this catalyst does not have to bereduced in situ, it does not lose activity uponexposure to air at 21°C to 550°C, and it is activeover a 180-400°C temperature range. Over the firsttwo years of the project, the WGS activity of theplatinum/mixed oxide catalyst was quadrupled,while the platinum loading was reduced from 1 wt%to 0.42 wt%. The catalyst was also supported on an

Fuel Cell Power Systems FY 2000 Progress Report
72
alumina extrudate. This past year, we developed anew synthesis method for the alumina-supportedcatalyst to further reduce the platinum loading. Asshown in Figure 1, the new method allowed areduction in platinum loading from 0.42 wt% to0.14 wt%, with no loss of WGS activity.
Argonne’s platinum/mixed oxide/aluminacatalyst can reduce shift reactor volumessignificantly. Figure 2 shows a comparison of thecalculated shift reactor volumes for the commercialHTS and LTS catalysts and for the Argonne catalystused at 300°C and 400°C. The calculated reactorvolumes were based on the measured intrinsicreaction rates and activation energies for theArgonne catalyst, and on the published kinetic datafor the commercial catalysts. The HTS and LTSstages were assumed to operate adiabatically. Thecalculated amount of catalyst is that needed toreduce the exit CO concentration to 1% (dry basis)from an inlet reformate gas consisting of 10% CO,10% CO2, 34% H2, 33% N2, and 13% H2O (wetbasis). As shown in Figure 2A, for the commercialHTS and LTS catalysts operated at 400°C and200°C, respectively, a total catalyst volume of19.2 L is needed for a 50-kWe fuel cell system. Incomparison, with the Argonne catalyst operated at400°C and 300°C, respectively, the total requiredcatalyst volume is 13.5 L, a 30% reduction. Alsoshown in Figure 2 are the improvements in theactivity of the platinum/mixed oxide catalystthroughout the duration of this project, as reflectedin the estimated reactor size, and the reduction in the
1/Reactant Flow Rate (min/mol )
0
1000
2000
3000
0 40 80 120 160
ln(([
CO
]in-[C
O]e
q)/[
CO
]out
-[CO
]eq
))/lit
er c
atal
yst
0.42 wt% Pt, old method0.2 wt% Pt, old method
0.14 wt% Pt, new method
Slope ∝∝∝∝ WGS rate constant
Figure 1. New synthesis method reduced the platinumloading of the catalyst while maintaining highactivity.
05
1015202530
Commercial June,'98
June,'99
Nov.,’99
ANL Pt/Mixed Oxide Catalysts
Volu
me
of S
hift
Cat
alys
tfo
r 50
kWe
(lite
rs) LTS
HTSA
05
1015202530
Commercial June,'98
June,'99
Nov.,’99
ANL Pt/Mixed Oxide Catalysts
Volu
me
of S
hift
Cat
alys
tfo
r 50
kWe
(lite
rs) LTS
HTSA
Figure 2. The Argonne catalyst can reduce shift reactorvolumes significantly. Projected size (A) andcost (B) of the Argonne shift reactors arebeing reduced.
amount of platinum needed. The platinum loadinghas been reduced from 1 wt% to 0.14 wt%, for anoverall platinum weight of 32 grams for a 50-kWesystem.
Although the noble metals have desirable airstability and temperature stability, their high costmay limit their acceptability for transportationapplications. This past year, we developed anonprecious-metal/mixed oxide alternative to theplatinum/mixed oxide catalyst. As shown inFigure 3, the nonprecious-metal/mixed oxidecatalyst has WGS activity comparable to that ofplatinum/mixed oxide and does not lose activity attemperatures up to 400°C. The nonprecious-metal/mixed oxide catalyst is not initially as activeas commercial copper/zinc oxide (United CatalystIncorporated’s C18-7), but the Argonne catalystdoes not lose its activity after exposure to air at230°C (Figure 4).
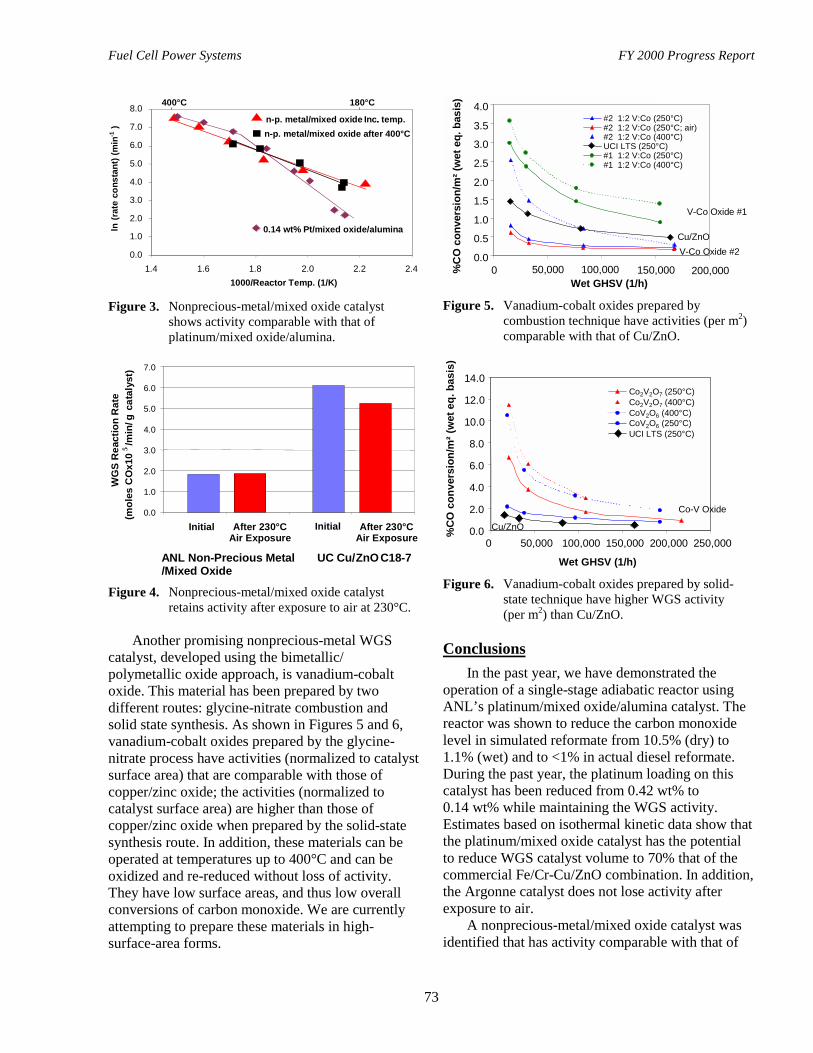
Fuel Cell Power Systems FY 2000 Progress Report
73
0.0
1.0
2.0
3.0
4.0
5.0
6.0
7.0
8.0
1.4 1.6 1.8 2.0 2.2 2.41000/Reactor Temp. (1/K)
ln (r
ate
cons
tant
) (m
in-1
) n-p. metal/mixed oxide Inc.. temp.n-p. metal/mixed oxide after 400°C
0.14 wt% Pt/mixed oxide/alumina
180°C400°C
Figure 3. Nonprecious-metal/mixed oxide catalystshows activity comparable with that ofplatinum/mixed oxide/alumina.
0.0
1.0
2.0
3.0
4.0
5.0
6.0
7.0
Initial After 230°CAir Exposure
Initial After 230°CAir Exposure
ANL Non-Precious Metal UC Cu/ZnO C18-7/Mixed Oxide
WG
S R
eact
ion
Rat
e(m
oles
CO
x10
5/m
in/g
cat
alys
t)
Figure 4. Nonprecious-metal/mixed oxide catalystretains activity after exposure to air at 230°C.
Another promising nonprecious-metal WGScatalyst, developed using the bimetallic/polymetallic oxide approach, is vanadium-cobaltoxide. This material has been prepared by twodifferent routes: glycine-nitrate combustion andsolid state synthesis. As shown in Figures 5 and 6,vanadium-cobalt oxides prepared by the glycine-nitrate process have activities (normalized to catalystsurface area) that are comparable with those ofcopper/zinc oxide; the activities (normalized tocatalyst surface area) are higher than those ofcopper/zinc oxide when prepared by the solid-statesynthesis route. In addition, these materials can beoperated at temperatures up to 400°C and can beoxidized and re-reduced without loss of activity.They have low surface areas, and thus low overallconversions of carbon monoxide. We are currentlyattempting to prepare these materials in high-surface-area forms.
0.0
0.5
1.0
1.5
2.0
2.5
3.0
3.5
4.0
0 50,000 100,000 150,000 200,000Wet GHSV (1/h)
%C
O c
onve
rsio
n/m
² (w
et e
q. b
asis
)
#2 1:2 V:Co (250°C)#2 1:2 V:Co (250°C; air)#2 1:2 V:Co (400°C)UCI LTS (250°C)#1 1:2 V:Co (250°C)#1 1:2 V:Co (400°C)
Cu/ZnO
V-Co Oxide #1
V-Co Oxide #2
Figure 5. Vanadium-cobalt oxides prepared bycombustion technique have activities (per m2)comparable with that of Cu/ZnO.
0.0
2.0
4.0
6.0
8.0
10.0
12.0
14.0
0 50,000 100,000 150,000 200,000 250,000
Wet GHSV (1/h)
%CO
con
vers
ion/
m² (
wet
eq.
bas
is)
Co2V2O7 (250°C)Co2V2O7 (400°C)CoV2O6 (400°C)CoV2O6 (250°C)UCI LTS (250°C)
Cu/ZnO
Co-V Oxide
Figure 6. Vanadium-cobalt oxides prepared by solid-state technique have higher WGS activity(per m2) than Cu/ZnO.
ConclusionsIn the past year, we have demonstrated the
operation of a single-stage adiabatic reactor usingANL’s platinum/mixed oxide/alumina catalyst. Thereactor was shown to reduce the carbon monoxidelevel in simulated reformate from 10.5% (dry) to1.1% (wet) and to <1% in actual diesel reformate.During the past year, the platinum loading on thiscatalyst has been reduced from 0.42 wt% to0.14 wt% while maintaining the WGS activity.Estimates based on isothermal kinetic data show thatthe platinum/mixed oxide catalyst has the potentialto reduce WGS catalyst volume to 70% that of thecommercial Fe/Cr-Cu/ZnO combination. In addition,the Argonne catalyst does not lose activity afterexposure to air.
A nonprecious-metal/mixed oxide catalyst wasidentified that has activity comparable with that of

Fuel Cell Power Systems FY 2000 Progress Report
74
the platinum/mixed oxide/alumina catalyst in the180-400°C temperature range. This material doesnot lose activity upon exposure to air and re-reduction at 230°C. Another alternative to theplatinum catalyst, a binary oxide of cobalt andvanadium, shows promise as an inexpensive, air-and thermally-stable WGS catalyst.
Fuel Cell Power Systems FY 2000 Progress Report
75
IV. FUEL CELL STACK SUBSYSTEM1
A. R&D on a 50-kW, High-Efficiency, High-Power-Density, CO-Tolerant PEMFuel Cell Stack System
Tim Rehg (primary contract) and Nguyen MinhHoneywell Engines & Systems2525 W. 190th Street, MS-36-1-93193Torrance, CA 90504-6099Rehg, (310) 512-2281, fax: (310) 512-3432, e-mail: [email protected], (310) 512-3515, fax: (310) 512-3432, e-mail: [email protected]
DOE Program Manager: Patrick Davis(202) 586-8061, fax: (202) 586-9811, e-mail: [email protected]
ANL Technical Advisor: William Swift(630) 252-5964, fax: (630) 272-4473, e-mail: [email protected]
Contractor: Honeywell Engines & Systems, Torrance, CaliforniaPrime Contract No. DE-FC02-97EE50470, October 1997-September 2000
ObjectivesResearch, develop, assemble, and test a 50-kW net polymer electrolyte membrane (PEM) fuel cell stack systemcomposed of a PEM fuel cell stack and the supporting gas, thermal, and water management subsystems. The PEMfuel cell stack system will be capable of integration with at least one of the fuel processors currently underdevelopment by Hydrogen Burner Technology (HBT) and Arthur D. Little, Inc.
OAAT R&D Plan: Task 11; Barriers A, B, C, D, and E
ApproachThis phased program includes the fabrication and testing of three 10-kW subscale PEM fuel cell stacks, leading upto the final 50-kW system. Stack technology development and system analysis are conducted iteratively to identifypertinent technology advances to be incorporated into successive subscale stack builds. The final system analysiswill define the 50-kW stack and system configuration.
• Phase I:
- PEM stack R&D to demonstrate multifuel capability and carbon monoxide (CO) tolerance.- PEM stack R&D to advance technologies toward U.S. Department of Energy (DOE) targets.
• Phase II:
- Subscale integration, electronic control system development, transient characteristics anddurability testing.
• Phase III:
- Testing of the 50-kW PEM fuel cell stack system.- Hardware delivery of 50-kW PEM fuel cell stack system.
1 The DOE technical targets for fuel cell stack systems running on hydrogen-rich fuel from a fuel-flexible fuel processor
can be found in Table 3, Appendix B.
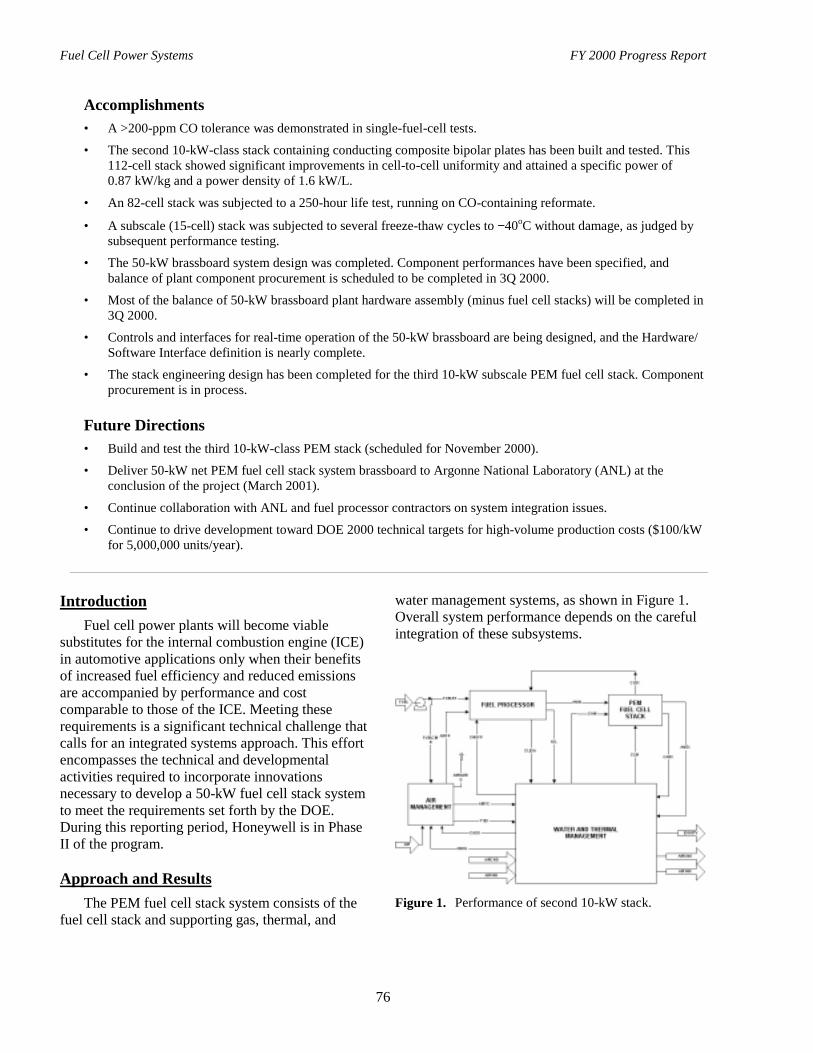
Fuel Cell Power Systems FY 2000 Progress Report
76
Accomplishments• A >200-ppm CO tolerance was demonstrated in single-fuel-cell tests.
• The second 10-kW-class stack containing conducting composite bipolar plates has been built and tested. This112-cell stack showed significant improvements in cell-to-cell uniformity and attained a specific power of0.87 kW/kg and a power density of 1.6 kW/L.
• An 82-cell stack was subjected to a 250-hour life test, running on CO-containing reformate.
• A subscale (15-cell) stack was subjected to several freeze-thaw cycles to −40oC without damage, as judged bysubsequent performance testing.
• The 50-kW brassboard system design was completed. Component performances have been specified, andbalance of plant component procurement is scheduled to be completed in 3Q 2000.
• Most of the balance of 50-kW brassboard plant hardware assembly (minus fuel cell stacks) will be completed in3Q 2000.
• Controls and interfaces for real-time operation of the 50-kW brassboard are being designed, and the Hardware/Software Interface definition is nearly complete.
• The stack engineering design has been completed for the third 10-kW subscale PEM fuel cell stack. Componentprocurement is in process.
Future Directions• Build and test the third 10-kW-class PEM stack (scheduled for November 2000).
• Deliver 50-kW net PEM fuel cell stack system brassboard to Argonne National Laboratory (ANL) at theconclusion of the project (March 2001).
• Continue collaboration with ANL and fuel processor contractors on system integration issues.
• Continue to drive development toward DOE 2000 technical targets for high-volume production costs ($100/kWfor 5,000,000 units/year).
IntroductionFuel cell power plants will become viable
substitutes for the internal combustion engine (ICE)in automotive applications only when their benefitsof increased fuel efficiency and reduced emissionsare accompanied by performance and costcomparable to those of the ICE. Meeting theserequirements is a significant technical challenge thatcalls for an integrated systems approach. This effortencompasses the technical and developmentalactivities required to incorporate innovationsnecessary to develop a 50-kW fuel cell stack systemto meet the requirements set forth by the DOE.During this reporting period, Honeywell is in PhaseII of the program.
Approach and ResultsThe PEM fuel cell stack system consists of the
fuel cell stack and supporting gas, thermal, and
water management systems, as shown in Figure 1.Overall system performance depends on the carefulintegration of these subsystems.
Figure 1. Performance of second 10-kW stack.

Fuel Cell Power Systems FY 2000 Progress Report
77
The brassboard system design for the 50-kWfuel cell stack has been completed. Six hexagonallyshaped stacks are pictured in Figure 2. Componentperformances have been specified, and procurementof major components is nearly completed. Thebrassboard has been designed for 50-kW electricpower output, operating at high efficiency ongasoline reformate. It incorporates full integrationand management of on-board thermal, water, and airsubsystems, and it makes use of off-the-shelfcomponents to minimize cost and assembly time.Controls are being designed on the assumption offull dynamic control capability, but provisions arebeing made for a variety of actuation schemes.Supervisory controls and built-in tests have beenpartially completed. The Hardware/SoftwareInterface definition, which is nearly complete, willbe finalized once the remaining actuated controlvalves have been selected.
In the area of membrane electrode assembly(MEA) technology development, Honeywell hasdemonstrated that our cells can tolerate >200 ppmCO contamination without appreciable performanceloss. Honeywell plans to use these MEAs, alongwith molded conducting composite bipolar plates, inthe upcoming third 10-kW stack and the final 50-kWbrassboard system build. The designs have beencompleted for these builds and the procurement is inprocess.
Figure 2. 50-kW brassboard system design.
The second 10-kW-class stack containingconducting composite bipolar plates has been builtand tested. A comparison of the first and secondstack designs is given in Figure 3, and a photo of thesecond stack is shown in Figure 4. This 112-cellstack showed significant improvements in cell-to-cell uniformity over the first stack (compareFigures 5 and 6). Improvements for the second stackincluded a new flow field with lower stoichiometrycapability, conducting composite bipolar plates, 13%increase in active cell area, and substantialimprovements in stack weight, volume, andmanufacturability. The performance data for thesecond stack are presented in Table 1, and 250-hourlife testing data (run on gasoline reformate/air) areindicated in Figure 7.
Figure 3. 10-kW stack designs. Comparison of stack I(left) and stack II (right) designs.
Figure 4. Photo of second 10-kW-class stack.
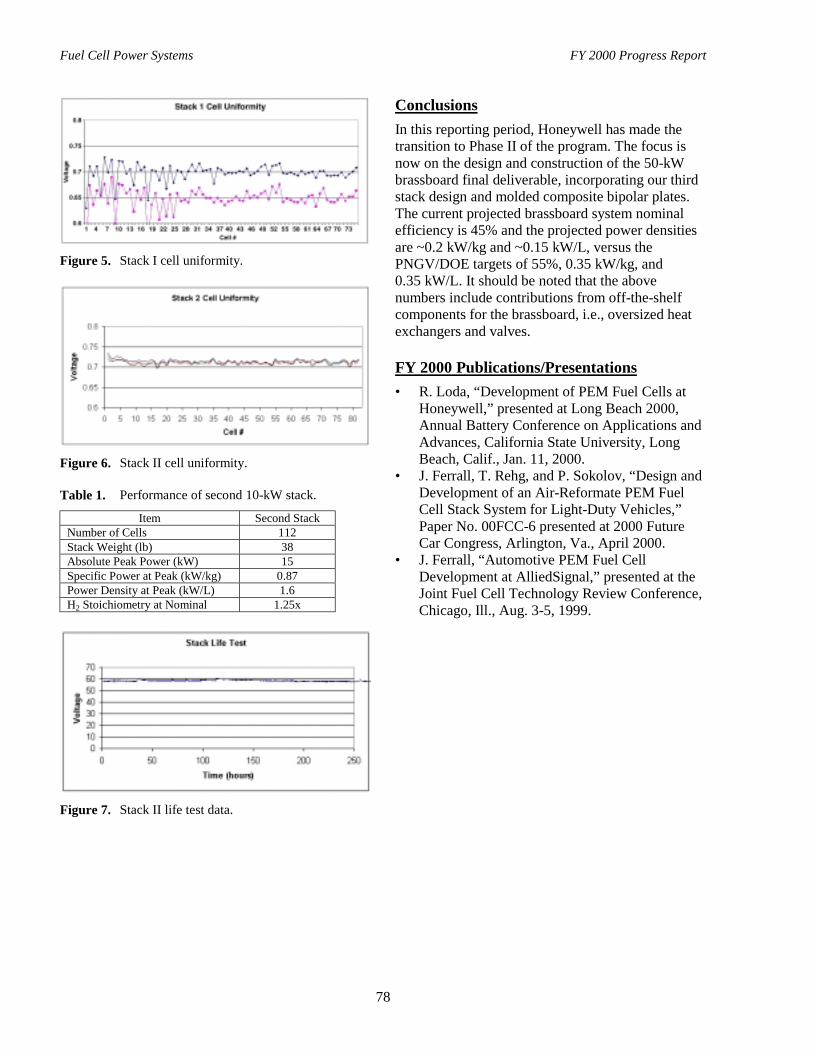
Fuel Cell Power Systems FY 2000 Progress Report
78
Figure 5. Stack I cell uniformity.
Figure 6. Stack II cell uniformity.
Table 1. Performance of second 10-kW stack.
Item Second StackNumber of Cells 112Stack Weight (lb) 38Absolute Peak Power (kW) 15Specific Power at Peak (kW/kg) 0.87Power Density at Peak (kW/L) 1.6H2 Stoichiometry at Nominal 1.25x
Figure 7. Stack II life test data.
ConclusionsIn this reporting period, Honeywell has made thetransition to Phase II of the program. The focus isnow on the design and construction of the 50-kWbrassboard final deliverable, incorporating our thirdstack design and molded composite bipolar plates.The current projected brassboard system nominalefficiency is 45% and the projected power densitiesare ~0.2 kW/kg and ~0.15 kW/L, versus thePNGV/DOE targets of 55%, 0.35 kW/kg, and0.35 kW/L. It should be noted that the abovenumbers include contributions from off-the-shelfcomponents for the brassboard, i.e., oversized heatexchangers and valves.
FY 2000 Publications/Presentations• R. Loda, “Development of PEM Fuel Cells at
Honeywell,” presented at Long Beach 2000,Annual Battery Conference on Applications andAdvances, California State University, LongBeach, Calif., Jan. 11, 2000.
• J. Ferrall, T. Rehg, and P. Sokolov, “Design andDevelopment of an Air-Reformate PEM FuelCell Stack System for Light-Duty Vehicles,”Paper No. 00FCC-6 presented at 2000 FutureCar Congress, Arlington, Va., April 2000.
• J. Ferrall, “Automotive PEM Fuel CellDevelopment at AlliedSignal,” presented at theJoint Fuel Cell Technology Review Conference,Chicago, Ill., Aug. 3-5, 1999.
Fuel Cell Power Systems FY 2000 Progress Report
79
B. Development of Advanced, Low-Cost PEM Fuel Cell Stack and SystemDesign for Operation on Reformate Used in Vehicle Power Systems
Michel Fuchs (primary contact) and Frano BarbirEnergy Partners, L.C.1501 Northpoint Parkway, #102West Palm Beach, FL 33407(561) 688-0500, fax: (561) 688-9610, e-mail: [email protected]
DOE Program Manager: Donna Ho(202) 586-8000, fax: (202) 586-9811, e-mail: [email protected]
DOE Program Support: Larry Blair(202) 586-0626, fax: (202) 586-9811, e-mail: [email protected]
ANL Technical Advisor: William Swift(630) 252-5964, fax: (630) 972-4473, e-mail: [email protected]
Contractor: Energy Partners, L.C., West Palm Beach, FloridaPrime Contract No. DE-FC02-97EE50476, September 30, 1997-June 30, 2001
Objectives• Develop low-cost bipolar collector plates through improvements in materials and processes.
• Evaluate and optimize membrane-electrode assembly (MEA) configurations with enhanced carbon monoxide(CO) tolerance and low platinum loading:
- Stable, usable performance with steady-state CO levels of 10 ppm and transient levels of 100 ppm.- Platinum loading less than 0.5 mg/cm2 per MEA.
• Design and demonstrate a reformate-capable fuel cell stack with a 50-kWnet power output.
• Design, integrate, and demonstrate a reformate-capable 50-kWnet automotive fuel cell power system.
OAAT R&D Plan: Task 11; Barriers A, B, C, and D
Approach• Phase I: Demonstration and delivery of a polymer electrolyte membrane (PEM) 10-cell stack with reformate
capability and 10 additional bipolar plates manufactured by the compression molding process.
• Phase II: Demonstration and delivery of a high-efficiency, reformate-tolerant 50-kWnet fuel cell stack and powersystem utilizing injection-molded bipolar plates (with compression molded plates as an alternative), excludingpower conditioning and fuel processor, to Argonne National Laboratory (ANL) for independent testing andverification.
Accomplishments• Bipolar plates:
- Completed compression molding development for high performance.- New injection molding of advanced molded composite bipolar plates results in high performance,
low cost (<$10/kW), and 100% recyclability, with less than 20 seconds cycle time per part permachine on 232-cm2 plates.
- Tested injection-molded plates in a Model NG2000 stack.
Fuel Cell Power Systems FY 2000 Progress Report
80
• Demonstration of hydrogen and reformate fuel cell performance:
- Scale-up of 50-kWnet automotive reformate design Model NG3000 comparable to previous20-kWgross Model NG2000 .
- Built and tested 10-cell Model NG3000 on H2/air.- Achieved target performance with 10-cell Model NG3000 on reformate/air.- Completed nearly 2000 hours of endurance testing.- Performed freeze-tolerance testing with coolant temperature down to −10°C.- Performed cold start-up testing from −40°C, with stack in an environmental chamber.- “Field” tested an 8-kWgross Model NG2000 (hydrogen fuel cell stack) in a Deere & Co. Gator
industrial vehicle.
• Packaged 50-kWnet system components into an automotive test stand.
• System optimization and analysis:
- Performed trade-off studies to increase efficiency to perform at temperature extremes.- Reduced componentry with thermally integrated system approach.- Water balance achievable.- Tested Arthur D. Little compressor-expander under simulated system conditions.- Enhanced 50-kWnet system model using actual component performance data.
Future Directions• Continue evaluations of new MEA materials for reformate performance.
• Optimize bipolar material compounding process and increase conductivity.
• Injection-mold net-shaped bipolar plates with all features (500 cm2).
• Injection-mold large-scale blank bipolar plates (1000 cm2).
• Deliver reformate-tolerant 10-cell stack.• Finish fabrication, assembly, controls, and testing of the 50-kWnet system and prepare it for delivery.
IntroductionEnergy Partners’ program objective is to
develop a state-of-the-art, reformate-tolerant PEMfuel cell stack and integrate it into a reformate-capable operating system that meets automotivedesign requirements. The development effort,focused on a systems approach, is broken down intothree discrete areas: bipolar collector plates, PEMfuel cell stack, and integrated system.
Results
Composite Bipolar Collector PlateDevelopment
An optimal bipolar collector plate should below-cost, impermeable, highly conductive,chemically inert, lightweight, and easilymanufactured. The available choices for PEM fuelcells are metals, graphite, and graphite-compositematerials. Energy Partners has used compression-
molded graphite composite plates in all of its fuelcell stacks since 1992. With the advances made infillers, binders, and processes, these plates haveproperties comparable to those of pure graphite.However, compression molding is not suitable forautomotive-style mass production because of itslong processing time and high energy consumption.
Energy Partners is developing materials andprocesses suitable for high-speed injection molding(patents pending). Graphite materials are initiallycompounded with thermoplastic polymers andformed into pellets in a continuous process. We havedemonstrated a production rate of over 60 kg/h, withmuch higher rates possible on larger machines.
Composite bipolar plates are currently injection-molded with cycle times under 20 seconds. Withproper tool design, cycle time can be reduced toabout 10 seconds. This is more than 8 times fasterthan injection-molded processes for conductivethermoset materials. By comparison, EnergyPartners’ thermoplastic technology offers greatly
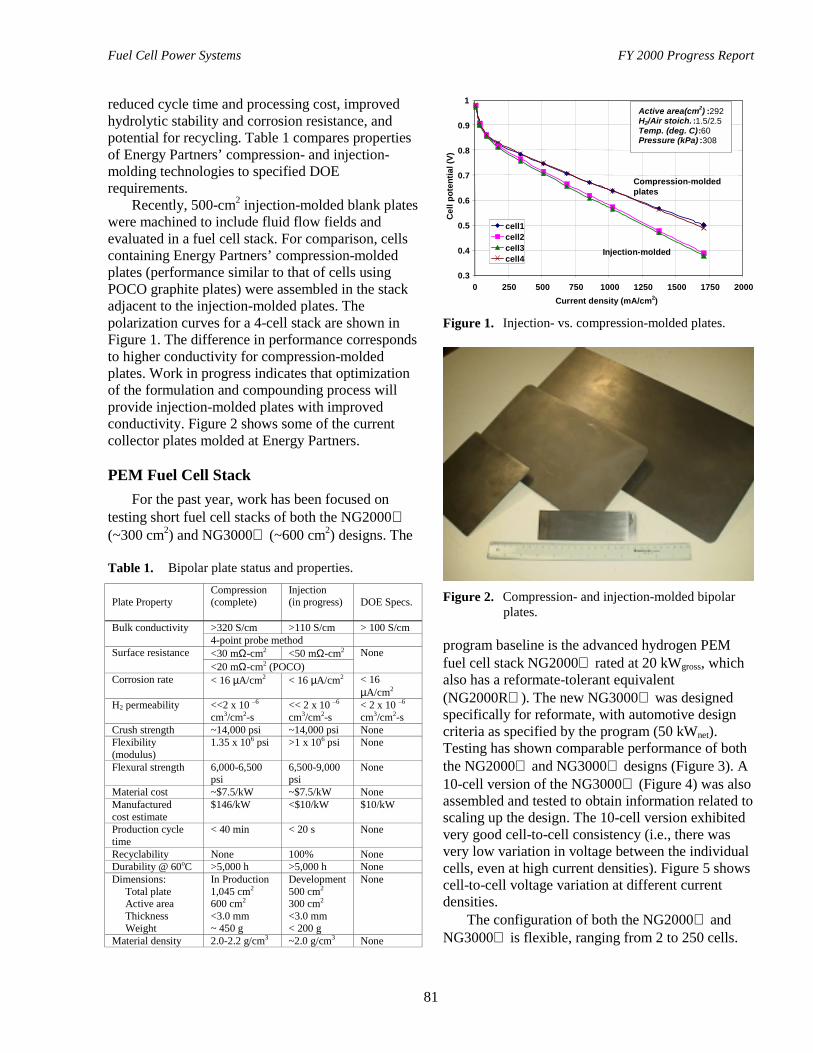
Fuel Cell Power Systems FY 2000 Progress Report
81
reduced cycle time and processing cost, improvedhydrolytic stability and corrosion resistance, andpotential for recycling. Table 1 compares propertiesof Energy Partners’ compression- and injection-molding technologies to specified DOErequirements.
Recently, 500-cm2 injection-molded blank plateswere machined to include fluid flow fields andevaluated in a fuel cell stack. For comparison, cellscontaining Energy Partners’ compression-moldedplates (performance similar to that of cells usingPOCO graphite plates) were assembled in the stackadjacent to the injection-molded plates. Thepolarization curves for a 4-cell stack are shown inFigure 1. The difference in performance correspondsto higher conductivity for compression-moldedplates. Work in progress indicates that optimizationof the formulation and compounding process willprovide injection-molded plates with improvedconductivity. Figure 2 shows some of the currentcollector plates molded at Energy Partners.
PEM Fuel Cell StackFor the past year, work has been focused on
testing short fuel cell stacks of both the NG2000(~300 cm2) and NG3000 (~600 cm2) designs. The
Table 1. Bipolar plate status and properties.
Plate PropertyCompression(complete)
Injection(in progress) DOE Specs.
>320 S/cm >110 S/cm > 100 S/cmBulk conductivity4-point probe method<30 mΩ-cm2 <50 mΩ-cm2Surface resistance<20 mΩ-cm2 (POCO)
None
Corrosion rate < 16 µA/cm2 < 16 µA/cm2 < 16µA/cm2
H2 permeability <<2 x 10 –6
cm3/cm2-s<< 2 x 10 –6
cm3/cm2-s< 2 x 10 –6
cm3/cm2-sCrush strength ~14,000 psi ~14,000 psi NoneFlexibility(modulus)
1.35 x 10⁶ psi >1 x 10⁶ psi None
Flexural strength 6,000-6,500psi
6,500-9,000psi
None
Material cost ~$7.5/kW ~$7.5/kW NoneManufacturedcost estimate
$146/kW <$10/kW $10/kW
Production cycletime
< 40 min < 20 s None
Recyclability None 100% NoneDurability @ 60oC >5,000 h >5,000 h NoneDimensions: Total plate Active area Thickness Weight
In Production1,045 cm2
600 cm2
<3.0 mm~ 450 g
Development500 cm2
300 cm2 <3.0 mm< 200 g
None
Material density 2.0-2.2 g/cm3 ~2.0 g/cm3 None
0.3
0.4
0.5
0.6
0.7
0.8
0.9
1
0 250 500 750 1000 1250 1500 1750 2000Current density (mA/cm2)
Cel
l pot
entia
l (V)
cell1cell2cell3cell4
Compression-moldedplates
Injection-molded
Active area(cm2) :292H2/Air stoich. :1.5/2.5Temp. (deg. C):60Pressure (kPa) :308
Figure 1. Injection- vs. compression-molded plates.
Figure 2. Compression- and injection-molded bipolarplates.
program baseline is the advanced hydrogen PEMfuel cell stack NG2000 rated at 20 kWgross, whichalso has a reformate-tolerant equivalent(NG2000R ). The new NG3000 was designedspecifically for reformate, with automotive designcriteria as specified by the program (50 kWnet).Testing has shown comparable performance of boththe NG2000 and NG3000 designs (Figure 3). A10-cell version of the NG3000 (Figure 4) was alsoassembled and tested to obtain information related toscaling up the design. The 10-cell version exhibitedvery good cell-to-cell consistency (i.e., there wasvery low variation in voltage between the individualcells, even at high current densities). Figure 5 showscell-to-cell voltage variation at different currentdensities.
The configuration of both the NG2000 andNG3000 is flexible, ranging from 2 to 250 cells.
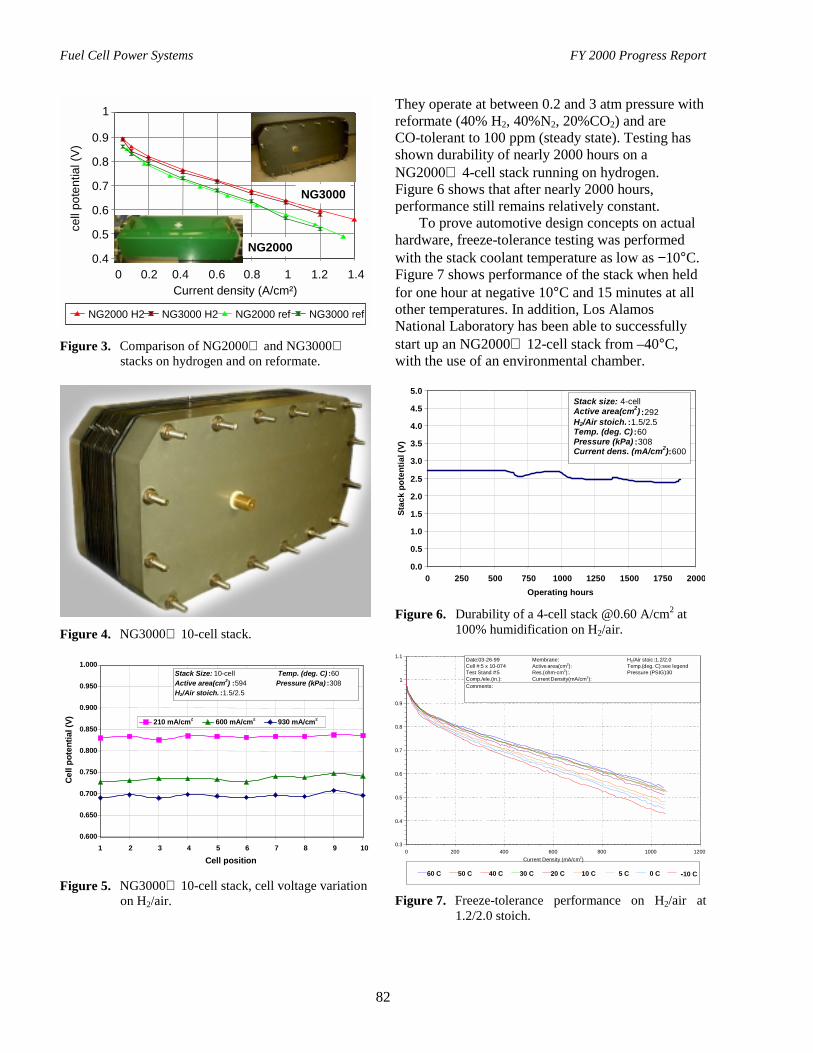
Fuel Cell Power Systems FY 2000 Progress Report
82
0.4
0.5
0.6
0.7
0.8
0.9
1
cell
pote
ntia
l (V)
0 0.2 0.4 0.6 0.8 1 1.2 1.4Current density (A/cm²)
NG2000 H2 NG3000 H2 NG2000 ref NG3000 ref
NG2000
NG3000
Figure 3. Comparison of NG2000 and NG3000stacks on hydrogen and on reformate.
Figure 4. NG3000 10-cell stack.
0.600
0.650
0.700
0.750
0.800
0.850
0.900
0.950
1.000
1 2 3 4 5 6 7 8 9 10
Cell position
Cell
pote
ntia
l (V) 210 mA/cm2 600 mA/cm2 930 mA/cm2
Stack Size: 10-cell Temp. (deg. C) :60Active area(cm2) :594 Pressure (kPa) :308H2/Air stoich. :1.5/2.5
Figure 5. NG3000 10-cell stack, cell voltage variationon H2/air.
They operate at between 0.2 and 3 atm pressure withreformate (40% H2, 40%N2, 20%CO2) and areCO-tolerant to 100 ppm (steady state). Testing hasshown durability of nearly 2000 hours on aNG2000 4-cell stack running on hydrogen.Figure 6 shows that after nearly 2000 hours,performance still remains relatively constant.
To prove automotive design concepts on actualhardware, freeze-tolerance testing was performedwith the stack coolant temperature as low as −10°C.Figure 7 shows performance of the stack when heldfor one hour at negative 10°C and 15 minutes at allother temperatures. In addition, Los AlamosNational Laboratory has been able to successfullystart up an NG2000 12-cell stack from –40°C,with the use of an environmental chamber.
0.0
0.5
1.0
1.5
2.0
2.5
3.0
3.5
4.0
4.5
5.0
0 250 500 750 1000 1250 1500 1750 2000Operating hours
Stac
k po
tent
ial (
V)Stack size: 4-cellActive area(cm2) :292H2/Air stoich. :1.5/2.5Temp. (deg. C) :60Pressure (kPa) :308Current dens. (mA/cm2):600
Figure 6. Durability of a 4-cell stack @0.60 A/cm2 at100% humidification on H2/air.
0.3
0.4
0.5
0.6
0.7
0.8
0.9
1
1.1
0 200 400 600 800 1000 1200Current Density (mA/cm2)
Comments:
Date:03-26-99Cell #:5 x 10-074Test Stand #:5Comp./ele.(in.):
H2/Air stoic :1.2/2.0Temp.(deg. C):see legendPressure (PSIG):30
Membrane:Active area(cm2):Res.(ohm-cm2):.Current Density(mA/cm2):
60 C 50 C 40 C 30 C 20 C 10 C 5 C 0 C -10 C
Figure 7. Freeze-tolerance performance on H2/air at1.2/2.0 stoich.
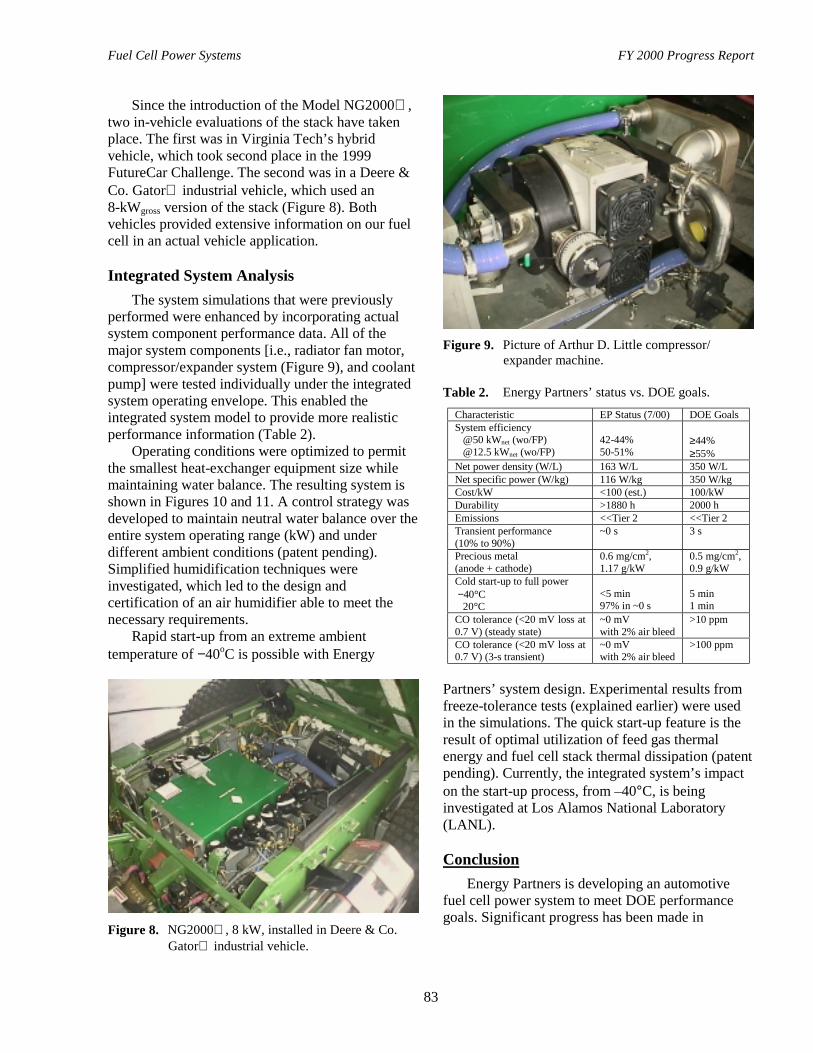
Fuel Cell Power Systems FY 2000 Progress Report
83
Since the introduction of the Model NG2000 ,two in-vehicle evaluations of the stack have takenplace. The first was in Virginia Tech’s hybridvehicle, which took second place in the 1999FutureCar Challenge. The second was in a Deere &Co. Gator industrial vehicle, which used an8-kWgross version of the stack (Figure 8). Bothvehicles provided extensive information on our fuelcell in an actual vehicle application.
Integrated System AnalysisThe system simulations that were previously
performed were enhanced by incorporating actualsystem component performance data. All of themajor system components [i.e., radiator fan motor,compressor/expander system (Figure 9), and coolantpump] were tested individually under the integratedsystem operating envelope. This enabled theintegrated system model to provide more realisticperformance information (Table 2).
Operating conditions were optimized to permitthe smallest heat-exchanger equipment size whilemaintaining water balance. The resulting system isshown in Figures 10 and 11. A control strategy wasdeveloped to maintain neutral water balance over theentire system operating range (kW) and underdifferent ambient conditions (patent pending).Simplified humidification techniques wereinvestigated, which led to the design andcertification of an air humidifier able to meet thenecessary requirements.
Rapid start-up from an extreme ambienttemperature of −40oC is possible with Energy
Figure 8. NG2000 , 8 kW, installed in Deere & Co.Gator industrial vehicle.
Figure 9. Picture of Arthur D. Little compressor/expander machine.
Table 2. Energy Partners’ status vs. DOE goals.Characteristic EP Status (7/00) DOE GoalsSystem efficiency @50 kWnet (wo/FP) @12.5 kWnet (wo/FP)
42-44%50-51%
≥44%≥55%
Net power density (W/L) 163 W/L 350 W/LNet specific power (W/kg) 116 W/kg 350 W/kgCost/kW <100 (est.) 100/kWDurability >1880 h 2000 hEmissions <<Tier 2 <<Tier 2Transient performance(10% to 90%)
~0 s 3 s
Precious metal(anode + cathode)
0.6 mg/cm2,1.17 g/kW
0.5 mg/cm2,0.9 g/kW
Cold start-up to full power −40°C 20°C
<5 min97% in ~0 s
5 min1 min
CO tolerance (<20 mV loss at0.7 V) (steady state)
~0 mVwith 2% air bleed
>10 ppm
CO tolerance (<20 mV loss at0.7 V) (3-s transient)
~0 mVwith 2% air bleed
>100 ppm
Partners’ system design. Experimental results fromfreeze-tolerance tests (explained earlier) were usedin the simulations. The quick start-up feature is theresult of optimal utilization of feed gas thermalenergy and fuel cell stack thermal dissipation (patentpending). Currently, the integrated system’s impacton the start-up process, from –40°C, is beinginvestigated at Los Alamos National Laboratory(LANL).
ConclusionEnergy Partners is developing an automotive
fuel cell power system to meet DOE performancegoals. Significant progress has been made in

Fuel Cell Power Systems FY 2000 Progress Report
84
Figure 10. Resulting 50-kWnet automotive system.
Figure 11. Picture of 50-kWnet automotive system.
development of mass-producible bipolar plates, instack and system design, and in development of acontrol strategy that will result in neutral waterbalance over the entire system operating range andunder different ambient conditions.
Presentations/Publications:• M. Fuchs, F. Barbir, and M. Nadal, “Fuel Cell
Powered Utility Vehicle with Metal HydrideFuel Storage,” submitted to the GlobeEx 2000Conference, Las Vegas, Nev., July 2000.
• F. Barbir, “Recent Progress and RemainingTechnical Issues in PEM Fuel CellDevelopment,” submitted to the WorldHydrogen Energy Conference, WHEC XIII,Beijing, China, June 2000.
• F. Barbir, “Air, Water and Heat Management inAutomotive Fuel Cell Systems,” presented at theIntertech Conference on Commercializing FuelCell Vehicles 2000, Berlin, Germany,April 2000.
• M. Fuchs, F. Barbir, A. Husar, J. Neutzler,D. Nelson, and M. Ogburn, “Performance ofAutomotive Fuel Cell Stack,” presented at the2000 Future Car Congress, Arlington, Va.,April 2000.
• F. Barbir, “Bi-polar Plates, Flow Fields andStack Design Criteria,” presented at theAmerican Physical Society Meeting,Minneapolis, Minn., March 2000.
• F. Barbir, M. Fuchs, A. Husar, and J. Neutzler,“Design and Operational Characteristics ofAutomotive PEM Fuel Cell Stacks,” Fuel CellPower for Transportation, SAE SP-1505, Proc.SAE International Congress & Exhibition,Detroit, Mich., March 2000, pp. 63-69, SAE,Warrendale, Pa., 2000.
• V. Gurau, F. Barbir, and H. Liu, “An AnalyticalSolution of a Half-cell Model for PEM FuelCells,” Journal of Electrochemical Society,Vol. 147(7), 2000.
• F. Barbir, M. Nadal, and J. Neutzler,“Development of PEM Fuel Cell Power Systemsfor Transportation Applications,” presented atthe IQPC Conference, Fuel Cell TechnologyAsia 99, Tokyo, Japan, Dec. 1999.
• F. Barbir, B. Balasubramanian, and J. Neutzler,“Trade-off Design Study of Operating Pressureand Temperature in PEM Fuel Cell Systems,”Proc. ASME Advanced Energy SystemsDivision – 1999 ASME InternationalMechanical Engineering Congress & Exposition,AES Vol. 39, pp. 305-315, ASME, 1999.
• F. Barbir, B. Balasubramanian, and J. Neutzler,“Optimal Operating Temperature and Pressurein PEM Fuel Cell Systems in AutomotiveApplications,” Proc. 218th ACS NationalMeeting, Vol. 44, No. 4, pp. 977-981, AmericanChemical Society, 1999.
• F. Barbir, J. Braun, and J.Neutzler, “Propertiesof Molded Graphite Bi-Polar Plates for PEMFuel Cells,” International Journal on NewMaterials for Electrochemical Systems, No. 2,pp. 197-200, 1999.
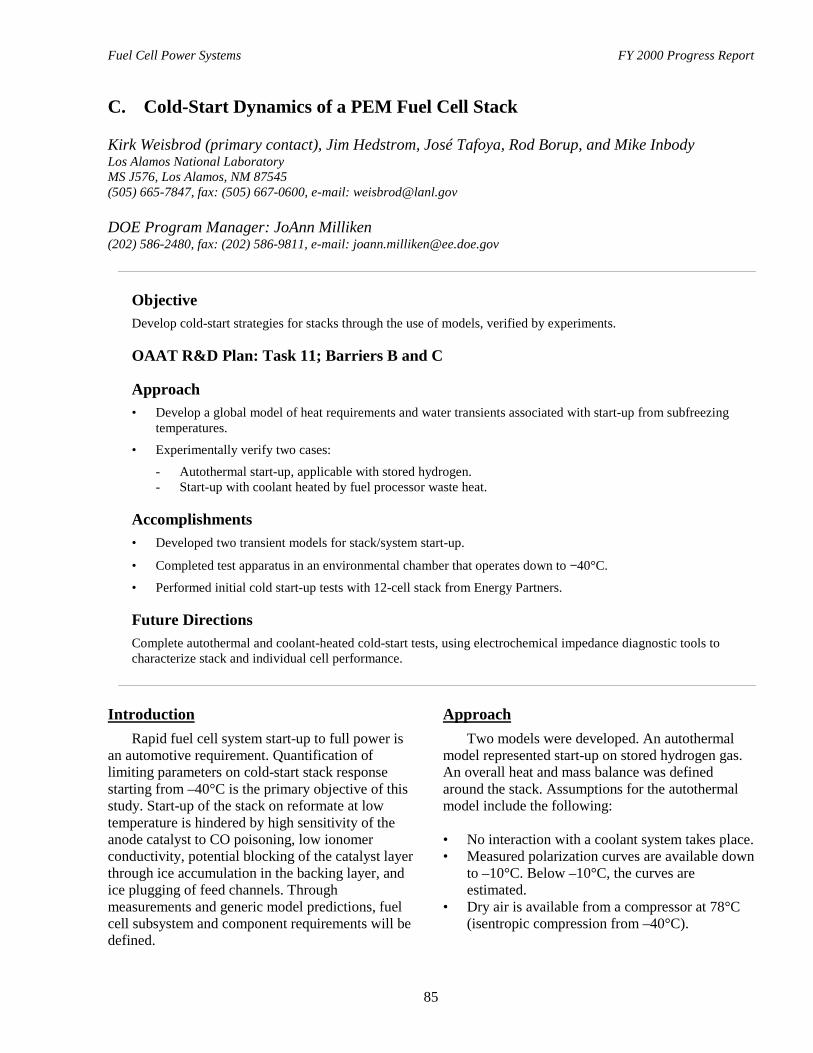
Fuel Cell Power Systems FY 2000 Progress Report
85
C. Cold-Start Dynamics of a PEM Fuel Cell Stack
Kirk Weisbrod (primary contact), Jim Hedstrom, José Tafoya, Rod Borup, and Mike InbodyLos Alamos National LaboratoryMS J576, Los Alamos, NM 87545(505) 665-7847, fax: (505) 667-0600, e-mail: [email protected]
DOE Program Manager: JoAnn Milliken(202) 586-2480, fax: (202) 586-9811, e-mail: [email protected]
ObjectiveDevelop cold-start strategies for stacks through the use of models, verified by experiments.
OAAT R&D Plan: Task 11; Barriers B and C
Approach• Develop a global model of heat requirements and water transients associated with start-up from subfreezing
temperatures.
• Experimentally verify two cases:
- Autothermal start-up, applicable with stored hydrogen.- Start-up with coolant heated by fuel processor waste heat.
Accomplishments• Developed two transient models for stack/system start-up.
• Completed test apparatus in an environmental chamber that operates down to −40°C.
• Performed initial cold start-up tests with 12-cell stack from Energy Partners.
Future DirectionsComplete autothermal and coolant-heated cold-start tests, using electrochemical impedance diagnostic tools tocharacterize stack and individual cell performance.
IntroductionRapid fuel cell system start-up to full power is
an automotive requirement. Quantification oflimiting parameters on cold-start stack responsestarting from –40°C is the primary objective of thisstudy. Start-up of the stack on reformate at lowtemperature is hindered by high sensitivity of theanode catalyst to CO poisoning, low ionomerconductivity, potential blocking of the catalyst layerthrough ice accumulation in the backing layer, andice plugging of feed channels. Throughmeasurements and generic model predictions, fuelcell subsystem and component requirements will bedefined.
ApproachTwo models were developed. An autothermal
model represented start-up on stored hydrogen gas.An overall heat and mass balance was definedaround the stack. Assumptions for the autothermalmodel include the following:
• No interaction with a coolant system takes place.• Measured polarization curves are available down
to –10°C. Below –10°C, the curves areestimated.
• Dry air is available from a compressor at 78°C(isentropic compression from –40°C).
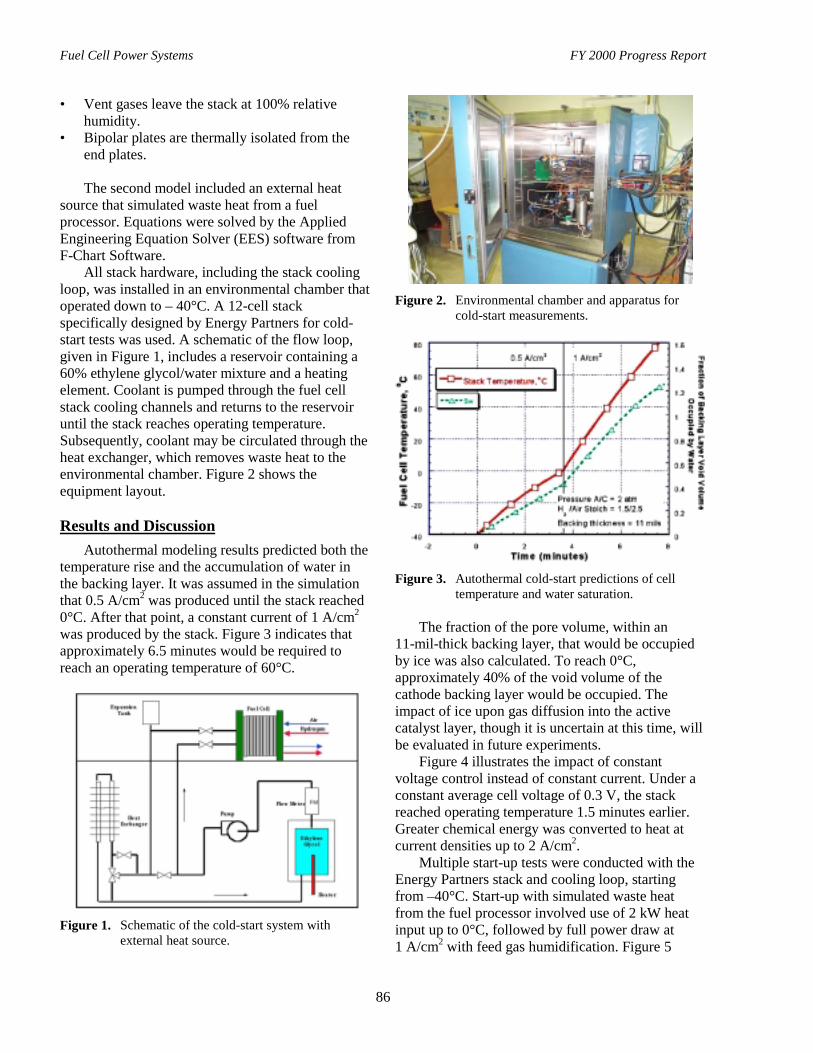
Fuel Cell Power Systems FY 2000 Progress Report
86
• Vent gases leave the stack at 100% relativehumidity.
• Bipolar plates are thermally isolated from theend plates.
The second model included an external heatsource that simulated waste heat from a fuelprocessor. Equations were solved by the AppliedEngineering Equation Solver (EES) software fromF-Chart Software.
All stack hardware, including the stack coolingloop, was installed in an environmental chamber thatoperated down to – 40°C. A 12-cell stackspecifically designed by Energy Partners for cold-start tests was used. A schematic of the flow loop,given in Figure 1, includes a reservoir containing a60% ethylene glycol/water mixture and a heatingelement. Coolant is pumped through the fuel cellstack cooling channels and returns to the reservoiruntil the stack reaches operating temperature.Subsequently, coolant may be circulated through theheat exchanger, which removes waste heat to theenvironmental chamber. Figure 2 shows theequipment layout.
Results and DiscussionAutothermal modeling results predicted both the
temperature rise and the accumulation of water inthe backing layer. It was assumed in the simulationthat 0.5 A/cm2 was produced until the stack reached0°C. After that point, a constant current of 1 A/cm2
was produced by the stack. Figure 3 indicates thatapproximately 6.5 minutes would be required toreach an operating temperature of 60°C.
Figure 1. Schematic of the cold-start system withexternal heat source.
Figure 2. Environmental chamber and apparatus forcold-start measurements.
Figure 3. Autothermal cold-start predictions of celltemperature and water saturation.
The fraction of the pore volume, within an11-mil-thick backing layer, that would be occupiedby ice was also calculated. To reach 0°C,approximately 40% of the void volume of thecathode backing layer would be occupied. Theimpact of ice upon gas diffusion into the activecatalyst layer, though it is uncertain at this time, willbe evaluated in future experiments.
Figure 4 illustrates the impact of constantvoltage control instead of constant current. Under aconstant average cell voltage of 0.3 V, the stackreached operating temperature 1.5 minutes earlier.Greater chemical energy was converted to heat atcurrent densities up to 2 A/cm2.
Multiple start-up tests were conducted with theEnergy Partners stack and cooling loop, startingfrom –40°C. Start-up with simulated waste heatfrom the fuel processor involved use of 2 kW heatinput up to 0°C, followed by full power draw at1 A/cm2 with feed gas humidification. Figure 5
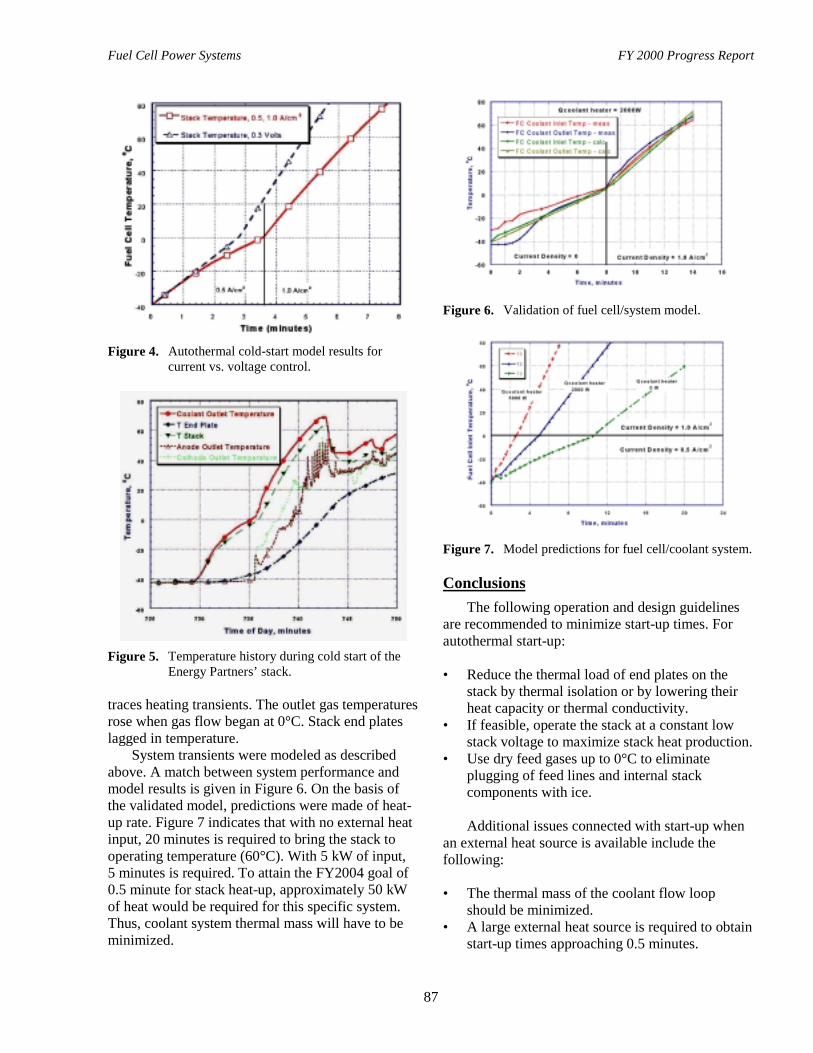
Fuel Cell Power Systems FY 2000 Progress Report
87
Figure 4. Autothermal cold-start model results forcurrent vs. voltage control.
Figure 5. Temperature history during cold start of theEnergy Partners’ stack.
traces heating transients. The outlet gas temperaturesrose when gas flow began at 0°C. Stack end plateslagged in temperature.
System transients were modeled as describedabove. A match between system performance andmodel results is given in Figure 6. On the basis ofthe validated model, predictions were made of heat-up rate. Figure 7 indicates that with no external heatinput, 20 minutes is required to bring the stack tooperating temperature (60°C). With 5 kW of input,5 minutes is required. To attain the FY2004 goal of0.5 minute for stack heat-up, approximately 50 kWof heat would be required for this specific system.Thus, coolant system thermal mass will have to beminimized.
Figure 6. Validation of fuel cell/system model.
Figure 7. Model predictions for fuel cell/coolant system.
ConclusionsThe following operation and design guidelines
are recommended to minimize start-up times. Forautothermal start-up:
• Reduce the thermal load of end plates on thestack by thermal isolation or by lowering theirheat capacity or thermal conductivity.
• If feasible, operate the stack at a constant lowstack voltage to maximize stack heat production.
• Use dry feed gases up to 0°C to eliminateplugging of feed lines and internal stackcomponents with ice.
Additional issues connected with start-up whenan external heat source is available include thefollowing:
• The thermal mass of the coolant flow loopshould be minimized.
• A large external heat source is required to obtainstart-up times approaching 0.5 minutes.
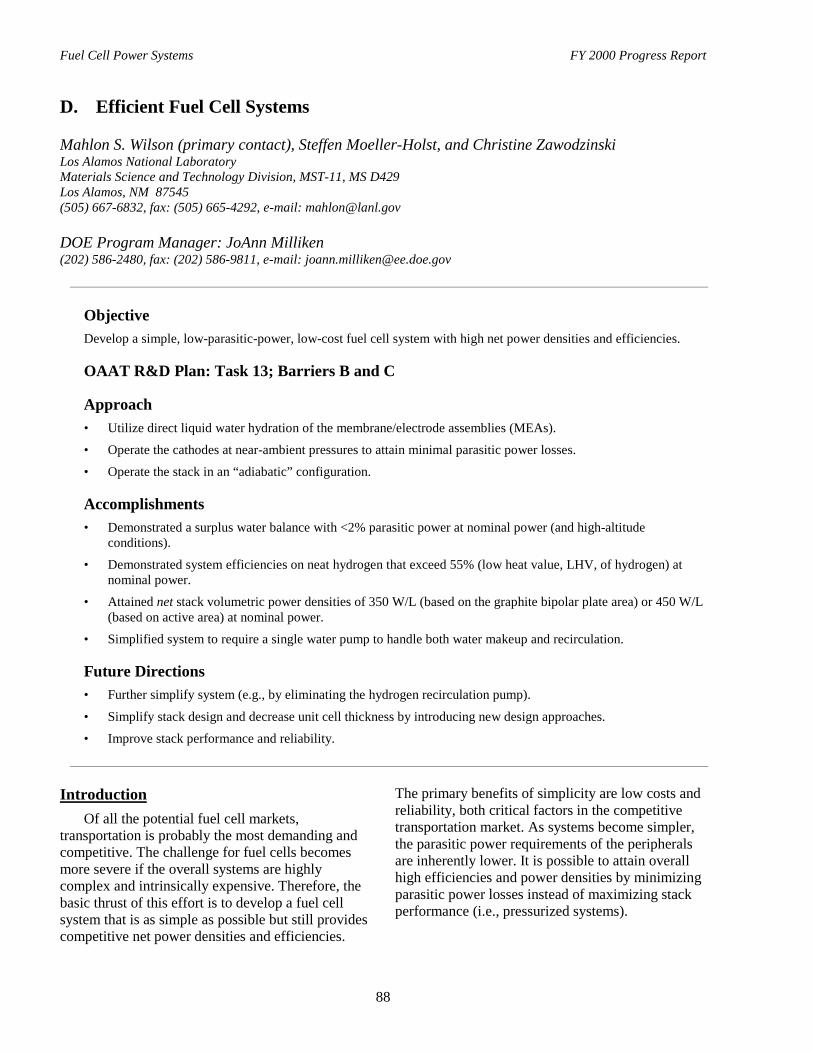
Fuel Cell Power Systems FY 2000 Progress Report
88
D. Efficient Fuel Cell Systems
Mahlon S. Wilson (primary contact), Steffen Moeller-Holst, and Christine ZawodzinskiLos Alamos National LaboratoryMaterials Science and Technology Division, MST-11, MS D429Los Alamos, NM 87545(505) 667-6832, fax: (505) 665-4292, e-mail: [email protected]
DOE Program Manager: JoAnn Milliken(202) 586-2480, fax: (202) 586-9811, e-mail: [email protected]
ObjectiveDevelop a simple, low-parasitic-power, low-cost fuel cell system with high net power densities and efficiencies.
OAAT R&D Plan: Task 13; Barriers B and C
Approach• Utilize direct liquid water hydration of the membrane/electrode assemblies (MEAs).
• Operate the cathodes at near-ambient pressures to attain minimal parasitic power losses.
• Operate the stack in an “adiabatic” configuration.
Accomplishments• Demonstrated a surplus water balance with <2% parasitic power at nominal power (and high-altitude
conditions).
• Demonstrated system efficiencies on neat hydrogen that exceed 55% (low heat value, LHV, of hydrogen) atnominal power.
• Attained net stack volumetric power densities of 350 W/L (based on the graphite bipolar plate area) or 450 W/L(based on active area) at nominal power.
• Simplified system to require a single water pump to handle both water makeup and recirculation.
Future Directions• Further simplify system (e.g., by eliminating the hydrogen recirculation pump).
• Simplify stack design and decrease unit cell thickness by introducing new design approaches.
• Improve stack performance and reliability.
IntroductionOf all the potential fuel cell markets,
transportation is probably the most demanding andcompetitive. The challenge for fuel cells becomesmore severe if the overall systems are highlycomplex and intrinsically expensive. Therefore, thebasic thrust of this effort is to develop a fuel cellsystem that is as simple as possible but still providescompetitive net power densities and efficiencies.
The primary benefits of simplicity are low costs andreliability, both critical factors in the competitivetransportation market. As systems become simpler,the parasitic power requirements of the peripheralsare inherently lower. It is possible to attain overallhigh efficiencies and power densities by minimizingparasitic power losses instead of maximizing stackperformance (i.e., pressurized systems).
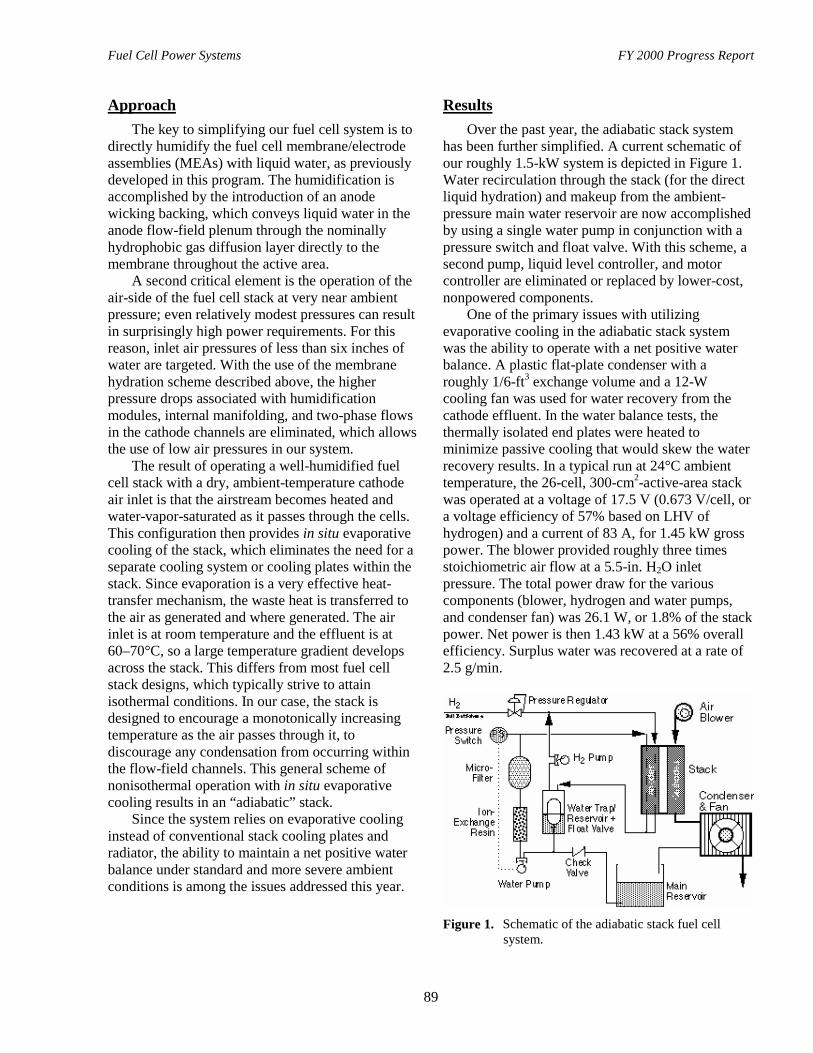
Fuel Cell Power Systems FY 2000 Progress Report
89
ApproachThe key to simplifying our fuel cell system is to
directly humidify the fuel cell membrane/electrodeassemblies (MEAs) with liquid water, as previouslydeveloped in this program. The humidification isaccomplished by the introduction of an anodewicking backing, which conveys liquid water in theanode flow-field plenum through the nominallyhydrophobic gas diffusion layer directly to themembrane throughout the active area.
A second critical element is the operation of theair-side of the fuel cell stack at very near ambientpressure; even relatively modest pressures can resultin surprisingly high power requirements. For thisreason, inlet air pressures of less than six inches ofwater are targeted. With the use of the membranehydration scheme described above, the higherpressure drops associated with humidificationmodules, internal manifolding, and two-phase flowsin the cathode channels are eliminated, which allowsthe use of low air pressures in our system.
The result of operating a well-humidified fuelcell stack with a dry, ambient-temperature cathodeair inlet is that the airstream becomes heated andwater-vapor-saturated as it passes through the cells.This configuration then provides in situ evaporativecooling of the stack, which eliminates the need for aseparate cooling system or cooling plates within thestack. Since evaporation is a very effective heat-transfer mechanism, the waste heat is transferred tothe air as generated and where generated. The airinlet is at room temperature and the effluent is at60–70°C, so a large temperature gradient developsacross the stack. This differs from most fuel cellstack designs, which typically strive to attainisothermal conditions. In our case, the stack isdesigned to encourage a monotonically increasingtemperature as the air passes through it, todiscourage any condensation from occurring withinthe flow-field channels. This general scheme ofnonisothermal operation with in situ evaporativecooling results in an “adiabatic” stack.
Since the system relies on evaporative coolinginstead of conventional stack cooling plates andradiator, the ability to maintain a net positive waterbalance under standard and more severe ambientconditions is among the issues addressed this year.
ResultsOver the past year, the adiabatic stack system
has been further simplified. A current schematic ofour roughly 1.5-kW system is depicted in Figure 1.Water recirculation through the stack (for the directliquid hydration) and makeup from the ambient-pressure main water reservoir are now accomplishedby using a single water pump in conjunction with apressure switch and float valve. With this scheme, asecond pump, liquid level controller, and motorcontroller are eliminated or replaced by lower-cost,nonpowered components.
One of the primary issues with utilizingevaporative cooling in the adiabatic stack systemwas the ability to operate with a net positive waterbalance. A plastic flat-plate condenser with aroughly 1/6-ft3 exchange volume and a 12-Wcooling fan was used for water recovery from thecathode effluent. In the water balance tests, thethermally isolated end plates were heated tominimize passive cooling that would skew the waterrecovery results. In a typical run at 24°C ambienttemperature, the 26-cell, 300-cm2-active-area stackwas operated at a voltage of 17.5 V (0.673 V/cell, ora voltage efficiency of 57% based on LHV ofhydrogen) and a current of 83 A, for 1.45 kW grosspower. The blower provided roughly three timesstoichiometric air flow at a 5.5-in. H2O inletpressure. The total power draw for the variouscomponents (blower, hydrogen and water pumps,and condenser fan) was 26.1 W, or 1.8% of the stackpower. Net power is then 1.43 kW at a 56% overallefficiency. Surplus water was recovered at a rate of2.5 g/min.
Figure 1. Schematic of the adiabatic stack fuel cellsystem.
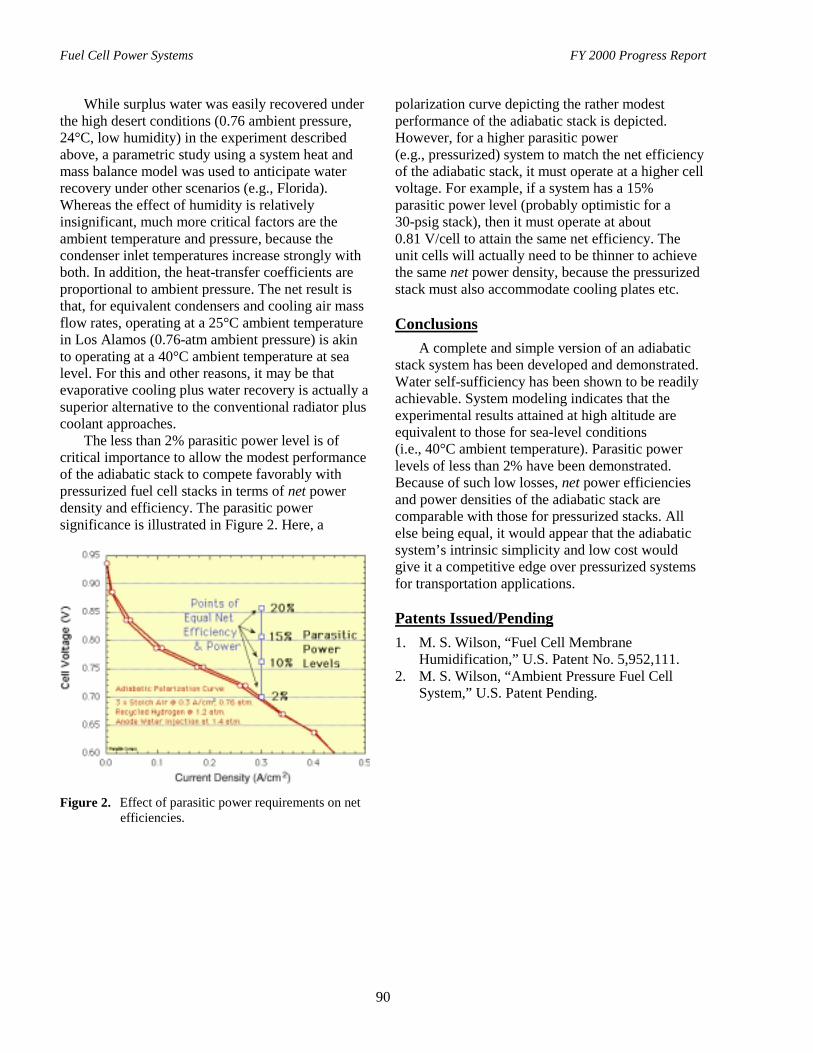
Fuel Cell Power Systems FY 2000 Progress Report
90
While surplus water was easily recovered underthe high desert conditions (0.76 ambient pressure,24°C, low humidity) in the experiment describedabove, a parametric study using a system heat andmass balance model was used to anticipate waterrecovery under other scenarios (e.g., Florida).Whereas the effect of humidity is relativelyinsignificant, much more critical factors are theambient temperature and pressure, because thecondenser inlet temperatures increase strongly withboth. In addition, the heat-transfer coefficients areproportional to ambient pressure. The net result isthat, for equivalent condensers and cooling air massflow rates, operating at a 25°C ambient temperaturein Los Alamos (0.76-atm ambient pressure) is akinto operating at a 40°C ambient temperature at sealevel. For this and other reasons, it may be thatevaporative cooling plus water recovery is actually asuperior alternative to the conventional radiator pluscoolant approaches.
The less than 2% parasitic power level is ofcritical importance to allow the modest performanceof the adiabatic stack to compete favorably withpressurized fuel cell stacks in terms of net powerdensity and efficiency. The parasitic powersignificance is illustrated in Figure 2. Here, a
Figure 2. Effect of parasitic power requirements on netefficiencies.
polarization curve depicting the rather modestperformance of the adiabatic stack is depicted.However, for a higher parasitic power(e.g., pressurized) system to match the net efficiencyof the adiabatic stack, it must operate at a higher cellvoltage. For example, if a system has a 15%parasitic power level (probably optimistic for a30-psig stack), then it must operate at about0.81 V/cell to attain the same net efficiency. Theunit cells will actually need to be thinner to achievethe same net power density, because the pressurizedstack must also accommodate cooling plates etc.
ConclusionsA complete and simple version of an adiabatic
stack system has been developed and demonstrated.Water self-sufficiency has been shown to be readilyachievable. System modeling indicates that theexperimental results attained at high altitude areequivalent to those for sea-level conditions(i.e., 40°C ambient temperature). Parasitic powerlevels of less than 2% have been demonstrated.Because of such low losses, net power efficienciesand power densities of the adiabatic stack arecomparable with those for pressurized stacks. Allelse being equal, it would appear that the adiabaticsystem’s intrinsic simplicity and low cost wouldgive it a competitive edge over pressurized systemsfor transportation applications.
Patents Issued/Pending1. M. S. Wilson, “Fuel Cell Membrane
Humidification,” U.S. Patent No. 5,952,111.2. M. S. Wilson, “Ambient Pressure Fuel Cell
System,” U.S. Patent Pending.

Fuel Cell Power Systems FY 2000 Progress Report
91
E. Direct Methanol Fuel Cells
Xiaoming Ren, Piotr Zelenay, Huyen Dinh, John Davey, and Shimshon Gottesfeld (primary contact)Los Alamos National Laboratory, Los Alamos, NM 87545(505) 667-6853, fax: (505) 665-4292, e-mail: [email protected]
DOE Program Manager: JoAnn Milliken(202) 586-2480, fax: (202) 586-9811, e-mail: [email protected]
ObjectivesDevelop materials, components, and operation conditions for direct methanol fuel cells (DMFCs) so as to prove thepotential of DMFCs for transportation applications in terms of power density, energy-conversion efficiency, andcost. Specifically,• Continue to optimize anode and cathode catalyst layers to enhance cell performance;
• Prove that low fuel utilization can be resolved through a combination of ionomeric membranes of good protonicconductivity and optimized stack structure and operation conditions; and
• Prove the stability of all cell components – primarily anode catalyst – in longer-term operation subject to thesecombined requirements.
OAAT R&D Plan: Task 14; Barriers B, F, H, and I
Approach• Operate DMFCs and stacks near 100°C with a variety of membrane/electrode assemblies (MEAs), using
optimized catalyst layers to demonstrate performance and stability.
• Optimize other cell components, including backing layers and bipolar plate/flow fields, to maximizedemonstrated performance in DMFC small stacks operating near 100°C.
Accomplishments• Small DMFC Stack Development: 30-cell, 45-cm2 active area, methanol/air stack fabricated, employing Los
Alamos National Laboratory (LANL) hardware; 80 W generated by stack in initial testing near ambientconditions ( 200 W expected near 90oC).
• Lowered Pt Loading: Low-Pt DMFCs (50 cm2) demonstrated: 5 g Pt/kW, with peak power of 0.15 W cm-2;2 g Pt/kW with peak power of 0.12 W cm-2.
Future Directions• Further lowering of precious catalyst loading.
• Possible scale-up of stack to the 1.0-kW level (budget permitting).
IntroductionThe objective of the direct methanol fuel cell
effort at LANL, sponsored by the U.S. Departmentof Energy’s Office of Advanced AutomotiveTechnologies (DOE/OAAT), has been to developmaterials, components, and operation conditions forsuch cells and small stacks, to prove their potential
for transportation applications in terms of powerdensity, energy conversion efficiency, and cost.Introduction of a DMFC as a primary power sourcefor transportation could provide the combinedattractive properties of a liquid fuel of good potentialavailability, high system simplicity (liquid fuel + airin, DC power out), good potential for packaging asrequired to achieve 350-mile range in a passenger

Fuel Cell Power Systems FY 2000 Progress Report
92
vehicle, and good potential for achieving zero-emission-vehicle (ZEV) characteristics.
ResultsOur DMFC work in fiscal year (FY) 2000
included advances in DMFC stack componentdevelopment, stack assembly, and stack testing. Inaddition, we made significant headway indemonstrating DMFCs with catalyst loadings thatwere lower by a factor of 10 compared with theloading used in military applications of thetechnology, at a cost in peak power of only about30%. The demonstration of operation on such lower-Pt loadings has provided hope for bringing precious-metal catalyst levels in DMFCs to within a factor oftwo of the precious metal level per kilowatt usedtoday in fuel cell systems, based on on-boardreforming. Figure 1 shows a comparison at 100°Cand 110°C of DMFC (single-cell) performance on>10 mg Pt/cm2 and on <1 mg Pt/cm2. It is clear thatthe lowering in peak power, observed as a result oflowering the Pt loading by an order of magnitude, israther modest. The trade-off between DMFC Ptloading per kilowatt and cell peak power issummarized in Table 1. For comparison, fuel cellpower systems based on reforming-on-board use atpresent attain near 2 g Pt/kW, while generating stackpeak power near 0.5 W cm-2.
We extended our DMFC work to the level of a30-cell stack of 50-cm2 cells, shown in Figure 2.Novel stack hardware has been developed in-house.We have demonstrated initial power output of 80 Wunder close-to-ambient conditions, and by the end ofthis calendar year we expect to be able todemonstrate 200 W from the same stack under thehigher temperature and pressure applicable fortransportation applications. We showed that veryeffective packaging could be achieved with our stackstructure, which has a pitch per cell of 2 mm, or5 cells/cm. This corresponds to a power density of1 W/cm3, or 1 kW/L of active volume of the stackwhen operated at a higher temperature, around 90oC,and at 30-psig air. We see the success in building thesmall stack as a substantial basis for scale-up to the1-kW level.
Another important demonstration this year wasthe applicability of “factory-grade” methanol toDMFC operation, without any further purification.Analytic-grade methanol and methanol from thefactory gate yielded the same cell performance andperformance stability. Significantly, no special “fuelcell grade” methanol will apparently be required forDMFCs.
An important development this year has been theinterest expressed by Motorola in working withLANL on DMFC technology for a variety of
V for 1058 vs AP for 1058 V For 1042 vs AP for 1042
Cell Current Density (A cm-2)
0.0 0.2 0.4 0.6 0.8
Cell
Volta
ge (V
)
0.0
0.2
0.4
0.6
0.8110°C
0.8 mg Pt cm-2
(total)
16.6 mg Pt cm-2
(total)
Cell Current Density (A cm-2)
0.0 0.2 0.4 0.6 0.8
Cell
Volta
ge (V
)
0.0
0.2
0.4
0.6
0.8100°C
0.8 mg Pt cm-2
(total)
16.6 mg Pt cm-2
(total)
Figure 1. DMFC polarization curves for ultra-high and low Pt loadings at 100 and 100°C (45-cm2 cell).
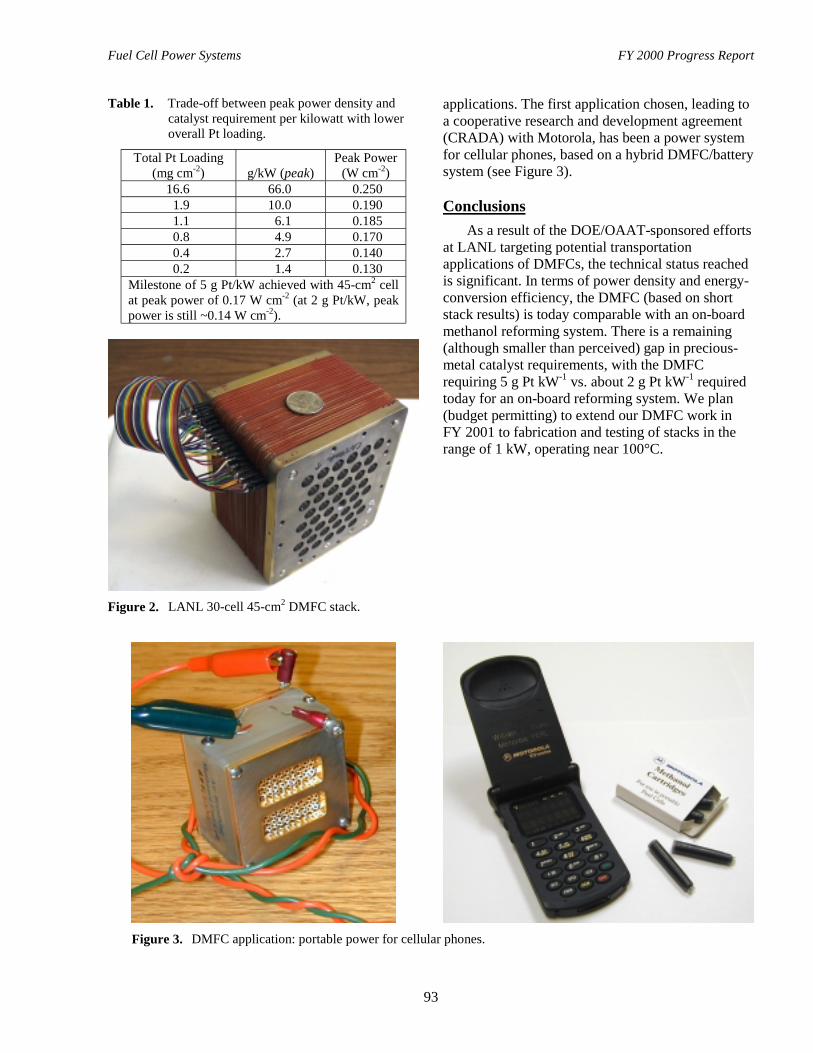
Fuel Cell Power Systems FY 2000 Progress Report
93
Table 1. Trade-off between peak power density andcatalyst requirement per kilowatt with loweroverall Pt loading.
Total Pt Loading(mg cm-2) g/kW (peak)
Peak Power(W cm-2)
16.6 66.0 0.2501.9 10.0 0.1901.1 6.1 0.1850.8 4.9 0.1700.4 2.7 0.1400.2 1.4 0.130
Milestone of 5 g Pt/kW achieved with 45-cm2 cellat peak power of 0.17 W cm-2 (at 2 g Pt/kW, peakpower is still ~0.14 W cm-2).
Figure 2. LANL 30-cell 45-cm2 DMFC stack.
applications. The first application chosen, leading toa cooperative research and development agreement(CRADA) with Motorola, has been a power systemfor cellular phones, based on a hybrid DMFC/batterysystem (see Figure 3).
ConclusionsAs a result of the DOE/OAAT-sponsored efforts
at LANL targeting potential transportationapplications of DMFCs, the technical status reachedis significant. In terms of power density and energy-conversion efficiency, the DMFC (based on shortstack results) is today comparable with an on-boardmethanol reforming system. There is a remaining(although smaller than perceived) gap in precious-metal catalyst requirements, with the DMFCrequiring 5 g Pt kW-1 vs. about 2 g Pt kW-1 requiredtoday for an on-board reforming system. We plan(budget permitting) to extend our DMFC work inFY 2001 to fabrication and testing of stacks in therange of 1 kW, operating near 100°C.
Figure 3. DMFC application: portable power for cellular phones.

Fuel Cell Power Systems FY 2000 Progress Report
94
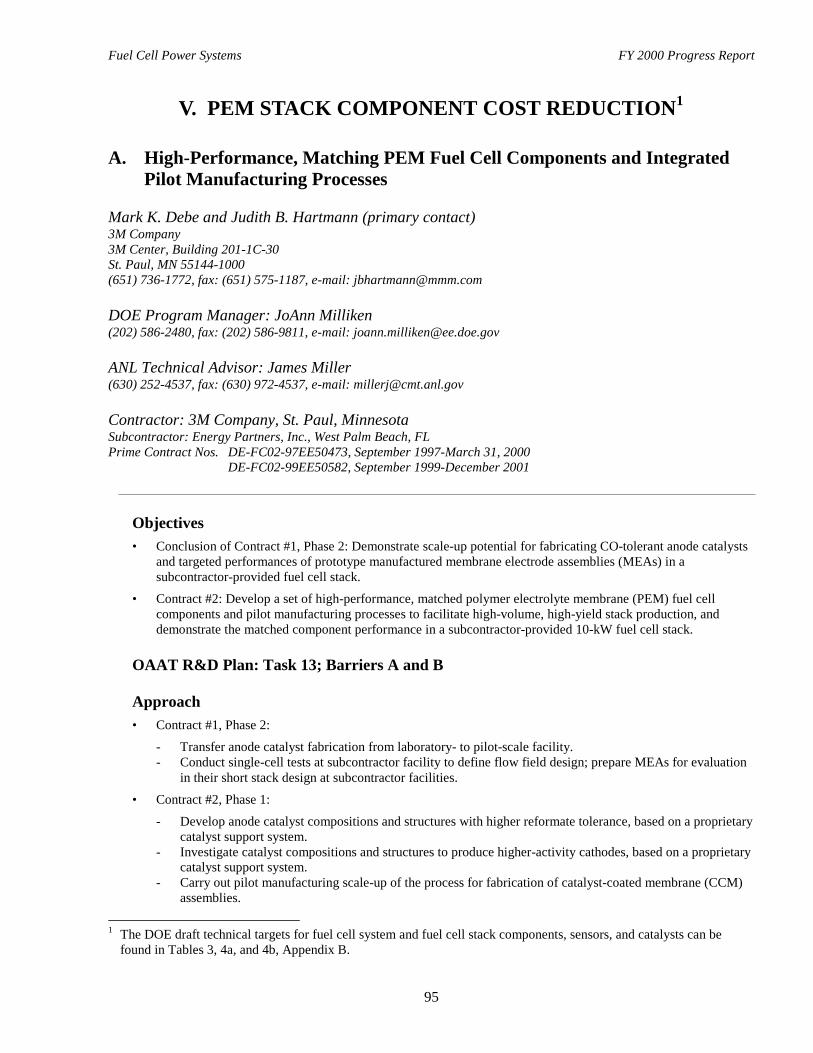
Fuel Cell Power Systems FY 2000 Progress Report
95
V. PEM STACK COMPONENT COST REDUCTION1
A. High-Performance, Matching PEM Fuel Cell Components and IntegratedPilot Manufacturing Processes
Mark K. Debe and Judith B. Hartmann (primary contact)3M Company3M Center, Building 201-1C-30St. Paul, MN 55144-1000(651) 736-1772, fax: (651) 575-1187, e-mail: [email protected]
DOE Program Manager: JoAnn Milliken(202) 586-2480, fax: (202) 586-9811, e-mail: [email protected]
ANL Technical Advisor: James Miller(630) 252-4537, fax: (630) 972-4537, e-mail: [email protected]
Contractor: 3M Company, St. Paul, MinnesotaSubcontractor: Energy Partners, Inc., West Palm Beach, FLPrime Contract Nos. DE-FC02-97EE50473, September 1997-March 31, 2000
DE-FC02-99EE50582, September 1999-December 2001
Objectives• Conclusion of Contract #1, Phase 2: Demonstrate scale-up potential for fabricating CO-tolerant anode catalysts
and targeted performances of prototype manufactured membrane electrode assemblies (MEAs) in asubcontractor-provided fuel cell stack.
• Contract #2: Develop a set of high-performance, matched polymer electrolyte membrane (PEM) fuel cellcomponents and pilot manufacturing processes to facilitate high-volume, high-yield stack production, anddemonstrate the matched component performance in a subcontractor-provided 10-kW fuel cell stack.
OAAT R&D Plan: Task 13; Barriers A and B
Approach• Contract #1, Phase 2:
- Transfer anode catalyst fabrication from laboratory- to pilot-scale facility.- Conduct single-cell tests at subcontractor facility to define flow field design; prepare MEAs for evaluation
in their short stack design at subcontractor facilities.
• Contract #2, Phase 1:
- Develop anode catalyst compositions and structures with higher reformate tolerance, based on a proprietarycatalyst support system.
- Investigate catalyst compositions and structures to produce higher-activity cathodes, based on a proprietarycatalyst support system.
- Carry out pilot manufacturing scale-up of the process for fabrication of catalyst-coated membrane (CCM)assemblies.
1 The DOE draft technical targets for fuel cell system and fuel cell stack components, sensors, and catalysts can be
found in Tables 3, 4a, and 4b, Appendix B.

Fuel Cell Power Systems FY 2000 Progress Report
96
- Develop carbon electrode backing (EB) media, optimized for performance with the catalyst system.- Optimize the fuel cell flow field, with the stack manufacturing subcontractor, for water management and
air bleed utilization with the catalyst system.
• Contract #2, Phase 2:- Evaluate matched component system’s performance in subcontractor stack tests.- Fabricate and deliver a 10-kW stack.
Accomplishments• Successfully scaled up anode catalyst, completed large-area short stack testing at Energy Partners, and prepared
final report on Contract #1.
• Defined and implemented development of methods for fast screening of new anode and cathode catalystcompositions and structures, which have direct correlation with fuel cell performance.
• Implemented and refined multiple in-situ techniques for characterizing MEA properties relevant to fuel cellperformance.
• Systematically evaluated multiple PEMs and gas diffusion layer media in MEAs to select the optimal set forcatalyst screening experiments.
• Developed a quantitative understanding of optimal water management and operating conditions for thenanostructured MEAs.
• Identified critical factors in MEA components and fuel cell break-in conditioning, leading to significantimprovements in performance.
• Identified and implemented improvements in pilot-scale CCM fabrication, which resulted in improved fuel cellperformance.
• Achieved improved definition of process windows for catalyst and CCM fabrication; identified key processparameters for statistically designed scale-up and quality improvement studies in the next stage of the effort.
• Completed the greater portion of the work needed to establish test stations, in-line process equipment, andmonitoring equipment to support the laboratory- and pilot-scale studies.
• Completed fuel cell evaluations and characterization studies of ~50 different electrode backings, which fallunder four different media categories. Identified key EB characteristics related to fuel cell performance anddeveloped increased understanding of differences among the types of media that influence how to optimizetheir use.
• Evaluated the effects of EB coating properties on fuel cell performance for the different types of EB media.
• Implemented three-dimensional flow field model for simulation of down-channel and cross-channeldistributions of oxygen, temperature, current density, and water saturation levels.
Future Directions• Continue development and evaluation of anode and cathode catalysts, emphasizing scaleable process methods
that yield higher specific surface area activities for oxygen reduction.
• Continue EB materials and process development to optimize water management with a high-volumemanufacturing process.
• Continue development of the CCM pilot-scale process to improve on-line process control methods, yields,quality, and performance.
• Continue flow field optimization modeling and verification.
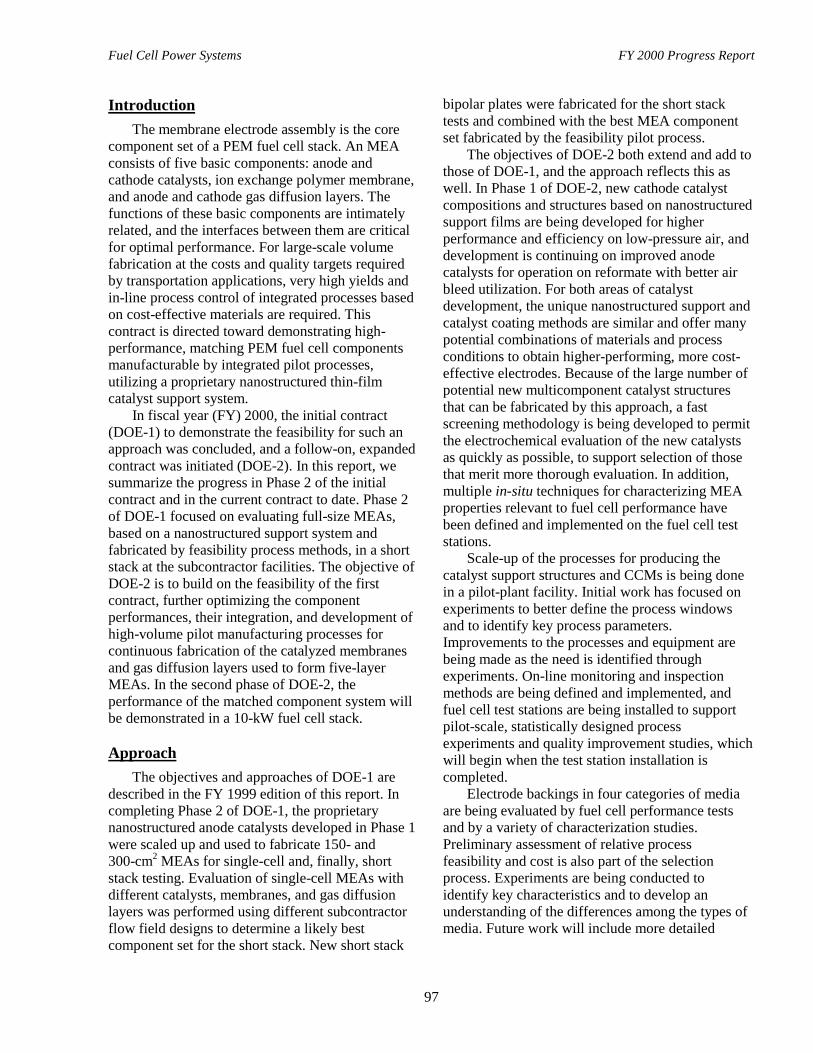
Fuel Cell Power Systems FY 2000 Progress Report
97
IntroductionThe membrane electrode assembly is the core
component set of a PEM fuel cell stack. An MEAconsists of five basic components: anode andcathode catalysts, ion exchange polymer membrane,and anode and cathode gas diffusion layers. Thefunctions of these basic components are intimatelyrelated, and the interfaces between them are criticalfor optimal performance. For large-scale volumefabrication at the costs and quality targets requiredby transportation applications, very high yields andin-line process control of integrated processes basedon cost-effective materials are required. Thiscontract is directed toward demonstrating high-performance, matching PEM fuel cell componentsmanufacturable by integrated pilot processes,utilizing a proprietary nanostructured thin-filmcatalyst support system.
In fiscal year (FY) 2000, the initial contract(DOE-1) to demonstrate the feasibility for such anapproach was concluded, and a follow-on, expandedcontract was initiated (DOE-2). In this report, wesummarize the progress in Phase 2 of the initialcontract and in the current contract to date. Phase 2of DOE-1 focused on evaluating full-size MEAs,based on a nanostructured support system andfabricated by feasibility process methods, in a shortstack at the subcontractor facilities. The objective ofDOE-2 is to build on the feasibility of the firstcontract, further optimizing the componentperformances, their integration, and development ofhigh-volume pilot manufacturing processes forcontinuous fabrication of the catalyzed membranesand gas diffusion layers used to form five-layerMEAs. In the second phase of DOE-2, theperformance of the matched component system willbe demonstrated in a 10-kW fuel cell stack.
ApproachThe objectives and approaches of DOE-1 are
described in the FY 1999 edition of this report. Incompleting Phase 2 of DOE-1, the proprietarynanostructured anode catalysts developed in Phase 1were scaled up and used to fabricate 150- and300-cm2 MEAs for single-cell and, finally, shortstack testing. Evaluation of single-cell MEAs withdifferent catalysts, membranes, and gas diffusionlayers was performed using different subcontractorflow field designs to determine a likely bestcomponent set for the short stack. New short stack
bipolar plates were fabricated for the short stacktests and combined with the best MEA componentset fabricated by the feasibility pilot process.
The objectives of DOE-2 both extend and add tothose of DOE-1, and the approach reflects this aswell. In Phase 1 of DOE-2, new cathode catalystcompositions and structures based on nanostructuredsupport films are being developed for higherperformance and efficiency on low-pressure air, anddevelopment is continuing on improved anodecatalysts for operation on reformate with better airbleed utilization. For both areas of catalystdevelopment, the unique nanostructured support andcatalyst coating methods are similar and offer manypotential combinations of materials and processconditions to obtain higher-performing, more cost-effective electrodes. Because of the large number ofpotential new multicomponent catalyst structuresthat can be fabricated by this approach, a fastscreening methodology is being developed to permitthe electrochemical evaluation of the new catalystsas quickly as possible, to support selection of thosethat merit more thorough evaluation. In addition,multiple in-situ techniques for characterizing MEAproperties relevant to fuel cell performance havebeen defined and implemented on the fuel cell teststations.
Scale-up of the processes for producing thecatalyst support structures and CCMs is being donein a pilot-plant facility. Initial work has focused onexperiments to better define the process windowsand to identify key process parameters.Improvements to the processes and equipment arebeing made as the need is identified throughexperiments. On-line monitoring and inspectionmethods are being defined and implemented, andfuel cell test stations are being installed to supportpilot-scale, statistically designed processexperiments and quality improvement studies, whichwill begin when the test station installation iscompleted.
Electrode backings in four categories of mediaare being evaluated by fuel cell performance testsand by a variety of characterization studies.Preliminary assessment of relative processfeasibility and cost is also part of the selectionprocess. Experiments are being conducted toidentify key characteristics and to develop anunderstanding of the differences among the types ofmedia. Future work will include more detailed
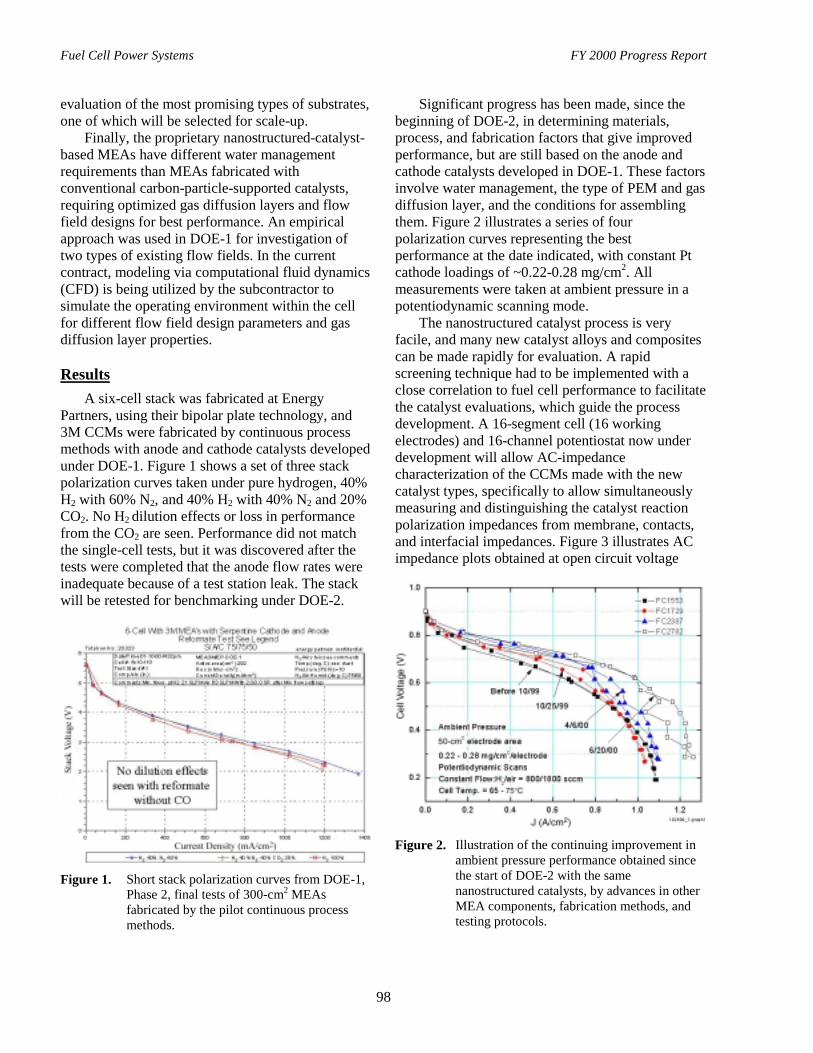
Fuel Cell Power Systems FY 2000 Progress Report
98
evaluation of the most promising types of substrates,one of which will be selected for scale-up.
Finally, the proprietary nanostructured-catalyst-based MEAs have different water managementrequirements than MEAs fabricated withconventional carbon-particle-supported catalysts,requiring optimized gas diffusion layers and flowfield designs for best performance. An empiricalapproach was used in DOE-1 for investigation oftwo types of existing flow fields. In the currentcontract, modeling via computational fluid dynamics(CFD) is being utilized by the subcontractor tosimulate the operating environment within the cellfor different flow field design parameters and gasdiffusion layer properties.
ResultsA six-cell stack was fabricated at Energy
Partners, using their bipolar plate technology, and3M CCMs were fabricated by continuous processmethods with anode and cathode catalysts developedunder DOE-1. Figure 1 shows a set of three stackpolarization curves taken under pure hydrogen, 40%H2 with 60% N2, and 40% H2 with 40% N2 and 20%CO2. No H2 dilution effects or loss in performancefrom the CO2 are seen. Performance did not matchthe single-cell tests, but it was discovered after thetests were completed that the anode flow rates wereinadequate because of a test station leak. The stackwill be retested for benchmarking under DOE-2.
Figure 1. Short stack polarization curves from DOE-1,Phase 2, final tests of 300-cm2 MEAsfabricated by the pilot continuous processmethods.
Significant progress has been made, since thebeginning of DOE-2, in determining materials,process, and fabrication factors that give improvedperformance, but are still based on the anode andcathode catalysts developed in DOE-1. These factorsinvolve water management, the type of PEM and gasdiffusion layer, and the conditions for assemblingthem. Figure 2 illustrates a series of fourpolarization curves representing the bestperformance at the date indicated, with constant Ptcathode loadings of ~0.22-0.28 mg/cm2. Allmeasurements were taken at ambient pressure in apotentiodynamic scanning mode.
The nanostructured catalyst process is veryfacile, and many new catalyst alloys and compositescan be made rapidly for evaluation. A rapidscreening technique had to be implemented with aclose correlation to fuel cell performance to facilitatethe catalyst evaluations, which guide the processdevelopment. A 16-segment cell (16 workingelectrodes) and 16-channel potentiostat now underdevelopment will allow AC-impedancecharacterization of the CCMs made with the newcatalyst types, specifically to allow simultaneouslymeasuring and distinguishing the catalyst reactionpolarization impedances from membrane, contacts,and interfacial impedances. Figure 3 illustrates ACimpedance plots obtained at open circuit voltage
Figure 2. Illustration of the continuing improvement inambient pressure performance obtained sincethe start of DOE-2 with the samenanostructured catalysts, by advances in otherMEA components, fabrication methods, andtesting protocols.

Fuel Cell Power Systems FY 2000 Progress Report
99
Figure 3. AC impedance plots obtained at open-circuitvoltage under reformate with a prototypesegmented cell from five different catalystcompositions. The low-frequency intercept isseen to be a strong function of catalystcomposition. The final 16-segment cell andpotentiostat will be used to rapidly screen newanode and cathode catalysts.
under reformate, with a prototype segmented cell,from five different catalyst compositions. The low-frequency intercept is seen to be a strong function ofcatalyst composition.
Improvements to the pilot-plant CCMfabrication process and equipment resulted inmaterial having improved fuel cell performance.Ambient-pressure polarization curves taken inpotentiodynamic/constant flow (PDS) andgalvanostatic/constant stoichiometry (GSS) scanningmodes for this material are shown in Figure 4. Thediscrepancy at low current densities between thePDS and GSS curves reflects the need for optimizedelectrode backings and flow fields. Experimentsconducted on the catalyst fabrication processresulted in better definition of the process windowsand identification of major variables for future,statistically designed experiments. Installation ofpilot-plant test equipment to support statisticallydesigned scale-up and process quality improvementstudies is nearing completion.
Fuel cell evaluations and characterizationstudies were completed for ~50 different EBs, whichfall under four different media categories. Also,
Figure 4. Ambient-pressure polarization curvescomparing two scanning protocols for CCMsfabricated by pilot process methods. PDS =potentiodynamic scan, constant flow,10 sec/point; GSS = galvanostatic scan,constant stoichiometry, 10 min/point.
several experiments were completed to evaluate theeffects of coating properties on fuel cell performanceand identify differences among the different types ofmedia. Key EB characteristics that relate to fuel cellperformance were identified, and an increasedunderstanding of differences among the types ofmedia that influence how to optimize their use wasdeveloped. Methods for achieving improvedperformance are being identified and implementedas needed to complete the evaluation and selectionprocess.
The final deliverable of DOE-2 (and the focus ofPhase 2) is assembly of a 10-kW stack by thesubcontractor. The bipolar-plate flow field design isan important factor affecting MEA performance,particularly with respect to water management andair bleed utilization across the area of an individualcell. A final task of DOE-2 is thus directed atutilizing experience from the DOE-1 short stacktesting and the subcontractor’s computer modelingand simulation programs to design a flow field thatoptimizes the performance of the MEAs with thenanostructured-catalyst system in an operating stack.
CFD simulations (single phase with heattransfer) of five different flow field designs havebeen examined for qualitative implications, and thefeature(s) examined that have the most influence onuniformity of current density, temperature, oxygen,and water vapor distributions across and along the
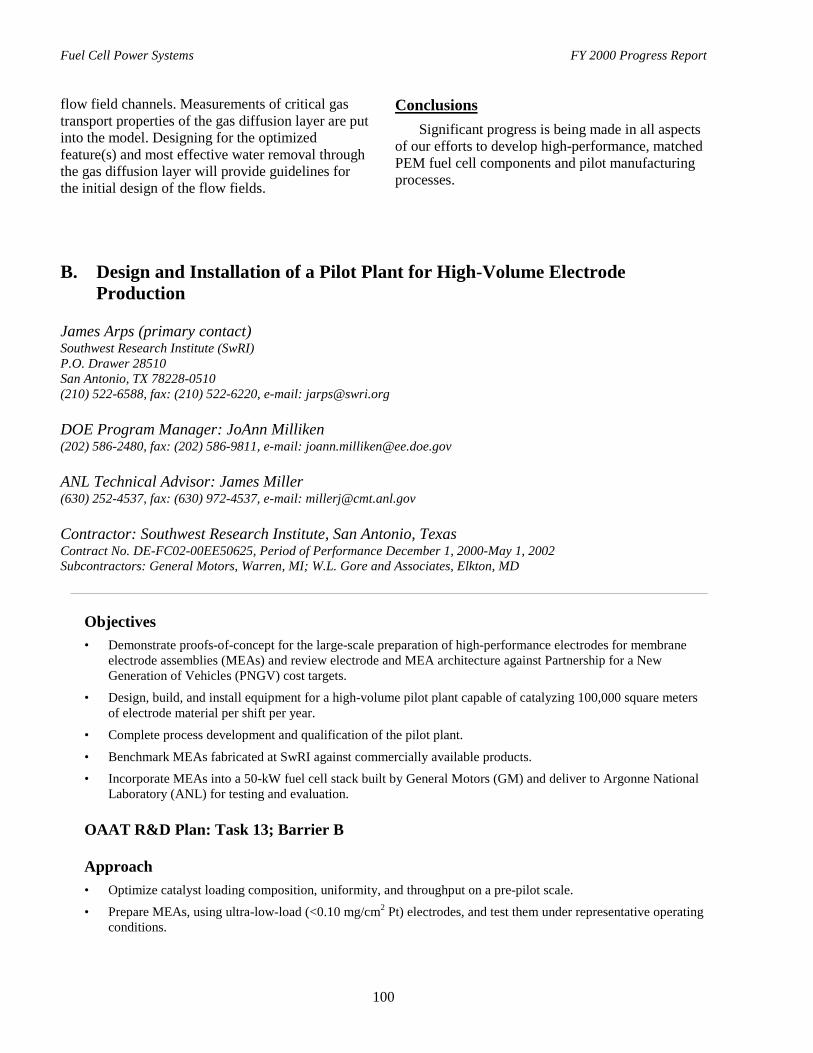
Fuel Cell Power Systems FY 2000 Progress Report
100
flow field channels. Measurements of critical gastransport properties of the gas diffusion layer are putinto the model. Designing for the optimizedfeature(s) and most effective water removal throughthe gas diffusion layer will provide guidelines forthe initial design of the flow fields.
ConclusionsSignificant progress is being made in all aspects
of our efforts to develop high-performance, matchedPEM fuel cell components and pilot manufacturingprocesses.
B. Design and Installation of a Pilot Plant for High-Volume ElectrodeProduction
James Arps (primary contact)Southwest Research Institute (SwRI)P.O. Drawer 28510San Antonio, TX 78228-0510(210) 522-6588, fax: (210) 522-6220, e-mail: [email protected]
DOE Program Manager: JoAnn Milliken(202) 586-2480, fax: (202) 586-9811, e-mail: [email protected]
ANL Technical Advisor: James Miller(630) 252-4537, fax: (630) 972-4537, e-mail: [email protected]
Contractor: Southwest Research Institute, San Antonio, TexasContract No. DE-FC02-00EE50625, Period of Performance December 1, 2000-May 1, 2002Subcontractors: General Motors, Warren, MI; W.L. Gore and Associates, Elkton, MD
Objectives• Demonstrate proofs-of-concept for the large-scale preparation of high-performance electrodes for membrane
electrode assemblies (MEAs) and review electrode and MEA architecture against Partnership for a NewGeneration of Vehicles (PNGV) cost targets.
• Design, build, and install equipment for a high-volume pilot plant capable of catalyzing 100,000 square metersof electrode material per shift per year.
• Complete process development and qualification of the pilot plant.
• Benchmark MEAs fabricated at SwRI against commercially available products.• Incorporate MEAs into a 50-kW fuel cell stack built by General Motors (GM) and deliver to Argonne National
Laboratory (ANL) for testing and evaluation.
OAAT R&D Plan: Task 13; Barrier B
Approach• Optimize catalyst loading composition, uniformity, and throughput on a pre-pilot scale.
• Prepare MEAs, using ultra-low-load (<0.10 mg/cm2 Pt) electrodes, and test them under representative operatingconditions.
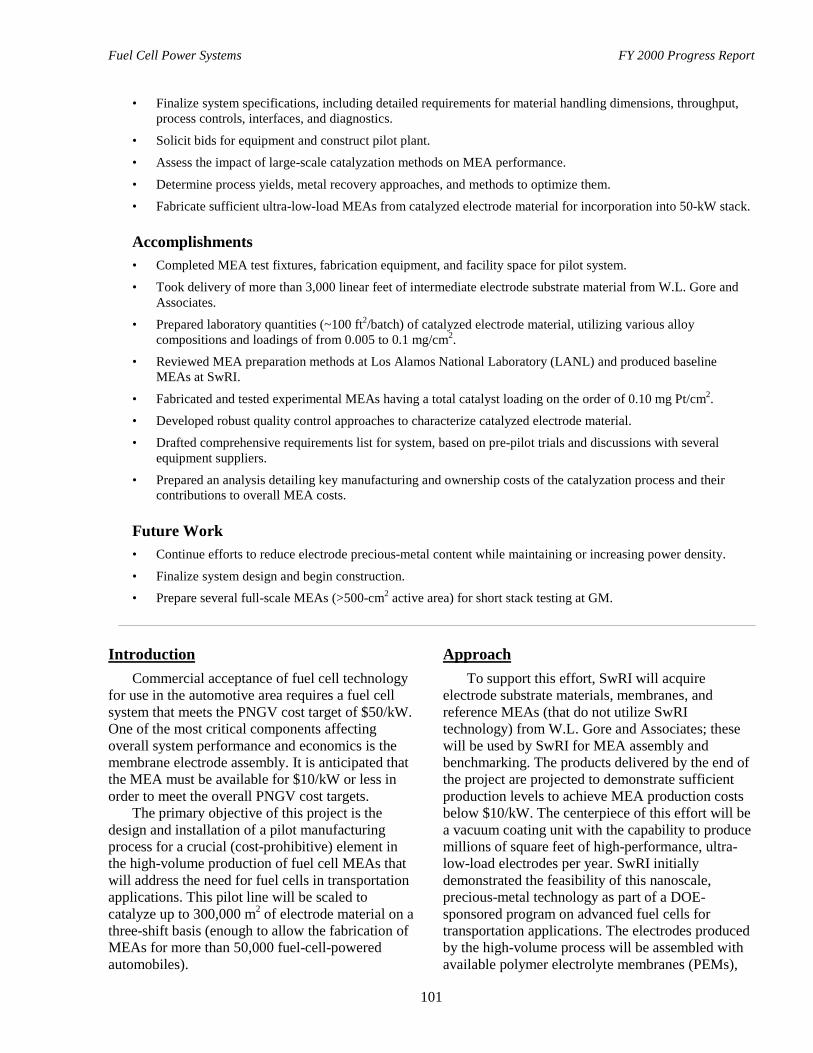
Fuel Cell Power Systems FY 2000 Progress Report
101
• Finalize system specifications, including detailed requirements for material handling dimensions, throughput,process controls, interfaces, and diagnostics.
• Solicit bids for equipment and construct pilot plant.
• Assess the impact of large-scale catalyzation methods on MEA performance.
• Determine process yields, metal recovery approaches, and methods to optimize them.
• Fabricate sufficient ultra-low-load MEAs from catalyzed electrode material for incorporation into 50-kW stack.
Accomplishments• Completed MEA test fixtures, fabrication equipment, and facility space for pilot system.
• Took delivery of more than 3,000 linear feet of intermediate electrode substrate material from W.L. Gore andAssociates.
• Prepared laboratory quantities (~100 ft2/batch) of catalyzed electrode material, utilizing various alloycompositions and loadings of from 0.005 to 0.1 mg/cm2.
• Reviewed MEA preparation methods at Los Alamos National Laboratory (LANL) and produced baselineMEAs at SwRI.
• Fabricated and tested experimental MEAs having a total catalyst loading on the order of 0.10 mg Pt/cm2.
• Developed robust quality control approaches to characterize catalyzed electrode material.
• Drafted comprehensive requirements list for system, based on pre-pilot trials and discussions with severalequipment suppliers.
• Prepared an analysis detailing key manufacturing and ownership costs of the catalyzation process and theircontributions to overall MEA costs.
Future Work• Continue efforts to reduce electrode precious-metal content while maintaining or increasing power density.
• Finalize system design and begin construction.• Prepare several full-scale MEAs (>500-cm2 active area) for short stack testing at GM.
IntroductionCommercial acceptance of fuel cell technology
for use in the automotive area requires a fuel cellsystem that meets the PNGV cost target of $50/kW.One of the most critical components affectingoverall system performance and economics is themembrane electrode assembly. It is anticipated thatthe MEA must be available for $10/kW or less inorder to meet the overall PNGV cost targets.
The primary objective of this project is thedesign and installation of a pilot manufacturingprocess for a crucial (cost-prohibitive) element inthe high-volume production of fuel cell MEAs thatwill address the need for fuel cells in transportationapplications. This pilot line will be scaled tocatalyze up to 300,000 m2 of electrode material on athree-shift basis (enough to allow the fabrication ofMEAs for more than 50,000 fuel-cell-poweredautomobiles).
ApproachTo support this effort, SwRI will acquire
electrode substrate materials, membranes, andreference MEAs (that do not utilize SwRItechnology) from W.L. Gore and Associates; thesewill be used by SwRI for MEA assembly andbenchmarking. The products delivered by the end ofthe project are projected to demonstrate sufficientproduction levels to achieve MEA production costsbelow $10/kW. The centerpiece of this effort will bea vacuum coating unit with the capability to producemillions of square feet of high-performance, ultra-low-load electrodes per year. SwRI initiallydemonstrated the feasibility of this nanoscale,precious-metal technology as part of a DOE-sponsored program on advanced fuel cells fortransportation applications. The electrodes producedby the high-volume process will be assembled withavailable polymer electrolyte membranes (PEMs),
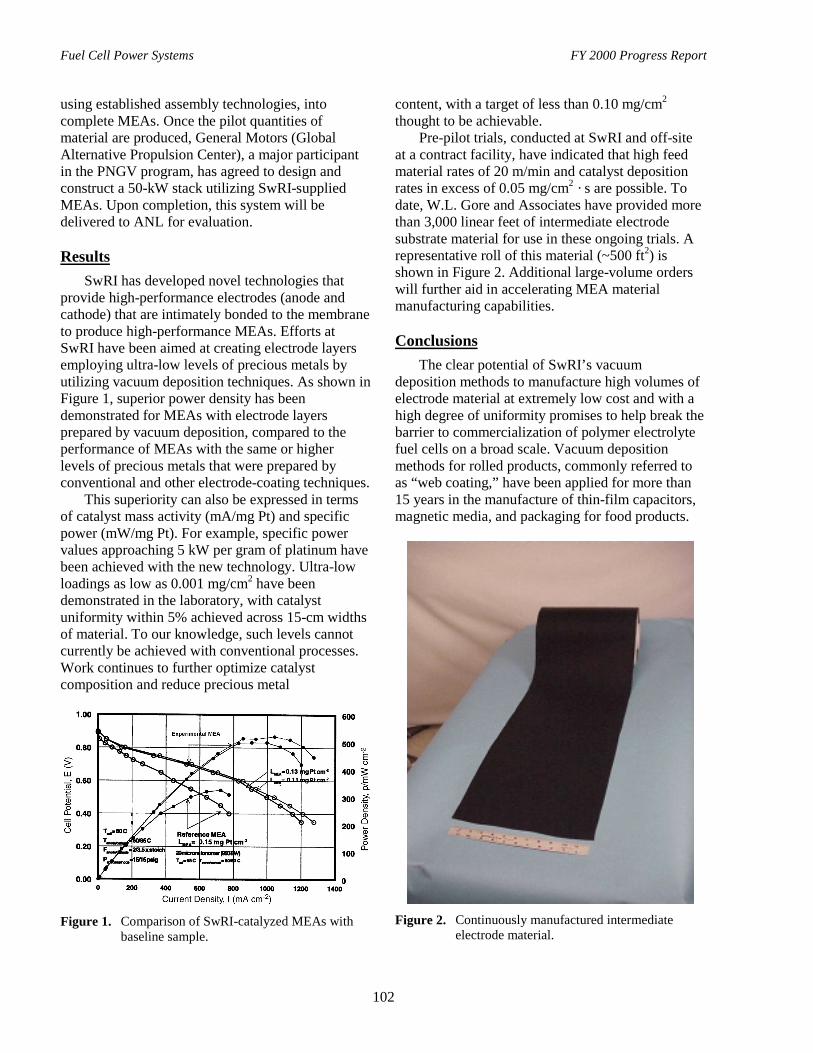
Fuel Cell Power Systems FY 2000 Progress Report
102
using established assembly technologies, intocomplete MEAs. Once the pilot quantities ofmaterial are produced, General Motors (GlobalAlternative Propulsion Center), a major participantin the PNGV program, has agreed to design andconstruct a 50-kW stack utilizing SwRI-suppliedMEAs. Upon completion, this system will bedelivered to ANL for evaluation.
ResultsSwRI has developed novel technologies that
provide high-performance electrodes (anode andcathode) that are intimately bonded to the membraneto produce high-performance MEAs. Efforts atSwRI have been aimed at creating electrode layersemploying ultra-low levels of precious metals byutilizing vacuum deposition techniques. As shown inFigure 1, superior power density has beendemonstrated for MEAs with electrode layersprepared by vacuum deposition, compared to theperformance of MEAs with the same or higherlevels of precious metals that were prepared byconventional and other electrode-coating techniques.
This superiority can also be expressed in termsof catalyst mass activity (mA/mg Pt) and specificpower (mW/mg Pt). For example, specific powervalues approaching 5 kW per gram of platinum havebeen achieved with the new technology. Ultra-lowloadings as low as 0.001 mg/cm2 have beendemonstrated in the laboratory, with catalystuniformity within 5% achieved across 15-cm widthsof material. To our knowledge, such levels cannotcurrently be achieved with conventional processes.Work continues to further optimize catalystcomposition and reduce precious metal
Figure 1. Comparison of SwRI-catalyzed MEAs withbaseline sample.
content, with a target of less than 0.10 mg/cm2
thought to be achievable.Pre-pilot trials, conducted at SwRI and off-site
at a contract facility, have indicated that high feedmaterial rates of 20 m/min and catalyst depositionrates in excess of 0.05 mg/cm2 · s are possible. Todate, W.L. Gore and Associates have provided morethan 3,000 linear feet of intermediate electrodesubstrate material for use in these ongoing trials. Arepresentative roll of this material (~500 ft2) isshown in Figure 2. Additional large-volume orderswill further aid in accelerating MEA materialmanufacturing capabilities.
ConclusionsThe clear potential of SwRI’s vacuum
deposition methods to manufacture high volumes ofelectrode material at extremely low cost and with ahigh degree of uniformity promises to help break thebarrier to commercialization of polymer electrolytefuel cells on a broad scale. Vacuum depositionmethods for rolled products, commonly referred toas “web coating,” have been applied for more than15 years in the manufacture of thin-film capacitors,magnetic media, and packaging for food products.
Figure 2. Continuously manufactured intermediateelectrode material.
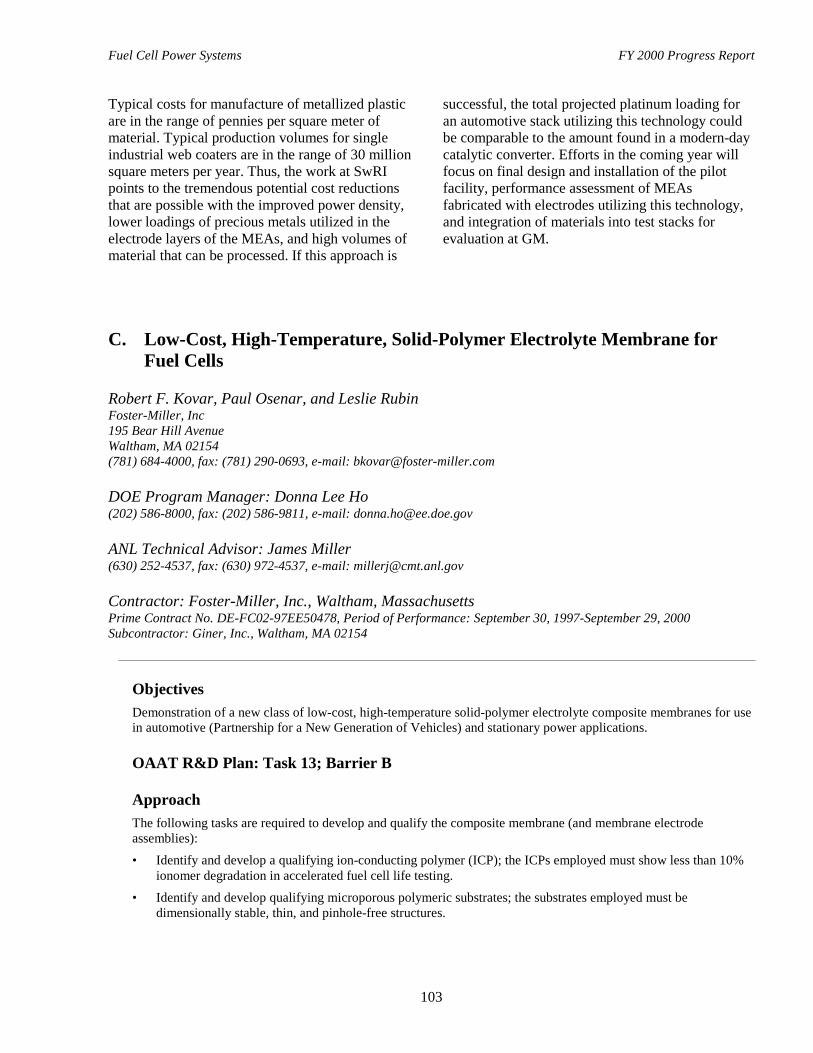
Fuel Cell Power Systems FY 2000 Progress Report
103
Typical costs for manufacture of metallized plasticare in the range of pennies per square meter ofmaterial. Typical production volumes for singleindustrial web coaters are in the range of 30 millionsquare meters per year. Thus, the work at SwRIpoints to the tremendous potential cost reductionsthat are possible with the improved power density,lower loadings of precious metals utilized in theelectrode layers of the MEAs, and high volumes ofmaterial that can be processed. If this approach is
successful, the total projected platinum loading foran automotive stack utilizing this technology couldbe comparable to the amount found in a modern-daycatalytic converter. Efforts in the coming year willfocus on final design and installation of the pilotfacility, performance assessment of MEAsfabricated with electrodes utilizing this technology,and integration of materials into test stacks forevaluation at GM.
C. Low-Cost, High-Temperature, Solid-Polymer Electrolyte Membrane forFuel Cells
Robert F. Kovar, Paul Osenar, and Leslie RubinFoster-Miller, Inc195 Bear Hill AvenueWaltham, MA 02154(781) 684-4000, fax: (781) 290-0693, e-mail: [email protected]
DOE Program Manager: Donna Lee Ho(202) 586-8000, fax: (202) 586-9811, e-mail: [email protected]
ANL Technical Advisor: James Miller(630) 252-4537, fax: (630) 972-4537, e-mail: [email protected]
Contractor: Foster-Miller, Inc., Waltham, MassachusettsPrime Contract No. DE-FC02-97EE50478, Period of Performance: September 30, 1997-September 29, 2000Subcontractor: Giner, Inc., Waltham, MA 02154
ObjectivesDemonstration of a new class of low-cost, high-temperature solid-polymer electrolyte composite membranes for usein automotive (Partnership for a New Generation of Vehicles) and stationary power applications.
OAAT R&D Plan: Task 13; Barrier B
ApproachThe following tasks are required to develop and qualify the composite membrane (and membrane electrodeassemblies):
• Identify and develop a qualifying ion-conducting polymer (ICP); the ICPs employed must show less than 10%ionomer degradation in accelerated fuel cell life testing.
• Identify and develop qualifying microporous polymeric substrates; the substrates employed must bedimensionally stable, thin, and pinhole-free structures.
Fuel CellPower Systems FY 2000 Progress Report
104
• Develop fabrication methods for high-temperature composite membranes (using the selected ICP andsubstrate). The ICP and substrate must be combined to form an interpenetrating network.
• Develop appropriate electrode structure and corresponding attachment methods for fabrication of membraneelectrode assemblies (MEAs).
• Demonstrate MEA via single-cell testing.
Accomplishments• Identified, synthesized, and evaluated several aromatic ICPs:
- Selected most promising system, based on commercially available starting polymers, and completedsynthesis and scale-up studies.
- Identified several ICP systems for advanced development, with the focus on improved stability andlifetime.
• Identified, synthesized, and evaluated selected substrate polymers:
- Selected poly-p-phenylene benzobisoxazole (PBO) as the most promising polymeric substrate material.- Demonstrated fabrication methodology for high-porosity, unoriented substrates for PBO on a batch scale.- Identified fabrication methodology for oriented substrates (for increased strength) with improved porosity.
Feasibility of extruding 6-wt.% PBO was demonstrated at laboratory scale.
• Developed an imbibition/pressing fabrication method for processing the ICP/substrate combination intocomposite membranes with good proton conductivity and barrier properties.
• MEAs are being developed by industry and Los Alamos National Laboratory (LANL) with the investigation ofelectrode structures and corresponding electrode attachment methods.
• Continued single-cell testing of MEAs:
- Demonstrated performance curves similar to those of state-of-the-art perfluorinated membranes.- Began looking at high-temperature performance and long-term stability of composite MEAs operating in a
fuel cell.
Future Directions• Continue development of low-cost, high-temperature aromatic-based ICPs that show long-term fuel cell
stability.• Continue development of improved substrates with microstructure suitable for interpenetrating network
formation:
- Design and build a continuous casting operation to improve substrate quality.- Continue development of oriented (higher-strength) substrates.
• Continue development of electrode application method(s) and evaluation of their structure in conjunction withLANL.
• Continue single-cell fuel cell testing, including analysis of fuel cell performance curves to optimize operatingconditions.
IntroductionThe objective of this work is to develop a low-
cost, high-temperature solid-polymer electrolytemembrane (HTSPEM) for use in fuel cells. Thisadvanced membrane is designed to address thepresent shortcomings of today’s Nafion-based solid-polymer electrolyte fuel cells (SPEFCs). The
HTSPEM will lower fuel cell cost, improve powerdensity, reduce sensitivity to carbon monoxide, andfacilitate thermal water management in the hydrogenfuel stream. The goal of the membrane technology isto provide a clean, efficient, lightweight, and high-density power source that will be useful over a widerange of applications, from next-generation vehiclesto stationary power.
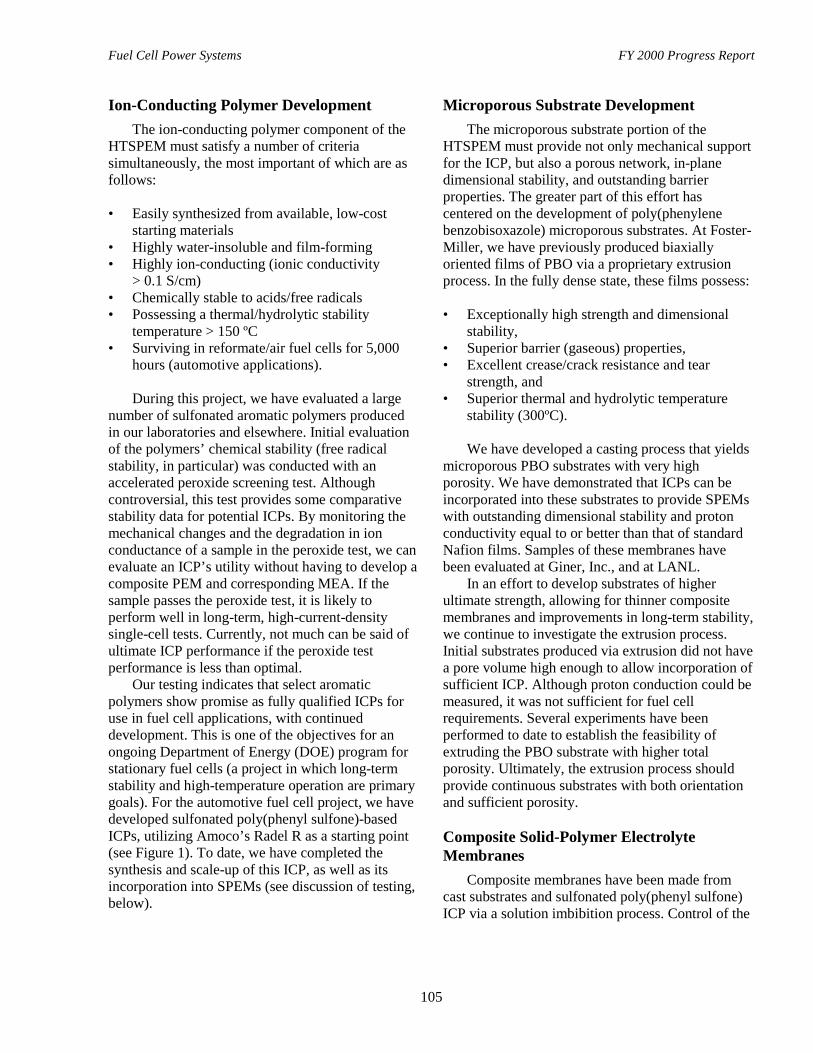
Fuel Cell Power Systems FY 2000 Progress Report
105
Ion-Conducting Polymer DevelopmentThe ion-conducting polymer component of the
HTSPEM must satisfy a number of criteriasimultaneously, the most important of which are asfollows:
• Easily synthesized from available, low-coststarting materials
• Highly water-insoluble and film-forming• Highly ion-conducting (ionic conductivity
> 0.1 S/cm)• Chemically stable to acids/free radicals• Possessing a thermal/hydrolytic stability
temperature > 150 ºC• Surviving in reformate/air fuel cells for 5,000
hours (automotive applications).
During this project, we have evaluated a largenumber of sulfonated aromatic polymers producedin our laboratories and elsewhere. Initial evaluationof the polymers’ chemical stability (free radicalstability, in particular) was conducted with anaccelerated peroxide screening test. Althoughcontroversial, this test provides some comparativestability data for potential ICPs. By monitoring themechanical changes and the degradation in ionconductance of a sample in the peroxide test, we canevaluate an ICP’s utility without having to develop acomposite PEM and corresponding MEA. If thesample passes the peroxide test, it is likely toperform well in long-term, high-current-densitysingle-cell tests. Currently, not much can be said ofultimate ICP performance if the peroxide testperformance is less than optimal.
Our testing indicates that select aromaticpolymers show promise as fully qualified ICPs foruse in fuel cell applications, with continueddevelopment. This is one of the objectives for anongoing Department of Energy (DOE) program forstationary fuel cells (a project in which long-termstability and high-temperature operation are primarygoals). For the automotive fuel cell project, we havedeveloped sulfonated poly(phenyl sulfone)-basedICPs, utilizing Amoco’s Radel R as a starting point(see Figure 1). To date, we have completed thesynthesis and scale-up of this ICP, as well as itsincorporation into SPEMs (see discussion of testing,below).
Microporous Substrate DevelopmentThe microporous substrate portion of the
HTSPEM must provide not only mechanical supportfor the ICP, but also a porous network, in-planedimensional stability, and outstanding barrierproperties. The greater part of this effort hascentered on the development of poly(phenylenebenzobisoxazole) microporous substrates. At Foster-Miller, we have previously produced biaxiallyoriented films of PBO via a proprietary extrusionprocess. In the fully dense state, these films possess:
• Exceptionally high strength and dimensionalstability,
• Superior barrier (gaseous) properties,• Excellent crease/crack resistance and tear
strength, and• Superior thermal and hydrolytic temperature
stability (300ºC).
We have developed a casting process that yieldsmicroporous PBO substrates with very highporosity. We have demonstrated that ICPs can beincorporated into these substrates to provide SPEMswith outstanding dimensional stability and protonconductivity equal to or better than that of standardNafion films. Samples of these membranes havebeen evaluated at Giner, Inc., and at LANL.
In an effort to develop substrates of higherultimate strength, allowing for thinner compositemembranes and improvements in long-term stability,we continue to investigate the extrusion process.Initial substrates produced via extrusion did not havea pore volume high enough to allow incorporation ofsufficient ICP. Although proton conduction could bemeasured, it was not sufficient for fuel cellrequirements. Several experiments have beenperformed to date to establish the feasibility ofextruding the PBO substrate with higher totalporosity. Ultimately, the extrusion process shouldprovide continuous substrates with both orientationand sufficient porosity.
Composite Solid-Polymer ElectrolyteMembranes
Composite membranes have been made fromcast substrates and sulfonated poly(phenyl sulfone)ICP via a solution imbibition process. Control of the
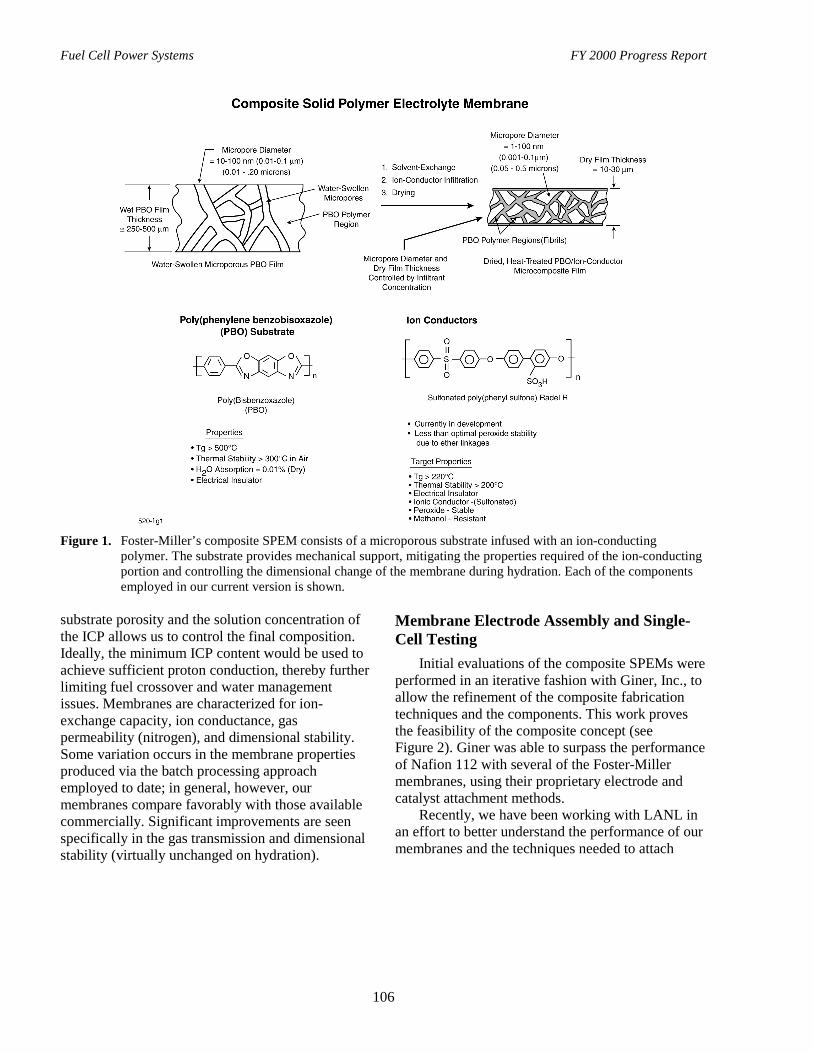
Fuel Cell Power Systems FY 2000 Progress Report
106
Figure 1. Foster-Miller’s composite SPEM consists of a microporous substrate infused with an ion-conductingpolymer. The substrate provides mechanical support, mitigating the properties required of the ion-conductingportion and controlling the dimensional change of the membrane during hydration. Each of the componentsemployed in our current version is shown.
substrate porosity and the solution concentration ofthe ICP allows us to control the final composition.Ideally, the minimum ICP content would be used toachieve sufficient proton conduction, thereby furtherlimiting fuel crossover and water managementissues. Membranes are characterized for ion-exchange capacity, ion conductance, gaspermeability (nitrogen), and dimensional stability.Some variation occurs in the membrane propertiesproduced via the batch processing approachemployed to date; in general, however, ourmembranes compare favorably with those availablecommercially. Significant improvements are seenspecifically in the gas transmission and dimensionalstability (virtually unchanged on hydration).
Membrane Electrode Assembly and Single-Cell Testing
Initial evaluations of the composite SPEMs wereperformed in an iterative fashion with Giner, Inc., toallow the refinement of the composite fabricationtechniques and the components. This work provesthe feasibility of the composite concept (seeFigure 2). Giner was able to surpass the performanceof Nafion 112 with several of the Foster-Millermembranes, using their proprietary electrode andcatalyst attachment methods.
Recently, we have been working with LANL inan effort to better understand the performance of ourmembranes and the techniques needed to attach
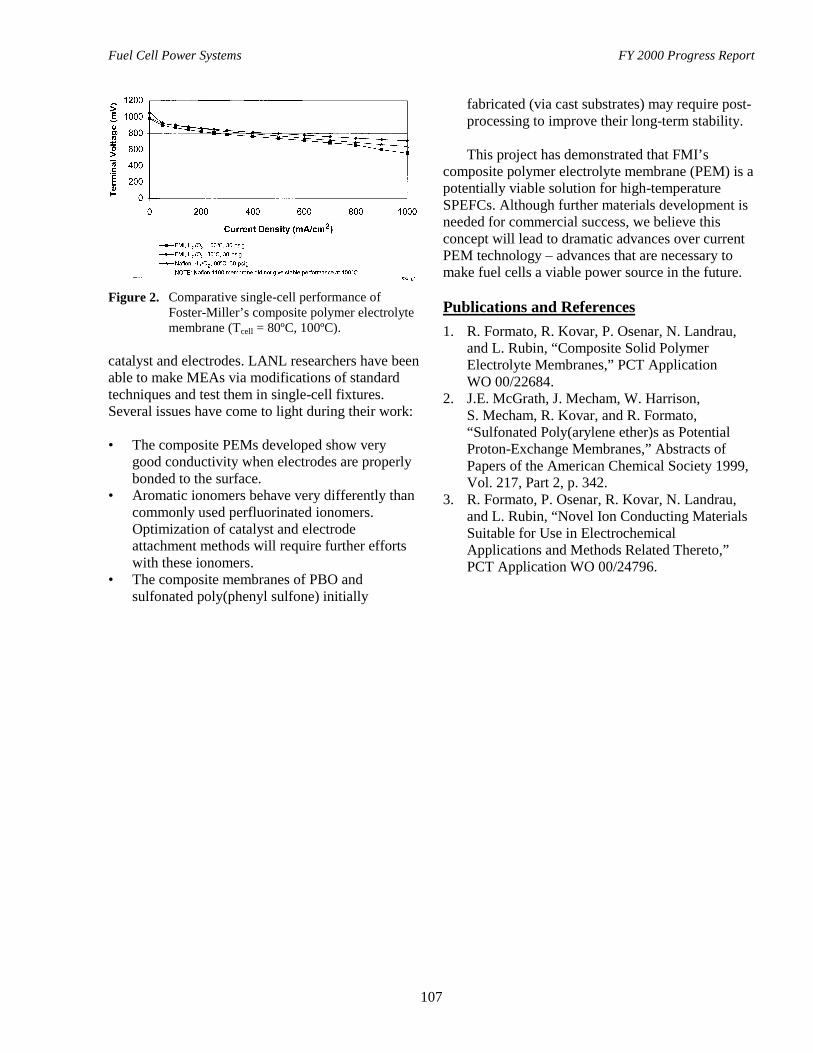
Fuel Cell Power Systems FY 2000 Progress Report
107
Figure 2. Comparative single-cell performance ofFoster-Miller’s composite polymer electrolytemembrane (Tcell = 80ºC, 100ºC).
catalyst and electrodes. LANL researchers have beenable to make MEAs via modifications of standardtechniques and test them in single-cell fixtures.Several issues have come to light during their work:
• The composite PEMs developed show verygood conductivity when electrodes are properlybonded to the surface.
• Aromatic ionomers behave very differently thancommonly used perfluorinated ionomers.Optimization of catalyst and electrodeattachment methods will require further effortswith these ionomers.
• The composite membranes of PBO andsulfonated poly(phenyl sulfone) initially
fabricated (via cast substrates) may require post-processing to improve their long-term stability.
This project has demonstrated that FMI’scomposite polymer electrolyte membrane (PEM) is apotentially viable solution for high-temperatureSPEFCs. Although further materials development isneeded for commercial success, we believe thisconcept will lead to dramatic advances over currentPEM technology – advances that are necessary tomake fuel cells a viable power source in the future.
Publications and References1. R. Formato, R. Kovar, P. Osenar, N. Landrau,
and L. Rubin, “Composite Solid PolymerElectrolyte Membranes,” PCT ApplicationWO 00/22684.
2. J.E. McGrath, J. Mecham, W. Harrison,S. Mecham, R. Kovar, and R. Formato,“Sulfonated Poly(arylene ether)s as PotentialProton-Exchange Membranes,” Abstracts ofPapers of the American Chemical Society 1999,Vol. 217, Part 2, p. 342.
3. R. Formato, P. Osenar, R. Kovar, N. Landrau,and L. Rubin, “Novel Ion Conducting MaterialsSuitable for Use in ElectrochemicalApplications and Methods Related Thereto,”PCT Application WO 00/24796.
Fuel Cell Power Systems FY 2000 Progress Report
108
D. Development and Optimization of Porous Carbon Papers Suitable for GasDiffusion Electrodes
Gerald J. Fleming, Principal InvestigatorSpectracorp Ltd.599 Canal St.Lawrence, MA 01840(978) 682-1232, fax: (978) 682-3253, e-mail: [email protected]
DOE Program Manager: Donna Lee Ho(202) 586-2480, fax: (202) 586-9811, e-mail: [email protected]
DOE Program Support: Larry Blair(202) 586-0626, fax: (202) 586-9811, e-mail: [email protected]
ANL Technical Advisor: James Miller(630) 252-4537, fax: (630) 252-4176, e-mail: [email protected]
Contractor: Spectracorp Ltd., Lawrence, MassachusettsPrime Contract No. DE-FC02-97EE50474, September 1997-July 2000Subcontractors: PSI, Andover, MA; Energy Partners, West Palm Beach, FL; and HPower, Clifton, NJ
Objectives• Reduce cost of polymer electrolyte membrane (PEM) fuel cell stack by optimizing (through cost reduction
and/or improved performance) carbonaceous gas diffusion electrode (GDE).
• Perform manufacturing feasibility analysis on optimized GDE, exploring both optimized batch processing andcontinuous processing to reduce costs.
• Manufacture small run of optimized GDEs on production equipment and distribute to Department of Energy(DOE) partners for commercial evaluation.
OAAT R&D Plan: Task 13; Barrier B
Approach• Design and manufacture a matrix of carbonaceous GDEs, utilizing varying compositions and manufacturing
techniques (more than 30 variants, including thickness, density, fiber type and length, pore size and distribution,electrical conductivity).
• Test GDE variants in fuel cells to establish performance with respect to industry standard materials.
• Using fuel cell test results, perform manufacturing cost/benefit analysis to determine optimal GDE material.
• On the basis of cost/benefit analysis, manufacture a small production run of optimized GDEs.
Accomplishments• GDE matrix was designed and all variants of the GDE were manufactured and tested for physical and electrical
properties, as well as pore size, pore size distributions, and gas flow. These properties were then correlated(e.g., air flow vs. density, resin content, thickness, and pore size).
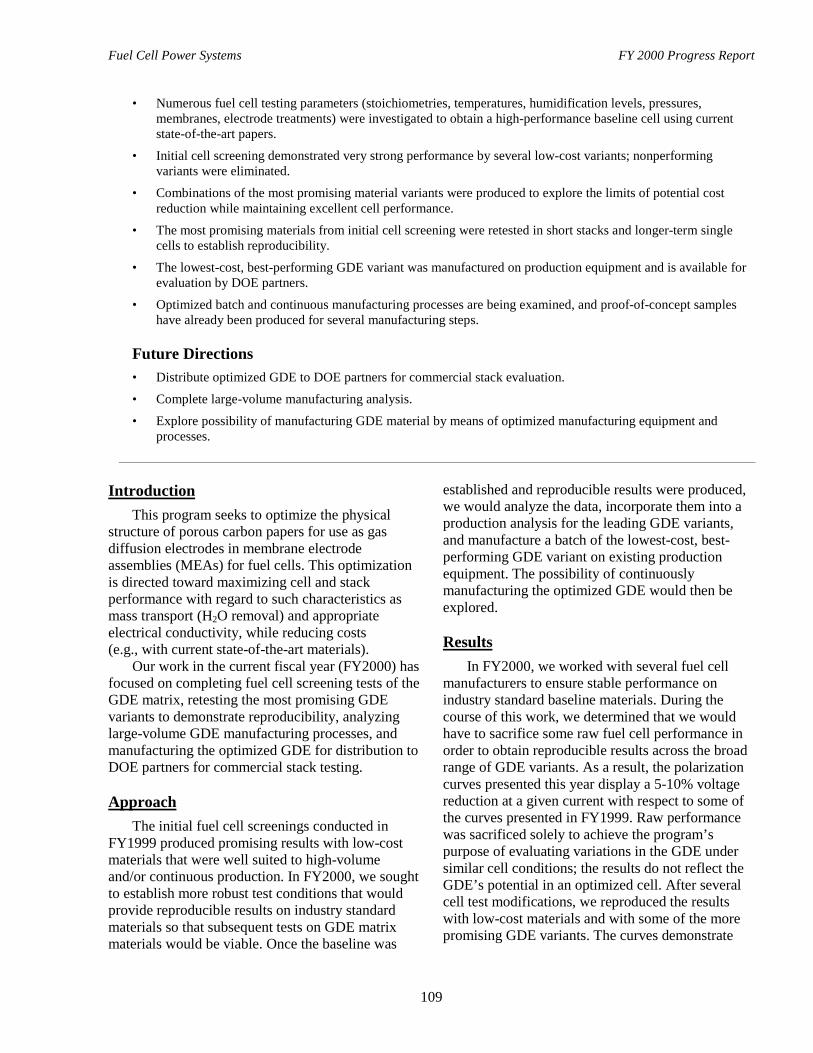
Fuel Cell Power Systems FY 2000 Progress Report
109
• Numerous fuel cell testing parameters (stoichiometries, temperatures, humidification levels, pressures,membranes, electrode treatments) were investigated to obtain a high-performance baseline cell using currentstate-of-the-art papers.
• Initial cell screening demonstrated very strong performance by several low-cost variants; nonperformingvariants were eliminated.
• Combinations of the most promising material variants were produced to explore the limits of potential costreduction while maintaining excellent cell performance.
• The most promising materials from initial cell screening were retested in short stacks and longer-term singlecells to establish reproducibility.
• The lowest-cost, best-performing GDE variant was manufactured on production equipment and is available forevaluation by DOE partners.
• Optimized batch and continuous manufacturing processes are being examined, and proof-of-concept sampleshave already been produced for several manufacturing steps.
Future Directions• Distribute optimized GDE to DOE partners for commercial stack evaluation.
• Complete large-volume manufacturing analysis.
• Explore possibility of manufacturing GDE material by means of optimized manufacturing equipment andprocesses.
IntroductionThis program seeks to optimize the physical
structure of porous carbon papers for use as gasdiffusion electrodes in membrane electrodeassemblies (MEAs) for fuel cells. This optimizationis directed toward maximizing cell and stackperformance with regard to such characteristics asmass transport (H2O removal) and appropriateelectrical conductivity, while reducing costs(e.g., with current state-of-the-art materials).
Our work in the current fiscal year (FY2000) hasfocused on completing fuel cell screening tests of theGDE matrix, retesting the most promising GDEvariants to demonstrate reproducibility, analyzinglarge-volume GDE manufacturing processes, andmanufacturing the optimized GDE for distribution toDOE partners for commercial stack testing.
ApproachThe initial fuel cell screenings conducted in
FY1999 produced promising results with low-costmaterials that were well suited to high-volumeand/or continuous production. In FY2000, we soughtto establish more robust test conditions that wouldprovide reproducible results on industry standardmaterials so that subsequent tests on GDE matrixmaterials would be viable. Once the baseline was
established and reproducible results were produced,we would analyze the data, incorporate them into aproduction analysis for the leading GDE variants,and manufacture a batch of the lowest-cost, best-performing GDE variant on existing productionequipment. The possibility of continuouslymanufacturing the optimized GDE would then beexplored.
ResultsIn FY2000, we worked with several fuel cell
manufacturers to ensure stable performance onindustry standard baseline materials. During thecourse of this work, we determined that we wouldhave to sacrifice some raw fuel cell performance inorder to obtain reproducible results across the broadrange of GDE variants. As a result, the polarizationcurves presented this year display a 5-10% voltagereduction at a given current with respect to some ofthe curves presented in FY1999. Raw performancewas sacrificed solely to achieve the program’spurpose of evaluating variations in the GDE undersimilar cell conditions; the results do not reflect theGDE’s potential in an optimized cell. After severalcell test modifications, we reproduced the resultswith low-cost materials and with some of the morepromising GDE variants. The curves demonstrate
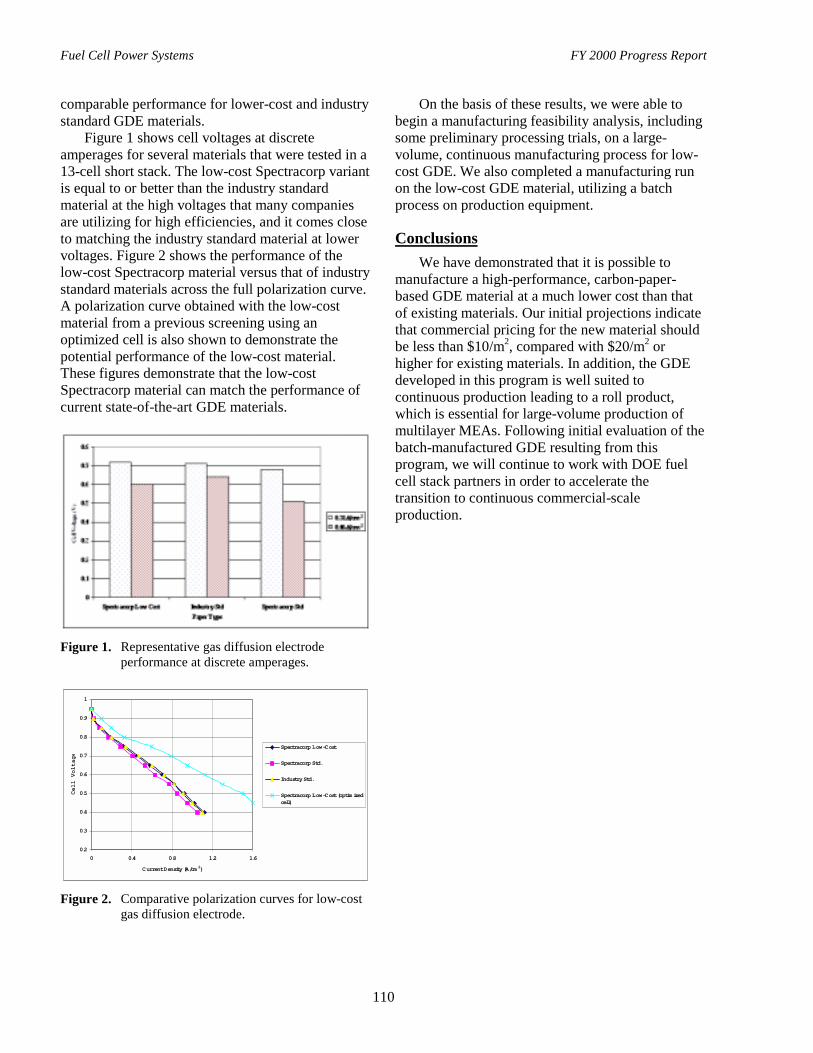
Fuel Cell Power Systems FY 2000 Progress Report
110
comparable performance for lower-cost and industrystandard GDE materials.
Figure 1 shows cell voltages at discreteamperages for several materials that were tested in a13-cell short stack. The low-cost Spectracorp variantis equal to or better than the industry standardmaterial at the high voltages that many companiesare utilizing for high efficiencies, and it comes closeto matching the industry standard material at lowervoltages. Figure 2 shows the performance of thelow-cost Spectracorp material versus that of industrystandard materials across the full polarization curve.A polarization curve obtained with the low-costmaterial from a previous screening using anoptimized cell is also shown to demonstrate thepotential performance of the low-cost material.These figures demonstrate that the low-costSpectracorp material can match the performance ofcurrent state-of-the-art GDE materials.
Figure 1. Representative gas diffusion electrodeperformance at discrete amperages.
0.2
0.3
0.4
0.5
0.6
0.7
0.8
0.9
1
0 0.4 0.8 1.2 1.6
Current Density (A/cm 2)
Cell Voltage
Spectracorp Low-Cost
Spectracorp Std.
Industry Std.
Spectracorp Low-Cost (optim izedcell)
Figure 2. Comparative polarization curves for low-costgas diffusion electrode.
On the basis of these results, we were able tobegin a manufacturing feasibility analysis, includingsome preliminary processing trials, on a large-volume, continuous manufacturing process for low-cost GDE. We also completed a manufacturing runon the low-cost GDE material, utilizing a batchprocess on production equipment.
ConclusionsWe have demonstrated that it is possible to
manufacture a high-performance, carbon-paper-based GDE material at a much lower cost than thatof existing materials. Our initial projections indicatethat commercial pricing for the new material shouldbe less than $10/m2, compared with $20/m2 orhigher for existing materials. In addition, the GDEdeveloped in this program is well suited tocontinuous production leading to a roll product,which is essential for large-volume production ofmultilayer MEAs. Following initial evaluation of thebatch-manufactured GDE resulting from thisprogram, we will continue to work with DOE fuelcell stack partners in order to accelerate thetransition to continuous commercial-scaleproduction.

Fuel Cell Power Systems FY 2000 Progress Report
111
E. Electrodes for PEM Operation on Reformate/Air
Thomas A. Zawodzinski (primary contact), Francisco Uribe, Jayson Bauman, Tommy Rockward,Paul Mombourquette, Markus Vogt, Thomas Springer, Judith Valerio, David Verson, andShimshon GottesfeldLos Alamos National LaboratoryElectronic and Electrochemical Materials and Device Research GroupLos Alamos, New Mexico 87545(505) 667-0925; fax: (505) 665-4292; e-mail: [email protected]
DOE Program Manager: JoAnn Milliken(202) 586-2480, fax: (202) 586-9811, e-mail: [email protected]
ObjectivesTo achieve maximum performance in polymer electrolyte fuel cells (PEFCs) under conditions appropriate forreformate/air operation and with methods that allow cost and efficiency targets to be met for transportation.
OAAT R&D Plan: Task 13; Barrier A
ApproachWe seek to develop an understanding of electrocatalysis and transport issues related to cathode performance and touse this understanding to guide the development, testing, and demonstration of improved electrodes. To approachrequirements for anode performance, we test single cells under conditions of steady-state and transient exposure tovarious levels of CO, focusing especially on conditions appropriate for off-design conditions of the fuel processor(such as during system start-up). This latter work exploits the ever-increasing levels of CO tolerance achieved.Through applied R&D, we seek to achieve the following cell characteristics simultaneously:
• Highest possible performance at 0.8 V.
• Minimal air injection for CO cleanup.
• Minimal catalyst loading.
• Minimal losses due to dilution at high fuel utilization.
Accomplishments• Cathode Performance: The cell performance at 0.8 V was studied. Improvements, relative to performance
obtained at steady state in cells using Pt, were obtained with different alloy catalysts and using low-duty-cyclepulsing of the cell voltage to lower voltages.- Demonstrated stable operation of cell yielding 0.4 A/cm2 @ 0.8 V (on H2).- Dependence of performance on catalyst loading indicates utilization problem.- Implementing studies of radically different electrode structures.- Completed studies of a series of alloy catalysts, including stability assessment.
• CO Tolerance: Achieved reduction in both precious-metal loading (to 0.1 mg/cm2) and in air bleed (none for100 ppm) since last review (different cells).
- New, reconfigured membrane electrode assembly (MEA) allows us to tolerate 100 ppm in reformate withonly 0.1 mg/cm2 of catalyst (with air bleed).
- New catalysts with reconfigured anode allow full tolerance to 500 ppm in reformate with <5% air bleed,using 0.3 mg/cm2 anode catalyst (tested for 100 hours), and improved transient behavior for system start-upconditions; 50 ppm in reformate, sometimes higher, was tolerated without air bleeding.
- Completed combined poisoning/dilution model.
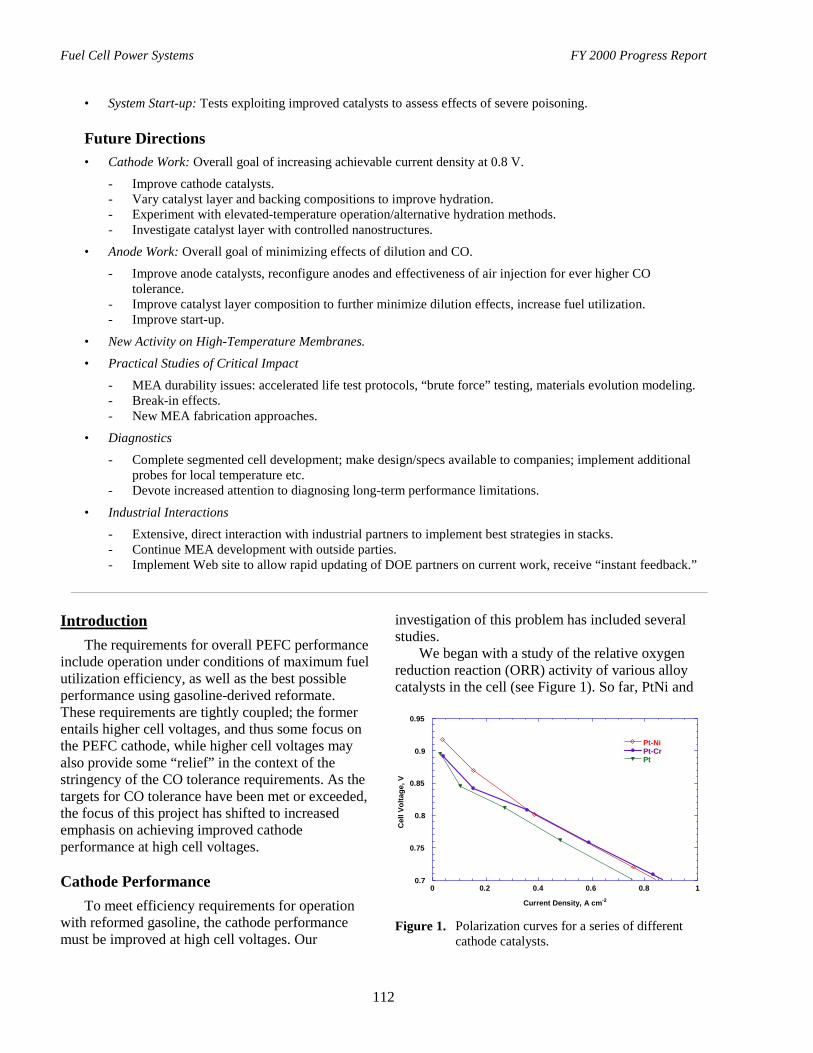
Fuel Cell Power Systems FY 2000 Progress Report
112
• System Start-up: Tests exploiting improved catalysts to assess effects of severe poisoning.
Future Directions• Cathode Work: Overall goal of increasing achievable current density at 0.8 V.
- Improve cathode catalysts.- Vary catalyst layer and backing compositions to improve hydration.- Experiment with elevated-temperature operation/alternative hydration methods.- Investigate catalyst layer with controlled nanostructures.
• Anode Work: Overall goal of minimizing effects of dilution and CO.
- Improve anode catalysts, reconfigure anodes and effectiveness of air injection for ever higher COtolerance.
- Improve catalyst layer composition to further minimize dilution effects, increase fuel utilization.- Improve start-up.
• New Activity on High-Temperature Membranes.• Practical Studies of Critical Impact
- MEA durability issues: accelerated life test protocols, “brute force” testing, materials evolution modeling.- Break-in effects.- New MEA fabrication approaches.
• Diagnostics- Complete segmented cell development; make design/specs available to companies; implement additional
probes for local temperature etc.- Devote increased attention to diagnosing long-term performance limitations.
• Industrial Interactions- Extensive, direct interaction with industrial partners to implement best strategies in stacks.- Continue MEA development with outside parties.- Implement Web site to allow rapid updating of DOE partners on current work, receive “instant feedback.”
IntroductionThe requirements for overall PEFC performance
include operation under conditions of maximum fuelutilization efficiency, as well as the best possibleperformance using gasoline-derived reformate.These requirements are tightly coupled; the formerentails higher cell voltages, and thus some focus onthe PEFC cathode, while higher cell voltages mayalso provide some “relief” in the context of thestringency of the CO tolerance requirements. As thetargets for CO tolerance have been met or exceeded,the focus of this project has shifted to increasedemphasis on achieving improved cathodeperformance at high cell voltages.
Cathode PerformanceTo meet efficiency requirements for operation
with reformed gasoline, the cathode performancemust be improved at high cell voltages. Our
investigation of this problem has included severalstudies.
We began with a study of the relative oxygenreduction reaction (ORR) activity of various alloycatalysts in the cell (see Figure 1). So far, PtNi and
0.7
0.75
0.8
0.85
0.9
0.95
0 0.2 0.4 0.6 0.8 1
Pt-NiPt-CrPt
Cel
l Vol
tage
, V
Current Density, A cm-2
Figure 1. Polarization curves for a series of differentcathode catalysts.

Fuel Cell Power Systems FY 2000 Progress Report
113
PtCr cathode catalysts have been the most active.We were able to achieve our target of 0.4 A/cm2 @0.8 V on hydrogen. These experiments were carriedout in 5-cm2 cells. Scaling up such results is oftendifficult. We employed the highly active PtCr alloycatalyst in 50-cm2 cells; Figure 2 shows a typicalpolarization curve obtained with such a cell.
Operation at high cell voltages necessarilyimplies operating with little water production at thecathode. We had previously shown that dryconditions lead to poorer ORR kinetics. Figure 3shows the decline in steady-state current with timeafter changing the cell voltage from 0.6 to 0.8 V. Wetried to overcome this problem by “pulsing” the cellto lower voltages, thus generating more water. Theresults of such an operation mode, with a 1% dutycycle at the lower cell voltage, are also shown inFigure 3. Clearly, the application of such a pulseprovided improved steady-state performance. Thenature of the improvement is under investigation.Our ability to achieve 100 hours of stable celloperation with neat H2 at 0.8 V, 0.4 A/cm2 at 80oCmeets the target for our fiscal year (FY) 2000 (June)milestone. By September of FY 2000, we seek toextend that targeted operation to a cell employingreformate feed to the anode.
Further work was carried out to assess, on amore fundamental level, the utilization of thecathode catalyst. The key finding of this work wasthat, given our catalyst layer preparation method,there appears to be a limit to how much catalyst isactually accessed; our current estimate is that thisamount is less than 40%.
0.4
0.5
0.6
0.7
0.8
0.9
1
0 0.2 0.4 0.6 0.8 1
Cel
l Cur
rent
, A c
m-2
Cell Voltage, V
Figure 2. Polarization curve for a 50-cm2 cell, using aPtCr alloy catalyst on the cathode.
0
100
200
300
400
500
0 20 40 60 80 100
Curr
ent,
mA
cm-2
Time, hours
Figure 3. Bottom curve: response of the cell with timeafter changing the cell voltage from 0.6 to0.8 V; top curve: effect of pulsing the cellvoltage between 0.8 V (99% of the time) and alower voltage (1%).
CO ToleranceIn Figure 4, we show results from a 500-hour
life test of a 50-cm2 cell, demonstrating tolerance to100 ppm CO in simulated reformate (meeting ourFebruary 2000 milestone). We also met ourJuly 2000 goal of 100 hours of stable performance at500 ppm CO in reformate with an advanced PtRucatalyst.
We continued to progress toward thesimultaneous goals of enhanced CO tolerance withminimal air injection and catalyst loading. Weshowed that certain new catalysts allowed us toapproach a high level of tolerance to 500 ppm CO(see Figure 5). In short-term tests, we cansimultaneously lower the catalyst loading to0.1 mg/cm2 and achieve complete tolerance to100 ppm CO with <4% air bleed.
In another set of tests, we have continued ourwork on the effects of transient excursions in COlevels, which are typical of nonsteady-state reformeroperation. Perhaps the most technologicallysignificant result is our finding that injection of aircan dramatically improve the recovery from largeexcursions in CO level. Recovery under suchconditions was sluggish without air injection.
We capitalized on the high level of CO toleranceto begin simulating start-up conditions. As shown inFigure 6, even small amounts of air injection canyield tolerance to high levels of CO. Without air
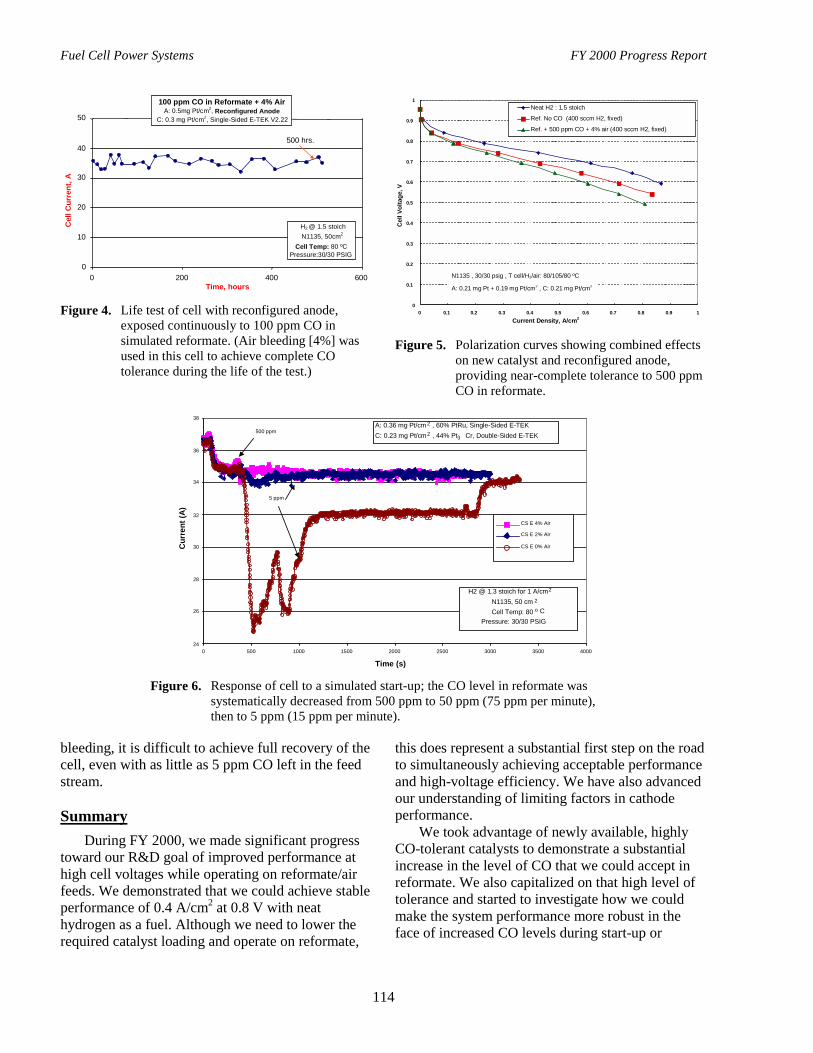
Fuel Cell Power Systems FY 2000 Progress Report
114
100 ppm CO in Reformate + 4% AirA: 0.5mg Pt/cm2, Reconfigured Anode
C: 0.3 mg Pt/cm2, Single-Sided E-TEK V2.22
0
10
20
30
40
50
0 200 400 600Time, hours
Cel
l Cur
rent
, A
H2 @ 1.5 stoichN1135, 50cm2
Cell Temp: 80 ºCPressure:30/30 PSIG
500 hrs.
Figure 4. Life test of cell with reconfigured anode,exposed continuously to 100 ppm CO insimulated reformate. (Air bleeding [4%] wasused in this cell to achieve complete COtolerance during the life of the test.)
0
0.1
0.2
0.3
0.4
0.5
0.6
0.7
0.8
0.9
1
0 0.1 0.2 0.3 0.4 0.5 0.6 0.7 0.8 0.9 1Current Density, A/cm2
Cel
l Vol
tage
, V
Neat H2 : 1.5 stoich
Ref. No CO (400 sccm H2, fixed)
Ref. + 500 ppm CO + 4% air (400 sccm H2, fixed)
N1135 , 30/30 psig , T cell/H2/air: 80/105/80 ºC
A: 0.21 mg Pt + 0.19 mg Pt/cm2 , C: 0.21 mg Pt/cm2
Figure 5. Polarization curves showing combined effectson new catalyst and reconfigured anode,providing near-complete tolerance to 500 ppmCO in reformate.
24
26
28
30
32
34
36
38
0 500 1000 1500 2000 2500 3000 3500 4000
Time (s)
Cur
rent
(A)
CS E 4% Air
CS E 2% Air
CS E 0% Air
500 ppm
5 ppm
A: 0.36 mg Pt/cm 2 , 60% PtRu, Single-Sided E-TEKC: 0.23 mg Pt/cm2 , 44% Pt3 Cr, Double-Sided E-TEK
H2 @ 1.3 stoich for 1 A/cm2
N1135, 50 cm 2
Cell Temp: 80 o CPressure: 30/30 PSIG
Figure 6. Response of cell to a simulated start-up; the CO level in reformate wassystematically decreased from 500 ppm to 50 ppm (75 ppm per minute),then to 5 ppm (15 ppm per minute).
bleeding, it is difficult to achieve full recovery of thecell, even with as little as 5 ppm CO left in the feedstream.
SummaryDuring FY 2000, we made significant progress
toward our R&D goal of improved performance athigh cell voltages while operating on reformate/airfeeds. We demonstrated that we could achieve stableperformance of 0.4 A/cm2 at 0.8 V with neathydrogen as a fuel. Although we need to lower therequired catalyst loading and operate on reformate,
this does represent a substantial first step on the roadto simultaneously achieving acceptable performanceand high-voltage efficiency. We have also advancedour understanding of limiting factors in cathodeperformance.
We took advantage of newly available, highlyCO-tolerant catalysts to demonstrate a substantialincrease in the level of CO that we could accept inreformate. We also capitalized on that high level oftolerance and started to investigate how we couldmake the system performance more robust in theface of increased CO levels during start-up or

Fuel Cell Power Systems FY 2000 Progress Report
115
transient phases of operation. Also, we furtheradvanced fundamental understanding of the anodeperformance by completing and submitting forpublication a paper describing combinedexperimental and modeling studies of the anode.
Finally, we are adopting a more proactiveapproach to interacting with industry anduniversities to transfer technology from this programas efficiently as possible.
F. New Electrocatalysts for Fuel Cells
P.N. Ross, N.M. Markovic, T.J. Schmidt, and V. StamenkovicMaterials Sciences Division, Lawrence Berkeley National LaboratoryUniversity of California, Berkeley, CA 94720(510) 486-6226, fax: (510) 486-5530, e-mail: [email protected]
DOE Program Manager: JoAnn Milliken(202) 586-2480, fax: (202) 586-9811, e-mail: [email protected]
ObjectivesUnderstand the kinetics and mechanism of electrode reactions in low-temperature fuel cells. Develop newelectrocatalysts, using materials-by-design approach.
OAAT R&D Plan: Task 13; Barrier A
Approach• Study the kinetics of fuel cell electrode reactions on well-characterized model electrodes and high-surface-area
fuel cell electrocatalysts, using modern electroanalytical methods.
• Study the mechanisms of the reactions, using state-of-the art in-situ spectroscopes.
• Use ultra-high vacuum (UHV) methods of surface preparation and surface analyses to form tailored surfaces.Synthesize nanoclusters to have the tailored surface.
• Characterize the microstructure of the nanoclusters by high-resolution electron microscopy.
• Transfer technology to catalyst developers/vendors.
Accomplishments• Development of Pd-based (Pd-Au) CO-tolerant anode electrocatalysts that are three times more active for
electrooxidation of CO/H2 mixtures than is Pt-Ru.
• Elucidation of the reaction mechanism for the “cleansing” of CO adsorbed on Pt and platinum-based alloysurfaces by air bleeding.
• Establishment of the oxygen reduction activity/stability on Pt3Ni and Pt3Co bulk alloys and high-surface-areacatalysts.
Future DirectionsAnode side:• Determine the optimal surface composition of Pd-Au catalysts for CO tolerance.
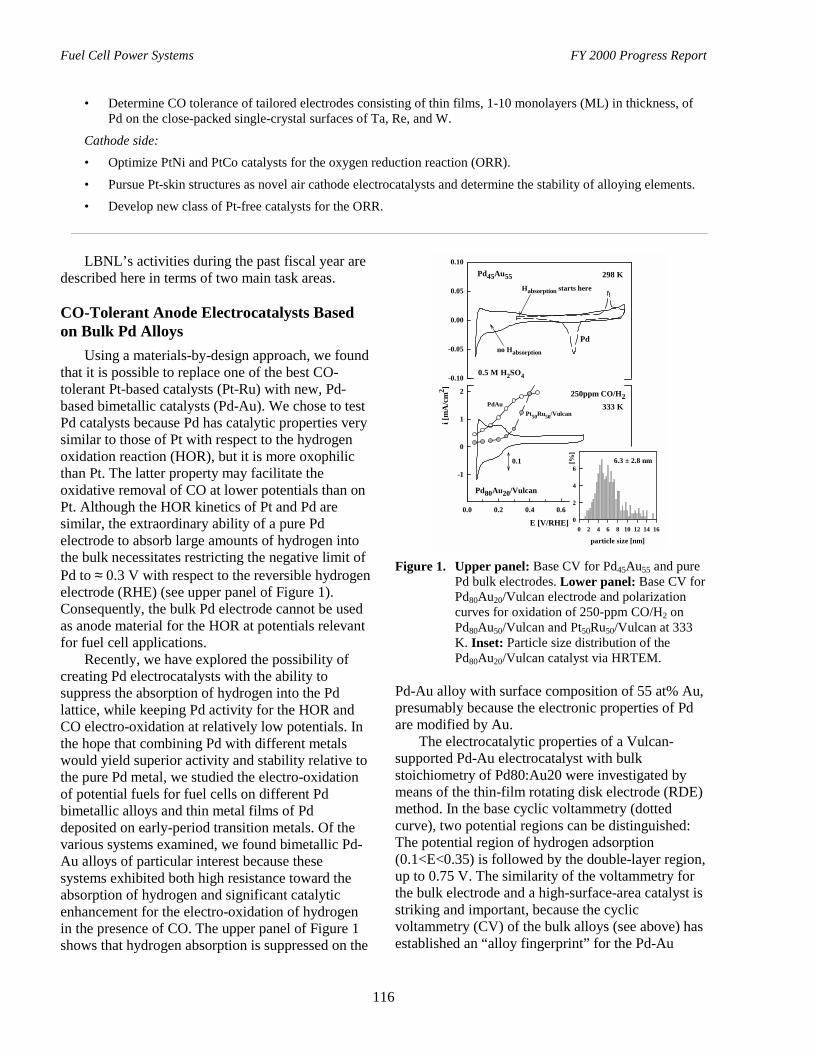
Fuel Cell Power Systems FY 2000 Progress Report
116
• Determine CO tolerance of tailored electrodes consisting of thin films, 1-10 monolayers (ML) in thickness, ofPd on the close-packed single-crystal surfaces of Ta, Re, and W.
Cathode side:• Optimize PtNi and PtCo catalysts for the oxygen reduction reaction (ORR).
• Pursue Pt-skin structures as novel air cathode electrocatalysts and determine the stability of alloying elements.
• Develop new class of Pt-free catalysts for the ORR.
LBNL’s activities during the past fiscal year aredescribed here in terms of two main task areas.
CO-Tolerant Anode Electrocatalysts Basedon Bulk Pd Alloys
Using a materials-by-design approach, we foundthat it is possible to replace one of the best CO-tolerant Pt-based catalysts (Pt-Ru) with new, Pd-based bimetallic catalysts (Pd-Au). We chose to testPd catalysts because Pd has catalytic properties verysimilar to those of Pt with respect to the hydrogenoxidation reaction (HOR), but it is more oxophilicthan Pt. The latter property may facilitate theoxidative removal of CO at lower potentials than onPt. Although the HOR kinetics of Pt and Pd aresimilar, the extraordinary ability of a pure Pdelectrode to absorb large amounts of hydrogen intothe bulk necessitates restricting the negative limit ofPd to ≈ 0.3 V with respect to the reversible hydrogenelectrode (RHE) (see upper panel of Figure 1).Consequently, the bulk Pd electrode cannot be usedas anode material for the HOR at potentials relevantfor fuel cell applications.
Recently, we have explored the possibility ofcreating Pd electrocatalysts with the ability tosuppress the absorption of hydrogen into the Pdlattice, while keeping Pd activity for the HOR andCO electro-oxidation at relatively low potentials. Inthe hope that combining Pd with different metalswould yield superior activity and stability relative tothe pure Pd metal, we studied the electro-oxidationof potential fuels for fuel cells on different Pdbimetallic alloys and thin metal films of Pddeposited on early-period transition metals. Of thevarious systems examined, we found bimetallic Pd-Au alloys of particular interest because thesesystems exhibited both high resistance toward theabsorption of hydrogen and significant catalyticenhancement for the electro-oxidation of hydrogenin the presence of CO. The upper panel of Figure 1shows that hydrogen absorption is suppressed on the
E [V/RHE]0.0 0.2 0.4 0.6 0.8 1.0
i [m
A/c
m2 ]
-1
0
1
2
-0.10
-0.05
0.00
0.05
0.10Pd45Au55
Pd80Au20/Vulcan
250ppm CO/H2
Pt50Ru50/Vulcan
Pd
333 K
0.5 M H2SO4
298 K
no Habsorption
Habsorption starts here
particle size [nm]0 2 4 6 8 10 12 14 16
[%]
0
2
4
66.3 ± 2.8 nm0.1
PdAu
Figure 1. Upper panel: Base CV for Pd45Au55 and purePd bulk electrodes. Lower panel: Base CV forPd80Au20/Vulcan electrode and polarizationcurves for oxidation of 250-ppm CO/H2 onPd80Au50/Vulcan and Pt50Ru50/Vulcan at 333K. Inset: Particle size distribution of thePd80Au20/Vulcan catalyst via HRTEM.
Pd-Au alloy with surface composition of 55 at% Au,presumably because the electronic properties of Pdare modified by Au.
The electrocatalytic properties of a Vulcan-supported Pd-Au electrocatalyst with bulkstoichiometry of Pd80:Au20 were investigated bymeans of the thin-film rotating disk electrode (RDE)method. In the base cyclic voltammetry (dottedcurve), two potential regions can be distinguished:The potential region of hydrogen adsorption(0.1<E<0.35) is followed by the double-layer region,up to 0.75 V. The similarity of the voltammetry forthe bulk electrode and a high-surface-area catalyst isstriking and important, because the cyclicvoltammetry (CV) of the bulk alloys (see above) hasestablished an “alloy fingerprint” for the Pd-Au
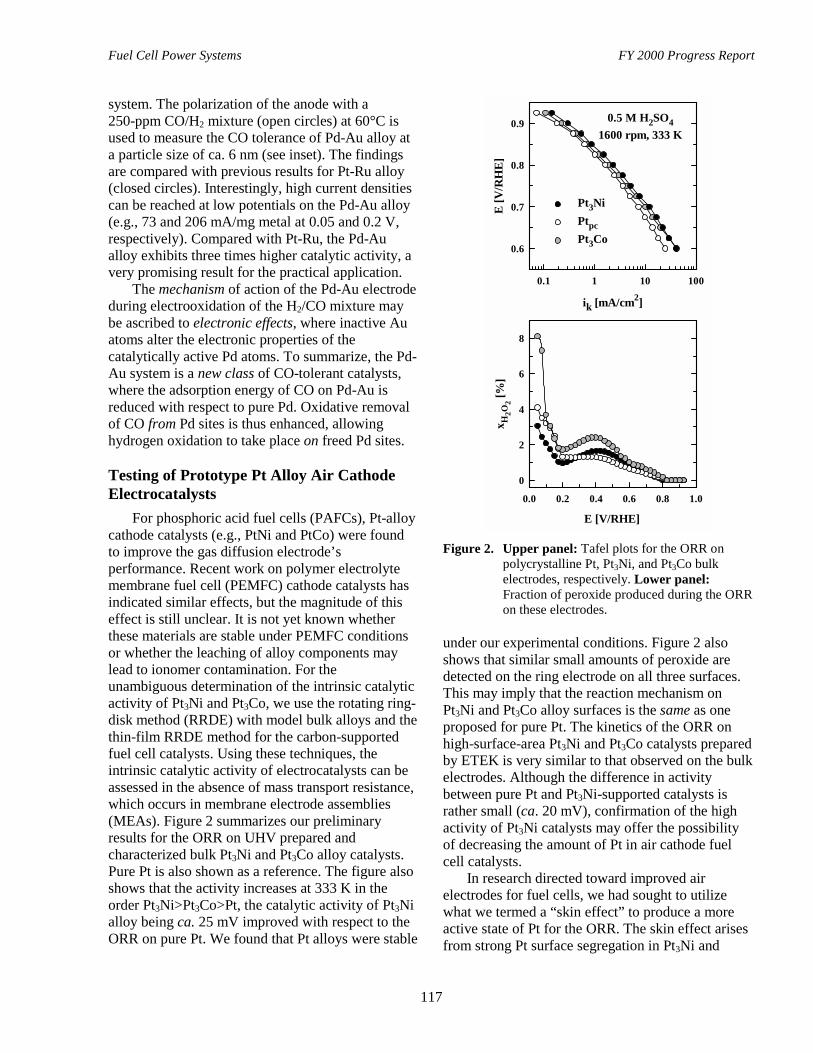
Fuel Cell Power Systems FY 2000 Progress Report
117
system. The polarization of the anode with a250-ppm CO/H2 mixture (open circles) at 60°C isused to measure the CO tolerance of Pd-Au alloy ata particle size of ca. 6 nm (see inset). The findingsare compared with previous results for Pt-Ru alloy(closed circles). Interestingly, high current densitiescan be reached at low potentials on the Pd-Au alloy(e.g., 73 and 206 mA/mg metal at 0.05 and 0.2 V,respectively). Compared with Pt-Ru, the Pd-Aualloy exhibits three times higher catalytic activity, avery promising result for the practical application.
The mechanism of action of the Pd-Au electrodeduring electrooxidation of the H2/CO mixture maybe ascribed to electronic effects, where inactive Auatoms alter the electronic properties of thecatalytically active Pd atoms. To summarize, the Pd-Au system is a new class of CO-tolerant catalysts,where the adsorption energy of CO on Pd-Au isreduced with respect to pure Pd. Oxidative removalof CO from Pd sites is thus enhanced, allowinghydrogen oxidation to take place on freed Pd sites.
Testing of Prototype Pt Alloy Air CathodeElectrocatalysts
For phosphoric acid fuel cells (PAFCs), Pt-alloycathode catalysts (e.g., PtNi and PtCo) were foundto improve the gas diffusion electrode’sperformance. Recent work on polymer electrolytemembrane fuel cell (PEMFC) cathode catalysts hasindicated similar effects, but the magnitude of thiseffect is still unclear. It is not yet known whetherthese materials are stable under PEMFC conditionsor whether the leaching of alloy components maylead to ionomer contamination. For theunambiguous determination of the intrinsic catalyticactivity of Pt3Ni and Pt3Co, we use the rotating ring-disk method (RRDE) with model bulk alloys and thethin-film RRDE method for the carbon-supportedfuel cell catalysts. Using these techniques, theintrinsic catalytic activity of electrocatalysts can beassessed in the absence of mass transport resistance,which occurs in membrane electrode assemblies(MEAs). Figure 2 summarizes our preliminaryresults for the ORR on UHV prepared andcharacterized bulk Pt3Ni and Pt3Co alloy catalysts.Pure Pt is also shown as a reference. The figure alsoshows that the activity increases at 333 K in theorder Pt3Ni>Pt3Co>Pt, the catalytic activity of Pt3Nialloy being ca. 25 mV improved with respect to theORR on pure Pt. We found that Pt alloys were stable
ik [mA/cm2]
0.1 1 10 100
E [V
/RH
E]
0.6
0.7
0.8
0.9
E [V/RHE]
0.0 0.2 0.4 0.6 0.8 1.0x H
2O2 [%
]0
2
4
6
8
Pt3NiPtpcPt3Co
0.5 M H2SO41600 rpm, 333 K
Figure 2. Upper panel: Tafel plots for the ORR onpolycrystalline Pt, Pt3Ni, and Pt3Co bulkelectrodes, respectively. Lower panel:Fraction of peroxide produced during the ORRon these electrodes.
under our experimental conditions. Figure 2 alsoshows that similar small amounts of peroxide aredetected on the ring electrode on all three surfaces.This may imply that the reaction mechanism onPt3Ni and Pt3Co alloy surfaces is the same as oneproposed for pure Pt. The kinetics of the ORR onhigh-surface-area Pt3Ni and Pt3Co catalysts preparedby ETEK is very similar to that observed on the bulkelectrodes. Although the difference in activitybetween pure Pt and Pt3Ni-supported catalysts israther small (ca. 20 mV), confirmation of the highactivity of Pt3Ni catalysts may offer the possibilityof decreasing the amount of Pt in air cathode fuelcell catalysts.
In research directed toward improved airelectrodes for fuel cells, we had sought to utilizewhat we termed a “skin effect” to produce a moreactive state of Pt for the ORR. The skin effect arisesfrom strong Pt surface segregation in Pt3Ni and

Fuel Cell Power Systems FY 2000 Progress Report
118
Pt3Co alloys (i.e., a monolayer “skin” of Pt, thesecond layer being nearly pure Co and Ni).Preliminary studies of the oxygen reduction activityand stability of the skin structure on Pt3Co and Pt3Nibulk alloys indicate that the Pt “skin” is not stable atrelatively high potentials (E > 0.6 V vs RHE).Consequently, the skin structure of Pt3Co and Pt3Nicannot be used as a cathode material for the ORR atpotentials relevant for fuel cell applications. Studiesof other possible “skin effect” bimetallic systems arein progress.
Publications1. N.M. Markovic, B.N. Grgur, C.A. Lucas, and
P.N. Ross, “Surface Chemistry of CO onPt(100)-Bimetallic Surfaces: DisplacementEffects,” Langmuir, 16:1998 (2000).
2. N.M. Markovic, C.A. Lucas, B.N. Grgur, andP.N. Ross, “Surface Electrochemistry of CO andH2/CO Mixture at Pt(100) Interface: ElectrodeKinetics and Interfacial Structures,” J. Phys.Chem.,103:9616 (1999).
3. N.M. Markovic, T.J. Schmidt, B.N. Grgur, H.A.Gasteiger, R.J. Behm, and P.N. Ross, “TheEffect of Temperature on Surface Process at thePt(111)-Liquid Interface: Hydrogen Adsorption,Oxide Formation, and CO Oxidation,” J. Phys.Chem., 103:8568 (1999).
4. C.A. Lucas, B.N. Grgur, N.M. Markovic, andP.N. Ross, “Structural Effects during COAdsorption on Pt-Bimetallic Surfaces: ThePt(100) Electrode,” Surf. Sci., 448:77 (2000).
5. C.A. Lucas, N.M. Markovic, and P.N. Ross,“Structural Effects during CO Adsorption on Pt-Bimetallic Surfaces: The Pt(111) Electrode,”Surf. Sci., 448:65 (2000).
6. S. Baldelli, N. Markovic, P. Ross, Y-R Shen,and G. Somorjai, “Sum Frequency Generationof CO on (111) and Polycrystalline Platinum
Electrode Surfaces: Evidence for SFG InvisibleSurface CO,” J. Phys. Chem., 103:8920 (1999).
7. V. Climent, N.M. Markovic, and P.N. Ross,“Kinetics of Oxygen Reduction on an EpitaxialFilm of Palladium on Pt(111),” J. Chem Phys.104:3116 (2000).
8. N.M. Markovic and P.N. Ross, “Electrocatalysisby Design: From the Tailored Surface to aCommercial Catalyst,” review article,Electrochim. Acta, in press.
9. N.M. Markovic and P.N. Ross, “NewElectrocatalysts for Fuel Cells: From ModelSurfaces to Commercial Catalysts,” reviewarticle, Cattech, in press.
Book Chapter1. N.M. Markovic and P.N. Ross.,
“Electrocatalysis at Well-Defined Surfaces,” inInterfacial Electrochemistry, Theory,Experiment, and Applications. A. Wieckowski,Ed., Marcel Dekker, Inc., New York, Chapter 46(1999), p. 821.
Other Publications1. “Fuel Cell Reactions on Well-Characterized
Catalysts,” 3rd International Symposium onNew Materials for Electrochemical Systems,Montreal, Canada, July 1999. Extended abstract,pp. 64-67.
2. “Electrocatalysis by Design: From Atomic LevelStructures to High Surface Area Catalysts,” 3rdInternational Symposium on Electrocatalysis,Portoroz, Slovenia, September 1999. ExtendedAbstract, pp. 49-51.
3. “Electrocatalysis on Well-CharacterizedBimetallic Catalysts,” Workshop on DirectMethanol Fuel Cells, Portoroz, Slovenia,September 1999. Extended Abstract, pp. 63-65.

Fuel Cell Power Systems FY 2000 Progress Report
119
G. Development of a $10/kW Bipolar Separator Plate
Leonard G. Marianowski (primary contact)Institute of Gas Technology (IGT)1700 South Mount Prospect RoadDes Plaines, IL 60018(847) 768-0559, fax: (847) 768-0916, e-mail: [email protected]
DOE Program Manager: Donna Lee Ho(202) 586-8000, fax: (202) 586-9811, e-mail: [email protected]
DOE Program Support: Larry Blair(202) 586-0626, fax: (202) 586-9811, e-mail: [email protected]
ANL Technical Advisor: Walter Podolski(630) 252-7558, fax: (630) 972-4430, e-mail: [email protected]
DOE Contractor: Institute of Gas Technology, Des Plaines, IllinoisPrime Contract No. DE-FC02-97EE50477, November 1998-June 2001Subcontractors: PEM Plates, LLC, Elk Grove Village, IL 60007; Stimsonite Corporation, Niles, IL 60714; SuperiorGraphite Corporation, Chicago, IL 60638; and Honeywell, Inc., Torrance, CA 90504
Objectives• Develop a low-cost molded graphite bipolar separator plate for polymer electrolyte membrane (PEM) fuel cells.
• Evaluate the IGT-molded graphite bipolar separator plate’s performance and endurance in fuel cell stacks.
• Build a pilot production molding line with capacity of five plates per hour at PEM Plates, LLC, to evaluatemass production of molded plates.
OAAT R&D Plan: Task 13; Barrier B
Approach• Select, blend, and optimize inexpensive raw materials for necessary electrical, chemical, and physical properties
of bipolar separator plates for a $10/kW manufactured target cost.
• Design, build, and operate the five-plate-per-hour (5-plate/hr) pilot production molding line at PEM Plates,LLC.
• Produce molded bipolar plates from the pilot line for the IGT and Honeywell fuel cell stack tests.
• Assemble fuel cell stacks at IGT to establish the functional performance and endurance of molded plates instack environments.
• Honeywell, Inc., will assemble and test molded plates from PEM Plates in a fuel cell stack and compareperformance against a machined graphite stack.
Accomplishments• Electrical, chemical, and physical property targets were met or exceeded with an optimized blend of
components, in laboratory tests and single-cell tests.
• Fuel cell performance was within 5% of that of state-of-the-art, machined graphite fuel cells in side-by-sidetests.
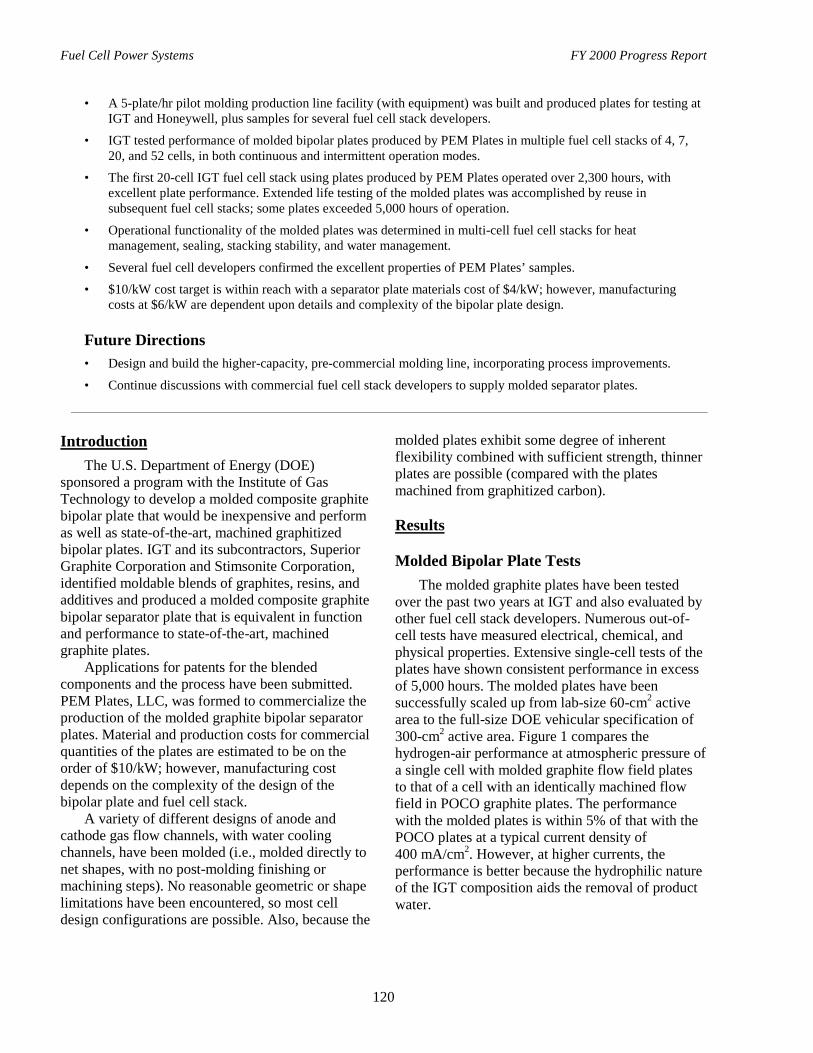
Fuel Cell Power Systems FY 2000 Progress Report
120
• A 5-plate/hr pilot molding production line facility (with equipment) was built and produced plates for testing atIGT and Honeywell, plus samples for several fuel cell stack developers.
• IGT tested performance of molded bipolar plates produced by PEM Plates in multiple fuel cell stacks of 4, 7,20, and 52 cells, in both continuous and intermittent operation modes.
• The first 20-cell IGT fuel cell stack using plates produced by PEM Plates operated over 2,300 hours, withexcellent plate performance. Extended life testing of the molded plates was accomplished by reuse insubsequent fuel cell stacks; some plates exceeded 5,000 hours of operation.
• Operational functionality of the molded plates was determined in multi-cell fuel cell stacks for heatmanagement, sealing, stacking stability, and water management.
• Several fuel cell developers confirmed the excellent properties of PEM Plates’ samples.• $10/kW cost target is within reach with a separator plate materials cost of $4/kW; however, manufacturing
costs at $6/kW are dependent upon details and complexity of the bipolar plate design.
Future Directions• Design and build the higher-capacity, pre-commercial molding line, incorporating process improvements.
• Continue discussions with commercial fuel cell stack developers to supply molded separator plates.
IntroductionThe U.S. Department of Energy (DOE)
sponsored a program with the Institute of GasTechnology to develop a molded composite graphitebipolar plate that would be inexpensive and performas well as state-of-the-art, machined graphitizedbipolar plates. IGT and its subcontractors, SuperiorGraphite Corporation and Stimsonite Corporation,identified moldable blends of graphites, resins, andadditives and produced a molded composite graphitebipolar separator plate that is equivalent in functionand performance to state-of-the-art, machinedgraphite plates.
Applications for patents for the blendedcomponents and the process have been submitted.PEM Plates, LLC, was formed to commercialize theproduction of the molded graphite bipolar separatorplates. Material and production costs for commercialquantities of the plates are estimated to be on theorder of $10/kW; however, manufacturing costdepends on the complexity of the design of thebipolar plate and fuel cell stack.
A variety of different designs of anode andcathode gas flow channels, with water coolingchannels, have been molded (i.e., molded directly tonet shapes, with no post-molding finishing ormachining steps). No reasonable geometric or shapelimitations have been encountered, so most celldesign configurations are possible. Also, because the
molded plates exhibit some degree of inherentflexibility combined with sufficient strength, thinnerplates are possible (compared with the platesmachined from graphitized carbon).
Results
Molded Bipolar Plate TestsThe molded graphite plates have been tested
over the past two years at IGT and also evaluated byother fuel cell stack developers. Numerous out-of-cell tests have measured electrical, chemical, andphysical properties. Extensive single-cell tests of theplates have shown consistent performance in excessof 5,000 hours. The molded plates have beensuccessfully scaled up from lab-size 60-cm2 activearea to the full-size DOE vehicular specification of300-cm2 active area. Figure 1 compares thehydrogen-air performance at atmospheric pressure ofa single cell with molded graphite flow field platesto that of a cell with an identically machined flowfield in POCO graphite plates. The performancewith the molded plates is within 5% of that with thePOCO plates at a typical current density of400 mA/cm2. However, at higher currents, theperformance is better because the hydrophilic natureof the IGT composition aids the removal of productwater.
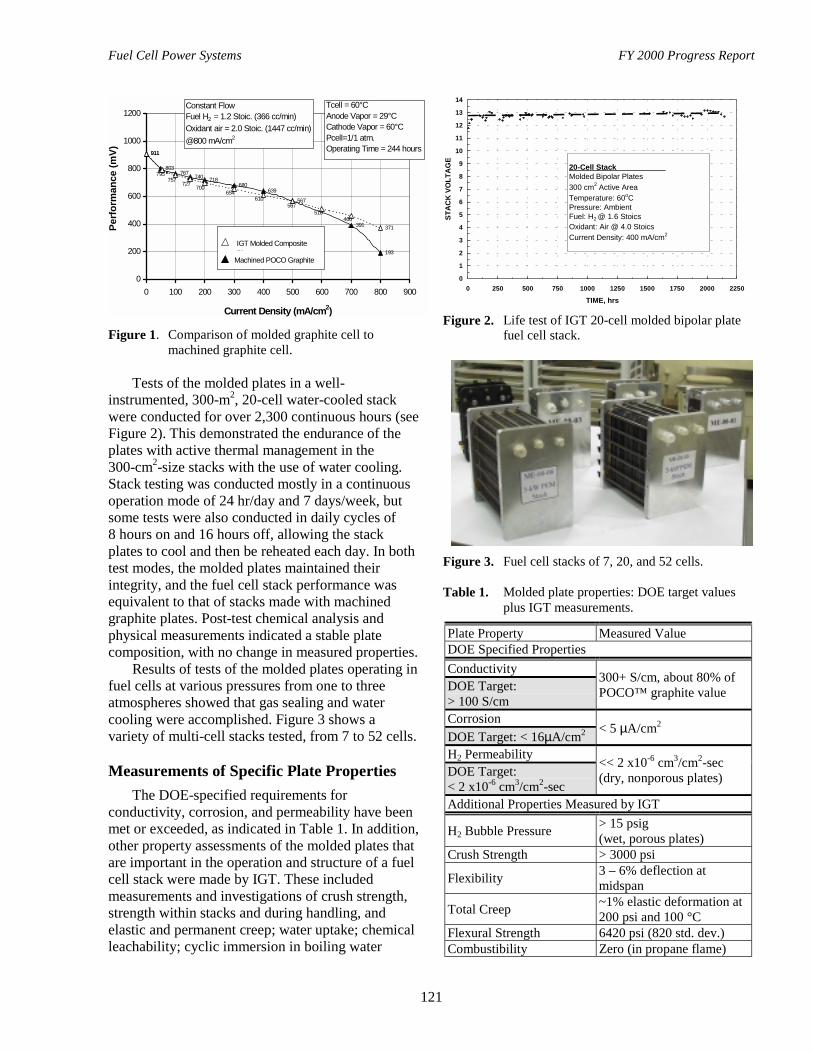
Fuel Cell Power Systems FY 2000 Progress Report
121
911
803767
740 718680
639
567
391
193
911
371460
510
610654
757727
700
567
795
0
200
400
600
800
1000
1200
0 100 200 300 400 500 600 700 800 900
Current Density (mA/cm2)
Perf
orm
ance
(mV)
Constant FlowFuel H2 = 1.2 Stoic. (366 cc/min)Oxidant air = 2.0 Stoic. (1447 cc/min)@800 mA/cm2
Tcell = 60°CAnode Vapor = 29°C Cathode Vapor = 60°CPcell=1/1 atm.Operating Time = 244 hours
Machined POCO Graphite
IGT Molded Composite Pl t
Figure 1. Comparison of molded graphite cell tomachined graphite cell.
Tests of the molded plates in a well-instrumented, 300-m2, 20-cell water-cooled stackwere conducted for over 2,300 continuous hours (seeFigure 2). This demonstrated the endurance of theplates with active thermal management in the300-cm2-size stacks with the use of water cooling.Stack testing was conducted mostly in a continuousoperation mode of 24 hr/day and 7 days/week, butsome tests were also conducted in daily cycles of8 hours on and 16 hours off, allowing the stackplates to cool and then be reheated each day. In bothtest modes, the molded plates maintained theirintegrity, and the fuel cell stack performance wasequivalent to that of stacks made with machinedgraphite plates. Post-test chemical analysis andphysical measurements indicated a stable platecomposition, with no change in measured properties.
Results of tests of the molded plates operating infuel cells at various pressures from one to threeatmospheres showed that gas sealing and watercooling were accomplished. Figure 3 shows avariety of multi-cell stacks tested, from 7 to 52 cells.
Measurements of Specific Plate PropertiesThe DOE-specified requirements for
conductivity, corrosion, and permeability have beenmet or exceeded, as indicated in Table 1. In addition,other property assessments of the molded plates thatare important in the operation and structure of a fuelcell stack were made by IGT. These includedmeasurements and investigations of crush strength,strength within stacks and during handling, andelastic and permanent creep; water uptake; chemicalleachability; cyclic immersion in boiling water
0
1
2
3
4
5
6
7
8
9
10
11
12
13
14
0 250 500 750 1000 1250 1500 1750 2000 2250
TIME, hrs
STA
CK
VO
LTA
GE
20-Cell Stack Molded Bipolar Plates300 cm2 Active AreaTemperature: 60oCPressure: AmbientFuel: H2 @ 1.6 StoicsOxidant: Air @ 4.0 StoicsCurrent Density: 400 mA/cm2
Figure 2. Life test of IGT 20-cell molded bipolar platefuel cell stack.
Figure 3. Fuel cell stacks of 7, 20, and 52 cells.
Table 1. Molded plate properties: DOE target valuesplus IGT measurements.
Plate Property Measured ValueDOE Specified PropertiesConductivityDOE Target:> 100 S/cm
300+ S/cm, about 80% ofPOCO™ graphite value
CorrosionDOE Target: < 16µA/cm2 < 5 µA/cm2
H2 PermeabilityDOE Target:< 2 x10⁻⁶ cm3/cm2-sec
<< 2 x10⁻⁶ cm3/cm2-sec(dry, nonporous plates)
Additional Properties Measured by IGT
H2 Bubble Pressure > 15 psig(wet, porous plates)
Crush Strength > 3000 psi
Flexibility 3 – 6% deflection atmidspan
Total Creep ~1% elastic deformation at200 psi and 100 °C
Flexural Strength 6420 psi (820 std. dev.)Combustibility Zero (in propane flame)

Fuel Cell Power Systems FY 2000 Progress Report
122
followed by freezing; noncombustibility;recyclability of components; and potential reuse ofcomponents in new plates or other products.
The values of conductivity were measured usingthe American Society for Testing and Materials(ASTM) C-661 method, and the values weretypically exceeded by a factor of three to eight,depending on plate density. Conductivity andsurface resistance measurements were alwayscompared with measurements of POCO graphiteplates, used as a standard.
The corrosion rate target of less than 16 µA/cm2
was also satisfied. This was done in hydrogen, air,and oxygen atmospheres in a dilute sulfuric acidsolution with 2 ppm fluoride, using the ASTM G5method at 90°C and pH ~ 4. The IGT moldedcomposite blend had total corrosion rates below5 µA/cm2. Hydrogen permeability was measured asa function of plate density, related to moldingpressure. Plates can be molded either more or lessdense than POCO graphite, thereby controlling theporosity. The hydrogen permeability rate measuredfor the dense, nonporous plates, at 90°C and 207 kPa(30 psig), was always well below the DOE-specifiedvalue of 2 × 10⁻⁶ cm3/cm2-s.
Additional measurements were made of the platecrush strength, flexural strength, mid-spanflexibility, and creep characteristics. The moldedplates are expected to survive an anticipated holdingforce exerting 200-psi pressure in the fuel cell stack,including stacking dimensional nonuniformitiesinduced by gasketing or assembly methods, plus amyriad of handling and packaging actions from theproduction line to stack assembly. The measuredstrength values shown in Table 1 yield a good safetymargin. The strength and slight flexibility of themolded composite plates give the stacks theadvantage of greater durability. The plates haveretained their electrical and physical properties afterbeing subjected to immersion in boiling waterfollowed by freeze-thaw cycles. Maximum loss ofweight in any of the tests has been on the order of0.5%.
Molded Plate Production and Cost EstimatesIGT and Stimsonite formed a joint venture
company called PEM Plates, LLC, with the purpose
of producing molded composite bipolar separatorplates for fuel cell stack developers. The varioussteps in the process were explored, andmodifications were developed for mass productionof the plates. With the knowledge gained frommolding the composite plates in the 5-plate/hr pilotline, plus corporate experience with rapid moldingmachines and inexpensive molds, machineproduction rates of hundreds of plates per hour arepossible. In carload quantities, raw material costswill be $4/kW or less. Production costs are expectedto be about $6/kW; however, this cost depends uponthe production quantity and the complexity of theplate designs.
Capital and operating costs were analyzed forthe custom machines to produce hundreds of platesper hour. To attain production costs below $6/kW,annual production quantities of 100 MW of fuelcells are needed. This is equivalent to about2,000 cars per year with 50-kW fuel cell engines. Asthe demand for plates increases, the number ofproduction machines can be increased.
ConclusionsAfter identifying a unique blend of component
materials for a molded graphite bipolar separatorplate for PEM fuel cells, development of a rapidmolding process began with a pilot production line.Thousands of plates have been molded andthousands of hours of fuel cell stack tests have beenconducted, yielding performance practicallyequivalent to state-of-the-art, machined graphiteplates. In commercial production quantities, themanufactured cost of PEM Plates’ molded separatorplates is estimated to be about $10/kW.
More needs to be done to reach commercialproduction:
• The new molding process needs to be validatedat the pre-commercial manufacturing level.
• Successful molding trials using stack developerdesigns must be demonstrated.
• Additional stack endurance and verificationtesting is needed.
• Additional orders from developers are needed inorder to increase production volumes to thelevels needed to achieve cost reductions.
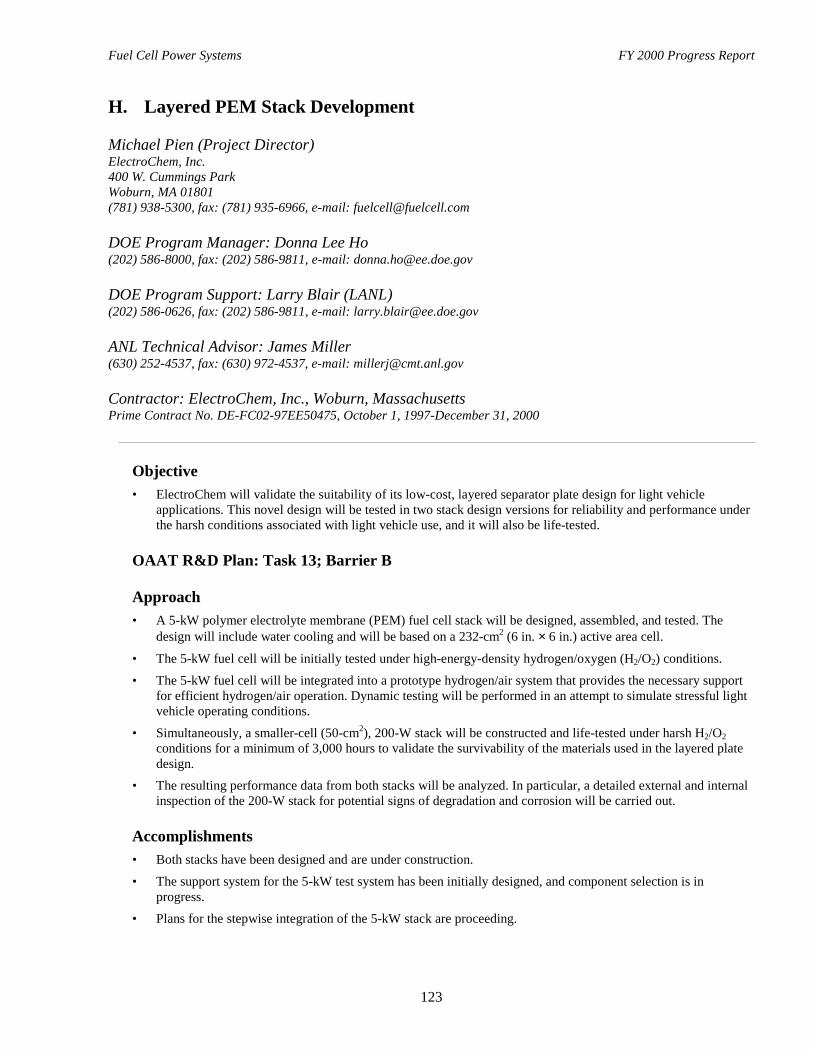
Fuel Cell Power Systems FY 2000 Progress Report
123
H. Layered PEM Stack Development
Michael Pien (Project Director)ElectroChem, Inc.400 W. Cummings ParkWoburn, MA 01801(781) 938-5300, fax: (781) 935-6966, e-mail: [email protected]
DOE Program Manager: Donna Lee Ho(202) 586-8000, fax: (202) 586-9811, e-mail: [email protected]
DOE Program Support: Larry Blair (LANL)(202) 586-0626, fax: (202) 586-9811, e-mail: [email protected]
ANL Technical Advisor: James Miller(630) 252-4537, fax: (630) 972-4537, e-mail: [email protected]
Contractor: ElectroChem, Inc., Woburn, MassachusettsPrime Contract No. DE-FC02-97EE50475, October 1, 1997-December 31, 2000
Objective• ElectroChem will validate the suitability of its low-cost, layered separator plate design for light vehicle
applications. This novel design will be tested in two stack design versions for reliability and performance underthe harsh conditions associated with light vehicle use, and it will also be life-tested.
OAAT R&D Plan: Task 13; Barrier B
Approach• A 5-kW polymer electrolyte membrane (PEM) fuel cell stack will be designed, assembled, and tested. The
design will include water cooling and will be based on a 232-cm2 (6 in. × 6 in.) active area cell.
• The 5-kW fuel cell will be initially tested under high-energy-density hydrogen/oxygen (H2/O2) conditions.
• The 5-kW fuel cell will be integrated into a prototype hydrogen/air system that provides the necessary supportfor efficient hydrogen/air operation. Dynamic testing will be performed in an attempt to simulate stressful lightvehicle operating conditions.
• Simultaneously, a smaller-cell (50-cm2), 200-W stack will be constructed and life-tested under harsh H2/O2conditions for a minimum of 3,000 hours to validate the survivability of the materials used in the layered platedesign.
• The resulting performance data from both stacks will be analyzed. In particular, a detailed external and internalinspection of the 200-W stack for potential signs of degradation and corrosion will be carried out.
Accomplishments• Both stacks have been designed and are under construction.
• The support system for the 5-kW test system has been initially designed, and component selection is inprogress.
• Plans for the stepwise integration of the 5-kW stack are proceeding.

Fuel Cell Power Systems FY 2000 Progress Report
124
Future Directions• Conduct dynamic testing of 5-kW stack to simulate light-duty vehicle operation.
• Conduct life-testing of 200-W stack for 3,000 hours.• Analyze performance data from 5-kW and 200-W stacks.
IntroductionThe principal hardware element in a PEM fuel
cell is the bipolar separator plate, which inconventional designs is a major cost item in a fuelcell system. The bipolar separator plate mustperform a number of important taskssimultaneously, while remaining lightweight andlow-cost. It must provide excellent electricalconductivity, keep the gaseous reactants separated,be leak-free, support intricate gas flow patterns touniformly distribute reactants and water vapor andremove waste products from the membraneelectrode assembly (MEA), permit stack cooling,and be fabricated to relatively high tolerances involume production. Finding a single material for usein inexpensively producing monolithic separatorplates remains a challenge. Long experience hasshown that graphite has the chemical stability tosurvive the fuel cell environment, but producingnonporous graphite is a long and expensiveindustrial process.
ApproachOur approach has been to fabricate separator
plates from several materials, thereby relaxing theperformance requirements for any one material. Ourbasic design approach is shown in Figure 1, where asingle monolithic plate design (a) is compared withthe layered design (b). The principal components ofthe new design are porous graphite, polycarbonateplastic, and stainless steel.
Previous work had shown that this designprovides high performance at low cost whileenabling a leak-free stack design that yielded nosigns of corrosion or degradation under the harshtest conditions examined. This program is explicitlyaimed at extending the testing range to includelonger life testing under harsh conditions, as well asa larger-scale (5-kW) stack design. The overall goalis to extend the range of confidence in this platedesign for commercial light vehicle mass productionapplications.
Nonporous(expensive)
Graphite
Gasket MEA
MEA
Thin StainlessSheet
MoldedPolycarbonate
Molded Porous(inexpensive)
Graphite
ConductiveBonding & Sealing
Layer
(a)Conventional Plate Design
(b)Layered Plate Design
Figure 1. Schematic comparison of a conventional fuelcell separator plate with ElectroChem’slayered structure. The typical monolithic plateis usually composed of expensive nonporousgraphite or graphite composite. ElectroChem’sdesign uses three primary materials selectedfor low cost, high performance, and readyavailability.
Technical ChallengesA particular feature of the layered separator
plate design is its facility for the flexible applicationof manufacturing technology. The fabricationprocess for these layered bipolar plates lends itself tolow-cost mass production by means of techniques,equipment, and processes used across severalindustries. Each step, though it comprises severalpieces that require individual fabrication andhandling, is quite low-cost and rapidly executed. Acost analysis has been carried out specifically forvolume production associated with the auto industry.
Some of the results of this analysis are shown inFigures 2 and 3. Of primary interest to the vehiclemanufacturer is that the fuel cell separator andcooling plates (one cooling plate for every twoactive cells) meet the simultaneous requirements oflow weight and low cost. The layered separator platedesign readily meets both of these requirements,

Fuel Cell Power Systems FY 2000 Progress Report
125
0
200
400
600
800
1000
1200
0.2 0.4 0.6 0.8 1 1.2
Current density, A/cm2
Num
ber o
f pla
tes
0
200
400
600
800
1000
1200
Spec
ific
pow
er, W
/kg
number of platesspecific power
Figure 2. Specific power analysis of layered separatorplus cooling plates for a 50-kW stackoperating at 0.8 V/cell.
0
200
400
600
800
1000
1200
0.2 0.4 0.6 0.8 1 1.2
Current density, A/cm2
Num
ber o
f pla
tes
0
5
10
15
20
25
30
35
40C
ost,
$/kW
number of plates
cost
Figure 3. Cost analysis results of layered separatorplates plus cooling plates for a 50-kW stackoperating at 0.8 V/cell.
using commercially available materials, on the basisof reasonable assumptions about cost savingsobtained from volume production techniques.
Our next stage in the validation of this novelplate design comprises extensive testing in(a) subscale stacks, which can examine potentialmaterials degradation scenarios (200 W); and in(b) a 5-kW stack, which operates at a scale andpower density comparable with light vehicleapplications. Toward this end, two stacks are beingdeveloped, and an extensive testing process isplanned. A schematic drawing of the 5-kW testsystem is shown in Figure 4.
Cooling Air FanCondenser
Heat Exchanger
Air Humidifier
HydrogenHumidifier
Air IntakeAir Blower
CoolantReturn
CoolantInput
Figure 4. Schematic drawing of the laboratory-scale5-kW fuel cell system for dynamic testing ofthe full-scale separator plate design.
Future ChallengesOur design has been developed with an eye
toward the progressive commercialization of fuelcells. The approach taken permits us to adapt thesematerials to a wide range of designs that may varybetween fuel cell manufacturers. This successfulseparator plate design is quite generic and can beadapted to a wide range of flow field patterns. Thesematerials are already produced in bulk, are wellengineered, and offer economies of scale that can beattained rapidly with minimal investment.
Meanwhile, this material combination can alsobe obtained in small volumes at modest cost andinexpensively machined to provide parts that alreadycost less than their nonporous graphite equivalents.This leads us to anticipate the introduction of theseless expensive parts into fuel cells whilemanufacturing volumes are still small, providingsubstantial cost savings at every level of productionvolume.

Fuel Cell Power Systems FY 2000 Progress Report
126
Fuel Cell Power Systems FY 2000 Progress Report
127
VI. AIR MANAGEMENT SUBSYSTEMS1
A. Turbocompressor for PEM Fuel Cells
Mark K. GeeHoneywell Engines & Systems2525 W. 190th Street, MS-36-2-93084Torrance, CA 90504(310) 512-3606, fax: (310) 512-4998, e-mail: [email protected]
DOE Program Manager: Patrick Davis(202) 586-8061, fax: (202) 586-9811, e-mail: [email protected]
ANL Technical Advisor: Robert Sutton(630) 252-4321, fax: (630) 252-4176, e-mail: [email protected]
Contractor: Honeywell Engines & Systems, Torrance, CaliforniaPrime Contract No. DE-FC02-97EE50479, October 1997-July 2000
DE-FC02-99EE50579, October 1999-June 2001
ObjectivesAn optimal turbocompressor configuration will be developed, working with fuel cell system manufacturers andcarrying on the work currently being performed. A vehicle-ready motor controller will be developed. Theturbocompressor/motor controller will be made available for integration in a fuel cell system.
OAAT R&D Plan: Task 13; Barrier D
ApproachHoneywell’s approach makes use of• Automotive and aerospace turbomachinery technology for low cost and low weight/volume ratio.• Variable nozzle turbine (VNT ) inlet geometry for improved performance across the flow range.• A mixed-flow-type compressor for improved low-flow performance.• Contamination/oil-free and zero-maintenance-compliant foil air bearings.• A high-efficiency, low-cost two-pole toothless motor.• Low-cost, sensorless variable-speed motor controller topology design.
Accomplishments• Numerous start/stop cycles with no appreciable wear.• Stable operation at full turbine temperature (150oC).• Performance of compressor and turbine mapping close to that predicted.• Completion of power consumption evaluation.
1 The DOE technical targets for fuel cell system compressor/expanders can be found in Table 5, Appendix B. These
targets will be reviewed and possibly revised at a workshop being held early in FY 2001.
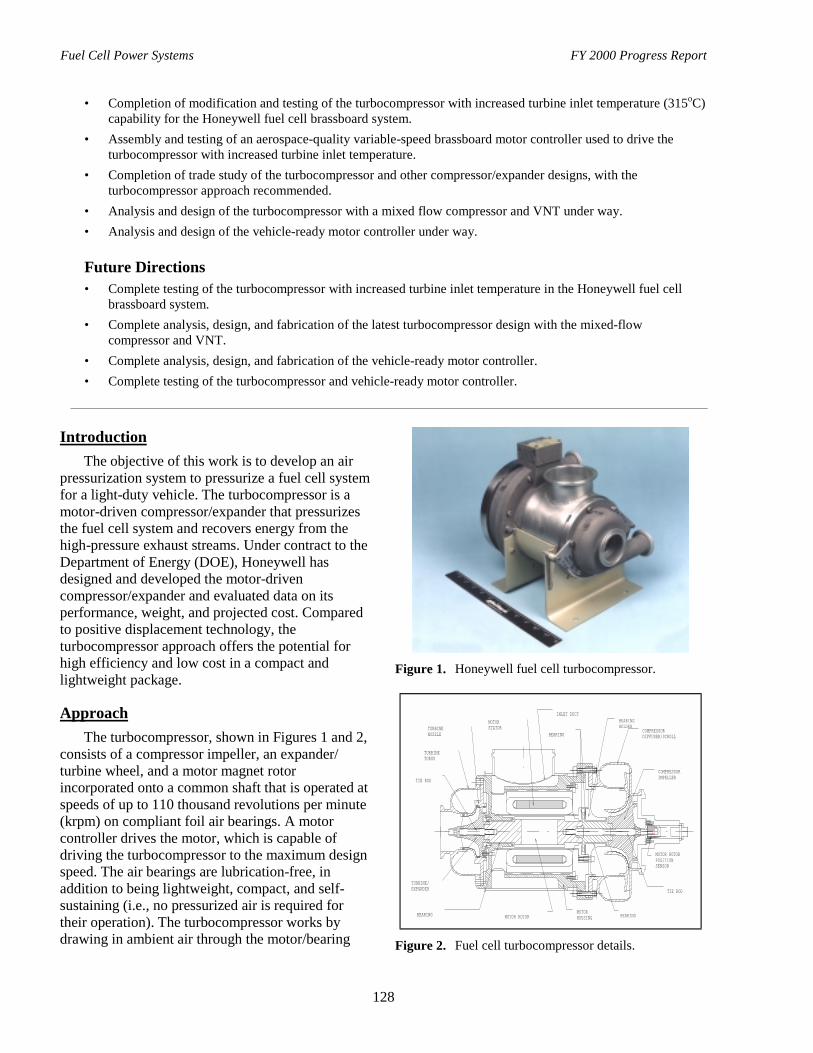
Fuel Cell Power Systems FY 2000 Progress Report
128
• Completion of modification and testing of the turbocompressor with increased turbine inlet temperature (315oC)capability for the Honeywell fuel cell brassboard system.
• Assembly and testing of an aerospace-quality variable-speed brassboard motor controller used to drive theturbocompressor with increased turbine inlet temperature.
• Completion of trade study of the turbocompressor and other compressor/expander designs, with theturbocompressor approach recommended.
• Analysis and design of the turbocompressor with a mixed flow compressor and VNT under way.• Analysis and design of the vehicle-ready motor controller under way.
Future Directions• Complete testing of the turbocompressor with increased turbine inlet temperature in the Honeywell fuel cell
brassboard system.• Complete analysis, design, and fabrication of the latest turbocompressor design with the mixed-flow
compressor and VNT.• Complete analysis, design, and fabrication of the vehicle-ready motor controller.• Complete testing of the turbocompressor and vehicle-ready motor controller.
IntroductionThe objective of this work is to develop an air
pressurization system to pressurize a fuel cell systemfor a light-duty vehicle. The turbocompressor is amotor-driven compressor/expander that pressurizesthe fuel cell system and recovers energy from thehigh-pressure exhaust streams. Under contract to theDepartment of Energy (DOE), Honeywell hasdesigned and developed the motor-drivencompressor/expander and evaluated data on itsperformance, weight, and projected cost. Comparedto positive displacement technology, theturbocompressor approach offers the potential forhigh efficiency and low cost in a compact andlightweight package.
ApproachThe turbocompressor, shown in Figures 1 and 2,
consists of a compressor impeller, an expander/turbine wheel, and a motor magnet rotorincorporated onto a common shaft that is operated atspeeds of up to 110 thousand revolutions per minute(krpm) on compliant foil air bearings. A motorcontroller drives the motor, which is capable ofdriving the turbocompressor to the maximum designspeed. The air bearings are lubrication-free, inaddition to being lightweight, compact, and self-sustaining (i.e., no pressurized air is required fortheir operation). The turbocompressor works bydrawing in ambient air through the motor/bearing
Figure 1. Honeywell fuel cell turbocompressor.
COMPRESSOR IMPELLER
MOTOR ROTOR POSITION SENSOR
TIE ROD
COMPRESSOR DIFFUSER/SCROLL
MOTOR ROTOR BEARINGBEARING
TURBINE/EXPANDER
TURBINETORUS
TURBINENOZZLE
MOTORSTATOR
BEARING
MOTOR HOUSING
INLET DUCT BEARING HOLDER
TIE ROD
Figure 2. Fuel cell turbocompressor details.
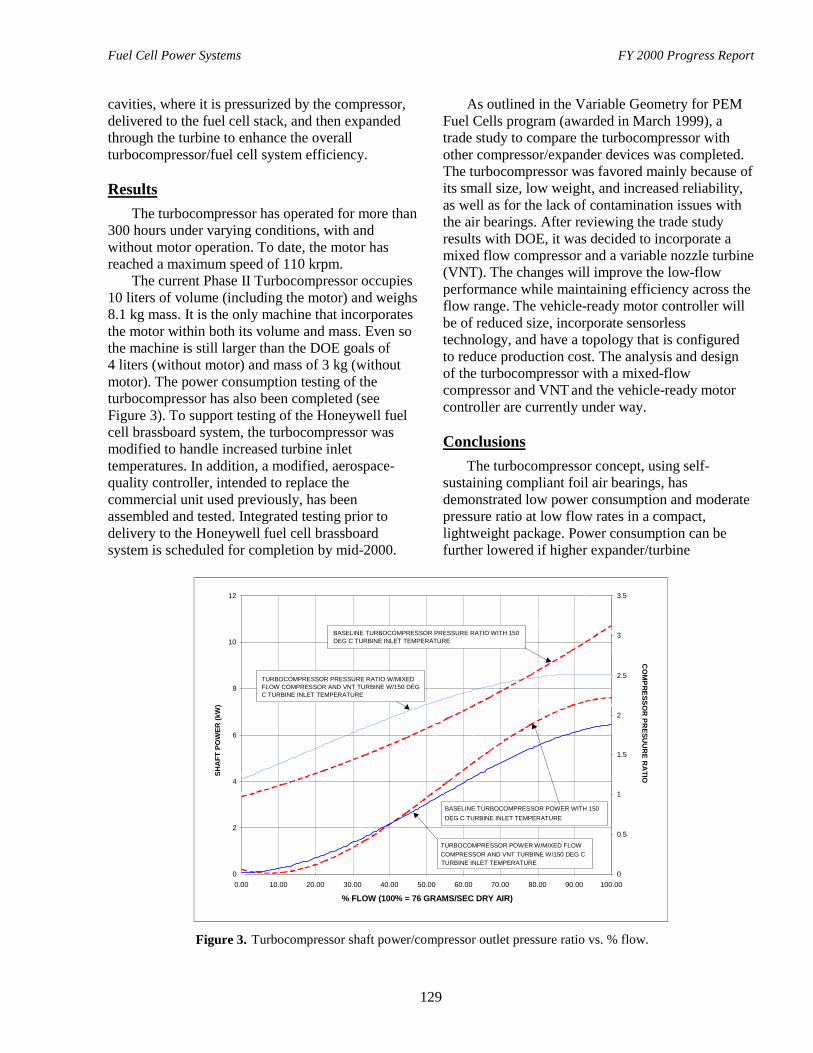
Fuel Cell Power Systems FY 2000 Progress Report
129
cavities, where it is pressurized by the compressor,delivered to the fuel cell stack, and then expandedthrough the turbine to enhance the overallturbocompressor/fuel cell system efficiency.
ResultsThe turbocompressor has operated for more than
300 hours under varying conditions, with andwithout motor operation. To date, the motor hasreached a maximum speed of 110 krpm.
The current Phase II Turbocompressor occupies10 liters of volume (including the motor) and weighs8.1 kg mass. It is the only machine that incorporatesthe motor within both its volume and mass. Even sothe machine is still larger than the DOE goals of4 liters (without motor) and mass of 3 kg (withoutmotor). The power consumption testing of theturbocompressor has also been completed (seeFigure 3). To support testing of the Honeywell fuelcell brassboard system, the turbocompressor wasmodified to handle increased turbine inlettemperatures. In addition, a modified, aerospace-quality controller, intended to replace thecommercial unit used previously, has beenassembled and tested. Integrated testing prior todelivery to the Honeywell fuel cell brassboardsystem is scheduled for completion by mid-2000.
As outlined in the Variable Geometry for PEMFuel Cells program (awarded in March 1999), atrade study to compare the turbocompressor withother compressor/expander devices was completed.The turbocompressor was favored mainly because ofits small size, low weight, and increased reliability,as well as for the lack of contamination issues withthe air bearings. After reviewing the trade studyresults with DOE, it was decided to incorporate amixed flow compressor and a variable nozzle turbine(VNT). The changes will improve the low-flowperformance while maintaining efficiency across theflow range. The vehicle-ready motor controller willbe of reduced size, incorporate sensorlesstechnology, and have a topology that is configuredto reduce production cost. The analysis and designof the turbocompressor with a mixed-flowcompressor and VNT and the vehicle-ready motorcontroller are currently under way.
ConclusionsThe turbocompressor concept, using self-
sustaining compliant foil air bearings, hasdemonstrated low power consumption and moderatepressure ratio at low flow rates in a compact,lightweight package. Power consumption can befurther lowered if higher expander/turbine
0
2
4
6
8
10
12
0.00 10.00 20.00 30.00 40.00 50.00 60.00 70.00 80.00 90.00 100.00
% FLOW (100% = 76 GRAMS/SEC DRY AIR)
SHA
FT P
OW
ER (k
W)
0
0.5
1
1.5
2
2.5
3
3.5
CO
MPRESSO
R PR
ESUU
RE R
ATIO
BASELINE TURBOCOMPRESSOR POWER WITH 150DEG C TURBINE INLET TEMPERATURE
BASELINE TURBOCOMPRESSOR PRESSURE RATIO WITH 150DEG C TURBINE INLET TEMPERATURE
TURBOCOMPRESSOR PRESSURE RATIO W/MIXEDFLOW COMPRESSOR AND VNT TURBINE W/150 DEGC TURBINE INLET TEMPERATURE
TURBOCOMPRESSOR POWER W/MIXED FLOWCOMPRESSOR AND VNT TURBINE W/150 DEG CTURBINE INLET TEMPERATURE
Figure 3. Turbocompressor shaft power/compressor outlet pressure ratio vs. % flow.
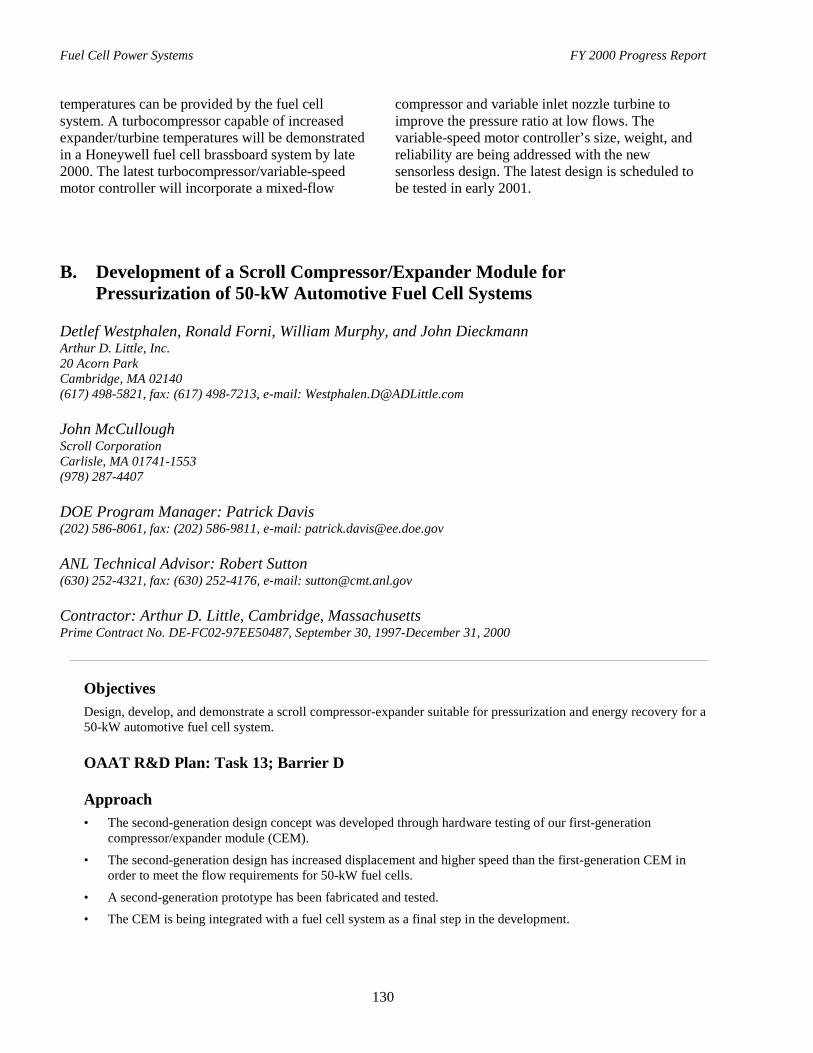
Fuel Cell Power Systems FY 2000 Progress Report
130
temperatures can be provided by the fuel cellsystem. A turbocompressor capable of increasedexpander/turbine temperatures will be demonstratedin a Honeywell fuel cell brassboard system by late2000. The latest turbocompressor/variable-speedmotor controller will incorporate a mixed-flow
compressor and variable inlet nozzle turbine toimprove the pressure ratio at low flows. Thevariable-speed motor controller’s size, weight, andreliability are being addressed with the newsensorless design. The latest design is scheduled tobe tested in early 2001.
B. Development of a Scroll Compressor/Expander Module forPressurization of 50-kW Automotive Fuel Cell Systems
Detlef Westphalen, Ronald Forni, William Murphy, and John DieckmannArthur D. Little, Inc.20 Acorn ParkCambridge, MA 02140(617) 498-5821, fax: (617) 498-7213, e-mail: [email protected]
John McCulloughScroll CorporationCarlisle, MA 01741-1553(978) 287-4407
DOE Program Manager: Patrick Davis(202) 586-8061, fax: (202) 586-9811, e-mail: [email protected]
ANL Technical Advisor: Robert Sutton(630) 252-4321, fax: (630) 252-4176, e-mail: [email protected]
Contractor: Arthur D. Little, Cambridge, MassachusettsPrime Contract No. DE-FC02-97EE50487, September 30, 1997-December 31, 2000
ObjectivesDesign, develop, and demonstrate a scroll compressor-expander suitable for pressurization and energy recovery for a50-kW automotive fuel cell system.
OAAT R&D Plan: Task 13; Barrier D
Approach• The second-generation design concept was developed through hardware testing of our first-generation
compressor/expander module (CEM).
• The second-generation design has increased displacement and higher speed than the first-generation CEM inorder to meet the flow requirements for 50-kW fuel cells.
• A second-generation prototype has been fabricated and tested.• The CEM is being integrated with a fuel cell system as a final step in the development.
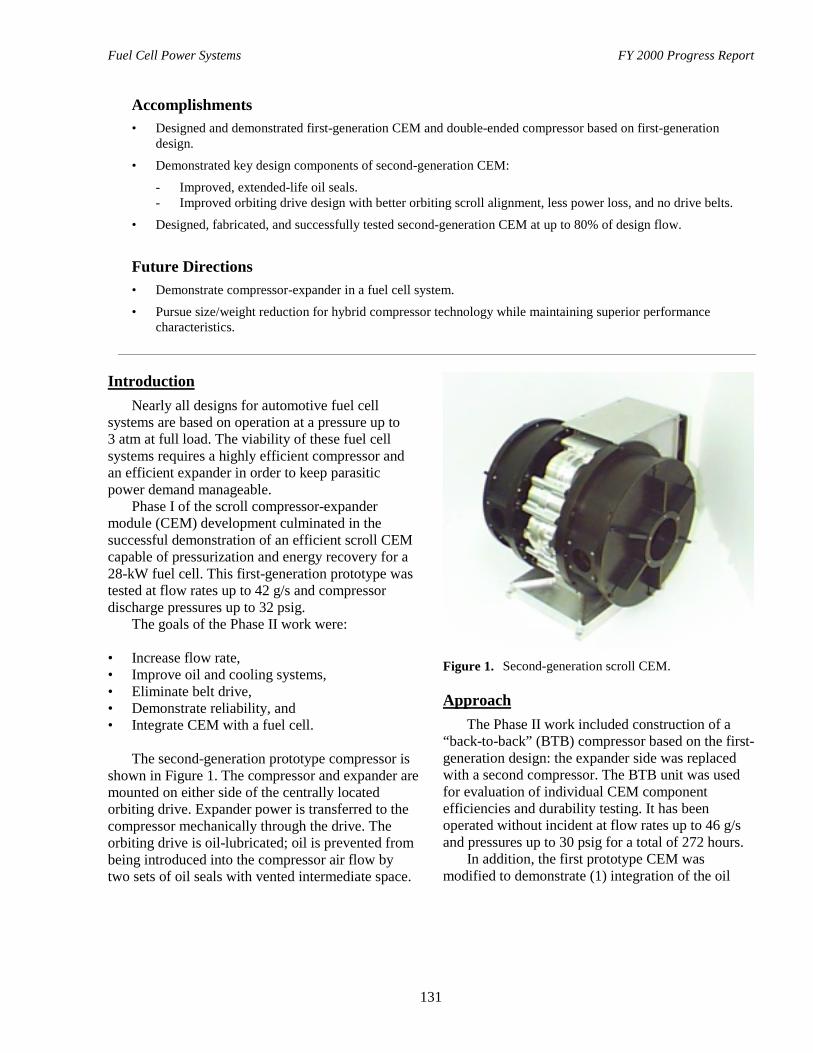
Fuel Cell Power Systems FY 2000 Progress Report
131
Accomplishments• Designed and demonstrated first-generation CEM and double-ended compressor based on first-generation
design.
• Demonstrated key design components of second-generation CEM:
- Improved, extended-life oil seals.- Improved orbiting drive design with better orbiting scroll alignment, less power loss, and no drive belts.
• Designed, fabricated, and successfully tested second-generation CEM at up to 80% of design flow.
Future Directions• Demonstrate compressor-expander in a fuel cell system.
• Pursue size/weight reduction for hybrid compressor technology while maintaining superior performancecharacteristics.
IntroductionNearly all designs for automotive fuel cell
systems are based on operation at a pressure up to3 atm at full load. The viability of these fuel cellsystems requires a highly efficient compressor andan efficient expander in order to keep parasiticpower demand manageable.
Phase I of the scroll compressor-expandermodule (CEM) development culminated in thesuccessful demonstration of an efficient scroll CEMcapable of pressurization and energy recovery for a28-kW fuel cell. This first-generation prototype wastested at flow rates up to 42 g/s and compressordischarge pressures up to 32 psig.
The goals of the Phase II work were:
• Increase flow rate,• Improve oil and cooling systems,• Eliminate belt drive,• Demonstrate reliability, and• Integrate CEM with a fuel cell.
The second-generation prototype compressor isshown in Figure 1. The compressor and expander aremounted on either side of the centrally locatedorbiting drive. Expander power is transferred to thecompressor mechanically through the drive. Theorbiting drive is oil-lubricated; oil is prevented frombeing introduced into the compressor air flow bytwo sets of oil seals with vented intermediate space.
Figure 1. Second-generation scroll CEM.
ApproachThe Phase II work included construction of a
“back-to-back” (BTB) compressor based on the first-generation design: the expander side was replacedwith a second compressor. The BTB unit was usedfor evaluation of individual CEM componentefficiencies and durability testing. It has beenoperated without incident at flow rates up to 46 g/sand pressures up to 30 psig for a total of 272 hours.
In addition, the first prototype CEM wasmodified to demonstrate (1) integration of the oil
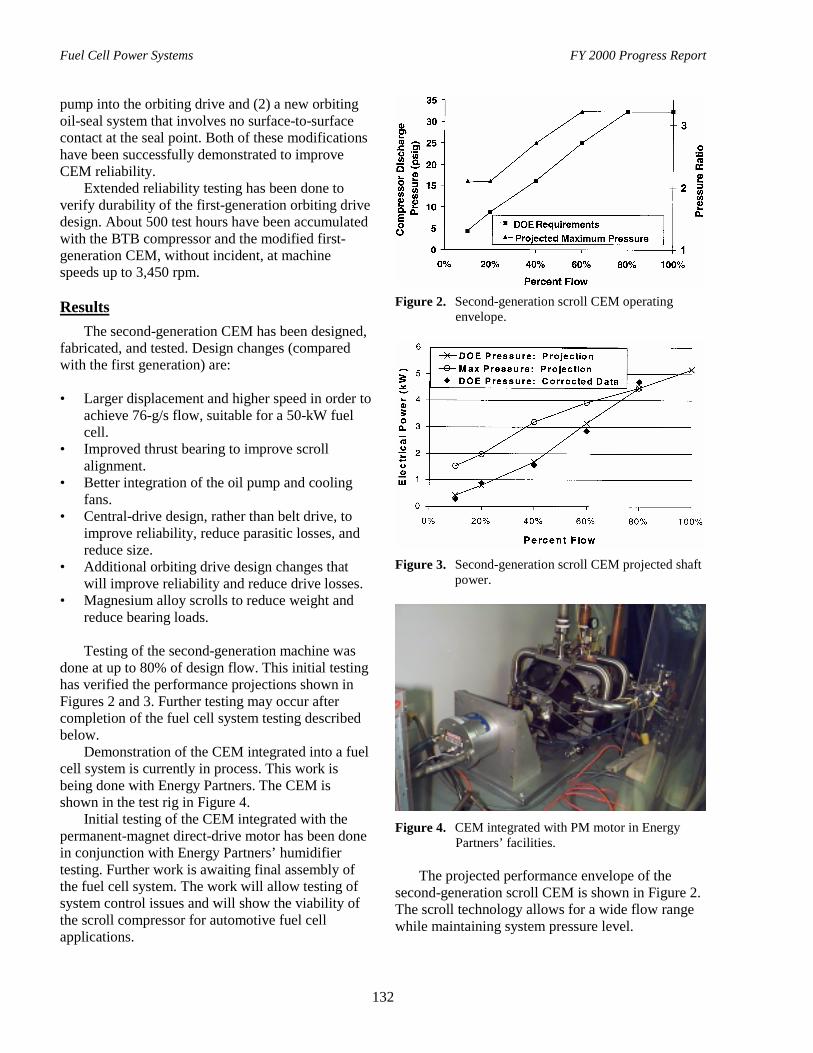
Fuel Cell Power Systems FY 2000 Progress Report
132
pump into the orbiting drive and (2) a new orbitingoil-seal system that involves no surface-to-surfacecontact at the seal point. Both of these modificationshave been successfully demonstrated to improveCEM reliability.
Extended reliability testing has been done toverify durability of the first-generation orbiting drivedesign. About 500 test hours have been accumulatedwith the BTB compressor and the modified first-generation CEM, without incident, at machinespeeds up to 3,450 rpm.
ResultsThe second-generation CEM has been designed,
fabricated, and tested. Design changes (comparedwith the first generation) are:
• Larger displacement and higher speed in order toachieve 76-g/s flow, suitable for a 50-kW fuelcell.
• Improved thrust bearing to improve scrollalignment.
• Better integration of the oil pump and coolingfans.
• Central-drive design, rather than belt drive, toimprove reliability, reduce parasitic losses, andreduce size.
• Additional orbiting drive design changes thatwill improve reliability and reduce drive losses.
• Magnesium alloy scrolls to reduce weight andreduce bearing loads.
Testing of the second-generation machine wasdone at up to 80% of design flow. This initial testinghas verified the performance projections shown inFigures 2 and 3. Further testing may occur aftercompletion of the fuel cell system testing describedbelow.
Demonstration of the CEM integrated into a fuelcell system is currently in process. This work isbeing done with Energy Partners. The CEM isshown in the test rig in Figure 4.
Initial testing of the CEM integrated with thepermanent-magnet direct-drive motor has been donein conjunction with Energy Partners’ humidifiertesting. Further work is awaiting final assembly ofthe fuel cell system. The work will allow testing ofsystem control issues and will show the viability ofthe scroll compressor for automotive fuel cellapplications.
Figure 2. Second-generation scroll CEM operatingenvelope.
Figure 3. Second-generation scroll CEM projected shaftpower.
Figure 4. CEM integrated with PM motor in EnergyPartners’ facilities.
The projected performance envelope of thesecond-generation scroll CEM is shown in Figure 2.The scroll technology allows for a wide flow rangewhile maintaining system pressure level.

Fuel Cell Power Systems FY 2000 Progress Report
133
The efficiency benefit of scroll technology forfuel cell pressurization is shown in Figure 3. Thefigure shows shaft power projections for Departmentof Energy (DOE) guideline pressures and for theprojected maximum pressure curve of Figure 2. Thepoints labeled “Corrected Data” are based on CEMtesting at operating conditions nearly identical to theDOE guidelines. The scroll CEM uses a very modest
amount of the net fuel cell stack power over theentire flow range. However, the second generationscroll CEM is 27 liters in volume (not including themotor) and has a mass of 36 kg (not including themotor). These parameters are far in excess of theoriginal DOE guidelines of 4 liters volume and 3 kgmass, both without the motor.
C. Variable Delivery Compressor/Expander Development
Ski M. Milburn, Principal InvestigatorVAIREX Corporation3044 Valmont RoadBoulder, CO 80301(303) 444-4556, fax: (303) 444-6150, e-mail: [email protected]
DOE Program Manager: Patrick Davis(202) 586-8061, fax: (202) 586-9811, e-mail: [email protected]
ANL Technical Advisor: Robert Sutton(630) 252-4321, fax: (630) 252-4176, e-mail: [email protected]
Contractor: VAIREX Corporation, Boulder, ColoradoPrime Contract No. DE-FCO2-98EE50481, December 19, 1997-June 19, 2000
ObjectivesThe primary objective for fiscal year (FY) 2000 was to complete development of a second-generation integrated aircompressor/expander/motor suitable for installation in 50-kW fuel cell demonstration systems. In particular, wesought to:
• Expand, through research and development, the performance envelope of the VAIREX dry piston technology foruse as a fuel cell power system air compressor and expander.
• Focus on performance improvements in the areas of operating speed, compressor power consumption, andexpander power recovery, as well as on the volume and weight of both devices.
• Define the development pathway to the manufacture of an integrated compressor/expander/motor (iCEM) thatwill satisfy cost, weight, and volume, as well as performance, requirements for a fuel-cell-powered productionvehicle.
OAAT R&D Plan: Task 13; Barrier D
ApproachThe current R&D phase moved beyond demonstration of basic capabilities to Department of Energy (DOE)guidelines and projected industry requirements. Specific steps during FY 2000 included:
• Implementation of an improved, simplified mechanism building on the Generation 1 results.
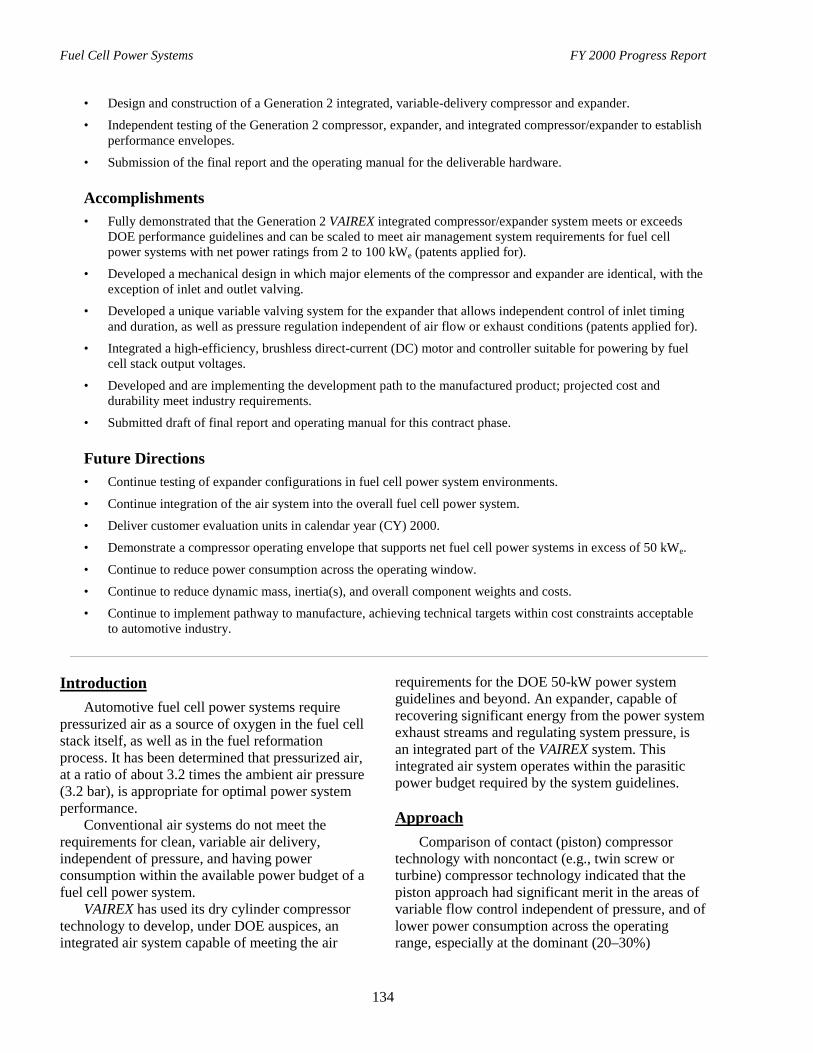
Fuel Cell Power Systems FY 2000 Progress Report
134
• Design and construction of a Generation 2 integrated, variable-delivery compressor and expander.
• Independent testing of the Generation 2 compressor, expander, and integrated compressor/expander to establishperformance envelopes.
• Submission of the final report and the operating manual for the deliverable hardware.
Accomplishments• Fully demonstrated that the Generation 2 VAIREX integrated compressor/expander system meets or exceeds
DOE performance guidelines and can be scaled to meet air management system requirements for fuel cellpower systems with net power ratings from 2 to 100 kWe (patents applied for).
• Developed a mechanical design in which major elements of the compressor and expander are identical, with theexception of inlet and outlet valving.
• Developed a unique variable valving system for the expander that allows independent control of inlet timingand duration, as well as pressure regulation independent of air flow or exhaust conditions (patents applied for).
• Integrated a high-efficiency, brushless direct-current (DC) motor and controller suitable for powering by fuelcell stack output voltages.
• Developed and are implementing the development path to the manufactured product; projected cost anddurability meet industry requirements.
• Submitted draft of final report and operating manual for this contract phase.
Future Directions• Continue testing of expander configurations in fuel cell power system environments.
• Continue integration of the air system into the overall fuel cell power system.
• Deliver customer evaluation units in calendar year (CY) 2000.
• Demonstrate a compressor operating envelope that supports net fuel cell power systems in excess of 50 kWe.
• Continue to reduce power consumption across the operating window.
• Continue to reduce dynamic mass, inertia(s), and overall component weights and costs.
• Continue to implement pathway to manufacture, achieving technical targets within cost constraints acceptableto automotive industry.
IntroductionAutomotive fuel cell power systems require
pressurized air as a source of oxygen in the fuel cellstack itself, as well as in the fuel reformationprocess. It has been determined that pressurized air,at a ratio of about 3.2 times the ambient air pressure(3.2 bar), is appropriate for optimal power systemperformance.
Conventional air systems do not meet therequirements for clean, variable air delivery,independent of pressure, and having powerconsumption within the available power budget of afuel cell power system.
VAIREX has used its dry cylinder compressortechnology to develop, under DOE auspices, anintegrated air system capable of meeting the air
requirements for the DOE 50-kW power systemguidelines and beyond. An expander, capable ofrecovering significant energy from the power systemexhaust streams and regulating system pressure, isan integrated part of the VAIREX system. Thisintegrated air system operates within the parasiticpower budget required by the system guidelines.
ApproachComparison of contact (piston) compressor
technology with noncontact (e.g., twin screw orturbine) compressor technology indicated that thepiston approach had significant merit in the areas ofvariable flow control independent of pressure, and oflower power consumption across the operatingrange, especially at the dominant (20–30%)
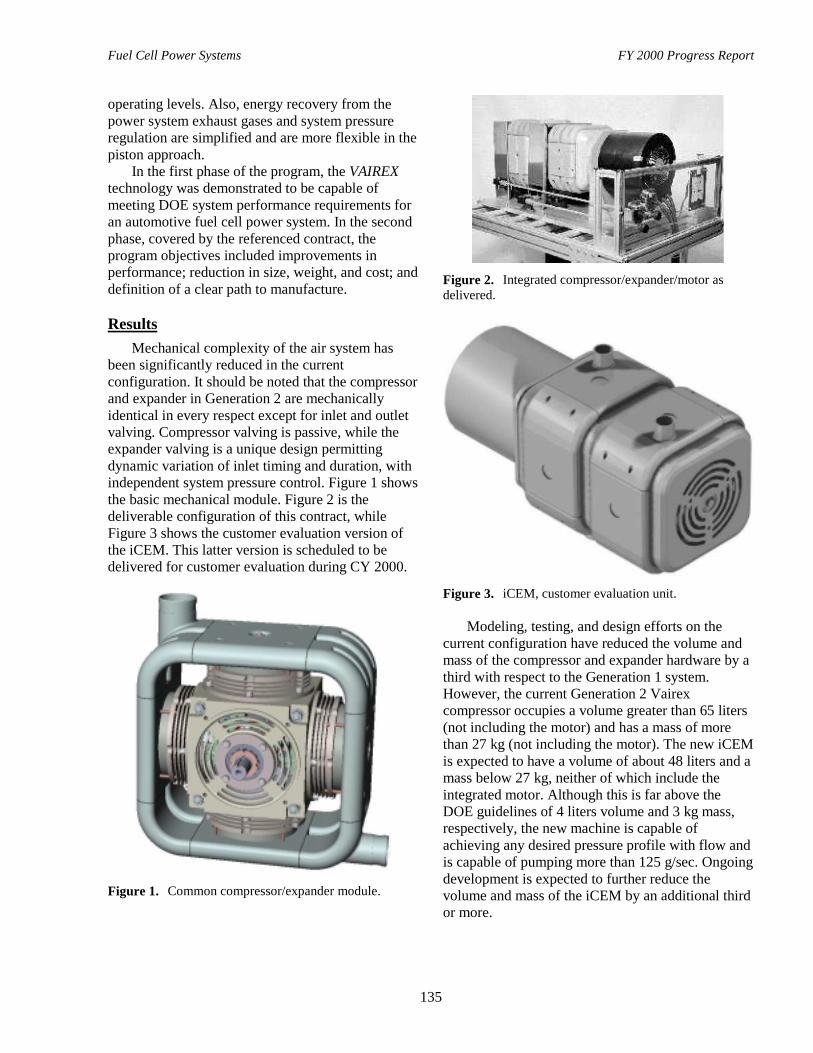
Fuel Cell Power Systems FY 2000 Progress Report
135
operating levels. Also, energy recovery from thepower system exhaust gases and system pressureregulation are simplified and are more flexible in thepiston approach.
In the first phase of the program, the VAIREXtechnology was demonstrated to be capable ofmeeting DOE system performance requirements foran automotive fuel cell power system. In the secondphase, covered by the referenced contract, theprogram objectives included improvements inperformance; reduction in size, weight, and cost; anddefinition of a clear path to manufacture.
ResultsMechanical complexity of the air system has
been significantly reduced in the currentconfiguration. It should be noted that the compressorand expander in Generation 2 are mechanicallyidentical in every respect except for inlet and outletvalving. Compressor valving is passive, while theexpander valving is a unique design permittingdynamic variation of inlet timing and duration, withindependent system pressure control. Figure 1 showsthe basic mechanical module. Figure 2 is thedeliverable configuration of this contract, whileFigure 3 shows the customer evaluation version ofthe iCEM. This latter version is scheduled to bedelivered for customer evaluation during CY 2000.
Figure 1. Common compressor/expander module.
Figure 2. Integrated compressor/expander/motor asdelivered.
Figure 3. iCEM, customer evaluation unit.
Modeling, testing, and design efforts on thecurrent configuration have reduced the volume andmass of the compressor and expander hardware by athird with respect to the Generation 1 system.However, the current Generation 2 Vairexcompressor occupies a volume greater than 65 liters(not including the motor) and has a mass of morethan 27 kg (not including the motor). The new iCEMis expected to have a volume of about 48 liters and amass below 27 kg, neither of which include theintegrated motor. Although this is far above theDOE guidelines of 4 liters volume and 3 kg mass,respectively, the new machine is capable ofachieving any desired pressure profile with flow andis capable of pumping more than 125 g/sec. Ongoingdevelopment is expected to further reduce thevolume and mass of the iCEM by an additional thirdor more.
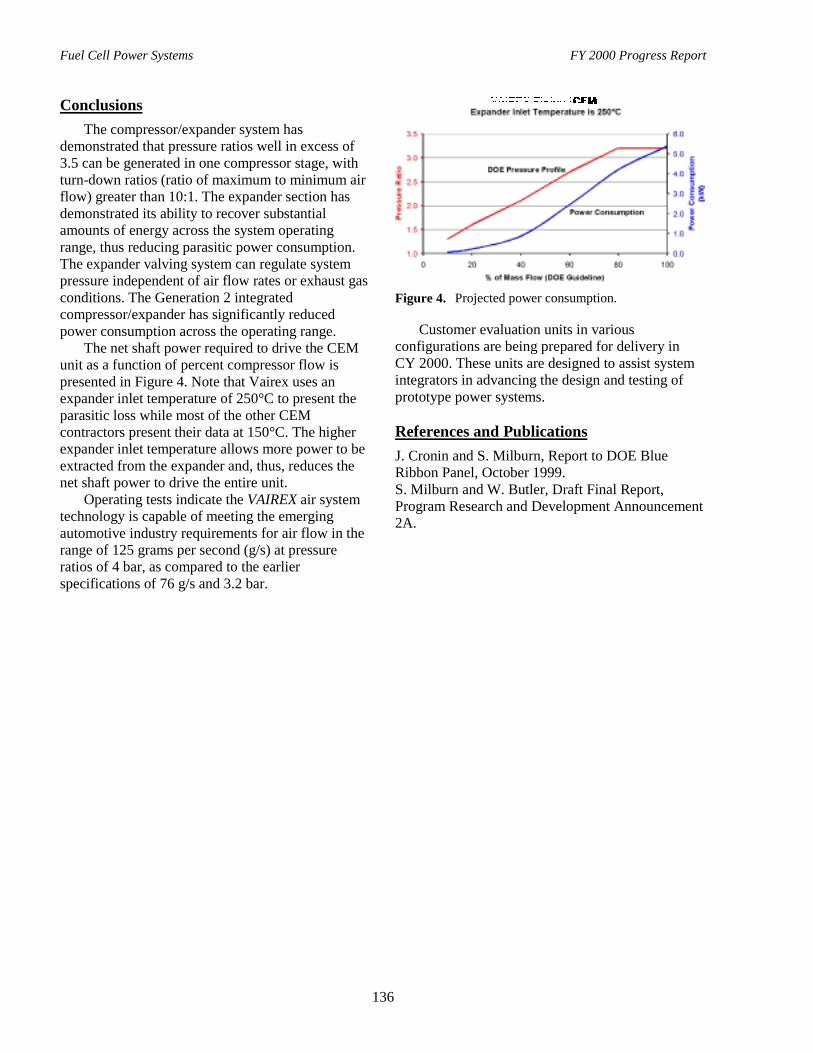
Fuel Cell Power Systems FY 2000 Progress Report
136
ConclusionsThe compressor/expander system has
demonstrated that pressure ratios well in excess of3.5 can be generated in one compressor stage, withturn-down ratios (ratio of maximum to minimum airflow) greater than 10:1. The expander section hasdemonstrated its ability to recover substantialamounts of energy across the system operatingrange, thus reducing parasitic power consumption.The expander valving system can regulate systempressure independent of air flow rates or exhaust gasconditions. The Generation 2 integratedcompressor/expander has significantly reducedpower consumption across the operating range.
The net shaft power required to drive the CEMunit as a function of percent compressor flow ispresented in Figure 4. Note that Vairex uses anexpander inlet temperature of 250°C to present theparasitic loss while most of the other CEMcontractors present their data at 150°C. The higherexpander inlet temperature allows more power to beextracted from the expander and, thus, reduces thenet shaft power to drive the entire unit.
Operating tests indicate the VAIREX air systemtechnology is capable of meeting the emergingautomotive industry requirements for air flow in therange of 125 grams per second (g/s) at pressureratios of 4 bar, as compared to the earlierspecifications of 76 g/s and 3.2 bar.
Figure 4. Projected power consumption.
Customer evaluation units in variousconfigurations are being prepared for delivery inCY 2000. These units are designed to assist systemintegrators in advancing the design and testing ofprototype power systems.
References and PublicationsJ. Cronin and S. Milburn, Report to DOE BlueRibbon Panel, October 1999.S. Milburn and W. Butler, Draft Final Report,Program Research and Development Announcement2A.

Fuel Cell Power Systems FY 2000 Progress Report
137
D. Turbocompressor for Vehicular Fuel Cell Service
G. Fonda-BonardiMeruit, Inc., 1450 23rd St., Santa Monica, CA 90404-2902(310) 453-3259, fax: (310) 828-5830, e-mail: [email protected]
DOE Program Manager: Patrick Davis(202) 586-8061, fax: (202) 586-9811, e-mail: [email protected]
ANL Technical Advisor: Robert Sutton(630) 252-4321, fax: (630) 252-4176, e-mail: [email protected]
Contractor: Meruit, Inc.Prime Contract No. DE-FC02-97EE-50480, October 1997-December 2000Subcontractor: FD Contours, Costa Mesa, California
Objectives• Validate the design and performance of the gas bearings for the turbocompressor.
• Validate the design and performance of the expander and compressor for fuel cell service.
OAAT R&D Plan: Task 13; Barrier D
Approach• Design, build, and test a specialized, instrumented test rig for measuring the performance of a new, high-
performance gas bearing.• After completion of the bearing tests, use the test rig to measure the performance of the Department of Energy
(DOE)/Argonne National Laboratory near-frictionless carbon (NFC) coating.
• Design, build, and test the prototype of a turbocompressor supplying 76 g/s of air and optimized for service witha 50-kW (net) fuel cell.
Accomplishments• The gas bearings perform essentially as predicted and are suitable for use in the turbocompressor.
• The test rig is available for further use by DOE for testing the NFC coating.
• The desirable characteristics of a turbocompressor have been quantified, and specialized software for thedetailed design has been written.
• Engineering drawings for the fabrication of the prototype turbocompressor have been released.
Future DirectionsBuild and test the turbocompressor prototype.
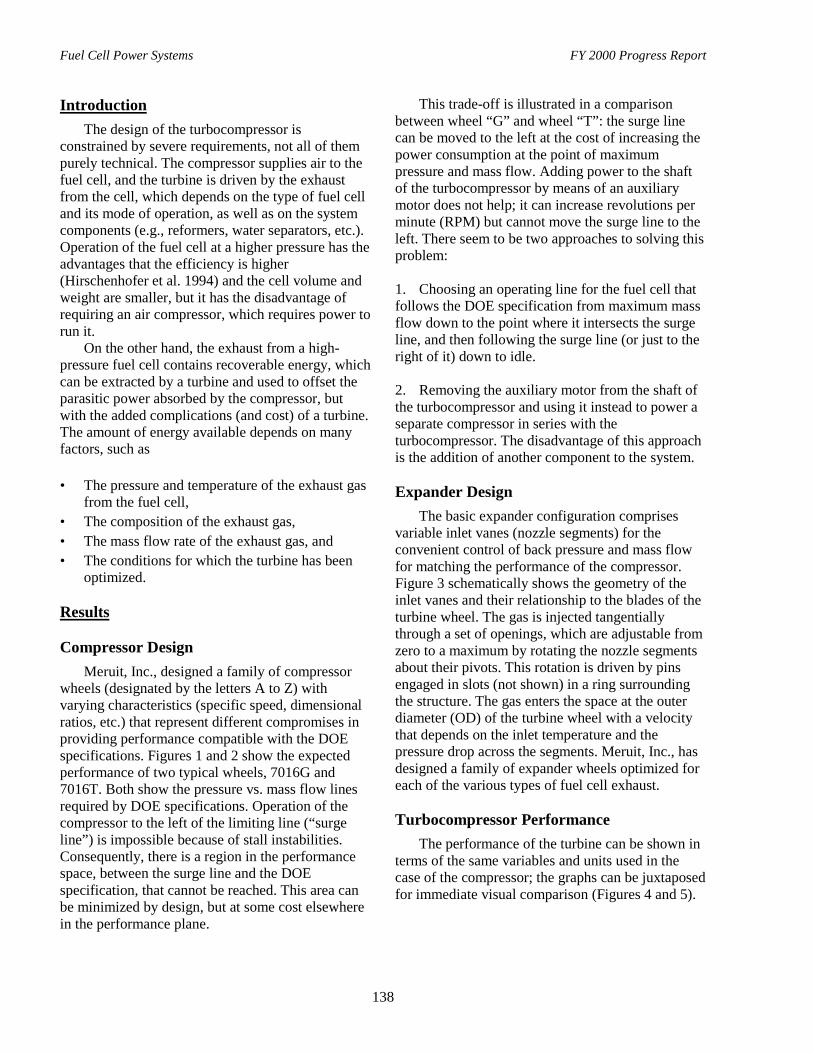
Fuel Cell Power Systems FY 2000 Progress Report
138
IntroductionThe design of the turbocompressor is
constrained by severe requirements, not all of thempurely technical. The compressor supplies air to thefuel cell, and the turbine is driven by the exhaustfrom the cell, which depends on the type of fuel celland its mode of operation, as well as on the systemcomponents (e.g., reformers, water separators, etc.).Operation of the fuel cell at a higher pressure has theadvantages that the efficiency is higher(Hirschenhofer et al. 1994) and the cell volume andweight are smaller, but it has the disadvantage ofrequiring an air compressor, which requires power torun it.
On the other hand, the exhaust from a high-pressure fuel cell contains recoverable energy, whichcan be extracted by a turbine and used to offset theparasitic power absorbed by the compressor, butwith the added complications (and cost) of a turbine.The amount of energy available depends on manyfactors, such as
• The pressure and temperature of the exhaust gasfrom the fuel cell,
• The composition of the exhaust gas,• The mass flow rate of the exhaust gas, and• The conditions for which the turbine has been
optimized.
Results
Compressor DesignMeruit, Inc., designed a family of compressor
wheels (designated by the letters A to Z) withvarying characteristics (specific speed, dimensionalratios, etc.) that represent different compromises inproviding performance compatible with the DOEspecifications. Figures 1 and 2 show the expectedperformance of two typical wheels, 7016G and7016T. Both show the pressure vs. mass flow linesrequired by DOE specifications. Operation of thecompressor to the left of the limiting line (“surgeline”) is impossible because of stall instabilities.Consequently, there is a region in the performancespace, between the surge line and the DOEspecification, that cannot be reached. This area canbe minimized by design, but at some cost elsewherein the performance plane.
This trade-off is illustrated in a comparisonbetween wheel “G” and wheel “T”: the surge linecan be moved to the left at the cost of increasing thepower consumption at the point of maximumpressure and mass flow. Adding power to the shaftof the turbocompressor by means of an auxiliarymotor does not help; it can increase revolutions perminute (RPM) but cannot move the surge line to theleft. There seem to be two approaches to solving thisproblem:
1. Choosing an operating line for the fuel cell thatfollows the DOE specification from maximum massflow down to the point where it intersects the surgeline, and then following the surge line (or just to theright of it) down to idle.
2. Removing the auxiliary motor from the shaft ofthe turbocompressor and using it instead to power aseparate compressor in series with theturbocompressor. The disadvantage of this approachis the addition of another component to the system.
Expander DesignThe basic expander configuration comprises
variable inlet vanes (nozzle segments) for theconvenient control of back pressure and mass flowfor matching the performance of the compressor.Figure 3 schematically shows the geometry of theinlet vanes and their relationship to the blades of theturbine wheel. The gas is injected tangentiallythrough a set of openings, which are adjustable fromzero to a maximum by rotating the nozzle segmentsabout their pivots. This rotation is driven by pinsengaged in slots (not shown) in a ring surroundingthe structure. The gas enters the space at the outerdiameter (OD) of the turbine wheel with a velocitythat depends on the inlet temperature and thepressure drop across the segments. Meruit, Inc., hasdesigned a family of expander wheels optimized foreach of the various types of fuel cell exhaust.
Turbocompressor PerformanceThe performance of the turbine can be shown in
terms of the same variables and units used in thecase of the compressor; the graphs can be juxtaposedfor immediate visual comparison (Figures 4 and 5).

Fuel Cell Power Systems FY 2000 Progress Report
139
Figu
re 1
. C
ompr
esso
r 701
6G
Fig
ure
2. C
ompr
esso
r 701
6T

Fuel Cell Power Systems FY 2000 Progress Report
140
Figure 3. Variable inlet geometry.
The turbine performance graph, showing lines ofconstant nozzle aperture, is limited to the left by thesurge line of the compressor that supplies the air,even though the expander itself has no suchlimitations: the expander must process what comesfrom the fuel cell (i.e., the air supplied by thecompressor, plus hydrogen and minus water, if suchis the case). The compressor graph now shows the
line corresponding to 100% open nozzles: no moreflow can be demanded than can be processedthrough the expander. Hence, the operating area forthe turbocompressor is constrained by the surge lineon one side and the 100% open nozzle line on theother. Within this area, a given point (pressure, massflow) will correspond to certain well-defined valuesof RPM and nozzle opening. Conversely, each valueof RPM and nozzle opening corresponds to adefinite operating point; these are independentvariables that can be used in a feedback loop tocontrol the operation of the fuel cell.
ConclusionTask 1 of the contract (validation of the gas
bearings) is completed. The first part of Task 2(design of a turbocompressor for vehicular fuelcells) is completed, and the expected performancehas been quantified and reported. The second part ofTask 2 (construction and testing of theturbocompressor) is under way.
BibliographyJ.H. Hirschenhofer et al., Fuel Cells: A Handbook(Revision 3), U.S. Department of Energy,Morgantown Energy Technology Center,DOE/METC-94-1006, 1994.

Fuel Cell Power Systems FY 2000 Progress Report
141
Figu
re 4
. Ex
pand
er 7
016F
and
Com
pres
sor 7
016T
Per
form
ance
at 3
70°C
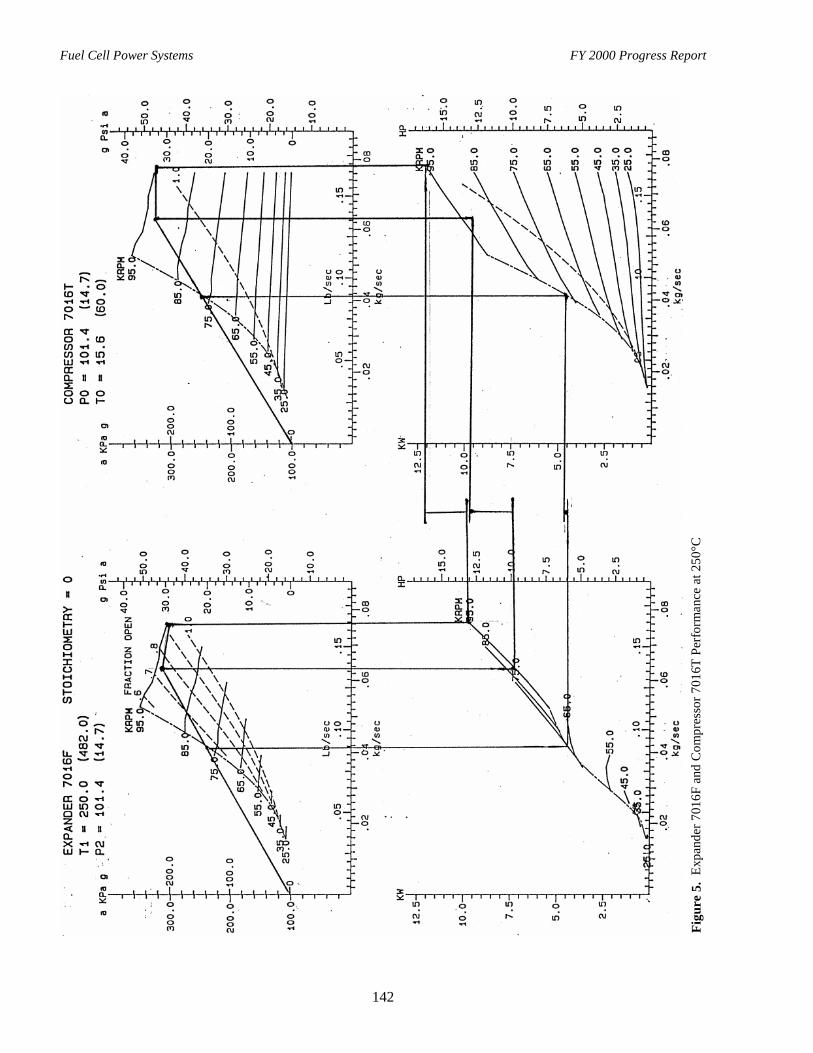
Fuel Cell Power Systems FY 2000 Progress Report
142
Figu
re 5
. Ex
pand
er 7
016F
and
Com
pres
sor 7
016T
Per
form
ance
at 2
50°C
Fuel Cell Power Systems FY 2000 Progress Report
143
E. Innovative, High-Efficiency Integrated Compressor/Expander Based onTIVM Geometry
Sterling Bailey, Ph.D., PE (primary contact) and Steve ChomyszakMechanology, LLC, 8 North Main Street, Suite 403, Attleboro, MA 02703(508) 223-1920, fax: (508) 226-3697, e-mail: [email protected], [email protected]
DOE Program Manager: Patrick Davis(202) 586-8061, fax: (202) 586-9811, e-mail: [email protected]
ANL Technical Advisor: George Fenske(630) 252-5190, fax: (630) 252-4798, e-mail: [email protected]
Contractor: Mechanology, LLC, Attleboro, MassachusettsPrime Contract Nos. 991602401 and OF-00505, June 1999-December 2000
Objectives• Design an integrated compressor/expander based on the Toroidal Intersecting Vane Machine (TIVM) geometry,
following the Department of Energy (DOE) 50-kWe automotive fuel cell guidelines.• Predict the performance of the TIVM compressor/expander over the operating range specified in the DOE
guidelines.
• Identify the technology developments necessary for this component.
• Fabricate and test a first-generation prototype TIVM compressor/expander.
OAAT R&D Plan: Task 13; Barrier D
Approach• Modify the geometric design parameters of the TIVM concept to provide a design consistent with the DOE
guidelines for a 50-kWe automotive fuel cell system.• Develop an engineering simulation model of the design to predict key performance parameters for specified
operating conditions and to examine sensitivities to design assumptions.
• Analyze the performance of the design across the DOE-specified operating range.
• Determine the performance impact of variations in friction and leakage characteristics.
• Identify the major uncertainties in achieving the predicted performance and the technology developmentsnecessary to meet the DOE guidelines.
• Design, build, and test a first-generation prototype compressor/expander to confirm the basic operatingcharacteristics of the design and to guide further design refinement.
• Plan and initiate development for the key technology requirements.
Accomplishments• A TIVM compressor/expander was designed to meet the DOE guidelines.
• A performance prediction model was developed and mathematically validated.
• The design’s performance was analyzed across the operating range.
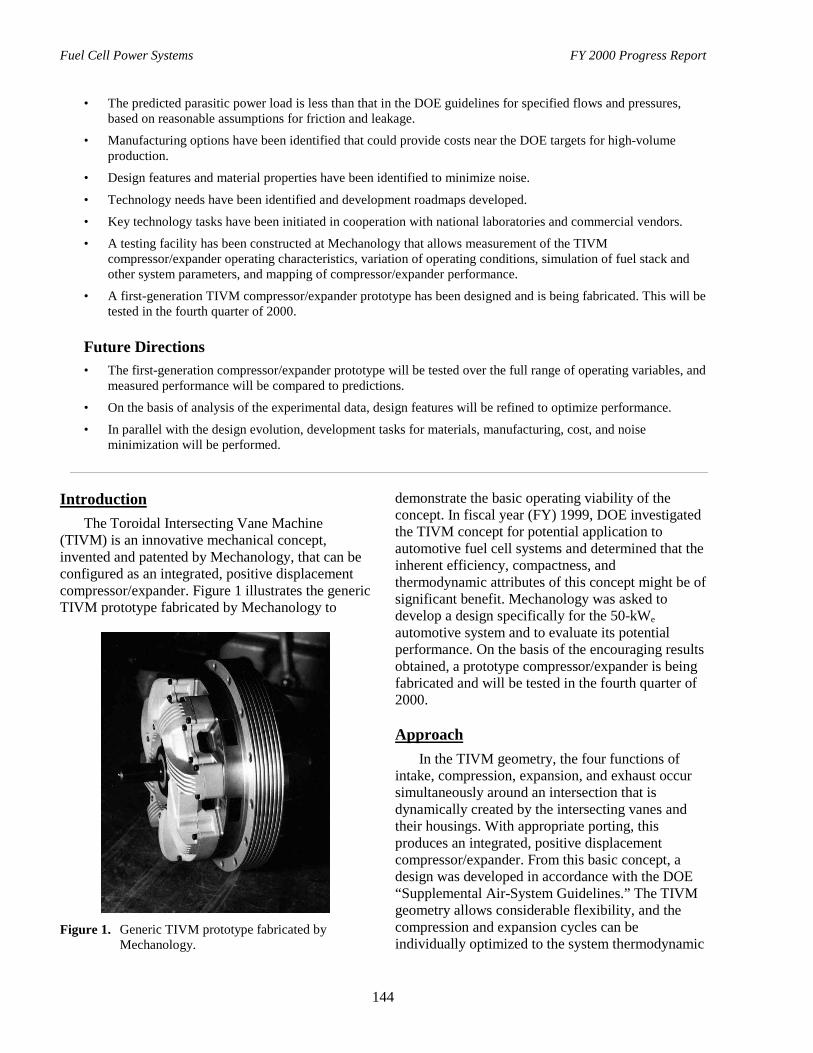
Fuel Cell Power Systems FY 2000 Progress Report
144
• The predicted parasitic power load is less than that in the DOE guidelines for specified flows and pressures,based on reasonable assumptions for friction and leakage.
• Manufacturing options have been identified that could provide costs near the DOE targets for high-volumeproduction.
• Design features and material properties have been identified to minimize noise.
• Technology needs have been identified and development roadmaps developed.
• Key technology tasks have been initiated in cooperation with national laboratories and commercial vendors.
• A testing facility has been constructed at Mechanology that allows measurement of the TIVMcompressor/expander operating characteristics, variation of operating conditions, simulation of fuel stack andother system parameters, and mapping of compressor/expander performance.
• A first-generation TIVM compressor/expander prototype has been designed and is being fabricated. This will betested in the fourth quarter of 2000.
Future Directions• The first-generation compressor/expander prototype will be tested over the full range of operating variables, and
measured performance will be compared to predictions.
• On the basis of analysis of the experimental data, design features will be refined to optimize performance.
• In parallel with the design evolution, development tasks for materials, manufacturing, cost, and noiseminimization will be performed.
IntroductionThe Toroidal Intersecting Vane Machine
(TIVM) is an innovative mechanical concept,invented and patented by Mechanology, that can beconfigured as an integrated, positive displacementcompressor/expander. Figure 1 illustrates the genericTIVM prototype fabricated by Mechanology to
Figure 1. Generic TIVM prototype fabricated byMechanology.
demonstrate the basic operating viability of theconcept. In fiscal year (FY) 1999, DOE investigatedthe TIVM concept for potential application toautomotive fuel cell systems and determined that theinherent efficiency, compactness, andthermodynamic attributes of this concept might be ofsignificant benefit. Mechanology was asked todevelop a design specifically for the 50-kWeautomotive system and to evaluate its potentialperformance. On the basis of the encouraging resultsobtained, a prototype compressor/expander is beingfabricated and will be tested in the fourth quarter of2000.
ApproachIn the TIVM geometry, the four functions of
intake, compression, expansion, and exhaust occursimultaneously around an intersection that isdynamically created by the intersecting vanes andtheir housings. With appropriate porting, thisproduces an integrated, positive displacementcompressor/expander. From this basic concept, adesign was developed in accordance with the DOE“Supplemental Air-System Guidelines.” The TIVMgeometry allows considerable flexibility, and thecompression and expansion cycles can beindividually optimized to the system thermodynamic
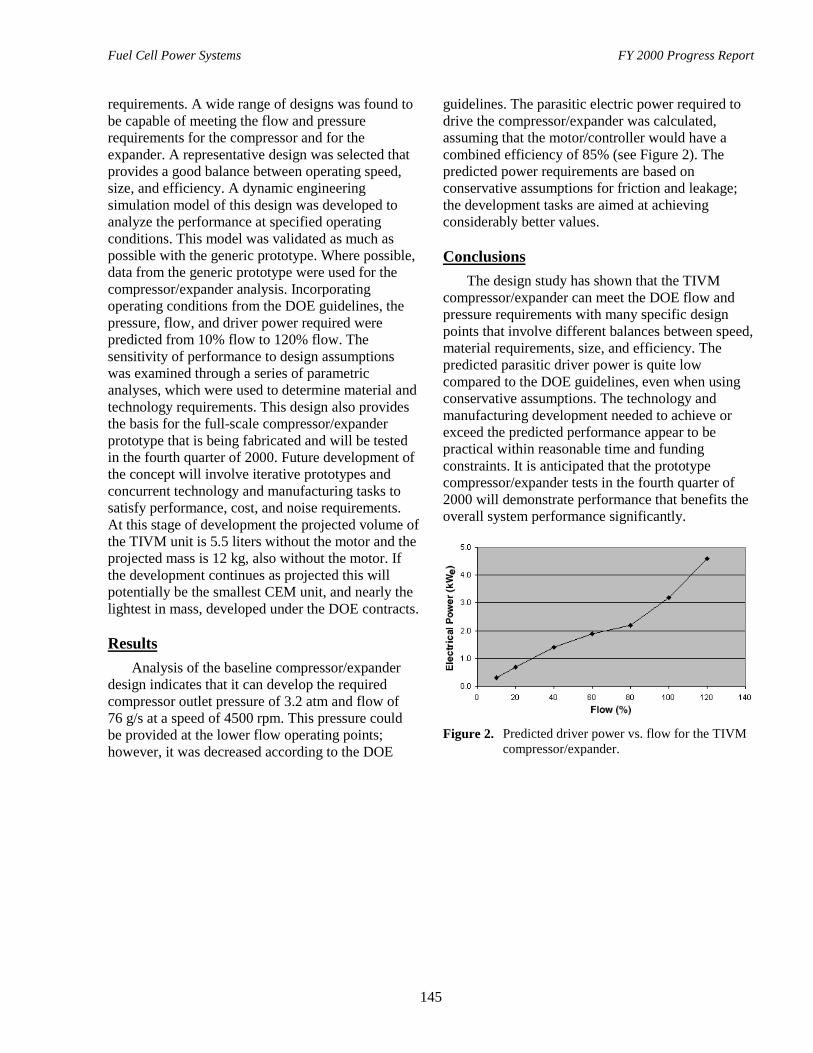
Fuel Cell Power Systems FY 2000 Progress Report
145
requirements. A wide range of designs was found tobe capable of meeting the flow and pressurerequirements for the compressor and for theexpander. A representative design was selected thatprovides a good balance between operating speed,size, and efficiency. A dynamic engineeringsimulation model of this design was developed toanalyze the performance at specified operatingconditions. This model was validated as much aspossible with the generic prototype. Where possible,data from the generic prototype were used for thecompressor/expander analysis. Incorporatingoperating conditions from the DOE guidelines, thepressure, flow, and driver power required werepredicted from 10% flow to 120% flow. Thesensitivity of performance to design assumptionswas examined through a series of parametricanalyses, which were used to determine material andtechnology requirements. This design also providesthe basis for the full-scale compressor/expanderprototype that is being fabricated and will be testedin the fourth quarter of 2000. Future development ofthe concept will involve iterative prototypes andconcurrent technology and manufacturing tasks tosatisfy performance, cost, and noise requirements.At this stage of development the projected volume ofthe TIVM unit is 5.5 liters without the motor and theprojected mass is 12 kg, also without the motor. Ifthe development continues as projected this willpotentially be the smallest CEM unit, and nearly thelightest in mass, developed under the DOE contracts.
ResultsAnalysis of the baseline compressor/expander
design indicates that it can develop the requiredcompressor outlet pressure of 3.2 atm and flow of76 g/s at a speed of 4500 rpm. This pressure couldbe provided at the lower flow operating points;however, it was decreased according to the DOE
guidelines. The parasitic electric power required todrive the compressor/expander was calculated,assuming that the motor/controller would have acombined efficiency of 85% (see Figure 2). Thepredicted power requirements are based onconservative assumptions for friction and leakage;the development tasks are aimed at achievingconsiderably better values.
ConclusionsThe design study has shown that the TIVM
compressor/expander can meet the DOE flow andpressure requirements with many specific designpoints that involve different balances between speed,material requirements, size, and efficiency. Thepredicted parasitic driver power is quite lowcompared to the DOE guidelines, even when usingconservative assumptions. The technology andmanufacturing development needed to achieve orexceed the predicted performance appear to bepractical within reasonable time and fundingconstraints. It is anticipated that the prototypecompressor/expander tests in the fourth quarter of2000 will demonstrate performance that benefits theoverall system performance significantly.
Figure 2. Predicted driver power vs. flow for the TIVMcompressor/expander.

Fuel Cell Power Systems FY 2000 Progress Report
146
Fuel Cell Power Systems FY 2000 Progress Report
147
VII. HYDROGEN STORAGE1,2
A. High-Pressure Conformable Hydrogen Storage for Fuel Cell Vehicles
Andy HaalandThiokol PropulsionP.O. Box 707, M/S 230Brigham City, UT 84302-0707(435) 863-6373, fax: (435) 863-8782, e-mail: [email protected]
DOE Program Managers: Sigmund Gronich and JoAnn Milliken(202) 586-1623, fax: (202) 586-5127, e-mail: [email protected](202) 586-2480, fax: (202) 586-9811, e-mail: [email protected]
LLNL Technical Advisor: Andrew Weisberg(925) 422-7293, fax: (925) 424-3731, e-mail: [email protected]
ANL Technical Advisor: Walter Podolski(630) 252-7558, fax: (630) 972-4430, e-mail: [email protected]
Contractor: Thiokol Propulsion, Brigham City, UtahPrime Contract No. DE-FC02-97EE-50484, May 1997-May 2000Subcontractors: Aero Tec Laboratories, Inc., Ramsey, NJ; Rotational Molding of Utah, Brigham City, UT; andPowertech Testing Labs, Surrey, B.C., Canada
Objectives
• Demonstrate ability to fabricate lightweight, noncylindrical pressure vessels capable of storing hydrogen gas at5,000 psig. These vessels have been termed “conformable tanks” because they provide the option of configuringthe tank geometry to conform to a given fuel storage envelope on a vehicle.
• Demonstrate ability of conformable tanks to meet an industry design standard for gaseous fuel storage. In theabsence of an industry-accepted specification for hydrogen gas storage, the NGV2-1998 ANSI standard[modified for 5,000 pounds per square inch, gauge (psig)] was chosen as the design standard for this effort.
OAAT R&D Plan: Task 1; Barrier I
Approach
• Develop technology necessary to produce a plastic-lined, composite-overwrap Type IV tank, using subscaletanks and simple cylindrical geometries.
• Incorporate technology advancements into a subscale, two-cell Type IV conformable tank that will be tested forstructural integrity.
• Demonstrate the structural integrity of conformable tank technology on a full-scale tank designed to fit within astorage envelope of 12.8 in. × 21.2 in. × 27.9 in., with a capacity of 3.4 lb of hydrogen. This tank envelope isconsistent with space constraints on Ford’s P2000 fuel cell vehicle.
1 The Hydrogen Storage System Development Projects are cofunded by the DOE Office of Transporation Technologies
and the Office of Power Technologies Hydrogen Program.2 The new draft DOE technical targets for on-board hydrogen storage can be found in Table 6, Appendix B.
Fuel Cell Power Systems FY 2000 Progress Report
148
• Subject full-scale tanks to tests defined in the NGV2-1998 standard (modified for 5,000 psig) that best identifyand address critical safety and durability issues for the tank design.
Accomplishments• Subscale tank development allowed key technologies to be identified for conformable tank manufacture.
• Subscale conformable tank testing demonstrated structural integrity of the tank and validated the designapproach.
• Full-scale tank testing demonstrated the tank’s ability to operate at 5,000 psig, with a burst safety factor greaterthan 2.25.
• Full-scale testing of tanks to the drop, penetration, accelerated stress rupture, environmental, and temperaturecycling criteria outlined did not reveal any design issues with the current conformable tank design. All testswere successfully passed according to the criteria outlined in the standard (modified for 5,000 psig).
Future Directions
This contract has been completed. An additional proposal has been submitted for a follow-on effort. Future taskswill be completed either on the follow-on contract or using Thiokol discretionary funding. Additional future effortsare defined below:
• Complete the remaining tests on the full-scale tank, outlined in the NGV2-1998 standard.
• Extend the conformable tank design to operate at 10,000 psig.
• Incorporate component and manufacturing cost improvements into the existing tank design.
IntroductionOn-board high-pressure storage of hydrogen for
fuel-cell-powered vehicles presents a number oftechnical and economic challenges. Because theenergy density of hydrogen is significantly less thanthat of conventional fuels, larger tanks are requiredfor equivalent range. Furthermore, the geometry oftraditional high-pressure cylinders generally doesnot conform to the available space on the vehicle,thereby raising tank packaging issues. Tank cost andweight also significantly influence the amount offuel that can be carried.
Thiokol is addressing these issues through thedevelopment of high-pressure conformable tanks foron-board hydrogen storage. The lightest-weightapproach uses high-strength, filament-wound carbonfiber composite for structural efficiency, with plasticliners to act as permeation barriers. Thiokol’sconformable storage concept uses multiple cells,with the number and shape of the cells tailored tomaximize internal volume within a rectangularenvelope while maintaining membrane loading forstructural efficiency. Each cell is filament-woundwith a combination of hoop and helical layers,followed by a hoop overwrap over the assemblage of
cells. Depending on the shape of the envelope, up to50% more storage is possible with a conformabletank than with cylinders.
ApproachThe full-scale tank under development is a two-
cell configuration that fits in an envelope 12.8 in. ×21.2 in. × 27.9 in., with a capacity of 3.4 lb ofhydrogen. The conformable tank provides 23% morecapacity than two cylinders in the same volumeenvelope. An optional third cell would increase thetank width to 29.6 in. and the capacity to 4.8 lb ofhydrogen. Tank envelopes are consistent with spaceconstraints on Ford’s P2000 fuel cell vehicle.
The tank is designed for a service pressure of5,000 psi, with a burst safety factor of 2.25,consistent with existing standards for high-pressurevehicle fuel tanks. Activities completed in fiscalyear (FY) 1999 included full-scale tank design,structural capability demonstration, and linermaterial evaluation and selection.
Successful completion of FY 1999 activitiesdemonstrated the primary functional requirement fora full-scale, high-pressure conformable hydrogentank: the capability for safely withstanding the
Fuel Cell Power Systems FY 2000 Progress Report
149
service pressure of 5,000 psi. However, additionalrequirements must be satisfied to demonstrate safeand reliable operation of the tank within the motorvehicle environment. Over a lifetime of service, thetank will experience cyclic loading due to repeatedfills, extremes of temperature, exposure to corrosivefluids, potential damage both during handling andvehicle operation, and possible creep and stressrupture due to sustained high-pressure loading.
The ANSI/AGA NGV2-1998 standard providesa comprehensive set of design and qualification testrequirements for compressed natural gas (CNG)vehicle fuel tanks to ensure safe operation over theirlifetime. In the absence of a comprehensive standardfor hydrogen vehicle fuel tanks, and because of theirsimilarity to CNG tanks, Thiokol will use NGV2-1998 qualification requirements (modified for tankoperation at 5,000 psig) as the basis for safety anddurability testing and evaluation under the presentprogram.
The primary approach employed in FY 2000efforts is to subject a total of six tanks producedusing the technology developed in FY 1999 toqualification testing based on NGV2-1998 (modifiedfor 5,000 psig tank operation) to identify andaddress critical safety and durability issues.
ResultsA total of six two-cell conformable tanks were
fabricated and delivered to Powertech Laboratoriesin Surrey, British Columbia, Canada, for testing.The tests conducted, defined in the NGV2-1998standard, included temperature cycling, acceleratedstress rupture, drop, environmental, penetration, andpermeation data. Test criteria for the completeNGV2-1998 standard and results obtained on the sixtanks are summarized in Table 1.
ConclusionsThiokol has successfully designed and
demonstrated a two-cell conformable tank capableof storing hydrogen at 5,000 psig (5.5 wt.% H2) thatwill meet the design criteria of the NGV2-1998standard. Additional testing will be required tocertify the design to the NGV2-1998 standard.Additional challenges for this effort includeincreasing the tank operating pressure to 10,000 psigand incorporation of lower-cost manufacturingcomponents and techniques. Increasing the pressureto 10,000 psig increases the amount of hydrogenstored by about 70%, but because of the increasedamount of carbon fiber required, the weightpercentage of hydrogen remains about the same.
Table 1. Conformable hydrogen tank test criteria and results.
Test Criteria for Successful Testa ResultBurst Safety factor of 2.25 * 5,000 psig = 11,250 psig PassAmbient cycle 15,000 cycles without failure: 45,000 cycles without rupture to 1.25 safety
factor * 5,000 psig = 6,250 psigPass
Environmental cycling Subject to fluid exposure, pendulum impact, gravel impact,high/low/ambient temperature cycling, burst above 9,000 psig
Pass
Flaw tolerance Machined flaws followed by cycling (15,000 cycles to 6,250 psig) Not testedb
Drop A total of six drops from a height of 6 ft, followed by ambient cycling of15,000 cycles to 6,250 psig
Pass
Penetration Bullet penetration of tank pressurized to 5,000 psig with hydrogen. Tankmust not fragment.
Pass
Permeation Specified leak rate for hydrogen 1.2 scc/LAhBonfire Must safely vent Not testedHydrogen gas cycling 1,000 cycles with hydrogen to 5,000 psig, followed by leak test and
destructive inspectionNot tested
Accelerated stressrupture
Tank pressurized to 6,250 psig and held at pressure for 1,000 hours at149ºF. At conclusion, tank must burst above 8,438 psig.
Pass
a Requirements for a tank with 5,000-psig service pressure and 20-year service life.b Tank expected to pass this test, based on positive results for a CNG tank of similar design operating at 3,600 psig.

Fuel Cell Power Systems FY 2000 Progress Report
150
B. Advanced Chemical Hydride Hydrogen-Generation/Storage System forPEM Fuel Cell Vehicles
Andrew W. McClaine (primary contact), Ronald W. Breault, Christopher Larsen, Ravi Konduri,Jonathan Rolfe, and Fred BeckerThermo Technologies (a Thermo Electron Company)P.O. Box 904645 First AvenueWaltham, MA 02454-9046(781) 622-1032, fax: (781) 622-1025, e-mail: [email protected]
DOE Program Managers: Sigmund Gronich and JoAnn Milliken(202) 586-1623, fax: (202) 586-5127, e-mail: [email protected](202) 586-2480, fax: (202) 586-9811, e-mail: [email protected]
LLNL Technical Advisor: Andrew Weisberg(925) 422-7293, fax: (925) 424-3731, e-mail: [email protected]
ANL Technical Advisor: Walter Podolski(630) 252-7558, fax: (630) 972-4430, e-mail: [email protected]
Contractor: U.S. Department of Energy (DOE)Prime Contract No. DE-FC02-97EE50483, September 30, 1997-June 30, 2000Cofunding provided by the California South Coast Air Quality Management District,Contract No. 98111
Objectives
Develop hydrogen storage and delivery system for the transportation sector, based on the use of chemical-hydrideslurry technology, and deliver a 50-kWe-equivalent hydrogen supply.
OAAT R&D Plan: Task 1; Barrier I
Approach• Complete the design and fabrication of the prototype hydrogen generation system.
• Evaluate the prototype performance.
• Integrate H2 supply system into operating conditions of simulated fuel cell power source.
• Test and evaluate performance of the final system.
Accomplishments• Produced pumpable lithium hydride slurry that is safe to handle and stable for several months.
• Demonstrated that the hydride slurry can be reacted to generate hydrogen on demand.
• Demonstrated that lithium-hydride-slurry hydrogen generator can meet the demands of a light vehicle followingthe California highway and city protocols.
• Operated hydrogen generator pumps and motors with the hydrogen produced.
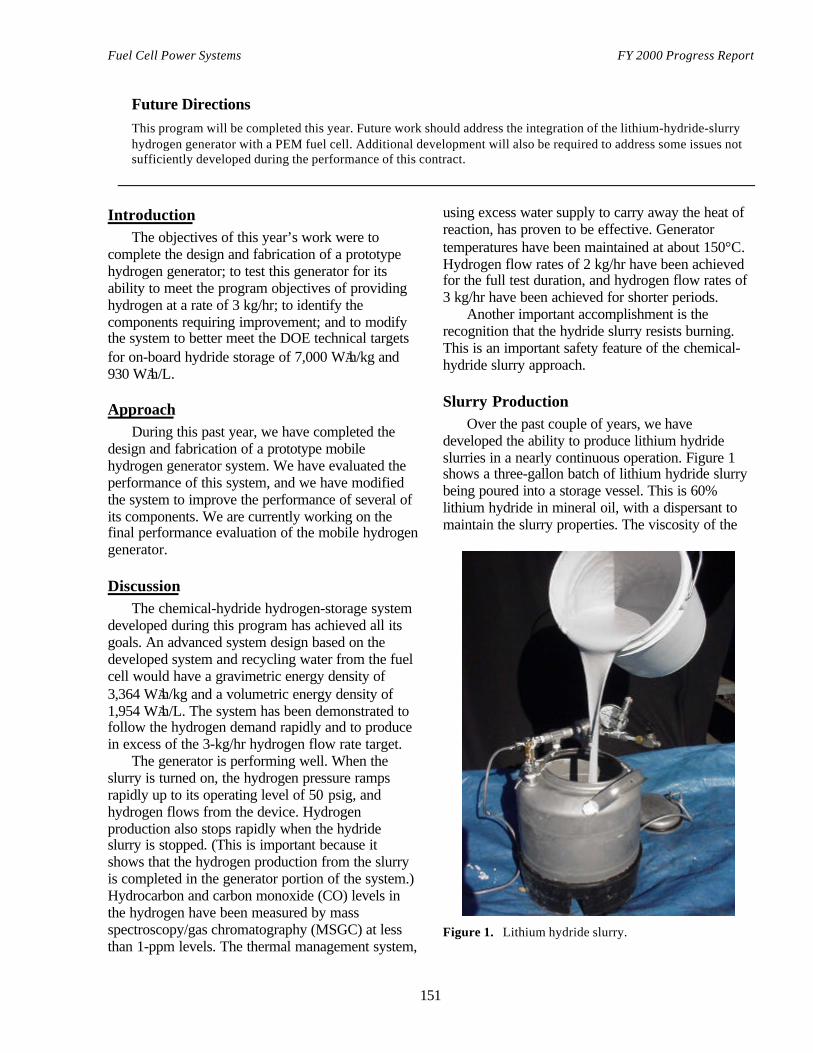
Fuel Cell Power Systems FY 2000 Progress Report
151
Future Directions
This program will be completed this year. Future work should address the integration of the lithium-hydride-slurryhydrogen generator with a PEM fuel cell. Additional development will also be required to address some issues notsufficiently developed during the performance of this contract.
IntroductionThe objectives of this year’s work were to
complete the design and fabrication of a prototypehydrogen generator; to test this generator for itsability to meet the program objectives of providinghydrogen at a rate of 3 kg/hr; to identify thecomponents requiring improvement; and to modifythe system to better meet the DOE technical targetsfor on-board hydride storage of 7,000 WAh/kg and930 WAh/L.
ApproachDuring this past year, we have completed the
design and fabrication of a prototype mobilehydrogen generator system. We have evaluated theperformance of this system, and we have modifiedthe system to improve the performance of several ofits components. We are currently working on thefinal performance evaluation of the mobile hydrogengenerator.
DiscussionThe chemical-hydride hydrogen-storage system
developed during this program has achieved all itsgoals. An advanced system design based on thedeveloped system and recycling water from the fuelcell would have a gravimetric energy density of3,364 WAh/kg and a volumetric energy density of1,954 WAh/L. The system has been demonstrated tofollow the hydrogen demand rapidly and to producein excess of the 3-kg/hr hydrogen flow rate target.
The generator is performing well. When theslurry is turned on, the hydrogen pressure rampsrapidly up to its operating level of 50 psig, andhydrogen flows from the device. Hydrogenproduction also stops rapidly when the hydrideslurry is stopped. (This is important because itshows that the hydrogen production from the slurryis completed in the generator portion of the system.)Hydrocarbon and carbon monoxide (CO) levels inthe hydrogen have been measured by massspectroscopy/gas chromatography (MSGC) at lessthan 1-ppm levels. The thermal management system,
using excess water supply to carry away the heat ofreaction, has proven to be effective. Generatortemperatures have been maintained at about 150°C.Hydrogen flow rates of 2 kg/hr have been achievedfor the full test duration, and hydrogen flow rates of3 kg/hr have been achieved for shorter periods.
Another important accomplishment is therecognition that the hydride slurry resists burning.This is an important safety feature of the chemical-hydride slurry approach.
Slurry ProductionOver the past couple of years, we have
developed the ability to produce lithium hydrideslurries in a nearly continuous operation. Figure 1shows a three-gallon batch of lithium hydride slurrybeing poured into a storage vessel. This is 60%lithium hydride in mineral oil, with a dispersant tomaintain the slurry properties. The viscosity of the
Figure 1. Lithium hydride slurry.
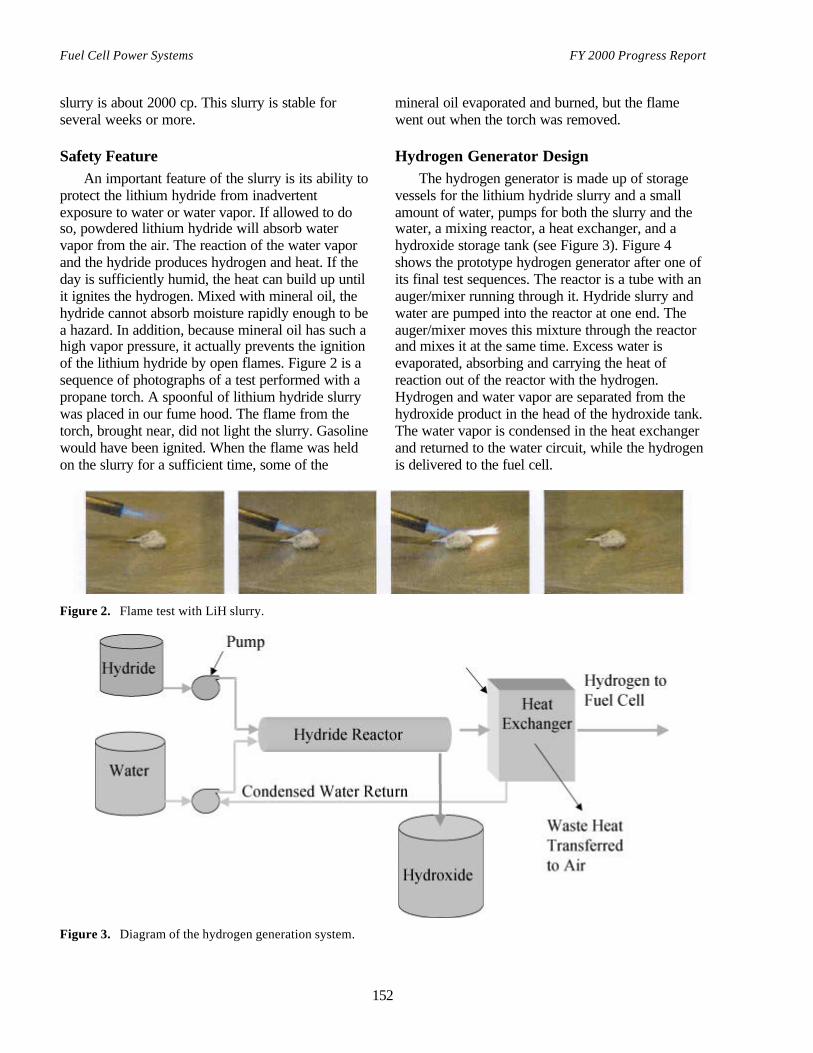
Fuel Cell Power Systems FY 2000 Progress Report
152
slurry is about 2000 cp. This slurry is stable forseveral weeks or more.
Safety FeatureAn important feature of the slurry is its ability to
protect the lithium hydride from inadvertentexposure to water or water vapor. If allowed to doso, powdered lithium hydride will absorb watervapor from the air. The reaction of the water vaporand the hydride produces hydrogen and heat. If theday is sufficiently humid, the heat can build up untilit ignites the hydrogen. Mixed with mineral oil, thehydride cannot absorb moisture rapidly enough to bea hazard. In addition, because mineral oil has such ahigh vapor pressure, it actually prevents the ignitionof the lithium hydride by open flames. Figure 2 is asequence of photographs of a test performed with apropane torch. A spoonful of lithium hydride slurrywas placed in our fume hood. The flame from thetorch, brought near, did not light the slurry. Gasolinewould have been ignited. When the flame was heldon the slurry for a sufficient time, some of the
mineral oil evaporated and burned, but the flamewent out when the torch was removed.
Hydrogen Generator DesignThe hydrogen generator is made up of storage
vessels for the lithium hydride slurry and a smallamount of water, pumps for both the slurry and thewater, a mixing reactor, a heat exchanger, and ahydroxide storage tank (see Figure 3). Figure 4shows the prototype hydrogen generator after one ofits final test sequences. The reactor is a tube with anauger/mixer running through it. Hydride slurry andwater are pumped into the reactor at one end. Theauger/mixer moves this mixture through the reactorand mixes it at the same time. Excess water isevaporated, absorbing and carrying the heat ofreaction out of the reactor with the hydrogen.Hydrogen and water vapor are separated from thehydroxide product in the head of the hydroxide tank.The water vapor is condensed in the heat exchangerand returned to the water circuit, while the hydrogenis delivered to the fuel cell.
Figure 2. Flame test with LiH slurry.
Figure 3. Diagram of the hydrogen generation system.
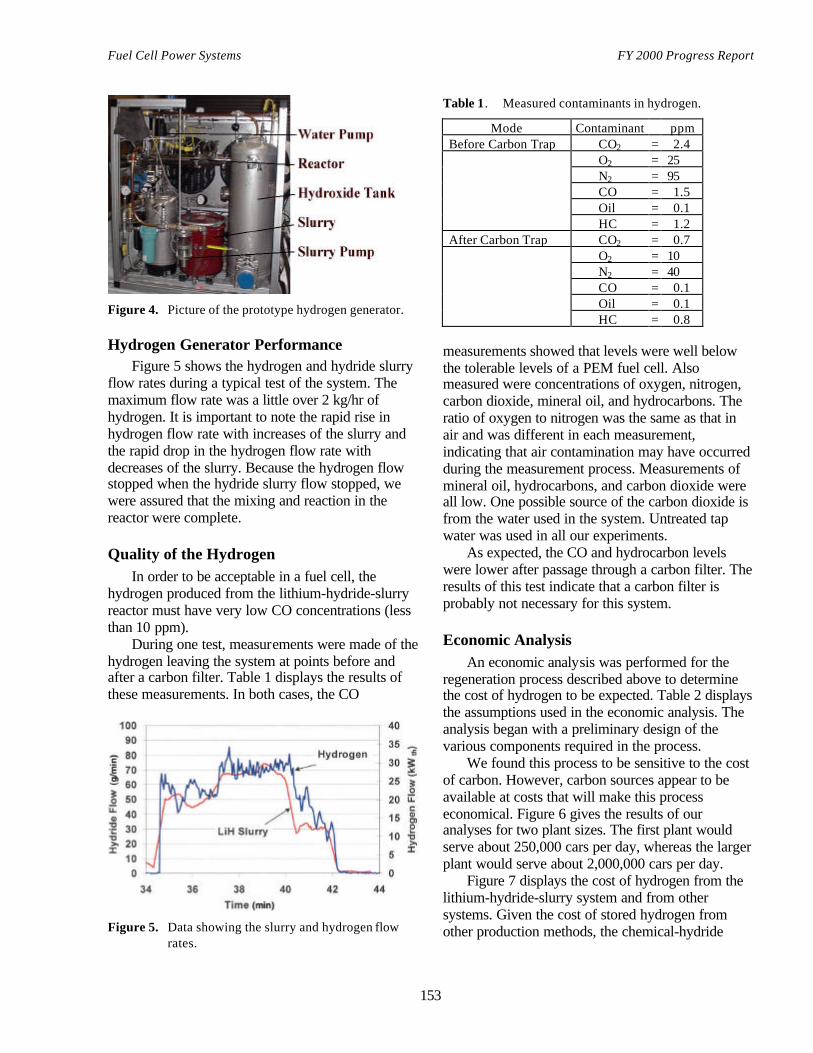
Fuel Cell Power Systems FY 2000 Progress Report
153
Figure 4. Picture of the prototype hydrogen generator.
Hydrogen Generator PerformanceFigure 5 shows the hydrogen and hydride slurry
flow rates during a typical test of the system. Themaximum flow rate was a little over 2 kg/hr ofhydrogen. It is important to note the rapid rise inhydrogen flow rate with increases of the slurry andthe rapid drop in the hydrogen flow rate withdecreases of the slurry. Because the hydrogen flowstopped when the hydride slurry flow stopped, wewere assured that the mixing and reaction in thereactor were complete.
Quality of the HydrogenIn order to be acceptable in a fuel cell, the
hydrogen produced from the lithium-hydride-slurryreactor must have very low CO concentrations (lessthan 10 ppm).
During one test, measurements were made of thehydrogen leaving the system at points before andafter a carbon filter. Table 1 displays the results ofthese measurements. In both cases, the CO
Figure 5. Data showing the slurry and hydrogen flowrates.
Table 1. Measured contaminants in hydrogen.
Mode Contaminant ppmBefore Carbon Trap CO2 = 2.4
O2 = 25N2 = 95CO = 1.5Oil = 0.1HC = 1.2
After Carbon Trap CO2 = 0.7O2 = 10N2 = 40CO = 0.1Oil = 0.1HC = 0.8
measurements showed that levels were well belowthe tolerable levels of a PEM fuel cell. Alsomeasured were concentrations of oxygen, nitrogen,carbon dioxide, mineral oil, and hydrocarbons. Theratio of oxygen to nitrogen was the same as that inair and was different in each measurement,indicating that air contamination may have occurredduring the measurement process. Measurements ofmineral oil, hydrocarbons, and carbon dioxide wereall low. One possible source of the carbon dioxide isfrom the water used in the system. Untreated tapwater was used in all our experiments.
As expected, the CO and hydrocarbon levelswere lower after passage through a carbon filter. Theresults of this test indicate that a carbon filter isprobably not necessary for this system.
Economic AnalysisAn economic analysis was performed for the
regeneration process described above to determinethe cost of hydrogen to be expected. Table 2 displaysthe assumptions used in the economic analysis. Theanalysis began with a preliminary design of thevarious components required in the process.
We found this process to be sensitive to the costof carbon. However, carbon sources appear to beavailable at costs that will make this processeconomical. Figure 6 gives the results of ouranalyses for two plant sizes. The first plant wouldserve about 250,000 cars per day, whereas the largerplant would serve about 2,000,000 cars per day.
Figure 7 displays the cost of hydrogen from thelithium-hydride-slurry system and from othersystems. Given the cost of stored hydrogen fromother production methods, the chemical-hydride

Fuel Cell Power Systems FY 2000 Progress Report
154
Table 2. Assumptions used in economic evaluation.
Capital $58.8 millionCarbon VariableLabor
Operators 25 at $35,000/yrSuper. & Cleric. 15% of operators
Mainten. & Repairs 5% of capitalOverhead 50% of tot. lab. + mtnc.Local Tax 2% of capitalInsurance 1% of capitalG&A 25% of overheadFed. and State Tax 38% of net profit
Figure 6. Results of economic analysis.
Figure 7. Cost of stored hydrogen as a chemical hydrideand by conventional methods.
slurry approach appears very competitive, evenagainst tax-free gasoline.
This analysis began with a preliminaryregeneration plant design, which was generated byusing ASPEN Plus, version 10.1. Costs determinedfrom this analysis (using methods from Ulrich)ranged from $6.04 to $11.30/106 Btu, depending onthe cost of the carbon. (A hydrogen cost of$10/106 Btu is approximately equivalent to agasoline cost of $1.14/gal.) This analysis assumes a15% after-tax rate of return, a carbon cost of $0.025-$0.075/lb ($50-$150/ton), and a high-volumeproduction plant serving 2,000,000 cars per day. Theanalysis is quite sensitive to the cost of carbon. At$0.04/lb, the carbon is assumed to be obtained fromcoal at a cost four to eight times the cost of the coal.
This cost compares favorably with that ofproducing hydrogen from conventional means andstoring it as a liquid or compressed gas (Padró andPutsche). Total stored hydrogen costs of hydrogenfrom steam methane reformation (SMR) range from$11.90 to $44.39/106 Btu. SMR is about the cheapestsource of hydrogen, with costs ranging between$5.97 and $7.46/106 Btu. Long-term storage(>30 days) costs range between $7.35 and$36.93/106 Btu for compressed hydrogen andbetween $5.26 and $17.12/106 Btu for liquid storage,depending on the size.
ConclusionsIn summary, the lithium hydride slurry approach
for storing hydrogen provides a viable alternative tostorage as liquid hydrogen or highly compressedhydrogen. Storage densities are higher than those formetal hydrides. The gravimetric energy density of60% lithium hydride slurry is 5,110 WAh/kg, or15.3% hydrogen. The volumetric energy density is3,937 WAh/L, or 118 kg H2/m
3. This is more thantwice the volumetric energy density of liquidhydrogen, and it is at ambient pressure andtemperature. The slurry is easily pumped and can bereacted with water via mixing to produce hydrogenon demand.
The mobile generator developed for the vehicleprogram has been shown to produce hydrogen ondemand, with complete reaction occurring in thereactor volume. Hydrogen production has beenmeasured up to 3 kg/hr. Based on the prototypegenerator design, an advanced design is anticipated

Fuel Cell Power Systems FY 2000 Progress Report
155
to provide a gravimetric energy density of3,361 WAh/kg and a volumetric energy density of1,954 WAh/L, assuming that the water from the fuelcell is condensed and used to produce hydrogen inthe hydride reactor.
The cost of hydrogen resulting from the carbo-thermal regeneration of lithium hydroxide to lithiumhydride is estimated to range from $6.04 for carboncosting $50/ton to $11.30 for carbon costing$150/ton. This is competitive with hydrogenproduced by natural gas and stored as a liquid.
The chemical-hydride slurry approach providesother desirable features. The slurry protects thehydride from accidental contact with moisture in theatmosphere (or otherwise). Hydrogen production byreaction of the slurry with water can be performed atelevated pressures, allowing additional power to begenerated from the exhaust hydrogen/steam from thereactor and/or allowing the exhaust hydrogen/steamto be used to pressurize air for a more compact fuelcell. Production of hydrogen at elevated pressuresalso allows the components of the hydrogengenerator to be reduced in size.
AcknowledgmentsThis work is supported by the U.S. Department
of Energy (DOE), the California South Coast AirQuality Management District (AQMD Contract No.98111), and Thermo Power Corporation. Theopinions, findings, conclusions, andrecommendations are those of the author(s) and donot necessarily represent the views of DOE orAQMD. DOE, AQMD, their officers, employees,contractors, and subcontractors make no warranties,expressed or implied, and assume no legal liability
for the information in this report. DOE and AQMDhave not approved or disapproved this report, norhave they passed upon the accuracy or adequacy ofthe information contained herein.
The authors would like to thank DOE, AQMD,and Thermo Power Corporation for the opportunityto demonstrate the chemical-hydride-slurry approachfor storing hydrogen. We would also like to thankFord Motor Company, Air Products, and MortonInternational for participating in our technical reviewpanel.
References1. C.E.G. Padró and V. Putsche , Survey of the
Economics of Hydrogen Technologies, NationalRenewable Energy Laboratory, NREL/TP-570-27079, Sept. 1999.
2. G.D. Ulrich, A Guide to Chemical EngineeringProcess Design and Economics, John Wiley &Sons, 1984.
FY 2000 Publications and Presentations• R.W. Breault, C. Larson, and J. Rolfe,
“Hydrogen for a PEM Fuel Cell Vehicle Using aChemical-Hydride Slurry,” American ChemicalSociety Meeting, New Orleans, La., Aug. 24-26,1999.
• A.W. McClaine, R.W. Breault, J. Rolfe,C. Larsen, R. Konduri, G. Miskolczy, andF. Becker, “Hydrogen Storage Using Slurries ofChemical Hydrides,” In Advances in HydrogenEnergy, to be published by KluwerAcademic/Plenum Publishers, 2000.

Fuel Cell Power Systems FY 2000 Progress Report
156
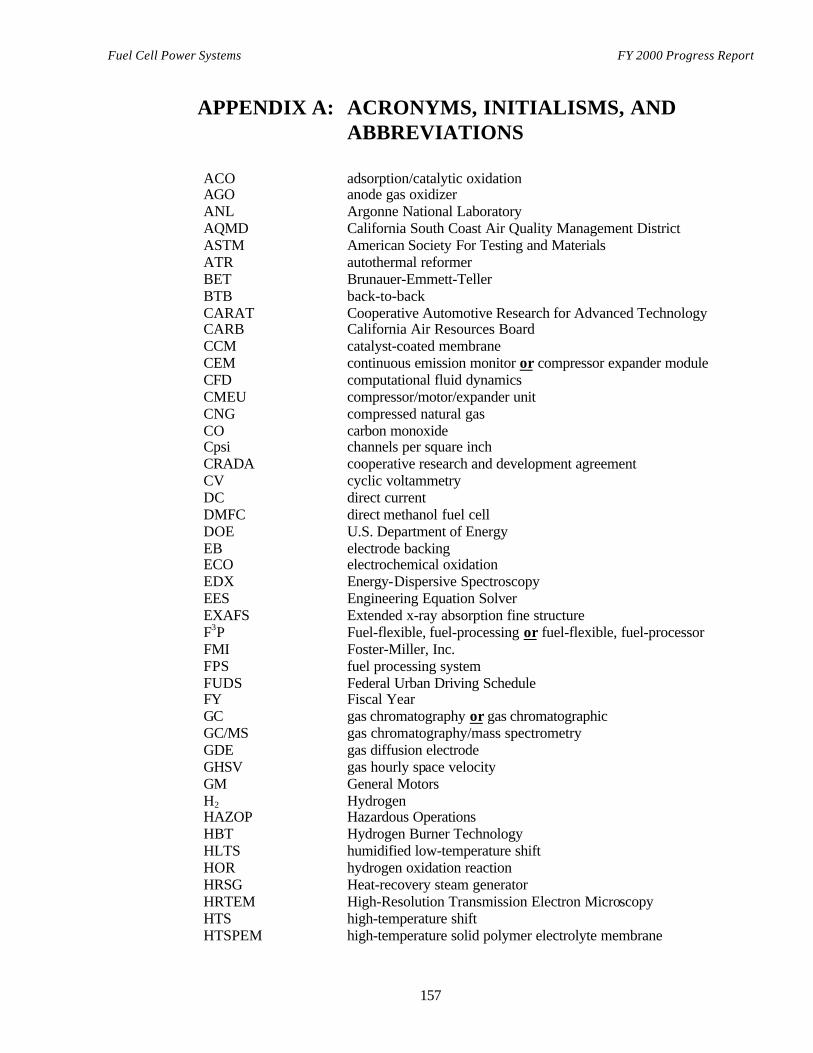
Fuel Cell Power Systems FY 2000 Progress Report
157
APPENDIX A: ACRONYMS, INITIALISMS, ANDABBREVIATIONS
ACO adsorption/catalytic oxidationAGO anode gas oxidizerANL Argonne National LaboratoryAQMD California South Coast Air Quality Management DistrictASTM American Society For Testing and MaterialsATR autothermal reformerBET Brunauer-Emmett-TellerBTB back-to-backCARAT Cooperative Automotive Research for Advanced TechnologyCARB California Air Resources BoardCCM catalyst-coated membraneCEM continuous emission monitor or compressor expander moduleCFD computational fluid dynamicsCMEU compressor/motor/expander unitCNG compressed natural gasCO carbon monoxideCpsi channels per square inchCRADA cooperative research and development agreementCV cyclic voltammetryDC direct currentDMFC direct methanol fuel cellDOE U.S. Department of EnergyEB electrode backingECO electrochemical oxidationEDX Energy-Dispersive SpectroscopyEES Engineering Equation SolverEXAFS Extended x-ray absorption fine structureF3P Fuel-flexible, fuel-processing or fuel-flexible, fuel-processorFMI Foster-Miller, Inc.FPS fuel processing systemFUDS Federal Urban Driving ScheduleFY Fiscal YearGC gas chromatography or gas chromatographicGC/MS gas chromatography/mass spectrometryGDE gas diffusion electrodeGHSV gas hourly space velocityGM General MotorsH2 HydrogenHAZOP Hazardous OperationsHBT Hydrogen Burner TechnologyHLTS humidified low-temperature shiftHOR hydrogen oxidation reactionHRSG Heat-recovery steam generatorHRTEM High-Resolution Transmission Electron MicroscopyHTS high-temperature shiftHTSPEM high-temperature solid polymer electrolyte membrane
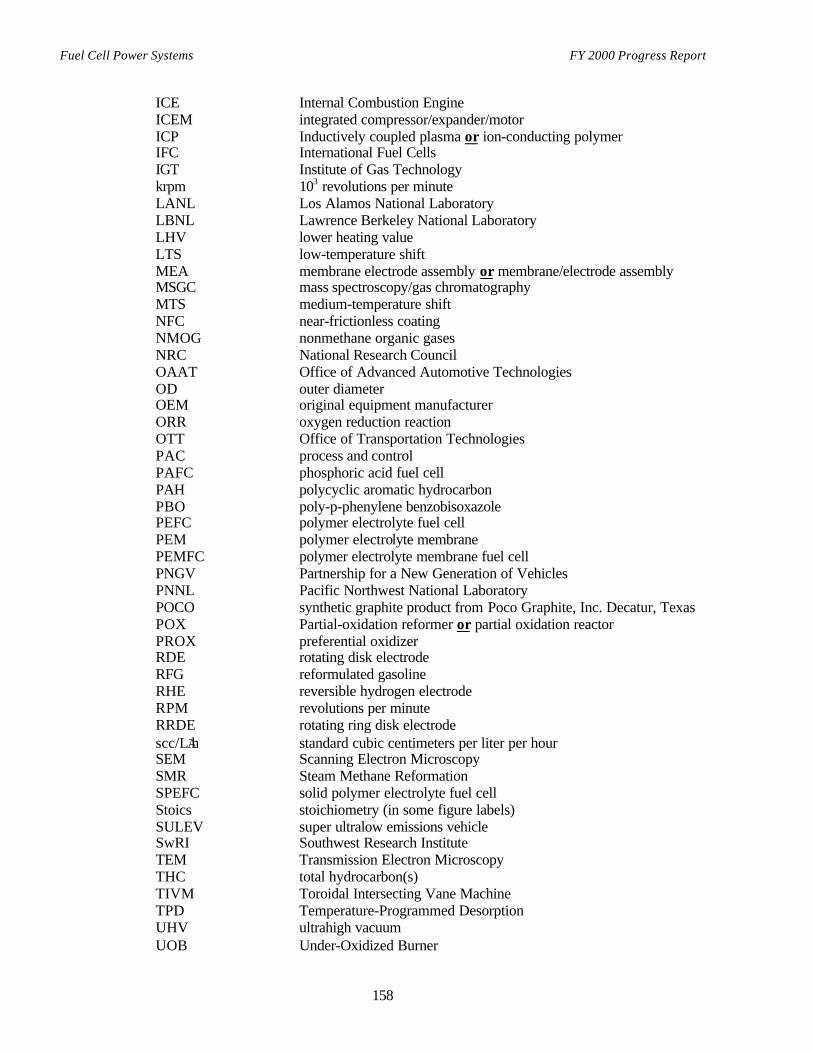
Fuel Cell Power Systems FY 2000 Progress Report
158
ICE Internal Combustion EngineICEM integrated compressor/expander/motorICP Inductively coupled plasma or ion-conducting polymerIFC International Fuel CellsIGT Institute of Gas Technologykrpm 103 revolutions per minuteLANL Los Alamos National LaboratoryLBNL Lawrence Berkeley National LaboratoryLHV lower heating valueLTS low-temperature shiftMEA membrane electrode assembly or membrane/electrode assemblyMSGC mass spectroscopy/gas chromatographyMTS medium-temperature shiftNFC near-frictionless coatingNMOG nonmethane organic gasesNRC National Research CouncilOAAT Office of Advanced Automotive TechnologiesOD outer diameterOEM original equipment manufacturerORR oxygen reduction reactionOTT Office of Transportation TechnologiesPAC process and controlPAFC phosphoric acid fuel cellPAH polycyclic aromatic hydrocarbonPBO poly-p-phenylene benzobisoxazolePEFC polymer electrolyte fuel cellPEM polymer electrolyte membranePEMFC polymer electrolyte membrane fuel cellPNGV Partnership for a New Generation of VehiclesPNNL Pacific Northwest National LaboratoryPOCO synthetic graphite product from Poco Graphite, Inc. Decatur, TexasPOX Partial-oxidation reformer or partial oxidation reactorPROX preferential oxidizerRDE rotating disk electrodeRFG reformulated gasolineRHE reversible hydrogen electrodeRPM revolutions per minuteRRDE rotating ring disk electrodescc/LAh standard cubic centimeters per liter per hourSEM Scanning Electron MicroscopySMR Steam Methane ReformationSPEFC solid polymer electrolyte fuel cellStoics stoichiometry (in some figure labels)SULEV super ultralow emissions vehicleSwRI Southwest Research InstituteTEM Transmission Electron MicroscopyTHC total hydrocarbon(s)TIVM Toroidal Intersecting Vane MachineTPD Temperature-Programmed DesorptionUHV ultrahigh vacuumUOB Under-Oxidized Burner

Fuel Cell Power Systems FY 2000 Progress Report
159
VNT Variable Nozzle TurbineWGS water gas shiftXANES X-ray Absorption Near-Edge SpectroscopyXPS X-ray Photoelectron SpectroscopyXRD X-ray DiffractionXRF X-ray Fluorescence SpectroscopyZEV zero-emission vehicle

Fuel Cell Power Systems FY 2000 Progress Report
160

Fuel Cell Power Systems FY 2000 Progress Report
161
APPENDIX B: DOE TECHNICAL TARGETS FORFUEL CELL SYSTEMS, SUBSYSTEMS,AND COMPONENTS
Table 1. DOE technical targets for integrated fuel cell power systems operating on gasoline reformate (includingfuel processor, stack, and auxiliaries; excluding gasoline tank and DC-DC converter).
Calendar YearCharacteristic a Units 1997 2000 2004
Energy efficiency b @ 25% of peak power % 35 40 48
Power density W/L 200 250 300
Specific power W/kg 200 250 300
Cost c $/kW 300 150 50
Start-up to full power min 2 1 0.5
Transient response (time from 10 to 90% power) sec 30 20 10
Emissions d <Tier 2 <Tier 2 <Tier 2
Durability e hour 1000 2000 5000
a Targets pertain to gasoline fuel; all targets will be refined through Systems Analysis and Vehicle Engineeringanalyses (consistent with those of the PNGV).
b Ratio: [dc output energy] ⁄ [lower heating value of the input fuel (gasoline)]c Includes projected cost advantage of high volume production and includes cost for assembling/integrating the
fuel cell system and fuel processor.d Emission levels will comply with emission regulations projected to be in place when the technology is available
for market introduction.e Less than 5% power degradation in the time between catalyst replacement.
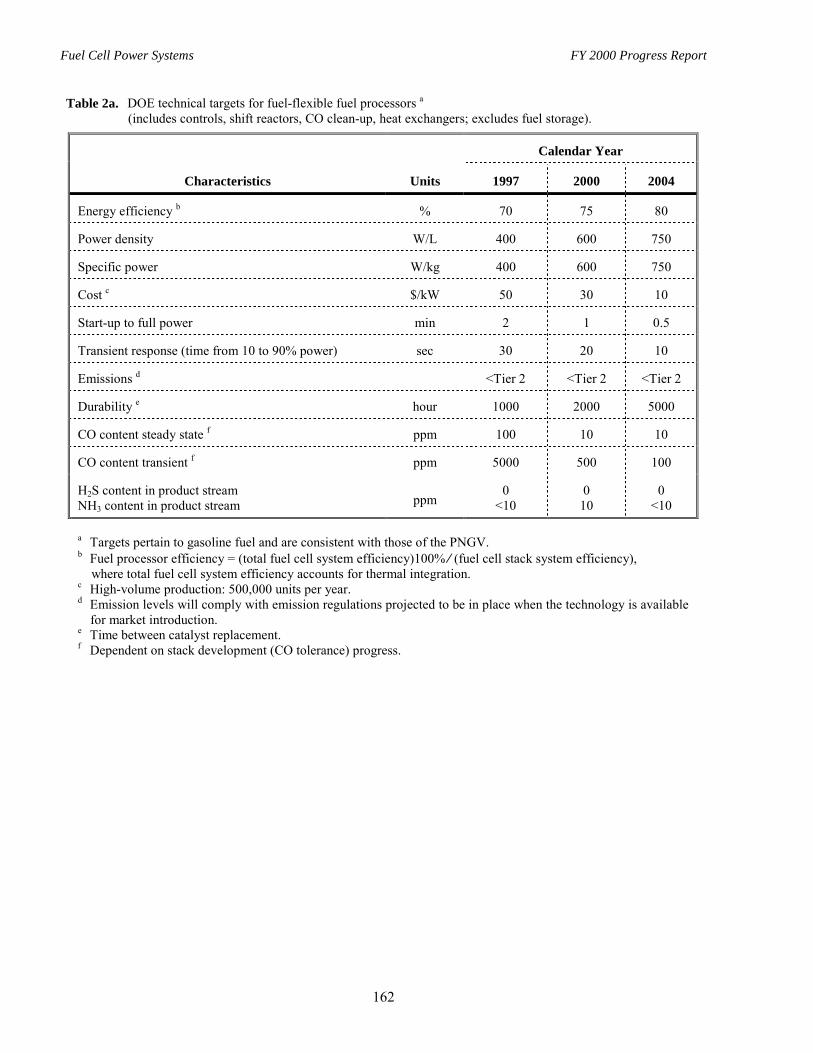
Fuel Cell Power Systems FY 2000 Progress Report
162
Table 2a. DOE technical targets for fuel-flexible fuel processors a(includes controls, shift reactors, CO clean-up, heat exchangers; excludes fuel storage).
Calendar Year
Characteristics Units 1997 2000 2004
Energy efficiency b % 70 75 80
Power density W/L 400 600 750
Specific power W/kg 400 600 750
Cost c $/kW 50 30 10
Start-up to full power min 2 1 0.5
Transient response (time from 10 to 90% power) sec 30 20 10
Emissions d <Tier 2 <Tier 2 <Tier 2
Durability e hour 1000 2000 5000
CO content steady state f ppm 100 10 10
CO content transient f ppm 5000 500 100
H2S content in product streamNH3 content in product stream ppm
0<10
010
0<10
a Targets pertain to gasoline fuel and are consistent with those of the PNGV.b Fuel processor efficiency = (total fuel cell system efficiency)100% ⁄ (fuel cell stack system efficiency), where total fuel cell system efficiency accounts for thermal integration.c High-volume production: 500,000 units per year.d Emission levels will comply with emission regulations projected to be in place when the technology is available
for market introduction.e Time between catalyst replacement.f Dependent on stack development (CO tolerance) progress.

Fuel Cell Power Systems FY 2000 Progress Report
163
Table 2b. Target PROX specifications.
Characteristic Value
Output CO concentration < 20 ppm, based on an input reformate composition of 2% CO, 30-75% H2, balance CO2 and N2
Transients < 20 ppm CO after 1 minute start-up< 20 ppm CO within 2 sec after + 90% electrical load transient
Hydrogen consumption < 20% of CO removed
Device volume ≤ 2.0 × catalyst volume
Device cost < $300 (sized for 50-kW fuel cell system)
Device pressure drop 21 kPa (3.1 psi)
Particulates Device must be tolerant of soot and debris
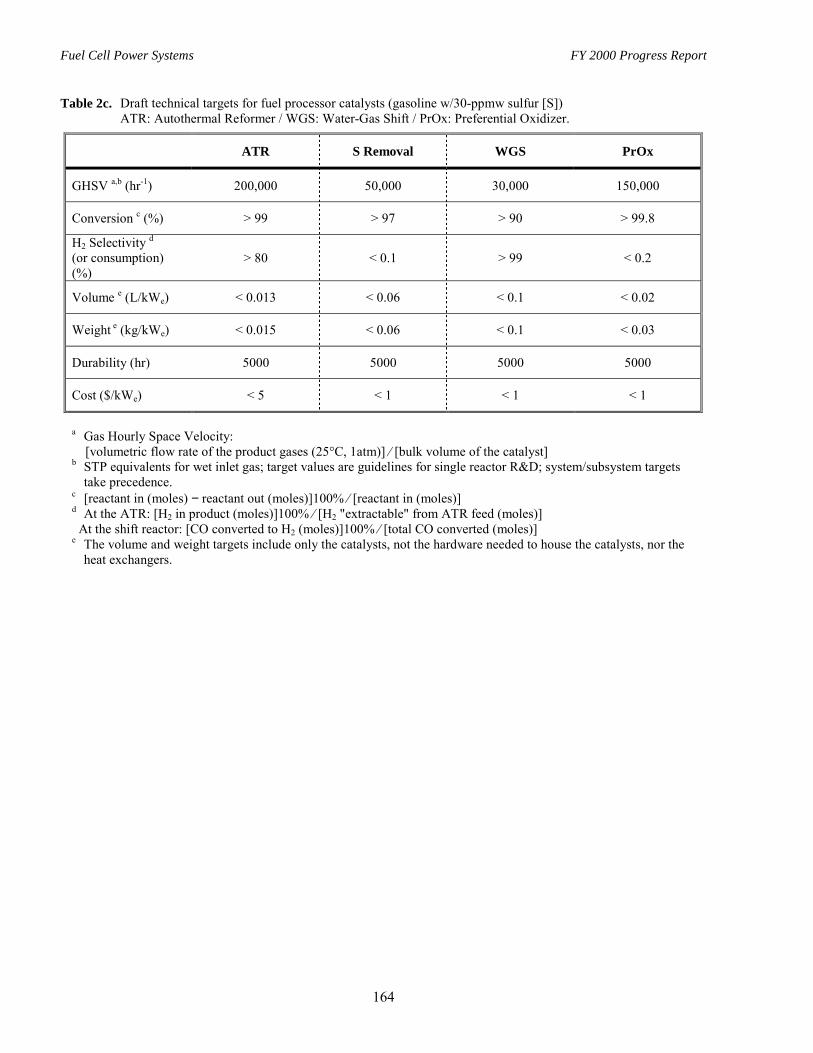
Fuel Cell Power Systems FY 2000 Progress Report
164
Table 2c. Draft technical targets for fuel processor catalysts (gasoline w/30-ppmw sulfur [S])ATR: Autothermal Reformer / WGS: Water-Gas Shift / PrOx: Preferential Oxidizer.
ATR S Removal WGS PrOx
GHSV a,b (hr-1) 200,000 50,000 30,000 150,000
Conversion c (%) > 99 > 97 > 90 > 99.8
H2 Selectivity d(or consumption)(%)
> 80 < 0.1 > 99 < 0.2
Volume e (L/kWe) < 0.013 < 0.06 < 0.1 < 0.02
Weight e (kg/kWe) < 0.015 < 0.06 < 0.1 < 0.03
Durability (hr) 5000 5000 5000 5000
Cost ($/kWe) < 5 < 1 < 1 < 1
a Gas Hourly Space Velocity: [volumetric flow rate of the product gases (25°C, 1atm)] ⁄ [bulk volume of the catalyst]b STP equivalents for wet inlet gas; target values are guidelines for single reactor R&D; system/subsystem targets
take precedence.c [reactant in (moles) − reactant out (moles)]100% ⁄ [reactant in (moles)]d At the ATR: [H2 in product (moles)]100% ⁄ [H2 "extractable" from ATR feed (moles)] At the shift reactor: [CO converted to H2 (moles)]100% ⁄ [total CO converted (moles)]e The volume and weight targets include only the catalysts, not the hardware needed to house the catalysts, nor the
heat exchangers.

Fuel Cell Power Systems FY 2000 Progress Report
165
Table 3. DOE technical targetsa for 50-kW peak power (continuous)b fuel cell stack systems running on hydrogen-rich fuel from fuel-flexible fuel processor (includes fuel cell ancillaries: heat, water, air managementsystems; excludes fuel processing/delivery system).
Calendar YearCharacteristic Unit 1997 2000 2004
Stack system power density b W/L 300 350 500
Stack system specific power W/kg 300 350 500
Stack system efficiency c @ 25% of peak power % 50 55 60
Stack system efficiency c @ peak power % 40 44 48
Precious metal loading g/peak kW 2.0 0.9 0.2
Cost d $/kW 200 100 35
Durability (< 5% power degradation) hour >1000 >2000 >5000
Transient performance(time from 10 to 90% power)
sec 10 3 1
Cold startup to maximum power at −40°CCold startup to maximum power at 20°C min
152
51
20.5
Emissions e <Tier 2 <Tier 2 <Tier 2
CO tolerance (steady state) ppm 10 100 1000
CO tolerance (transient) ppm 100 500 5000
a Technical targets are consistent with those of the PNGV.b Power refers to net power (i.e. stack power minus auxiliary power requirements).c Ratio: (output dc energy) ⁄ (lower heating value of hydrogen-rich fuel stream)d High-volume production: 500,000 units per year.e Emission levels will comply with emission regulations projected to be in place when the technology is
available for market introduction.
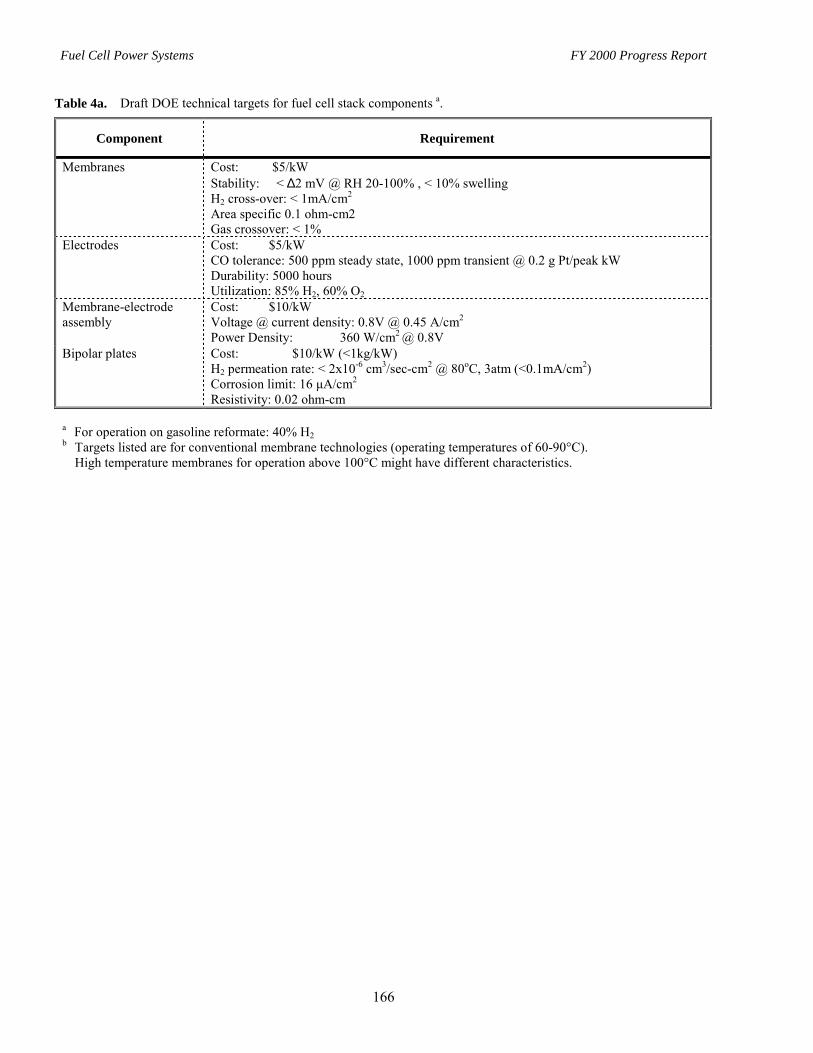
Fuel Cell Power Systems FY 2000 Progress Report
166
Table 4a. Draft DOE technical targets for fuel cell stack components a.
Component Requirement
Membranes Cost: $5/kWStability: < ∆2 mV @ RH 20-100% , < 10% swellingH2 cross-over: < 1mA/cm2
Area specific 0.1 ohm-cm2Gas crossover: < 1%
Electrodes Cost: $5/kWCO tolerance: 500 ppm steady state, 1000 ppm transient @ 0.2 g Pt/peak kWDurability: 5000 hoursUtilization: 85% H2, 60% O2
Membrane-electrodeassembly
Cost: $10/kWVoltage @ current density: 0.8V @ 0.45 A/cm2
Power Density: 360 W/cm2 @ 0.8VBipolar plates Cost: $10/kW (<1kg/kW)
H2 permeation rate: < 2x10⁻⁶ cm3/sec-cm2 @ 80oC, 3atm (<0.1mA/cm2)Corrosion limit: 16 μA/cm2
Resistivity: 0.02 ohm-cm
a For operation on gasoline reformate: 40% H2b Targets listed are for conventional membrane technologies (operating temperatures of 60-90°C).
High temperature membranes for operation above 100°C might have different characteristics.
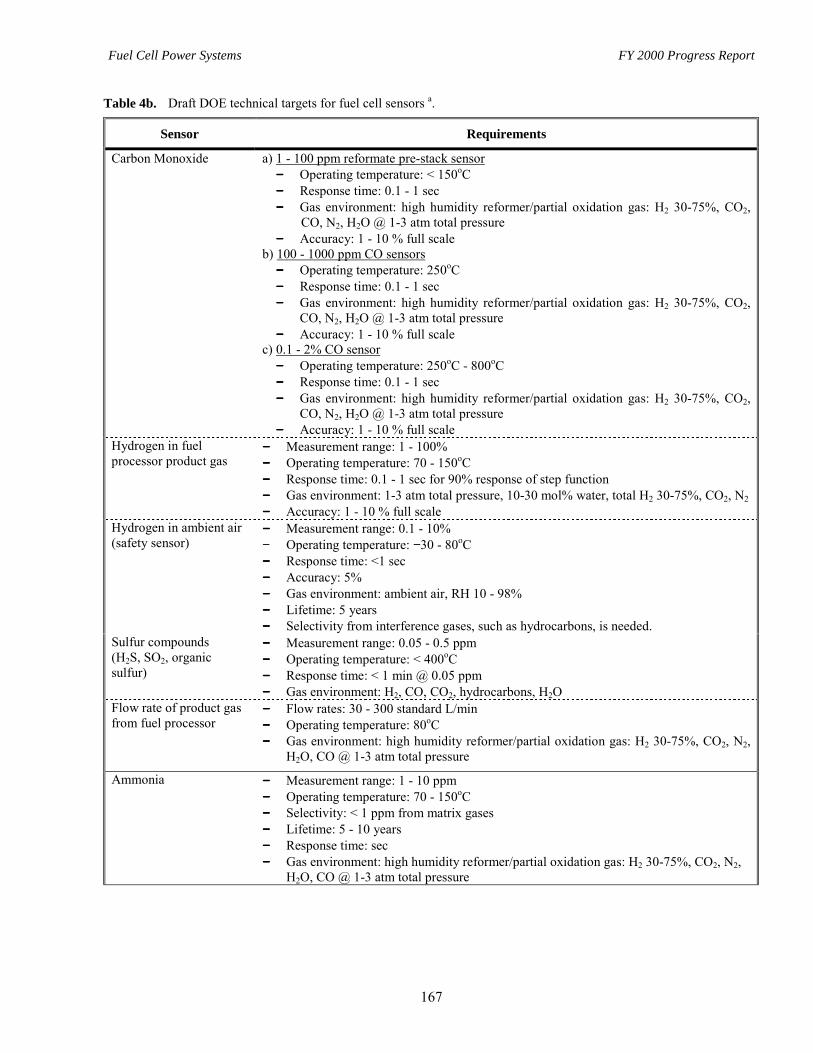
Fuel Cell Power Systems FY 2000 Progress Report
167
Table 4b. Draft DOE technical targets for fuel cell sensors a.
Sensor Requirements
Carbon Monoxide a) 1 - 100 ppm reformate pre-stack sensor−−−− Operating temperature: < 150oC−−−− Response time: 0.1 - 1 sec−−−− Gas environment: high humidity reformer/partial oxidation gas: H2 30-75%, CO2,
CO, N2, H2O @ 1-3 atm total pressure−−−− Accuracy: 1 - 10 % full scale
b) 100 - 1000 ppm CO sensors−−−− Operating temperature: 250oC−−−− Response time: 0.1 - 1 sec−−−− Gas environment: high humidity reformer/partial oxidation gas: H2 30-75%, CO2,
CO, N2, H2O @ 1-3 atm total pressure−−−− Accuracy: 1 - 10 % full scale
c) 0.1 - 2% CO sensor−−−− Operating temperature: 250oC - 800oC−−−− Response time: 0.1 - 1 sec−−−− Gas environment: high humidity reformer/partial oxidation gas: H2 30-75%, CO2,
CO, N2, H2O @ 1-3 atm total pressure−−−− Accuracy: 1 - 10 % full scale
Hydrogen in fuelprocessor product gas
−−−− Measurement range: 1 - 100%−−−− Operating temperature: 70 - 150oC−−−− Response time: 0.1 - 1 sec for 90% response of step function−−−− Gas environment: 1-3 atm total pressure, 10-30 mol% water, total H2 30-75%, CO2, N2
−−−− Accuracy: 1 - 10 % full scaleHydrogen in ambient air(safety sensor)
−−−− Measurement range: 0.1 - 10%− Operating temperature: −30 - 80oC−−−− Response time: <1 sec−−−− Accuracy: 5%−−−− Gas environment: ambient air, RH 10 - 98%−−−− Lifetime: 5 years−−−− Selectivity from interference gases, such as hydrocarbons, is needed.
Sulfur compounds(H2S, SO2, organicsulfur)
−−−− Measurement range: 0.05 - 0.5 ppm−−−− Operating temperature: < 400oC−−−− Response time: < 1 min @ 0.05 ppm−−−− Gas environment: H2, CO, CO2, hydrocarbons, H2O
Flow rate of product gasfrom fuel processor
−−−− Flow rates: 30 - 300 standard L/min−−−− Operating temperature: 80oC−−−− Gas environment: high humidity reformer/partial oxidation gas: H2 30-75%, CO2, N2,
H2O, CO @ 1-3 atm total pressure
Ammonia −−−− Measurement range: 1 - 10 ppm−−−− Operating temperature: 70 - 150oC−−−− Selectivity: < 1 ppm from matrix gases−−−− Lifetime: 5 - 10 years−−−− Response time: sec−−−− Gas environment: high humidity reformer/partial oxidation gas: H2 30-75%, CO2, N2,
H2O, CO @ 1-3 atm total pressure
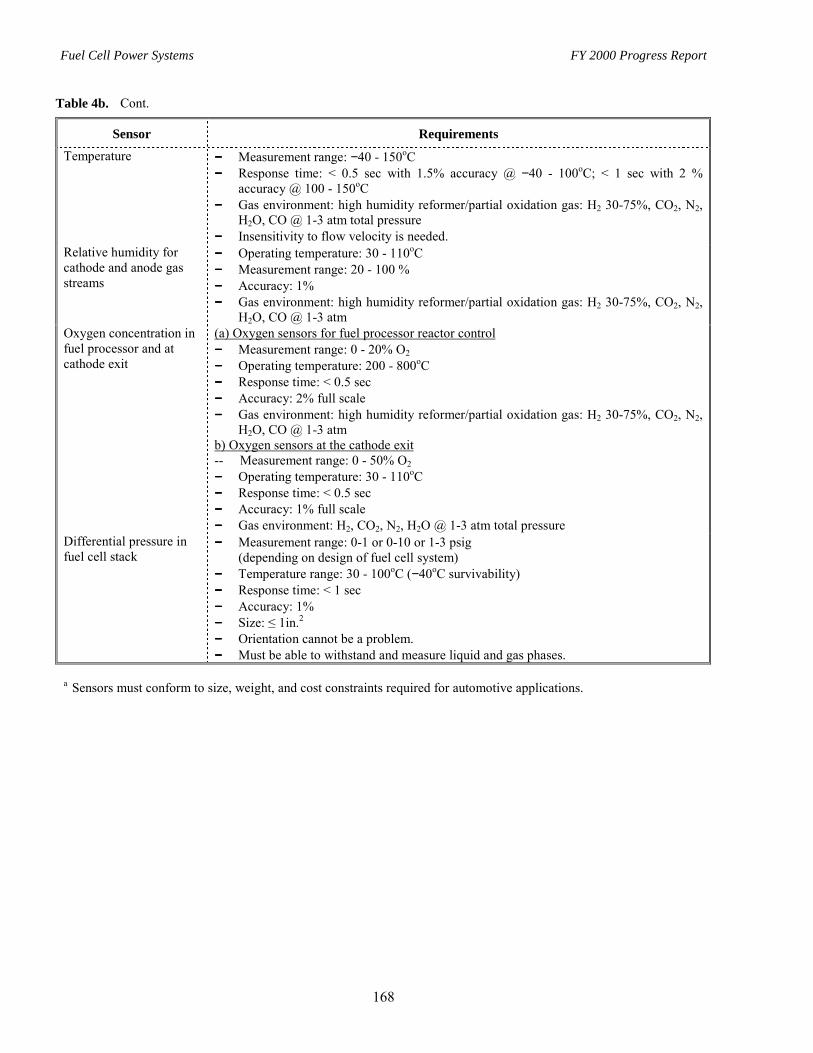
Fuel Cell Power Systems FY 2000 Progress Report
168
Table 4b. Cont.
Sensor RequirementsTemperature −−−− Measurement range: −40 - 150oC
−−−− Response time: < 0.5 sec with 1.5% accuracy @ −40 - 100oC; < 1 sec with 2 %accuracy @ 100 - 150oC
−−−− Gas environment: high humidity reformer/partial oxidation gas: H2 30-75%, CO2, N2,H2O, CO @ 1-3 atm total pressure
−−−− Insensitivity to flow velocity is needed.Relative humidity forcathode and anode gasstreams
−−−− Operating temperature: 30 - 110oC−−−− Measurement range: 20 - 100 %−−−− Accuracy: 1%−−−− Gas environment: high humidity reformer/partial oxidation gas: H2 30-75%, CO2, N2,
H2O, CO @ 1-3 atmOxygen concentration infuel processor and atcathode exit
(a) Oxygen sensors for fuel processor reactor control−−−− Measurement range: 0 - 20% O2
−−−− Operating temperature: 200 - 800oC−−−− Response time: < 0.5 sec−−−− Accuracy: 2% full scale−−−− Gas environment: high humidity reformer/partial oxidation gas: H2 30-75%, CO2, N2,
H2O, CO @ 1-3 atmb) Oxygen sensors at the cathode exit-- Measurement range: 0 - 50% O2
−−−− Operating temperature: 30 - 110oC−−−− Response time: < 0.5 sec−−−− Accuracy: 1% full scale−−−− Gas environment: H2, CO2, N2, H2O @ 1-3 atm total pressure
Differential pressure infuel cell stack
−−−− Measurement range: 0-1 or 0-10 or 1-3 psig(depending on design of fuel cell system)
−−−− Temperature range: 30 - 100oC (−40oC survivability)−−−− Response time: < 1 sec−−−− Accuracy: 1%−−−− Size: ≤ 1in.2
−−−− Orientation cannot be a problem.−−−− Must be able to withstand and measure liquid and gas phases.
a Sensors must conform to size, weight, and cost constraints required for automotive applications.

Fuel Cell Power Systems FY 2000 Progress Report
169
Table 5. Current DOE targets for compressors/expandersa.
Characteristic (units) Requirement
Input power b,c at max flow (kW) 4.3
Efficiency at 100% flow d compressor: 75% @ 3.2 PRexpander c: 90%
Efficiency at 20% flow e compressor: 65% @ 1.6 PRexpander c: 80%
Volume f (liters) 4
Weight f (kg) 3
Cost f @100K/yr $200
Turndown ratio 10
Noise < 80 dB
a A workshop being held early in FY 2001 will review and update the compressor/expander performancetargets.
b Input power to the controller to power a compressor/expander system producing 76 g/sec (dry)maximum flow. This flow rate roughly corresponds to maximum power for a 50 kW fuel cell system.
c Input power and expander efficiency calculated assuming tail gas composition specified by DOEd 100% flow: 82 g/sec (150ºC, 2.8 atm inlet, unless otherwise specified)e 25% flow: 19 g/sec (150ºC, 2.8 atm inlet, unless otherwise specified)f DOE guidelines for volume, weight, and cost do not include the motor/controller or heat rejection (if required).

Fuel Cell Power Systems FY 2000 Progress Report
170
Table 6. New Draft DOE Targets for On-board Hydrogen Storage Technologies a,b.
Units Physical Storage c Chemical Storage d
Storage weight percent e % 6 6
Storage efficiency f % 95 90
Energy density (gas) Wthh/liter 1050 g 1500 g
Specific energy h Wthh/kg 2000 2000
Costi $/kW-h 5 5
Cycle life Cycles 500 500
Operating pressure (gas) psig 7500 g N/A
Refueling time min < 5 < 5
Permeation rate scc/hr-liter 2.0 N/A
a To meet PNGV 380-mile range target; based on LHV of hydrogen.b Work carried out in collaboration with DOE Hydrogen Program.c Includes compressed gas and cryogenic liquid tanks.d Includes materials such as carbon nanostructures, fullerenes, metal hydrides,
organometallics, or catalyzed hydrides.e Weight percent H2 is assumed to be: [weight of H2]100% ⁄ [weight of (H2 + tank)]f Includes power associated with capturing and releasing hydrogen.g Conceptual designs showed 180 liters (3 tanks) could be packaged without
compromising trunk or passenger compartments; assuming 5 kg for +300 mile range ina PNGV-type vehicle yields 0.028 kg/L. Derated by 10% for tank system yields0.031kg/L. This corresponds to tank pressure of 7500 psig, and 1050 Wthh/L. Chemicalstorage target is more aggressive because tanks are marginal in meeting vehiclerequirements.
h Specific energy is assumed to be: [LHV of H2 contained] ⁄ [weight of (H2 + tank)]i Based on high volume production of 500,000 units.

This document highlights work sponsored by agencies of the U.S. Government. Neither the U.S.Government nor any agency thereof, nor any of their employees, makes any warranty, express or implied,or assumes any legal liability or responsibility for the accuracy, completeness, or usefulness of any infor-mation, apparatus, product, or process disclosed, or represents that its use would not infringe privatelyowned rights. Reference herein to any specific commercial product, process, or service by trade name,trademark, manufacturer, or otherwise does not necessarily constitute or imply its endorsement, recom-mendation, or favoring by the U.S. Government or any agency thereof. The views and opinions of authorsexpressed herein do not necessarily state or reflect those of the U.S. Government or any agency thereof.
Printed on recycled paper
O F F I C E O F T R A N S P O R T A T I O N T E C H N O L O G I E S
S E R I E S O F
2 0 0 0 A N N U A L P R O G R E S S R E P O R T S
• Vehicle Propulsion and Ancillary Subsystems
• Automotive Lightweight Materials
• Automotive Propulsion Materials
• Fuels for Advanced CIDI Engines and Fuel Cells
• SIDI Engine R&D
• Combustion and Emission Control for Advanced CIDI Engines
• Transportation Fuel Cell Power Systems
• Vehicle Power Electronics and Electric Machines
• Advanced Technology Development (High-Power Battery)
• Exploratory Technology Research (High-Power Battery)
• Vehicle High-Power Energy Storage
• Electric Vehicle Batteries R&D
and Office of Advanced Automotive TechnologiesFY2000 Program Highlights
www.ott.doe.gov/oaat
Clean Energy– for the –
21st Century