Embed Size (px)
Citation preview

DOI: 10.1126/science.1150473, 395 (2008);321 Science
James A. EvansElectronic Publication and the Narrowing of Science and Scholarship
This copy is for your personal, non-commercial use only.
clicking here.colleagues, clients, or customers by , you can order high-quality copies for yourIf you wish to distribute this article to others
here.following the guidelines
can be obtained byPermission to republish or repurpose articles or portions of articles
): August 10, 2014 www.sciencemag.org (this information is current as of
The following resources related to this article are available online at
http://www.sciencemag.org/content/321/5887/395.full.htmlversion of this article at:
including high-resolution figures, can be found in the onlineUpdated information and services,
http://www.sciencemag.org/content/suppl/2008/07/17/321.5887.395.DC1.html can be found at: Supporting Online Material
http://www.sciencemag.org/content/321/5887/395.full.html#relatedfound at:
can berelated to this article A list of selected additional articles on the Science Web sites
http://www.sciencemag.org/content/321/5887/395.full.html#ref-list-1, 6 of which can be accessed free:cites 11 articlesThis article
22 article(s) on the ISI Web of Sciencecited by This article has been
http://www.sciencemag.org/content/321/5887/395.full.html#related-urls18 articles hosted by HighWire Press; see:cited by This article has been
http://www.sciencemag.org/cgi/collection/sociologySociology
subject collections:This article appears in the following
registered trademark of AAAS. is aScience2008 by the American Association for the Advancement of Science; all rights reserved. The title
CopyrightAmerican Association for the Advancement of Science, 1200 New York Avenue NW, Washington, DC 20005. (print ISSN 0036-8075; online ISSN 1095-9203) is published weekly, except the last week in December, by theScience
on
Aug
ust 1
0, 2
014
ww
w.s
cien
cem
ag.o
rgD
ownl
oade
d fr
om
on
Aug
ust 1
0, 2
014
ww
w.s
cien
cem
ag.o
rgD
ownl
oade
d fr
om
on
Aug
ust 1
0, 2
014
ww
w.s
cien
cem
ag.o
rgD
ownl
oade
d fr
om
on
Aug
ust 1
0, 2
014
ww
w.s
cien
cem
ag.o
rgD
ownl
oade
d fr
om
on
Aug
ust 1
0, 2
014
ww
w.s
cien
cem
ag.o
rgD
ownl
oade
d fr
om
on
Aug
ust 1
0, 2
014
ww
w.s
cien
cem
ag.o
rgD
ownl
oade
d fr
om
12. A. C. Ashworth, Anthropologie 98, 3 (1994).13. All age uncertainties are reported at 2s. Radiocarbon
ages were converted to calendar years following (27).14. J. O. Stone, J. Geophys. Res. 105, 23 (2000).15. Materials and methods are available as supporting online
material on Science Online.16. D. C. Douglass, B. S. Singer, M. R. Kaplan, D. M. Mickelson,
M. W. Caffee, Quat. Geochron. 1, 43 (2006).17. J. Mercer, Am. J. Sci. 266, 91 (1968).18. A. Gilli et al., Terra Nova 13, 443 (2001).19. S. Stine, M. Stine, Nature 345, 705 (1990).20. V. Markgraf et al., Holocene 13, 581 (2003).21. F. Lamy et al., Science 304, 1959 (2004).
22. K. J. Turner, C. J. Fogwell, R. D. McCulloch, D. E. Sugden,Geogr. Ann. 87A, 363 (2005).
23. N. E. Glasser, S. Harrison, S. Ivy-Ochs, G. A. T. Duller,P. W. Kubik, Quat. Res. 65, 70 (2006).
24. C. J. Heusser, J. S. Am. Earth Sci. 15, 577 (2002).25. K. D. Bennett, S. G. Haberle, S. H. Lumley, Science 290,
325 (2000).26. B. Stenni et al., Earth Planet. Sci. Lett. 217, 183
(2004).27. P. J. Reimer et al., Radiocarbon 46, 1029 (2004).28. We thank J. Stone for providing laboratory facilities for
36Cl preparation at the University of Washington. Thisresearch was supported by NSF grants to the University of
Wisconsin–Madison, Woods Hole OceanographicInstitution, and Purdue University.
Supporting Online Materialwww.sciencemag.org/cgi/content/full/321/5887/392/DC1Materials and MethodsSOM TextFigs. S1 to S3Tables S1 to S3
3 March 2008; accepted 16 June 200810.1126/science.1157215
Electronic Publication and theNarrowing of Science and ScholarshipJames A. Evans
Online journals promise to serve more information to more dispersed audiences and are moreefficiently searched and recalled. But because they are used differently than print—scientists andscholars tend to search electronically and follow hyperlinks rather than browse or peruse—electronically available journals may portend an ironic change for science. Using a database of 34million articles, their citations (1945 to 2005), and online availability (1998 to 2005), I show thatas more journal issues came online, the articles referenced tended to be more recent, fewerjournals and articles were cited, and more of those citations were to fewer journals and articles. Theforced browsing of print archives may have stretched scientists and scholars to anchor findingsdeeply into past and present scholarship. Searching online is more efficient and followinghyperlinks quickly puts researchers in touch with prevailing opinion, but this may accelerateconsensus and narrow the range of findings and ideas built upon.
Scholarship about “digital libraries” and“information technology” has focused onthe superiority of the electronic provision
of research. A recent Panel Report from the U.S.President’s Information Technology AdvisoryCommittee (PITAC), “Digital Libraries: Univer-sal Access to Human Knowledge,” captures thetone: “All citizens anywhere anytime can useany Internet-connected digital device to searchall of human knowledge…. In this vision, noclassroom, group, or person is ever isolatedfrom the world’s greatest knowledge resources”(1, 2). This perspective overlooks the nature ofthe interface between the user and the infor-mation (3). There has been little discussion ofbrowsing/searching technology or its potentialeffect on science and scholarship.
Recent research into the practice of libraryusage measures the use of print and electronicresources with surveys, database access logs,circulation records, and reshelving counts. De-spite differences in methodology, researchersagree that print use is declining as electronic useincreases (4), and that general users prefer on-line material to print (5). These studies are alsoin general agreement about the three most com-mon practices used by scientists and scholarswho publish. First, most experts browse orbriefly scan a small number of core journals in
print or online to build awareness of current re-search (6). After relevant articles are discoveredonline, these are often printed and perused indepth on paper (7). A second practice is tosearch by topic in an online article database. Inrecent years, the percentage of papers read as aresult of browsing has dropped and been re-placed by the results of online searches, espe-cially for the most productive scientists andscholars (8). Finally, subject experts use hyper-links in online articles to view referenced orrelated articles (6). Disciplinary differences exist.For example, biologists prefer to browse online,whereas medical professionals place a premiumon purchasing and browsing in print. In sum,researchers peruse in print, browse in print oronline (9), and search and follow citations on-line. These findings follow from the organiza-tion and accessibility of print and online papers.Print holdings reside either in a physical “stack”by journal and topic, arranged historically, or ina “recent publications” area. For print journals, thetable of contents—its list of titles and authors—serves as the primary index. Online archivesallow people to browse within journals, but theyalso facilitate searching the entire archive ofavailable journals. In online interfaces wheresearching and browsing are both options (e.g., 3ProQuest, Ovid, EBSCO, JSTOR, etc.), thesearching option (e.g., button) is almost al-ways placed first on the interface becauselogs demonstrate more frequent usage. When
searched as an undifferentiated archive ofpapers, titles, abstracts, and sometimes the fulltext can be searched by relevance and by date.Because electronic indexing is richer, expertsmay still browse in print, but they search online(10).
What is the effect of online availability ofjournal issues? It is possible that by makingmore research more available, online searchingcould conceivably broaden the work cited andlead researchers, as a collective, away from the“core” journals of their fields and to dispersedbut individually relevant work. I will show,however, that even as deeper journal back is-sues became available online, scientists andscholars cited more recent articles; even asmore total journals became available online,fewer were cited.
Citation data were drawn from ThompsonScientific’s Science, Social Science, and Artsand Humanities Citation Indexes, the most com-plete source of citation data available. CitationIndex (CI) data currently include articles andassociated citations from the 6000 most highlycited journals in the sciences, social sciences,and humanities going back as far as 1945, for atotal of over 50 million articles. The CI flagsmore than 98% of its journals with from 1 to 3 ofa possible 300 content codes, such as “condensedmatter physics,” “ornithology,” and “inorganicand nuclear chemistry.” Citation patterns werethen linked with data tracking the online avail-ability of journals from Information Today, Inc.’sFulltext Sources Online (FSO).
FSO is the oldest and largest publicationabout electronic journal availability. Informa-tion Today began publishing FSO biannuallyin 1998, indicating which journals were availa-ble in which commercial electronic archives (e.g.,Lexis-Nexis, EBSCO, Ovid, etc.) or if they wereavailable freely on their own Web site, and forhow many back issues. Merged together byISSN (International Standard Serial Number),the CI and FSO data allowed me to capture howarticle online availability changes the use of pub-lished knowledge in subsequent research. FSO’ssource distinction further allows comparison ofprint access with the different electronic chan-nels through which scientists and scholars ob-tained articles—whether a privately maintainedcommercial portal or the open Internet. The com-bined CI-FSO data set resulted in 26,002,796
Department of Sociology, University of Chicago, 1126 East 59thStreet, Chicago, IL 60615, USA. E-mail: [email protected]
www.sciencemag.org SCIENCE VOL 321 18 JULY 2008 395
REPORTS
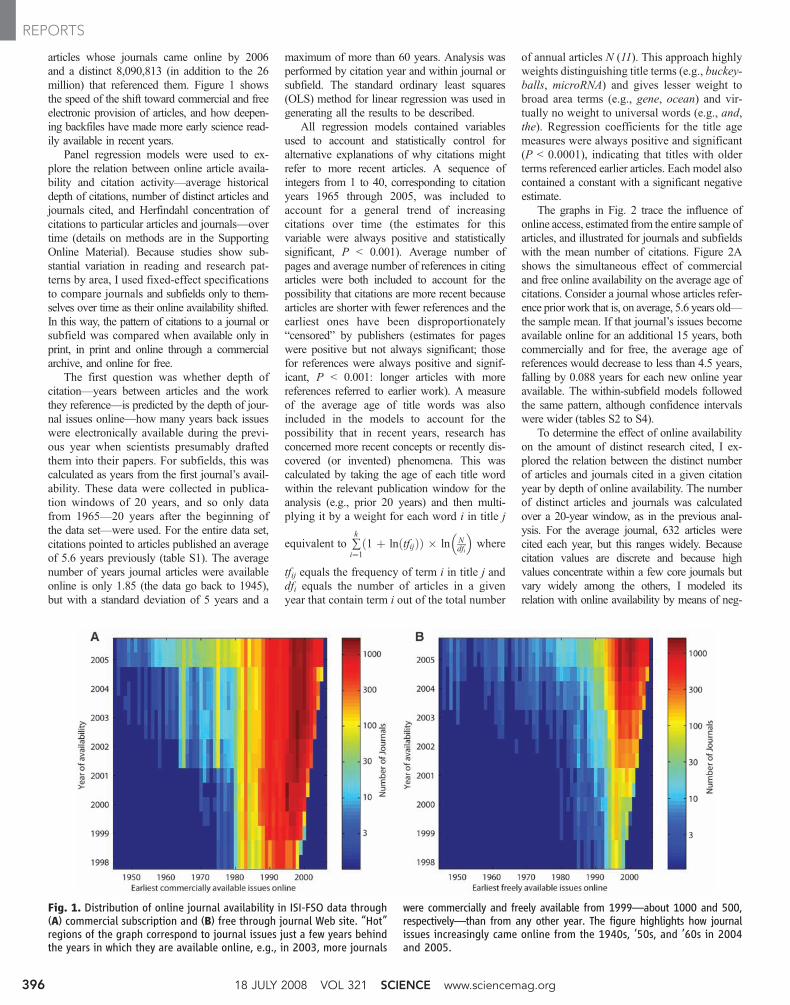
articles whose journals came online by 2006and a distinct 8,090,813 (in addition to the 26million) that referenced them. Figure 1 showsthe speed of the shift toward commercial and freeelectronic provision of articles, and how deepen-ing backfiles have made more early science read-ily available in recent years.
Panel regression models were used to ex-plore the relation between online article availa-bility and citation activity—average historicaldepth of citations, number of distinct articles andjournals cited, and Herfindahl concentration ofcitations to particular articles and journals—overtime (details on methods are in the SupportingOnline Material). Because studies show sub-stantial variation in reading and research pat-terns by area, I used fixed-effect specificationsto compare journals and subfields only to them-selves over time as their online availability shifted.In this way, the pattern of citations to a journal orsubfield was compared when available only inprint, in print and online through a commercialarchive, and online for free.
The first question was whether depth ofcitation—years between articles and the workthey reference—is predicted by the depth of jour-nal issues online—how many years back issueswere electronically available during the previ-ous year when scientists presumably draftedthem into their papers. For subfields, this wascalculated as years from the first journal’s avail-ability. These data were collected in publica-tion windows of 20 years, and so only datafrom 1965—20 years after the beginning ofthe data set—were used. For the entire data set,citations pointed to articles published an averageof 5.6 years previously (table S1). The averagenumber of years journal articles were availableonline is only 1.85 (the data go back to 1945),but with a standard deviation of 5 years and a
maximum of more than 60 years. Analysis wasperformed by citation year and within journal orsubfield. The standard ordinary least squares(OLS) method for linear regression was used ingenerating all the results to be described.
All regression models contained variablesused to account and statistically control foralternative explanations of why citations mightrefer to more recent articles. A sequence ofintegers from 1 to 40, corresponding to citationyears 1965 through 2005, was included toaccount for a general trend of increasingcitations over time (the estimates for thisvariable were always positive and statisticallysignificant, P < 0.001). Average number ofpages and average number of references in citingarticles were both included to account for thepossibility that citations are more recent becausearticles are shorter with fewer references and theearliest ones have been disproportionately“censored” by publishers (estimates for pageswere positive but not always significant; thosefor references were always positive and signif-icant, P < 0.001: longer articles with morereferences referred to earlier work). A measureof the average age of title words was alsoincluded in the models to account for thepossibility that in recent years, research hasconcerned more recent concepts or recently dis-covered (or invented) phenomena. This wascalculated by taking the age of each title wordwithin the relevant publication window for theanalysis (e.g., prior 20 years) and then multi-plying it by a weight for each word i in title j
equivalent to ∑k
i¼1ð1 þ lnðtfijÞÞ � ln N
dfi
� �where
tfij equals the frequency of term i in title j anddfi equals the number of articles in a givenyear that contain term i out of the total number
of annual articles N (11). This approach highlyweights distinguishing title terms (e.g., buckey-balls, microRNA) and gives lesser weight tobroad area terms (e.g., gene, ocean) and vir-tually no weight to universal words (e.g., and,the). Regression coefficients for the title agemeasures were always positive and significant(P < 0.0001), indicating that titles with olderterms referenced earlier articles. Each model alsocontained a constant with a significant negativeestimate.
The graphs in Fig. 2 trace the influence ofonline access, estimated from the entire sample ofarticles, and illustrated for journals and subfieldswith the mean number of citations. Figure 2Ashows the simultaneous effect of commercialand free online availability on the average age ofcitations. Consider a journal whose articles refer-ence prior work that is, on average, 5.6 years old—the sample mean. If that journal’s issues becomeavailable online for an additional 15 years, bothcommercially and for free, the average age ofreferences would decrease to less than 4.5 years,falling by 0.088 years for each new online yearavailable. The within-subfield models followedthe same pattern, although confidence intervalswere wider (tables S2 to S4).
To determine the effect of online availabilityon the amount of distinct research cited, I ex-plored the relation between the distinct numberof articles and journals cited in a given citationyear by depth of online availability. The numberof distinct articles and journals was calculatedover a 20-year window, as in the previous anal-ysis. For the average journal, 632 articles werecited each year, but this ranges widely. Becausecitation values are discrete and because highvalues concentrate within a few core journals butvary widely among the others, I modeled itsrelation with online availability by means of neg-
Fig. 1. Distribution of online journal availability in ISI-FSO data through(A) commercial subscription and (B) free through journal Web site. “Hot”regions of the graph correspond to journal issues just a few years behindthe years in which they are available online, e.g., in 2003, more journals
were commercially and freely available from 1999—about 1000 and 500,respectively—than from any other year. The figure highlights how journalissues increasingly came online from the 1940s, ’50s, and ’60s in 2004and 2005.
18 JULY 2008 VOL 321 SCIENCE www.sciencemag.org396
REPORTS

ative binomial models (12). The negative bi-nomial is a generalization of the Poisson modelthat allows for an additional source of varianceabove that due to pure sampling error. A fixed-effects specification of this model refers not tothe coefficient estimates but to the “dispersionparameter,” forcing the estimated variance ofcitations to be the same within journals or sub-fields, but allowing it to take on any value acrossthem. These models were estimated with themaximum likelihood method and producedcoefficient estimates that, when exponentiated,can be interpreted as the ratio of (i) the numberof distinct articles cited after a 1-year increase inthe electronic provision of journals over (ii) thenumber of articles cited without an online in-crease. One can subtract 1 from these ratios and
multiply by 100 to obtain the percentage changeof a 1-year increase in online availability on thenumber of distinct items cited. All models con-tained measures that statistically control for cita-tion year, average number of pages, and referencesin citing articles.
In each subsequent year from 1965 to 2005,more distinct articles were cited from journalsand subfields. The pool of published science isgrowing, and more of it is archived in the CIeach year. Online availability, however, has notdriven this trend. Figure 2B illustrates the simul-taneous effect of free and online availabilityon the number of distinct articles cited in jour-nals, and the number of distinct articles andjournals cited in subfields. The panels portraythese effects for a hypothetical journal and sub-
field receiving the sample mean of citations.With five additional years of free and commer-cial online availability, the number of distinctarticles cited within journal would drop from600 to 200; the number of articles cited withinsubfields would drop from 25,000 to 15,000;and the number of journals cited within sub-fields would drop from 19 to 16. This suggeststhat online availability may have reduced thenumber of distinct articles and journals citedbelow what it would have been had journalsnot gone online. Provision of one additionalyear of issues online for free associates with14% fewer distinct articles cited.
Fewer distinct articles and journals werecited soon after they went online. Although thisinfluenced the overall concentration of article
Fig. 2. Estimated influence ofcommercial and free online arti-cle availability (in years of jour-nal issues available online) on(A) mean age of citations (basedon OLS regression coefficients);(B) distinct number of articlesand journals cited (based on ex-ponentiated maximum likelihoodnegative binomial regression co-efficients); and (C) Herfindahlconcentration of citations withinparticular articles and journals(based on OLS regression coef-ficients). Each of these relationsis illustrated relative to the sam-ple mean of citation age, number,and concentration; each rela-tion illustrated represents anunderlying model that accountsfor citation year, number ofpages, and number of referencesin citing articles; the underlyingcitation age model also accountsfor the mean weighted age ofweighted title words in citingarticles. Estimated percentagechange, given one additional yearof online availability, for (D)number of distinct articles andjournals cited and (E) Herfindahlconcentration within those cita-tions, when enlarging the windowin which citation measures areevaluated, from 1 to 30 years—1975 to 2005.
www.sciencemag.org SCIENCE VOL 321 18 JULY 2008 397
REPORTS
citations in science, it did not fully determine it.Citations may be spread more evenly over fewerarticles to more broadly disperse scientific atten-tion. To assess the degree to which online pro-vision influences the concentration of citationsto just a few articles (and journals), I computed
a Herfindahl index, where ∑n
j¼1ðs2j Þ represents the
percentage of citations s to each article j,squared and summed across journal or subfieldi within the 20-year time window examined. Aconcentration of 1 indicates that every citationto journal i in a given year is to a single article;a concentration just less than 1 suggests a highproportion of citations pointing to just a fewarticles; and a concentration approaching zeroimplies that citations reach out evenly to a largenumber of articles. Herfindahl concentrations ofarticles cited in journals ranged from 0.0000933to 1 in this sample, with an average of 0.088and a wide standard deviation of 0.195. Whereno articles were cited, no concentrations couldbe computed. Regression models were used toexamine whether citation concentration to arti-cles from the last 20 years could be attributed todepth of online availability. As in previous mod-els, these were estimated for articles within jour-nals and for articles and journals within subfields,by means of both commercial and free electronicprovision. Citation concentrations are approxi-mately normally distributed and the models wereestimated with OLS.
Figure 2C illustrates the concurrent influ-ence of commercial and free online provision onthe concentration of citations to particular ar-ticles and journals. The left panel shows that thenumber of years of commercial availability ap-pears to significantly increase concentration ofcitations to fewer articles within a journal. Ifan additional 10 years of journal issues wereto go online via any commercial source, themodel predicts that its citation concentrationwould rise from 0.088 to 0.105, an increase ofnearly 20%. Free electronic availability had aslight negative effect on the concentration ofarticles cited within journals, but it had a mar-ginally positive effect on the concentration ofarticles cited within subfields (middle panel)and appeared to substantially drive up the con-centration of citations to central journals withinsubfields (right panel). Commercial provisionhad a consistent positive effect on citation con-centration in both articles and journals. The col-lective similarity between commercial and freeaccess for all models discussed suggests thatonline access—whatever its source—reshapesknowledge discovery and use in the same way.For all models, similar results were obtainedwhen journals’ presence in multiple (e.g., one,two, and three or more) commercial archiveswas accounted for and modeled simultaneously.
Although 20 years is not an unreasonablewindow of time within which to examine theeffect of online availability on citations, it doesnot capture the trend of the effect. For example,
one can imagine that online provision increasesthe distinct number of articles cited and decreasesthe citation concentration for recent articles, buthastens convergence to canonical classics in themore distant past. To explore this possibility, Iperformed the same analyses but calculatedvariables with expanding windows ranging fromthe last year to the last 30 years. To keep sam-ples comparable, I estimated all models on datafrom 1975 (1945 plus a 30-year window) to2005, and so the 20-year window coefficients donot correspond perfectly to the effects illustratedearlier. Estimated percentage changes in the num-ber of articles and journals cited and the Herfindahlcitation concentration within those citations werecalculated as associated with a 1-year extensionof online availability. These estimates and theircorresponding 95% confidence intervals aregraphed in Fig. 2, D and E. Increased onlineprovision in the preceding year was associatedwith a decrease in the number of distinct articlescited within journals and articles and journalscited within subfields most in recent years (Fig.2D). A 1-year change in online availabilitycorresponded to a 9% drop in articles cited inthe last year, but only a 7% drop in articlescited in the past 20 and 30 years. The patternwas the same for articles and journals withinsubfields (tables S2 to S4). The citationwindow’s effect on citation concentration wasnot so consistent (Fig. 2E). Nevertheless, in thecase of article concentrations within subfields, theHerfindahl concentration increase was highest—1.5% per year of online availability—when cal-culated for references to only the last year’sarticles.
The models presented are limited in a num-ber of ways. For example, journals such asScience use Supporting Online Material for“Materials and Methods,” which frequently in-clude references not indexed by the CI. It is the-oretically possible, though unlikely, that thesereferences are to earlier or more diverse arti-cles. Moreover, by studying only conventionaljournals, this study fails to capture newer sci-entific media like science blogs, wikis, andonline outlets exploring alternative modelsof peer review. These new media almost un-doubtedly link to extremely recent scientificdevelopments—often through ephemeral Weblinks (13)—but they may also point to morediverse materials.
Collectively, the models presented illustratethat as journal archives came online, eitherthrough commercial vendors or freely, citationpatterns shifted. As deeper backfiles becameavailable, more recent articles were referenced;as more articles became available, fewer werecited and citations became more concentratedwithin fewer articles. These changes likely meanthat the shift from browsing in print to searchingonline facilitates avoidance of older and less rele-vant literature. Moreover, hyperlinking throughan online archive puts experts in touch withconsensus about what is the most important prior
work—what work is broadly discussed and ref-erenced. With both strategies, experts online by-pass many of the marginally related articlesthat print researchers skim. If online research-ers can more easily find prevailing opinion,they are more likely to follow it, leading to morecitations referencing fewer articles. Research onthe extreme inequality of Internet hyperlinks(14), scientific citations (15, 16), and other formsof “preferential attachment” (17, 18) suggeststhat near-random differences in quality am-plify when agents become aware of each other’schoices. Agents view others’ choices as relevantinformation—a signal of quality—and factorthem into their own reading and citation selec-tions. By enabling scientists to quickly reachand converge with prevailing opinion, electronicjournals hasten scientific consensus. But hastemay cost more than the subscription to anonline archive: Findings and ideas that do notbecome consensus quickly will be forgottenquickly.
This research ironically intimates that one ofthe chief values of print library research is poorindexing. Poor indexing—indexing by titlesand authors, primarily within core journals—likely had unintended consequences that as-sisted the integration of science and scholarship.By drawing researchers through unrelated arti-cles, print browsing and perusal may have facil-itated broader comparisons and led researchersinto the past. Modern graduate education parallelsthis shift in publication—shorter in years, morespecialized in scope, culminating less frequent-ly in a true dissertation than an album of arti-cles (19).
The move to online science appears to rep-resent one more step on the path initiated by themuch earlier shift from the contextualizedmonograph, like Newton’s Principia (20) orDarwin’s Origin of Species (21), to the modernresearch article. The Principia and Origin, eachproduced over the course of more than a decade,not only were engaged in current debates, butwove their propositions into conversation withastronomers, geometers, and naturalists from cen-turies past. As 21st-century scientists and scholarsuse online searching and hyperlinking to frameand publish their arguments more efficiently, theyweave them into a more focused—and morenarrow—past and present.
References and Notes1. R. Reddy et al., “Digital Libraries: Universal Access to
Human Knowledge” (President’s Information TechnologyAdvisory Committee, Panel on Digital Libraries, 2001);www.nitrd.gov/pubs/pitac/pitac-dl-9feb01.pdf.
2. The report (1) qualifies the vision of universal access,but only by admitting that “more ‘quality’ digitalcontents” must be made available and better ITinfrastructure must deliver them.
3. M. McLuhan, Understanding Media (McGraw-Hill,New York, 1964), chap. 1.
4. S. Black, Libr. Resour. Tech. Serv. 49, 19 (2005).5. S. L. De Groote, J. L. Dorsch, J. Med. Libr. Assoc. 91, 231
(2003).6. C. Tenopir, B. Hitchcock, S. A. Pillow, “Use and Users of
Electronic Library Resources: An Overview and Analysis of
18 JULY 2008 VOL 321 SCIENCE www.sciencemag.org398
REPORTS

Recent Research Studies” (Council on Library andInformation Resources, Washington, DC, 2003).
7. A. Friedlander, “Dimensions and Use of the ScholarlyInformation Environment: Introduction to a Data SetAssembled by the Digital Library Federation and Outsell,Inc.” (Council on Library and Information Resources,Washington, DC, 2002); www.clir.org/pubs/reports/pub110/contents.html.
8. P. Boyce, D. W. King, C. Montgomery, C. Tenopir,Ser. Libr. 46, 121 (2004).
9. C. Tenopir, D. W. King, A. Bush, J. Med. Libr. Assoc. 92,233 (2004).
10. C. Shirky, “Ontology is Overrated: Categories, Links andTags” (Clay Shirky’s Writings About the Internet:Economics & Culture, Media & Community, Open Source,2005); www.shirky.com/writings/ontology_overrated.html.
11. C. Manning, H. Schütz, Foundations of Natural LanguageProcessing (MIT Press, Cambridge, MA, 1999).
12. J. Hausman, B. H. Hall, Z. Griliches, Econometrica 52,909 (1984).
13. R. P. Dellavalle et al., Science 302, 787 (2003).14. A. L. Barabási, R. Albert, Science 286, 509 (1999).15. R. K. Merton, Science 159, 56 (1968).16. D. J. de Solla Price, Science 149, 510 (1965).17. H. A. Simon, Biometrika 42, 425 (1955).18. M. J. Salganik, P. S. Dodds, D. J. Watts, Science 311, 854
(2006).19. J. Berger, “Exploring ways to shorten the ascent to a Ph.D.,”
New York Times, 3 October 2007; www.nytimes.com/2007/10/03/education/03education.html.
20. I. Newton, Principia (Macmillan, New York, ed. 4, 1883)(first published in 1687).
21. C. Darwin, The Origin of Species (D. Appleton, New York,1867) (first published in 1859).
22. I gratefully acknowledge research support from NSF grant0242971, Science Citation Index data from ThompsonScientific, Inc., and Fulltext Sources Online data fromInformation Today, Inc. I also thank J. Reimer for helpfuldiscussion and insight.
Supporting Online Materialwww.sciencemag.org/cgi/content/full/321/5887/395/DC1MethodsTables S1 to S4References
13 September 2007; accepted 9 June 200810.1126/science.1150473
The Evolution and Distribution ofSpecies Body SizeAaron Clauset1* and Douglas H. Erwin1,2
The distribution of species body size within taxonomic groups exhibits a heavy right tail extendingover many orders of magnitude, where most species are much larger than the smallestspecies. We provide a simple model of cladogenetic diffusion over evolutionary time that omitsexplicit mechanisms for interspecific competition and other microevolutionary processes, yet fullyexplains the shape of this distribution. We estimate the model’s parameters from fossil data andfind that it robustly reproduces the distribution of 4002 mammal species from the lateQuaternary. The observed fit suggests that the asymmetric distribution arises from a fundamentaltrade-off between the short-term selective advantages (Cope’s rule) and long-term selective risksof increased species body size in the presence of a taxon-specific lower limit on body size.
Most taxonomic groups show a commondistribution of species body size (1–3),with a single prominent mode relative-
ly near but not at the smallest species size (4) anda smooth but heavy right tail (often described as aright skew on a log-size scale) extending for sev-eral orders of magnitude (e.g., Fig. 1). This dis-tribution is naturally related to a wide variety ofother species characteristics withwhich body sizecorrelates, including habitat, life history, life span(5), metabolism (6), and extinction risk (7). Agreater understanding of the underlying con-straints on, and long-term trends in, body size evo-lution may provide information for conservationefforts (8) and insight about interactions betweenecological and macroevolutionary processes (9).
Studies of body-size distributions have sug-gested that the prominent mode may be indica-tive of a taxon-specific energetically optimal bodysize (10, 11), which is supported by microevo-lutionary studies of insular species (12). However,evidence for Cope’s rule (1, 13, 14)—the obser-vation that species tend to be larger than theirancestors—and the fact that most species are notclose to their group’s predicted optimal size[among other reasons (15)] suggest that this
theory may be flawed. Alternatively, species bodysizes may diffuse over evolutionary time. If so,Cope’s rule alone could cause size distributionsto exhibit heavy right tails (1), although size-dependent speciation or extinction rates (2, 9, 16)or size-neutral diffusion near a taxon-specific lowerlimit on body size (17) could also produce a sim-ilar shape. Furthermore, different mechanismsmay drive body-size evolution on spatial and tem-poral scales (3), and the importance of inter-specific competition to the macroevolutionarydynamics of species body size is not known.
We developed a generalized diffusion modelof species body-size evolution, in which the sizedistribution is the product of three macroevolu-tionary processes (Fig. 1). We combine theseprocesses, each of which has been independentlystudied (1, 2, 17, 18), in a single quantitativeframework, estimate its parameters from fossildata on extinct terrestrial mammals from beforethe late Quaternary (19, 20), and determinewhether this model, or simpler variants, can re-produce the sizes of the 4002 known extant andextinct terrestrial mammal species from the lateQuaternary (Recent species) (21, 22).
This model makes three assumptions: (i)Species size varies over evolutionary time as acladogenetic multiplicative diffusion process(1, 17); the size of a descendant species xD is theproduct of a stochastic growth factor l and itsancestor’s size xA, that is, xD = lxA. For eachspeciation event, a new l is drawn from the dis-
tribution F(l), which models the total influenceon species size changes from all directions. Abias toward larger sizes (Cope’s rule) appears as apositive average log-change to size ⟨log l⟩ > 0,andmay depend on the ancestor’s size. (ii) Speciesbody size is restricted by a taxon-specific lowerlimit xmin (6, 23), which we model by requiringthat F(l < xmin/xA) = 0, that is, the largest possibledecrease in size for a particular speciation event isl = xmin/xA. In our computer simulations, timeproceeds in discrete steps. At each step, exactlyone new species is produced, which is the de-scendant of a randomly selected species. (iii) Everyspecies independently becomes extinct with prob-ability pe(x), which increases monotonically withsize. A schematic of the model is shown inFig. 2A. [For technical details, see (24).]
To make this model appropriately realistic,we estimated the form of each process from fossildata. The lower limit on mammalian body size isnear 2 g, close to the size of both the Etruscanshrew (Suncus etruscus) and the bumblebee bat(Craseonycteris thonglongyai). Fossil evidencesuggests that this limit has existed since at leastthe Cretaceous-Tertiary boundary (19, 20, 25).Further, a limit in this vicinity is supported by both
1Santa Fe Institute, 1399 Hyde Park Rd., Santa Fe, NM 87501,USA. 2Department of Paleobiology, MRC-121, National Museumof Natural History, Post Office Box 37012, Washington, DC20013–012, USA.
*To whom correspondence should be addressed. E-mail:[email protected]
100
101
102
103
104
105
106
107
108
Lo
g D
ensi
ty
Body size (g)
Lowerboundaryeffects
Diffusion andshort−term
selective advantages
Long−term riskof extinction
Fig. 1. Smoothed species body-size distribution of4002 Recent terrestrial mammals [data from (21)],showing the three macroevolutionary processesthat shape the relative abundances of differentsizes. The left tail of the distribution is created bydiffusion in the vicinity of a taxon-specific lowerlimit near 2 g, whereas the long right tail is producedby the interaction of diffusion over evolutionary time(including trends like Cope’s rule) and the long-termrisk of extinction from increased body size.
www.sciencemag.org SCIENCE VOL 321 18 JULY 2008 399
REPORTS