Embed Size (px)
Citation preview

Electrodialytic technology as effluent treatment for reuse in construction materials
C Magro, LM Ottosen, EP Mateus, AB Ribeiro
5th International Conference on Sustainable Solid Waste Management21-24 June 2017, Athens, Greece

Source: World climate change challenge
Why? Water StressConcrete is the 2nd material most consumed
Water is the 1st
water–cement ratio: weight of water to weight of cement used in a concrete mix ≈ 0.45 to 0.60
800 billion liters of water used in 1 year !!!!! 2

+
Fresh water safety– Contribute to circular economyLess wastewater volume discharged in water bodiesSimilar chemical characteristics comparing to tap water
x Wastewater with micro-organisms, heavy metals and salts
3
Solution?Wastewater Pre-treatment with Electrodialytic Process (ED)
WIN-WIN SOLUTION
Effluent 2nd clarifierBefore chlorination
Building MaterialsMortars specimens
Aim
ED technology optimization:
to remove heavy metals, salts [Cl- (oxidation of iron), SO2-4 (crack
formation)], macro & micro elements;
to neutralize micro-organisms in effluents
Viability to use ED treated effluent in construction materials (mortars) as an alternative to tap water
4
? ?
Wastewater Pre-treatment with Electrodialytic Process

5
Electrolyte NaNO3
Effluent under treatment
Electrodialytic Pre-treatment
DC power
AnodeCathode
‐ +
CEM AEM
OH‐ H+
Cn+ An‐
Wastewater Pre‐treatment Electrodialytic Process (ED)
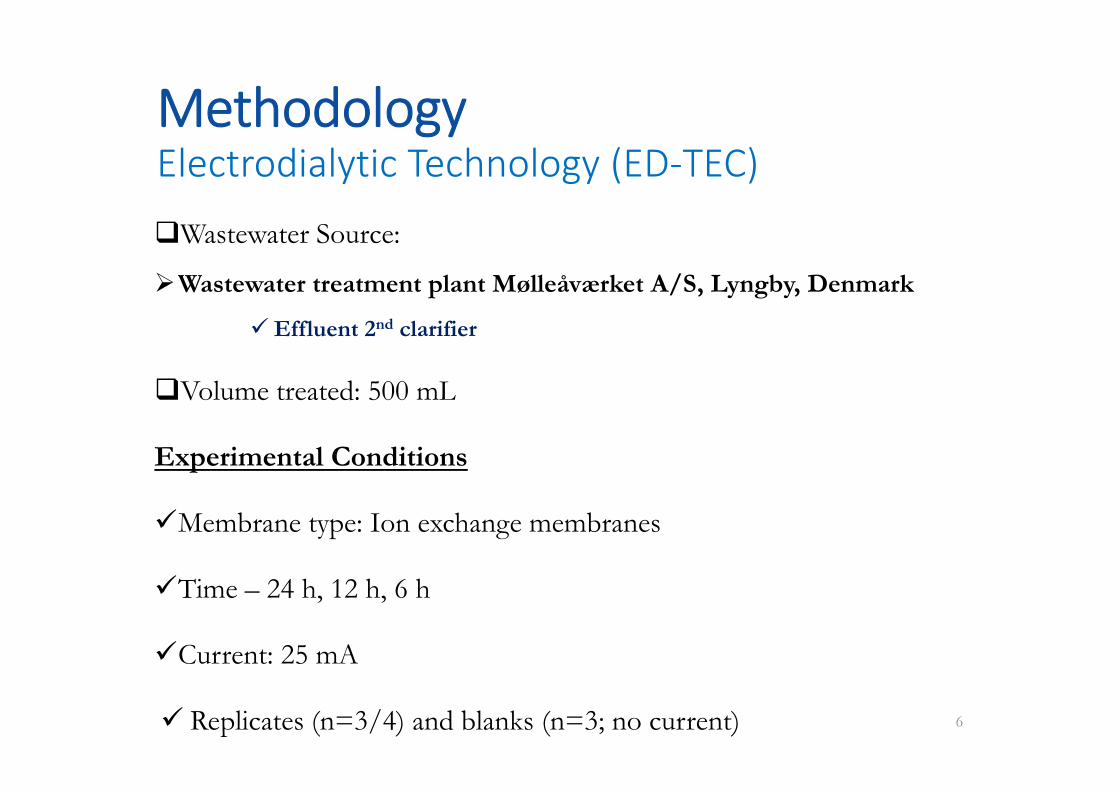
Methodology Electrodialytic Technology (ED‐TEC)
Wastewater Source:
Wastewater treatment plant Mølleåværket A/S, Lyngby, Denmark
Effluent 2nd clarifier
Volume treated: 500 mL
Experimental Conditions
Membrane type: Ion exchange membranes
Time – 24 h, 12 h, 6 h
Current: 25 mA
Replicates (n=3/4) and blanks (n=3; no current) 6

Methodology Casting of specimens*
Replacement of Tap Water by Effluent: 50% and 100%
(Ordinary Portland Cement – OPC - 0.5 w/c ratio – prisms 40×40×160mm)
Raw (effluent without Electrodialytic pre-treatment)
ED- T (effluent with ED pre-treatment – 24 h, 12 h, 6 h)
Reference
7
*Casting of specimens – it is the action of making mortars

MethodologyProperty & Environmental tests
8
Mortar property Tests - Compared with mortar REF
Setting time (ref; raw; ED- T - final acid pH )
Compressive strength - (Age: 7, 14, 28 days)
Bending strength - (Age: 7, 14, 28 days)
Mortar Environmental tests
Leaching of HM and salts
9
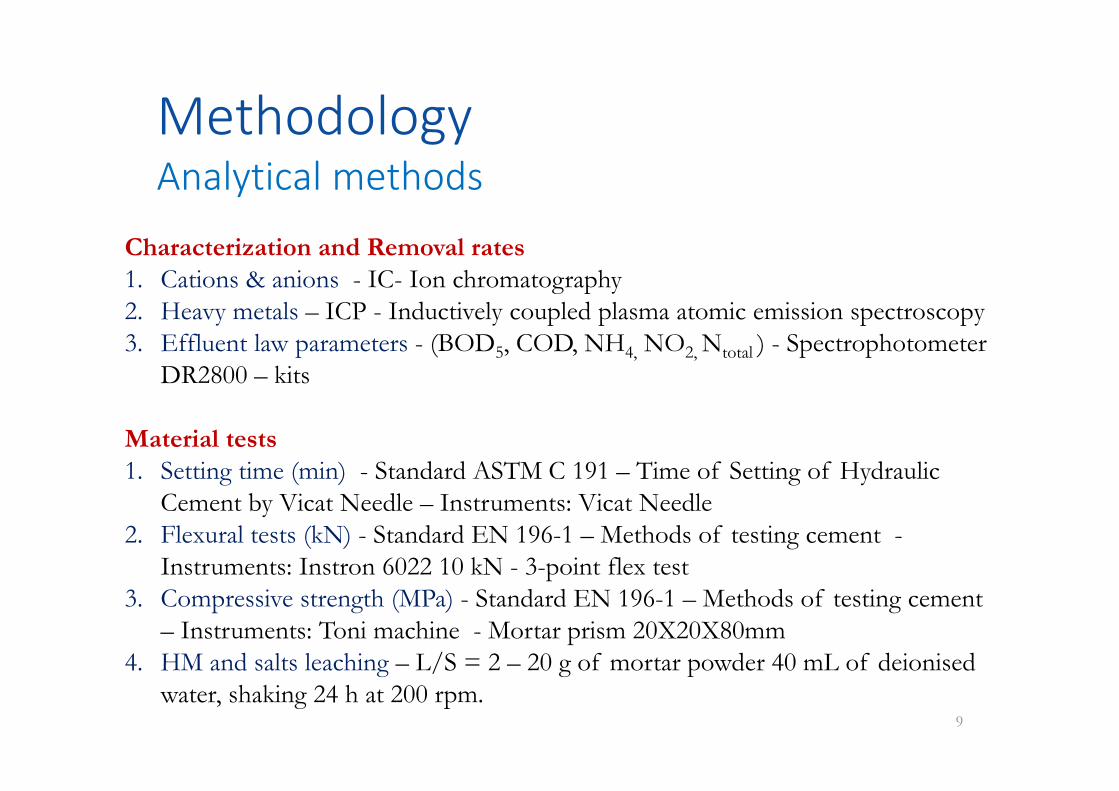
Characterization and Removal rates1. Cations & anions - IC- Ion chromatography2. Heavy metals – ICP - Inductively coupled plasma atomic emission spectroscopy3. Effluent law parameters - (BOD5, COD, NH4, NO2, Ntotal ) - Spectrophotometer
DR2800 – kits
Material tests 1. Setting time (min) - Standard ASTM C 191 – Time of Setting of Hydraulic
Cement by Vicat Needle – Instruments: Vicat Needle2. Flexural tests (kN) - Standard EN 196-1 – Methods of testing cement -
Instruments: Instron 6022 10 kN - 3-point flex test3. Compressive strength (MPa) - Standard EN 196-1 – Methods of testing cement
– Instruments: Toni machine - Mortar prism 20X20X80mm4. HM and salts leaching – L/S = 2 – 20 g of mortar powder 40 mL of deionised
water, shaking 24 h at 200 rpm.
MethodologyAnalytical methods

10
Results and Discussion

11
Effluent Tap Water
pH 7.9 ± 0.3 7.7 ± 0.1Conductivity (µs/cm) 1304.5 ± 109.6 755.5 ± 23.3
Macro-elementsCa 115.1 ± 13.3 113.9K 24.2 ± 0.7 5.3
Mg 15.7 ± 0.9 20.7Na 118.7 ± 0.7 38.5S 20.6 ± 1.9 8.7
Micro-elementsNi 0.04 ± 0.02 0.005Si 8.4 ± 0.4 8.8Zn 0.05 ± 0.02 0.35
SaltsCl- 207.3 ± 3.9 63.0 ± 2.2
SO2-4 65.7 ± 2.3 31.7 ± 2.2
MatrixInitial characterization

ED‐TECpH and Conductivity (mS/cm)
FinalInitial
12
0,0
0,2
0,4
0,6
0,8
1,0
1,2
1,4
1,6
Con
du
ctiv
ity
(mS/
cm)
ED-T 24 ED-T 12 E-T 6
FinalInitial0123456789
pH
Increasing the duration time = Higher acidification of the matrices= Lower conductivity

Energy consumption
ED-T (24) - 25 W/h - 0.0080 €
ED-T (12) -13 W/h - 0.0040 €
ED-T (6) - 3 W/h - 0.0009 €
13

14
(mg/L) Ca K Mg Na Ni S Si Zn
Initial 115.1 24.9 14.7 117.9 0.01 22.7 79.2 0.04Final ED-T
240.3 0.5 0.05 0.5 0.004 0.2 24.5 0.01
Removal (%) 99.8% 98.1% 99.7% 100% 54.8% 99.2% 69.1% 74.6%Final ED-T
120.3 0.3 0.04 1.5 0.003 0.2 40.0 0.01
Removal (%) 99.8% 98.9% 99.7% 98.7% 70.7% 99.0% 49.6% 75.1%Final ED-T
65.9 1.2 1.2 10.2 0.004 3.0 7.5 0.03
Removal (%) 94.9% 95.4% 92.1% 99.1% 59.8% 87.0% 90.6% 27.3%
ED‐TEC Elements ‐Removal Rates (%)
Ca, Mg, K and Na = complexes with Sulfates = crack formation Removal range of 92-100%

ED‐TECRemoval Rates (%) ‐ Cl‐ and SO2‐
4Higher than 85%
Cl- SO2-4
Initial concentration 207.3 65.7
Final concentration (mg/L) ED-T 24 1.98 0.40Removal(%) 99% 99%
Final concentration (mg/L) ED-T 12 2.09 0.20Removal(%) 99% 99%
Final concentration (mg/L) ED-T 6 23.14 9.99Removal(%) 89% 85%
15
Cl- = promoting of iron oxidation = corrosion process SO2-
4 = lead to a crack formation Removal ≥ 85 %

Mortars TestsSetting time (min)
16
pHwater
=7pHefflu=7-8 pHefflu=4-5
Delay in the hydration time = impurities and organic matter that still remain in the effluent Still with no significant changes according to Standard ASTM C 191 Uses: hot weather conditions
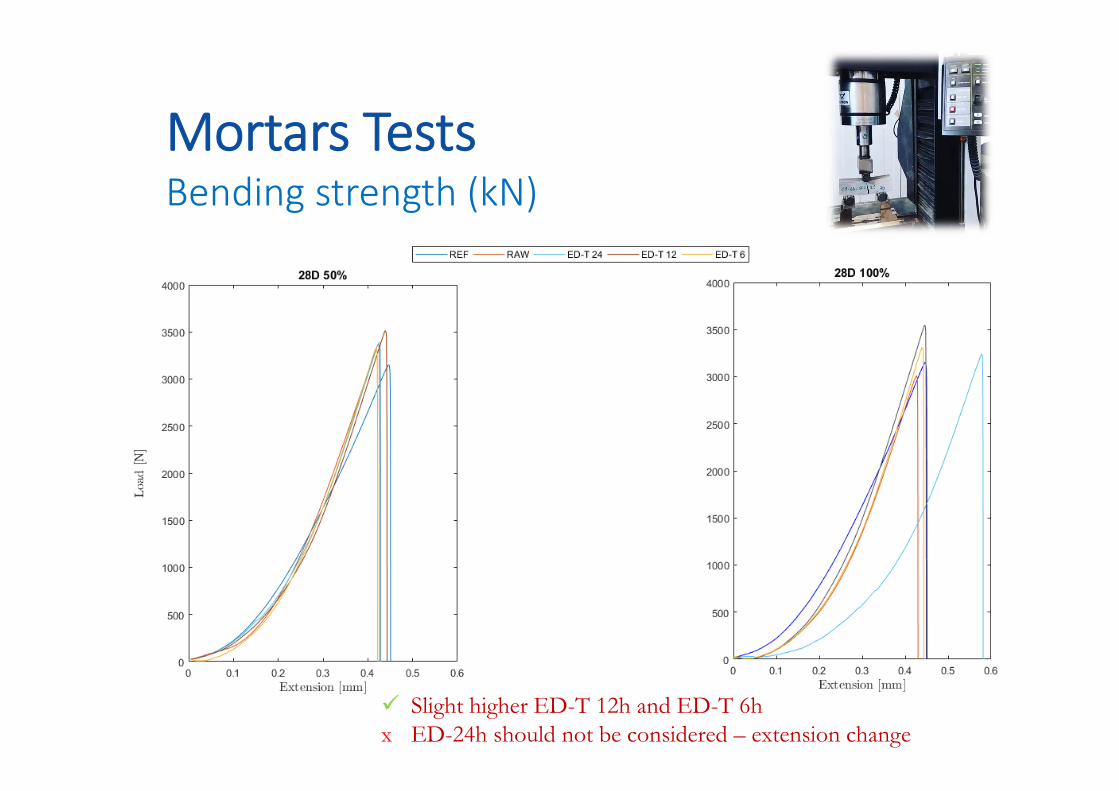
Mortars TestsBending strength (kN)
Slight higher ED-T 12h and ED-T 6hx ED-24h should not be considered – extension change
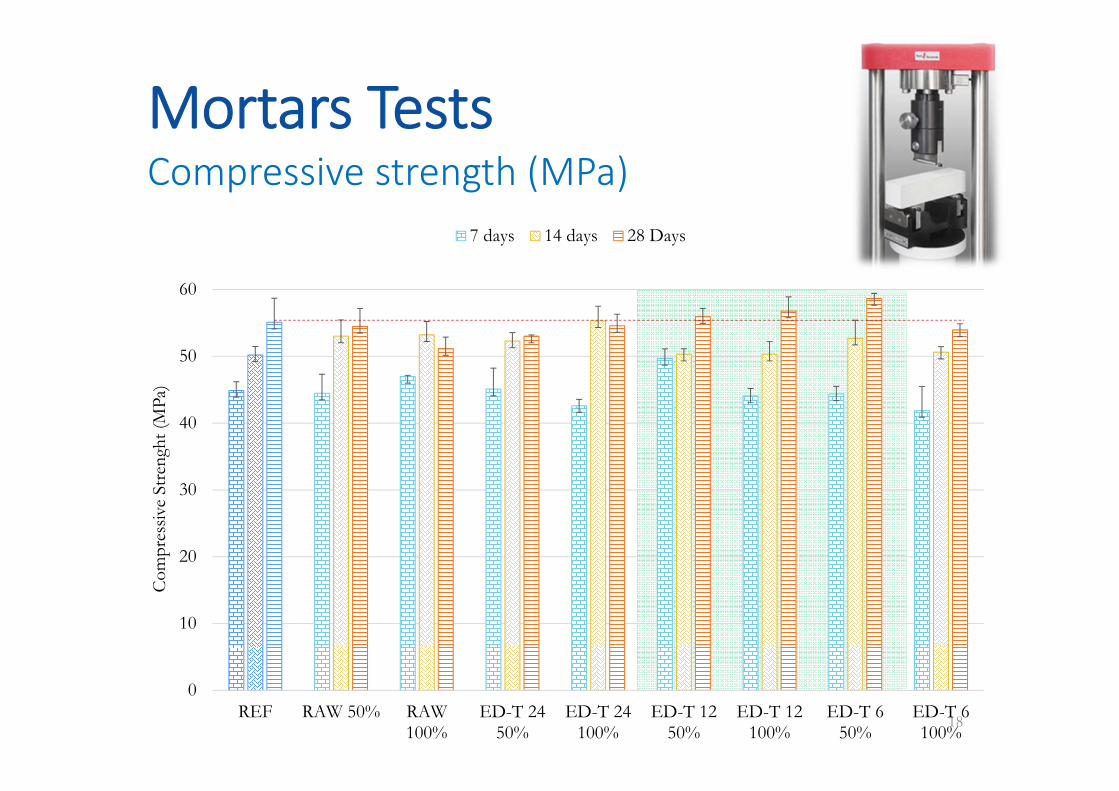
Mortars TestsCompressive strength (MPa)
18
0
10
20
30
40
50
60
REF RAW 50% RAW100%
ED-T 2450%
ED-T 24100%
ED-T 1250%
ED-T 12100%
ED-T 650%
ED-T 6100%
Com
pres
sive
Stre
nght
(MPa
)
7 days 14 days 28 Days
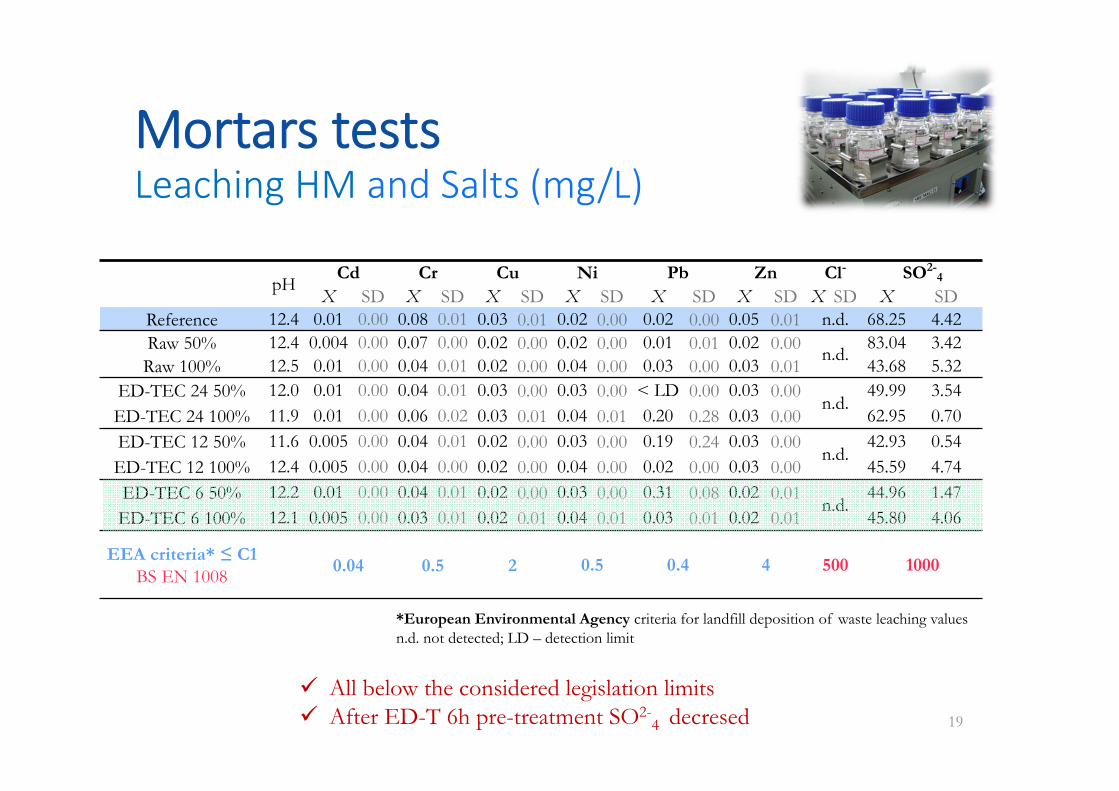
Mortars testsLeaching HM and Salts (mg/L)
*European Environmental Agency criteria for landfill deposition of waste leaching valuesn.d. not detected; LD – detection limit
19
pH Cd Cr Cu Ni Pb Zn Cl- SO2-4
X SD X SD X SD X SD X SD X SD X SD X SDReference 12.4 0.01 0.00 0.08 0.01 0.03 0.01 0.02 0.00 0.02 0.00 0.05 0.01 n.d. 68.25 4.42Raw 50% 12.4 0.004 0.00 0.07 0.00 0.02 0.00 0.02 0.00 0.01 0.01 0.02 0.00 n.d. 83.04 3.42Raw 100% 12.5 0.01 0.00 0.04 0.01 0.02 0.00 0.04 0.00 0.03 0.00 0.03 0.01 43.68 5.32
ED-TEC 24 50% 12.0 0.01 0.00 0.04 0.01 0.03 0.00 0.03 0.00 < LD 0.00 0.03 0.00n.d.
49.99 3.54ED-TEC 24 100% 11.9 0.01 0.00 0.06 0.02 0.03 0.01 0.04 0.01 0.20 0.28 0.03 0.00 62.95 0.70ED-TEC 12 50% 11.6 0.005 0.00 0.04 0.01 0.02 0.00 0.03 0.00 0.19 0.24 0.03 0.00
n.d.42.93 0.54
ED-TEC 12 100% 12.4 0.005 0.00 0.04 0.00 0.02 0.00 0.04 0.00 0.02 0.00 0.03 0.00 45.59 4.74ED-TEC 6 50% 12.2 0.01 0.00 0.04 0.01 0.02 0.00 0.03 0.00 0.31 0.08 0.02 0.01
n.d.44.96 1.47
ED-TEC 6 100% 12.1 0.005 0.00 0.03 0.01 0.02 0.01 0.04 0.01 0.03 0.01 0.02 0.01 45.80 4.06
EEA criteria* ≤ C1BS EN 1008 0.04 0.5 2 0.5 0.4 4 500 1000
All below the considered legislation limits After ED-T 6h pre-treatment SO2-
4 decresed

Conclusions (1)
20
ELECTRODIALYTIC EXPERIMENTS - EFFLUENTElements removal
30% - 99%MORTAR PROPERTY AND ENVIRONMENTAL TESTSSetting times
Effluent re-use increased the final setting timeCompressive tests
Strength tests in the range 51-59 MPa (Ref range 53-55MPa)Flexural tests
ED-T 12 and ED-T 6 slightly higher or with similar resistancecomparing to the Ref
Leaching of heavy metals
All the values bellow EEA criteria (HM) and BS EN 1008 (salts)
Salts removal
85%-99%

Conclusions (2)
21
ED-T 6h
100% or 50% Re-Use
Removal rates of the main concern elements ± 86% Materials and environmental tests
Energy consumption – 3.4 W/h – 0.0009€
Effluent similar with the tap water

Acknowledgements
• Financial support was provided by project “Development ofNanostrutures for Detection of Triclosan Traces on AquaticEnvironments” (PTDC/FIS-NAN/0909/2014)
• CENSE-Center for Environmental and SustainabilityResearch which is financed by national funds fromFCT/MEC (UID/AMB/04085/2013)
• C. Magro acknowledges Fundação para a Ciência e aTecnologia for her PhD fellowship (SFRH/BD/114674/2016)
• ARTEK team
22

|Thank you|
23