Embed Size (px)
Citation preview
I.
UgNROL-TR-08-2615 January 1966
- ELECTROCHEMICAL CORROSION STUDIES0 OF GALVANICALLY COUPLED SNAP-21 MATERIALS
I byO0. A. Kubose
H. I. Cordova
U.S. NAVAL RADIOLOGICALDEFENSE LABORATORY
SAN FRANCISCO -CALIFORNIA 94135
DC1- ,,
ýctz b~n crpm~"T
NUCLEAR APPLICATIONS BRANCH
D. L. Love, Head
NUCLEAR TECHNOLOGY DIVISIONR. Cole, Head
ADMINISTRATI"E INFOP04ATION
The work reported is part of a projectsponsored by the Atomic Energy Commission,DRD&T Program, under AT-RDT-XP-14l, Tasks2a and 3b.
DDC AVAILABILITY NOTICE
This document has been approved forpublic release and sale; its distributionis unlimited.
a iiv ....... ... ...I
. .*oo.*.. ...............................
Euehn PCopertor C0,mpbd, OCA r Sn ie
Technical Director Ccornmanding Officer and Director
ABSTRACT
Electrochemical corrosion rate measurements on materials used int'he SNAP-21 radioisotopically-fueled power system have been made inseawater at room temperature. The materials examined included aluminum,copperHastelloy C, Hastelloy X, nickel, 304 stainless steel, tantalum,titanium- 6 21 alloy and uranium-8 % molybdenum alloy. The normal corro-sion rate of each material was measured by means of galvanostaticpolarization techniques. A galvanic series of the materials in seawaterwas determined and the galvanic currents between galvanically coupledmaterials were measured with a zero-resistance ammeter circuit. Theeffect of galvanic coupling of construction materials of the SNAP-21system does not materially change the containment time of the Sr-90fuel in the corrosive seawater environment.
tq
SUMLA RY
The Problem
RrdioloCgical-ssfety consideration of the sNAI-22 radioisotopically-fueled power system (.Yr marine environment use) requires that the cor-rosion behavior in senwater of the various materiels used in the inte-rior construction of the system be known in the event that the pressurevessel, made of titnr, 'um 621 alloy) is broached. Materials used in theinterior of the systrm include: aluminirrn, copper, Hastelloy C, Hastel-loy X, nickel, 304 stainless steel, tantaluvn, and uranium- 8 % molyb-denum alloy. Knowledge of the se~awater corrosion behavior of thesematerials individually and galvanically coupled will permit estimatesof how long the radioactive fuel would be contained in the event thatseawater entered the interior of the SNAP-21 system.
The Findings
Experiments were conducted tc determine (1) the normal (i.e.,uncoupled) corrosion rate of each material in seawater, (P) h galvanicseries of the materials in seawater and (3) the effect on the corrosionrate of galvanically courling the materials in seawater. The resultsof these experiments indicated that if seawater Fnterel the interior ofthe SNAP-21 system, the radlologial hazard to man would not constitutea serious threat, since the Cue] woula remain contained for a relativelylong period of time.
It is felt that studies such as those carries out here would be ofvalue in evaluating other radioisotcjpia-a]Iy-fueled :,NAP systems in theNavy's SNAP program from the stcrrdpoint of radiological spfety.
li
C
I. INTRODUCTION
The SNAP-21 system has been designed and is presently being deve]-oped by the Minnesota Mining and Manufacturing Company (3M) under thesponsorship of the Division of 9eactor Development and Technology ofthe United States Atomic Energy Commission. The system is a radioiso-topically-fueled power source providing 10 watts of electrical energythrough thermoelectric conversion of the radioisotopically generatedheat energy.
The radioisotopic nature of the fuel material, strontium-90 tita-nate, dictates that utmost precautioits be taken to insure that man willnot be subjected to its radiological hazards under credible accidentsituations.
Under normal deployment conditions the outside pressure vessel,made of titanium 621, is the only pert. of the system exposed to theocean environment. It is possible, however, that seawater may enterthe interior of the system in the event of a severe accident situation.Since there are a variety of metallic materials used in the interior ofthe SNAP-21 system, the presence of seawater can establish galvaniccells between them. This situation can lead to accelerated corrosionof these materials.
Because of these considerations it is necessary to examine thecorrosion behavior of the materials comprising the SNAP-21 systemresulting from exposure to seawater.
This report describes studies, using electrochemical techniques, todetermine the corrosion behavior of the various materials used in theconstruction of the SNAP-21 system. These materials include aluminum,copper, Hastelloy C, Hastelloy X, nickel, 304 stainless steel, tantalum,titanium 621 alloy and uranium-8 % molybdenum alloy.
Three types of results are presented: (]) the normal (i.e., uncoup-led) corrosion rate of each material; (2) a galvanic series of the ma-terials; and (3) the effect of galvanically coupling the materials.From the integration of these results an attempt was made to estimatehow long the radioisotopic fuel would be contained.
1J
II. EXPERDUENTAL
The test specimens of the SNAP-21 materials were fabricatedat NRDL into electrodes frorn bar stock provided by 3M. The test elec-trodes were fabricated in the shape of right circular cylinders 0.5 in.in height and 0.25 in. in diameter (the U-8 % Mo electrodej fabricatedfrom larger bar stock, was larger: 0.5 in. in height and 0.5 in. indiameter). Each electrode had a 4-40 threaded stud extending fron oneend for mounting on the electrode holder assembly of the polarizationapparatus. Before use, each electrode was polished (finishing with600 grit) and then ultrasonically cleaned in benzene and absolute etha-nol. Immediately before immersion in the test seawater the electrodeswere rinsed with distilled water.
The seawater used for the corrosion tests was collected about amile from the Farallon Islands, located about 20 miles off the northernCalifornia coast at San Francisco. Before use the seawater was filteredthrough a Millipore filter (0.8 micron).
Conditions of aeration and deaeration of the seawater were achievedby continuous purging with air or nitrogen. All measurements were con-ducted at ambient room temperature (ca. 230 0).
Measurement of Normal Corrosion Rates
The normal corrosion rate of each of the SNAP-21 materials wasdetermined by use of the galvanostatic polarization technique. Thetheory behind the application of the techniques has been adequatelydescribed in the literature.* A description of the polarization equip-ment and the experimental techniques used in this work has been givenelsewhere. 1
In essence the galvanostatic technique is to cathodically andanodically polarize the test electrode from its open-circuit potentialby application of an external current. The degree of polarization,measured as overvoltage E, is plotted against the logarithm of theapplied current density, i. For values of E greater than about 50 mysuch a plot should yield a straight line with slope Oc for cathodicpolarization and Oa for anodic polarization. Values of the corrosioncurrent density, icorr, can be obtained from such measurements in two
ways. One consists of applying the relation2 ,3
*See for example M. G. Fontana and N. D. Greene, Corrosion Engineering.New York, McGraw Hill Book Company, 1967, Chapters 9 and 10.
2

-. a~ (1)
•- f corr(.(a+c
where AE/Ai is the slope near the region of the open-circuit potential(i.e., E less than about 50 my) for which the change of E with i islinear. The other method of obtaining icorr is the extrapolation ofthe line of slope Oc to the open-circuit potential. The current densityat the intersection represents the dissolution rate of the electrodeand hence its corrosion rate in terms of current density.
Determination of Galvanic Series and of Effect orGalvanic Coupling (Currents)
The open-circuit potential of each test electrode was measured withrespect to a saturated calomel reference electrode (SCE) in aerated andin deaerated seawater. All of the test electrodes were immersed in acommon container while the measurements were made. These potentials werethe basis for determining a galvanic series of the SNAP 21 materials.
The galvanic currents betwee:, each of the materials in turn and allthe others, as a group, when short-circuited (i.e., galvanically coupled)to each other, were measured, in aerated and deaersted seawater, in thefollowing manner. After the open-circuit potentials were determined, allbut one, say Hastelloy X, of the test electrodes were short-circuited toeach other. The connection between the shorted group of electrodes andHastelloy X was made via a zero resistance ammeter circuit (ZRA) des-cribed by Greene. 4 Now, in effect, all of the other electrodes wereshorted to each other so that the galvanic current between Hastelloy X andand the shorted group of electrodes could be measured. After measurementof this galvanic current, the ZRA was disconnected from the Hastelloy X,the Hastelloy X shorted (now directly) to the shorted rroup of electrodes,and a different electrode disconnected from the shorted group (which nowincluded Hastelloy X) and re-connected to the shorted group via the ZRA.The galvanic current between this new single electrode and the new shortedgroup was measured. This procedure was followed until the galvanic cur-rent between each electrode and the shorted group had been measured(the shorted group being different for each measurement); these currentswere denoted as the first set. Examination of this first set of gal-vanic currents revealed, by their direction, which electrode (or elec-trodes) was the anode in reference to the other electrodes. Thiselectrode (or electrodes) was disconnected entirely and the aboveprocedure repeated to obtain a second set of galvanic currents.This second set revealed another anodic electrode(s). It was dis-connected entirely (so that now two electrodes had been removed) andthe entire procedure repeated again to obtain a third set of ,-alvaniccurrents. This procedure was followed until only two electrodes
3
4'
remained, the galvanic current (the last set) between them also beingmeasured by the ZRA. This technique, in addition to providing the gal-vanic currents, provides an independent determination of the galvanicseries. The anodic electrode in the first set of galvanic currents isthe most active and the remaining electrode after the last set is themost noble.
Determination of Polarization Behavior(Potentials)
The polarization behavior (see discussion in Section III) of thevarious anodic and cathodic members of the galvanic couples was deter-mined in the following manner with a new set of test electrodes. Afterthe open-circuit potential of each test electrode was individually meas-ured (against the SCE), all but the test electrode with the most negativepotential (the anode: most active in the galvanic series) were shortedtogether. The potential of this shorted group (the cathode) was measuredagainst the SCE; then the anode and cathode were shorted to each otherand the potential of the resulting couple measured against the SCE. Afterthese potential measurements were completed the electrode which was theanode was disconnected and put aside. Another electrode, the one nextmost negative in potential, was disconnected from the shorted group andbecame the new anode (the shorted group, minus this electrode, became thenew cathode). The above set of potential measurements was recorded in thesame sequence with this new set of anode, cathode and couple. (The couplefor this set was of course the cathode for the previous set. However cath-ode and couple readings were repeated for each set.) This procedure wasrepeated until only two electrodes remained, the cathodic one being themost noble* in the galvanic series and the anodic one being the next mostnoble. Comparison of the potentials of the various cathodes (consistingof the various shorted groups of electrodes) and anodes with their respec-tive coupled potentials permitted evaluation of their respective polariza-tion behavior.
In both the normal and the galvanic corrosion rate determinations theelectrochemical equivalents of the corrosion rate, i.e., the corrosion 2current and the galvanic current in terms of current density (P amp/cm2 ),were measured. Faraday's Law was then used to translate these values ofcurrent density into a more immediately useful quantity such as mil peryear (mpy). In application of F'araday's Law the following valencies wereassumed for the corrosion products in seawater: +2 for nickel, copper, 304stainless steel, Hastelloy C and Hastelloy X; +3 for Al; +4 for titanium621 and Uranium-8 % molybdenum, +5 for tantalum. The relationship betweencurrent density in mamp/cm2 and corrosion rate in mpy is
Corrosion rate, mpy 11 0.129 eqVO,/ urn density,gý*mp/cm) (2)
(dnsty glum
where the equivalent aeight (g) and density (g/cn 3) refer to the electrodematerial.vanhic turned out to be Hastelloy X, for both aerated and deaerated seawater.
4
III. RESULTS AND DISCUSSION
SI Normal Corrosion Rates
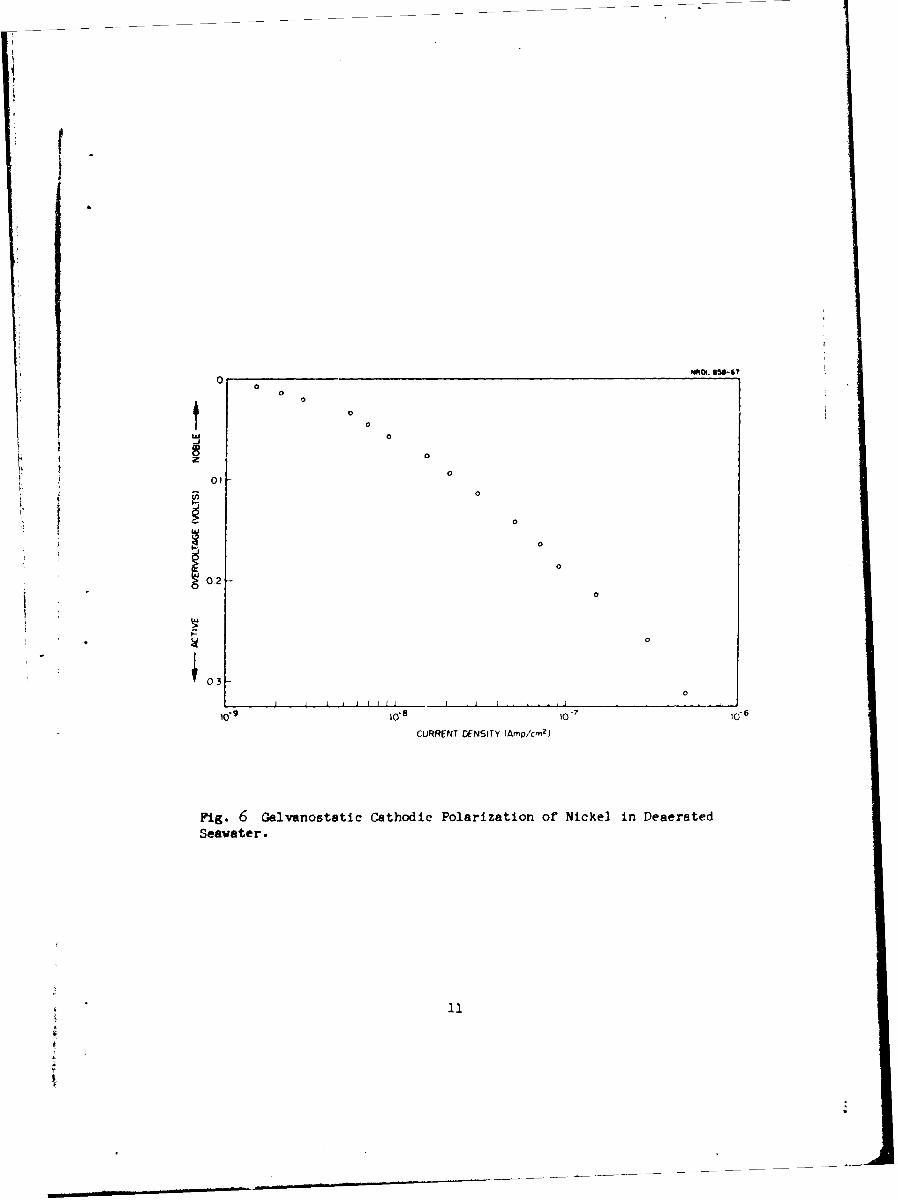
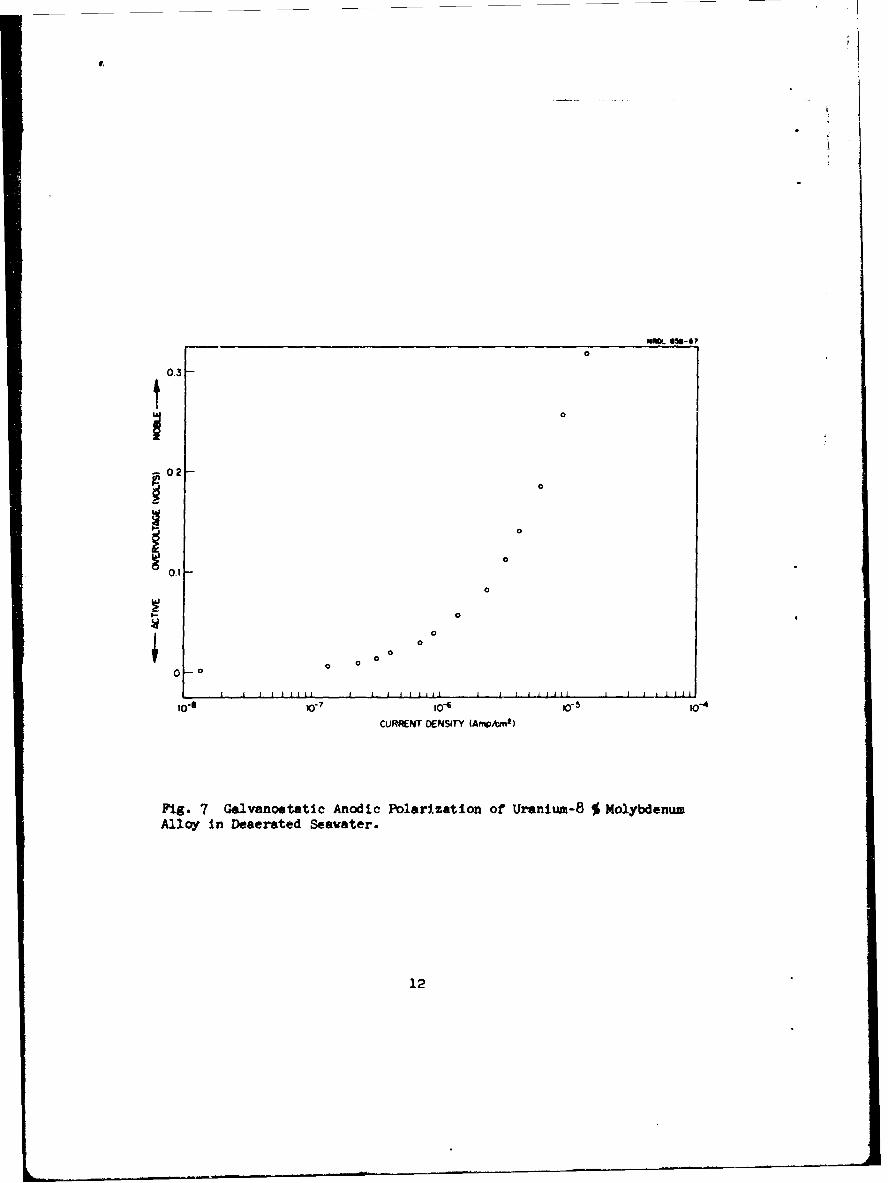
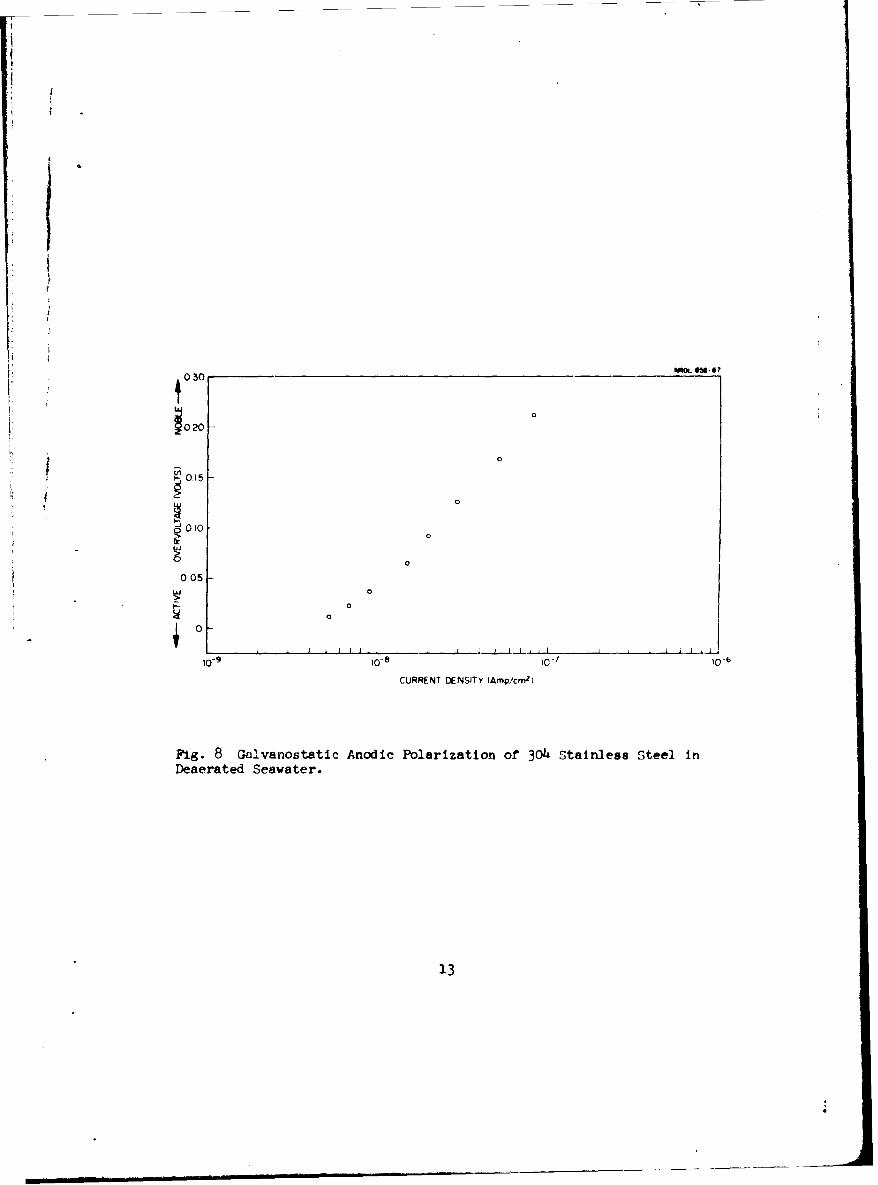
oaFCgures 1 through 8 show some representative plots of E vs. log i
from which values of Oa and Oc were obtained. In some instances thedetermination of Pa and Pc was somewhat subjective. However, this sub-jectivity does not affect the value of icorr too severely since the term
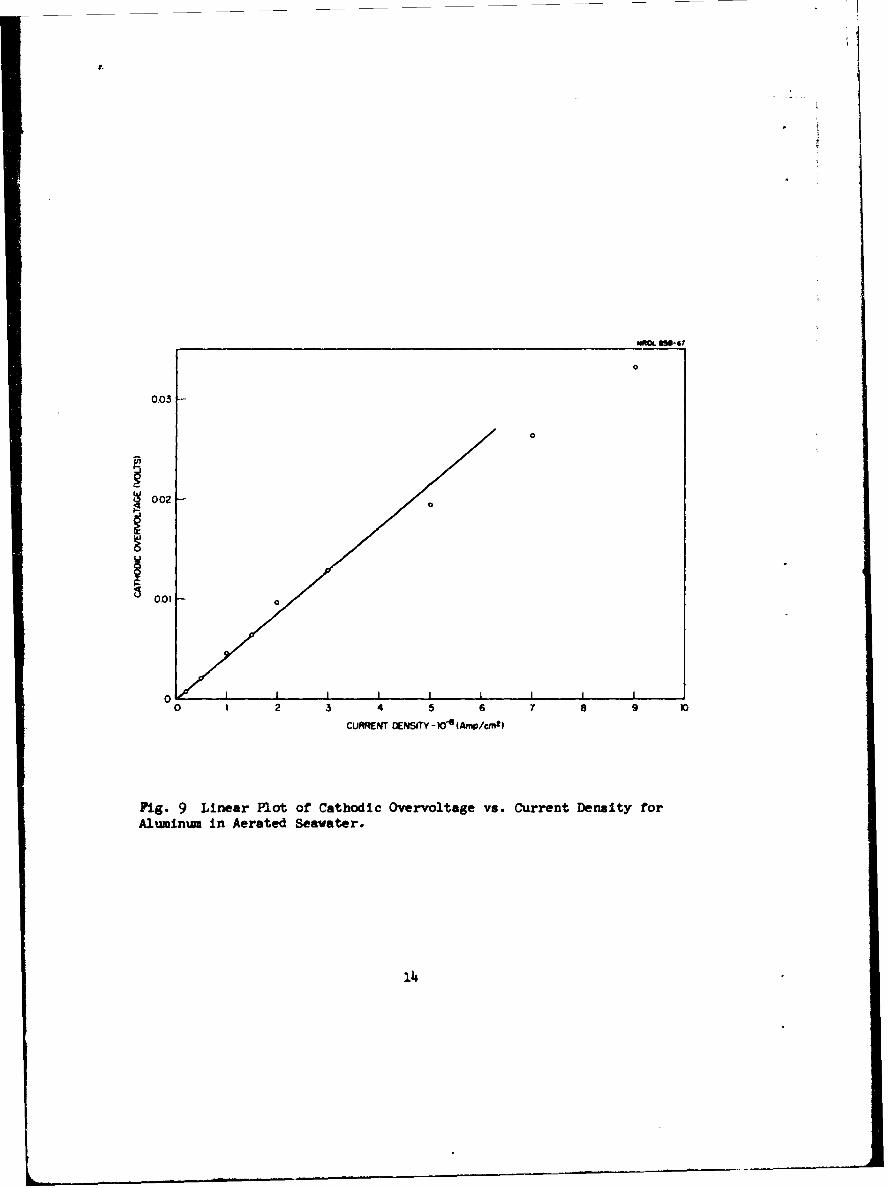
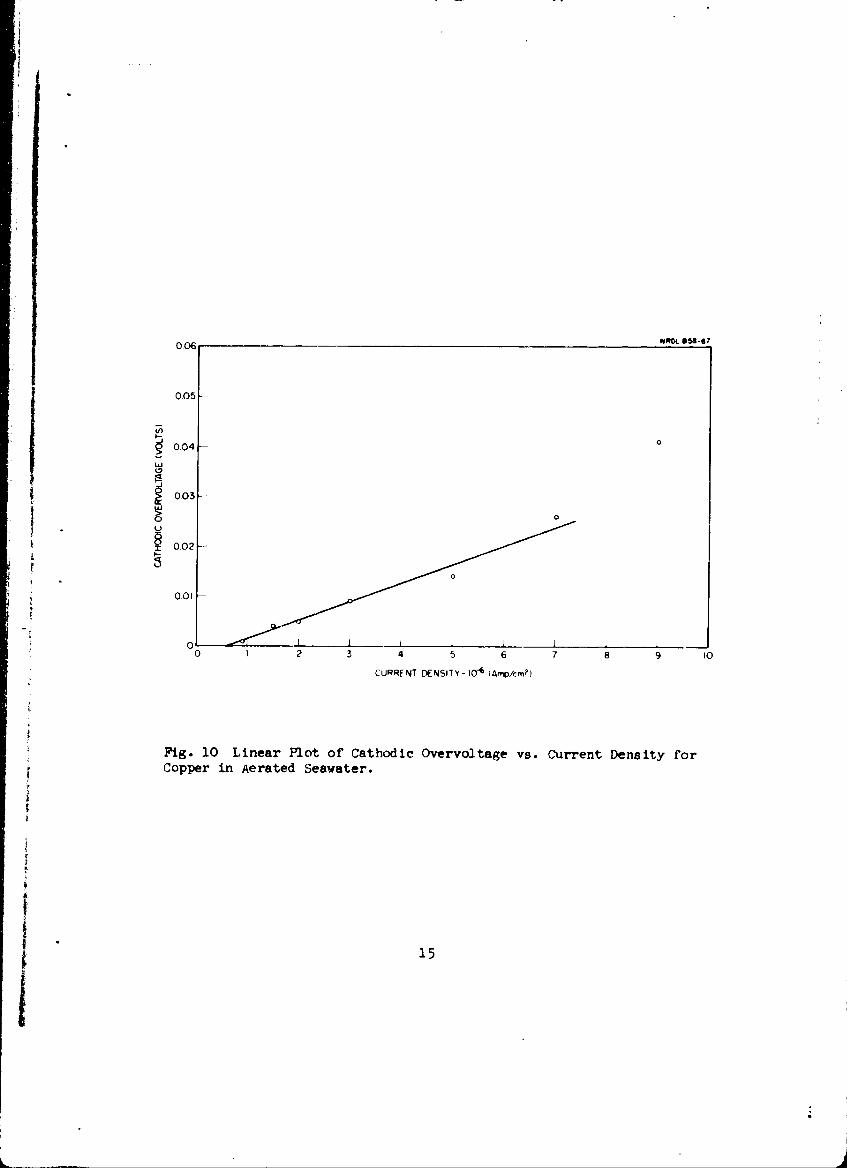
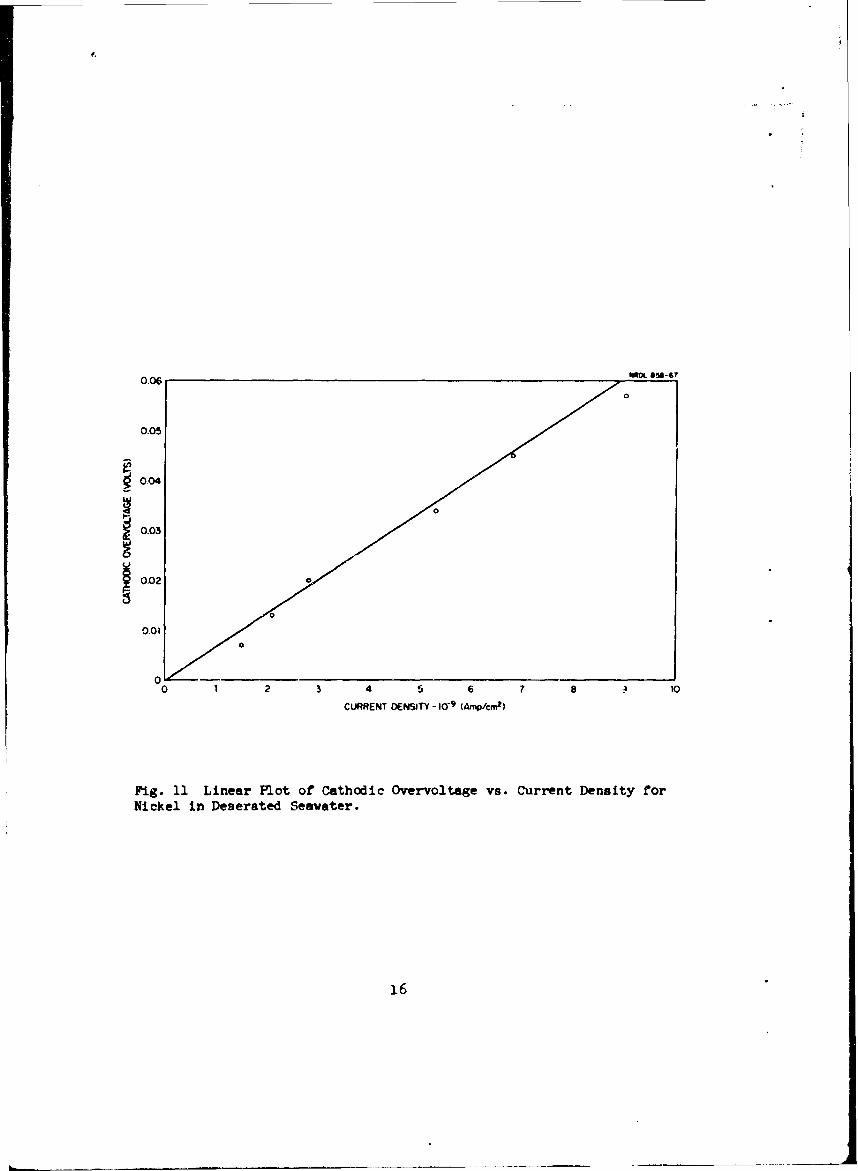
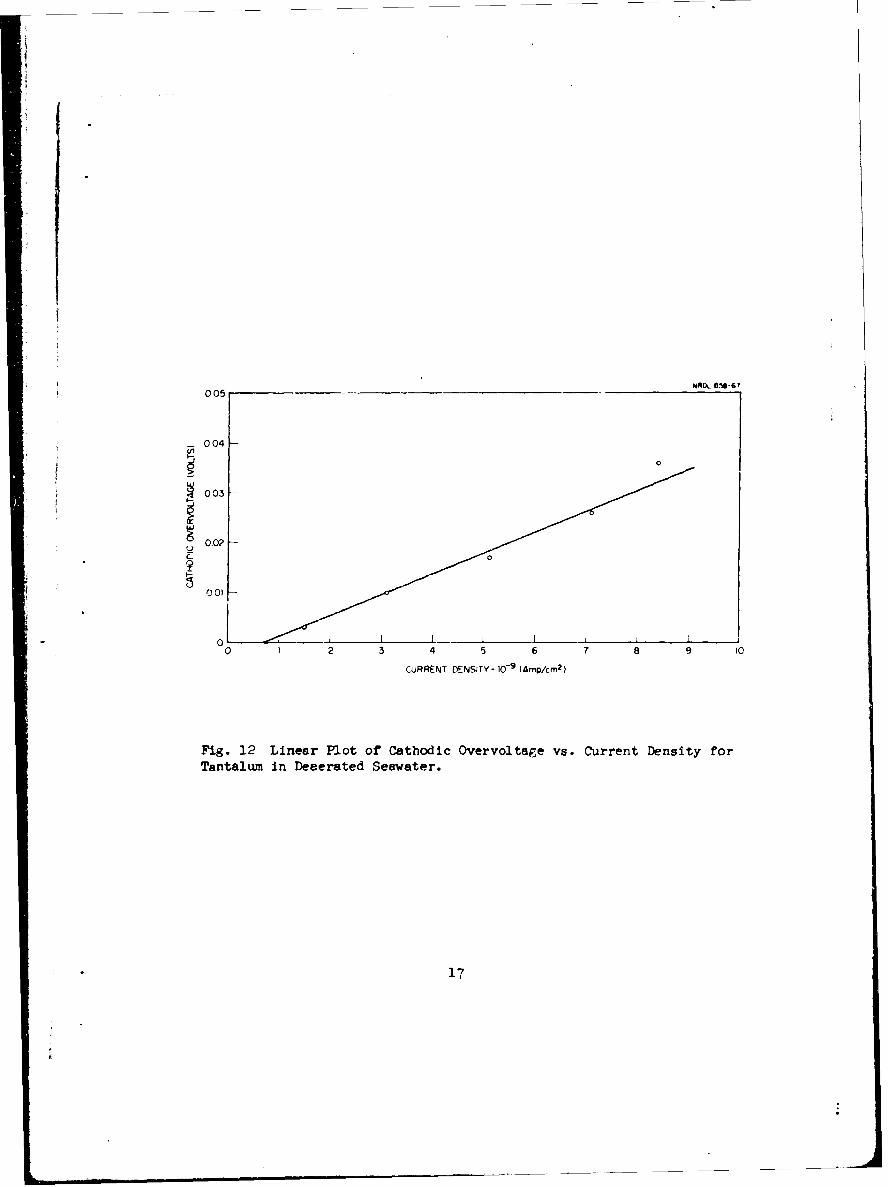
*Pa3c/(a+03c) in eq. (1) is relatively insensitive to small changes in 18or Oc. Figures 9 through 12 show some representative plots of E againsti in the region near the open-circuit potential. Values of AE/Ai wereobtained from these plots.
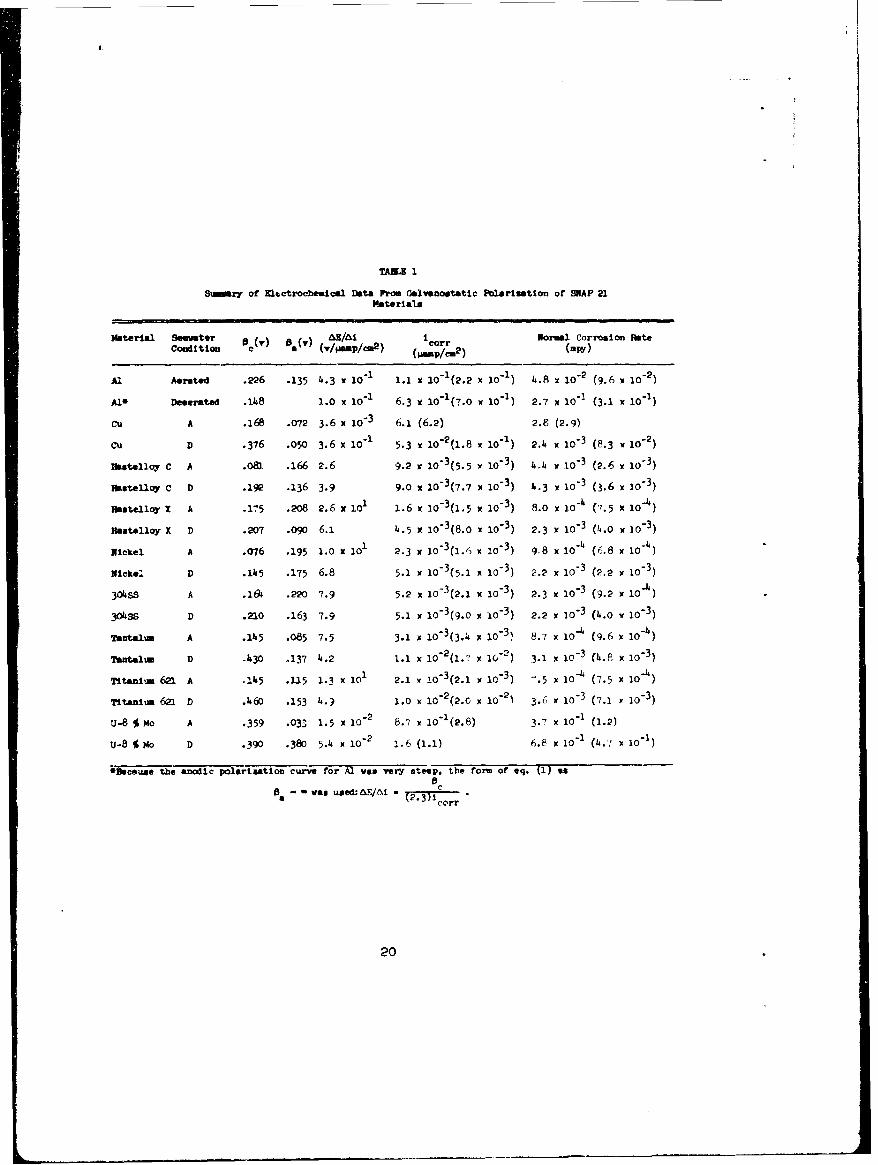
Table 1 summarizes the electrochemical data and presents the corro-sion currents in Vamp/cm2 and the normal corrosion rates in mpy for eachof the SNAP-21 materials. The main table entries for icorr and normalcorrosion rate are based on Equation 1; the corresponding entries inparentheses are obtained by graphical extrapolation of 10 to the open-circuit potential.
Gialvanic Series and Galvanic Effect
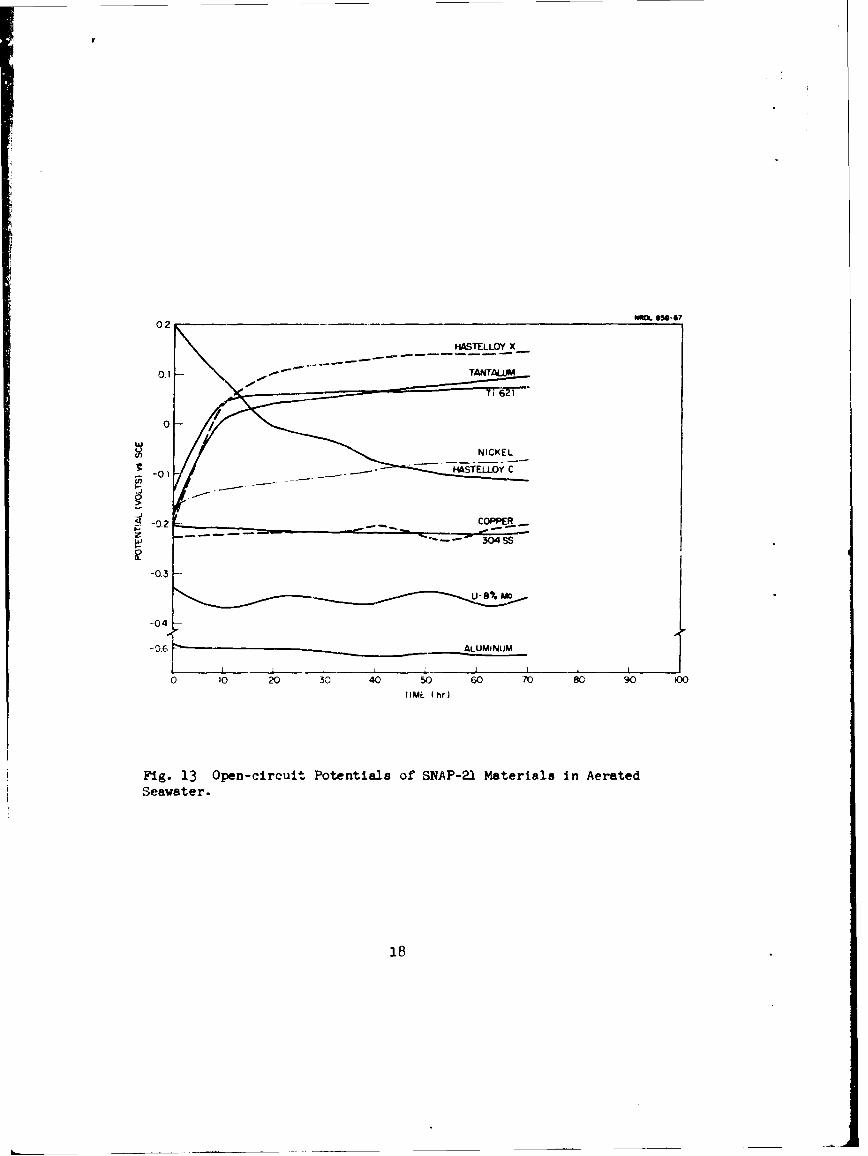
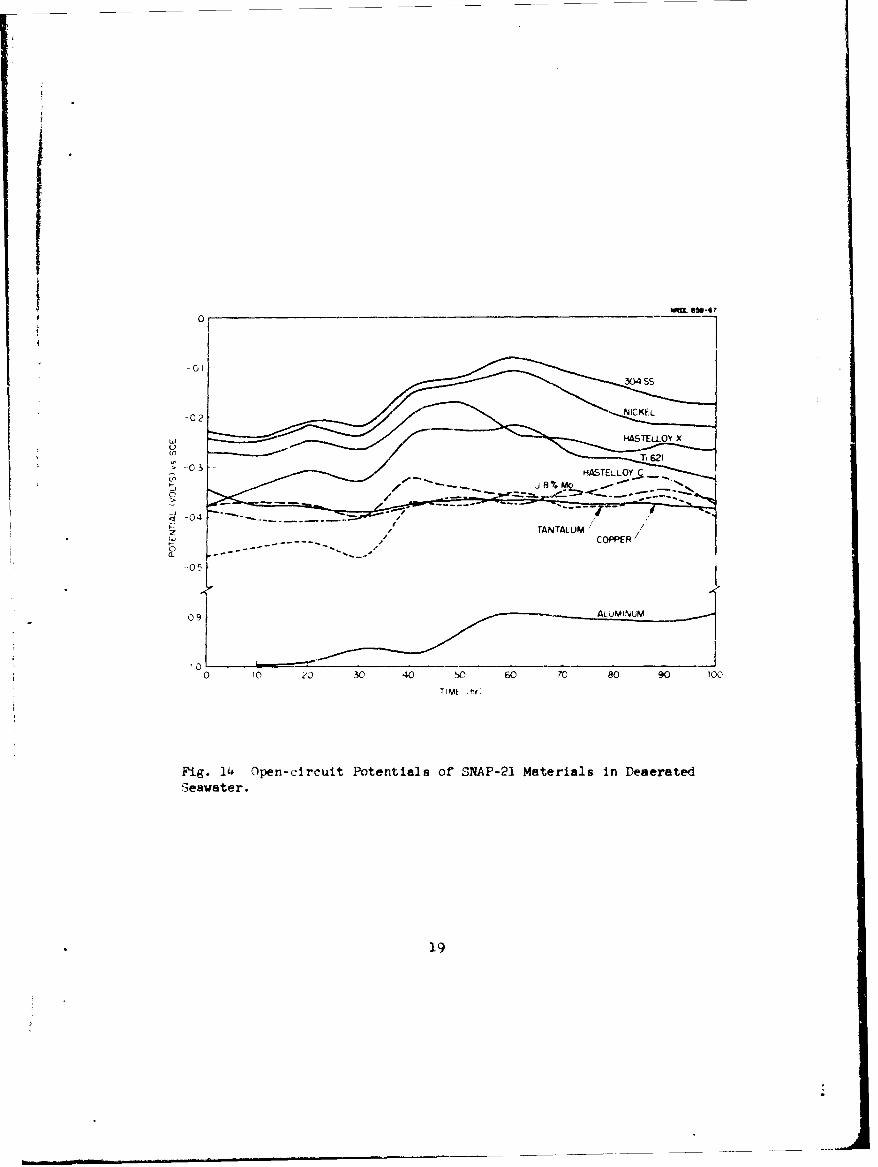
Figures 13 and 14 show the open-circuit potentials of the SNAP-21materials as a function of time in aerated and deaerated seawater, re-spectively. The important features tonote in these figures are not thevalues of the individual potentials but rather the relative positionsof the materials with respect to one another. Also note that after afew hours, the potentials for the aerated seawater materials are rela-tively constant, whereas for the deaerated seawater materials changesare still occurring up to 100 hours. Because of this fact it is diffi-cult to determine a galvanic series accurately. Nevertheless, Figs. 13and 14 indicate, in general, what the galvanic series are. The mostnegative potential is shown by the most active material (i.e., thematerial on which accelerated corrosion takes place when it is coupledwith materials more positive in potential) and the most positive poten-tial is shown by the most noble material (i.e., the material which tendsto be protected from corrosion when coupled to materials more negativein potential).
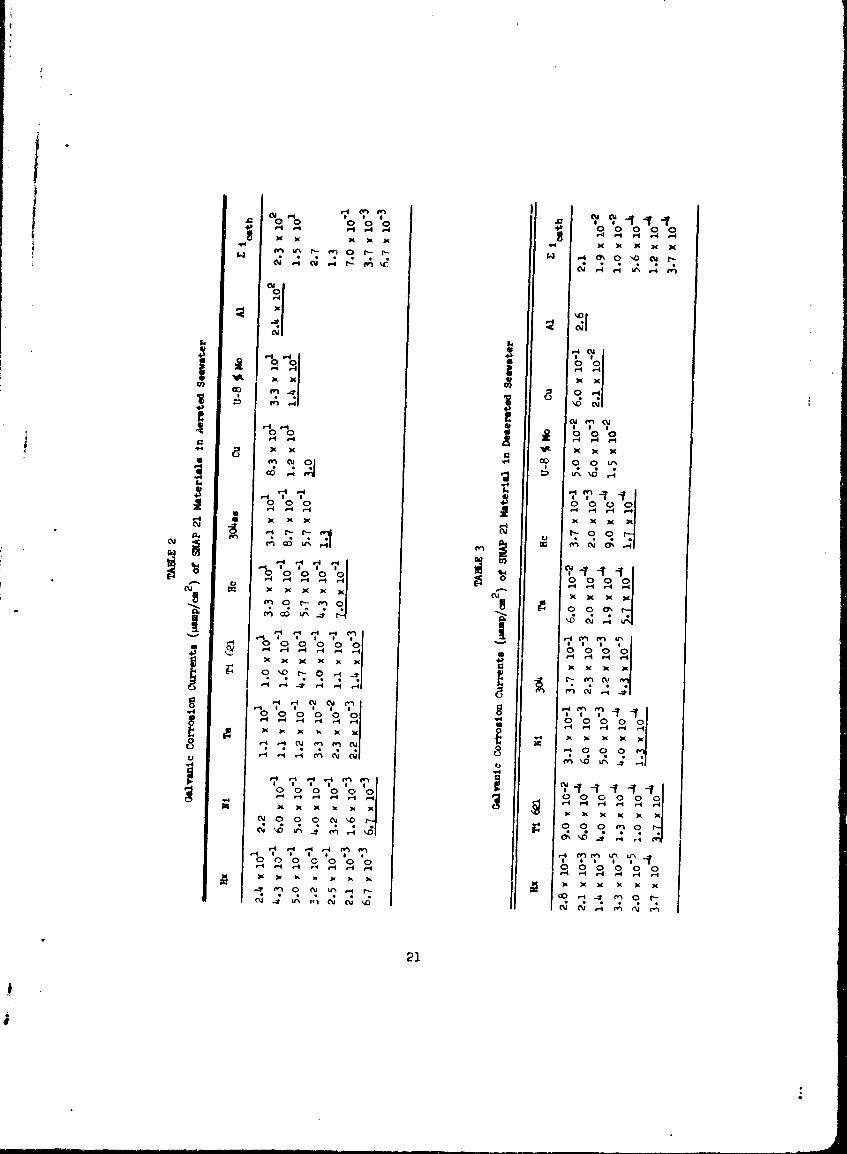
Tables 2 and 3 show the various sets (rows) of galvanic current den-sities measured between one material at a time and all the other coupledmaterials (in that row) in aerated and deaerated seawater, respeotIvely.These current densities are obtained from the zero resistance ammuetermeasurements. The anodic member(s) of each set is denoted by its underlinedgalvanic current density. These anodic current densities are a measire
5

S•ftNL 88- 67
00 0 00
0.02 0
0,04
0.06 -
0.00S~0
0.10 0
0,12
0.14 0taiJ
0.16
0.18 0
S020 -
k022 -
0.2,4
0.26 i I I I • II • I i II ,
10-7 10-6 10-5 10-4
CURRENT DENSITY (LmMc4)
Fig. 1 Galvanostatic Cathodic Polarization of Copper in AeratedSeawater.
6
PIE 056.-467
00 o 0 0
t 0.05 -
S01 -o00
05 0
0320 -o
0.4
-0.5
006
10-9 i0-8 i0-7 10-6 V4
CURRENT DNSITY (An'aknm)
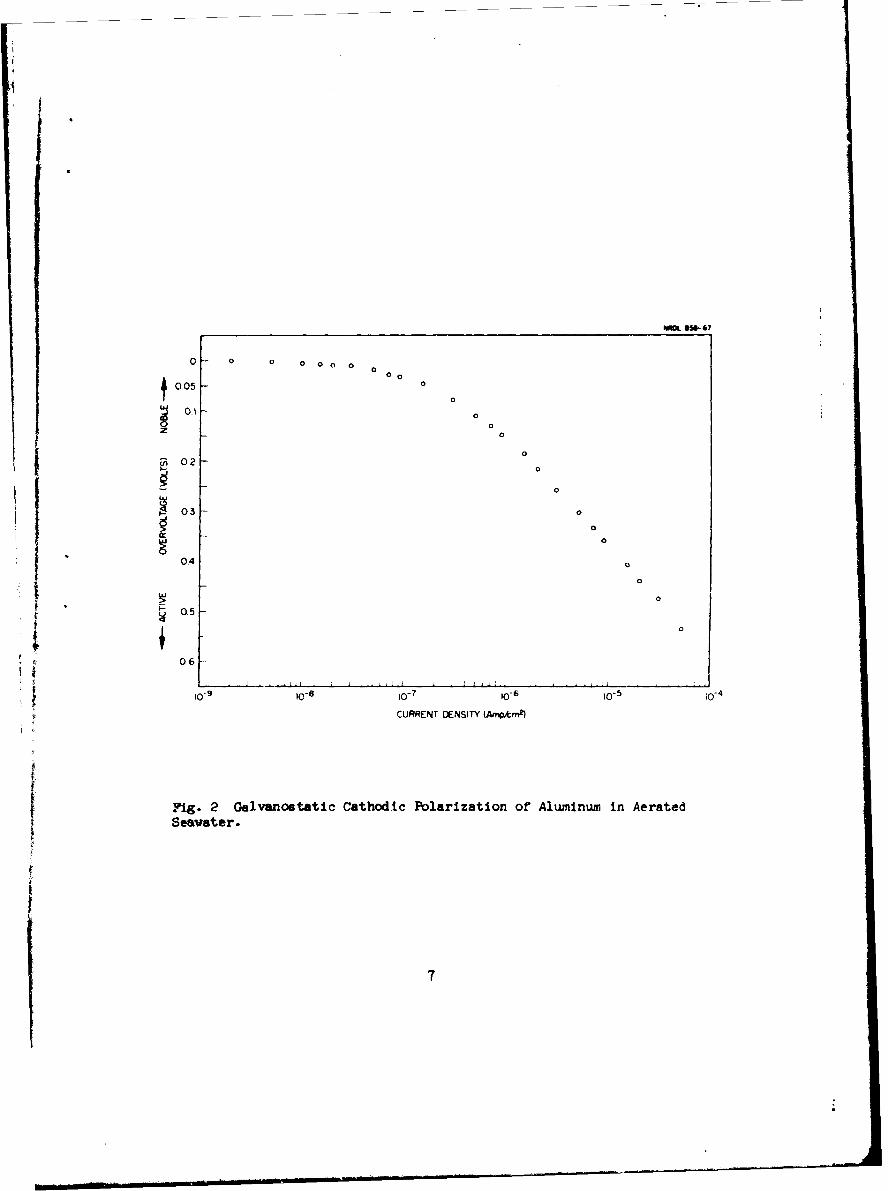
Fig. 2 Gelvanostatic Cathodic Polarization of Aluminum in AeratedSeawater.
7
Lt.
0.6
,. 0.5
0.4 0
0
t 0.3 -o o0
002 0o0
00.1 0
0
o 9 10-8 I0-7 I
CURRENT DENSITY (Amp/mZ)
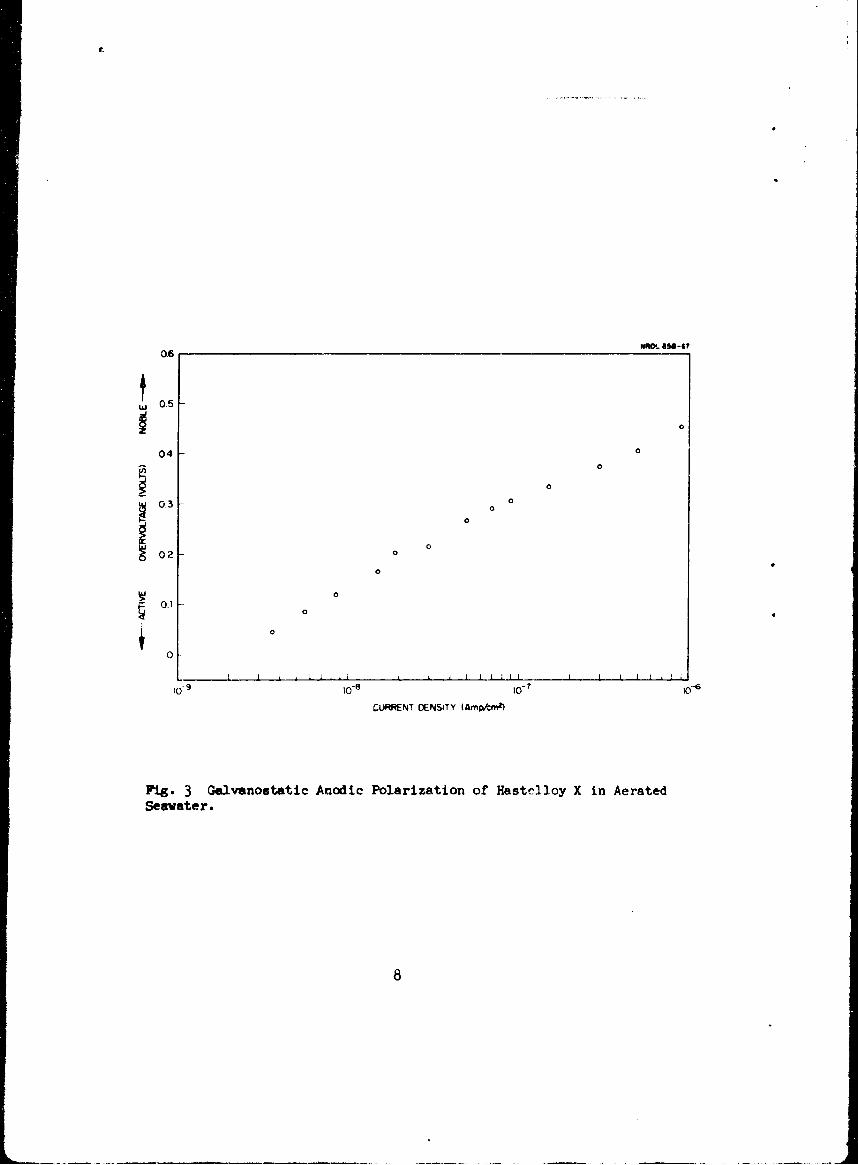
Fig. 3 Gelvanostatic Anodic Polarization of Hastelloy X in AeratedSeawater.
06p I
041 05
00
00.4 0
U) 0,. 0- 0
02
02
-> 0.
"Io
00
CURRENT DENS!TY (Ampm/c2 )
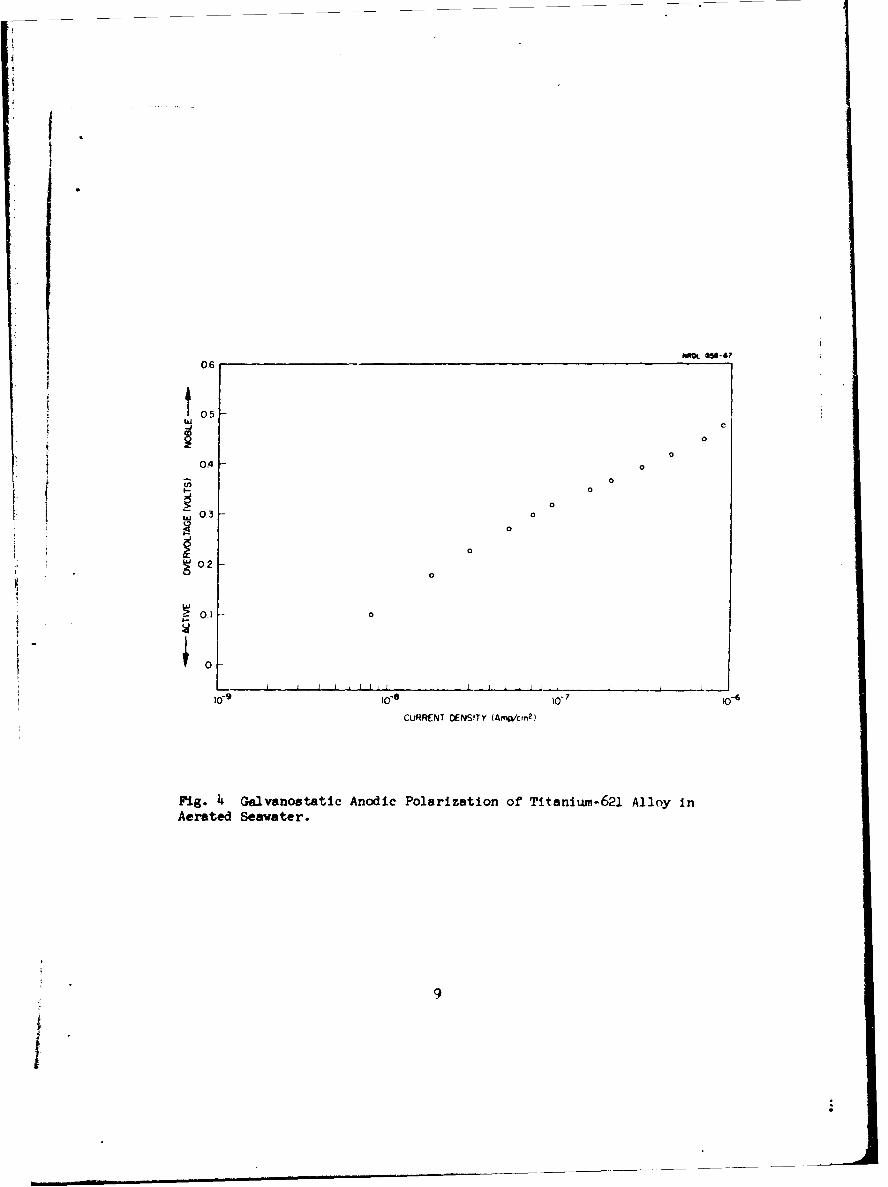
Fig. 4 Galvanostatic Anodic Polarization of Titanium-621 Alloy inAerated Seawater.
9
I
MaC 15°60 0 00
010
01 0
0
0.0
0?0
0
0IA 0
0
S06
CURRENT DENSITY (Amp/cm2 )
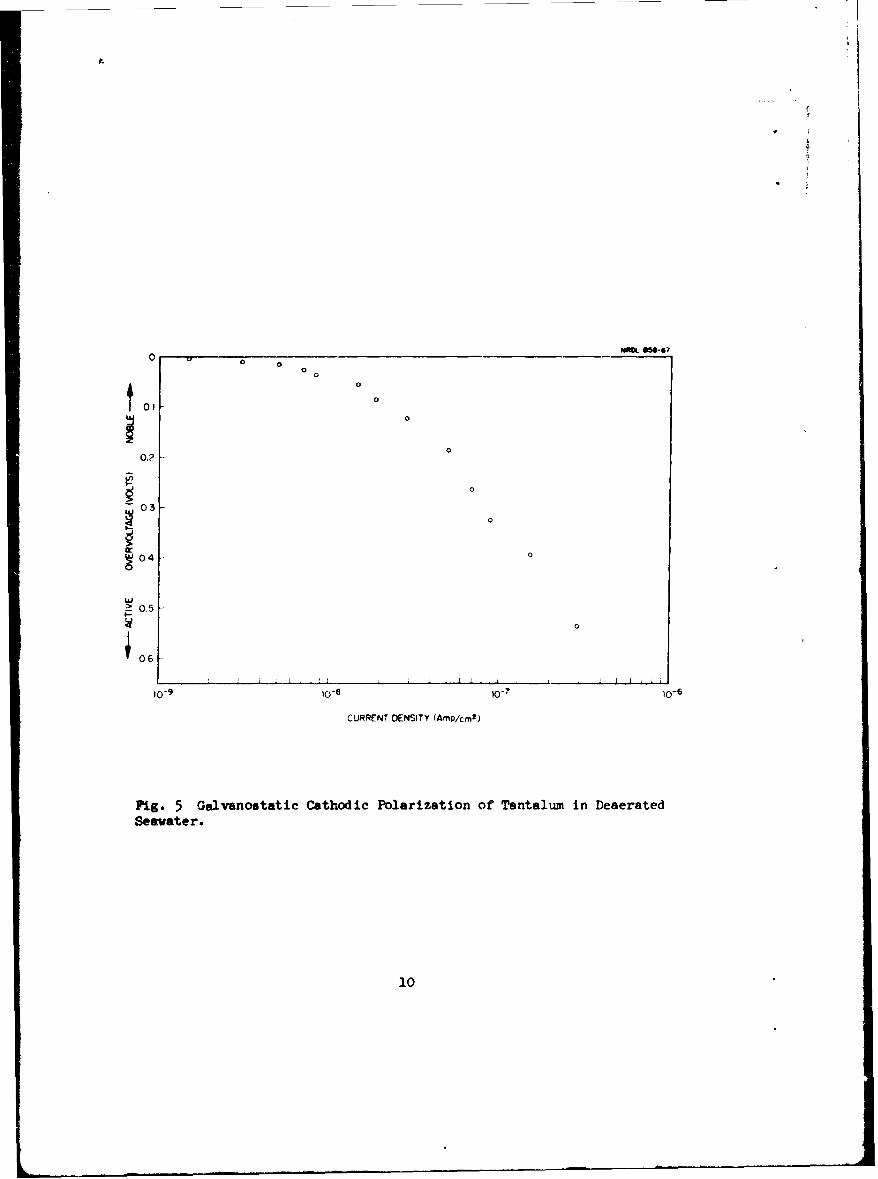
Fig- 5 Galvanostatic Cathodic Polarization of Tantalum in DeaeratedSeavater.
10
f
"NAOL S5-670 0
00
0 0
0 00 0
0
i- 0
0
020
03
IO 0 •1•I
000-6
CURRENT DENSITY (Amp/cm2)
Fig. 6 Galvanostatic Cathodic Polarization of Nickel in DeaeratedSeawater.
:i"i
* •m
wim•. 11S-67
0
0-3-
0
-- 02-0
9 0
0.1-
S00
0 0
0-0I I_ o I IIJ I i I l I / ] i I 1 I l l II
10-8 10-7 10-6 - 0-4
CURRENT DENSITY (Arm/crng)
Fig. 7 Galvanostatic Anodic Polarization of Uranium-8 5 MolybdenumAlloy in Deaerated Seawater.
12
1030 o -,
ý0 20
0015
0 LO
005
0-
• o -
10-9 10-8 i0 10-b
CURRENT DENSITY (Amrp/cm2)
Fig. 8 Ga1vanostatic Anodic Polarization of 30 4 Stainless Steel inDeaerated Seawater.
13
0
0.03
0
W 002
0.010
0IIII I0 1 2 3 4 5 6 7 8 9 10
CURRENT OENS"TY - WO (Amo/cmfl
Fig. 9 Linear Plot of Cathodic Overvoltage vs. Current Density forAluminum in Aerated Seavater.
14
0.06 "ROL 058-67
0.05--
0.04- 0
Ld
o0.03-
0 0
0.02--
0.01
C I0 1 2 3 4 5 6 7 9 10
CURRENT DENSITY - )06 ýAff/cm2)
Fig. 10 Linear Plot of Cathodic Overvoltage vs. Current Density forCopper in Aerated Seawater.
I15
I
0.06 as.-.?
Fa0.05
0.04
0.03
S0.03
0.01
CURRENT OENSITY - I079 (Amp/cm2)
Fig. 11 Linear Plot of Cathodic Overvoltage vs. Current Density forNickel in Deserated Seawater.
16
II
I
; ~NRDL M*86?'
005
0.04
S003-I !-
0.02
00)
010 1 2 3 4 5 6 7 8 9 10
CURRENT DENSITY- 10-9 (Amp/cm2 )
Fig. 12 Linear Plot of Cathodic Overvoltage vs. Current Density forTantalum in Deaerated Seawater.
17
02
HASTELLOY X_
0.1 TANTALUM
0-
NICKEL
_-0.1 -- H-ASTELLOY C
-0.2COPPER~
-0.3
-0.4
-0.6 ALUMINUM
L)10 20 30 40 50 GO 70 80 90 100
HIME (hr)
Fig. 13 Open-circuit Potentials of~ SNAP-21. Materials in AeratedSeawater.
18
_0
a 0 ~ ) 30 0 SO 0 70304 S0S
-02 NICKEL
019
TANL 1
Sumary of KLtctroaheaical Data From alvanostatic Polarization of SWAP 21Materials
oterial Seawater r Normal Corrosion FateCondition e(pep ýps, (mpy)
A! Aerated .226 .135 4.3 N 10"I 1.1 x 10"1(2.2 x i0"I) 4.8 x I0-2 (9.6 x 10⁻²)
Al* Deaerated .148 1.0 x 10⁻¹ 6.3 x 10"1(7.0 x 10"1) 2.7 x 10" (3.1 x 101)
Cu A .168 .072 3.6 x 10⁻³ 6.1 (6.2) 2.8 (2.9)
Cu D .376 .050 3.6 x 10⁻¹ 5.3 w 10" 2 (1.8 x 10"1) 2.4 x I0-3 (8.3 y 10-2)
Ibatelloy C A .081 .166 2.6 9.2 y 10"3(5.5 v 10- 3 ) 4.4 y 10-3 (2.6 y 10-3)
flstelloy C D .192 .136 3.9 9.0 x 10⁻³(7.7 x 10- 3 ) 4.3 x 10⁻³ (3.6 y 30-3)
Hastelloy X A .175 .208 2.6 x 101 1.6 x 10⁻³(1.5 x I0-3) 8.0 x 1O-4 (7.5 x 10⁻⁴)
Rastelloy X D .207 .090 6.1 4.5 x 10"3(8.0 x 10⁻³) 2.3 x 10⁻³ (4.O x 10-3)
1 3(. 03 9, 104 - 04Nickel A .0r6 .195 1.0 x 10 2.3 x I0"3 (1. w !0 3 ) 908 w 10J' ((.8 x
Nickes. D .145 .175 6.8 5.1 x 10"3(5.1 x 10⁻³) 2.2 x 10"3 (2.2 x 10⁻³)
3O4SS A .16i .20 7.9 5.2 x 10⁻³(2.1 x 10⁻³) 2.3 x 10⁻³ (9.2 x iO-)
3043SS D .210 .163 7.9 5.1 x 10"3(9.0 x 10⁻³) 2.2 x 10⁻³ (4.0 x 10⁻³)
Tantalum A .145 .085 7.5 3.1 x 10⁻³(3.4 x 10⁻³) 8.7 x 10"- (9.6 x lo-•)
Tantalum D -430 .137 4.2 1.1 x 10² (1.7 x 16"2) 3.1 x 10"3 (4.8 x 10⁻³⁵
Titanium 621 A -145 .115 1.3 x (01 2.1 1-) 7 4(7.5 K 10 7. )
Titanium 621 D .460 .153 4.9 1.0 x 10² (2.0 X 10⁻²' 3.6 x 10⁻³ (7.1 x 10⁻³)
U-8 % Mo A .359 .033 1.5 x 10"2 8.7 x 10"1(2.8) 3.' x 10"1 (1.2)
u-8 % mo D .390 .380 5.4 x i0-2 1,6 (1.1) 6.F x 10"1 (4.,' x I0")
fiecause the anodic polarization curve for Al wan vary steep, the form of eq. (1) as0
w s - va u sed: &E/Ai * (2.31
20
0. .f4 00001
r4 r4 r4 44x Pý14-
4 r4 M4 4N N
14 X X
U 0
r4)
-l .- i r' J 4 , ý l
.` 4 r 4 N N
* ~~en cu01 0 0I
* .44 r.4.
000 22 0 0
en 0i x-- CU
43. 4 .4 q 4 .4'
". T. N~
el r-4
C n0 00 00 0 0
r4 r- 4 00 00
6~x .4.4.4 ý
N N
0u4 e N .4 0 0.4 ~ ~ . .44. enI en-7 1
-4 Me4,
X N N Nx
0 (3 0 0 C) 0 0 C) no(
10' '.: mt 0 f'.42 Lr t.)4, u (%j I'D
.4 I I I I 21
I
of the oxidetion (metal dissolution) process. The galvanic currentdensities not underlined are the cathodic galvanic current densitieswhich are a measure of the reduction processes. Theoretically, the sumof the anodic current densities must equal the sum of the cathodic cur-rent densities. Comparison of the sum of the cathodic current densities(listed in the leat column of Tables 2 and 3) with the anodic currentdensity (or sum of the anodic current densities as the case may be)-ofeach set sbMs that they are in good agreement.
Note that the materials in Tables 2 and 3 are listed in a galvanicseries (on the basis of the successive elimination process describedabove), the most noble at the left and the most active at the right.These galvanic series can be compared to those in Figs. 13 and 14 whichwere obtained from the measurements of open-circuit potentials. In thecase of aerated seawater the order of materials is in fair agreement.In contrast, the order of materials in deaerated seawater is quite dif-ferent. Apparently this is a reflection of the large variability ofpotential with time shown in Fig. 14. The galvanic series determinedas a consequence of the galvanic current measurements is considered tobe more valid since it was determined "in-situ" so to speak.
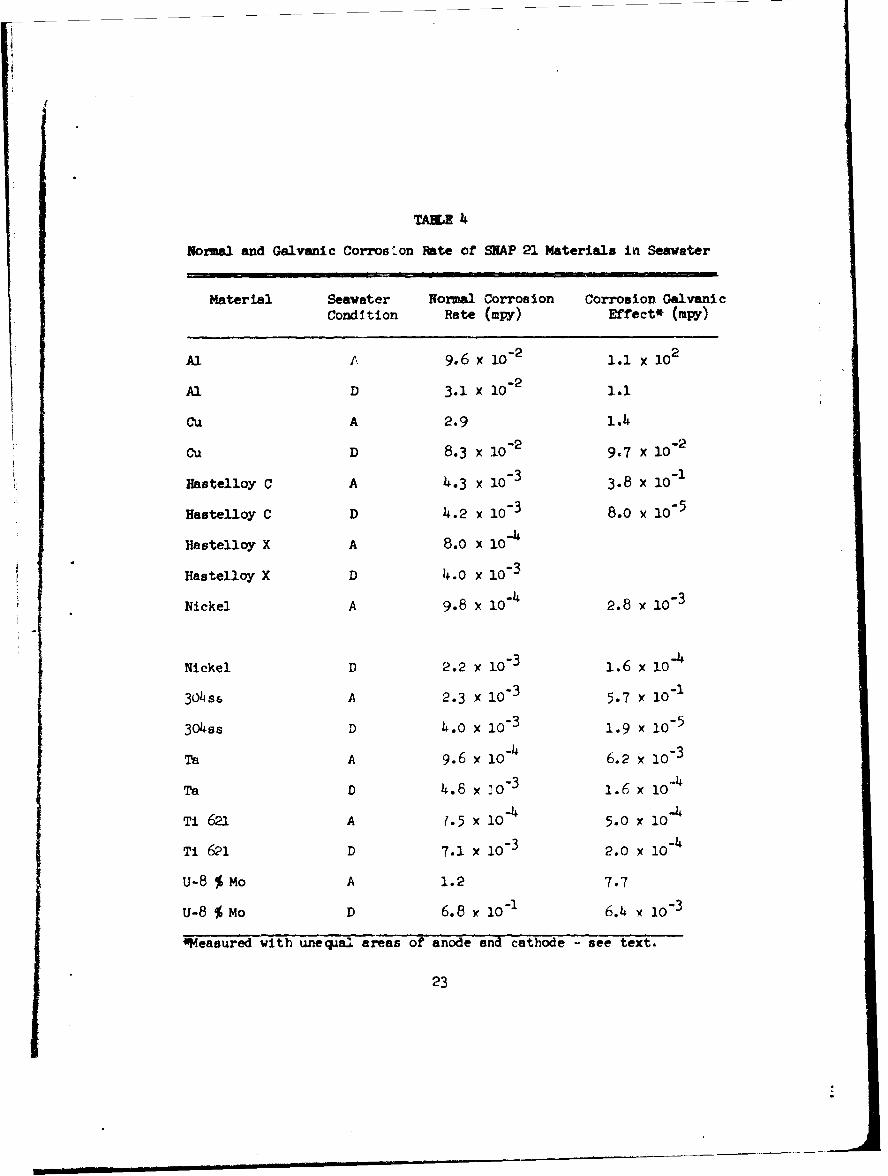
Table 4 lists the normal corrosion rate (largest value in column7 of Table 1) and the galvanic corrosion effect (from underlined anodicgalvanic currents in Tables 2 and 3) for each material in aerated anddeaerated seawater. The sum of the two rates (normal and galvanic) isthe total corrosion rate of the material under coupled conditions whenit is the anodic member of the couple. It can be seen that in deaeratedseawater the galvanic effect is small except for aluminum. For everymaterial the galvanic effect in aerated seawater is larger. This dif-ference in galvanic effect is due primarily to the relative differencesof potentials of the materials in aerated and deaerated seawater (seeFigs. 13 and 14) and to the degree of polarization. The degree ofpolarization is dependent on the degree of aeration. Specifically, anincrease in aeration reduces cathodic polarization, thus enhancing gal-vanic corrosion)5
It must be mentioned that the galvanic effects listed in Table 4include a surface-area effect due to the manner in which the galvaniccurrents were measured. This surface area effect refers to the factthat the anode-to-cathode area ratio varied for each material when itwas the anode. For example, in aerated seawater the anode-to-cathodesurface area ratio when aluminum was the anode was about 1 to 9; whenU-8 % Mo was the anode the ratio was about 2 to 7;* when copper was theanode the ratio was I to 6 and so on up the galvanic series.
*The surface area of the U-8 % Mo electrode was about 2.2 times the sur-face =mu of the other electrodes, which were equal.
22
TAEU 4
Normal and Galvanic Corrosion Fate of SNAP 21 Materials in Seawater
Material Seawater Normal Corrosion Corrosion GalvanicCondition Rate (mpy) Effect* (mpy)
Al I 9.6 x 10- 2 1.1 x 10 2
Al D 3.1 x 10- 2
Cu A 2.9 1.4
Cu D 8.3 x 10 2 9.7 x 10 2
Hastelloy C A 4-3 x 10⁻³ 3.8 X 10⁻¹
Hastelloy C D 4.2 x 10⁻³ 8.0 x 10⁻⁵
Hastelloy X A 8.0 X 10"-
Hastelloy X D 4.0 x 0-3
Nickel A 9.8 X 10" 2.8 x 10⁻³
Nickel D 2.2 x 10⁻³ 1.6 x l0"-
304 ss A 2.3 x 10- 3 5.7 x 10i1
304ss D 4.0 X 10.3 1.9 X 10⁻⁵
Ta A 9.6 x 10⁻⁴ 6.2 x 10. 3
Ta D 4.8 x 3 1.6 x io
Ti 621 A (.5 x 10 5.0 x 10
Ti 621 D 7.1 x 10i3 2.0 x 10i4
U-8 % Mo A 1.2 7.7
u-8 % Mo D 6.8 IO-1 6.4 y 10-3
Measured with unequal areas of anode and cathode - see text.
23
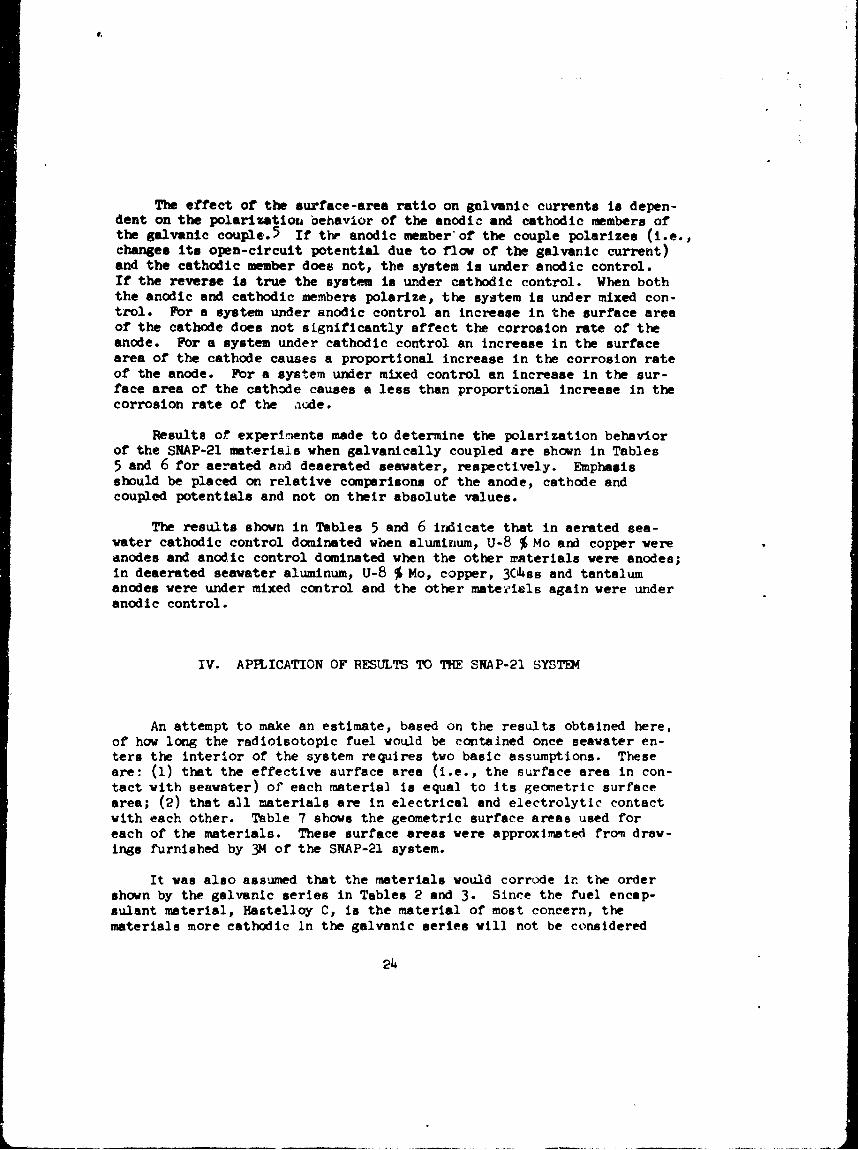
The effect of the surface-area ratio on galvanic currents is depen-dent on the polarization behavior of the anodic and cathodic members ofthe galvanic couple. 5 If the anodic member'of the couple polarizes (i.e.,changes its open-circuit potential due to flow of the galvanic current)and the cathodic member does not, the system is under anodic control.If the reverse is true the system is under cathodic control. When boththe anodic and cathodic members polarize, the system is under mixed con-trol. For a system under anodic control an increase in the surface areaof the cathode does not significantly affect the corrosion rate of theanode. For a system under cathodic control an increase in the surfacearea of the cathode causes a proportional increase in the corrosion rateof the anode. For a system under mixed control an increase in the sur-face area of the cathode causes a less than proportional increase in thecorrosion rate of the node.
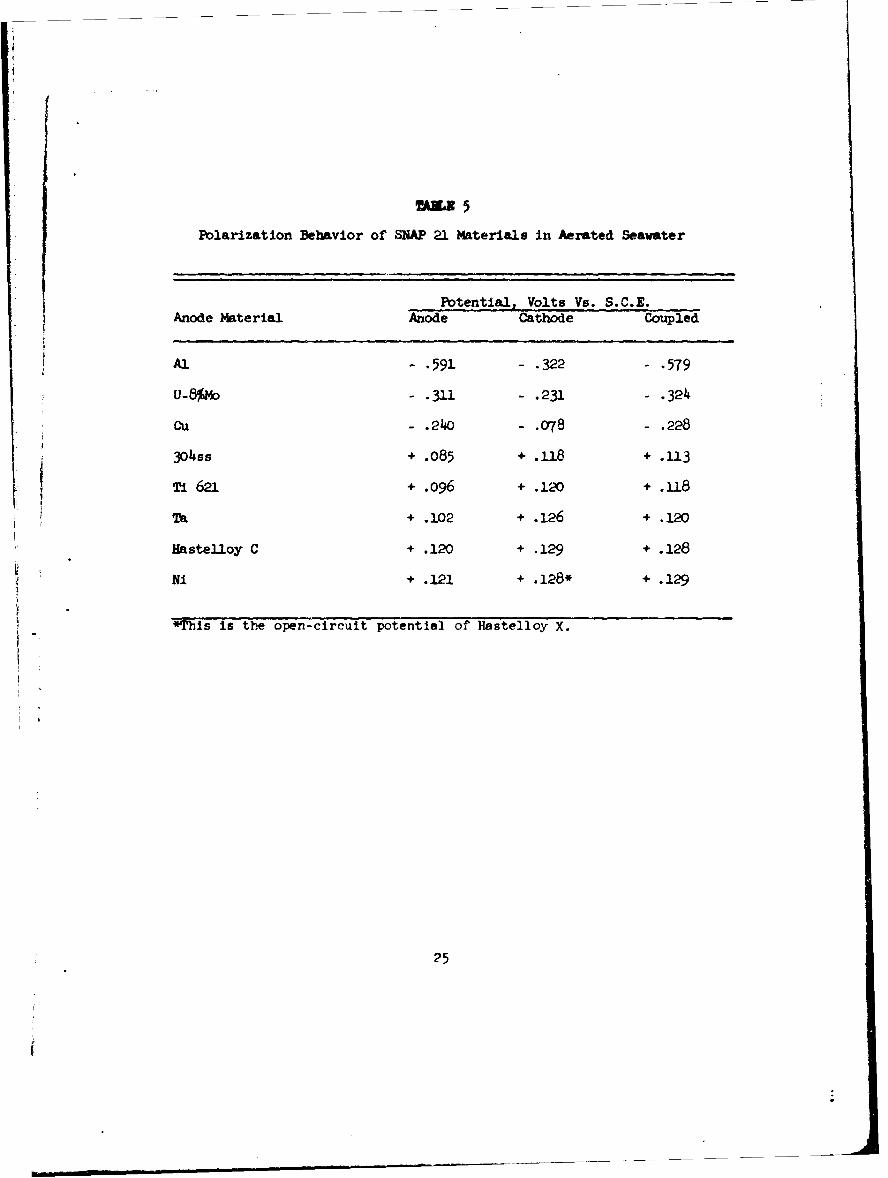
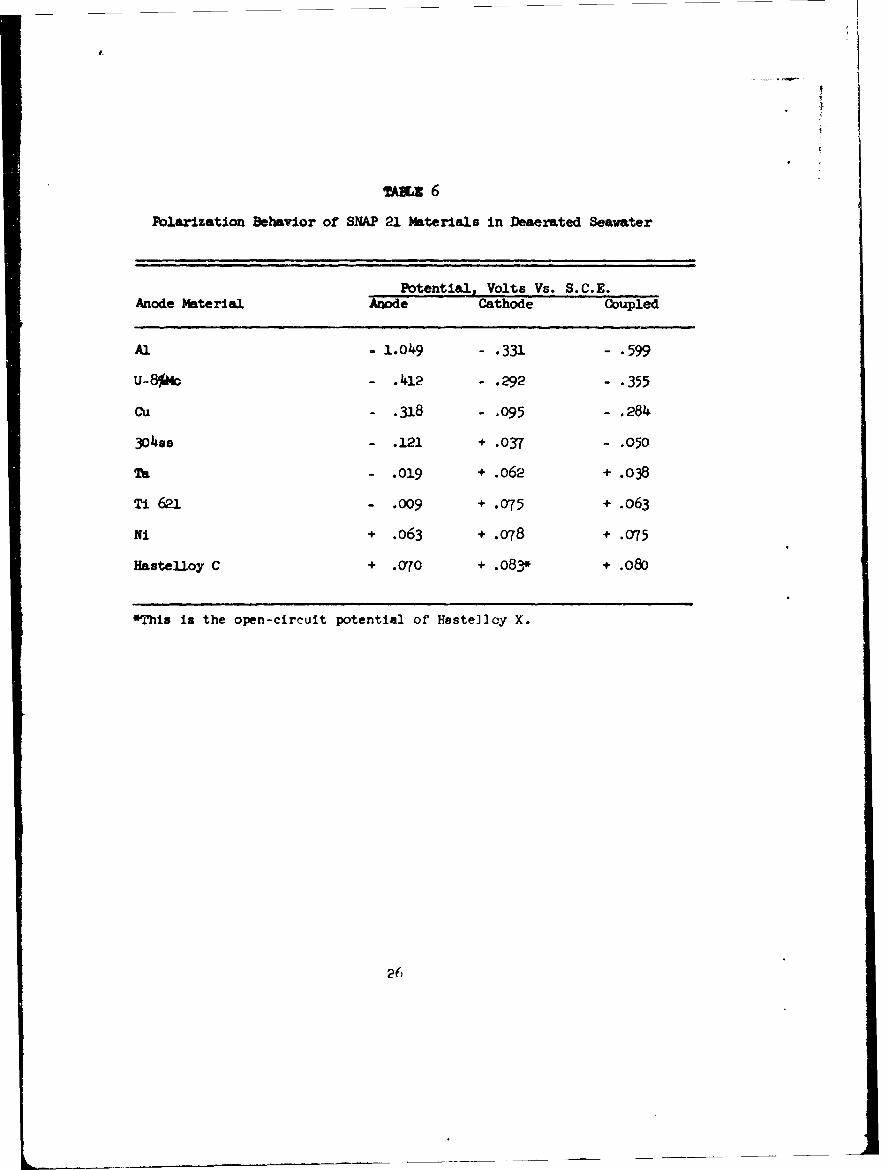
Results of experiments made to determine the polarization behaviorof the SNAP-21 materials when galvanically coupled are shown in Tables5 and 6 for aerated and deaerated seawater, respectively. Emphasisshould be placed on relative comparisons of the anode, cathode andcoupled potentials and not on their absolute values.
The results shown in Tables 5 and 6 indicate that in aerated sea-water cathodic control dominated when aluminum, U-8 % Mo and copper wereanodes and anodic control dominated when the other materials were anodes;in deaerated seawater aluminum, U-8 % Mo, copper, 3C4ss and tantalumanodes were under mixed control and the other materials again were underanodic control.
IV. APHLICATION OF RESULTS 10 THE SNAP-21 SYSTEM
An attempt to make an estimate, based on the results obtained here,of how long the radioisotopic fuel would be contained once seawater en-ters the interior of the system requires two basic assumptions. Theseare: (1) that the effective surface area (i.e., the surface area in con-tact with seawater) of each material is equal to its geometric surfacearea; (2) that all materials are in electrical and electrolytic contactwith each other. Table 7 shows the geometric surface areas used foreach of the materials. These surface areas were approximated from draw-ings furnished by 3M of the SNAP-21 system.
It was also assumed that the materials would corrode in the ordershown by the galvanic series in Tables 2 and 3. Since the fuel encap-sulant material, Hastelloy C, is the material of most concern, thematerials more cathodic in the galvanic series will not be considered
24
TAIL5
Polarization Behavior of SNAP 21 Materials in Aerated Seawater
Potential, Volts Vs. S.C.E.Anode Material Anode Cathode Coupled
Al - .591 - .322 - .579
u-8%M - .311 - .231 - .324
cu - .24o - .078 - .228
304ss + .085 + .u18 + .113
Ti 621 + .096 + .120 + .118
Ta + .102 + .126 + .120
Hastelloy C + .120 + .129 + .128
N1 + .121 + .128* + .129
* This Is the open-circuit potentia] of Hastelloy X.
25
i
4
muZ 6
Polarization Behavior of SNAP 21 Materials in Deaerated Seawater
Potential, Volts Vs. S.C.E.Anode Material Anode Cathode Coupled
Al - 1.049 - .331 - .599
u- .412 -. 292 - .355
Cu - .318 -.095 - .284
3048ss - .121 + .037 - .050
T- .019 + .062 + .038
Ti 621 - .009 + .075 + .o63
Ni + .063 + .078 + .075
Hastelloy C + .070 + .083" + .080
*This is the open-circuit potential of Heste]loy X.
26
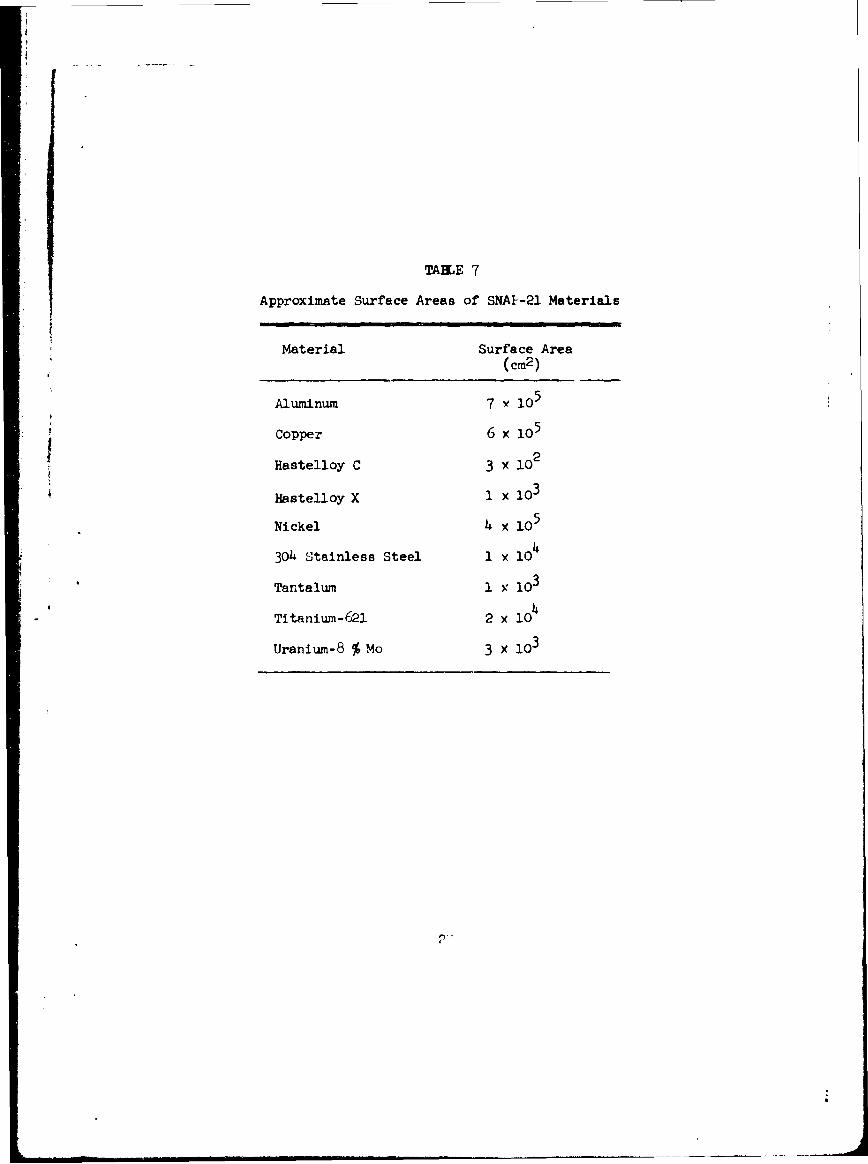
TAILE 7
Approximate Surface Areas of SNA1--21 Materials
Material Surface Area(cm2)
Aluminum 7 Y 105
Copper 6X 10
Hastelloy C 3 X 10
Hastelloy X 1 X 10³
Nickel 4 x l05
304 Stainless Steel 1 X 10t
Tantalum 1 X 10
Titanium-621 2 x I0h
Uranium-8 % Mo 3 X 10³
"V."
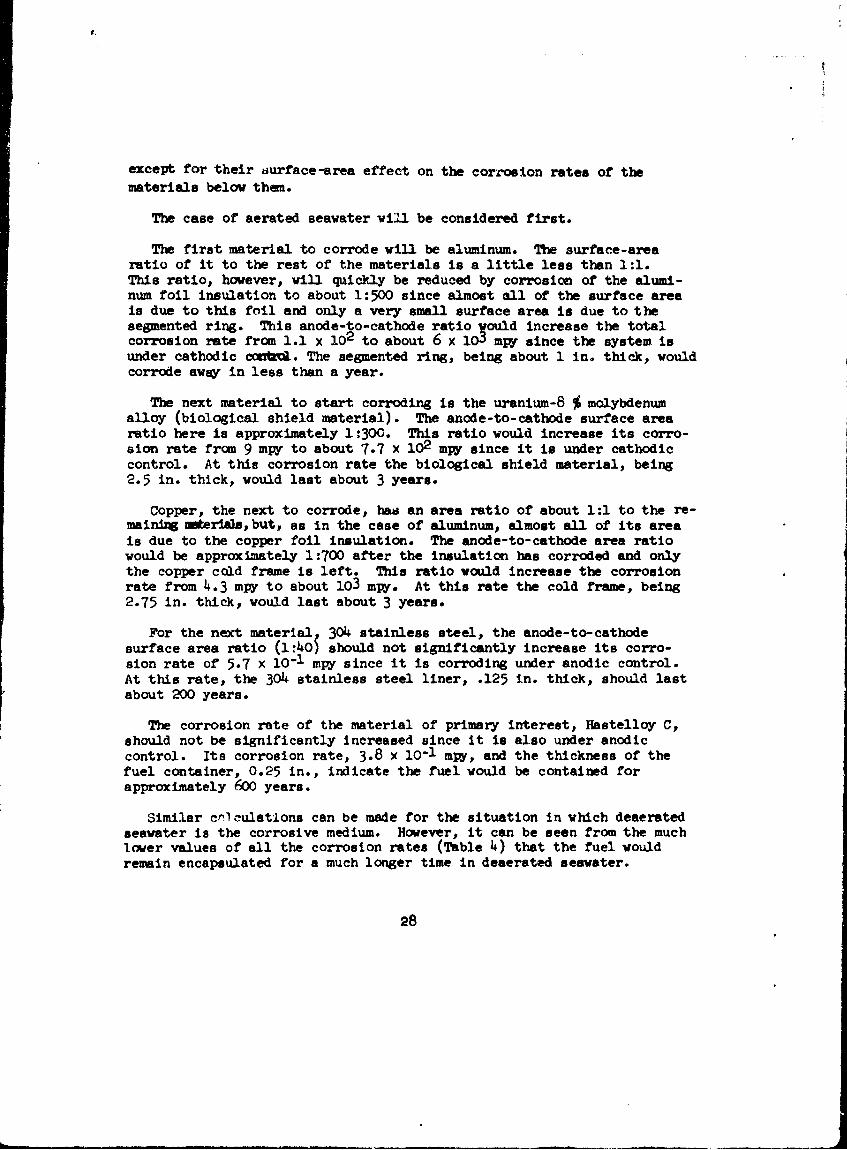
except for their aurface-area effect on the corrosion rates of the
materials below them.
The case of aerated seawater will be considered first.
The first material to corrode will be aluminum. The surface-arearatio of it to the rest of the materials is a little less than 1:1.This ratio, however, will quickly be reduced by corrosion of the alumi-num foil insulation to about 1:500 since almost all of the surface areais due to this foil and only a very small surface area is due to thesegmented ring. This anode-to-cathode ratio •ould increase the totalcorrosion rate from 1.1 x 10² to about 6 x 101 mpy since the system isunder cathodic ccuibol. The segmented ring, being about 1 in. thick, wouldcorrode away in less than a year.
The next material to start corroding is the uranium-8 % molybdenumalloy (biological shield material). The anode-to-cathode surface arearatio here is approximately 1:300. This ratio would increase its corro-sion rate from 9 mpy to about 7.7 X 10² mpy since it is under cathodiccontrol. At this corrosion rate the biological shield material, being2.5 in. thick, would last about 3 years.
Copper, the next to corrode, has an area ratio of about 1:1 to the re-maining merials,but, as in the case of aluminum, almost all of its areais due to the copper foil insulation. The anode-to-cathode area ratiowould be approximately 1:700 after the insulation has corroded and onlythe copper cold frame is left. This ratio would increase the corrosionrate from 4.3 mpy to about 103 mpy. At this rate the cold frame, being2.75 in. thick, would last about 3 years.
For the next material 304 stainless steel, the anode-to-cathodesurface area ratio (1:401 should not significantly increase its corro-sion rate of 5.7 x 10⁻¹ mpy since it is corroding under anodic control.At this rate, the 304 stainless steel liner, .125 in. thick, should lastabout 200 years.
The corrosion rate of the material of primary interest, Hastelloy C,should not be significantly increased since it is also under anodiccontrol. Its corrosion rate, 3.8 x 10⁻¹ mpy, and the thickness of thefuel container, 0.25 in., indicate the fuel would be contained forapproximately 600 years.
Similar crn culations can be made for the situation in which deaeratedseawater is the corrosive medium. However, it can be seen from the muchlower values of all the corrosion rates (Table 4) that the fuel wouldremain encapsulated for a much longer time in deaerated seawater.
28
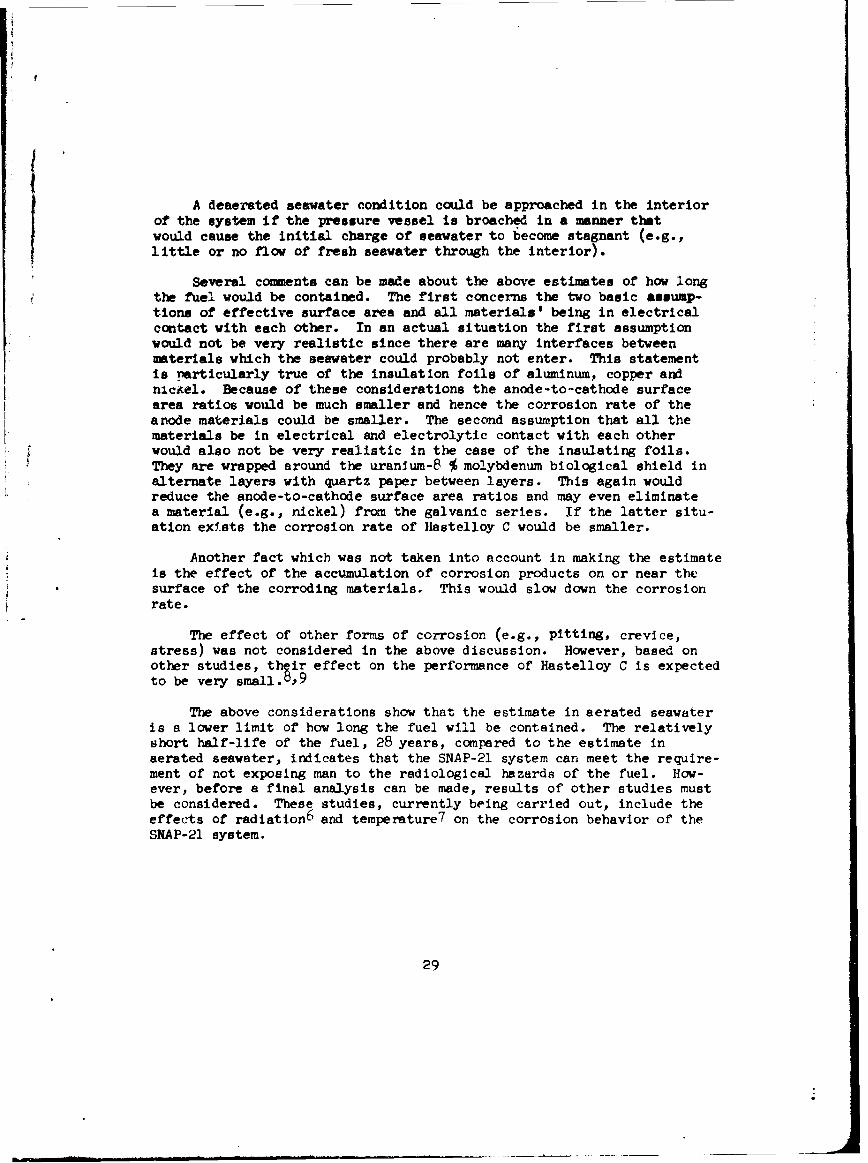
A deaerated seawater condition could be approached in the interiorof the system if the pressure vessel is broached in a manner thatwould cause the initial charge of seawater to become stagnant (e.g.,little or no flow of fresh seawater through the interior).
Several comments can be made about the above estimates of how longthe fuel would be contained. The first concerns the two basic assump-tions of effective surface area and all materials' being in electricalcontact with each other. In an actual situation the first assumptionwould not be very realistic since there are many interfaces betweenmaterials which the seawater could probably not enter. This statementis particularly true of the insulation foils of aluminum, copper andnicAel. Because of these considerations the anode-to-cathode surfacearea ratios would be much smaller and hence the corrosion rate of theanode materials could be smaller. The second assumption that all thematerials be in electrical and electrolytic contact with each otherwould also not be very realistic in the case of the insulating foils.They are wrapped around the uranium- 8 % molybdenum biological shield inalternate layers with quartz paper between layers. This again wouldreduce the anode-to-cathode surface area ratios and may even eliminatea material (e.g., nickel) from the galvanic series. If the latter situ-ation exists the corrosion rate of Hastelloy C would be smaller.
Another fact which was not taken into account in making the estimateis the effect of the accumulation of corrosion products on or near thesurface of the corroding materials. This would slow down the corrosionrate.
The effect of other forms of corrosion (e.g., pitting, crevice,stress) was not considered in the above discussion. However, based onother studies, their effect on the performance of Hastelloy C is expectedto be very small.b,9
The above considerations show that the estimate in aerated seawateris a lower limit of how long the fuel will be contained. The relativelyshort half-life of the fuel, 28 years, compared to the estimate inaerated seawater, indicates that the SNAP-21 system can meet the require-ment of not exposing man to the radiological hazards of the fuel. How-ever, before a final analysis can be made, results of other studies mustbe considered. These studies, currently being carried out, include theeffects of radiation6 and temperature 7 on the corrosion behavior of theSNAP-21 system.
29
REFRENCES
1. D. A. Kubose and H. I. Cordova, "Electrochemical Corrosion Studiesof SNAP Container Materials", U. S. Naval Radiological DefenseLaboratory, USNRIM-TR-1036, 7 June 1966.
2. M. Stern and A. L. Geary, '"lectrochemical Polarization. A TheoreticalAnalysis of the Shape of Polarization Curves", J.lo:56 (1957).
3. M. Stern, "A Method for Determining Corrosion Rates FromPolarization Data", Corrosion 14:440 (1958).
4. N. D. Greene, Experimental Electrode Kinetics, Troy, New York,Rensselaer Polytechnic Institute, p. 31, 1965.
5. H. H. Thlig, ed. The Corrosion Handbook, New York, John Wiley andSons, Inc., p. 4897, 18.i
6. L. W. Weisbecker and S. Z. Mikhail, "Basic Test Plan for OceanExposure Studies of SNAP-21 Radioisotope-Loaded Ftiel Capsule",U. S. Naval Radiological Defense Laboratory, USNRDL-LR-67-96,27 November 1967.
7. L. W. Weisbecker, "Basic Test Plan for Ocean Exposure Studies ofSNAP-2] Electrically Heated Fue.A Capsule Test Systems", U. S. NavalRadiological Defense Laboratory, USNRM -TRC-67-15, 7 March 1967.
8. E. D. Weisert, "Hastelloy C", Chem. Eng. 59:297 (1952).
9. Compilation of Seawater Corrosion Data for Hastelloy C, StelliteDivision, Uinion Carbide Corporation, Kokomo, Indiana, 3965.
30
UNCLALSTFTEDsecuifty Classification
DOCUMENT CONTROL DATA - R & D(Seewit. t.esicst.i., of .e., body, of .sftrrl a.,nd ,f4.., annot.faon ov1 be .nte.,.d when ,h.. ove.e,' repot i. las.e.d*. .
I ORialGiATINe ACTIVITY (CotponfeO Outher) 20. REPORT" SECURITY CLASSIf5CAt ION
U. S. Naval. Rediological Defense Laboratory T=AqqTylTnSan Francisco, California 94135 2,. GROUP
3. REpORT TIT0v E
ELECTROCHEMTICAL CORROSION SUJDIES OF GALVANICALLY COUPLFD SNAP-21 MATERIALS
4. OESCRIPTiVEi N0T•ES (7)'r• "oMf ltt Afto 1019nBIJ dS#e*)
a. AU THORI4I (ulrI nfllmR, aId& initial, lolst name)
Donald A. KuboseHerman I. Cordova
a. REPORT OATE 70. TOTAL NO. OF PAGEgs b. NO. Or Revs
APR•o 968 42SO. CONTRACT ORt GRANT NO. SO. ORIGINATOR'S REPORT NUMBIERISI
AEC, DRD&T Program, AT-RDT-XP-141, Task4
,,..*J•,. rho. 9a and 3b USNRDL-TR-68-26
e. Sb. OT1E4R REPORT NO(S) (Any other nubes die may be asslinedt •4e rpot)
d.
10. OISTRISJTION STATIMENT
This document has been approved for public release and sale; its distribution isunlimited.
II SUPPLEMENTARY NOTES 12. SPONSORING MILITARY ACTIVITY
Atomic Energy CommissionWashingtanx, D. C. 20545
IS AUSTRACT
Electrochemical corrosion rate measurements on materials used in the SNAP-21radioisotopically-f'teled power system have been made in seawater at room tempera-ture. The materials examined included aluminum, copper, Hastelloy C, Hastel'oy X,nickel, 3-4 stainless steel, tantalum, titanium- 6 21 alloy and uranium-8C0 molybdenumalloy. The normal corrosion rate of each material was measured by means of galvan-ostic polarization techniques. A galvanic series of the materials in seawater wasdetermined and the galvanic currents between galvanically coupled material's weremeasured with a zero-resistance ammeter circuit. The effect of galvanic couplingof construction materials of the SNAP-21 system does not materially change the con-tainment time of the Sr-90 fuel in the corrosive seawater environment.
DD '°.1473 PS/N 010t1- ?0-680t .111, !,
T"ClA33 TFIID
14. KvWR$LIN4K A LINK 9 LINK ct
SOkaL I U? P@LU Ut T OL6 WUT
Corrosion*3NAP 2 17lectrochemistryS eauate r
DD 1"UMV9147 (BAK) SFT
(PAG 2)Socuty legef~ctio

![Electrochemical corrosion studies of various metals€¦ · [1]. In a closed electrochemical circuit cur-[7] expressed as:Fundamentals of Electrochemical Corrosion, E. E. Stansbury,](https://img.dokumen.tips/doc/110x75/5f73a612cc40d85fce097206/electrochemical-corrosion-studies-of-various-metals-1-in-a-closed-electrochemical.jpg)