Embed Size (px)
Citation preview

EKONOMSKEIDEJE I PRAKSA
BROJ 6
Kvartalni Časopis iz oblasti eKonomije, poslovne eKonomije i menadŽmenta, statistiKe i poslovne informatiKeEKONOMSKI fAKultEt uNIvERzItEtA u BEOgRADu / BEOgRAD, SEPtEMBAR 2012 / www.EIP.ORg.RS u
OvOM
IzDA
NJu:
vlad
an ba
tano
vić -
slob
odan
Gube
rini
ć - ra
divo
j pet
rović
// d
omaG
oj Ci
ngul
a - m
arija
n Ci
ngul
a //
ivana
jova
nović
// ro
nald
ains
bury
- bi
ljana
peša
lj - s
auliu
s bui
vys /
/ ves
na bu
cevs
Ka -
jasmi
na bu
cevs
Ka //
eva m
ijato
vić //
boŽid
ar ce
rović


EKONOMSKE IDEJE I PRAKSAKvartalni Časopis iz oblasti eKonomije, poslovne eKonomije i menadŽmenta, statistiKei poslovne informatiKe

IzdavačCentar za izdavačku delatnostEkonomskog fakulteta u BeograduKamenička 6, tel. 3021-045, faks 3021-065E-mail:[email protected]
Dekan Ekonomskog fakultetaProf. dr Branislav Boričić
Dizajn korice i priprema za štampuMaxnova Creativewww.maxnova.rs
ŠtampaČugura Print, Beogradwww.cugura.rs
Godina2012.
RedakcIja časopIsa ekonomske Ideje I pRaksa
Glavni urednik časopisaprof. dr Miomir Jakšić
Urednici časopisadr aleksandra Praščević, vanr. prof.dr Vlade Milićević, vanr. prof.dr Saša Veljković, vanr. prof.
članovi Redakcijeprof. dr Miomir Jakšićprof. dr Marko Backovićprof. dr Ðorđe Ðukićprof. dr Siniša Zarićprof. dr Nebojša Janićijevićprof. dr radovan Kovačevićprof. dr Stipe Lovretaprof. dr Dragana Pokrajčićprof. dr gojko rikalovićprof. dr Božidar Cerovićprof. dr Čedomir Čupićdr Predrag Bjelić, vanr. prof. dr radmila Dragutinović Mitrović, vanr. prof.dr Saša Veljković, vanr. prof.dr Vlade Milićević, vanr. prof.dr aleksandra Praščević, vanr. prof.dr Žaklina Stojanović, vanr. prof.dr Miroslav Todorović, vanredni profesor Svetozar Tanasković – sekretar redakcije
Tehnički sekretarJelena Cvetanović
Kontakt redakcijeTelefon: +381 11 3021 068Faks: +381 11 3021 068e-mail: [email protected]
optimization versus sustainability in economic systemsVladan Batanovićslobodan GuberinićRadivoj petrović
monetary and fiscal policy WitH stronG social component – a different patH to GroWtHDomagoj Cingulamarijan cingula
znaČaj nacionalniH raČuna za monetarnu politiKuIvana jovanović
corporate sustainability and responsibility as a source of competitive advantaGe – case of van Houtum companyRonald ainsburyBiljana pešaljsaulius Buivys
estimatinG and forecastinG stocK marKet volatility under crisis: empirical evidence from tHe macedonian stocKVesna BucevskaJasmina Bucevska
accountinG for business combinationseva mijatović
priKaz KnjiGe „tranzicija - zamisli i ostvarenja” Božidar cerović
sadrŽaj
07
21
45
33
59
81
93

Key Words:economic system, optimization, sustainability
optimization versus sustainability in economic systems
vladan batanović1
slobodan Guberinić1
radivoj petrović1
jel KlasifiKacija: c61
abstract: In this paper the concepts of optimization and sustainability in the basic economic insti-tutions are compared and discussed. In the middle of the last century the one among the ruling concepts in the economic theory was an idea of the system optimum with respect to a single selected criterion. In all of the basic institutions of economic theory , such as in the household, in the firm, in the welfare economic, in an aggregative closed economy etc. the main tasks have been determination of the optimum solutions, i.e. maximize associated utility function, or maximize profit or minimize cost, or maximize consumption per worker at any period of time, etc. Both researchers and practitioners recognized the importance of optimization as a key strategic component in economic development. However, one must notice that optimization of a system is not at all a simple problem, and most often the term optimization was used as slang and it does not mean a strict approach to determine the best solution in the considered system. At the beginning of this century, instead of tendency toward pure economic optimization, sustainability became widely used as a result of incre-ased social responsibility and environmental awareness. In treating economic systems the planners and managers try to balance the need for economic growth with the social progress and environmental protection. Moving from pure economic optimization to sustainability became a social challenge. Sustainability requires modelling and analysis for performance measures and metrics of various options of decision making at strategic, tactical and ope-rational levels. In this paper sustainability problem is stated as multicriteria optimization problem with three groups of optimization criteria describing social, economic and envi-ronmental dimensions of system of values in actual systems.
1 Institute Mihajlo Pupin, Belgrade, Serbia
7EkonoMSkE IdEjE I PrakSa | Broj 6 | SEPtEMBar 2012.

1. proloGue
9EkonoMSkE IdEjE I PrakSa | Broj 6 | SEPtEMBar 2012.
a few years ago the followers of the optimization celebrated 300 years from the po-stulate of the first task of the optimal management (Sussmann and Willems, 1997). However, very intensive and successful development of the mathematical optimization theory was characteristic for the fifties of the last century (Pontryagin et al. 1962). It was based mostly on the theory of the maximum and minimum function and on the calculus of variations. If one also consider the revolutionary development of computer and computer science, it explains the opinion that optimization, especially in solving management problems i.e. in defining optimal strategies, plans and optimal decisions, has no obstacles in finding its position and application in all spheres of the real life spheres.
The optimization concepts start to penetrate in all practical areas with a great expecta-tion that theoretical results in the optimization theory area, supported by the powerful computer potential in domain of the numerical mathematics, will be applied usefully in all areas of the human activities. The optimization wave did not even miss the area of the economic sciences (Intriligator, 1971). Very soon, the optimization concepts found their position in the theories of household (Slutsky, 2002), in the theories of the firms (averch and Johnson, 1962), in welfare economics, in the theories of optimal econo-mic growth and others. However, one very important thing must be pointed out. Prac-titioners in almost all areas, including economists, did not have a tendency of thorough research and understanding of the optimization theory, but they were satisfied with the superficial understanding of the optimization concepts which was enough for solving all occurring problems. Simply, the word optimization became an everyday slang instead of a scientific concept with a profound content.
The development of the optimization theory was carried out in several directions. In the formal sense there was a tendency to cover different mathematical forms of the opti-mization tasks: (1) deterministic and stochastic optimization, (2) linear and nonlinear optimization (Dantzig, 1963; Kuhn and Tucker, 1951), (3) dynamic and static opti-mization (Bellmann, 1957), (4) time continuous and time discrete optimization, etc. Considering application there were specialized optimization theories for the application in different spheres, for example, in energetic, water management, human resources usage, manufacturing, and even in economics (Baxley and Moorhouse, 1984).
all approaches to the development of the optimization theory in the specific areas of the applications have their particularities. The one unique thread in all optimization theories is the existence of the one optimal criterion as a strict mathematical measure of the optimal solution performance i.e. optimum. The following is said: the value system is interpreted in every concrete optimization task using optimization criteria. Setting optimization criterion is essentially a subjective action, and a limitation, that in every task must be only one optimization criterion, significantly narrows the domain of the practical application of the optimization theory. However, one should emphasize that the existence of this limitation in the first phase of the development of the optimi-zation theory was necessary, because only that way the mutual comparison of indivi-
dual solutions can be provided, with the purpose to choose only one – optimal solution, in the sense of the defined optimization criterion (guberinic et al. 1970).
The word sustainability is derived from the Latin sustinere – to hold. There are many meanings for sustain as to maintain, to support. a universal accepted definition of su-stainability remains elusive. Sustainability is defined in different ways by the experts for economy, ecology or sociology (allen, 2007). The one general definition is as follows: “Sustainability is a call for action”. There are different definitions in the literature and here we state some of them:
a. “Sustainability means using methods, systems and materials that won’t deplete resources or harm natural cycles”,
B. “Sustainability identifies a concept and attitude in development that looks at a site’s natural land, water and energy resources as integral aspects of the development”,
C. “Sustainability integrates natural systems with human patterns and celebrates continuity, uniqueness and placemaking”,
D. “Sustainability-non-diminishing life opportunities from generation to generati-on”
E. “Sustainable development: Development which meets the needs of present wit-hout compromising the ability of future generations to meet their own needs”
F. “Sustainability – maximization of human welfare over time” (defined by econo-mists).
g. “Sustainability – maintenance of ecosystem resilience” (defined by ecologists). H. “Sustainability – maintenance of a fixed state” (defined by specialists of system
theory). I. “Sustainability –non – decreasing valuation function of the outputs of the con-
sidered system i.e. where, V - some kind of welfare function, O - total value of output (capital stock - natural, manufactured or social). (Gallo-
pin, 2003).
We consider that sustainability as a concept derives from our understanding that all strategies, all plans, all management decisions have social, environmental and econo-mic consequences ( Harris, 2000). That will enable us to develop the formalism of su-stainability as a natural extension of optimization. That will be the subject of this paper.
The optimization criterion is a basic concept in the mathematical optimization theory (guberinic et al. 1970). In the formal sense, the optimization criterion is a function or functional in different forms – numeric or linguistic, and the central optimization task is
oPtIMIZatIon VErSUS SUStaInaBILItY In EConoMIC SYStEMS10
2. optimization criteria and sustainability criteria
to define the management decisions for which the optimization criteria will reach the extreme value (or values). That is mostly a complex task in the concrete optimization problems and literature is very rich in descriptions of the large number of the optimiza-tion methods which is used to determine the extremum of the optimization criteria in the presence of different conditions and limitations, characteristic for different classes of optimization problems. also, a great number of optimization methods deals with tasks of defining approximate extremum values, when it is practically impossible to reach the real extremum.
In the phase of setting the optimization problem, one sets the problem for defining what the optimization criteria is, first descriptive, and then its formal form is found, which is, as we have already said, function or functional. The task of defining optimization criteria is sometimes trivial, but it can even be a very complex research problem.
It is already said that in the first phase of the development of the optimization theory there should be the one – the unique optimization criteria. It was considered that even if seemingly there was a need to define more optimization criteria, they could be ag-gregated in one criteria function (or functional). Insisting that there should be only one optimization criteria is not just the consequence of the belief that the value system can be interpreted well by one performance measurement, but, what is more important, that is a consequence of the methodology difficulties which occur when there are more than one optimization criteria in the optimization task. That actually means that it is assumed that decision makers are “rational”. That is, each decision maker is assumed to have a preference ordering over the outcomes, so the decision makers select a plan, or an action or a control activity, among those feasible, that is the most preferred according to this ordering. The preference ordering is sometimes called optimization criterion, sometimes called pay-off function or utility function.
as illustration, some conventional optimization criteria (Batanovic et al. 2011) are stated: - Considering, for example, the basic institution of microeconomic theory – the firm
(averch and Johnson, 1962). The firm is defined as an entity using economic in-puts to produce output of goods and services sold to households or other firms In the theories of the firm, the firm optimization criterion is either profit or cost, i.e. firms select that level of outputs, and that combinations of inputs which yields, the highest level of profit, or firms select that combination of inputs to produce a certain level of output at minimum cost
- also, a firm may be assumed to maximize its sales, rather than its profit.
In the theory of the household, defined as any group of individuals sharing income so as to purchase and consumer goods and services, the optimization problem is that of deci-ding how much of each of the available goods and services it should purchase in order to maximize an associated utility function.
In the theory of optimal economic growth the basic problem is to choose between pro-vision for the present or consumption and provision for the future or capital accumula-tion. The optimization criterion is a utility function which compromises consumption
11EkonoMSkE IdEjE I PrakSa | Broj 6 | SEPtEMBar 2012.
per worker over the relevant interval and investment per worker over the same interval, which corresponds to the compromise of the policies “Live today, for tomorrow we die” and “consume as little as possible today so as to increase capital and potential for future consumption”.
In the seventies and eighties of the last century, the researcher attention in the optimiza-tion area was concentrated on the optimization problems with more optimization criteria. First it should be said that it is possible to interpret more adequately the system value with more optimization criteria in many real tasks. It is established that if there are more optimization criteria, they can be in a partial or in a complete conflict. The idea develops that it is not only important to interpret the system value using more optimization criteria, but it is essential that optimization criteria “cover” all important environment aspects where the system we treat, plan or manage is positioned (Ching-Lai and Kwangsun, 1981).
The idea of development in general terms did not exist practically until the second half of the twentieth century. However, general problems related to the economic growth and
oPtIMIZatIon VErSUS SUStaInaBILItY In EConoMIC SYStEMS12
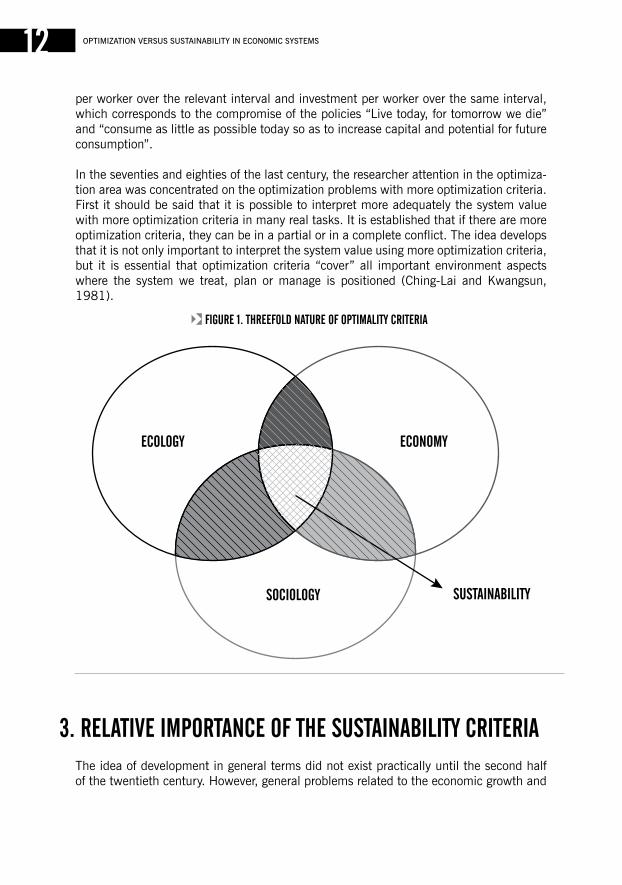
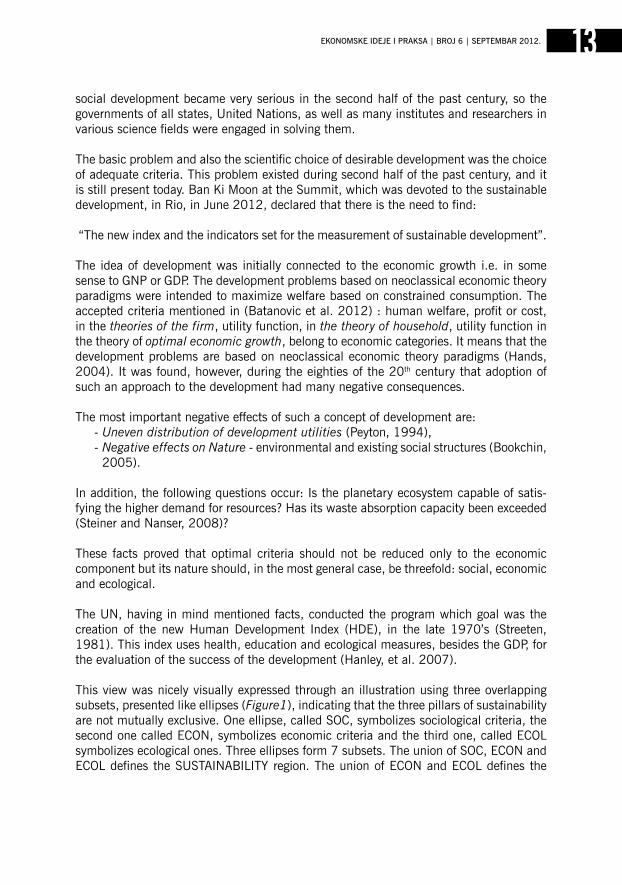
fiGure 1. tHreefold nature of optimality criteria
3. relative importance of tHe sustainability criteria
social development became very serious in the second half of the past century, so the governments of all states, united Nations, as well as many institutes and researchers in various science fields were engaged in solving them.
The basic problem and also the scientific choice of desirable development was the choice of adequate criteria. This problem existed during second half of the past century, and it is still present today. Ban Ki Moon at the Summit, which was devoted to the sustainable development, in rio, in June 2012, declared that there is the need to find:
“The new index and the indicators set for the measurement of sustainable development”.
The idea of development was initially connected to the economic growth i.e. in some sense to gNP or gDP. The development problems based on neoclassical economic theory paradigms were intended to maximize welfare based on constrained consumption. The accepted criteria mentioned in (Batanovic et al. 2012) : human welfare, profit or cost, in the theories of the firm, utility function, in the theory of household, utility function in the theory of optimal economic growth, belong to economic categories. It means that the development problems are based on neoclassical economic theory paradigms (Hands, 2004). It was found, however, during the eighties of the 20th century that adoption of such an approach to the development had many negative consequences.
The most important negative effects of such a concept of development are: - Uneven distribution of development utilities (Peyton, 1994), - Negative effects on Nature - environmental and existing social structures (Bookchin,
2005).
In addition, the following questions occur: Is the planetary ecosystem capable of satis-fying the higher demand for resources? Has its waste absorption capacity been exceeded (Steiner and Nanser, 2008)?
These facts proved that optimal criteria should not be reduced only to the economic component but its nature should, in the most general case, be threefold: social, economic and ecological.
The uN, having in mind mentioned facts, conducted the program which goal was the creation of the new Human Development Index (HDE), in the late 1970’s (Streeten, 1981). This index uses health, education and ecological measures, besides the gDP, for the evaluation of the success of the development (Hanley, et al. 2007).
This view was nicely visually expressed through an illustration using three overlapping subsets, presented like ellipses (Figure1), indicating that the three pillars of sustainability are not mutually exclusive. One ellipse, called SOC, symbolizes sociological criteria, the second one called ECON, symbolizes economic criteria and the third one, called ECOL symbolizes ecological ones. Three ellipses form 7 subsets. The union of SOC, ECON and ECOL defines the SuSTaINaBILITY region. The union of ECON and ECOL defines the
13EkonoMSkE IdEjE I PrakSa | Broj 6 | SEPtEMBar 2012.
VIaBILITY region. The union of SOC and ECON defines the EQuITaBILITY region. The union of SOC and ECOL defines the BEaraBILITY region.
as one can see we enter into the domain of multicriteria optimization with three types of optimization criteria for sustainability problems or two types of optimization criteria for viability, equitability and bearability problems, respectively.
Defining sustainable strategies, sustainable plans, and sustainable management actions assumes the existence of 3 optimal criteria groups: social, economic and ecological crite-ria. Therefore, each criteria group may have at least one or even more criteria within the group. We will give an example.
In the electricity production the thermal blocks produce electric power, and its produc-tion is performed along with the emission of the harmful gases CO2 and NH3, as well as the emission of the particles of coal dust. also, the production of the electric power is followed by increase of the temperature of the water for cooling aggregate which is usually led to the river. Thus the candidates for the ecological optimal criteria appear in 4 sizes: amount of the emission of two harmful gases, amount of emitted particles of coal dust and increase of temperature of water for cooling in the cooling system. The values of all four ecological optimal criteria should be reduced to as smaller value as possible, i.e. they should be minimized. generally, the question of the importance of the optimization criteria groups occurs. Coefficients of the relative importance V (SOC), V (EKON) and V (EKOL) define the relative importance of the individual criteria groups. In the simplest cases, the coefficients are normalized, which means that their sum is equal to 1, and they take value between 0 and 1.
The numerical values which denote relative importance of the individual criteria groups are the result of the subjective assessment of the decision maker in the sustainable tasks. They are, as a rule, one simple interpretation of the linguistic assessments. For example, if one considers that all three groups of the optimal criteria are equally important, then all three coefficients of the criteria relative importance have the value 1/3. If one, for exam-ple, considers that economic criteria are as important as social and economic together, and the late two are equally important, then V (ECON) = ½, V (SOC) = V (EKOL) = ¼. In some sustainable task it is appropriate to treat the relative importance of the groups of the sustainable criteria as fuzzy values ( Pedrycz and gomide, 1998). The simplest is to use three primes, which can be considered as standardized. These are fuzzy sets “great importance”, “Medium importance” and “Small importance”. The next possibility is to enrich primes and to introduce the intensified fuzzy sets “Very great importance” and “Very small importance” etc, and also to introduce fuzzy sets “Very, very great importan-ce” and “Very, very small importance”. We should emphasize that if fuzzy sets are used for the description of the relative importance of the groups of the optimal criteria, then the fuzzy methodologies must be used in the process of defining sustainable strategies, plans and management actions.
In the following we present the selected taxonomy of the methods for multicriteria opti-mization:
oPtIMIZatIon VErSUS SUStaInaBILItY In EConoMIC SYStEMS14
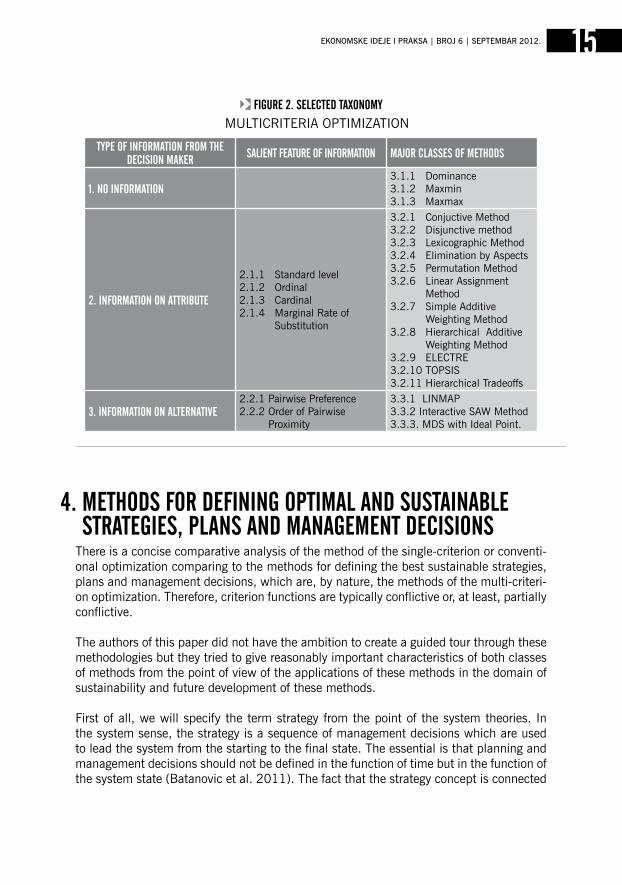
There is a concise comparative analysis of the method of the single-criterion or conventi-onal optimization comparing to the methods for defining the best sustainable strategies, plans and management decisions, which are, by nature, the methods of the multi-criteri-on optimization. Therefore, criterion functions are typically conflictive or, at least, partially conflictive.
The authors of this paper did not have the ambition to create a guided tour through these methodologies but they tried to give reasonably important characteristics of both classes of methods from the point of view of the applications of these methods in the domain of sustainability and future development of these methods.
First of all, we will specify the term strategy from the point of the system theories. In the system sense, the strategy is a sequence of management decisions which are used to lead the system from the starting to the final state. The essential is that planning and management decisions should not be defined in the function of time but in the function of the system state (Batanovic et al. 2011). The fact that the strategy concept is connected
15EkonoMSkE IdEjE I PrakSa | Broj 6 | SEPtEMBar 2012.
fiGure 2. selected taxonomyMuLTICrITErIa OPTIMIZaTION
type of information from tHe decision maKer salient feature of information major classes of metHods
1. no information3.1.1 Dominance3.1.2 Maxmin3.1.3 Maxmax
2. information on attribute
2.1.1 Standard level2.1.2 Ordinal2.1.3 Cardinal2.1.4 Marginal rate of
Substitution
3.2.1 Conjuctive Method3.2.2 Disjunctive method3.2.3 Lexicographic Method3.2.4 Elimination by aspects3.2.5 Permutation Method3.2.6 Linear assignment
Method3.2.7 Simple additive
Weighting Method3.2.8 Hierarchical additive
Weighting Method3.2.9 ELECTrE3.2.10 TOPSIS3.2.11 Hierarchical Tradeoffs
3. information on alternative2.2.1 Pairwise Preference2.2.2 Order of Pairwise
Proximity
3.3.1 LINMaP3.3.2 Interactive SaW Method3.3.3. MDS with Ideal Point.
4. metHods for defininG optimal and sustainable strateGies, plans and manaGement decisions
with the concept of the system state complicates the definition of the strategy. The con-cept of state exists in different sciences and in the science of the system management the concept of the state is one of the fundamental concepts and it has a very important role.
In this paper we will not deal with the formal definition of the system state, but we give only heuristic definition: state is a set of data on the system which give complete infor-mation about the system history, which is necessary for determining its state in the future if the management decisions are known. as it can be seen, the state is a function of the time. unlike a plan in which the management decisions are defined in the function of the time, the essence of the strategy concept is that the management decisions are defined in the function of the system state.
It is useless to talk about the best or optimal strategy if it is not defined in which sense it is the best. Optimization criteria define the sense. It is well known that optimal strategies satisfy the optimality principle (Bellman, 1957): “an optimal strategy has the property that whatever the initial state and the initial decisions are, the remaining decisions must constitute an optimal strategy with regard to the state resulting from the first decisions.” as known, the principle of optimality is a base for development of many optimization methods (Bellman and Dreyfus, 1962).
It follows from this that the methodology bases of the optimization assume that the system which tends to be optimized does not have memory or, precisely, the system history is not relevant for the future system optimization.
The principle of optimality cannot be expanded to some principle of sustainability, in the sense that what refers to the system optimality, refers also to the sustainability. In other words, it cannot be assumed that the system history is not relevant in the defining of sustainable strategies, plans and management decisions. That significantly complicates the development of the methodology basis for defining sustainable strategies, sustainable plans and sustainable management decisions.
The methods of the single-criteria optimization have about two times longer history than the methods of the multi-criteria optimization. The rich history of the methods of the single-criteria optimization is about 6 decades long and the history of the second ones is only three decades long. The literature on the the single-criteria optimization is very numerous. Besides a great number of books, studies, monographies, there is also a great number of specialized periodicals. Most of the texts are dedicated to different mathemati-cal programming – linear programming, nonlinear programming, dynamic programming, integer and combinatory optimization, stochastic optimization etc. The other large group of single-criteria optimization methods is dedicated to the dynamic optimization with continuous time. This group is actually an extension of the calculus of variations and the maximum principle of Pontryagin (Pontryagin et al. 1962). It should be emphasized that the development of the single-criteria methods of optimization is followed by the intensi-ve development of computational support of the methods, intended for the application of these methods in solving the real words optimization problems.
oPtIMIZatIon VErSUS SUStaInaBILItY In EConoMIC SYStEMS16
regarding the literature on the multi-criteria optimization, it has the following charac-teristics. Because of the broad interdisciplinary character of the field, the multicriteria optimization articles appear in more than hundred highly ranked scientific journals. There are more taxonomies of methods of determination of sustainable strategies, plans or de-cisions in the literature. In this paper we present only the one selected taxonomy, (Figure 2) (Ching-Lai and Kwangsun, 1981). They classify methods for multicriteria decision making upon different form of preference information from decision maker.
While methods of single-criteria optimization are characterized by exactness and rigor, the methods of multi-criteria optimization which are connected with defining sustainable strategies, plans and management decision, do not possess these characteristics, but, as a rule, the subjectivity of the decision maker always influences the method itself and the interpretation of results. The reason for this is double: (1) it is necessary to establish the relative importance of three groups of optimality criteria – sociological, economic and ecological which exist in sustainability problems. Defining relative importance is actually subjective action in which the decision maker (or a decision maker team) interprets the system value in every concrete problem of the sustainable solutions choice. (2) The rela-tive preference of the set of elements in the sense of more than one attribute associated to the set of elements cannot be strict and unique. Since this relation is important part of the methods of the multi-criteria optimization, these methods cannot lead to the exact solution of the sustainability problem (adams, 2006).
as it is already implied the subject of this paper is an effort to develop the formalism of sustainability as a natural extension of optimization. In the area of the mathematical optimization and operational research, a whole sequence of optimization methods and algorithms of the optimal decision making is developed. However, when attempting to apply these methods on the problem of the sustainable development, a serious problem of mathematical problem formulation occurs, especially a problem of defining optimality criteria i.e. performance index of sustainable development.
For solving the task of optimal decision making, it is necessary to have a mathemati-cal statement of the decision making task and development of the exact optimization method. Elements, necessary for the formal statement of the optimal decision making problem, such as optimality criteria, constraints which define a set of acceptable de-cisions, time interval in which the managed process is taking part, are mostly defined by the specific nature of the problem. Thus development and application of the method of optimal decision making are concentrated on the development of the mathematical optimization methods. until today, a set of formal methods for solving different problems of the optimal decision making has been developed mostly in the area of the operational research. also in our time researchers make great efforts in development of new optimi-zation methods and improving the existing ones.
17EkonoMSkE IdEjE I PrakSa | Broj 6 | SEPtEMBar 2012.
5. conclusion

The paper presents how to use methods, developed in the area of the optimal decision making for solving tasks of optimal management of sustainable development. However, the specificity of the problem of sustainable development, comparing to the classical task of the optimal decision making, reflects in the mathematical statement of the task of the optimal sustainable development.
Namely, because of the complexity of the task of sustainable development management, defining of the problem statement elements, such as optimality criteria, constraints, time interval in which a process is taking part, is a very complex problem. Optimality criteria were first economic in their nature. However, it soon became obvious that it was nece-ssary to include elements of social justice and ecology in the optimality criteria (Diclos, 2008).
The fact that the united Nations has started special programs for defining adequate and generally accepted optimality criteria also points out to the complexity and importance of this problem. Defining optimality criteria is a problem that is actual even today, so that one of the conclusions of the Summit “rio+20”, held in June this year, in rio de Janeiro, was that it was necessary to define “new index and set of indicators for the measurement of the sustainable development.”
The concepts of optimization and sustainability derived within the system theories get an important position in the economic theories and in the practice of planning and manage-ment of the real economic systems.
as it was the case with the optimization ideas in the middle of the last century, that means that there was a lot of talk about them and relatively little was known, thus today the same is with the sustainability ideas. Terms optimization and sustainability are used almost every day, and the authors of both written texts and spoken words mostly use those terms with the intention to be on the line of modernism and they show neither the profound knowledge of these concepts nor understanding of methodology bases of optimization and sustainability.
The authors believe that the sustainability ideas will gain strength in the near future and that very soon will be developed the strict and perspective theories of sustainable firm, of sustainable household, theories of sustainable economic growth and others.
oPtIMIZatIon VErSUS SUStaInaBILItY In EConoMIC SYStEMS18
7. reference literatureadams, W. M. (2006), The Future of Sustainability, rethinking Environment and Development in the Twenty- first Century, report IuCN.
allen, W. (2007), Learning for Sustainability, Sustainable Development.
averch, H. and Johnson, L. L. (1962), “Behavior of the firm under regulatory constra-int”, American Economic Review, Vol. 52, Pp 1053-1069.
Batanovic, V. et al. (2011), “System Theoretic approach to Sustainable Development Problems” Yugoslav Journal of Operations Research, Vol. 21, Pp 1-10.
Baxley, J. and Moorhouse J. (1984) , “Lagrange Multiplier Problems in Economics”, American Math Monthly, Vol. 91, Pp 404-412.
Bellman, r. (1957), Dynamic Programming, Princeton, N.J.: Princeton university Press, 1957.
Bellman, r. and Dreyfus S., (1962) Applied Dynamic Programming, Princeton uni-versity Press, Princeton, New Jersey.
Bookchin, M. (2005), The Ecology of Freedom, Stirling Press.
Ching-Lai, H. and Kwangsun. (1981), “Multiple attribute Decision Making, Methods and applications", Lecture Notes in Economics and Mathematical Systems No. 186, Springer Verlag, Berlin.
Dantzig g.B. (1963), Linear programming and extensions, Princeton university Pre-ss, Princeton, New Jersey.
Diclos, J. (2008), Horizontal and Vertical Equity, The New Palgrave Dictionary of Economics.
galloppin, g. (2003), “a Systems approach to Sustainability and Sustainable Deve-lopment”, UN Publication, Santiago, Chile Pp 1- 42.
guberinic, S. et al. (1970), Sistemi, upravljanje sistemima, sistemske discipline tehnike i metode, Institut „Mihailo Pupin“, Beograd (In Serbian).
Hands, D. (2004), Introductory Mathematical Economics, Second Edition, Oxford univ. Press, (1st ed., Heath, 1991).
Hanley, N. et al. (2007), Environmental Economics in Theory and Practice, Palgrave, London.
Harris, J. (2000), “ Basic Principles of Sustainable Development”, Working paper 00-04, Tufts university, Medford Ma, uSa, Pp 1-26.
Intriligator, M. (1971), Mathematical Optimization and Economic Theory, Prentice-Hall.
Kuhn, H. and Tucker a. (1951), “Nonlinear Programming”, in J. Neyman (ed.), (1950), Proceedings of the Second Berkeley Symposium on Mathematical Statistics and Probability, univ. of California Press Pp 481-492.
Pedrycz, W. and gomide F. (1998) An Introduction to Fuzzy Sets, a Bradford Book, the MIT Press, Cambridge, Massachusetts.
19EkonoMSkE IdEjE I PrakSa | Broj 6 | SEPtEMBar 2012.

oPtIMIZatIon VErSUS SUStaInaBILItY In EConoMIC SYStEMS20
Peyton Y. (1994), Equity in Theory and Practice, Princeton university Press.
Pontryagin V. g. et al. (1962), The Mathematical Theory of Optimal Processes, Wiley, New York, NY.
Slutsky, E. (2002), “On the theory of the budget of the consumer”, in.. Stigler g. J and Boulding K. E.(eds.), Readings in Price Theory, 27-56, Chicago: Irwin.
Steiner,r. and Nanser, M. (2008), “Human Ecology”, Ecology review, Vol 15,No.1.
Streeten, P. (1981), First Things First: Meeting basic human needs in developing countries, World Bank Publikation.
Sussman, H. and Willems, J. C. (1997), „Years of Optimal Control: From The Brahi-stochrone to the Maximum Principle“, IEEE Control Systems, Vol.33, Pp.32-44.
monetary and fiscal policy WitH stronG social component – a different patH to GroWtH
domaGoj cinGula1
marijan cinGula2
jel KlasifiKacija: e52, e62
1 Volksbank d.d. Zagreb, Varšavska 9, Zagreb2SveučilišteuZagrebu,Ekonomskifakultet,TrgJ.F.Kennedyja6,Zagreb
21EkonoMSkE IdEjE I PrakSa | Broj 6 | SEPtEMBar 2012.
MONETARYANDFISCALPOLICYWITHSTRONGSOCIALCOMPONENT–ADIFFERENTPATHTOGROWTH22
Key Words:fiscal policy, Global crises, monetary policy, social component
abstract: Since global crisis started to shake World's largest economies until today, Croatia con-tinues to blindly follow instructions from Europe. Restrictive monetary policy with main goal of preserving the value of national currency „Kuna“ (Hrvatska kuna - HRK) was carried out successfully, yet there is no other positive effect visible. Record-low infla-tion ratio in 2011 failed to cover up the real results during period of no GDP (Gross Domestic Product) growth, wages reduction or taxes increase and constant problems with unemployment. Fiscal policy in past few years stroke Croatian population with value added tax 22% to 23% increase at first, and up to 25% increase finally. People were also hit by a special crisis tax during the year 2010, and they are facing new wages decrease in 2012. Gasoline prices are going up on regular basis even during periods of Oil price stagnation or fall where government takes share in gasoline price over 50%. Although USD (United States Dollar) went up in comparison with HRK, Oil price went down drastically since 2008 so gasoline price should follow negative trend drastically. People or companies cannot blame government or central bank for their own mistakes like over indebtedness or bad investments, but they rightly expect and crave for solutions that would help them overcome this difficult period instead of just being used as a tool for filling up the national budget gaps. New Croatian government, established after elections in early 2012, is taking different actions to fill up national budget deficit without taking into consideration that all measure, taken so far, are limiting citizens and SMEs (Small and Medium Sized Enterprises) more and more in their economic independency (due to electricity, gas or toll price growth). Since new government continues to promise results that cannot emerge out of their policy and central bank actions, the paper comes up with new monetary and fiscal policy mutual direction with strong social component. This mutual direction consists of five steps: 1. „Coming out of the closet“, 2. Gain and keep Trust, 3. Higher Liquidity, 4. Debt Con-trol, 5. Production and Export. Firm base or solid foundation for the implementation of these steps is made out of two assumptions or main pre-actions: 1. back to moral values, 2. economic crime equals crime. Since government, central bank and citizens with SMEs and large corporations form one unity, and unity cannot function with only one side satisfied, therefore social, moral and ethic values should become main priority of monetary and fiscal policy.

Fiscal policy involves changing government spending and taxation3. Balancing betwe-en government revenue and expenditure should be done with purpose of influencing economy in a positive way. Fiscal policy is one mechanism through which government tries to affect gDP. Monetary policy is other mechanism created with the same pur-pose of affecting gDP with central bank as a main government body to control money supply. The amount of money that is available for spending by individuals or busine-sses affects prices, interest rates, foreign exchange rates, and the level of income in the economy4. a global crisis has significantly influenced world’s largest economies so no wonder that Croatia is going through one of the most difficult period since its independence, especially for the fact that Croatia lines up with developing (emerging) countries. There are constant and heated discussions about weather or not monetary and fiscal policy lead to the right way to overcome the crisis5.
No less important reason for difficult situation in Croatia is very high corruption level6 which is visible in the numerous fields like law, economics, sport etc. This is mentio-ned because of more and more currently opened cases against highly ranked people or formerly highly ranked people in small or large companies, leading persons or formerly leading persons of the city authorities, leaders or former leaders of state enterprises, high government officials or former government officials, and even against the former prime minister. Cases include embezzlement of extremely large sums of money, and causing damage or even complete destruction of large number of companies and citizens. authors distance themselves from the conviction of individuals in these ca-ses, and only point out serious consequences of enterprises and other entities illicit impoverishment.
Instead of finding almost impossible solutions, which in Croatia example means exactly what politicians do: looking for more different ways to collect money from already exhausted firms and citizens only to fill up national budget holes, the paper tries to point out possible and doable methods to lead monetary and fiscal policy in a different path to economic growth.
One of the main goals of Croatian monetary policy is preserving the value of national currency kuna (HrK) and mentioned goal was carried out quite successfully during past few years7. Yet, there are few quite questionable moves that central bank was re-peating during that time and some of them are considered to be a reason why Croatian economy still cannot find a path to growth.
23
1. introduction
EkonoMSkE IdEjE I PrakSa | Broj 6 | SEPtEMBar 2012.
2. monetary and fiscal policy in croatia
3Wessels,W.J.,(2006),p.1784Boyes,W.andMelvin,M.,(2012),p.2845Jurčić,Lj.(2009)6KorupcijauHrvatskoj(2011),p.117Piplica,D.(2012),p.238
Both enterprises and citizens where significantly influenced by the CHF (Swiss Franc) growth in 2011 because of large amounts of bank loans in that currency, where CHF growth in comparison to other currencies was also followed by quite big interest ra-tes growth in Croatia. National bank started to make bigger pressure on the banking sector just before Swiss government took measures to stop their currency growth and that was already too late. “CHF case” would not even be called a case if central bank with government reacted on time to stop growth of the interest rates on loans with CHF clause. It is pure logic that after certain, significant, CHF growth it was necessary for banks to even reduce interest rates on loans with CHF clause. It was unacceptable that banks protect themselves both with currency clause (typical hedging) and interest rates growth, at the same time. Huge extra profit of the banking sector in Croatia, while all other sectors with citizens were impoverished, emerged as a result8.
Other questionable step made by the central bank was that with the reduction in the banks reserve requirements, which was made to increase lending capacity of banks, newly liberated funds were used to support and finance Croatian government, inste-ad of private sector. That step was taken more than once and no positive effect was visible in economy, of course, since these funds (or significant part of these funds) should be used to finance manufacturing enterprises and export programs or tourism, for example. One other thing that would help general liquidity and that would help enterprises and citizens to get through this difficult period of time is that these funds could have been used for restructuring, rescheduling and prolongation of existing cre-dit obligations of citizens or private sector.
Fiscal policy, in the other hand, has brought many changes that have further stran-gled Croatian economy. Value added tax increase (22% to 23% at first, then finally to 25%), special crises tax in 2010 with new Croatian government measures (constant gasoline price growth even during long period of oil price decrease, electricity and gas price growth, roads toll increase, etc.) are only burdening enterprises and citizens further with purpose to support national budget. Monetary and fiscal policy should mutually influence and help state economy while the case of Croatia shows drastic differences because the people and companies constantly have to support government more and more, getting nothing in return.
In many developed countries there is a prohibition on government borrowing from central bank (or limit on such borrowing as a proportion of past government revenue or expenditure)9 which was mentioned earlier, and that fiscal rule stands for European union members also. There are certain new Croatian government actions that should definitely be done, especially ones that will prevent entities to avoid paying tax or measures to exterminate work market known as “black labour”, still it is not possible to make all these steps “over night”. all actual measures, taken so far, are only enlar-ging the number of enterprises with locked (blocked) accounts and further strangling liquidity and capacity for competition of Croatian private sector10.
MONETARYANDFISCALPOLICYWITHSTRONGSOCIALCOMPONENT–ADIFFERENTPATHTOGROWTH24
8 Krizazbog„švicaraca“(2011)9 Kopits,G.andSymansky,S.(1998),p.210 IndustrijskaproizvodnjauHrvatskoj(2012)
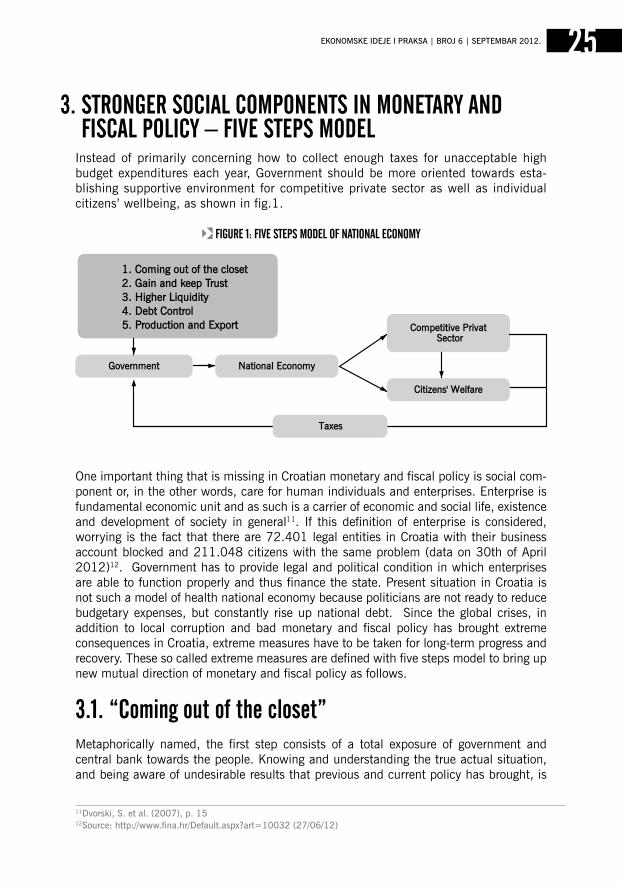
Instead of primarily concerning how to collect enough taxes for unacceptable high budget expenditures each year, government should be more oriented towards esta-blishing supportive environment for competitive private sector as well as individual citizens’ wellbeing, as shown in fig.1.
One important thing that is missing in Croatian monetary and fiscal policy is social com-ponent or, in the other words, care for human individuals and enterprises. Enterprise is fundamental economic unit and as such is a carrier of economic and social life, existence and development of society in general11. If this definition of enterprise is considered, worrying is the fact that there are 72.401 legal entities in Croatia with their business account blocked and 211.048 citizens with the same problem (data on 30th of april 2012)12. government has to provide legal and political condition in which enterprises are able to function properly and thus finance the state. Present situation in Croatia is not such a model of health national economy because politicians are not ready to reduce budgetary expenses, but constantly rise up national debt. Since the global crises, in addition to local corruption and bad monetary and fiscal policy has brought extreme consequences in Croatia, extreme measures have to be taken for long-term progress and recovery. These so called extreme measures are defined with five steps model to bring up new mutual direction of monetary and fiscal policy as follows.
3.1. “coming out of the closet”Metaphorically named, the first step consists of a total exposure of government and central bank towards the people. Knowing and understanding the true actual situation, and being aware of undesirable results that previous and current policy has brought, is
25EkonoMSkE IdEjE I PrakSa | Broj 6 | SEPtEMBar 2012.
3. stronGer social components in monetary and fiscal policy – five steps model
fiGure 1: five steps model of national economy
11Dvorski,S.etal.(2007),p.1512Source:http://www.fina.hr/Default.aspx?art=10032(27/06/12)
essential for the proper functioning of the state, without future significant changes in a popularity of ruling and alternative parties. regardless to any specific political opti-on, authors consider that frequent changes of ruling parties are not good for long-term prosperity as long as politicians primarily concern of getting the rule or staying at rule, between two elections, instead of long term national interests. Main term and obligation in such process of transparent behaviour is honesty, since it is so closely related to the fundamental principle of keeping trust13 and numberless woman and men of all regions and religions strive to live lives of honesty and truthfulness14.
3.2. gain and keep trustTo gain and to keep the trust, which involves feelings of mutuality, dependency and confidence15, is more than tough task after years of catastrophic economic performance. Yet, after first step accomplished well, gaining trust is much easier. Keeping trust in the other hand stands for constant effort to preserve gained trust. This can be achieved only in surrounding and society where honesty becomes part of standard behaviour. There are few major things helping:
- Focus on actions that will affect long-term performance rather than inventing soluti-ons that will “put out the fire” and only camouflage bad current situation;
- Inform the public and educate people: describe every political action and what is expected to emerge out of it;16
- Seek for the solutions that will help people and companies being able to support the state: mutual support instead of just imposing new duties and taxes.
Trust is very hard to keep in any kind of relationship, yet transparency, honesty and con-stant effort to make things better are building sufficient ground for achieving that.
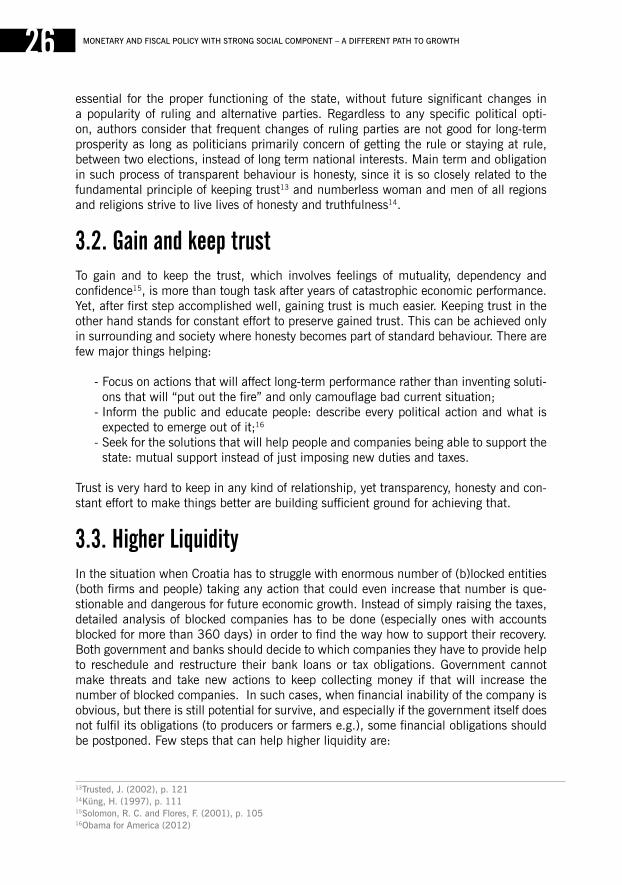
3.3. Higher liquidityIn the situation when Croatia has to struggle with enormous number of (b)locked entities (both firms and people) taking any action that could even increase that number is que-stionable and dangerous for future economic growth. Instead of simply raising the taxes, detailed analysis of blocked companies has to be done (especially ones with accounts blocked for more than 360 days) in order to find the way how to support their recovery. Both government and banks should decide to which companies they have to provide help to reschedule and restructure their bank loans or tax obligations. government cannot make threats and take new actions to keep collecting money if that will increase the number of blocked companies. In such cases, when financial inability of the company is obvious, but there is still potential for survive, and especially if the government itself does not fulfil its obligations (to producers or farmers e.g.), some financial obligations should be postponed. Few steps that can help higher liquidity are:
MONETARYANDFISCALPOLICYWITHSTRONGSOCIALCOMPONENT–ADIFFERENTPATHTOGROWTH26
13 Trusted,J.(2002),p.12114 Küng,H.(1997),p.11115 Solomon,R.C.andFlores,F.(2001),p.10516 ObamaforAmerica(2012)
- greater period of time between the introduction of significant changes related to price increases and taxes growth (value added tax increase, gasoline price growth, electricity and gas price growth, road toll increase etc. in only few months is unacceptable);
- rescheduling and restructuring of existing credit obligations: even if extra profits in banking sector could suffer;
- Higher level of control in large cash and debt generators: big concerns and state enterprises e.g.;
- More flexibility to small tax defaulters: notice the absurdity and damage in cases of blocking firms with small tax debt.
No greater debt reduction and production growth can be expected without affecting gene-ral liquidity – it is not likely to expect that people and enterprises can support government’s liquidity and liquidity of the banks in long-term, if the state and banks can’t do the same for people and enterprises, especially in time of crises.
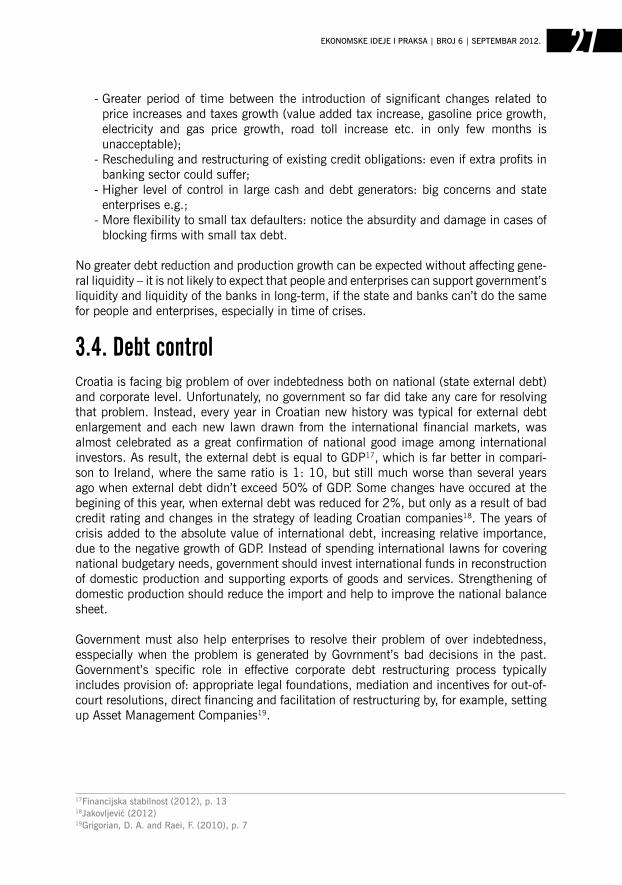
3.4. debt controlCroatia is facing big problem of over indebtedness both on national (state external debt) and corporate level. unfortunately, no government so far did take any care for resolving that problem. Instead, every year in Croatian new history was typical for external debt enlargement and each new lawn drawn from the international financial markets, was almost celebrated as a great confirmation of national good image among international investors. as result, the external debt is equal to gDP17, which is far better in compari-son to Ireland, where the same ratio is 1: 10, but still much worse than several years ago when external debt didn’t exceed 50% of gDP. Some changes have occured at the begining of this year, when external debt was reduced for 2%, but only as a result of bad credit rating and changes in the strategy of leading Croatian companies18. The years of crisis added to the absolute value of international debt, increasing relative importance, due to the negative growth of gDP. Instead of spending international lawns for covering national budgetary needs, government should invest international funds in reconstruction of domestic production and supporting exports of goods and services. Strengthening of domestic production should reduce the import and help to improve the national balance sheet.
government must also help enterprises to resolve their problem of over indebtedness, esspecially when the problem is generated by govrnment’s bad decisions in the past. government’s specific role in effective corporate debt restructuring process typically includes provision of: appropriate legal foundations, mediation and incentives for out-of-court resolutions, direct financing and facilitation of restructuring by, for example, setting up asset Management Companies19.
27EkonoMSkE IdEjE I PrakSa | Broj 6 | SEPtEMBar 2012.
17Financijskastabilnost(2012),p.1318Jakovljević(2012)19Grigorian,D.A.andRaei,F.(2010),p.7
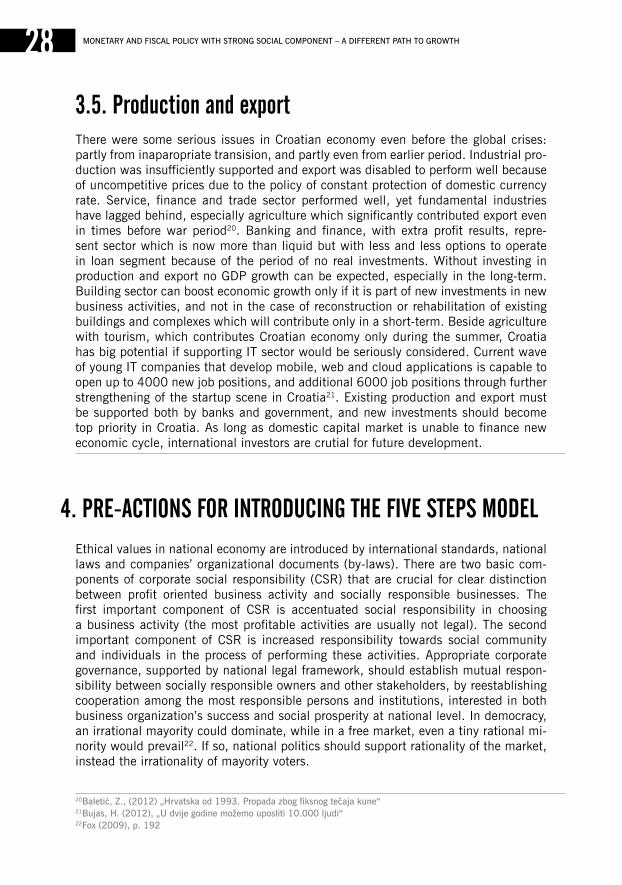
3.5. production and exportThere were some serious issues in Croatian economy even before the global crises: partly from inaparopriate transision, and partly even from earlier period. Industrial pro-duction was insufficiently supported and export was disabled to perform well because of uncompetitive prices due to the policy of constant protection of domestic currency rate. Service, finance and trade sector performed well, yet fundamental industries have lagged behind, especially agriculture which significantly contributed export even in times before war period20. Banking and finance, with extra profit results, repre-sent sector which is now more than liquid but with less and less options to operate in loan segment because of the period of no real investments. Without investing in production and export no gDP growth can be expected, especially in the long-term. Building sector can boost economic growth only if it is part of new investments in new business activities, and not in the case of reconstruction or rehabilitation of existing buildings and complexes which will contribute only in a short-term. Beside agriculture with tourism, which contributes Croatian economy only during the summer, Croatia has big potential if supporting IT sector would be seriously considered. Current wave of young IT companies that develop mobile, web and cloud applications is capable to open up to 4000 new job positions, and additional 6000 job positions through further strengthening of the startup scene in Croatia21. Existing production and export must be supported both by banks and government, and new investments should become top priority in Croatia. as long as domestic capital market is unable to finance new economic cycle, international investors are crutial for future development.
Ethical values in national economy are introduced by international standards, national laws and companies’ organizational documents (by-laws). There are two basic com-ponents of corporate social responsibility (CSr) that are crucial for clear distinction between profit oriented business activity and socially responsible businesses. The first important component of CSr is accentuated social responsibility in choosing a business activity (the most profitable activities are usually not legal). The second important component of CSr is increased responsibility towards social community and individuals in the process of performing these activities. appropriate corporate governance, supported by national legal framework, should establish mutual respon-sibility between socially responsible owners and other stakeholders, by reestablishing cooperation among the most responsible persons and institutions, interested in both business organization’s success and social prosperity at national level. In democracy, an irrational mayority could dominate, while in a free market, even a tiny rational mi-nority would prevail22. If so, national politics should support rationality of the market, instead the irrationality of mayority voters.
MONETARYANDFISCALPOLICYWITHSTRONGSOCIALCOMPONENT–ADIFFERENTPATHTOGROWTH28
4. pre-actions for introducinG tHe five steps model
20 Baletić,Z.,(2012)„Hrvatskaod1993.Propadazbogfiksnogtečajakune“21 Bujas,H.(2012),„Udvijegodinemožemouposliti10.000ljudi“22 Fox(2009),p.192
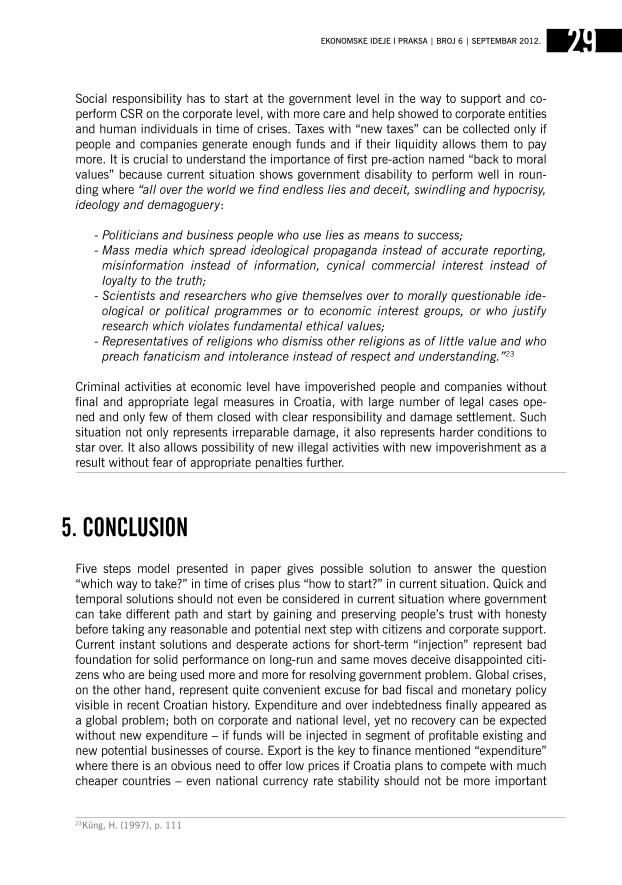
Social responsibility has to start at the government level in the way to support and co-perform CSr on the corporate level, with more care and help showed to corporate entities and human individuals in time of crises. Taxes with “new taxes” can be collected only if people and companies generate enough funds and if their liquidity allows them to pay more. It is crucial to understand the importance of first pre-action named “back to moral values” because current situation shows government disability to perform well in roun-ding where “all over the world we find endless lies and deceit, swindling and hypocrisy, ideology and demagoguery:
- Politicians and business people who use lies as means to success; - Mass media which spread ideological propaganda instead of accurate reporting,
misinformation instead of information, cynical commercial interest instead of loyalty to the truth;
- Scientists and researchers who give themselves over to morally questionable ide-ological or political programmes or to economic interest groups, or who justify research which violates fundamental ethical values;
- Representatives of religions who dismiss other religions as of little value and who preach fanaticism and intolerance instead of respect and understanding.”23
Criminal activities at economic level have impoverished people and companies without final and appropriate legal measures in Croatia, with large number of legal cases ope-ned and only few of them closed with clear responsibility and damage settlement. Such situation not only represents irreparable damage, it also represents harder conditions to star over. It also allows possibility of new illegal activities with new impoverishment as a result without fear of appropriate penalties further.
Five steps model presented in paper gives possible solution to answer the question “which way to take?” in time of crises plus “how to start?” in current situation. Quick and temporal solutions should not even be considered in current situation where government can take different path and start by gaining and preserving people’s trust with honesty before taking any reasonable and potential next step with citizens and corporate support. Current instant solutions and desperate actions for short-term “injection” represent bad foundation for solid performance on long-run and same moves deceive disappointed citi-zens who are being used more and more for resolving government problem. global crises, on the other hand, represent quite convenient excuse for bad fiscal and monetary policy visible in recent Croatian history. Expenditure and over indebtedness finally appeared as a global problem; both on corporate and national level, yet no recovery can be expected without new expenditure – if funds will be injected in segment of profitable existing and new potential businesses of course. Export is the key to finance mentioned “expenditure” where there is an obvious need to offer low prices if Croatia plans to compete with much cheaper countries – even national currency rate stability should not be more important
29
5. conclusion
EkonoMSkE IdEjE I PrakSa | Broj 6 | SEPtEMBar 2012.
23Küng,H.(1997),p.111
then ability to offer cheap price. government must also take big part in the process of presenting and educating people that saving and keeping the money should not take place before investing the money and also has to provide conditions in which profitable investments are possible. gDP growth will not emerge out of higher taxes, higher control of tax debtors and other “penalties”, neither out of consumption reduction. It will emerge as a result of honest and hard work where government and central bank will mutually support people and economy.
MONETARYANDFISCALPOLICYWITHSTRONGSOCIALCOMPONENT–ADIFFERENTPATHTOGROWTH30
6. reference literatureBaletić, Z. (2012), „Hrvatska od 1993. Propada zbog fiksnog tečaja kune“, Ju-tarnji list, 23.06.2012., http://www.jutarnji.hr/template/article/article-print.jsp?id=1036852 [accessed 04/07/12]
Blinder, a. S. (2006), “The Case against the Case against Discretionary Fiscal Policy“, in Kopcke et al. (ed.) (2006), The Macroeconomics of Fiscal Policy, MIT Press, Cam-bridge Massachusetts, Pp 25-61
Boyes, W and Melvin, M. (2012), Macroeconomics, South-Western, Cengage Lear-ning, Mason, (OH), uSa
Bujas, H., (2012), „u dvije godine možemo zaposliti 10.000 ljudi“, Danas.hr, 02.07.2012., http://danas.net.hr/novac/cisex-softver-it-10000-radnih-mjesta [accessed 04/07/12]
Dvorski, S., ruža, F., Kovšca, V. (2007), Poslovna ekonomija, TIVa – Tiskara Varaždin and Fakultet organizacije i informatike Varaždin, Varaždin, Croatia
Financijska stabilnost (2012), Hrvatska narodna banka, Broj 8, siječanj 2012. http://www.hnb.hr/publikac/financijska%20stabilnost/h-fs-8-2012.pdf [accessed 30/06/12]
Fox, J. (2009), The Myth of rational Market, Harper, New York
grigorian, D. a. and raei, F. (2010), „government Involvement in Corporate Debt restructuring: Case Studies from the great recession“, International Monetary Fund, November 2010
Industrijska proizvodnja u Hrvatskoj past će 5 do 8 posto (2012), Business HR, 29.06.2012 http://www.business.hr/ekonomija/industrijska-proizvodnja-u-hrvatskoj-past-ce-5-do-8-posto [accessed 29/06/12]
Jakovljević, I. (2012), Hrvatska u 2012. prvi put poslije 20 godina smanjuje vanjski dug, Novi list, 11.03.2012, http://www.novilist.hr/Vijesti/gospodarstvo/Hrvatska-u-2012.-prvi-put-poslije-20-godina-smanjuje-vanjski-dug [accessed 30/06/12]
31Jurčić, Lj. (2009), “Hrvatska kriza u globalnoj krizi”, Nacional, br. 697, 24.03.2009, http://www.nacional.hr/clanak/55317/hrvatska-kriza-u-globalnoj-krizi [accessed 29/06/12]
Kopits, g. and Symansky, S. (1998), “Fiscal Policy rules”, International Monetary Fund, Washington, Occasional Paper, No. 162
Korupcija u Hrvatskoj: Stvarna korupcijska iskustva građana (2011), united Nations Office on Drugs and Crime, http://www.unodc.org/documents/data-and-analysis/statistics/corruption/Croatia_corruption_report_2011_croatian.pdf [accessed 27/06/12]
Kriza zbog "švicaraca": ante Babić za Index otkriva kako država može spasiti građane (2011), http://www.index.hr/vijesti/clanak/kriza-zbog-quotsvicaracaquot-ante-babic-za-index-otkriva-kako-drzava-moze-spasiti-gradjane/564533.aspx, 02.08.2011. [accessed 27/06/12]
Küng, H. (1997), A Global Ethic for Global Politics and Economics, Oxford university Press Inc., New York
Obama for america (2012), http://www.barackobama.com/american-jobs-splash/ [accessed 29/06/12]
Piplica, D. (2012), role of Central Bank in Formulation and Implementation of Economic Politics of Eu Members Transition Countries, in: Filipovic, and goltnik urnaut (editors): Economic and Social Development: Book of abstracts of the 1st International Scientific Conference, Frankfurt am Main, germany, 12-13 april 2012, p.p. 226-243
Solomon, r. C. and Flores, F. (2001), Building Trust in Business, Politics, Relationships and Life, Oxford university Press Inc., New York
Trusted, J. (2002), Moral Principles and Social Values, Taylor and Francis e-Library, London
Wessels, W. J. (2006), Economics, Barron's Educational Series, New York
http://www.fina.hr/Default.aspx?art=10032 [accessed 27/06/12]
Financijska stabilnost (2012), Hrvatska narodna banka, Broj 8, siječanj 2012.
http://www.hnb.hr/publikac/financijska%20stabilnost/h-fs-8-2012.pdf [accessed 30/06/12]
EkonoMSkE IdEjE I PrakSa | Broj 6 | SEPtEMBar 2012.

KljuČne reČi:stabilizaciona politiKa, tejlorovo pravilo, nacionalni raČuni, efeKat boGatstva
znaČaj nacionalniH raČuna za monetarnu politiKu
ivana jovanović1
jel KlasifiKacija: e01, e37, e58
apstraKt:U radu je, polazeći od informacija koje koriste Narodna banka Srbije i Evropska central-na banka, ispitana teza Fritsa Bosa da sistem nacionalnih računa igra manju ulogu u stabilizacionim politikama, iz ugla monetarne politike kao njihovog važnog dela. Sistem zaista ima trenutno ograničenu ulogu u monetarnoj politici Srbije, međutim, prelaskom na izradu celovitog sistema nacionalnih računa, sistem će dobiti važnu ulogu, kao što je to slučaj i u analizi Evropske centralne banke. Teza holandskog autora se odbacuje, a ukazuje se i na način na koji će dodatni podaci u budućnosti doprineti analitičkoj osnovi monetarne politike u Srbiji.
1 Institucija/Afilijacija:Ekonomskifakultet,UniverzitetuBeogradu,studentdoktorskihstudija.
33EkonoMSkE IdEjE I PrakSa | Broj 6 | SEPtEMBar 2012.
ZNAČAJNACIONALNIHRAČUNAZAMONETARNUPOLITIKU34
Key Words:stabilisation policy, taylor rule, national accounts, WealtH effect
abstract: In this paper, the thesis of Frits Bos, that system of national accounts plays less im-portant role as a tool for macro-stabilization policies has been examined, from the perspective of monetary policy as one important part of them, on basis of information used by Central bank of Serbia and European Central bank. System does have a limited role in monetary policy of Serbia at the moment, but with transition to making complete system of national accounts, it will play important role, like in analysis of the European central bank. The thesis of Dutch author has been rejected, and also the way additional data will improve analytical base of monetary policy in Serbia has been analyzed.
Nacionalni računi su inicijalno nastali usled radoznalosti država da vrše poređenja sa drugim zemljama u pogledu ekonomske snage.2 Već prvi obračuni nacionalnog dohotka nesumnjivo su od početka korišćeni i u svrhu analize ekonomske politike. Nakon Velike depresije, pojavom Kejnzove teorije, označen je početak kako makroekonomske teorije tako i politike u modernom smislu a država postaje aktivan činilac privrednog života. Od tada je sistem nacionalnih računa intenzivnije razvijan sa zahtevom da sadrži, između ostalog, sve relevantne informacije koje su od značaja za analizu u vođenju ekonomske politike. Tokom razvoja moderne makroekonomske misli, u zavisnosti od vladajuće dok-trine, aktivna ekonomska politika je dobijala ili gubila na značaju kao i uloga nacionalnih računa kao instrumenta, to jest, informacione osnove ekonomske politike.
Kakva je danas uloga nacionalnih računa u domenu analize ekonomske politike? u kojim oblastima ekonomske politike je njihova uloga značajna? Ovo su važna pitanja, budući da je u Srbiji u toku proces dopune statističke produkcije, koja će u budućnosti obuhvatati celovit sistem nacionalnih računa, kada će biti moguće unaprediti pojedine oblasti eko-nomske politike upotrebom šire informacione osnove.
u Srbiji se trenutno ne izrađuje kompletan sistem nacionalnih računa kakav je predviđen međunarodnim smernicama (ESa3 1995, SNa4 2008). Ta situacija će se promeniti već 2012. godine, budući da je planom razvoja statističkog sistema Srbije predviđeno da se do tada započne sa izradom finansijskih računa po sektorima i makroekonomskim bilan-sima, odnosno dela sistema koji trenutno nedostaje.
Ekonomska politika u širem smislu obuhvata, pored stabilizacione politike, pod kojom se danas podrazumevaju monetarne politike centralnih banaka i fiskalna politika, politiku finansijske i makroekonomske stabilnosti, politiku održivog razvoja, strukturne politike, socijalnu, zdravstvenu i mnoge druge. Pojedini moduli ili satelitski računi sistema nacio-nalnih računa, igraju važnu ulogu za neke od ovih politika.
Sistem u užem smislu, koji obuhvata tekuće, finansijske račune kao i bilanse, sadrži veliki obim informacija, od čega se jedan relativno mali deo zapravo koristi u analizi ekonomske politike. Svaki element integrisanog sistema pak ima svoje mesto u nje-mu i čini važan deo celine. „... Integrisani sistemi su dizajnirani da opišu kompletne procese. Varijable tih sistema su definisane u skladu sa logikom specifičnog sistema. To mogu biti stavke koje su trenutno na društvenoj agendi, dok neke druge varijable mogu biti instrumenti politika, ali ukoliko se one obrišu iz te agende, one ne gube svoju funkciju u sistemu...“5
Za koje oblasti analize ekonomske politike je sistem nacionalnih računa u užem smislu relevantan? u literaturi se može naći stav6 da sistem igra relativno manju ulogu u stabiliza-cionoj politici. Cilj ovog rada je da se ispita ova teza holandskog autora Fritsa Bosa, odnosno
35
1. uvod
EkonoMSkE IdEjE I PrakSa | Broj 6 | SEPtEMBar 2012.
2 Tinbergen(1993),str.133 “EuropeanSystemofAccounts”4 “SystemofNationalAccounts”5 VanTuinen(2009),str.4546 Bos,F.(2006),str.279
odredi značaj koji sistem nacionalnih računa danas ima u monetarnoj politici kao važnoj komponenti stabilizacionih politika. analiziraće se u kojoj meri i na koji način se sistem u užem smislu koristi u monetarnoj politici, u Srbiji i od strane Evropske centralne banke. Cilj je odgovoriti na pitanje da li će dopunjen sistem nacionalnih računa u Srbiji obezbediti, i na koji način, dodatne mogućnosti u analizi za potrebe vođenja monetarne politike.
u radu je najpre, u drugom delu, definisan pojam stabilizacione politike i savremena monetarna politika, kao njen važan deo. Zatim, u trećem delu, dat je osvrt na neke spe-cifične informacije koje koristi Evropska centralna banka u svojoj analizi i definisana je u kratkim crtama suština i informaciona baza srednjoročne monetarne politike u Srbiji. u četvrtom delu je razmotreno na koji način će dodatne informacije, koje će postati ras-položive kompletiranjem statistike nacionalnih računa u Srbiji, moći biti upotrebljene u kontekstu analize monetarne politike. u zaključku, osvrnućemo se još jednom, između ostalog, na hipotezu holandskog autora Fritsa Bosa.
Kada se govori o makroekonomskoj stabilizaciji, danas se pod tim pojmom podrazu-mevaju mere ekonomske politike koje su usmerene na smanjenje stepena kratkoročnih fluktuacija7. Monetarna politika, kao važna komponenta stabilizacione politike, danas po-drazumeva primenu pravila kamatne stope i strategiju ciljanja inflacije, odnosno politike u čijoj osnovi leži neka varijanta Tejlorovog pravila.
u novijoj literaturi se govori o neoklasičnoj sintezi u makroekonomskoj teoriji, u kojoj teorija realnih poslovnih ciklusa objašnjava kretanje (potencijalnog) autputa, uzrokovanog šokovi-ma u tehnološkom progresu, pod pretpostavkom fleksibilnih nadnica i cena, dok novo-kejn-zijanska teorija objašnjava kratkoročne ciklične oscilacije oko tog nivoa, delovanjem šokova tražnje i ponude i kašnjenjem u prilagođavanju potencijalnom nivou autputa usled različitih vrsta rigidnosti (na primer kašnjenja u prilagođavanju nominalnih plata i cena) tako da dolazi do devijacije stvarnog dohotka i zaposlenosti od prirodnog, to jest, potencijalnog nivoa. Iz te sinteze se razvio stav o aktivnoj ulozi monetarne politike, koja treba da stabilizuje autput oko prirodnog nivoa, zbog nepoželjnosti privrednih fluktuacija8. Pravila kamatne stope ili Tejlorova pravila, koja se koriste od početka 90-ih godina u ciljanju inflacije, uzimaju u obzir
ZNAČAJNACIONALNIHRAČUNAZAMONETARNUPOLITIKU36
7 Mankiw(2003),str.250;“Usledkašnjenjazbogdugeimplementacijimerafiskalnepolitike,kratkoročnostabilizovanjeprivredetrebadabudezadatakmonetarnepolitike,dokbifiskalnapolitikatrebalodaseusredsredinadugoročneciljevevladepoputalokacijeresursaipreraspodeledohotka“,SorenseniWhitta-Jacobsen(2010),str.614.Naravno,uzemljamaEvropskeekonomskeimonetarneunije,fiskalnapolitikajejedinosredstvostabilizacijenacionalnihekonomija,kodpojaveasimetrič-nihšokova–kojipogađajuzemljeponaosobaneEMUucelini,kojejepreostalonakonprenošenjamonetarnesuverenostinaEvropskucentralnubanku,prelaskomnazajedničkuvalutu–evro.Ujedno„...Činjenicadajefiskalnapolitikabilapreprocikličnanegoanticikličnaumnogimzemljama,ukazujenatodaoporezivanjeijavnirashodislužeinekimdrugimciljevimakojiseneodnosenastabilizovanjeprivrede.Ovačinjenicaiobjašnjavazaštomnogiekonomistiizražavajuskeptičnostuvezikorišćenjafiskalnepolitikekaouspešnoginstrumentakontracikličnepolitike(imajućiuvidukakoparlamentarnipolitičkipro-cesifunkcionišu).Međutim,..uvremenimaozbiljnekrize,kadamonetarnapolitikamožebitiuhvaćenau“zamkulikvidnosti”,fiskalnapolitikamožeigrativažnuulogukaojedinidelotvorniinstrumentupravljanjatražnjom”,Idem,str.619
8 v.Vetlovetal.(2011),str.9
2. definisanje savremene monetarne politiKe, Kao vaŽne Komponente stabilizacioniH politiKa
stvarna (ili projektovana) odstupanja autputa od potencijalnog nivoa usled toga što ove osci-lacije mogu da ugroze stabilnost cena9.
Sorensen i Whitta-Jacobsen10 ističu da danas dominira stav, da su poslovni ciklusi odraz tržišnih nesavršenosti i da bi se društveno blagostanje moglo povećati, ukoliko bi fluktua-cije mogle biti ublažene11. Oni ističu da je nemoguće uočiti šokove koji trenutno pogađaju privredu, ali da se mogu utvrditi odstupanja autputa i inflacije od trenda i targetiranog nivoa („output and inflation gaps“). upravo ta odstupanja se uzimaju u obzir u okviru Tejlorovog12 pravila, čije različite varijante danas slede mnoge centralne banke sveta.
Jedna od varijanti Tejlorovog pravila, koja ima za cilj da utiče na budući, predviđeni nivo inflacije, obzirom na kašnjenje monetarne politike13, u principu može rešiti problem spo-ljašnjeg kašnjenja, budući da se utiče na stopu inflacije u budućem periodu koji odgovara pretpostavljenom trajanju spoljašnjeg kašnjenja14 („inflation forecast targeting“).
Tejlorovo pravilo podrazumeva da centralna banka (na primer Fed, američka centralna banka i mnoge druge važne centralne banke) određuje kamatnu stopu uzimajući u ob-zir, u određenoj proporciji, odstupanje koje ima stvarna stopa inflacije od projektovane stope inflacije sa jedne strane, i meru u kojoj stvarna stopa autputa odstupa od trenda tj. prirodne stope rasta dohotka. utvrđivanjem proporcije (ili koeficijenata) u kojoj će se uzeti u obzir odstupanje stope inflacije i stope autputa, centralna banka vrši izbor između manjeg ili većeg varijabiliteta stope inflacije i stope autputa budući da deluju ne samo šokovi na strani tražnje već i na strani ponude (kada deluje šok tražnje, kamatna stopa deluje na inflaciju i autput u istom smeru, jer tada i autput i inflacija odstupaju u istom smeru od prirodnog nivoa, međutim, kada deluje, na primer, negativan cenovni šok na strani ponude, autput pada i inflacija raste tako da promene kamatne stope potrebne za
37
9 v.Blanchard(2012),str.545-54710 SorensenandWhitta-Jacobsen(2010),55611 IdealnastabilizacionapolitikabitežiladastabilizujeautputokoPareto-efikasnognivoa,kojibipreovlađivaouperfektnokonkurentnojprivredibezporeskihdistorzija.Toznačidabiautputtrebalodafluktuirauskladusaprome-namauproduktivnosti,gdebioscilacijekojesurezultatdrugihšokovatrebalostabilizovati.Idem,str.584,585
12 DžonTejlorjepredstavnik„novih“kejnzijanaca.13 Odstupanje(gep)tekućegautputaodtrendaiinflacijeodprojektovanognivoautičenabudućuinflacijuizbogtogaobaodstupanjaulazeujednačinuodređivanjakamatnestopecentralnebankedabiseosiguralaprojektovanastopainflacijeubudućemperiodu(naprimeruperiodut+4).Koeficijentitekućegodstupanjaautputaiinflacijezaviseodtoganakojinačinoniutičunabudućustopuinflacije.Idem,str.606;
14 Spoljašnjekašnjenje(„outsidelag“)jevremeizmeđupolitičkeakcijeinjenoguticajanaprivredu.15 Mankiw(2010),str.416
EkonoMSkE IdEjE I PrakSa | Broj 6 | SEPtEMBar 2012.
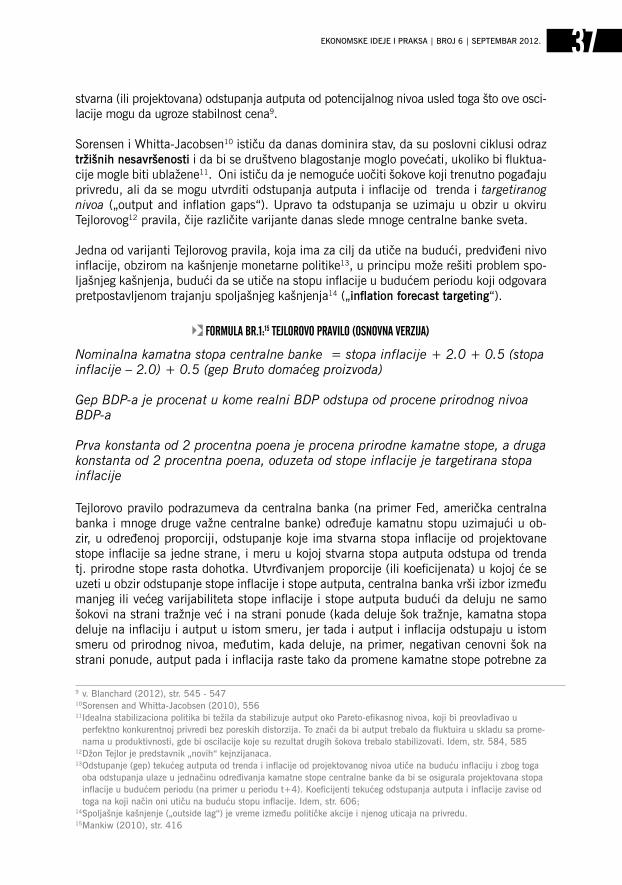
formula br.1:15 tejlorovo pravilo (osnovna verzija)
Nominalna kamatna stopa centralne banke = stopa inflacije + 2.0 + 0.5 (stopa inflacije – 2.0) + 0.5 (gep Bruto domaćeg proizvoda)
Gep BDP-a je procenat u kome realni BDP odstupa od procene prirodnog nivoa BDP-a
Prva konstanta od 2 procentna poena je procena prirodne kamatne stope, a druga konstanta od 2 procentna poena, oduzeta od stope inflacije je targetirana stopa inflacije
stabilizovanje inflacije autput još više udaljavaju od prirodnog nivoa; u kojoj meri će se tada vršiti stabilizacija autputa, a u kojoj meri stabilizacija inflacije zavisiće od izbora koeficijenata)16. Izborom ovih pondera, centralna banka utiče na nagib (dinamičke) krive agregatne tražnje, odnosno meru u kojoj će promenom stope inflacije reagovati agregatna tražnja (pod uticajem variranja kamatne stope centralne banke kao odgovora na promenu stope inflacije).17 Primenom Tejlorovog pravila, centralne banke ne reaguju na šokove tražnje ili ponude (a to bi bilo i nemoguće, budući da se oni registruju ex post) već utiču na nagib krive agregatne tražnje i time na način na koji će šokovi delovati na inflaciju i zaposlenost.
Narodna banka Srbije (NBS) od 2009. godine primenjuje režim ciljane (targetirane) in-flacije, kao okvir za postizanje stabilnosti cena u srednjoročnom periodu18. Još 2006. godine je NBS usvojila nove mere i principe za održavanje stope inflacije u okvirima projektovanog koridora, a referentna kamatna stopa je osnovni instrument monetarne politike (koji se primenjuje u repo operacijama, operacijama monetarne politike). Od 2007. godine NBS određuje referentnu kamatnu stopu u bliskoj budućnosti, koja je konzistentna sa projektovanom inflacijom. Funkcija reakcije monetarne politike NBS ne sadrži eksplicitno proizvodni jaz. Međutim, imajući u vidu da proizvodni jaz ulazi u jed-načinu modela19 za srednjoročnu projekciju inflacije (od čijeg nivoa odnosno odstupanja od ciljane vrednosti zavisi trenutna referentna kamatna stopa ), kao i da njegova veličina zavisi od projektovane putanje referentne kamatne stope, on na indirektan način utiče na donošenje odluke NBS o kamatnoj stopi i stoga NBS, održavajući inflaciju u željenim okvirima na srednji rok, doprinosi i stabilizaciji autputa.
Jednačina reakcije monetarne politike glasi:
u zavisnosti od putanje referentne kamatne stope za koju se NBS odluči, projektuje se proizvodni jaz čija visina ulazi u jednačinu prognozirane bazne inflacije. Tako se dolazi do , odnosno veličine prognozirane inflacije. Odluka o visini referentne stope donosi se u zavisnosti od veličine odstupanja prognozirane inflacije od ciljane vrednosti, četiri tromesečja unapred. ukoliko je prognozirana stopa inflacije iznad ciljane vrednosti, po-trebno je da tekuća referentna stopa bude iznad neutralne stope , i obrnuto.
Stav NBS je da “na cenovne šokove na strani ponude, poput naftnog i poljoprivrednog šoka, ili povećanja PDV-a, monetarna politika ne treba da reaguje. Ti šokovi su, po svojoj prirodi, privremenog karaktera i nije moguće sprečiti rast cena proizvoda i usluga koji su direktno njima pogođeni.”20 Odsustvom restriktivnog odgovora monetarne politike na takvo povećanje cena, izbegava se veći pad autputa. Direktno uključivanje proizvodnog jaza u reakciju monetarne politike bilo bi potrebno kada bi centralna banka želela da re-aguje na ove šokove na strani ponude, vršeći izbor između rasta cena i pada proizvodnje. Budući da se monetarnom politikom delovanje ovih cenovnih šokova na strani ponude u
ZNAČAJNACIONALNIHRAČUNAZAMONETARNUPOLITIKU38
16 Mankiw(2010),str.434;SorensenandWhitta-Jacobsen(2010),str.603,638, Mankiw(2003),str.253
17Mankiw(2010),str43318NarodnabankaSrbije(2008),str.119 v.Ðukićetal.(2011)20 NBS(2012),str.16
potpunosti dopušta, time se implicitno veći ponder daje autputu u primeni jednog oblika Tejlorovog pravila koje leži u osnovi politike Narodne banke Srbije21.
Polazeći od definicije stabilizacione politike u prethodnom delu, i monetarne politike kao njenog važnog dela, osvrnućemo se u nastavku na informacionu osnovu monetarne politike kako bi sagledali ulogu nacionalnih računa i mogli prihvatiti ili odbaciti tezu holandskog autora o ulozi sistema nacionalnih računa u stabilizacionoj politici danas, u delu monetarne politike.
Istraživanja pokazuju da je monetarna politika većine najvažnijih centralnih banaka u skladu sa nekom formom Tejlorovog pravila, mada se centralne banke nikad ne pridrža-vaju fiksnog pravila. Centralne banke, kao na primer, najveća centralna banka u Evropi, Evropska centralna banka, se u svom radu ne pridržavaju ni jednostavnih pravila, koja ne mogu da obuhvate sve važne informacije, a ni komplikovanih modela u striktnom smislu, budući da je za njih vezan veliki stepen neizvesnosti, već se tu pre radi o pridržavanja proceduralnog okvira i strategije u odlučivanju, u kome se veliki značaj daje interpretaciji ekonomskih dešavanja, prirodi i poreklu šokova koji utiču na ciljeve centralne banke i u krajnjoj liniji “ekonomskoj priči” koja je u osnovi monetarnog odlučivanja22.
Evropska centralna banka zasniva svoju monetarnu politiku, koja za osnovni cilj ima stabilnost cena, na dva “noseća stuba” (“two pillars”). Jedan se zasniva na važnoj ulozi koja se pridaje novcu a drugi na analizi odnosa ponude i tražnje i troškovnim pritiscima. u ovom drugom delu strategije veoma važnu ulogu igraju makroekonomske projekcije, ali budući da modeli ne mogu obuhvatiti sve relevantne informacije, odlučivanje se zasniva na širokom skupu analiza, informacija i projekcija: vrši se monitoring indikatora u real-nom vremenu, analiza sektora i strukturne analize i koriste mali ekonometrijski modeli koji rasvetljavaju neke posebne oblasti, a sve sa ciljem da se procene pretnje po cenovnu stabilnost na srednji rok. relevantne informacije koje se koriste prevazilaze opseg koji se inače koristi u primeni jednostavnog monetarnog targetiranja ili Tejlorovih pravila. Na primer, finansijske varijable poput stope prinosa na obveznice, cene aktiva (uključujući i devizni kurs), tokovi kreditiranja i pozicije bilansa stanja, obezbeđuju dodatne informacije od koristi u vođenju monetarne politike. Vidimo dakle da nacionalni računi, koji obezbe-đuju informacije o bilansnim pozicijama sektora, igraju važnu ulogu u vođenju monetarne politike evropske centralne banke.
Kao potpora u odlučivanju o visini referentne kamatne stope koja je konzistentna sa ostvarenjem ciljane inflacije, u Narodnoj banci Srbije je razvijen tromesečni model za srednjoročne projekcije. Proces srednjoročne projekcije ne čini samo prosta upotreba
39
21 Iakomonetarnapolitikanereagujenapomenutecenovnešokove,onasvakakouzimauobzirnjihovodejstvonainflacionaočekivanjauformulisanjureferentnekamatnestope.v.Idem,str.16
22 ECBMonthlyBulletin(2001),str.48
EkonoMSkE IdEjE I PrakSa | Broj 6 | SEPtEMBar 2012.
3. podaci nacionalniH raČuna u analizi monetarne politiKe
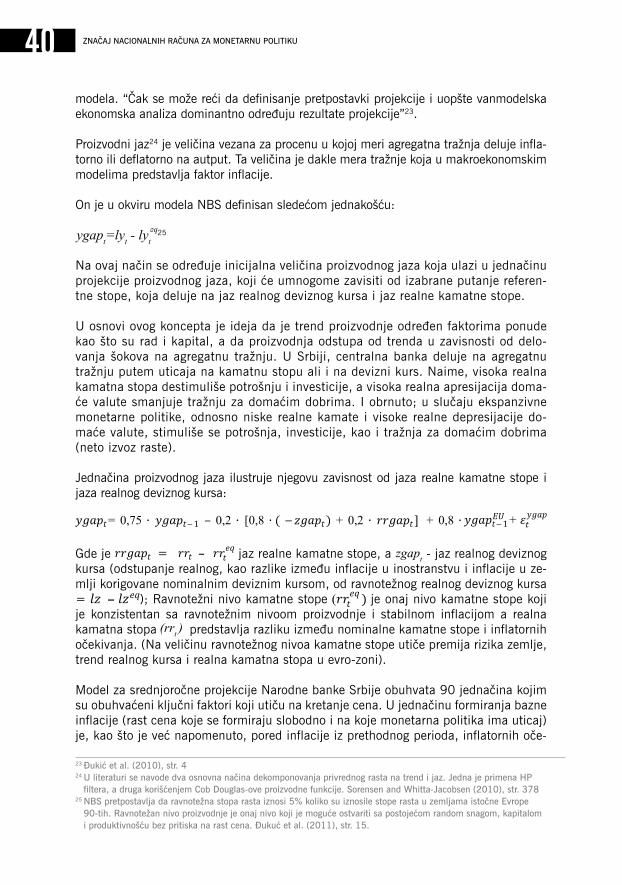
modela. “Čak se može reći da definisanje pretpostavki projekcije i uopšte vanmodelska ekonomska analiza dominantno određuju rezultate projekcije”23.
Proizvodni jaz24 je veličina vezana za procenu u kojoj meri agregatna tražnja deluje infla-torno ili deflatorno na autput. Ta veličina je dakle mera tražnje koja u makroekonomskim modelima predstavlja faktor inflacije.
On je u okviru modela NBS definisan sledećom jednakošću:
25
Na ovaj način se određuje inicijalna veličina proizvodnog jaza koja ulazi u jednačinu projekcije proizvodnog jaza, koji će umnogome zavisiti od izabrane putanje referen-tne stope, koja deluje na jaz realnog deviznog kursa i jaz realne kamatne stope.
u osnovi ovog koncepta je ideja da je trend proizvodnje određen faktorima ponude kao što su rad i kapital, a da proizvodnja odstupa od trenda u zavisnosti od delo-vanja šokova na agregatnu tražnju. u Srbiji, centralna banka deluje na agregatnu tražnju putem uticaja na kamatnu stopu ali i na devizni kurs. Naime, visoka realna kamatna stopa destimuliše potrošnju i investicije, a visoka realna apresijacija doma-će valute smanjuje tražnju za domaćim dobrima. I obrnuto; u slučaju ekspanzivne monetarne politike, odnosno niske realne kamate i visoke realne depresijacije do-maće valute, stimuliše se potrošnja, investicije, kao i tražnja za domaćim dobrima (neto izvoz raste).
Jednačina proizvodnog jaza ilustruje njegovu zavisnost od jaza realne kamatne stope i jaza realnog deviznog kursa:
gde je jaz realne kamatne stope, a - jaz realnog deviznog kursa (odstupanje realnog, kao razlike između inflacije u inostranstvu i inflacije u ze-mlji korigovane nominalnim deviznim kursom, od ravnotežnog realnog deviznog kursa = ); ravnotežni nivo kamatne stope je onaj nivo kamatne stope koji je konzistentan sa ravnotežnim nivoom proizvodnje i stabilnom inflacijom a realna kamatna stopa predstavlja razliku između nominalne kamatne stope i inflatornih očekivanja. (Na veličinu ravnotežnog nivoa kamatne stope utiče premija rizika zemlje, trend realnog kursa i realna kamatna stopa u evro-zoni).
Model za srednjoročne projekcije Narodne banke Srbije obuhvata 90 jednačina kojim su obuhvaćeni ključni faktori koji utiču na kretanje cena. u jednačinu formiranja bazne inflacije (rast cena koje se formiraju slobodno i na koje monetarna politika ima uticaj) je, kao što je već napomenuto, pored inflacije iz prethodnog perioda, inflatornih oče-
ZNAČAJNACIONALNIHRAČUNAZAMONETARNUPOLITIKU40
23 Ðukićetal.(2010),str.424 Uliteraturisenavodedvaosnovnanačinadekomponovanjaprivrednograstanatrendijaz.JednajeprimenaHPfiltera,adrugakorišćenjemCobDouglas-oveproizvodnefunkcije.SorensenandWhitta-Jacobsen(2010),str.378
25 NBSpretpostavljadaravnotežnastoparastaiznosi5%kolikosuiznosilestoperastauzemljamaistočneEvrope90-tih.Ravnotežannivoproizvodnjejeonajnivokojijemogućeostvaritisapostojećomrandomsnagom,kapitalomiproduktivnošćubezpritiskanarastcena.Ðukućetal.(2011),str.15.
kivanja, troškovnog pritiska cena proizvoda uključenih u nebaznu inflaciju (cene po-ljoprivrednih proizvoda), promene uvoznih cena, promene trenda realnog kursa i jaza realnog deviznog kursa, uključen i proizvodni jaz iz prethodnog perioda26 (tromesečja).
Iz sheme br. 127, može se zaključiti da model uglavnom koristi cenovne podatke, veza-ne za proizvode kao i podatke o deviznom kursu i kamatnoj stopi. Od kursa monetarne politike odnosno projektovane putanje referentne stope zavisiće, međutim, umnogome devizni kurs i tržišna kamatna stopa. u projekciji jaza realne kamatne stope i realnog deviznog kursa, koji ulaze u jednačinu proizvodnog jaza, pa samim tim određuju njegovu veličinu, potrebne su i razne druge informacije koje se tiču ukupne makroe-konomske situacije u zemlji, koje predstavljaju agregate sistema nacionalnih računa. Tako su informacije o saldu roba u usluga, stranim direktnim investicijama (veličina iz platnog bilansa, takođe, mada ne eksplicitan, deo nacionalnih računa), očekivanom privrednom rastu, projekcijama vezanim za izvoz dobara i usluga, (kao i informacije o zaradama i tržištu rada28 i deviznim doznakama), uključene u model putem satelitskih modela, pa se može zaključiti da je jedan ograničen broj veličina nacionalnih računa u sprezi sa srednjoročnom monetarnom politikom29, trenutno, u srbiji. Pri tome se više radi o projekcijama nego o istorijskim podacima zvanične statistike, koji su polazna osnova tih projekcija. Istorijski podaci nacionalnih računa se koriste i kod projekcije proizvodnog jaza, gde je potrebna inicijalna veličina jaza koja ulazi u model, a ona se bazira na razlaganju opažene (istorijskih podataka) veličine privrednog rasta (kao i njegove kratkoročne projekcije za jedan ili dva tromesečja unapred, bazirane na ek-spertskoj proceni i informacijama iz privrede) na trend i jaz.
Privredni rast se u Narodnoj banci Srbije procenjuje na bazi projekcije rashodne strane BDP-a, i tako dobijeni rast BDP-a se upoređuje sa veličinom dobijenom putem pro-jekcije proizvodnog jaza. Model koji je trenutno u izradi će biti model opšte privredne ravnoteže i tada će i veličine rashodne strane BDP-a (lična i investiciona potrošnja stanovništva i države i neto izvoz) biti eksplicitno uključene u model, što znači da će veći broj veličina nacionalnih računa biti direktnije uključeno u vođenju srednjoročne stabilizacione politike u Srbiji. Trenutno su podaci zvanične statistike o rashodnoj stra-ni BDP-a dostupni sa kašnjenjem od dve godine, što umnogome umanjuje njenu ulogu u mogućnostima vođenja tekuće politike.
Teza Fritsa Bosa, u delu monetarne politike, se može prihvatiti iz ugla trenutne uloge koju sistem nacionalnih računa ima u Srbiji, međutim, polazeći od analize Evropske centralne banke, zaključujemo da sistem danas igra važnu ulogu u analizi monetarne politike i da ovu tezu moramo odbaciti.
41
26 Svepomenuteveličineuključenesuujednačinuprojekcijeinflacijesapozitivnimpredznakom.Koeficijentuzproi-zvodnijaziznosi0,3štojeprocenjenavrednostnjegovoguticajanainflacijusadocnjomodjednogperioda.v.Idem
27 Shemabr.1jepreuzetaizÐukićetal.(2011),str.1128 Vezanozaocenudodatnihinflacionihpritisaka29 Poredtogauupotrebisuinekespecifičneveličinepoputstopeobaveznerezervenadevizneizvorekojautičenanivokamatnestopenakrediteindeksiraneuevrima,zatimiznosštednje,podaciizmonetarnihbilansaitd.
EkonoMSkE IdEjE I PrakSa | Broj 6 | SEPtEMBar 2012.

Prelaskom na sastavljanje finansijskih računa i bilansa po institucionalnim sektorima, u Srbiji će sistem nacionalnih računa u izradi biti u potpunosti u skladu sa međuna-rodnim smernicama. Bankarska i monetarna statistika su bile dostupne u prethod-nom periodu, međutim, sa razvojem finansijskog tržišta, dostignut je stepen razvoja finansijskog sistema u kome bankarski sektor više nije jedini relevantan sektor za sagledavanje finansijskih transakcija. Statistikom finansijskih računa i bilansa po in-stitucionalnim sektorima biće obuhvaćene i transakcije hartijama od vrednosti koje se vrše posredstvom finansijskog tržišta u kojima se kao emitenti pojavljuju preduzeća i sektor države, a kao kupci različiti sektori, između ostalog i sektor domaćinstava. Time će tokovi finansijskih transakcija biti u potpunosti obuhvaćeni.
Jedan od osnovnih ciljeva uvođenja obaveze sastavljanja bilansa, kada su smernice ESa (European System of accounts) revidirane 1993. godine, bio je da se unapre-de mogućnosti predviđanja ponašanja sektora domaćinstava. Naime, potrošnja, kao
ZNAČAJNACIONALNIHRAČUNAZAMONETARNUPOLITIKU42sHema 1. struKtura modela za srednjoroČne projeKcije nbs
4. unapreÐenje analitiČKiH moGućnosti monetarne politiKe dopunom izrade nacionalniH raČuna u srbiji
43važan input predviđanja bruto društvenog proizvoda, zavisi kako od raspoloživog do-hotka tako i od kretanja vrednosti bogatstva kojom raspolaže sektor stanovništva. Na kretanje bogatstva koje čine hartije od vrednosti, štednja i nekretnine, umanjene za iznos kredita, odnosno finansijskih obaveza, utiču kako kupo-prodajne transakcije tako i ostale promene koje su rezultat kretanja tržišnih cena nefinansijske i finansijske aktive. Sve ove promene obuhvaćene su finansijskim računom, dok se rezultirajuća stanja obuhvataju bilansima.
Otuda je jasno, da će obuhvatom finansijskih računa i bilansa po sektorima moći biti poboljšane mogućnosti ocene sveopštih prilika od važnosti za stabilnost cena u srednjem roku, procenom budućih pritisaka agregatne tražnje, na bazi sagledavanja trenutne i projekcijom buduće bilansne pozicije sektora domaćinstava od značaja za prognoziranje potrošnje ovog sektora30.
Nacionalni računi su već od samog nastanka igrali važnu ulogu u analizi za potrebe ekonomske politike i dizajnirani su sa ciljem da sadrže sve relevantne informacije za potrebe njene analize. u Srbiji će se 2012. godine početi sa izradom dela sistema nacionalnih računa koji trenutno nedostaje, čime će njihova izrada u Srbiji biti u pot-punosti u skladu sa međunarodnim smernicama, iako ne sasvim u pogledu (kvartalne) dinamike izrade koja je zastupljena u zemljama Evropske i monetarne unije.
Savremena monetarna politika zasniva se na ciljanju inflacije i primeni pravila ka-matne stope. Kao i najvažnije centralne banke i NBS primenjuje u svojoj politici neki oblik Tejlorovog pravila. u informacionoj osnovi srednjoročne projekcije inflacije NBS, trenutno, u ograničenoj meri koristi podatke nacionalnih računa.
Obzirom da celovit sistem danas igra važnu ulogu u analizi monetarne politike, kao što se može videti na primeru Evropske centralne banke, dopunom podataka u Srbiji ostvariće se napredak u obezbeđenju informacione osnove analize monetarne politike.
Teza Fritsa Bosa, da sistem nacioanlnih računa igra manju ulogu u stabilizacionoj poli-tici, danas se ne može prihvatiti, u delu monetarne politike, budući da pozicije bilansa stanja sektora, posebno domaćinstava, kao važan deo sistema, igraju značajnu ulogu u proceni opštih izgleda vezanih za cenovnu stabilnost, obzirom da na potrošnju deluje efekat bogatstva. Moguće je da je ovaj autor imao u vidu monetarnu politiku koja je u ranijem periodu koristila targetiranje novčane mase i da su podaci nacionalnih računa tada korišćeni u manjoj meri.
Dopunom izrade nacionalnih računa u Srbiji, makroekonomski bilansi sektora će po-stati dostupni. Time će biti moguće ostvariti napredak u prognoziranju ponašanja
30 Finansijskiračunićeseizrađivatikvartalno,abilansikaoiračunostalihpromenafondovagodišnje,štoznačidadinamikaizrade,kojajeuzemljamačlanicamaEvropskeimonetarneunijekvartalna,upočetkuuSrbijinećebitiostvarena,panimogućnostianalizenakvartalnomnivou.
EkonoMSkE IdEjE I PrakSa | Broj 6 | SEPtEMBar 2012.
5. zaKljuČaK
sektora domaćinstava, nosioca potrošnje kao važnog ekonomskog toka, koji je izvor rasta bruto domaćeg proizvoda kao i izvor mogućih inflacionih ili deflacionih pritisaka tražnje.
6. literatura
ZNAČAJNACIONALNIHRAČUNAZAMONETARNUPOLITIKU44
Blanšar, O. (2012), Makroekonomija, univerzitet u Beogradu, Ekonomski fakultet, Beograd (original, Pearson Prentice Hall, New Jersey)
Bos, F. (2006), “The National accounts as a Tool for analysis and Policy; Past, Pre-sent and Future”, MPra Paper No. 1235, http://mpra.ub.uni-muenchen.de/1235/
Ðukić, M. et al. (2010), “Model za srednjoročne projekcije Narodne banke Srbije”, Narodna banka Srbije, Beograd, Stručni radovi, br. 17, decembar 2010
European Central Bank, Frankfurt (2001) „Issues related to monetary policy rules“, Monthly Bulletin, October 2001, pp 37-50
Mankiw, N. g. (2003), Macroeconomics, Worth Publishers, New York
Mankiw N. g. (2010), Macroeconomics, Worth Publishers, New York
Narodna banka Srbije (2008), „Memorandum Narodne banke Srbije o ciljanju (targetiranju) inflacije kao monetarnoj strategiji“, www.nbs.rs/export/sites/default/internet/latinica/30/memorandum_monetarna_strategija_122008.pdf
Narodna Banka Srbije (2012), Izveštaj o inflaciji, maj, avgust
Sorensen, P.B. i Whitta-Jacobsen, H.J (2010), Introducing Advanced Macroeconomics, Mcgraw-Hill, Berkshire
Tinbergen, J. (1993) “Origin of National accounts and relation to Economic Theory”, in de Vries W.F.M. et al. (ed.) (1993), The Value Added of National Accounting, Netherlands Central Bureau of Statistics, Voorburg, pp 13-17
Van Tuinen, H. (2009), “Innovative Statistics to Improve Our Notion of reality”, Journal of Official Statistics, Vol. 25, No. 4, pp. 431-465
Vetlov et al. (2011) “Potential Output in DSgE Models”, European Central bank, Frankfurt, Working Paper Series No 1351, June 2011
corporate sustainability and responsibility as a source of competitive advantaGe – case of van Houtum company
jel KlasifiKacija: : l26, m10, m14, Q53, Q55
abstract:The objective of this paper is to discuss the concept of Corporate Sustainability and Responsibility (CS&R) as a source of building competitive advantage in companies. Companies continually face new market challenges and try to find new ways to grow and improve their performance. Higher awareness of the environmental and social con-sequences of its operations and activities is one of the ways in which a company may seek sustainable growth amid severe competition. These opportunities are discussed using the single case study method looking at the example of a medium-sized Dutch company – Van Houtum, based in Swalmen in South-Eastern Netherlands making ti-ssue paper. We will present the elements of CS&R that Van Houtum introduced during different periods of the company’s recent history. Triggers driving Van Houtum to em-brace and integrate CS&R into its business strategy will be discussed and their impor-tance evaluated. Further, CS&R related performance drivers that can affect outcomes, will be analysed and it will be shown that in the case of Van Houtum excellence in operations and performances was achieved by following the main elements of CS&R. Lastly, we will show how this has provided Van Houtum with new growth opportunities.
1 VisitingFellowatCranfieldUniversity’sDoughtyCentre;President,Jacaranda,aCSRConsultancy2 SeniorLectureratRotterdamUniversityofAppliedSciences,RotterdamBusinessSchool3 AssociateProfessoratRotterdamUniversityofAppliedSciences,RotterdamBusinessSchool
45EkonoMSkE IdEjE I PrakSa | Broj 6 | SEPtEMBar 2012.
ronald ainsbury1
biljana pešalj2
saulius buivys3
Key Words:corporate sustainability and responsibility, case study, performance drivers, business excellence.


Complex business environments and severe industry competition require new business and management models that could provide survival and growth of companies. One of the models that attracted large deal of attention is the concept of corporate social res-ponsibility (CSr). This concept is not new. It has been largely exploited in practice and in the scientific literature. This concept has been modified to a certain extent and nowadays we speak of corporate sustainability and responsibility (CS&r). Companies are motivated to introduce CS&r since there is a pressure coming from consumers, government and society to run a business that is viable in the long run. However, some companies have recognized this as a business opportunity and used CS&r model as a source of radical changes in the business philosophy, vision, leadership and organizational culture.
The main objective of this paper is to present a case of a company that used CS&r concept to drive changes, innovation and excellence in the company. This approach has provided high financial performances and company’s growth. The structure of the paper is as follows. In the following section the external motivation to implement CS&r is discussed. Second section explains the concept of CS&r, its definition and elements. The third section is focused on the case company – Van Houtum, medium-sized Dutch company, based in Swalmen in South-Eastern Netherlands, making tissue paper. On the example of this company elements of CS&r are discussed, as they have been introduced during time. The paper analyses the motives of the company to embrace and integrate these elements into its business and strategy. Further, we will try to relate implementation of CS&r with company’s performances. Fourth section groups and discusses elements of CS&r recognized in the Van Houtom case, using one of the most influential definitions of the concept. Main points discussed in the paper will be summarized in the conclusion of the paper. Main goal of the paper is to discuss the case of successful implementation of CS&r and in this way to provide the sharing of the best practice.
Huge changes have taken place in the business environment and in business practice in the last several decades, which have altered the basic prerequisites for achieving competitive advantage. The development of information and communication tech-nologies and other elements of the “new economy” have introduced new challenges for successful business. New challenges offer new opportunities, but also put new requirements in regard to opportunities for growth, business management and strategy implementation. In these new business conditions the company's competitive advan-tage depends on its ability to develop and effectively use intangible assets, to adapt quickly to a constantly changing business environment, and to adequately respond to the increasingly sophisticated needs and requirements of consumers. Nowadays, consumers’ choice is considerably affected by their awareness of numerous issues
47
1. introduction
EkonoMSkE IdEjE I PrakSa | Broj 6 | SEPtEMBar 2012.
2. cHallenGinG business environment – opportunities for GroWtH
related to the protection of the environment, scarcity and limitation of resources, loss of biodiversity, energy efficiency, etc. Therefore, one of the main challenges of doing business in the last decades is to provide sustainability.
Social and environmental influence of business activities is a growing area of interest in general public, practice and research. There is emerging concern of managers to observe and measure these aspects, for two reasons. First, stakeholders require the business to pay more attention to social and environmental effects of the business. In this way companies recognize that their financial results depend on these non-financial aspects. Second, there is a pressure from the government through a growing number of regula-tions to improve social and environmental responsibility of companies (e.g. the Carbon reduction Commitment Energy Efficiency Scheme in the uK). The growing interest to secure sustainable business (that would be socially and environmentally responsible) requires deep changes in the way the business is run, and requires the development of new business models.
Integrating sustainability into the business obviously entails additional costs for the bu-siness. It also requires a clear vision, an innovative approach, strong leadership and strong organizational culture. Therefore could it be recognized and used as a source of business’s growth opportunities and financial success? We are interested to investigate this question using a case study.
In the 19th Century several entrepreneurs invested in the wellbeing of their employees. robert Owen built a model village for his employees at South Lanark (circa 1816) as did Titus Salt at Saltaire (1851), the Cadbury brothers at Bourneville (1893), and the Lever Brothers at Port Sunlight (1899). The standard of housing they provided in each case was superior to the then standard workers’ quarters and incorporated other amenities such as parks and recreation areas. robert Owen built an infant’s school for the children of his workers at the Lanark Mill, for example, Port Sunlight had a swimming pool, a hospital, and a concert hall, and Bourneville boasted extensive sporting facilities.
Moreover, many early industrialists were renowned for sharing the wealth created by their endeavours; supporting the arts, recreation, sport, research, and the needy through charitable foundations and trusts. Familiar names include the Medicis, rockefeller, getty, Mellon, and Sainsbury, and more recently gates and Buffett. Often the line between the enterprise per se and the entrepreneur who owned it as an individual were blurred, so it became hard to distinguish between corporate philanthropy and individual philanthropy.
With the rise of the number of limited companies through the second half of the 19th Cen-tury and the 20th Century there has been a corresponding interest by researchers focu-
CORPORATESUSTAINABILITYANDRESPONSIBILITYASASOURCEOFCOMPETITIVEADVANTAGE–CASEOFVANHOUTUMCOMPANY48
3. corporate sustainability and responsibility – concept and elements
sing on the role of the executive and the subject of management. Cranfield university’s Doughty Centre for Corporate responsibility has published a useful “CSr Timeline”.4
academic interest in the subject appears to date to a work by Chester Barnard’s publis-hed in 1938.5 Many writers have sought to define the role of the executive and to include a social element. For example, in 1942 Peter Drucker set out a social side to business.6 In 1953, Howard Bowen, published “Social responsibilities of the Businessman” and coined the phrase ‘corporate social responsibility'7.
Many others, most notably, Milton Friedman, espoused a completely different view, one that is still the bedrock of many CEOs, Boards, and the basis of many MBa curricula: “I shall mostly neglect the individual proprietors and speak of corporate executives. In a free-enter-prise, private-property system, a corporate executive is an employee of the owners of the business. He has direct responsibility to his employers. That responsibility is to conduct the business in accordance with their desires, which generally will be to make as much money as possible while conforming to the basic rules of the society, both those embodied in law and those embodied in ethical custom.”8 an owner-entrepreneur could do what he liked with is profits – but the only responsible path for a corporate executive, a paid employee of the company, was to return to the shareholders as high a profit as possible – and if the sharehol-ders wanted to make contributions to society – then they could do so with their dividends.
Over time, the concept of Corporate Social responsibility (CSr) continued to be interpre-ted in different ways by various authors. Bert Spector indicates that roots of contemporary concept of CSr could be traced to the comments of Donald K. David, Dean of Harvard Business School, who was calling business executives to take heed of the responsibilities that had come to rest on the shoulders of business leaders (Spector, 2008).
Various terms and phrase have since been used, such as Triple Bottom Line (People, Pla-net, Profit) first articulated by John Elkington in 1997.9 In its guide to uK executives, the uK’s Business in the Community defines a responsible Business as one that integrates responsible practices into their day-to-day operations: 1. Demonstrating clear leadership, governance, and values and integrating responsi-
ble business practices across all business operations; 2. Developing products and services with improved social and environmental impacts
and positively influencing customers’ behaviour; 3. Developing employees and the future workforce to build successful working lives; 4. Investing in the communities in which the business operates and those communi-
ties in greatest need; 5. Managing social, environmental, and economic impacts in the supply chain; 6. Taking action to reduce climate change and preparing for a low carbon economy; 7. Working with others in collaboration to create change that benefits both business
and society.
49EkonoMSkE IdEjE I PrakSa | Broj 6 | SEPtEMBar 2012.
4 Availableunder“Resources”athttp://www.som.cranfield.ac.uk/som/p14340/Research/Research-Centres/Doughty-Centre-Home
5 Barnard,C.I.(1938),Thefunctionsoftheexecutive,Cambridge,MA:HarvardUniversityPress.Republished19686 DruckerF.P.(1942),TheFutureofIndustrialMan,JohnDay7 BowenR.H.(1953),Socialresponsibilitiesofthebusinessman,HarperNewYork8 FriedmanM.(1970),TheNewYorkTimesMagazine,September139 ElkingtonJ.(1997),CannibalswithForks:theTripleBottomLineof21stCenturyBusiness, Capstone
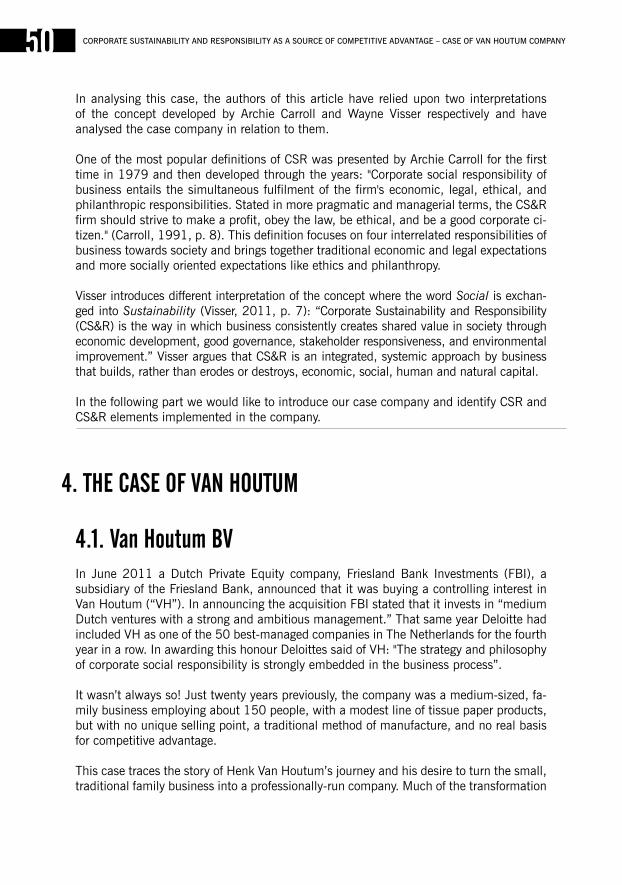
In analysing this case, the authors of this article have relied upon two interpretations of the concept developed by archie Carroll and Wayne Visser respectively and have analysed the case company in relation to them.
One of the most popular definitions of CSr was presented by archie Carroll for the first time in 1979 and then developed through the years: "Corporate social responsibility of business entails the simultaneous fulfilment of the firm's economic, legal, ethical, and philanthropic responsibilities. Stated in more pragmatic and managerial terms, the CS&r firm should strive to make a profit, obey the law, be ethical, and be a good corporate ci-tizen." (Carroll, 1991, p. 8). This definition focuses on four interrelated responsibilities of business towards society and brings together traditional economic and legal expectations and more socially oriented expectations like ethics and philanthropy.
Visser introduces different interpretation of the concept where the word Social is exchan-ged into Sustainability (Visser, 2011, p. 7): “Corporate Sustainability and responsibility (CS&r) is the way in which business consistently creates shared value in society through economic development, good governance, stakeholder responsiveness, and environmental improvement.” Visser argues that CS&r is an integrated, systemic approach by business that builds, rather than erodes or destroys, economic, social, human and natural capital.
In the following part we would like to introduce our case company and identify CSr and CS&r elements implemented in the company.
4.1. van Houtum bvIn June 2011 a Dutch Private Equity company, Friesland Bank Investments (FBI), a subsidiary of the Friesland Bank, announced that it was buying a controlling interest in Van Houtum (“VH”). In announcing the acquisition FBI stated that it invests in “medium Dutch ventures with a strong and ambitious management.” That same year Deloitte had included VH as one of the 50 best-managed companies in The Netherlands for the fourth year in a row. In awarding this honour Deloittes said of VH: "The strategy and philosophy of corporate social responsibility is strongly embedded in the business process”.
It wasn’t always so! Just twenty years previously, the company was a medium-sized, fa-mily business employing about 150 people, with a modest line of tissue paper products, but with no unique selling point, a traditional method of manufacture, and no real basis for competitive advantage.
This case traces the story of Henk Van Houtum’s journey and his desire to turn the small, traditional family business into a professionally-run company. Much of the transformation
CORPORATESUSTAINABILITYANDRESPONSIBILITYASASOURCEOFCOMPETITIVEADVANTAGE–CASEOFVANHOUTUMCOMPANY50
4. tHe case of van Houtum
can be attributed to the desire of Henk Van Houtum not to run a family business but to be at the head of a professionally-managed company. along the way several external factors or triggers provided fresh impetus and encouraged Van Houtum to embrace and integrate CS&r into its business strategy.
4.2. initial motivation - professionalismThe company commenced in 1935 when the two Van Houtum brothers built their pa-per business on respect for people: employees, customers, suppliers, and the commu-nity. Over the years the company had gradually expanded its production capacity and output, had grown from delivering to The Netherlands to exporting to other countries in Europe. The workforce had grown from the initial six workers in 1935 to over 130 employees by the start of the 1980s.
Henk had never seen himself as taking over the family business and had embarked on a career in engineering. He was living and working in the uSa when he was asked by the family to return to Swalmen to assist his cousin, who was suffering from poor health. Thus Henk found himself running the family business.
as Henk recalls, generally, the image of a family business at that time was “decisi-ons made around the kitchen table” and he wanted none of that. He announced his intention: to move from being a family-run business to one that was professionally managed.
Henk decided that the best way to introduce change was via a system so he anno-unced the goal of achieving ISO9001 certification. until that time there was little paperwork, few reports, no written procedures. Once ISO9001 had been achieved he urged the company to go after ISO14001. The company was already involved in using recycled paper and treating their waste water and so it was natural that they should start to look at other aspects of their environmental performance. Certification was achieved in 1998. as part of the process of achieving ISO 14001 the company started to tackle energy consumption, installing a co-generation process.
Besides the initial motivation there followed three important, external triggers.
4.3. TriggersIn 2002 Henk was invited, along with other managers of the paper industry, by the national paper and board association, to attend a dinner at which a competitor Chief Executive addressed the group. a very serious, near-fatal accident had occurred at his plant and he related, passionately, how the police had subjected him to intense interrogation over a day. He warned all that if their industry did not take action one of those enjoying dinner in the private room at the restaurant might find themselves in prison following the death of one of their employees.
51EkonoMSkE IdEjE I PrakSa | Broj 6 | SEPtEMBar 2012.
Henk took this external warning seriously. Henk decided to use aKZO’s system Mana-ging Total Safety (MTS). Step one was a training programme for all employees: in each training group Henk sat in with the employees for the first hour to ensure that all would understand that the concern for safety came from the top.
The first reaction of employees was more or less the same: “we can’t do these things because it will result in reduced production”. Henk recalls, “I responded that I don’t care about production. What use is it if I have to visit you in hospital but we then can both say we are proud that we made a lot of production?” His attendance at the training sessions and his positive response to such questions allowed the employees to move forward with the confidence that this was not going to be just another “flavour of the month” but a se-rious, top-management-backed, sustained effort to reduce accidents and improve safety.
The dinner is still remembered as “The dinner in the attic”, an important milestone in Van Houtum’s history.
By the early 2000s, Van Houtum was, by most accounts, a forward-looking, well-ma-naged company. It enjoyed modest annual growth in sales, markets had developed - not only in Eu countries. as a result of the environment programme, spurred by the work to achieve and maintain ISO14001 certification, had led to a range of environmentally-friendly initiatives. as a result of these initiatives Van Houtum management choose to focus more on corporate social responsibility and claiming their achievements.
In 2007 came a second trigger: Europe’s largest paper company, Svenska Cellulosa ak-tiebolaget, a Swedish company (known as SCa), was named the 2nd greenest company in the world by The Independent, a uK newspaper, who had used Ethical Investment research Services to undertake the research. Henk read the report and wondered, how do we compare? So a study was set in motion to compare SCa’s published record against Van Houtum’s. Much to his surprise he found that on each statistic quoted by SCa, Van Houtum out-performed: “We found that we used 2/3 less water, 60% of their unit energy consumption, 50% of the CO2 emissions, and they still had a significant % of their waste dumped to landfill whereas we had reduced ours to nil.” as a result of this Van Houtum decide that they should start to speak more publicly about their CSr performance.
Shortly after they commenced speaking publicly about their CSr performance, and as a direct result, Henk Van Houtum received a visit from the organizers of Floriade Venlo 2012. Venlo is the city just a few kilometres north of Swalmen (home of Van Houtum). The organizers explained that they had chosen the concept of Cradle-to-Cradle as one of the key concepts of the 2012 event and to develop a C2C “valley of companies” focused on C2C.
as a result of Van Houtum being more public about their CSr performance - they had become aware of Van Houtum’s achievements in the environment. Would Van Houtum be interested to be a part of a pilot project and to be examined by the firm of McDonough and Braungart as to how well they performed under the C2C concept? Learning that the process wouldn’t be a cost Henk agreed. a third trigger.
CORPORATESUSTAINABILITYANDRESPONSIBILITYASASOURCEOFCOMPETITIVEADVANTAGE–CASEOFVANHOUTUMCOMPANY52

However, he was again unpleasantly surprised to find that, despite their great achieve-ments, 29 out of 30 chemicals that they sourced for their business would not meet C2C standards. Bas gehlen summarised – “after three months we learned that we had an issue – but no solutions!”
Once again an external stimulus spurred Henk into a new course of action and the com-pany found itself investing some €150,000 over the following 18 months, replacing che-micals toxic to the environment with environmentally-friendly ones. Finally, VH achieved Silver Cradle-to-Cradle status for a new product line.
4.4. outcomes of the triggersEach of these triggers spurred the company either to review its management practices or to review its business model. In practice, there was a complex process in which an external trigger built on or stimulated an internal change of direction or attitude. This then shaped Van Houtum’s people making them more receptive to outside stimuli and new ideas. These then provided a further stimulus.
The safety campaign led to a complete change in employee attitude. The earlier attitude had been “how can I tell someone else what to do or how they should do their job?” a new phase in employee engagement followed. Employees were now being given a new licence to challenge ways of working to challenge their environment.
Bas gehlen, Director operations, points out that the focus on safety allowed Van Houtum to then gain the most from World Class Manufacturing (“WCM”). Van Houtum had, in fact started to tackle WCM in 2000 but had not made much progress. “The problem we found with the certifications such as ISO9001 and ISO14001 was that they had not addressed the people and their attitudes. We had very nice systems, but it was mostly on paper. What we learned from tackling safety was that first you address awareness then you address the systems. Our management systems are not the goal, but allow all employees to be involved sustaining our future by improving quality across all aspects of the business.”
The next step was to empower the people to take action, to take responsibility for their part in the process. Bas again: “It’s all about creating ownership, making sure that people who are in the process, who really control the process, feel a real responsibility and accept no losses. as an operator I am responsible for my safety, for my environment, for my quality, my output, my cost. So I measure my own OEE (‘Overall Equipment Effectiveness).”
With energy consumption the company invested in basic training sessions addressing questions such as “What is energy? How do we use energy?” Then they involved each team of machine operators to address the energy consumption of their own machines and start to question, “how can you reduce the energy usage?”
The change of attitude of the employees led the company to develop a number of other initiatives to benefit the employees and the community - such as programmes to improve
53EkonoMSkE IdEjE I PrakSa | Broj 6 | SEPtEMBar 2012.

employee health, a more enlightened approach to sickness and sick leave, and to several employee-inspired community programmes.
One of the benefits of this focus on employee health and safety is a dedicated workforce and a safer workforce – and productivity improvements. gertie de roode-Schouwenberg, Van Houtum’s Communications Manager, report: “We used to have 10% absenteeism and a high level of accidents. One year we had 16 accidents which is quite a high num-ber for a factory with less than 200 people. as a result of this we used to have teams of 11 workers when the function might only have required just 9 – so we always had more workers to be able to cover absenteeism. Today, our absenteeism is very low, staff turnover is very low, and all employees feel involved.
an unexpected benefit has been the intense media interest in response to reports of the company’s achievements, especially after Cradle-to-Cradle certification. There had been a Dutch TV documentary about the C2C concept10. While Van Houtum is not mentioned the documentary led to heightened awareness of and interest in the C2C concept in The Netherlands. When Van Houtum announced their Silver certification media attention, already curious about C2C, flocked to their door to discover more.
The attention has also brought about the need for a systematic approach to stakehol-der communication. In response, Van Houtum has developed a carefully-thought-out structure for engaging stakeholders. The structure is set out in a grid that describes the stakeholder group, the nature of the content, and who within the company has primary responsibility.
4.5. satino black: using cs & r to build a brandVan Houtum branded the C2C line “Satino Black” with the tagline “Dare to be green”. The product line is not just for paper but also for the chemicals that are used in keeping the toilet hygienic - all certified C2C.
Nick op den Buijsch, Concept Manager for CS&r explains: “We are no longer selling toilet paper to these corporate customers – we are selling sustainability.” Our business development managers now approach large companies and put forward a new argument: “Your corporate goal is to reduce your impact on the environment. We can help you achieve your target in the area of your bathrooms. at least in your bathrooms, by using our Cradle-to-Cradle Satino Black you can be sure that you are minimizing your impact on the environment.”
With this “pull” strategy Van Houtum is opening up new market segments as well as reinforcing their already strong relationships with their distributors – because once a ma-jor company or organisation agrees to switch to Satino Black – then Van Houtum points them to their local distributor – they do not supply directly.
Satino Black toilets are now resulting in environmentally-friendly consumers asking Van Houtum, where can we buy Satino Black for our homes - opening up a new possibility
CORPORATESUSTAINABILITYANDRESPONSIBILITYASASOURCEOFCOMPETITIVEADVANTAGE–CASEOFVANHOUTUMCOMPANY54

that Van Houtum might start to sell directly to consumers. Thus, C2C is opening up the possibility of a B2B company adding B2C to their portfolio!
In the presented case of VH initial motivation and external triggers of implementing CS&r are presented. Furthermore, it was described how CS&r was used to provide growth – to build a brand. Presented case enables us to recognize the following elements of CS&r in VH case: 1. Sustainable and profitable business (attraction of investor) 2. Transparency (meeting with employees, CS&r reporting) 3. Stakeholder involvement (meeting with employees, open days for local community) 4. High quality of production and efficient manufacturing processes (ISO 9001) 5. Commitment to buyers (Satino Service concept) 6. Safety of employees (implementation of aKZO safety management system continuous
training) 7. Employee engagement (introduction of management systems with focus on em-
ployees’ involvement in the World Class Manufacturing system) 8. Environmental improvement (Environmental Management System ISO 14001) 9. reduction of waste 10. Community investment 11. Environmentally-friendly products 12. C2C manufacturing.
Listed elements of CS&r can be grouped based on Visser’s definition in the following manner:
using Carroll’s (1991) definition and concept of CSr it is possible to evaluate the level of the concepts reached by VH. The following figure shows VH Pyramid of CSr and com-pares it with the original concept:
55EkonoMSkE IdEjE I PrakSa | Broj 6 | SEPtEMBar 2012.
5. csr elements in van Houtum case
fiGure 1: GroupinG of cs&r elements
economic development Good Governance Sustainable and profitable businessHigh quality of production and efficient manufacturing processes (ISO 9001)World Class Manufacturing
Commitment to buyersSafety of employeesWorld Class Manufacturing Satino Service concept
staKeHolder responsiveness Good Governance TransparencyStakeholder involvementEmployee engagementSafety of employeesCommunity investment Commitment to buyers
Environmental Management System ISO 14001reduction of waste C2C manufacturing Environmentally friendly products
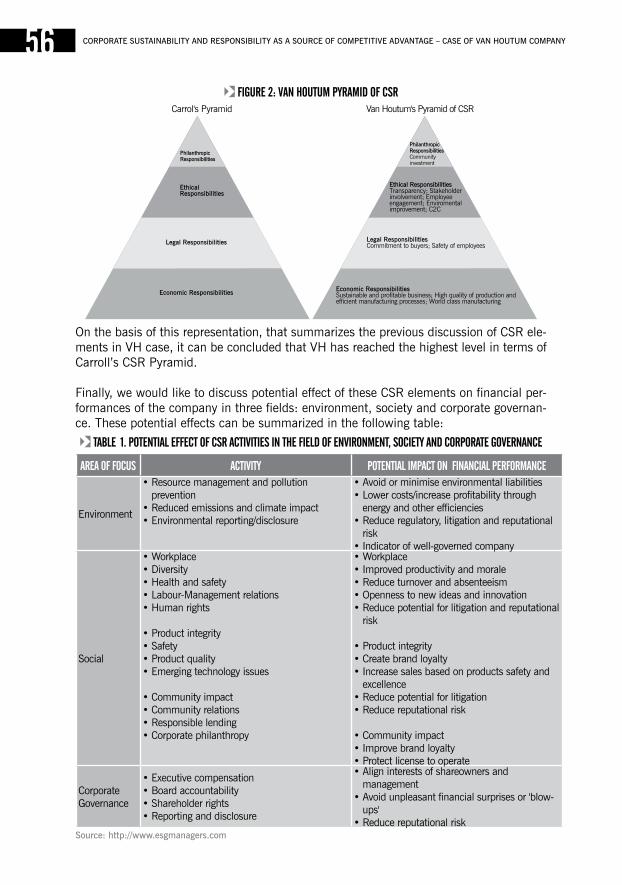
On the basis of this representation, that summarizes the previous discussion of CSr ele-ments in VH case, it can be concluded that VH has reached the highest level in terms of Carroll’s CSr Pyramid.
Finally, we would like to discuss potential effect of these CSr elements on financial per-formances of the company in three fields: environment, society and corporate governan-ce. These potential effects can be summarized in the following table:
CORPORATESUSTAINABILITYANDRESPONSIBILITYASASOURCEOFCOMPETITIVEADVANTAGE–CASEOFVANHOUTUMCOMPANY56
table 1. potential effect of csr activities in tHe field of environment, society and corporate Governance
area of focus activity potential impact on financial performance
Environment
• resource management and pollution prevention
• reduced emissions and climate impact• Environmental reporting/disclosure
• avoid or minimise environmental liabilities • Lower costs/increase profitability through
energy and other efficiencies • reduce regulatory, litigation and reputational
risk • Indicator of well-governed company
Social
• Workplace• Diversity • Health and safety • Labour-Management relations • Human rights
• Product integrity • Safety • Product quality • Emerging technology issues
• Community impact • Community relations • responsible lending • Corporate philanthropy
• Workplace• Improved productivity and morale • reduce turnover and absenteeism • Openness to new ideas and innovation • reduce potential for litigation and reputational
risk
• Product integrity • Create brand loyalty • Increase sales based on products safety and
excellence • reduce potential for litigation • reduce reputational risk
• Community impact • Improve brand loyalty • Protect license to operate
Corporate governance
• Executive compensation • Board accountability • Shareholder rights • reporting and disclosure
• align interests of shareowners and management
• avoid unpleasant financial surprises or 'blow-ups'
• reduce reputational riskSource:http://www.esgmanagers.com
fiGure 2: van Houtum pyramid of csrCarrol's Pyramid Van Houtum's Pyramid of CSr
Presented framework provides us with a tool to understand the mechanism in which elements of CSr could lead to improved financial performances of the company.
Case of Van Houtum, shortly presented in this paper, provides us with the insight into the successful business practice of CSr implementation. This medium-sized Dutch company, manufacturing tissue paper, used CSr and CS&r concepts to reach the excellence in its business operations. These concepts were built into the company’s strategy and used to drive changes in the company toward better business practice, taking into account needs of different stakeholders. Employees were motivated and empowered to implement ele-ments of CSr.
Internal motivation and external triggers of CSr in the case of VH were discussed. Paper summarizes main elements of CSr in VH case and groups them according to Visser’s definition of the concept. By building CSr Pyramid for VH following Carroll’s concept it can be concluded that VH reached the highest level. CSr implementation is not a goal on its own but a tool in reaching superior financial performances. analysis of potential financial effects of CSr elements in VH case gives insight into the possible mechanism of this influence, and explains how the implementation of CSr concept and elements provided growth and superior performances for Van Houtum.
57
6. conclusion
7. references
Barnard, C. I. (1938), The functions of the executive, Cambridge, Ma: Harvard univer-sity Press. republished 1968
Bowen r. H. (1953), Social responsibilities of the businessman, Harper New York
Carroll, a.B. (1991), “The Pyramid of Corporate Social responsibility: Toward the Moral Management of Organizational Stakeholders”, Business Horizons, July-august, 34, pp. 39 – 48.
Drucker F. P. (1942), The Future of Industrial Man, John Day
Elkington J. (1997), Cannibals with Forks: the Triple Bottom Line of 21st Century Busine-ss, Capstone
Friedman M. (1970), The New York Times Magazine, September 13
Spector, B. (2008), “Business responsibilities in a divided world: the cold war roots of the corporate social responsibility movement”, Enterprise & Society, 9, pp. 314–336.
EkonoMSkE IdEjE I PrakSa | Broj 6 | SEPtEMBar 2012.
CORPORATESUSTAINABILITYANDRESPONSIBILITYASASOURCEOFCOMPETITIVEADVANTAGE–CASEOFVANHOUTUMCOMPANY58
Visser, W. (2011), The Age of Responsibility: CSR 2.0 and the New DNA of Business, Willey.
http://tegenlicht.vpro.nl/backlight/waste-food.html
Weck, M., Klocke, F., Schell, H., and ruenauver, E., 1997, Evaluating alternative pro-duction cycles using the extended fuzzy AHP method, European Journal of Operational research, 100(2): 351–366.
http://www.bitc.org.uk/
http://www.esgmanagers.com
http://www.som.cranfield.ac.uk/som/p14340/research/research-Centres
jel KlasifiKacija: : c22, c52, c53, c58, G10
1 University“Ss.CyrilandMethodius”,FacultyofEconomics-Skopje,Skopje,Macedonia2 KomercijalnabankaADSkopje,Skopje,Macedonia
59
estimatinG and forecastinG stocK marKet volatility under crisis: empirical evidence from tHe macedonian stocK excHanGe
EkonoMSkE IdEjE I PrakSa | Broj 6 | SEPtEMBar 2012.
vesna bucevsKa1
jasmina bucevsKa2

ESTIMATINGANDFORECASTINGSTOCKMARKETVOLATILITYUNDERCRISIS:EMPIRICALEVIDENCEFROMTHEMACEDONIANSTOCKEXCHANGE60
Key Words:value-at-risK, GarcH models, forecastinG volatility, financial crisis, macedonia.
abstract: The importance of Value-at-Risk (VaR), the most well-known financial risk measure-ment, has significantly increased during the 2008-09 global financial crisis. In the light of the ongoing sovereign debt crisis in the Euro zone, accurate measuring and forecasting of market losses seem to play a crucial role, both in developed and emerg-ing financial markets.
The growing interest of foreign financial investors to invest in emerging financial mar-kets and the increased financial fragility in these markets, highlight the importance of accurate market risk quantification and prediction. As an EU candidate country with a high potential for stock market growth, Macedonia is an interesting destination for foreign financial investors, who, due to the distinctions between developed and emerg-ing financial markets and the turbulent market environment, need to test the possibility to apply GARCH models in VaR estimation and forecasting in the Macedonian stock market.
The purpose of our paper is to extend the very scarce empirical research on VaR estima-tion and forecasting in emerging financial markets by testing the relative performance of selected GARCH-based models in terms of their ability of delivering volatility esti-mates and forecasts for the daily returns of the Macedonian stock market index.
The theoretical contribution of our study is that it is the first study, to the best of our knowledge, on VaR estimation and forecasting in the Macedonian stock market over a long sample period (from the 4th January 2005 to the 31st October 2011).
Using the daily returns of the Macedonian stock market index-MBI 10, we have tested the performance of the following symmetric GARCH models: the GARCH (1,1) model with normal and Student’s t-distribution and the GARCH-M model, and of the follow-ing asymmetric GARCH models: the EGARCH (1,1) model with normal and Student’s t-distribution distribution, the GARCH-GJR model and the APARCH (1,1) model.
Our empirical results indicate that the most adequate GARCH family models for esti-mating and forecasting volatility in the Macedonian stock market are the asymmetric EGARCH model with Student’s t-distribution, the EGARCH model with normal distribu-tion and the GARCH-GJR model.
The impetus for Value-at-risk (Var), the most well-known financial risk measurement, came from failures of financial institutions and the responses of regulators to these failures. Following the increase in financial instability in the beginning of the 70’s ye-ars as a result of the advent of derivative markets and floating exchange rates, several methods of risk have been developed. However, Var is the most popular one.
Value-at-risk (Var) is defined as “the worst loss over a target horizon with a given level of confidence”.3 The first regulatory measures that evoke Value-at- risk, were initiated in the 80’s when the Securities Exchange Commission (SEC) tied the capital requirements of financial service firms to the losses that would be incurred, with 95% confidence over a thirty-day interval, in different security classes. In parallel with that, the trading portfolios of financial institutions were becoming larger and more volatile, creating a need for more sophisticated and timely risk measurement. By the early 90’s many banks have developed different rudimentary measures of Value-at-risk. In the aftermath of the famous financial disasters that occurred between 1993 and 1995, financial institutions, regulators and academics were motivated to better develop sop-histicated models for market risk estimation. The popularity of Var and the debate about the validity of the underlying statistical assumptions increased since 1994, when JP Morgan made available its riskMetrics methodology through Internet. The free accessibility of the riskMetrics triggered academics and practitioners to find the best-performing market risk quantification method.
The importance of risk measurement and estimation and prediction of market losses has significantly increased during and after the 2008-09 global financial crisis. It is not a long time since the world financial system is recovering from its latest and seve-rest financial crisis that we are again dealing with a new one - the greek, the Italian, the Spanish debt crisis – or more properly, Europe’s sovereign-debt crisis. In the light of the ongoing crisis in the Euro zone, accurate measuring and forecasting of market losses seem to play a crucial role both in developed and emerging financial markets.
unlike the financial markets of developed countries, the emerging financial markets are characterized with insufficient liquidity, small scale of trading and asymmetrical and low number of trading days with certain securities.4 In their study of 16 emerging markets in Europe, Latin america and asia, Dimitrakopolous et al.5 point out that average daily returns are not significantly different from zero for the emerging markets. Their return volatilities are twice the volatilities of developed markets. Furthermore, return series exhibit significant positive or negative skewness coefficients. Emerging markets kurtosis values are on average higher than those of developed markets su-ggesting fatter tailed distributions. Batten and Szilagyi6 point out that emerging stock market volatility is characterized by a complex dynamics, mainly during crises and turbulence periods.
61
1. introduction
3 Jorion(2006),p.22.4 Andjelicetal.(2010),p.3667.5 Dimitrakopolousetal.(2010),p.518.6 BattenandSzilagyi(2011).p.4.
EkonoMSkE IdEjE I PrakSa | Broj 6 | SEPtEMBar 2012.
The above described differences between the developed and emerging financial markets, the growing interest of foreign financial investors to invest in emerging financial markets and the increased financial fragility in these markets, highlight the importance of accura-te market risk quantification and prediction.
The purpose of this paper is to test the relative performance of a range of symmetric and asymmetric garCH family models in estimating and forecasting Value-at-risk in the Macedonian stock exchange over a long sample period which includes tranquil as well as stress years.
as an Eu candidate country with a high potential for stock market growth, Macedonia is an interesting destination for foreign financial investors, who, due to the distincti-ons between developed and emerging financial markets and the turbulent market envi-ronment, need to test the possibility to apply garCH models in Var estimation and forecasting in the Macedonian stock market.
Our empirical results indicate that the most adequate garCH family models for estima-ting and forecasting volatility in the Macedonian stock market are the asymmetric Egar-CH model with Student’s t-distribution, the EgarCH model with normal distribution and the garCH-gJr model which are robust with regard to estimation.
The rest of the paper is organized as follows. In Section 2 we give a brief literature review. In Section 3 we describe the symmetric and asymmetric garCH family models used in our study. Section 4 presents the data used and the results of the preliminary analysis. In Section 5 we present our empirical results and in Section 6 we draw conclusions.
Var models were originally created and tested in the developed financial markets for measuring market risks. It is therefore quite understandable that the majority of the exi-sting literature on modelling and forecasting volatility refers to the stock markets in the developed countries.
Despite the extensive literature and empirical research of estimation of Var models in the major developed financial markets, the Var-related literature regarding emerging financi-al markets is very scarce.7 The main reason for that were the short historical time series data (most of the stock markets in these countries were established in the early nineties) which did not allow performing a reliable econometric analysis.
The situation is even worse as far as the Macedonian stock exchange is concerned. Na-mely, there is only one empirical study8, to the best of our knowledge, which applies the
ESTIMATINGANDFORECASTINGSTOCKMARKETVOLATILITYUNDERCRISIS:EMPIRICALEVIDENCEFROMTHEMACEDONIANSTOCKEXCHANGE62
7 SeeHagerud(1997),Gokcan(2000),BrooksandPersand(2000),MagnusssonandAndonov(2002),DaSilvaetal.(2003),Parrondo(2004),Valentinyi-Enrdesz(2004),Baoetal.(2006),ZikovicandBezic(2006),McMillanandSpeght(2007),Kovacic(2007),ZikovicandAktan(2009),ZikovicandFiller(2009),Andjelicetal.(2010).
8 Kovacic(2007),pp.1-44.
2. literature revieW
same methodology as in our paper to estimate and forecast the volatility in the Macedo-nian stock exchange. However, one of the shortcomings of this study is the short time series return data, which does not allow precise estimation of Var.
another limitation of the existing empirical studies on Var estimation and forecasting in emerging stock markets is that only few of them have tried to take into account the impact of a financial crisis on Value-at risk (Var) estimation. Namely, Zikovic and aktan9 investigate the relative performance of a wide array of Var models with the daily returns of Turkish (Xu100) and Croatian (Crobex) stock index prior to and during global 2008 financial crisis. In another study, Zikovic and Filler10 test the relative performance of Var and ES models using daily returns for sixteen stock market indices (eight from developed and eight from emerging markets) prior to and during the 2008 financial crisis. However, the main limitation of their studies is the fact that they have tested the relative perfor-mances of Var models at the very beginning of the global financial crisis. Due to the short sample period their results should be taken with cautious and future research with inclusion of a longer period is needed in order to obtain estimates with greater precision.
Our paper tries to extend the limited empirical research on Var estimation and foreca-sting in emerging financial markets and to overcome the above stated limitations of the previous empirical studies by testing the relative performance of selected garCH-based models in volatility estimation and forecasting for the Macedonian stock market over a longer sample period, which includes stable as well as turbulent years (the years of the global financial crisis of 2008 and the current Europe’s sovereign-debt crisis).
3.1 symmetric GarcH modelsaccurate volatility estimates are essential for producing robust Var estimates. In this context different methods were developed to estimate volatility. The traditional methods of measuring volatility (variance or standard deviation) are unconditional and can not capture the characteristics of asset returns data, such as, thick tails, volatility clustering, leverage effects, non-trading periods and forecastable events. One of the most popular models that capture the above patterns of volatility have proved to be the generalized autoregressive Conditional Heteroskedasticity (garCH) models. In this paper we are focusing on the use of selected garCH type models to estimate and forecast daily Var of the Macedonian stock exchange in turbulent times.
To model volatility of financial time series, Engle introduced the autoregressive Conditional Heteroscedasticity (arCH) model.11 The general form of arCH (q) model is as follows:
63
9 ZikovicandAktan(2009),pp.149-170.10 ZikovicandFiller(2009),pp.1-39.11 Engle(1982),pp.987-1008.
EkonoMSkE IdEjE I PrakSa | Broj 6 | SEPtEMBar 2012.
3. GarcH models

where is the conditional variance and is the error term. For the conditional variance to be positive, the value of the parameters and should be greater than zero since standard deviation and variance can not be negative and values of should be less than one in order for the process to be stationary. In the arCH (q) model today’s expected volatility depends on the squared forecast errors of the previous days.
In empirical applications of the arCH model a relatively long lag in the conditional variance equation is often called for, and to avoid problems with negative variance parameter estima-tes a fixed lag structure is typically imposed.12 In that context, Bollerslev extended the arCH model to have longer memory and a more flexible lag structure by adding lagged conditional variance to the model as well. The model that he proposed was called generalized autoregre-ssive Conditional Heteroskedasticity (garCH) model.13
The garCH (p,q) model permits a wider range of behaviour, in particular, a more persistent volatility. It expresses the conditional variance as a linear function of lagged square error terms and also lagged conditional variance terms. The general form of the garCH (p,q) model is given by:
(2)
where p is the order of garCH and q is the order of arCH process, are returns of the financial time series (stock exchange index) at time t in natural log (logs), are mean value of the returns, is the error term at time t which is assumed to be normally distributed with zero mean and conditional variance and are parameters. all parameters in variance equation must be positive. We expect the value of to be small. Parameter is the measure of volatility response to movements in the market and parameter expresses how persistent shocks are that were caused by extreme values of conditional variance. We expect the sum of .
according to Brooks14 garCH models are among the best models that are currently available for volatility forecasting and that is the reason why in this paper I will concentrate on garCH family models.
The standard garCH (p,q) model successfully captures the most important characteristics of financial time series, such as the leptokurtic distribution of asset returns (fat tails) and volatility clusters of returns, thanks to the high degree of persistence typically found when estimating garCH models. It expresses the conditional variance as a linear function of past information allowing the conditional heteroskedasticity of returns.15
according to Brooks16 the lag order (1,1) garCH model is sufficient to capture all of the volatility clustering in the data. In most empirical applications17, the basic garCH (1,1) fits
ESTIMATINGANDFORECASTINGSTOCKMARKETVOLATILITYUNDERCRISIS:EMPIRICALEVIDENCEFROMTHEMACEDONIANSTOCKEXCHANGE64
12 Bollerslev(1986),pp.307-327.13 Bollerslev(1986),pp.307-327.14 Brooks(2008),p.420.15 Curtoetal.(2009),pp.311-321.16 Brooks(2008),p.394.17SeeFrenchetal.(1987),pp.3-29;PaganandSchwert(1990),pp.267-290;FransesandVanDijk(1996),pp.229-235andGokcan(2000),pp.499-504.
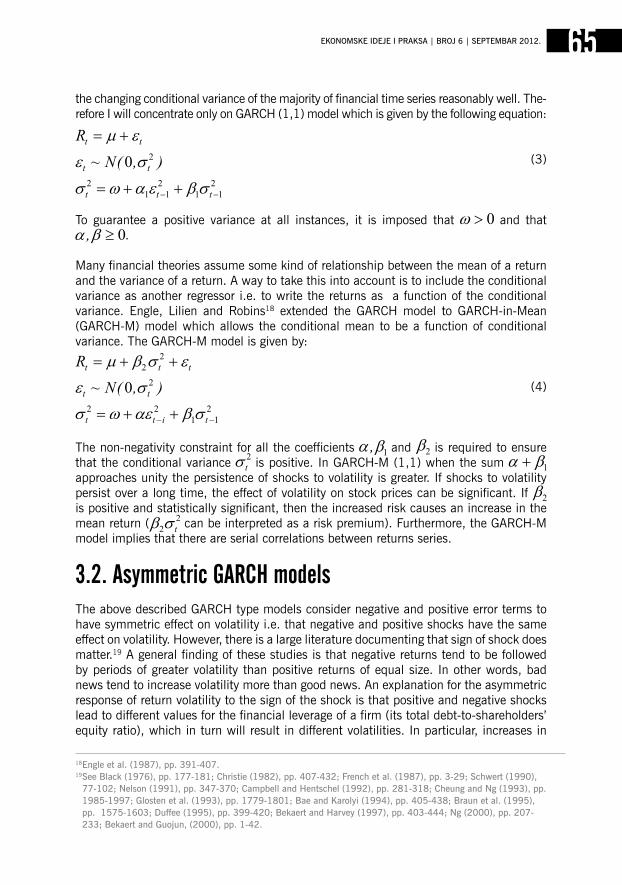
the changing conditional variance of the majority of financial time series reasonably well. The-refore I will concentrate only on garCH (1,1) model which is given by the following equation:
(3)
To guarantee a positive variance at all instances, it is imposed that and that .
Many financial theories assume some kind of relationship between the mean of a return and the variance of a return. a way to take this into account is to include the conditional variance as another regressor i.e. to write the returns as a function of the conditional variance. Engle, Lilien and robins18 extended the garCH model to garCH-in-Mean (garCH-M) model which allows the conditional mean to be a function of conditional variance. The garCH-M model is given by:
(4)
The non-negativity constraint for all the coefficients and is required to ensure that the conditional variance is positive. In garCH-M (1,1) when the sum approaches unity the persistence of shocks to volatility is greater. If shocks to volatility persist over a long time, the effect of volatility on stock prices can be significant. If is positive and statistically significant, then the increased risk causes an increase in the mean return ( can be interpreted as a risk premium). Furthermore, the garCH-M model implies that there are serial correlations between returns series.
3.2. asymmetric GarcH modelsThe above described garCH type models consider negative and positive error terms to have symmetric effect on volatility i.e. that negative and positive shocks have the same effect on volatility. However, there is a large literature documenting that sign of shock does matter.19 a general finding of these studies is that negative returns tend to be followed by periods of greater volatility than positive returns of equal size. In other words, bad news tend to increase volatility more than good news. an explanation for the asymmetric response of return volatility to the sign of the shock is that positive and negative shocks lead to different values for the financial leverage of a firm (its total debt-to-shareholders’ equity ratio), which in turn will result in different volatilities. In particular, increases in
65
18Engleetal.(1987),pp.391-407.19 SeeBlack(1976),pp.177-181;Christie(1982),pp.407-432;Frenchetal.(1987),pp.3-29;Schwert(1990),77-102;Nelson(1991),pp.347-370;CampbellandHentschel(1992),pp.281-318;CheungandNg(1993),pp.1985-1997;Glostenetal.(1993),pp.1779-1801;BaeandKarolyi(1994),pp.405-438;Braunetal.(1995),pp.1575-1603;Duffee(1995),pp.399-420;BekaertandHarvey(1997),pp.403-444;Ng(2000),pp.207-233;BekaertandGuojun,(2000),pp.1-42.
EkonoMSkE IdEjE I PrakSa | Broj 6 | SEPtEMBar 2012.
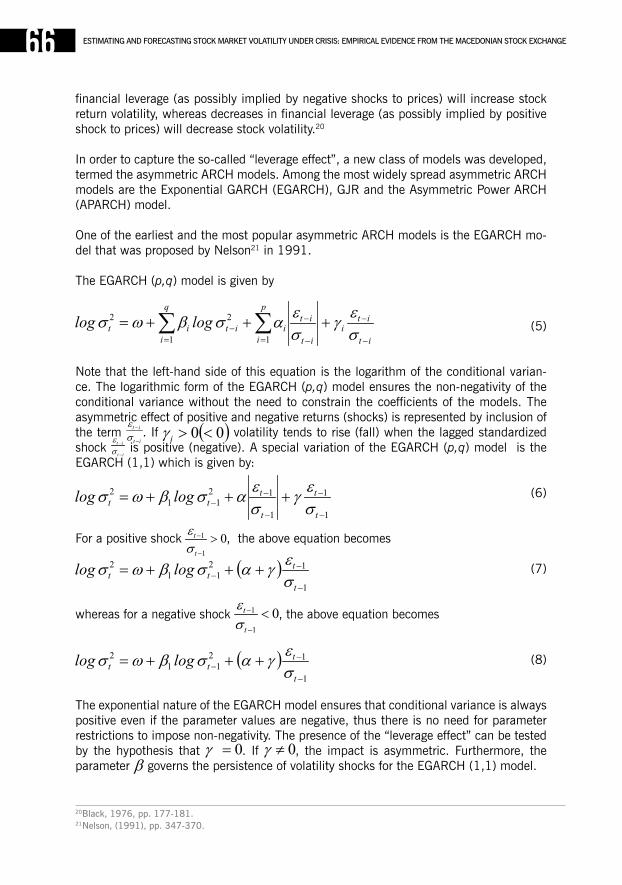
financial leverage (as possibly implied by negative shocks to prices) will increase stock return volatility, whereas decreases in financial leverage (as possibly implied by positive shock to prices) will decrease stock volatility.20
In order to capture the so-called “leverage effect”, a new class of models was developed, termed the asymmetric arCH models. among the most widely spread asymmetric arCH models are the Exponential garCH (EgarCH), gJr and the asymmetric Power arCH (aParCH) model.
One of the earliest and the most popular asymmetric arCH models is the EgarCH mo-del that was proposed by Nelson21 in 1991.
The EgarCH (p,q) model is given by
(5)
Note that the left-hand side of this equation is the logarithm of the conditional varian-ce. The logarithmic form of the EgarCH (p,q) model ensures the non-negativity of the conditional variance without the need to constrain the coefficients of the models. The asymmetric effect of positive and negative returns (shocks) is represented by inclusion of the term . If volatility tends to rise (fall) when the lagged standardized shock is positive (negative). a special variation of the EgarCH (p,q) model is the EgarCH (1,1) which is given by:
(6)
For a positive shock , the above equation becomes
(7)
whereas for a negative shock , the above equation becomes
(8)
The exponential nature of the EgarCH model ensures that conditional variance is always positive even if the parameter values are negative, thus there is no need for parameter restrictions to impose non-negativity. The presence of the “leverage effect” can be tested by the hypothesis that . If , the impact is asymmetric. Furthermore, the parameter governs the persistence of volatility shocks for the EgarCH (1,1) model.
ESTIMATINGANDFORECASTINGSTOCKMARKETVOLATILITYUNDERCRISIS:EMPIRICALEVIDENCEFROMTHEMACEDONIANSTOCKEXCHANGE66
20 Black,1976,pp.177-181.21 Nelson,(1991),pp.347-370.
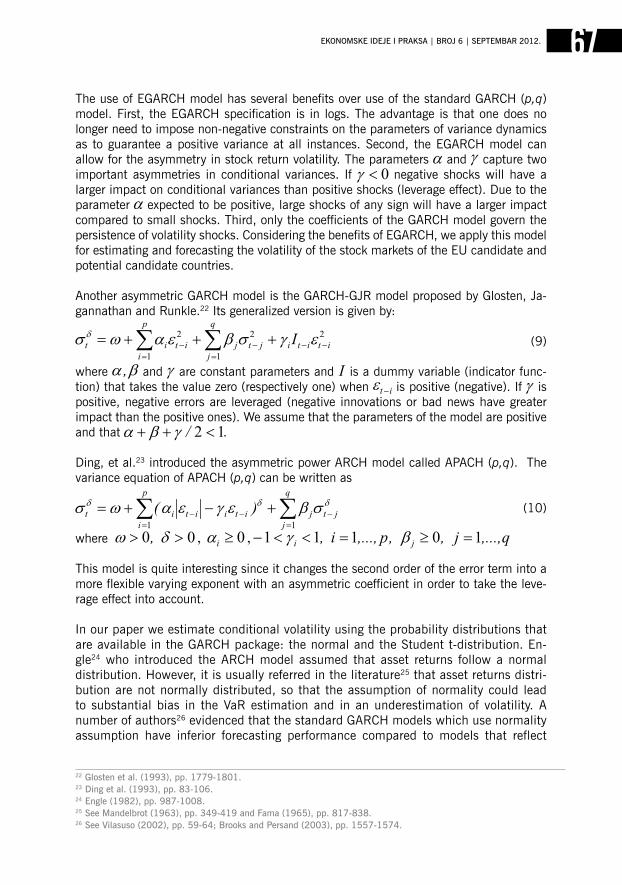
The use of EgarCH model has several benefits over use of the standard garCH (p,q) model. First, the EgarCH specification is in logs. The advantage is that one does no longer need to impose non-negative constraints on the parameters of variance dynamics as to guarantee a positive variance at all instances. Second, the EgarCH model can allow for the asymmetry in stock return volatility. The parameters and capture two important asymmetries in conditional variances. If negative shocks will have a larger impact on conditional variances than positive shocks (leverage effect). Due to the parameter expected to be positive, large shocks of any sign will have a larger impact compared to small shocks. Third, only the coefficients of the garCH model govern the persistence of volatility shocks. Considering the benefits of EgarCH, we apply this model for estimating and forecasting the volatility of the stock markets of the Eu candidate and potential candidate countries.
another asymmetric garCH model is the garCH-gJr model proposed by glosten, Ja-gannathan and runkle.22 Its generalized version is given by:
(9)
where and are constant parameters and is a dummy variable (indicator func-tion) that takes the value zero (respectively one) when is positive (negative). If is positive, negative errors are leveraged (negative innovations or bad news have greater impact than the positive ones). We assume that the parameters of the model are positive and that .
Ding, et al.23 introduced the asymmetric power arCH model called aPaCH (p,q). The variance equation of aPaCH (p,q) can be written as
(10)
where
This model is quite interesting since it changes the second order of the error term into a more flexible varying exponent with an asymmetric coefficient in order to take the leve-rage effect into account.
In our paper we estimate conditional volatility using the probability distributions that are available in the garCH package: the normal and the Student t-distribution. En-gle24 who introduced the arCH model assumed that asset returns follow a normal distribution. However, it is usually referred in the literature25 that asset returns distri-bution are not normally distributed, so that the assumption of normality could lead to substantial bias in the Var estimation and in an underestimation of volatility. a number of authors26 evidenced that the standard garCH models which use normality assumption have inferior forecasting performance compared to models that reflect
67
22 Glostenetal.(1993),pp.1779-1801.23 Dingetal.(1993),pp.83-106.24 Engle(1982),pp.987-1008.25 SeeMandelbrot(1963),pp.349-419andFama(1965),pp.817-838.26 SeeVilasuso(2002),pp.59-64;BrooksandPersand(2003),pp.1557-1574.
EkonoMSkE IdEjE I PrakSa | Broj 6 | SEPtEMBar 2012.
skewness and kurtosis in innovations. In order to capture the excess kurtosis of fi-nancial asset returns, Bollerslev27 introduced the garCH model with a standardized Student’s t distribution with degrees of freedom.
after describing the properties of selected garCH family models, we turn now to the question how we can estimate garCH models when the only variable on which there are available data is the data on asset returns. However, before attempting to estimate a garCH model the first thing to do is to check if there are arCH effects in the residu-als of the model. If there are no signs of arCH effects, we should not explicitly model and estimate the conditional volatility of return series as garCH.
The common methodology used for estimation of garCH models is the conditional maxi-mum likelihood assuming i.i.d. innovations.
The parameters of the garCH model can be found by maximizing the objective log-like-lihood function:
(11)
where is the vector of parameters estimated that maximize the objective function ; represents the standardized residual calculated as . The rest of the notation is the same as expressed previously.
Maximum likelihood estimates of the parameters are obtained by employing numerical maximization procedure according to Marquardt algorithm. Engle28 suggests an even simpler answer to use software such as EViews, SaS, gauSS, TSP, Matlab, raTS and others. In our paper we estimate the garCH family models using the econometric com-puter package EViews 6.
In this paper we examine the relative performance of selected symmetric garCH mo-dels, such as, the garCH (1,1) model with normal and Student’s t-distribution and the garCH-M model and the asymmetric garCH models, such as, the EgarCH (1,1) with normal and Student’s t-distribution and the aParCH (1,1), model with regard to mo-delling and estimating Var in the Macedonian stock exchange in crisis times. For emer-ging economies, such as Macedonia, a significant problem for a serious and statistically significant analysis is the short histories of their market economies and active trading in financial markets.29 Therefore andjelic et al.30 suggest analyzing the stock indices of the-se countries, because of the short time series of returns of individuals stocks. The stock indices represent a portfolio of selected stocks from an individual stock market. Thus data
ESTIMATINGANDFORECASTINGSTOCKMARKETVOLATILITYUNDERCRISIS:EMPIRICALEVIDENCEFROMTHEMACEDONIANSTOCKEXCHANGE68
27Bollerslev(1987),pp.542-547.28Engle(2001),pp.157-168.29 Andjelicetal.(2010),p.3671.30 Andjelicetal.(2010),p.3671
4. data and descriptive statistics
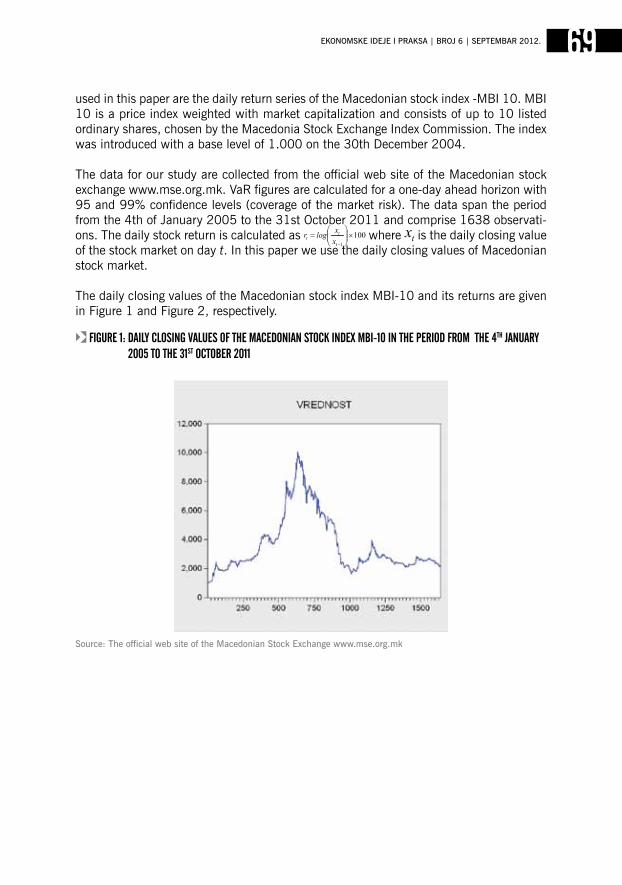
used in this paper are the daily return series of the Macedonian stock index -MBI 10. MBI 10 is a price index weighted with market capitalization and consists of up to 10 listed ordinary shares, chosen by the Macedonia Stock Exchange Index Commission. The index was introduced with a base level of 1.000 on the 30th December 2004.
The data for our study are collected from the official web site of the Macedonian stock exchange www.mse.org.mk. Var figures are calculated for a one-day ahead horizon with 95 and 99% confidence levels (coverage of the market risk). The data span the period from the 4th of January 2005 to the 31st October 2011 and comprise 1638 observati-ons. The daily stock return is calculated as where is the daily closing value of the stock market on day t. In this paper we use the daily closing values of Macedonian stock market.
The daily closing values of the Macedonian stock index MBI-10 and its returns are given in Figure 1 and Figure 2, respectively.
fiGure 1: daily closinG values of tHe macedonian stocK index mbi-10 in tHe period from tHe 4tH january 2005 to tHe 31st october 2011
Source:TheofficialwebsiteoftheMacedonianStockExchangewww.mse.org.mk
69EkonoMSkE IdEjE I PrakSa | Broj 6 | SEPtEMBar 2012.

as it can be seen from Figure 1 the closing values of MBI-10 show a random walk. From Figure 2 it is evident that the daily returns are stationary.
The return data is tested for autocorrelation both in log returns as well as squared log returns (see Figure 3 and Figure 4). autocorrelation in log returns is tested by aCF, PaCF and the mean adjusted Ljung-Box Q-statistics. autocorrelation in squared log returns is tested by aCF, PaCF, Ljung-Box Q-statistic and Engle’s arCH test. When autocorrelation is detected in log returns the most parsimonious arMa (p,q) model adequate to remove autocorrelation is fitted to the data. When autocorrelation is detected in the squared log returns, the most parsimonious garCH model is fitted to the arMa filtered (if necessary) data to remove heteroskedasticity from the series.
fiGure 2: daily stocK returns of tHe macedonian stocK index mbi-10 in tHe period from tHe 4tH january 2005 to tHe 31st october 2011
Source:TheofficialwebsiteoftheMacedonianStockExchangewww.mse.org.mk
70 ESTIMATINGANDFORECASTINGSTOCKMARKETVOLATILITYUNDERCRISIS:EMPIRICALEVIDENCEFROMTHEMACEDONIANSTOCKEXCHANGE
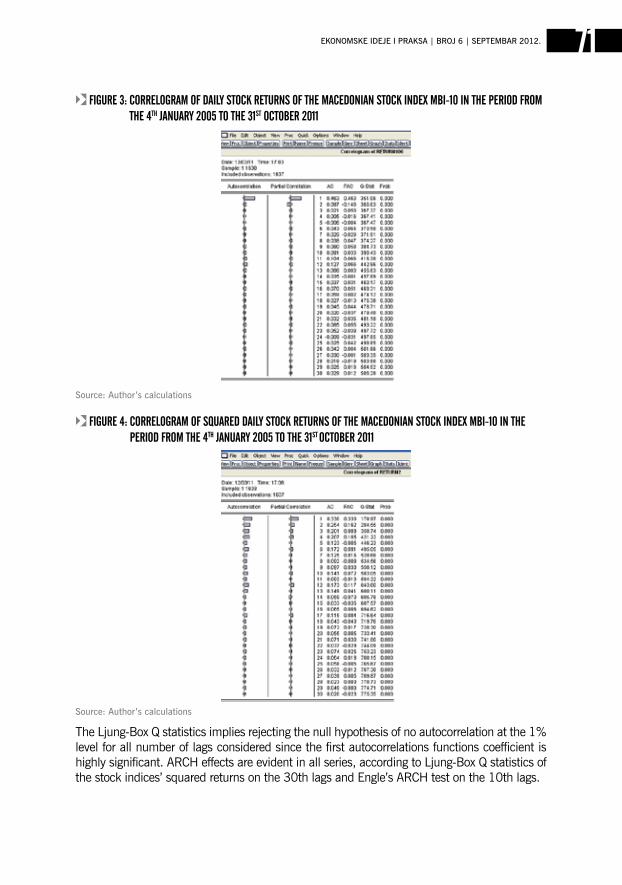
The Ljung-Box Q statistics implies rejecting the null hypothesis of no autocorrelation at the 1% level for all number of lags considered since the first autocorrelations functions coefficient is highly significant. arCH effects are evident in all series, according to Ljung-Box Q statistics of the stock indices’ squared returns on the 30th lags and Engle’s arCH test on the 10th lags.
fiGure 3: correloGram of daily stocK returns of tHe macedonian stocK index mbi-10 in tHe period from tHe 4tH january 2005 to tHe 31st october 2011
Source:Author’scalculations
fiGure 4: correloGram of sQuared daily stocK returns of tHe macedonian stocK index mbi-10 in tHe period from tHe 4tH january 2005 to tHe 31st october 2011
Source:Author’scalculations
71EkonoMSkE IdEjE I PrakSa | Broj 6 | SEPtEMBar 2012.
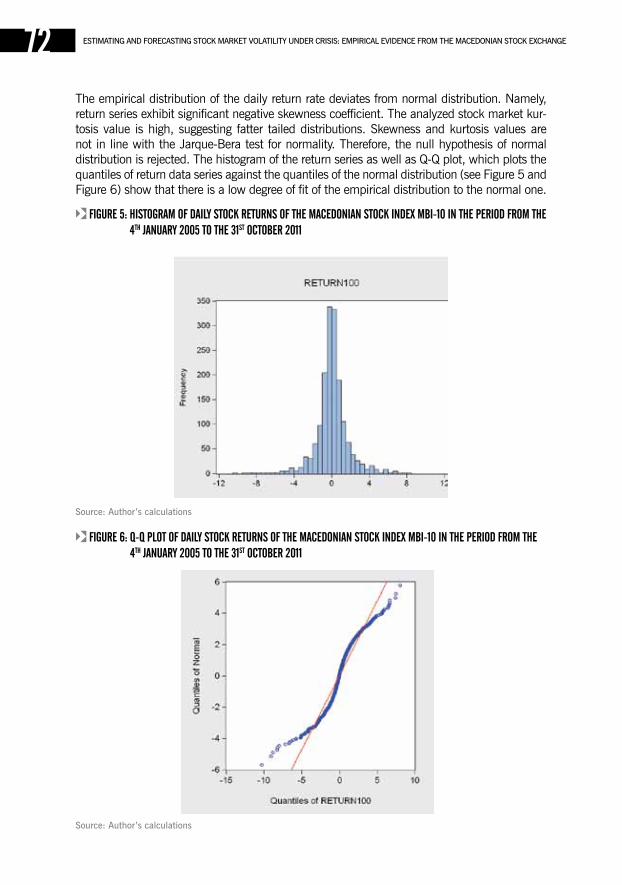
The empirical distribution of the daily return rate deviates from normal distribution. Namely, return series exhibit significant negative skewness coefficient. The analyzed stock market kur-tosis value is high, suggesting fatter tailed distributions. Skewness and kurtosis values are not in line with the Jarque-Bera test for normality. Therefore, the null hypothesis of normal distribution is rejected. The histogram of the return series as well as Q-Q plot, which plots the quantiles of return data series against the quantiles of the normal distribution (see Figure 5 and Figure 6) show that there is a low degree of fit of the empirical distribution to the normal one.
fiGure 5: HistoGram of daily stocK returns of tHe macedonian stocK index mbi-10 in tHe period from tHe 4tH january 2005 to tHe 31st october 2011
Source:Author’scalculations
fiGure 6: Q-Q plot of daily stocK returns of tHe macedonian stocK index mbi-10 in tHe period from tHe 4tH january 2005 to tHe 31st october 2011
Source:Author’scalculations
72 ESTIMATINGANDFORECASTINGSTOCKMARKETVOLATILITYUNDERCRISIS:EMPIRICALEVIDENCEFROMTHEMACEDONIANSTOCKEXCHANGE
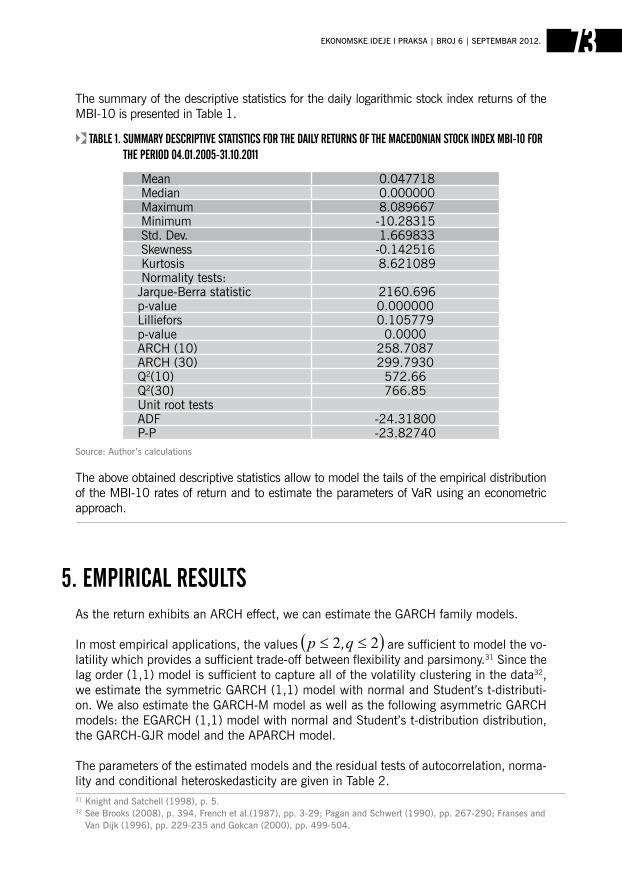
The summary of the descriptive statistics for the daily logarithmic stock index returns of the MBI-10 is presented in Table 1.
The above obtained descriptive statistics allow to model the tails of the empirical distribution of the MBI-10 rates of return and to estimate the parameters of Var using an econometric approach.
as the return exhibits an arCH effect, we can estimate the garCH family models.
In most empirical applications, the values are sufficient to model the vo-latility which provides a sufficient trade-off between flexibility and parsimony.31 Since the lag order (1,1) model is sufficient to capture all of the volatility clustering in the data32, we estimate the symmetric garCH (1,1) model with normal and Student’s t-distributi-on. We also estimate the garCH-M model as well as the following asymmetric garCH models: the EgarCH (1,1) model with normal and Student’s t-distribution distribution, the garCH-gJr model and the aParCH model.
The parameters of the estimated models and the residual tests of autocorrelation, norma-lity and conditional heteroskedasticity are given in Table 2.
table 1. summary descriptive statistics for tHe daily returns of tHe macedonian stocK index mbi-10 for tHe period 04.01.2005-31.10.2011
Source:Author’scalculations
Mean 0.047718 Median 0.000000 Maximum 8.089667 Minimum -10.28315 Std. Dev. 1.669833 Skewness -0.142516 Kurtosis 8.621089 Normality tests:Jarque-Berra statistic 2160.696p-value 0.000000Lilliefors 0.105779p-value 0.0000arCH (10) 258.7087arCH (30) 299.7930Q2(10) 572.66Q2(30) 766.85unit root testsaDF -24.31800P-P -23.82740
5. empirical results
31 KnightandSatchell(1998),p.5.32 SeeBrooks(2008),p.394,Frenchetal.(1987),pp.3-29;PaganandSchwert(1990),pp.267-290;FransesandVanDijk(1996),pp.229-235andGokcan(2000),pp.499-504.
73EkonoMSkE IdEjE I PrakSa | Broj 6 | SEPtEMBar 2012.
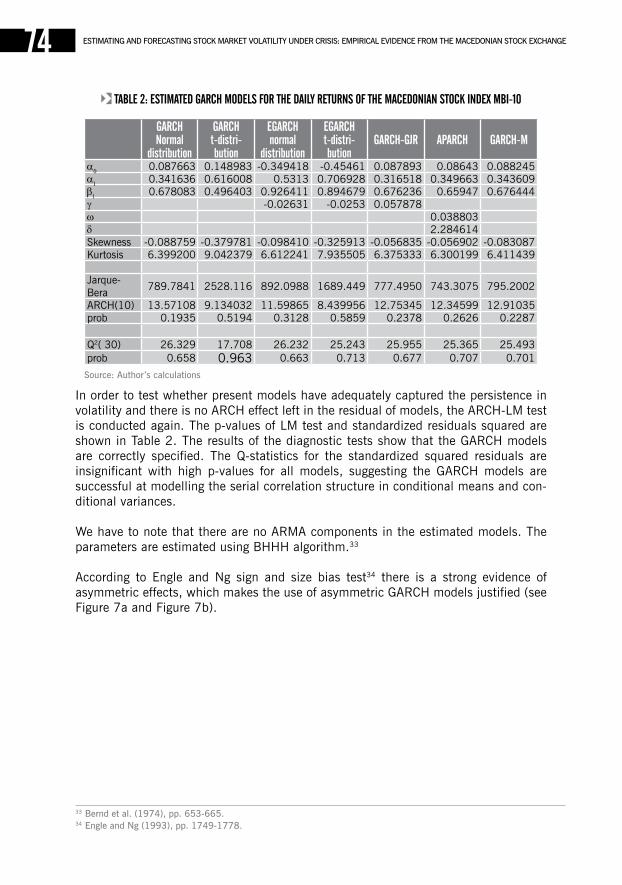
In order to test whether present models have adequately captured the persistence in volatility and there is no arCH effect left in the residual of models, the arCH-LM test is conducted again. The p-values of LM test and standardized residuals squared are shown in Table 2. The results of the diagnostic tests show that the garCH models are correctly specified. The Q-statistics for the standardized squared residuals are insignificant with high p-values for all models, suggesting the garCH models are successful at modelling the serial correlation structure in conditional means and con-ditional variances.
We have to note that there are no arMa components in the estimated models. The parameters are estimated using BHHH algorithm.33
according to Engle and Ng sign and size bias test34 there is a strong evidence of asymmetric effects, which makes the use of asymmetric garCH models justified (see Figure 7a and Figure 7b).
Source:Author’scalculations
table 2: estimated GarcH models for tHe daily returns of tHe macedonian stocK index mbi-10
GarcHnormal
distribution
GarcH t-distri-bution
eGarcH normal
distribution
eGarcH t-distri-bution
GarcH-Gjr aparcH GarcH-m
α0 0.087663 0.148983 -0.349418 -0.45461 0.087893 0.08643 0.088245α1 0.341636 0.616008 0.5313 0.706928 0.316518 0.349663 0.343609β1 0.678083 0.496403 0.926411 0.894679 0.676236 0.65947 0.676444γ -0.02631 -0.0253 0.057878ω 0.038803δ 2.284614Skewness -0.088759 -0.379781 -0.098410 -0.325913 -0.056835 -0.056902 -0.083087Kurtosis 6.399200 9.042379 6.612241 7.935505 6.375333 6.300199 6.411439
Jarque-Bera
789.7841 2528.116 892.0988 1689.449 777.4950 743.3075 795.2002
arCH(10) 13.57108 9.134032 11.59865 8.439956 12.75345 12.34599 12.91035prob 0.1935 0.5194 0.3128 0.5859 0.2378 0.2626 0.2287
Q2( 30) 26.329 17.708 26.232 25.243 25.955 25.365 25.493prob 0.658 0.963 0.663 0.713 0.677 0.707 0.701
33 Berndetal.(1974),pp.653-665.34 EngleandNg(1993),pp.1749-1778.
74 ESTIMATINGANDFORECASTINGSTOCKMARKETVOLATILITYUNDERCRISIS:EMPIRICALEVIDENCEFROMTHEMACEDONIANSTOCKEXCHANGE
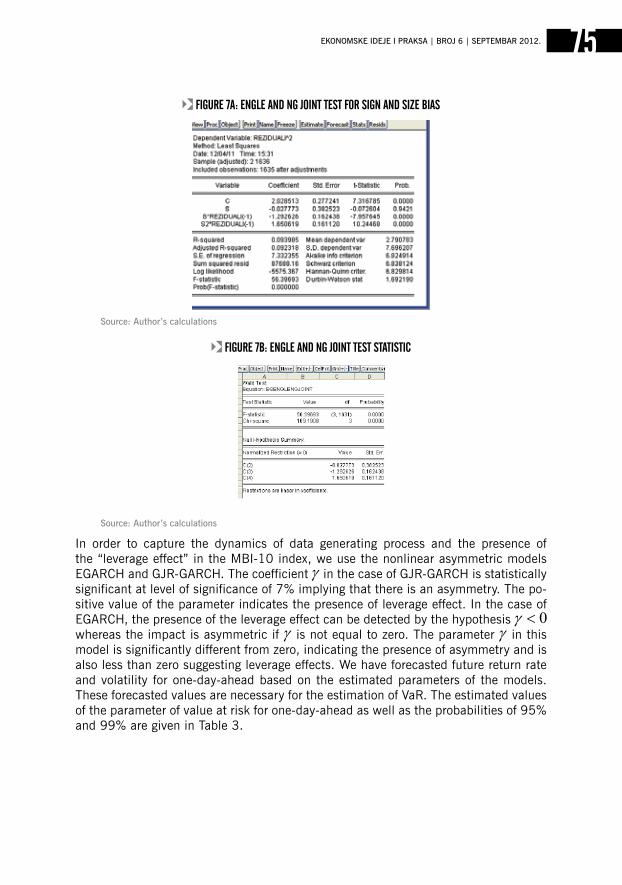
In order to capture the dynamics of data generating process and the presence of the “leverage effect” in the MBI-10 index, we use the nonlinear asymmetric models EgarCH and gJr-garCH. The coefficient in the case of gJr-garCH is statistically significant at level of significance of 7% implying that there is an asymmetry. The po-sitive value of the parameter indicates the presence of leverage effect. In the case of EgarCH, the presence of the leverage effect can be detected by the hypothesis whereas the impact is asymmetric if is not equal to zero. The parameter in this model is significantly different from zero, indicating the presence of asymmetry and is also less than zero suggesting leverage effects. We have forecasted future return rate and volatility for one-day-ahead based on the estimated parameters of the models. These forecasted values are necessary for the estimation of Var. The estimated values of the parameter of value at risk for one-day-ahead as well as the probabilities of 95% and 99% are given in Table 3.
fiGure 7a: enGle and nG joint test for siGn and size bias
Source:Author’scalculations
fiGure 7b: enGle and nG joint test statistic
Source:Author’scalculations
75EkonoMSkE IdEjE I PrakSa | Broj 6 | SEPtEMBar 2012.
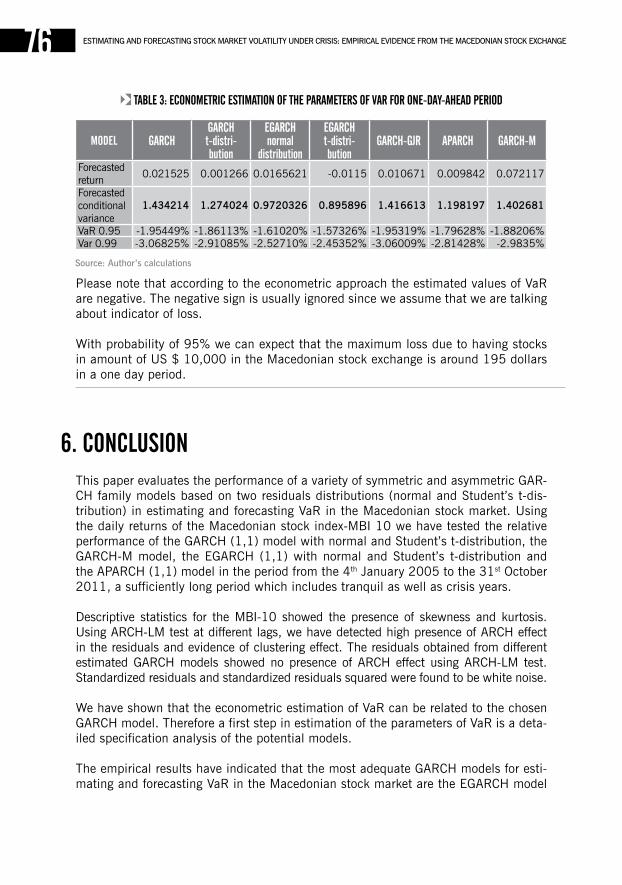
Please note that according to the econometric approach the estimated values of Var are negative. The negative sign is usually ignored since we assume that we are talking about indicator of loss.
With probability of 95% we can expect that the maximum loss due to having stocks in amount of uS $ 10,000 in the Macedonian stock exchange is around 195 dollars in a one day period.
This paper evaluates the performance of a variety of symmetric and asymmetric gar-CH family models based on two residuals distributions (normal and Student’s t-dis-tribution) in estimating and forecasting Var in the Macedonian stock market. using the daily returns of the Macedonian stock index-MBI 10 we have tested the relative performance of the garCH (1,1) model with normal and Student’s t-distribution, the garCH-M model, the EgarCH (1,1) with normal and Student’s t-distribution and the aParCH (1,1) model in the period from the 4th January 2005 to the 31st October 2011, a sufficiently long period which includes tranquil as well as crisis years.
Descriptive statistics for the MBI-10 showed the presence of skewness and kurtosis. using arCH-LM test at different lags, we have detected high presence of arCH effect in the residuals and evidence of clustering effect. The residuals obtained from different estimated garCH models showed no presence of arCH effect using arCH-LM test. Standardized residuals and standardized residuals squared were found to be white noise.
We have shown that the econometric estimation of Var can be related to the chosen garCH model. Therefore a first step in estimation of the parameters of Var is a deta-iled specification analysis of the potential models.
The empirical results have indicated that the most adequate garCH models for esti-mating and forecasting Var in the Macedonian stock market are the EgarCH model
6. conclusion
table 3: econometric estimation of tHe parameters of var for one-day-aHead period
model GarcHGarcH t-distri-bution
eGarcH normal
distribution
eGarcH t-distri-bution
GarcH-Gjr aparcH GarcH-m
Forecasted return
0.021525 0.001266 0.0165621 -0.0115 0.010671 0.009842 0.072117
Forecasted conditional variance
1.434214 1.274024 0.9720326 0.895896 1.416613 1.198197 1.402681
Var 0.95 -1.95449% -1.86113% -1.61020% -1.57326% -1.95319% -1.79628% -1.88206%Var 0.99 -3.06825% -2.91085% -2.52710% -2.45352% -3.06009% -2.81428% -2.9835%
Source:Author’scalculations
76 ESTIMATINGANDFORECASTINGSTOCKMARKETVOLATILITYUNDERCRISIS:EMPIRICALEVIDENCEFROMTHEMACEDONIANSTOCKEXCHANGE
77EkonoMSkE IdEjE I PrakSa | Broj 6 | SEPtEMBar 2012.
with Student’s t-distribution, the EgarCH model with normal distribution and the garCH-gJr model which are robust with regard to estimation.
The findings reported in this paper bear very important implications regarding Var estimation in turbulent times, market timing, portfolio selection etc. that have to be addressed by investors and other risk managers operating in emerging capital markets.
However, the main limitation of our study is that in our empirical research we have focused solely on the Macedonian stock exchange and therefore the obtained findings can not be generalized to other emerging financial markets. In the future research we will attempt to overcome this limitation by using a wider sample of emerging markets - the Eu candidate and potential candidate countries which are attractive destinations for foreign investors.
another issue for future research agenda is the inclusion of other asymmetric garCH type models and testing and comparing their predictive performance.
andjelić, g., Djaković, V. and radišić, S. (2010), “application of Var in emerging markets: a case of selected Central and Eastern European Countries” African Journal of Business Management Vol. 4, No. 17, pp. 3666-3680
Bao, Y., Lee, T. and Saltoglu, B. (2006), “Evaluating predictive performance of value-at-risk models in emerging markets: a reality check” Journal of Forecasting Vol. 25, pp. 101-128
Chen, S. and ravallion, M., 2000. How Did the Poorest Fare in the 1990s? Washington: World Bank, Development research group,
Bae, K. and Karolyi, g. a. (1994), “good News, Bad News and International Spillovers of Stock return Volatility between Japan and the u.S.” Pacific-Basin Finance Journal Vol. 2, pp. 405-438
Batten, J. a. and Szilagyi, P. g. (2011), “The Impact of the global Financial Crisis on Emer-ging Financial Markets: an Introduction”, in Batten, J. a. and Szilagyi P. g. (2011), The Im-pact of the Global Financial Crisis on Emerging Financial Markets (Contemporary Studies in Economic and Financial Analysis 93), Emerald group Publishing Limited, pp. 3-17
Bekaert, g. and Harvey, C. r. (1995), “Time-Varying World Market Integration” Journal of Finance Vol. 50, pp. 403-444
Bekaert, g. and guojun, W. (2000), “asymmetric Volatility and risk in Equity Markets” The Review of Financial Studies Vol. 13, No. 1, pp. 1-42
7. reference literature
ESTIMATINGANDFORECASTINGSTOCKMARKETVOLATILITYUNDERCRISIS:EMPIRICALEVIDENCEFROMTHEMACEDONIANSTOCKEXCHANGE78
Berndt, E., Hall, B., Hall, r. and Hausman, J. (1974), “Estimation and inference in nonline-ar structural models” Annals of Economic and Social Measurement Vol. 3, pp. 653-665
Black, F. (1976), “Studies of Stock Price Volatility Changes” in Proceedings of the 1976 Meetings of the American Statistical Association, Business and Economical Statistics Section, pp. 177-181
Braun, P. a., Nelson, D. B. and Sunier, a. M. (1995), “good News, Bad News, Volatility, and Betas” Journal of Finance Vol. 50, pp. 1575-1603
Bollerslev, T. (1986), “generalized autoregressive Conditional Heteroskedasticity” Journal of Econometrics Vol. 31, pp. 307-327
Bollerslev, T. (1987), “Conditionally Heteroskedastic Time Series Model for Speculative Prices and rates of return” Review of Economics and Statistics Vol. 69, pp. 542-547
Brooks, C. (2008), Introductory Econometrics for Finance 2nd edition, Cambridge univer-suty Press, Cambridge
Brooks, C. and Persand g. (2000), “a word of caution on calculating market based mini-mum capital risk requirements” Journal of Banking and Finance Vol. 24, pp. 1557-1574
Campbell, J. Y. and Hentshel, L. (1992), “No News is good News: an asymmetric Model of Changing Volatility in Stock returns” Journal of Financial Economics Vol. 31, pp. 281-318
Chiu, C. L., Lee, M. C. and Hung, J. C. (2005), „Estimation of Value-at-risk under jump dynamics and asymmetric information” Applied Financial Economic Vol. 15, pp. 1095-1106
Cheung, Y. and Ng, L. (1992), “Stock Price Dynamics and Firm Size: an Empirical Investi-gation” Journal of Finance Vol. 47, pp. 1985-1997
Christie, a. a. (1982), “The Stochastic Behavior of Common Stock Variances – Value, Leve-rage and Interest rate Effects” Journal of Financial Economics Vol. 10, pp. 407-432
Curto, J. D., Pinto, J. C. and Tavares, g. N. (2009), “Modelling stock markets’ volatility using garCH models with Normal, Student’s t and stable Paretian distributions” Statistical Papers Vol. 50 No. 2, pp. 311-321
Da Silva, a., Beatriz, V. and de Melo Mendes, B. (2003), “Value-at-risk and extreme returns in asian stock markets” International Journal of Business Vol. 8, pp. 17-40.
Dimitrakopoulos, D. N., Kavussanos, M. g. and Spyrou, S. I. (2010), “Value at risk models for volatile emerging markets equity portfolios” The Quarterly Review of Economics and Finance Vol. 50, No. 4, pp. 515-526
Ding, Z., Engle, r. and granger C. (1993), “a long memory property of stock market returns and a new model” Journal of Empirical Finance Vol. 1, pp. 83-106
Dufee, g. r. (1995), “Stock returns and Volatility: a Firm Level analysis” Journal of Finan-cial Economics Vol. 37, pp. 399-420
79EkonoMSkE IdEjE I PrakSa | Broj 6 | SEPtEMBar 2012.
Engle, r. F. (1982), “autoregressive conditional heteroscedasticity with estimates of the variance of uK inflation” Econometrica Vol. 50, pp. 987-1008
Engle, r. F. (2001), “garCH 101: The use of arCH/garCH Models in applied Econome-trics” Journal of Economic Perspectives Vol. 15, No. 4, pp. 157-168
Engle, r. F. and Bollerslev, T. (1986), “Modelling the persistence of conditional variance” Econometric Reviews Vol. 5, pp. 1-50
Engle, r. F., Lilien, D. M. and robbins, r. P. (1987), „Estimating Time Varying risk Premia in the Term Structure: The arCH-M Model” Econometrica Vol. 55, pp. 391-407
Engle, r. F. and Ng, V. K. (1993), “Measuring and testing the impact of news on volatility” Journal of Finance Vol. 48, pp. 1749-1778
Fama, E. F. and richard, r. (1968), “Some Properties of Symmetric Stable Distributions” Journal of the American Statistical Association Vol. 63, pp. 817-838
Franses, P. H. and Van Dijk, D. (1996), “Forecasting stock market volatility using (non-line-ar) garCH models” Journal of Forecasting Vol. 15, pp. 229-235
French, K., Schwert, g. and Stambaugh, r. (1987), “Expected stock returns and volatility” Journal of Financial Economics Vol. 19, pp. 3-29
glosten, L. r., Jagannathan, r. and runkle, D. E. (1993), ”On the relation Between the Expected Value and the Volatility of the Nominal Excess return on Stocks” Journal of Finan-ce Vol. 48, pp. 1779-1801
gokcan, S. (2000), “Forecasting volatility of emerging stock markets: Linear versus non-linear garCH models” Journal of Forecasting Vol. 19, pp. 499-504
Hagerud, g. E. (1997), “Modelling Nordic Stock returns with asymmetric garCH models” Working Paper Series in Economics and Finance from Stockholm School of Economics Vol. 164, pp. 1-26
http://www.mse.org.mk.html [accessed 09/04/12]
Jorion, P. (2006), Value at Risk: The New Benchmark for Managing Financial Risk, 3rd Edition, Mcgraw-Hill.
Knight, J. and Satchell, S. (1998), Forecasting Volatility in the Financial Markets, Butterworth-Heinemann, Oxford.
Kovačić, Z. (2007), “Forecasting volatility: Evidence from the Macedonian stock exchange” unpublished MPRA Paper No. 5319, pp. 1-44
Magnusson, g. and andonov, S. (2002), “Basel capital adequacy ratio and the Iceland banking sector: Quantitative impact, structural changes and optimality considerations” IOES working paper series, pp. 1-51
Mandelbrot, B. (1963), “The Variation of Certain Speculative Prices” Journal of Business Vol. 36, No. 4, pp. 349-419
80
Mokni, K., Mighri, Z. and Mansouri, F. (2009), “On the Effect of Subprime Crisis on Value-at-risk Estimation: garCH Family Models approach” International Journal of Economics and Finance Vol. 1, No. 2, pp. 88-105
McMillan, D. g. and Speight, a. E. H. (2007), “Value-at-risk in Emerging Equity Markets: Comparative Evidence for Symmetric, asymmetric, and Long-Memory garCH Models” International Review of Finance Vol. 7, pp. 1–19
Nelson, D. B. (1991), “Conditional Heteroskedasticity in asset returns: a New approach” Econometrica Vol. 59, pp. 347-370
Ng, a. (2000), “Volatility Spillover Effects from Japan and the uS to the Pacific-Basin” Journal of Monetary Economics Vol. 19, pp. 207-233
Pagan, a. r. and Schwert, g. W. (1990), “alternative Models for Conditional Stock Volati-lity” Journal of Econometrics Vol. 45, pp. 267-290
Parrondo, J. M. r. (2004), Calculation of the Value at Risk in emerging markets, research Project.
Schwert, g. W. (1990), “Stock Volatility and the Crash of ’87” Review of Financial Studies Vol. 3, pp. 77-102
Tsay, r. S. (2010), Analysis of financial time series, Wiley.
Valentinyi-Endresz, M. (2004), “Structural breaks and financial risk management” Magyar Nemzeti Bank MNB Working paper No. 2004/11, pp. 1-60
Vilasuso, J. (2002), “Forecasting exchange rate volatility” Economics Letters Vol. 76, pp. 59-64
Zikovic, S. and aktan, B. (2009), “global financial crisis and Var performance in emerging markets: a case of Eu candidate states - Turkey and Croatia” Journal of Economics and Business, Proceedings of Rijeka Faculty of Economics Vol. 27, No. 1, pp. 149-170
Zikovic, S. and Bezić, H. (2006), “Is historical simulation appropriate for measuring market risk? a case of countries candidates for Eu accession” Proceedings of the CEDIMES confe-rence, Ohrid, Macedonia, 23-27th March, pp. 1-20
Zikovic, S. and Filler, r. K. (2009), “Hybrid Historical Simulation Var and ES: Performance in Developed and Emerging Markets” CESifo Working paper Series No. 2820, pp. 1-39.
ESTIMATINGANDFORECASTINGSTOCKMARKETVOLATILITYUNDERCRISIS:EMPIRICALEVIDENCEFROMTHEMACEDONIANSTOCKEXCHANGE
accountinG for business combinations
eva mijatović1
[email protected] , [email protected]
jel KlasifiKacija: m41
1 UniversityDepartmentofProfessionalStudies,UniversityofSplit
81EkonoMSkE IdEjE I PrakSa | Broj 6 | SEPtEMBar 2012.
ACCOUNTINGFORBUSINESSCOMBINATIONS82
Key Words:merGers, acQuisitions, acQuisition cost, GoodWill, consolidation
abstract: Accounting is the last phase in M&A activity. After a successful business combination; merger or acquisition, it is necessary to prepare consolidated financial statements. In Croatia it is determinate by International Accounting Standards, International Financial Reporting Standards, Croatian Financial Reporting Standards, the Accounting Act, the Corporations Act and the Takeover Act. This paper will present new accounting methods according to audited International Financial Reporting Standard 3 and International Accounting Standard 27. The revised IFRS 3 and IAS 27 introduce many changes in the accounting for business combinations and the financial statements. These changes affect on the amount of goodwill and recognized value of non-controlling stake in the year of acquisition, and also in the years afterward. Under the new IFRS 3, in every business combination company enter, the company have to choose whether to measure non-controlling stake in the combined company or total fair value of net identifiable assets of enterprises obtain to the proportional share. Choice of alternative solutions may result in the recognition of goodwill in relation to 100% of the business (applying the full fair value option and the resulting allocation of goodwill and non-controlling interest) or just the recognition of goodwill acquired percentage shares. According to the revised IFRS 3 and IAS 27, all business combinations are considered acquisitions. Acquired assets and assumed liabilities are taken from the target company account-ing by their assumed fair value using the acquisition method of accounting (formerly the purchase method).There is a difference if a business combination was financed by money or it was an acquisition through other forms of property. The last step in applying the purchase method is to determine the amount of goodwill resulting from business combinations. There is a significant difference in treatment of goodwill between Inter-national Accounting Standards and Croatian Financial Reporting Standards. Small and medium-sized companies do the bookkeeping according to Croatian Financial Report-ing Standards and the large enterprises and entrepreneurs that list securities on stock exchanges use the International Financial Reporting Standards. The process of consoli-dation is a very complex process, and it will be presented by phases. The process of consolidation of the financial statements is operationally implemented in special con-solidation work-notes which will be presented. According to IAS 27, a parent company doesn’t need to make the consolidated financial statements in certain situations. This paper will present situations in which the parent needs and does not need to prepare consolidated financial statements..
Investments in long-term financial assets, which include mergers and acquisitions are de-fined by IaS2 27, IaS 28, IaS 31, IaS 39, IFrS 3, CFrS3 2 (NN 30/08.) , the accounting act (NN 109/07), the Corporations act (NN 111/93., 34/99., 52/99., 118/03., 107/07.) the Takeover act (NN 109/07.). By investing in long-term assets the acquirer obtains aliquot parts of equity in another company. Shares can be acquired by direct purchase either from companies which issue them or their shareholders and indirectly, from brokers and dealers at stock exchanges. Each of this transaction of shares has its own acquisition cost. The elements included in the acquisition cost are as follows: purchase price of shares, brokerage and banking fees and excise duties, or other transfer costs. acquisition of shares can be made in several ways but the most common of are purchase for cash, share exchange or exchange for other securities. When the acquirer gets stocks by swapping them with target firm stocks, the purchase price – which is the most important part of the acquisition cost, re-presents the fair value of the acquirer's stock and if the acquisition is done by exchanging for non-monetary assets / services, the purchase price is based on the fair value of the acquirer's assets / services4. according to the accounting act (NN 109/2007) in Croatia there is a dual accounting system; small and medium-sized companies do the bookkeeping according to CFrS and the large enterprises and entrepreneurs that list securities on stock exchanges use the IFrS5. CFrS-2 is responsible for business combinations accounting for small and medium-sized enterprises and IFrS 3 is responsible for large businesses and entrepreneurs that list securities on stock exchanges. In terms of the initial calculation between these two accounting standards there are no significant differences because CFrS has taken over all relevant provisions from IFrS 3. However, in the subsequent evaluation of goodwill, there are some important differences between the IFrS and CFrS.
IFrS 3 provides that in almost all mergers one subject (the acquirer) gets control over the target company. all business combinations must be balanced using the purchase met-hod, because the equity method is no longer permitted. applying the purchase method involves the following steps: 1. identification of the 'acquirer' – the combining entity that obtains control of the
acquiree [IFrS 3.7] 2. determination of the 'acquisition date' – the date on which the acquirer obtains
control of the acquiree [IFrS 3.8] 3. recognition and measurement of the identifiable assets acquired, the liabilities
assumed and any non-controlling interest (NCI, formerly called minority interest) in the target company
4. recognition and measurement of goodwill or a gain from a bargain purchase.
83
1. introduction
2 International accounting Standards3 CroatianFinancialReportingStandards4 Orsag,S.andGulinD.(1996)Poslovnekombinacije,Zagreb,Hrvatskazajednicaračunovođaifinancijskihdjelatni-
ka, p. 3065 InternationalFinancialReportingStandards
EkonoMSkE IdEjE I PrakSa | Broj 6 | SEPtEMBar 2012.
2. tHe accountinG metHods for business combinations
applying the purchase method implies the costs of acquiring shares in another company must be established. They consist of two parts: - basic cost and - all direct costs that are directly connected with the acquisition. Direct costs of acqu-
isition depend directly on the pricing of shares purchased6: • Money acquisition is a direct cost in the form of money paid • Acquisition through other forms of property is a direct cost that is determined
by the fair value of assets which is given on the day of exchange, for example, if the acquirer has issued debt securities where the payment is not done imme-diately, but in some future periods, the acquisition cost represents the present value all future payments (principal and interest); if the acquisition is paid by someone`s own equity securities, the acquisition cost is determined by the market price of securities on the day of exchange , but in case the market does not work, the cost of acquisition is determined by the share of the given equity securities in the total value of the acquiring company.
The acquirer is the entity company that obtains control over the other merging compa-nies. Control here means the power of deciding on the financial and operating policies of the acquired company so as to obtain benefits from its activities. The main indicator of having control is having more than half voting rights the acquired company, unless such ownership does not provide control. Control usually exists if the acquirer owns more than 50% of the voting shares7. However, there are situations when the merging entity has less than half voting rights, and nevertheless has control over another entity. Specific instances of such control are as follows: 1. a majority vote rights obtained through an agreement with other investors 2. power to govern the operations of another entity under a statute or agreement 3. power of appointment and removal of most members of the board of another entity 4. power of acquiring a majority of votes at meetings of other government entity.
Besides these there are additional criteria for determining the acquirer: 1. when the fair value of one entity is significantly higher than the fair value of the
other entity, the larger entity is more likely the acquirer 2. if the business combination is carried out by exchanging voting rights for money,
the entity that gives the money is likely to become the acquirer 3. if the management board election of one entity is dominated by the board of the
other entity, the dominant is likely to become the acquirer.
The next step in applying the purchase method is the determination and recognition of assets and liabilities of the acquired company. In the balance sheet of the acquirer the following requirements must be met: 1. assets are recognized only if it is probable that their future economic benefits will
flow into the acquirer company 2. liabilities are recognized only when it is probable that the outflow of resources
related to their settlement will be economically beneficial for the acquirer 3. the acquirer is able to assess their cost of acquisition or the fair value.
ACCOUNTINGFORBUSINESSCOMBINATIONS84
6 Bubić,J.(2011)FinancijskoračunovodstvoII–računovodstveniiporeznikoncepti, Split, redak, p. 54.7 Pervan,Ivica(2009):IskazivanjeivrednovanjedugotrajneimovinenamijenjeneprodajipremaMSFIiHSFI,Raču-novodstveno-financijskeinformacije-54((2009),10;p.1-5
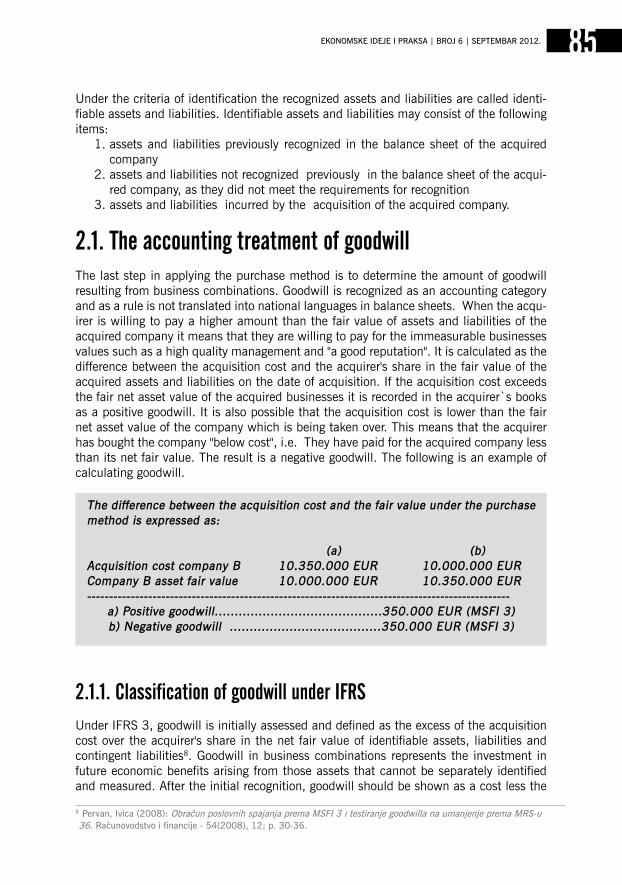
under the criteria of identification the recognized assets and liabilities are called identi-fiable assets and liabilities. Identifiable assets and liabilities may consist of the following items: 1. assets and liabilities previously recognized in the balance sheet of the acquired
company 2. assets and liabilities not recognized previously in the balance sheet of the acqui-
red company, as they did not meet the requirements for recognition 3. assets and liabilities incurred by the acquisition of the acquired company.
2.1. The accounting treatment of goodwillThe last step in applying the purchase method is to determine the amount of goodwill resulting from business combinations. goodwill is recognized as an accounting category and as a rule is not translated into national languages in balance sheets. When the acqu-irer is willing to pay a higher amount than the fair value of assets and liabilities of the acquired company it means that they are willing to pay for the immeasurable businesses values such as a high quality management and "a good reputation". It is calculated as the difference between the acquisition cost and the acquirer's share in the fair value of the acquired assets and liabilities on the date of acquisition. If the acquisition cost exceeds the fair net asset value of the acquired businesses it is recorded in the acquirer`s books as a positive goodwill. It is also possible that the acquisition cost is lower than the fair net asset value of the company which is being taken over. This means that the acquirer has bought the company "below cost", i.e. They have paid for the acquired company less than its net fair value. The result is a negative goodwill. The following is an example of calculating goodwill.
2.1.1. classification of goodwill under ifrsunder IFrS 3, goodwill is initially assessed and defined as the excess of the acquisition cost over the acquirer's share in the net fair value of identifiable assets, liabilities and contingent liabilities8. goodwill in business combinations represents the investment in future economic benefits arising from those assets that cannot be separately identified and measured. after the initial recognition, goodwill should be shown as a cost less the
85EkonoMSkE IdEjE I PrakSa | Broj 6 | SEPtEMBar 2012.
The difference between the acquisition cost and the fair value under the purchase method is expressed as:
(a) (b)acquisition cost company B 10.350.000 eUR 10.000.000 eURcompany B asset fair value 10.000.000 eUR 10.350.000 eUR-------------------------------------------------------------------------------------------------
a) positive goodwill..........................................350.000 eUR (msFI 3)b) negative goodwill ......................................350.000 eUR (msFI 3)
8Pervan,Ivica(2008):ObračunposlovnihspajanjapremaMSFI3itestiranjegoodwillanaumanjenjepremaMRS-u36.Računovodstvoifinancije-54(2008),12;p.30-36.
accumulated impairment losses. Companies liable to IFrS cannot depreciate goodwill any more but it must be tested for impairment once a year (or more frequently) as per IaS 369.
If goodwill doesn’t appear, but there is an excess of acquirer's share in the net fair value of identifiable assets, liabilities and contingent liabilities of the acquired company over the cost of business merger it is necessary to examine the process of recognizing and evaluating of assets, liabilities and contingent liabilities of acquired companies, as well as evaluating the cost of acquisition. Such a review procedure stems from the view that the positive difference should arise primarily because of the overvaluation of assets, underestimation of liabilities / contingent liabilities and the overvaluation of the cost of a business merger. If a positive difference appears again it must be recognized immediately as income/revenue in the income statement.
as for the "old" goodwill, recognized and depreciated according to IaS 22, the depreciati-on should have been accomplished by the end of 2005. Furthermore, from 2005 on, all companies having in their balance sheets the “old" positive goodwill should have elimina-ted its accumulated depreciation and simultaneously reduced the amount of goodwill for the same amount. (IFrS 3). On the other hand, companies with a negative goodwill in their balance sheets should have eliminated it from the balance sheets by increasing the balance on retained profits (IFrS 3). The above mentioned guidelines for the treatment of the "old" positive and negative goodwill resulting from M&a are valid for any goodwill arising from the purchase of shares in affiliated companies under IaS 28 (IFrS 3)10.
2.1.2. classification of goodwill as per cfrs-2This section will present the differences that occur between IFrS 3 and CFrS 2. as the Croatian Financial reporting Standards 2 are adapted to Croatian entrepreneurs and acts in accordance with IFrS 3 the differences are few and they are primarily reflected on the way of recognition of costs associated with acquisition and assessment of goodwill11.
according to IFrS 3 acquisition-related costs are costs that are incurred by the business merger. They are treated as expenses and are not included in the purchase price. They usually include the following: - compensation to counsellors, accountants, appraisers and consultants - general and administrative expenses - the costs of equity and debt securities issue.
Costs associated with acquisition should be treated as expenses by the acquirer with the exception of equity and debt securities issue costs which should be treated in accordance with IaS 32 and IaS 39. On the other hand, according to CFrS 2, acquisition-related costs are included in the purchase price.
ACCOUNTINGFORBUSINESSCOMBINATIONS86
9 Pervan,Ivica(2006):MSFI3-novistandardzaposlovnaspajanja.Financijeiporezi:časopiszapoduzećaibanke,obrtnike,proračuniproračunskekorisnike,neprofitneiostaleorganizacije13(2006),6;p.46-56
10 Pervan,Ivica(2010):Računovodstvoposlovnihspajanja:premarevidiranomMSFI-u3.Financijeiporezi-17(2010),9;p.19-27
11 Zakonoračunovodstvu,Narodnenovinebr.109/07,Zagreb
The revised IFrS 3 brings forth a new approach to the initial assessment of goodwill. goodwill is defined as the difference between: • the total amount of the consideration transferred, possible uncontrolled interest in a
business combination and the fair value of the stages of acquisition of equity shares to the acquirer in the acquiree previously held
• the net amount of the identifiable assets acquired and the liabilities assumed on the date of acquisition, assessed in accordance with IFrS 3.
Positive goodwill is an intangible fixed asset among the acquirers’ balance sheet positi-ons. On the acquisition date goodwill should be reported as excess cost of the business combination in relation to the acquirer's share in the fair value of the net assets of the target company.
after the initial recognition, goodwill should be presented as the cost less any accumula-ted impairment losses. goodwill must be tested annually for impairment in accordance with IaS 36. This approach to valuation of goodwill may or may not lose its value over time. Subsequent accounting for goodwill according to CFrS-2 shows that companies liable to CFrS should depreciate goodwill within a period of 5 years12.
Negative goodwill should be recognized either as an expense or income in the acquirer`s income statement. as negative goodwill is a result of differences when the cost of busi-ness combination is less than the fair value of net assets of acquired companies, it should be reported as income.
2.2. Consolidation of financial statementsThe concept of consolidation in the accounting and financial theory in the context of the business combination or merger and acquisition has several meanings13: - a business combination in which one, newly formed company acquires two or more
enterprises which cease to exist after the acquisition as legal subjects - in general terms, the consolidation process is considered acquisition and merger - it is a merger of the financial statements of the parent company and its subsidiary.
2.2.1. the consolidated financial statementsusers of the consolidated financial statements are the owners, management, sharehol-ders and investors in long-term equity investments. The purpose of preparing the consoli-dated financial statements is based on users` needs. It is assumed that the consolidated financial statements are more important than basic financial statements because the consolidated financial statements are required for presenting a fair value when a com-pany has a direct or indirect control over other companies. By having a control means having a strength or power of a company to manage the financial and operating policies of other companies.
87
12 Pervan,Ivica(2009):IskazivanjeivrednovanjedugotrajneimovinenamijenjeneprodajipremaMSFIiHSFI,Računo-vodstveno-financijskeinformacije-54((2009),10;p.1-5
13 Beams,A.F.,(1992)advanced accounting,NewJersey,PrenticeHall,str.942.
EkonoMSkE IdEjE I PrakSa | Broj 6 | SEPtEMBar 2012.
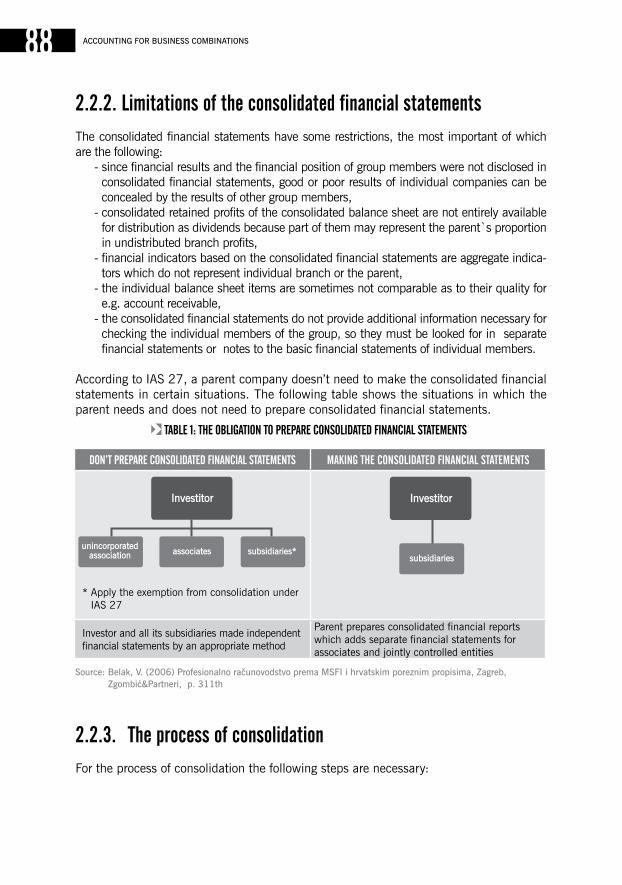
2.2.2. limitations of the consolidated financial statementsThe consolidated financial statements have some restrictions, the most important of which are the following: - since financial results and the financial position of group members were not disclosed in
consolidated financial statements, good or poor results of individual companies can be concealed by the results of other group members,
- consolidated retained profits of the consolidated balance sheet are not entirely available for distribution as dividends because part of them may represent the parent`s proportion in undistributed branch profits,
- financial indicators based on the consolidated financial statements are aggregate indica-tors which do not represent individual branch or the parent,
- the individual balance sheet items are sometimes not comparable as to their quality for e.g. account receivable,
- the consolidated financial statements do not provide additional information necessary for checking the individual members of the group, so they must be looked for in separate financial statements or notes to the basic financial statements of individual members.
according to IaS 27, a parent company doesn’t need to make the consolidated financial statements in certain situations. The following table shows the situations in which the parent needs and does not need to prepare consolidated financial statements.
2.2.3. The process of consolidationFor the process of consolidation the following steps are necessary:
ACCOUNTINGFORBUSINESSCOMBINATIONS88
table 1: tHe obliGation to prepare consolidated financial statements
don’t prepare consolidated financial statements maKinG tHe consolidated financial statements
* apply the exemption from consolidation under IaS 27
Investor and all its subsidiaries made independent financial statements by an appropriate method
Parent prepares consolidated financial reports which adds separate financial statements for associates and jointly controlled entities
Source:Belak,V.(2006)ProfesionalnoračunovodstvopremaMSFIihrvatskimporeznimpropisima,Zagreb,Zgombić&Partneri,p.311th
a) The bookkeeping amount of the parent investment in each subsidiary and the parent part of the equity of each subsidiary get eliminated;
b) Inter-group accounts and inter-group transactions, including sales, expenses and dividends, are eliminated in full;
c) unrealized profits arising from inter-group transactions, which are included in the bookkeeping amount of assets such as inventories and fixed assets, are eliminated in full;
d) unrealized losses resulting from inter-group transactions; that are deducted when we get at the bookkeeping amount of assets are also eliminated unless costs can be compensated;
e) Time differences arising from the elimination of unrealized profits and losses re-sulting from inter-group transactions have been processed in accordance with IaS 12, Income Taxes;
f) Minority interests in net profit of consolidated subsidiaries for the reporting period are identified and aligned with the profit of the group to arrive at net income attri-butable to holders of the parent, and
g) Minority interests in net assets of consolidated subsidiaries are identified and presented in consolidated balance sheet separately from liabilities and the parent shareholders' equity. Minority interests in net assets consist of:
(I) The amount on the date of the original merger calculated in accordance with International accounting Standard 22, accounting for business mer-gers, and
(II) The minority's share of equity movements from the date of the merger.
The process of consolidation of the financial statements is operationally implemented in special consolidation work-notes and is carried out in several phases as follows: 1. determining the cost of investment in shares of a subsidiary (or associate) entre-
preneurs, 2. determining the bookkeeping value of acquired shares, 3. determining the difference between investment cost and the bookkeeping value of
acquired shares, 4. recording an acquisition transaction of subsidiary in a parent main book 5. implementation of the elimination entries and recording the difference between
the acquisition cost and bookkeeping value of acquired shares of the subsidiary company,
6. creation of work-notes for the consolidation of financial statements and 7. the preparation of consolidated financial statements.
The financial statements of the parent and its subsidiaries get added at the same items as if they were one accounting entity; mutual transactions get eliminated. Consolidation work-notes represent working material necessary for the consolidation of financial state-ments. They contain items of the financial statements both of the parent company and its subsidiaries that are consolidated. Consolidation is based on adding and eliminating or cancellation of inter-company items. In the consolidation work-notes special columns are provided for elimination entries. The last column represents the result of consolida-tion of each financial item of the consolidated report.
89EkonoMSkE IdEjE I PrakSa | Broj 6 | SEPtEMBar 2012.
Beams, a.F., (1992) Advanced Accounting, New Jersey, Prentice Hall
Belak, V. (2006) Profesionalno računovodstvo prema MSFI i hrvatskim poreznim propisima, Zagreb, Zgombić&Partneri
Bubić, J. (2011) Financijsko računovodstvo II – računovodstveni i porezni koncepti, Split, redak
International Financial reporting Standards
Orsag, S. (et al.) (1996) Poslovne kombinacije, Zagreb, Hrvatska zajednica računo-vođa i financijskih djelatnika, p. 306
Pervan, I. (2006): MSFI 3 - novi standard za poslovna spajanja. Financije i porezi : časopis za poduzeća i banke, obrtnike, proračun i proračunske korisnike, neprofitne i ostale organizacije 13(2006),6 ; p. 46-56
2.2.4. minority interestThe minority interest represents that part of the value of the subsidiaries` net assets which is not controlled by the parent. It is presented in the balance sheet (a special part of the principal) in the form of a row or column in the work-notes for consolidation. The minority interest is therefore an integral part of the consolidated balance sheet, visible in the profit or loss account which is not subject to the parent company`s control. It can be calculated by multiplying the total amount of capital with the subsidiary minority, e.g. 4.000.000x20% = 800,000. That means that this part of the equity in the consolidated balance sheet is not under the control of the parent.
In accordance with the legal definition of individual states and the accounting standar-ds defined by the International accounting Standards, International Financial reporting Standards, financial entrepreneurs and managers are required to comply in all situati-ons related with business combinations; mergers and acquisitions. This paper reviews the method of accounting for business combinations, accounting for goodwill and con-solidation procedures performed after a business combination under the International accounting Standards, International Financial reporting Standards and the Croatian Fi-nancial reporting Standards. The accounting records of the business combination taken by mergers and acquisitions should be conducted in accordance with those rules of the profession.
ACCOUNTINGFORBUSINESSCOMBINATIONS90
3. conclusion
4. reference literature

Pervan, I. (2008): Obračun poslovnih spajanja prema MSFI 3 i testiranje goodwilla na umanjenje prema MRS-u 36. računovodstvo i financije - 54(2008), 12; p. 30-36.
Pervan, I. (2009): Iskazivanje i vrednovanje dugotrajne imovine namijenjene prodaji prema MSFI i HSFI, računovodstveno-financijske informacije - 54((2009),10 ; p. 1-5
Pervan, I. (2010): Računovodstvo poslovnih spajanja : prema revidiranom MSFI-u 3, Financije i porezi-17(2010), 9 ; p. 19-27
Zakon o preuzimanju dioničkih društava Narodne novine 109/07
Zakon o računovodstvu Narodne novine 109/07
Zakon o trgovačkim društvima Narodne novine 152/2011
91EkonoMSkE IdEjE I PrakSa | Broj 6 | SEPtEMBar 2012.


93EkonoMSkE IdEjE I PrakSa | Broj 6 | SEPtEMBar 2012.
tranzicija -zamisli i ostvarenja
prof. dr boŽidar cerović
Centar za izdavačku delatnost Ekonomskog fakulteta u Beogradu, 2012.
Knjiga „Tranzicija - Zamisli i ostvarenja“, autora Božidara Cerovića, redovnog profeso-ra Ekonomskog fakulteta u Beogradu, predstavljena na 675 strana teksta, je rezultat autorovog pisanja i izučavanja procesa tranzicije koje traje više od dvadeset godina. Naime, na Ekonomskom fakultetu u Beogradu je još davne 1992. godine, među pr-vima u svetu, zaživeo predmet Ekonomika tranzicije. Osmišljavanje i izvođenje ovog predmeta je od samog početka povereno prof. Ceroviću, što je podstaklo i usmerilo njegova dalja istraživanja ka ovoj temi. Sa ove distance, ne može se u potpunosti ra-zumeti težina i kompleksnost zadatka koji je tada pred sobom imao prof. Cerović, da oformi konzistentan i didaktički prihvatljiv predmet o nečemu što je tek bilo ideja na početku procesa realizacije.
razlozi neuspeha tranzicionog procesa, kao i njegove dobre i loše strane, prvi put su u vidu jedne ovako obimne i sistematizovane studije dostupni javnosti u Srbiji. Proces tranzicije je tada bio na samom početku, sa neizvesnim ishodima, brojnim prepreka-ma, različitom dinamikom i specifičnostima od zemlje do zemlje. u skladu sa osnov-nom idejom, autor postepeno vodi čitaoca od početnih zamisli kako tranzicija treba da izgleda i šta se od nje očekuje, pa sve do ostvarenja, koja su u današnje vreme već poznata realnost.
Prikaz knjigeProf. dr Biljana rakić, redovni profesor
Ekonomskog fakulteta u Nišu
PRIKAZKNJIGE„TRANZICIJA-ZAMISLIIOSTVARENJA“94upravo zato, knjiga je i organizovana tako da se sastoji iz dve velike celine. S obzirom na obim i strukturu teksta, prva celina pod naslovom Zamisli, potpuno opravdano nosi naziv Knjiga prva. Druga celina, tj. Knjiga druga, je naslovljena Ostvarenja i poput prve, podeljena je u dva dela. Iako sadrži ideje i tekstove, nadograđivane tokom više od dve decenije, tekst knjige deluje iznenađujuće koherentno, konzistentno i aktuelno.
Strukturu knjige čine 26 poglavlja, logički grupisana u četiri dela. Pri tome, prva dva dela čine jednu celinu i bave se osnovnim idejama tranzicije i specifičnostima procesa privatizacije tokom tranzicije, dok druga dva dela čine celinu koja se prvenstveno bavi iskustvima tranzicionih zemalja sa sprovedenim reformama, kao i modelima i faktorima rasta privreda u tranziciji. Zaključni deo knjige posvećen je procesu tranzicije u Srbiji i postignutim rezultatima u dosadašnjem periodu.
Početni deo knjige, Tranzicija: osnovne ideje, čini pet poglavlja u kojima autor nastoji da, pre svega, istakne ekonomski aspekt tranzicije, dok ideološka i politička viđenja ovog procesa ostavlja po strani. On smatra da definicija tranzicije kao „prelaza iz socijalizma u kapitalizam“ može biti nepouzdana i može raspravu o jednom važnom savremenom fenomenu da nepotrebno prevede sa ekonomskog na manje pouzdan teren individualnih gledišta, vrednosnih sudova i opredeljenja. Zato autor tranziciju posmatra kao ekonomski fenomen, koji je sastavni deo globalnih promena u svetskoj ekonomiji krajem XX veka.
u prvom poglavlju se polazi od definisanja osnovnih sadržaja procesa tranzicije koga čine: makroekonomska stabilizacija, izgradnja tržišta i tržišnih institucija, svojinsko i po-slovno restrukturiranje preduzeća, kao i liberalizacija i deregulacija u ekonomskoj politici. Pri tome, set preduzetih mera i instrumenata kao i njihov obim, zavise od stanja sistema svake pojedinačne privrede. u nastavku se prati razvoj ekonomske misli tokom XX veka i nastoji da definiše mesto tranzicije i tržišne privrede u savremenom okruženju. u trećem poglavlju se daje prikaz nekoliko osnovnih modela tržišne privrede kojima teže privrede u tranziciji, kao mogućim stanjima ekonomske strukture, ukazujući pri tome na njihove zajedničke karakteristike koje mogu da posluže kao uputstvo i iskustvo privredama u tranziciji prilikom izgradnje sopstvenog modela tržišne ekonomije.
Makroekonomska stabilizacija – početna tačka tranzicije, je poglavlje koje se bavi sta-bilizacionom makroekonomskom politikom u privredama koje su tada kretale u proces tranzicije, pri čemu je posebna pažnja posvećena antiinflacionoj politici, imajući u vidu fenomen hiperinflacije sa kojim je bila suočena naša privreda početkom devedesetih godina prošlog veka. glavnim uzročnikom hiperinflacije autor smatra budžetski deficit, koga je država pokrivala putem tzv. inflacionog poreza. upravo zato se sugeriše (pored promene i primene monetarne politike) i neophodna promena fiskalne politike, koja bi bila usmerena na trajnu eliminaciju deficitnog finansiranja javne potrošnje, a sve sa ci-ljem obezbeđenja kredibiliteta novih politika u očima ekonomskih aktera i ostvarivanja preko potrebne makroekonomske stabilizacije.
u petom poglavlju, koje govori o restrukturiranju i tranzicionoj recesiji, se razmatra restrukturiranje kao neizbežan deo procesa tranzicije. analiziraju se dva tipa poslovnog restrukturiranja preduzeća: defanzivno - koje dovodi do smanjivanja troškova usled sma-
njenja broja zaposlenih, zatvaranja pojedinih pogona ili reorganizacije i strateško – koje dovodi do novih i većih investicionih ulaganja usled restrukturiranja ili otvaranja novih fabrika i pogona, novih tehnologija i proizvoda. u nastavku se ukazuje na tranzicionu re-cesiju do koje dolazi usled pada proizvodnje i zaposlenosti na početku procesa tranzicije. Opšti zaključak koji se može izvući iz početnih empirijskih istraživanja jeste da brzina reformi predstavlja glavni faktor rasta privreda u tranziciji i da se brzim reformama može nadjačati uticaj nepovoljnih početnih uslova zemlje. Najzad, akcenat se stavlja i na neza-poslenost kao posledicu tranzicione recesije, koja predstavlja veliki problem čiji su efekti dugotrajni i prevazilaze period tranzicione recesije.
Drugi deo se bavi privatizacijom, kao ključnim procesom tranzicije i posvećen je ispi-tivanju ekonomskog smisla, razloga i značaja privatizacije, kao jedne od najobimnijih i najdelikatnijih promena u privredama u tranziciji. Kroz sedam poglavlja, autor se većim delom bavi specifičnostima privatizacije društvene svojine jugoslovenske privrede. upr-kos činjenici da su te specifičnosti mogle da doprinesu bržem i lakšem prilagođavanju jugoslovenske privrede tranzicionim zahtevima, događaji su poprimili drugačiji tok, što je zemlje bivše Jugoslavije drastično udaljilo od očekivanih rezultata.
Počinje se od ispitivanja međuzavisnosti privatizacije i efikasnosti, pri čemu se analizi-raju glavni argumenti koji objašnjavaju zašto privatna svojina može da ostvari veću efika-snost privređivanja u odnosu na kolektivnu ili državnu svojinu. Polazni model u analizi je model principala i agenta, koji državu razlikuje od privatnog vlasnika po mestu u agencij-skom lancu. Naime, privatni vlasnik je orijentisan na maksimiranje profita, a država na maksimizaciju blagostanja (ne nužno i profita). analiza pokazuje da automatski i samo-regulišući tržišni mehanizmi određuju donju granicu neefikasnosti u privatnoj svojini, ali da takvi mehanizmi ne postoje u uslovima kolektivne svojine i da se ne raspolaže instru-mentima pomoću kojih bi agenti u državnim preduzećima bili podstaknuti na podizanje ili održavanje zadatog nivoa efikasnosti. Takođe, autor ukazuje na probleme uspostavljanja efikasne vlasničke kontrole i unutar privatne svojine usled problema sa različitim, parci-jalnim interesima pojedinih deoničara, koji mogu da rezultiraju suboptimalnim efektima.
uz šesto poglavlje je dodat i kratak esej (6a) Svojina, sloboda i efikasnost, u kome autor ukazuje na činjenicu da je razvoj demokratije povezan sa ograničenjem prava svojine. S tim u vezi, analizira se hipoteza po kojoj se u osnovi ovih promena nalazi zahtev za efikasnijim privređivanjem koje rezultira većom proizvodnjom i boljim materijalnim pret-postavkama za slobodu ljudi. ali, ukoliko se pokaže da ukidanje privatne svojine ne dopri-nosi ekonomskoj efikasnosti, onda se ono i ne može razumeti kao društveni napredak ka slobodi, a istovremeno ni svaki oblik privatne svojine, ukoliko nije saglasan sa datim uslo-vima nekog društva, neće doprineti povećanju slobode pojedinca. Dalje se analizira ra-zvoj samoupravnog modela preduzeća u jugoslovenskoj privredi, kao i specifičnosti ovog modela koje su mogle da olakšaju prelaz iz samoupravne u tržišnu privredu. S obzirom na činjenicu da je i model samoupravne privrede zahtevao korenite promene, posebno su analizirani uslovi i razlozi privatizacije samoupravnih preduzeća. u nastavku istraživanja o specifičnostima privatizacije društvene svojine, autor ispituje i ocenjuje jugoslovenski program privatizacije, a posebno ograničenja sa kojima se suočavao, ekonomsko-politič-ke osnove, kao i ciljeve i metode privatizacije predviđene ovim programom.
95EkonoMSkE IdEjE I PrakSa | Broj 6 | SEPtEMBar 2012.
autor se u nastavku teksta bavi odnosom tranzicije i vlasništva, obrazlažući pri tome potrebu za privatizacijom tokom tranzicije i analizirajući efekte različitih modela privatiza-cije sa aspekta njihove sposobnosti da generišu štednju i time doprinesu razvoju privrede. analizom se pokazuje da je program deoničarstva zaposlenih superioran u odnosu na druge modele privatizacije. upravo zato je celo naredno poglavlje (Popusti u deoničar-stvu zaposlenih: restitucija za samoupravljače?) posvećeno deoničarstvu zaposlenih i njegovoj analizi kroz odnos popusta i doprinosa zaposlenih, kao i analizi njegove specifič-nosti u uslovima privatizacije samoupravnog preduzeća sa društvenom svojinom. rezul-tati pokazuju da se proces privatizacije putem deoničarstva zaposlenih može posmatrati kao povraćaj zaposlenima akumuliranog kapitala koji su uložili u društvenu imovinu, nemajući pri tome mogućnost izbora između privatnog i društveno-svojinskog ulaganja. S obzirom da takva mogućnost izbora, prema Farbont-Pejanovićevom argumentu, usme-rava ulaganja u pravcu privatnog vlasništva, autor smatra da je ovaj model privatizacije ekonomski i društveno opravdan. u tom smislu je i program deoničarstva zaposlenih primenjen u Jugoslaviji 1990. godine, po mišljenju autora, bio dobro dimenzioniran i komponovan.
Poglavlje Privatizacija, regulacija i monopol, bavi se i danas aktuelnim problemom pri-vatizacije monopola i njegove adekvatne regulacije. autor izdvaja dve grupe argumenata: u korist privatizacije monopola i protiv privatizacije monopola. Pristalice privatizacije u prvi plan ističu ideju o podizanju efikasnosti poslovanja i nužnosti transformacije držav-nog u mešovito vlasništvo. glavni argumenti druge grupe su da, u slučaju monopolskog preduzeća, privatizacija znači ustupanje monopolskih dohodaka privatnicima, kao i da monopol mora da podleže državnoj kontroli i regulaciji koja će biti efikasnija u uslovima državne svojine. Kako u uslovima monopola privatizacija ne daje izvesnost povećane efikasnosti, a etatizacija i tradicionalni oblici regulacije ne obezbeđuju dobre razvojne performanse, autor razmatra i alternativna rešenja koja kreatori ekonomske politike imaju na raspolaganju da ovu oblast urede i učine efikasnijom.
Zaključno poglavlje drugog dela knjige se bavi programima privatizacije u Srbiji i daje sistematizaciju osnovnih metoda privatizacije primenjenih od početka devedesetih godina do danas. Značaj ovog dela jeste u tome što prikazuje razvoj ideja o procesu privatizacije u Srbiji, kao i uporedni prikaz glavnih rezultata i efekata primenjenih privatizacionih programa. Najpre se analiziraju osnovni modeli privatizacije, njihove prednosti i mane, a zatim daje detaljan prikaz četiri glavna programa privatizacije primenjena u našoj zemlji.
Treći deo knjige, Tranzicija i rast, sastoji se od pet poglavlja u kojima autor nastoji da odgovori na pitanje da li su zemlje u tranziciji uvek vodile adekvatnu politiku, koliko su napredovale u reformama i koliko su te reforme doprinele njihovom razvoju, odnosno da li su tranzicioni projekti i tranzicione politike bili dovoljno efikasni instrumenti za obezbe-đivanje ekonomskog razvoja. Ponuđenim odgovorima autor pokazuje da mnogim važnim pitanjima nije posvećena adekvatna pažnja ni pre, a ni posle pokretanja tranzicionih reformi.
Posle višegodišnje primene tranzicionih mera, preporuka i projekata, rezultati pokazuju da je celina procesa tranzicije različito ostvarena u različitim institucionalno i ekonom-
PRIKAZKNJIGE„TRANZICIJA-ZAMISLIIOSTVARENJA“96
sko-politički uređenim okruženjima. Kao glavne uzroke različitog ostvarenja tranzicionog programa, autor navodi politiku sprovođenja pojedinih mera tokom tranzicije i nasleđene uslove iz prethodnog sistema. Takođe, na osnovu dotadašnjih iskustava istraživani su i upoređivani efekti i posledice pojedinih modela privatizacije (modela prodaje, vaučerske privatizacije i deoničarstva zaposlenih) i identifikovane nesaglasnosti teorijskih očeki-vanja i praktične primene pojedinih modela u datim okolnostima. rezultati analize su pokazali da je napredak u tranziciji jedan od ključnih faktora integrisanja tranzicionih privreda u međunarodne privredne tokove, a posebno tokove kapitala.
u nastavku se posebna pažnja posvećuje istraživanju uticaja nasleđenih uslova jedne privrede na njen napredak u tranzicionim reformama. rezultati istraživanja pokazuju da brzina implementacije projektovanih reformi nije prvenstveno zavisna od spremnosti ili volje donosilaca ekonomsko-političkih odluka da reforme sprovedu brzo, već je endogena varijabla uslovljena početnim uslovima svake konkretne privrede. Takođe, rezultati anali-ze pokazuju da su reforme u najvećem broju privreda u tranziciji ostvarene onim tempom koji je u skladu sa njihovim specifičnim nasleđenim uslovima u razvojnom i institucional-nom smislu. Istovremeno, ekonomske performanse privreda u tranziciji su daleko ispod nivoa predviđenog od strane kreatora tranzicije, iz razloga što projekat tranzicije nije do-voljno dobro uticao na faktore rasta tj. primenjene strategije i politike rasta nisu uvažavale osobenosti konkretne privrede.
upravo zato se nadalje ispituju „neobični ishodi“ povezanosti reformi i privrednog rasta, kao i uticaja nasleđenih uslova na rast tokom procesa tranzicije. rezultati sprovedene analize pokazuju da napredak u tranzicionim reformama može pozitivno uticati na eko-nomske performanse privreda u tranziciji, ali samo u prvim godinama reformisanja siste-ma, jer se na dugi rok uticaj reformi na rast privrede postepeno gubi. Istovremeno, bolji početni uslovi tj. viši stepen razvijenosti zemlje pre tranzicije, jeste faktor koji pozitivno utiče na brzinu sprovođenja reformi tokom celog posmatranog perioda. Takođe, ustanov-ljeno je da standardni dugoročni modeli rasta ne mogu da objasne rast tokom tranzicije, pre svega zbog strukturnih razlika privreda u tranziciji u odnosu na druge zemlje. Ovakvi nalazi daju za pravo onim analitičarima koji ukazuju kako brza primena potpuno istog programa reformi, naročito u zemljama koje u pogledu nasleđenih uslova nemaju neop-hodne pretpostavke za brze sistemske promene, može negativno uticati na njihov rast i performanse.
Logičan nastavak predstavlja metodološko istraživanje povezanosti privrednog rasta i uticaja koje proizvode tranzicione reforme i nasleđeni uslovi privrede u tranziciji. u defi-nisanom modelu analizira se uticaj makroekonomske stabilnosti, nasleđenih uslova i na-pretka u reformama posmatrane privrede na privredni rast. rezultati analize pokazuju da se model rasta menja tokom procesa tranzicije, s obzirom da su identifikovane određene strukturne prelomne tačke uslovljene napretkom u tranziciji. Konsekventno, definisani su modeli rasta za faze ostvarenja reformi koje se nalaze ispod, iznad ili između prelomnih tačaka, pri čemu rezultati pokazuju različite determinante rasta u različitim modelima. Na početku tranzicije, viši nivo reformi potpomaže rast, dok u središnjoj fazi reformisanja privrede ne predstavlja značajan faktor koji doprinosi privrednom rastu. Nakon sledećeg prelomnog nivoa reformi, ponovo je utvrđen njihov pozitivan uticaj na privredni rast, ali
97EkonoMSkE IdEjE I PrakSa | Broj 6 | SEPtEMBar 2012.
PRIKAZKNJIGE„TRANZICIJA-ZAMISLIIOSTVARENJA“98u znatno manjem obimu. Pored toga, rezultati regresionih modela pokazuju da visoka inflacija ometa rast privrede, tj. ona predstavlja značajan negativni faktor koji utiče na ekonomske performanse privrede u tranziciji. Sa druge strane, uticaj nasleđenih uslova značajan je faktor rasta privrede u svakoj identifikovanoj fazi tranzicije. Na kraju, utvrđe-no je da su zemlje koje su ostvarile najveći napredak u tranzicionim reformama, upravo zbog takvog napretka trpele dodatne gubitke u pogledu svog ekonomskog rasta u periodu krize, odnosno došlo je do promene njihovog modela rasta tokom krize.
Treći deo knjige zaključuje poglavlje koje posmatra privrede u tranziciji u uslovima global-ne krize. Model rasta, definisan u prethodnom poglavlju, dopunjen je novim varijablama koje se odnose na industrijsku proizvodnju i izvoz, sa ciljem utvrđivanja faktora koji de-terminišu rast u različitim fazama tranzicije. rezultati dobijeni ocenom novog proširenog modela rasta takođe identifikuju dva strukturna preloma koja ukazuju na promene mode-la rasta tokom tranzicije. Osim toga, utvrđeno je da je u sredini procesa tranzicije važnije da se, umesto ubrzavanja reformi, obezbedi odgovarajuća struktura proizvodnje i odgo-varajući odnosi razmene pojedine privrede. Ovo implicira zaključak da u sredini tranzicije ostvarene reforme nameću potrebu uspostavljanja nove politike i strategije rasta, koje će podsticajno delovati na razvoj industrije i izvoza i pri tome biti prilagođene konkretnim uslovima svake pojedinačne privrede. u daljoj analizi se u model uključuju i varijable koje se odnose na otvorenost privrede u tranziciji i na fiskalnu politiku tj. na udeo državnih izdataka u BDP-u posmatrane privrede. rezultati modela dodatno potvrđuju činjenicu da približno oko sredine celog reformskog puta, tranzicione privrede treba da definišu odgo-varajuću politiku rasta, jer u suprotnom insistiranje na samom unapređivanju reformi i na njihovim spontanim efektima može biti kontraproduktivno. Ovo posebno dolazi do izraža-ja tokom krize, kada viši nivo reformi bez odgovarajućih promena u modelu rasta deluje negativno na stope rasta. Na kraju je predstavljeno i nekoliko kratkih studija slučaja koje ilustruju i dopunjuju predstavljene rezultate.
Četvrti deo knjige, pod nazivom Tranzicija u Srbiji, u celosti je posvećen tranzicionim proce-sima u našoj zemlji. Početna poglavlja se bave privredom Srbije tokom devedesetih godina prošlog veka, dok su kasnija poglavlja usmerena na analizu perioda posle političkih promena 2000. godine. u kratkom uvodnom osvrtu na devedesete (kroz tri priloga pisana 90-ih go-dina), autor ukazuje na neophodnost postojanja ekonomskih odnosa između bivših jugoslo-venskih republika, s obzirom na značajnu povezanost njihovih privreda, kao i činjenicu da nemaju tržišta u svetu ili imaju sasvim skromna međunarodna tržišta. Takođe se ukazuje i na neophodnost promene ukupne politike zemlje, jer se bez toga ne može ostvariti ni promena ekonomske situacije u kojoj se SrJ našla u tom periodu. Dalja analiza pokazuje da kašnjenja u procesu tranzicije proizvode nepotrebne troškove i gubitke i odlažu ekonomski oporavak. Istovremeno, takva zakašnjenja dovode do neefikasne upotrebe domaćih resursa, produžuju tranzicionu recesiju i demotivišu priliv stranih sredstava, sprečavajući na taj način privredu da prevaziđe nizak nivo razvijenosti i slabe ekonomske performanse.
Posebna pažnja je posvećena modelu prodaje, kao dominantnom modelu privatizacije u Srbiji u 2001. godini, uz kritički prikaz njegovih ograničenja. rezultati empirijske analize pokazuju da je za uspeh privatizacije i za uspešno restrukturiranje jedne privrede pre-sudan uticaj institucionalnog okruženja, dok je konkretan primenjeni model privatizacije

99praktično irelevantan. Iz ovih rezultata proizilazi zaključak da je za uspeh privatizacije važnije usmeriti pažnju na sistemski ambijent, tj. na institucije i ekonomsku politiku koja treba da podstiče njihovo brže uspostavljanje, a preduzeća na tržišno ponašanje, nego na sam model privatizacije. Takva orijentacija za rezultat ima smanjene troškove prelaska sa jednog modela na drugi, a istovremeno deluje i kao poseban faktor stabilnosti za predu-zeća u odnosu na prethodni period u kome su uslovi poslovanja naglo i stalno menjani.
Ocena razvojnog potencijala novousvojenog programa privatizacije pokazuje da on može da ostvari značajan priliv kapitala po osnovu prodaje preduzeća, ali u ograničenom roku i obimu, pri čemu deo sredstava mora biti iskorišćen za pokrivanje troškova koje je proizve-la desetogodišnja pogrešna politika. autor ukazuje i na neophodnost decentralizovanja i diverzifikovanja modela privatizacije, da ne bi došlo do zastoja u procesu privatizacije i usporenog prelaska privrede na razvojnu putanju. Dok se na kraju, poseban akcenat stavlja na promovisanje i stvaranje podsticajnih uslova za formiranje malih i srednjih privatnih preduzeća koja će činiti okosnicu privrednog rasta.
Veoma je značajno i istraživanje poslovne i investicione klime u Srbiji, sa aspekta njenog uticaja na proces privatizacije. rezultati sprovedenog sopstvenog istraživanja, kao i rezul-tati istraživanja Svetske banke i Evropske banke pokazuju da je poslovna klima relativno bolja od očekivane i da samim tim predstavlja nedovoljno iskorišćen resurs za ubrzanje procesa privatizacije, ali je zapaženo pogoršanje te ocene u odnosu na ranija istraživanja. Interesantno je napomenuti da su uočene oštrije ocene poslovne klime od strane novih privatnih preduzeća i preduzeća privatizovanih od strane domaćih vlasnika, u odnosu na preduzeća privatizovana od strane stranih vlasnika ili zaposlenih.
Iste analize su delom korišćene i za utvrđivanje pojedinih efekata procesa privatizacije, pre svega reakcije različitih tipova preduzeća u pogledu njihovih performansi, preduzetih mera restrukturiranja i uslova konkurencije na tržištu. rezultati istraživanja koji se tiču performansi preduzeća pokazali su da su privatna i privatizovana preduzeća bolja u od-nosu na društvena preduzeća. Takođe, pokazano je da bolje rezultate ostvaruju preduzeća koja imaju manji broj zaposlenih, koja su pod manjim uticajem konkurencije, koja imaju manja dugovanja prema državi i koja su aktivnija u procesu restrukturiranja. Pri tome, vrsta preduzeća odnosno tip vlasništva nema uticaja na ostvarene performanse predu-zeća. Štaviše, dobijeni rezultati pokazuju da nova privatna preduzeća ne predstavljaju pokretačku snagu razvoja privrede u tranziciji, kako su to ranija istraživanja naglašavala.
u jednom od završnih poglavlja (Usporavanje reformi u Srbiji: trošak neiskorišćenih mogućnosti) se zaključuje da je Srbija posle 2000. godine ubrzala reformske procese, ali da su ti procesi naglo usporeni u 2003. godini, nakon čega se naša privreda reformiše usporenim tempom. upravo zato, povećava se njeno kašnjenje u pogledu ostvarenih reformi u odnosu na zemlje iz okruženja. Takođe, ovi procesi su prouzrokovali i nizak nivo BDP-a po stanovniku, koji je trebalo da bude na znatno višem nivou da su reforme sprovođene brže. Negativni efekti usporavanja reformi su delimično kompenzovani višim prilivom stranih direktnih investicija u odnosu na druge privrede u tranziciji na istom nivou napretka tranzicionih reformi, ali to donekle znači i da strane direktne investicije nisu efikasno iskorišćene.
EkonoMSkE IdEjE I PrakSa | Broj 6 | SEPtEMBar 2012.
Poglavlje, pod zanimljivim nazivom Srbija u tranziciji i - krizi, bavi se analizom efekata globalne ekonomske krize na privredu Srbije. Srbija nije bila spremna i osposobljena da odgovori izazovima globalne krize, a kao dodatni problem su se pokazale i nedovoljno dobro koordinisane i komponovane reforme, koje se ogledaju u sporom razvoju institucija i nedostatku politike konkurencije. Posledica toga je umanjenje efekata privatizacije i li-beralizacije, produbljena neravnoteža u više sektora, a istovremeno i dodatno pogoršanje uticaja globalne ekonomske krize na performanse srpske privrede.
Najzad, zaključno poglavlje govori o neusklađenosti reformi i modela rasta Srbije i Zapad-nog Balkana i potrebi za novim modelom rasta. Polazeći od rezultata empirijske analize, izložene u poglavljima 16. i 17. ove knjige, autor nastoji da odgovori na pitanje zbog čega je i od kada Srbiji potreban novi model rasta. analiza je pokazala da pojava prelomnih tačaka u sprovođenju reformi zahteva promenu modela rasta. Kao optimalni period za definisanje odgovarajuće razvojne politike, odnosno strategije rasta svake pojedinačne privrede u tranziciji, identifikovana je srednja faza tranzicije, na nivou od oko 40-60% ostvarenja ukupnih reformi. Za privredu Srbije to konkretno znači da su se uslovi za us-postavljanje novog modela rasta stekli još tokom 2003. godine, ali on nije primenjen ni tada, ni u godinama koje su sledile.
Do tada primenjivan „spontani“ pristup modelu rasta je privredu Srbije, slično kao i zemlje Zapadnog Balkana, usmeravao ka pogrešnom i dugoročno neodrživom putu, tj. ka nepovoljnim strukturnim promenama koje karakteriše nesrazmeran rast sektora ne-razmenljivih dobara, smanjenje industrijske proizvodnje, trgovinski deficit, stalna potreba priliva strane štednje i ekspanzija uvozne tražnje. Sve ovo je za posledicu imalo visok stepen zaduženosti, pre svega privatnog sektora privrede, kome će se u uslovima krize pridružiti i visok rast državnog duga.
Na samom kraju knjige, autor iznosi stav da su uprošćene preporuke programa tranzicije, oslonjene na uverenje o gotovo bezuslovnoj sposobnosti tržišta da privrede izvede na optimalan put razvoja, uzrokovale izrazitu ranjivost privreda u regionu u uslovima krize. Tako vođena politika je izazvala kašnjenje ovih privreda u izboru adekvatnog modela ra-sta i razvojne politike, što će za posledicu imati znatno veće troškove tranzicije i usporen oporavak u budućnosti. Prof. Cerović naglašava da je promena modela rasta neophodna i neizbežna, ali da zemlje u tranziciji mora da budu spremne da se suoče sa znatno ma-njim efektima novog modela, u odnosu na one koji su se mogli ostvariti da je promena modela izvršena na vreme.
u prezentovanju ove izuzetno složene, obimne i uvek aktuelne materije, autor je znalački i vešto koristio kako domaću tako i stranu literaturu, ali takođe i sopstvena istraživanja, iskustva, razmišljanja i ideje. Ipak, kao izuzetan doprinos ovog teksta posebno treba naglasiti empirijsku verifikaciju iznetih stavova, zbog čega ova knjiga ima još veću upo-trebnu vrednost.
Knjiga „Tranzicija - zamisli i ostvarenja“, prof. dr Božidara Cerovića ima elemente i monografskog i udžbeničkog karaktera. Kao takva, može korisno poslužiti celokupnoj naučnoj i stručnoj javnosti koja iskazuje interesovanje za detaljnijim proučavanjem i razu-
PRIKAZKNJIGE„TRANZICIJA-ZAMISLIIOSTVARENJA“100
mevanjem procesa tranzicije. Pojedini delovi su posebno namenjeni i korisni studentima Ekonomskog fakulteta u Beogradu, u cilju sticanja i produbljivanja znanja iz predmeta Ekonomika tranzicije, ali se ova knjiga preporučuje i studentima drugih ekonomskih fa-kulteta u našoj zemlji, na svim nivoima studija. Teorijsko-metodološki značaj i empirijsko dokazivanje iznetih stavova i više su nego dovoljan razlog da se kod naučne i stručne javnosti pobudi interes za dubljim proučavanjem njenog sadržaja.
Knjiga je pisana stručnim, razumljivim jezikom iskusnog pedagoga, pregledno i sistema-tizovano, jasnim i istovremeno prepoznatljivim stilom; obiluje empirijskim istraživanjima, mnoštvom odabranih primera i studija slučaja, što je čini izuzetno pogodnom za razume-vanje i praćenje reformskih procesa u našoj zemlji, ali i drugim zemljama u okruženju. Ono što dodatno uvećava vrednost ove obimne i složene studije, jesu brojna originalna gledišta i stavovi autora o teorijskom i praktičnom rešavanju pojedinih pitanja vezanih za proces tranzicije u našoj zemlji. Ova knjiga, impresivnog obima, kompleksne a logične kompozicije i strukture, sa ovolikim bogatstvom empirijske građe, svakako predstavlja krunu dugogodišnjeg bavljenja prof. Cerovića problemima tranzicije i ekonomije uopšte.
Zbog svega navedenog, ova knjiga predstavlja izuzetno vredan doprinos domaćoj eko-nomskoj literaturi i svakako će naići na adekvatan odjek u naučnoj i stručnoj javnosti. Profesionalno, a i lično, iskreno preporučujem knjigu „Tranzicija - Zamisli i ostvarenja“, pre svega stručnoj, ali i široj čitalačkoj publici zainteresovanoj za uvek aktuelne ekonom-ske probleme i smatram da je treba imati u svojoj biblioteci.
101EkonoMSkE IdEjE I PrakSa | Broj 6 | SEPtEMBar 2012.

© 2012.sva prava su zadržana. nijedan deo ove publikacije ne može biti reprodukovan niti smešten u sistem za pretraživanje ili transmitovanje u bilo kom obliku, elektronski, mehanički, fotokopiranjem, snimanjem ili na drugi način, bez prethodne pismene dozvole autora.
CIP - Кaтaлогизaцијa y пyбликaцијиНaроднa библиотекa Србије, Беогрaд
33
ekonomske ideje i praksa : kvartalničasopis iz oblasti ekonomije, poslovneekonomije i menadžmenta, statistike i poslovne informatike / glavni urednik miomirjakšić. - 2012, br. 6 (septembar)- . - Beograd(kamenička 6) : centar za izdavačku delatnostekonomskog fakulteta u Beogradu, 2012-(Beograd : čugura print). - 24cm
TromesečnoIssn 2217-6217 = ekonomske ideje i praksacoBIss.sR-Id 184934668