Embed Size (px)
Citation preview

MSc RENE is a cooperation between
Universitat Politècnica de Catalunya, Spain │ KTH-Royal Institute of Technology, Sweden
Instituto Superior Técnico, Portugal │ École Polytechnique (ParisTech), France
EIT KIC InnoEnergy Master’s Programme
Renewable Energy - RENE
MSc Thesis
Characterization of PV technology over roofs and their
constraints for a geographical analysis
Author: S.M.Safayet Ullah
Supervisors:
Principal supervisor: Dr. Santiago Silvestre/UPC
Industrial supervisor: Dr. Javier Domínguez /Ciemat
Session: September 2013


Thesis Title Page 1
Abstract
This work is focussed on the characterization of PV technology over roofs and their
constraints for a geographical analysis. The objectives of the work are to calculate the
available roof surface area of the city Miraflores de la Sierra and to calculate the power and
energy that can be produced by using solar pv technologies using available roof surface area
of the city.
To find out the available area of Miraflores, at first the arcGIS is used to get the flat roof
surface area. From the flat roof surface area, inclined roof surface area is calculated.
Different type of constrains also considered to get the available roof surface area. After
getting the available roof surface area, power and energy is calculated using different type of
solar pv technologies.
All the area of the roof top is calculated of the city of miraflores. all the 1883 houses are
considered in this project including all the main urban area and remaining urban area. At first
the roofs are considered as flat roof and later inclined roof surface area is calculated using
formula. The available roof surface area for solar pv installation is 28212.35 m2.
In the city of miraflores, all the houses are inclined. So, to calculate the energy and power
potential, it is very important to know the global radiation on tilted surface of the area. But,
lack of the weather data of the city, the weather data of Madrid is considered and calculated.
Annual global radiation on 20 degree tilted surface result is 4.64 kWh/m2day
With a efficiency of 22.9% solar pv technologies( Si mono crystalline), annual energy output
is 8177992kWh and the potential power output is 934 kW. Using a lower efficiency of 8.20%
solar pv technologies Si(thin film polycrystalline), annual energy output is 2599050kWh and
the potential power output is 297 kW.

Page 2 Thesis Report
Acknowledgements
I thank the Almighty GOD for giving me power, courage, patience and dedication to do the
MSc thesis and to be a part of the project.
I want to thank to the administration of CIEMAT, Madrid, Spain who gave me a lifetime
opportunity to experience. My sincere thanks go to my supervisor Dr. Javier Domínguez for
his immense support and encouragement to do this work. I want to thank to Dr. Luis F.
Zarzalejo for his continuous support to me. I want to thank to Ana martin, Vicente Roque and
Lara de Diego.
I thank my academic supervisor at Universitat Politecnica de Catalunya (UPC), Associate
professor Santiago Silvestre who helped and supported me all the time during the research
work, without his encouragement and motivation, it was impossible to complete the work.

Thesis Title Page 3
Table of Contents
ABSTRACT ___________________________________________________ 1
ACKNOWLEDGEMENTS ________________________________________ 2
TABLE OF CONTENTS _________________________________________ 3
1. GLOSSARY ________________________________________________ 5
2. INTRODUCTION _____________________________________________ 6
3. LITERATURE REVIEW _______________________________________ 8
3.1. Photovoltaic concepts ....................................................................................... 8
3.2. Different types of solar pv technologies ............................................................ 9
3.3. Crystalline silicon technology ............................................................................ 9
3.4. Thin film technology ........................................................................................ 11
3.5. Roof top pv system ......................................................................................... 11
3.5.1. Different types of roofs ....................................................................................... 11
3.5.2. Different type of pv system ................................................................................. 12
3.6. Important factors ............................................................................................. 12
3.6.1. Performance ratio .............................................................................................. 13
3.6.2. Orientation and inclination .................................................................................. 13
3.6.3. Sun position and declination angle ..................................................................... 13
3.6.4. Elevation angle and zenith angle ........................................................................ 14
3.6.5. Tilted slope, solar azimuth angle, surface azimuth angle ................................... 14
3.6.6. Solar and Time ................................................................................................... 15
Local Standard Time Meridian (LSTM) ......................................................................... 15
3.7. Solar radiation components ............................................................................ 17
3.7.1. Direct radiation ................................................................................................... 17
3.7.2. Diffuse radiation ................................................................................................. 17
3.7.3. Albedo radiation ................................................................................................. 17
3.8. Shading in the use of pv technology over roofs .............................................. 18
3.9. Introduction to GIS and ArcGis ....................................................................... 18
4. METHODOLOGY ___________________________________________ 19
4.1. Determination of the roof surface area ........................................................... 19
4.1.1. Determination of the area of Miraflores ............................................................... 19
4.1.2. Determination of the building of Miraflores ......................................................... 21
4.2. Determination of the available roof surface area of Miraflores de la Sierra .... 25

Page 4 Thesis Report
4.3. Determination of Solar radiation on the roof surface area .............................. 26
4.4. Determination of the power and energy can be produced on the available roof
surface area ................................................................................................. 28
5. RESULTS AND DISCUSSIONS ________________________________ 29
5.1. Area of the miraflores de la Sierra .................................................................. 29
5.2. Available area of miraflores de la Sierra ......................................................... 31
5.3. Solar radiation on horizontal and inclined surface .......................................... 32
5.4. Power and energy generation in miraflores de la Sierra ................................ 34
CONCLUSIONS ______________________________________________ 37
FUTURE WORK ______________________________________________ 39
REFERENCES _______________________________________________ 40
Thesis Title Page 5
1. Glossary
pv: Photovoltaics
DC: Direct current
c-Si: Crystalline silicon
AC: Alternating current
PR: Performance ratio
δ: Declination angle
dn: Day number in a year
β: Tilted slope angle
GIS: Geographical information systems
2D: Two dimensional
a-Si: Amorphous silicon
a-SiGe: Amorphous silicon/ germanium/ hydrogen alloy
3D: Three dimensional
Page 6 Thesis Report
2. Introduction
Continuous power supply is essential for the advancement of a country. As the price of fossil
fuel is increasing, renewable energy is a good alternative to this situation. Not only it is a
good solution, it is also environment friendly technology. Now a day, all the countries are
looking forward to expand this technology to produce the power. European Union sets a
target to produce 20% energy of the total energy consumption by the renewable energy by
the year 2020[1].
Solar PV is one of the major parts of renewable energy technologies. The amount of solar
radiation incident on the ground is enough to meet the energy demand of the world. On
average, the amount of solar radiation incident on earth surface, it can produce 1700 kW
energy every year [22]. The average energy received in Europe is 1,200 kWh/m2 per year.
Roof top pv technologies is very much popular now a days. In the grid connected pv system,
owners can supply extra energy to the grid and earns money. When there is no solar energy
available, they can also take electricity from the main grid. At standalone roof top system,
owners can store energy in battery. When there is no solar energy available, they can use
stored energy from battery.
Roof top pv system also a big factor to those place which are not connected to the main grid
system. Using the solar energy, peoples can meet their energy demand.
The objective of this thesis is to find out the area of the roof top of the city Miraflores de la
Sierra near Madrid, Spain. Different type of constraints and shading will be also considered
to find the available roof surface area of the region. Using the available roof surface area, the
amount of energy and power produced using different type of Solar PV technology will be
also calculated.

Thesis Title Page 7
Objective
To develop a model based on geographic information technologies and state of the art
photovoltaics technology, to evaluate the potential use of roofs and urban spaces with solar
photovoltaic in the city of Miraflores de la Sierra in Madrid, Spain.
Specific objective
1. To calculate the available roof surface area of the city Miraflores de la Sierra.
2. To calculate the power and energy that can be produced by using solar pv
technologies using available roof surface area of the city.

Page 8 Thesis Report
3. Literature review
3.1. Photovoltaic concepts
Photovoltaic technology is the process of generating Direct current (DC) power from semi-
conductors when they are illuminated by photons [2]. This process is made of several cells
which convert sunlight into electricity [3]. Solar cells are made of semi conducting materials.
These semiconducting materials contain weakly bonded electrons which occupy a band of
energy called valence band. When energy exceeds the band gap energy, the bonds get
broken and the electrons get free to go in a new energy band named conduction band. The
band gap separates the free electrons in conduction band from valence band. To free the
electrons, energy is needed which is provided by photons which are particles of light.
Fig. 3.1. Schematic of a solar cell
Fig 4.1 shows the basic working priciple of a solar cell.The solar cell works as a pn junction.
By using doping, conduction band and valence band are produced where one becomes the
n-side (lots of negative charge) and other becomes the p-side (lots of positive charge). when
the sunlight of sufficient energy is incident on the solar cell, the atoms absorb the solar
photons, breaking the bonds of valence electrons and send the electrons to the higher
energy in conduction band. The electrons send to the outer load via wires. After some work,
electrons are back at a lower energy level to the valence band.

Thesis Title Page 9
3.2. Different types of solar pv technologies
There are several types of pv technologies. They can be defines as first, second and third
generation. Basic crystalline silicon (c-Si) is considered as first generation and thin film
technologies included in second generation technologies. Concentrator photovoltaics,
organics and some other technology are included in the third generation technologies [4]. Fig
4.2 shows an interesting view of dominating the pv market by different type of technologies
for a decade [5].
Fig. 3.2. Evaluation between different technologies
3.3. Crystalline silicon technology
Mono crystalline silicon technology
Mono crystalline silicon was first produced by using the Czochralski (Cz) technique almost 50
years ago [6]. Mono-Si cell efficiency is about 16-17% [7]. It comes directly from the
microelectronics industry. It is known for better efficiency but it is still expensive comparing to
multi crystalline (poly crystalline).

Page 10 Thesis Report
Fig. 3.3. Mono crystalline solar cell
Multi crystalline silicon technology
Multi crystalline silicon technology is known for its cost effectiveness though its efficiency is
lower than mono crystalline silicon cell, about 13-15%. Multi crystalline solar cells are
rectangular or square which gives a better opportunity to utilize the module area than mono
crystalline silicon cells.
Fig. 3.4. Multi crystalline solar cell
There is another technology called Ribbons. Its efficiency is not good as multi crystalline.

Thesis Title Page 11
3.4. Thin film technology
The thin film solar cells use materials which can absorb sunlight of different wavelength and
this is why the cells are very thin [8]. The main objective to produce this kind of cell is to be
cost effective. One of the causes for the high cost of Si cells are demand of purification and
crystallinity of the material is high. In thin film, electrons need to travel short distance in the
cell to cell contacts which give it advantages over Si cell. Si cells are produced from wafers,
processed and assembled to make a module where as thin film solar cell technology
produces lots of cells and formed as a module [8].
Fig. 3.5. Thin film module
3.5. Roof top pv system
3.5.1. Different types of roofs
To implement the solar panel, it is very important to know about the condition of the roof.
There is mainly two type of roofs which include; flat and inclined.

Page 12 Thesis Report
Fig. 3.5. Different types of roof
3.5.2. Different type of pv system
There are two types of pv system, grid connected and stand-alone(off grid) system[9].
Fig. 3.6. Different types of pv system
When the pv system is connected with the local or main grid, it is considered as grid
connected pv system. The owner of pv system can send power to the grid when there is
some power remain after meeting the demand.
When pv system has no connection with grid, it can be considered as stand-alone system
(off grid system). As it has no connection with grid, it contains a lot of batteries so that power
can be stored to use later. As pv system produces DC current, inverter is also needed to
convert the DC power into AC power.
3.6. Important factors
To calculate the inclined roof surface area, available total roof surface area, power and
energy produced by the solar pv technology, some important factor plays a big role in the
calculation.

Thesis Title Page 13
3.6.1. Performance ratio
It is the ratio between the actual and theoretical energy outputs [12]. The performance ratio
(PR) is expressed as percentage and it shows the relation between actual and theoretical
output from solar pv. In real life, 100% PR cannot be achieved because of different kind of
losses and other unavoidable reasons.
3.6.2. Orientation and inclination
The orientation and tilt of a system has a big impact how much avaialbe solar radiation the
solar system can collect. Theoretically, the optimal orientation is true south and the optimal
tilt is considered as equal to latitude. But,practically, it is preferable that the system to face
the equator and the tilt should be 10-15degree less then the local latitude[20].
3.6.3. Sun position and declination angle
The declination of the sun is the angle between the equator and the line drawn from the
centre of the earth to the centre of the sun [13].The declination angle δ changes due to the
earth rotation on its own axis and also the rotation of the earth around the sun. the
declination angle can be get by using [14] the formula of Cooper.
)365
284360sin(45.23 nd
(Ec. 3.1)
Here, dn is the number of the day of the year.
Fig. 3.7. The orbit of the Earth around the sun whole year
The declination angle becomes zero at spring equinox (march 21) and at autumn equinox
(December 21), the line between the sun and the earth passes through the equator [15]. The
declination angle reaches maximum 23.45 degree at June 21 (because of summer solstice in
the northern hemisphere) and it reaches minimum -23.45 degree at December 21 (because
of winter solstice in the northern hemisphere).

Page 14 Thesis Report
3.6.4. Elevation angle and zenith angle
Solar elevation angle is the angle between the horizontal and the line to the sun [14].The
elevation angle is zero degree at sunrise and it becomes 90 degree when it comes to
overhead [16]. Elevation angle changes through out the whole day and it depend on the
latitude of a place and also on the day of year. It is also known as altitude angle.
Fig. 3.8. Elevation angle and zenith angle
Zenith angle is measured from vertical axis. It is the angle between the vertical axis and the
line to sun. Zenith angle=90°-elevation angle
3.6.5. Tilted slope, solar azimuth angle, surface azimuth angle
The tilted slope angle(β) is the angle between the surface and the horizontal surface[14].
Solar azimuth angle is the angular displacement from south of the incident beam radiation at
the horizontal plane. In the figure 4.9,displacement east of south are negative and west of
south are positive.
Surface azimuth angle is the angle between the projection of beam radiation to the horizontal
plane of normal to the surface from the local meridian, considering zero to the south and east
negative and west positive.

Thesis Title Page 15
Fig. 3.9. Tilted slope, solar azimuth angle and surface azimuth angle
3.6.6. Solar and Time
Local solar time
The sun remain highest in the sky at twelve noon which known as local solar time (LST).
Local time
Local time (LT) changes from LST because of time zones and daylight saving.
Local Standard Time Meridian (LSTM)
The Local Standard Time Meridian (LSTM) is a reference meridian which is used for a
particular time zone and is alike to the Prime Meridian, which is used for Greenwich Mean
Time.
The (LSTM) is calculated using,
GMTTLSTM .15 (Ec. 3.2)
Where ΔTGMT is the difference of the Local Time (LT) from Greenwich Mean Time (GMT).

Page 16 Thesis Report
Equation of Time (EoT)
The equation of time (EoT) is an equation which modify the eccentricity of the Earth's orbit
and the Earth's axial tilt.
)sin(5.1)cos(53.7)2sin(87.9 BBBEoT (Ec. 3.3)
Where as,
)81(365
360 dB (Ec. 3.4)
In the equation 3.4, d is the number of the day of the year.
Time Correction Factor
The net Time Correction Factor responsible for the variation of the Local Solar Time (LST)
within a given time zone due to the change of longitude within the time zone.
EoTLSTMLongitudeTC )(4 (Ec. 3.5)
Local solar time can be found using,
60
TCLTLST (Ec. 3.6)
Solar hour angle, ω
It is an expression of time, It is the angular measurement of the sun east or west of the local
meridian due to the the rotation of the earth on its own axis at 15° per hour.
)12(15 LST (Ec. 3.7)

Thesis Title Page 17
3.7. Solar radiation components
In the figure 4.10, it is clearly showing the different type of components of solar radiation
hitting a terrestrial flat-plate pv surface. The total radiation falling on a surface is the
summation of direct, diffuse and albedo radiation and it is known as global radiation.
Fig. 3.10. Different components of solar radiation
3.7.1. Direct radiation
Direct radiation is the radiation which incident directly to the surface in a straight line from the
sun. It incident on the surface without any scattering. It is also known as beam radiation.
3.7.2. Diffuse radiation
Some solar radiation hits the surfaces which are not directly coming from the sun. They are
scattered from the sky and atmosphere and hit the surface later. This type of radiation is
known as diffuse radiation.
3.7.3. Albedo radiation
Some solar radiation at first hits the ground and moved to the receiver surface. This type of
radiation is called albedo radiation. It is also known as reflected radiation.
Page 18 Thesis Report
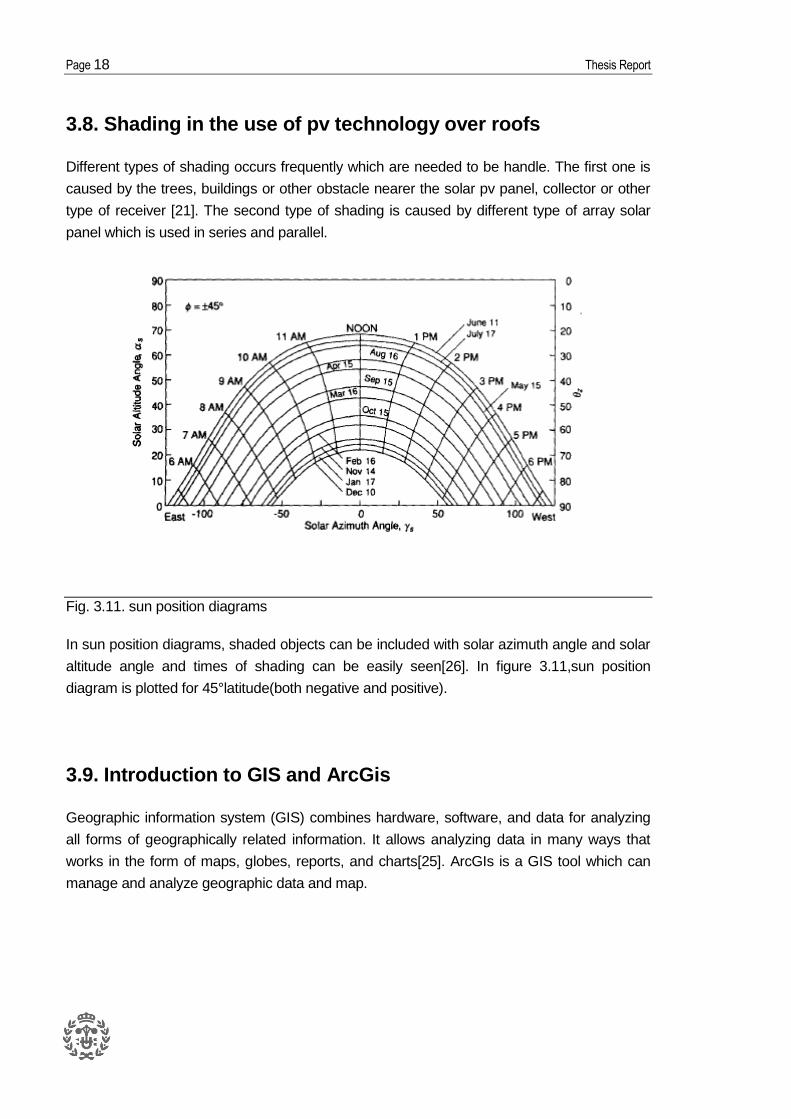
3.8. Shading in the use of pv technology over roofs
Different types of shading occurs frequently which are needed to be handle. The first one is
caused by the trees, buildings or other obstacle nearer the solar pv panel, collector or other
type of receiver [21]. The second type of shading is caused by different type of array solar
panel which is used in series and parallel.
Fig. 3.11. sun position diagrams
In sun position diagrams, shaded objects can be included with solar azimuth angle and solar
altitude angle and times of shading can be easily seen[26]. In figure 3.11,sun position
diagram is plotted for 45°latitude(both negative and positive).
3.9. Introduction to GIS and ArcGis
Geographic information system (GIS) combines hardware, software, and data for analyzing
all forms of geographically related information. It allows analyzing data in many ways that
works in the form of maps, globes, reports, and charts[25]. ArcGIs is a GIS tool which can
manage and analyze geographic data and map.

Thesis Title Page 19
4. Methodology
To find out the available area of Miraflores, at first the arcGIS is used to get the roof surface
area. After getting the available roof surface area, power and energy is calculated using
different type of panel.
4.1. Determination of the roof surface area
4.1.1. Determination of the area of Miraflores
A map is taken from website[27], where the entire municipality of Madrid province is showed.
Fig. 4.1. Map used in ArcGIS
From the whole map, Miraflores de la Sierra is selected and take the limit of the city.

Page 20 Thesis Report
Fig. 4.2. Area of Miraflores
From another website[28], All of the Madrid urban area is taken and used the arcGIS. After
selecting the boundary of Miraflores, it showed that there are 4 urban areas in the boundary
of Miraflores, one is considered as main town of Miraflores de la Sierra where as others are
Los Endrinales, Las Huelgas and los pinarejos. The remaining urban areas are considered
as “remain urban area”.
Fig. 4.3. Different urban areas of Miraflores

Thesis Title Page 21
4.1.2. Determination of the building of Miraflores
The building map of Madrid is taken from www.ign.es and used in arcGIS. The limit of
Miraflores and all the urban areas are already indicated. So, building within the limit of
miraflores was only seletected.
Fig. 4.4. Buildings in the limit of Miraflores
It was observed that there are buildings inside the selected urban areas as well as there is
some building outside the urban areas but in the boundary of Miraflores. Those building are
considered in the group of “remaining urban area”.
Fig. 4.5. Buildings of the town-miraflores de la Sierra

Page 22 Thesis Report
This is roof captured by arcGIS of the town of miraflores de la Sierra. The maximum density
house of the miraflores is in this part of the city. 1239 house is remaining in this town.
Fig. 4.6. Buildings of urban area 1-los Endrinales
These are housing of Los endrinales which we consideres as urban area 1.
Fig. 4.7. Buildings in the urban area 2-Las Huelgas
Las huelgas is considered as urban area 2. There is only few house in this urban area.

Thesis Title Page 23
Fig. 4.8. Buildings in the urban area 3-Los Pinarejos
These are the house in Los pinarejos which we considered as the urban area 3.
Besides the main town and 3 urban areas, there are lots of house here and there in the limit
of miraflores de la Sierra. In this work,these are considered as “remaining urban area”.
By using ArcGIS, using 2D projection, every house area is calculated.
Fig. 4.9. Buildings in the Miraflores de la Sierra

Page 24 Thesis Report
Fig. 4.10. Buildings in the Miraflores de la Sierra
The building areas that are calculated from 2D projections and as they are inclined, the slope
angle has to be considered to get the actual roof surface area [1].
Fig. 4.11 calculating inclined roof surface
Almost all the houses of the miraflores are inclined. So it is very important to get the accurate
area of the inclined roof. Using arcGIS, it considered all the roofs as flat roofs and calculated
the roof area. To get the inclined surface area, inclination angle Ɵ was considered. Every
house area was divided by cos(Ɵ) to get the inclined area. For a easier and better
calculation, all the roofs were assumed as 20 degree slope angle from horizontal.
Roof inclined area,
cos/flatinclined SS (Ec. 4.1)
Using the arcGIS and applying this formula, total roof surface area of miraflores de la Sierra
was achieved.

Thesis Title Page 25
4.2. Determination of the available roof surface area of
Miraflores de la Sierra
To find out the available roof surface area, different factors and constraints had impact on the
total area. Different type of limitations had influence to find out the available roof surface area
such as orientation, inclination, shading, some objects like chimney, aerials or window
occupied some roof surface etc.
In this project, it is considered to put the pv solar panel in any one of the inclined surface of
the roof. The panel was considered to put on that inclined surface which has the best
orientation to get the maximum sunlight. We considered the roof surface available per
building goes down to 50%, here a roof type coefficient CRT=0.5 is introduced [1].
As some space of roof occupied by chimney, aerials or window, it was considered that 70%
of the roof pitch is available to install the pv panel. This is why corrective feature coefficient
CF=0.7 is used.
It was also considered that 10% of the roof surface area will occupied by solar thermal
systems. This is why solar thermal coefficient CST=0.9 is used[1].
The most important effect on roof surface was shading. The shading of the pv module series
was also considered. To get rid of this unwanted shadow effect, a sufficient gap must be kept
between all solar panel, so covering index coefficient CCOV= 0.45 is also introduced.
There was another type of shadow. Shadow was produced by other buildings and by the roof
itself also. As, the find out procedure of roof surface area was 2D and there was no
availability data regarding this, we assumed this shadowing coefficient CSH as 0.43 according
to Izquierdo et al. (2008)[10].
Considering all these limitations and coefficient, the available roof surface area of the
miraflores will be,
Savailroof= CRT * CF * CST * CCOV * CSH * Sinclined (Ec. 4.2)
Using this equation, the available roof surface area for PV installation was found out.

Page 26 Thesis Report
4.3. Determination of Solar radiation on the roof surface area
To find out the solar pv generation on the roof surface available area, it is very important to
get the solar radiation on the inclined roof surface area of Miraflores. As the solar radiation
data for the miraflores is not available, so in this project, nearest weather station data was
used which was available. The solar radiation data is taken from the website[29] that
contains the data for the research center CIEMAT, Madrid, Spain. The latitude of the place
is 40.46 North and longitude is 3.73 West.
From the data of the website, solar beam, diffuse and total solar radiation on horizontal
surface was collected. Solar elevation angle and solar azimuth angle was also achieved from
the data. But, as almost all the houses of the miraflores are inclined, so we needed to use
the global solar radiation on inclined surface.
The hourly total irradiation on a tilted surface(GTH) is composed of direct (BTh), sky-diffuse
(DTh) and ground reflected (RTH) radiation[11].Using the iso-tropic model,
ThThThTh RDBG (Ec. 4.3)
Ec. 5.3 can be written as,
zBBB ihiNTh cos/coscos (Ec. 4.4)
BN is direct beam and Bh is direct horizontal solar radiation.
sinsinsincoscoscossinsincos
coscoscoscoscossincossincossinsincos
i (Ec. 4.5)
From weather data, direct normal beam irradiation was found. So, for BTh, the formula was
used[23],
iNTh BB cos
Ec. 5.3 can be written,
2/)]cos(1[cos SGDrBG hhdiNTh (Ec. 4.6)
Whereas,
BTh- hourly direct solar radiation on a tilted surface
Bh- hourly direct solar radiation on a horizontal surface

Thesis Title Page 27
BN- hourly direct beam normal irradiation
DTh-hourly diffuse solar radiation on a tilted surface
Dh- hourly diffuse solar radiation on a horizontal surface
RTh-hourly reflected solar radiation on a tilted surface
Gh- hourly total solar radiation on a horizontal surface
GTh- hourly total solar radiation on a tilted surface
rb- beam ratio factor, the ratio of cos(Ɵ)/cos(Z)
rd-ratio of the hourly diffuse solar radiation incident on a tilted surface to that on a horizontal
surface
S-tilted plane slope angle
Z-solar zenith angle
αs- solar azimuth angle
αT- surface azimuth angle
δ- solar declination angle
Ø- latitude of the site
ρ- ground reflectivity
Ɵi -solar incidence angle on tilted surface
From the weather station data, BN, Dh, Gh was achived. As solar elevation angle was also
achieved, so solar zenith angle was also achieved because
zenith angle,Z=90-elevation angle (Ec. 4.7)
To find out rd, there is lots of way to solve it. In this work, Liu and Jordan (1962), Koronakis
(1986) and Badescu (2002) method was used[ 11] to solve. At the final calculation, only Liu
and Jordan model was used.
For Liu and Jordan model,
2/)]cos(1[ Srd (Ec. 4.8)

Page 28 Thesis Report
For Badescu model,
4/)]2cos(3[ Srd (Ec. 4.9)
For Koronakis model,
)]cos(2[3/1 Srd (Ec. 4.10)
The ground reflectivity was assumed as 0.2.
As the houses of miraflores have different tilted plane slope angle, In this work,20(deg.) tilted
slope angle was assumed to do all the calculation. The houses also have different tilted
plane azimuth angle, so tilted plane azimuth angle was assumed as 0(degree), 15(degree),
30(degree).It was assumed that 30%,30% and 40% of the total house of miraflores have
surface azimuth angle as 0(degree), 15(degree), 30(degree).
4.4. Determination of the power and energy can be produced
on the available roof surface area
After getting the available roof surface area and the tilted solar radiation on the inclined roof
of miraflores, Its important to calculate the energy and power potential of the city using solar
pv technologies.
Total annual energy output can be calculate as[17],
E=Itilt*365*e*Savailroof (Ec. 4.11)
Where, Itilt is the mean global insolation on tilted surface, calculated as annual average and e
is the module efficiency and Savailroof is the available roof surface area for pv installation.
Now, considering different kind of losses (inverter losses, dc and ac cable losses,
temperature loss etc),to get a more accurate result, total annual energy is multiplied by
performance ratio(PR)[18]. Its range is between 0.5 and 0.9, we considered as 0.75.
To find out the power,
Power=Time
Energy (Ec. 4.12)

Thesis Title Page 29
5. Results and discussions
In this section, all the results of the area, solar radiation on inclined surface, energy and
power is put here. To get a better and quick result, Excel and Matlab is used.
5.1. Area of the miraflores de la Sierra
Urban area Area(m2)
Miraflores de la Sierra 309665
Las Huelgas 5885
Los Endrinales 24649
Los Pinarejos 25567
Remaining urban 69175
Total 434944
Table. 5.1. Roof surface area of different urban areas of Miraflores
Figure. 5.1. Roof surface area of different urbana reas of Miraflores

Page 30 Thesis Report
All the roof surface area of Miraflores is calculated.There is almost 1883 houses in the
región. These area is calculated in 2D projection. These are the area of flat surface
calculated using ArcGIS..
Urban area Area(m2)
Miraflores de la Sierra 329539.1438
Las Huelgas 6263.266503
Los Endrinales 26231.61794
Los Pinarejos 27208.42482
Remaining urban 73615.53492
Total 462857.9879
Table. 5.2. Inclined Roof surface area of different urbana areas of Miraflores for solar pv
installation
Figure. 5.2. Inclined Roof surface area of different urbana areas of Miraflores for solar pv
installation
In table 5.2 and figure 5.2, all the inclined roof surface is calculated. The total inclined roof
surface area of Miraflores is 462857.98m2. the máximum roof surface area is for the town,
329539.14m2.

Thesis Title Page 31
5.2. Available area of miraflores de la Sierra
Urban area Area(m2)
Miraflores de la Sierra 20086
Las Huelgas 381
Los Endrinales 1598
Los Pinarejos 1658
Remaining urban 4487
Total 28212.35
Table. 5.3. Available Roof surface area of different urbana reas of Miraflores for solar pv
installtion
Figure. 5.3. Available Roof surface area of different urbana reas of Miraflores for solar pv
installation
After getting the roof surface area of Miraflores,different type of coefficient considered to find
out the available roof surface area of pv installation. The available roof surface area for solar
pv installation area is 28212.35m2 in the city of Miraflores.

Page 32 Thesis Report
5.3. Solar radiation on horizontal and inclined surface
The yearly solar radiation data is obtained from Ciemat,Madrid,Spain. The global horizontal
radiation annually for everyday is 4.467 kwh/m2.
Surface
azimuth
angle LJ model BA model KR model
0 4.64 4.56 4.66
15 4.64 4.56 4.66
30 4.60 4.53 4.63
Table. 5.4. Global tilt radiation using diffrent model
Figure 5.4. Global tilt radiation using different type of model
Using the avaialble data for Madrid, global tilt radiation was found out using different type of
model. The slope of the inclined surface was considered as 20degree and surface azimuth
angle varies as 0, 15 and 30 degrees. Solar tilt radiation calculated by Liu and Jordan model,
Badescu model and Koronakis Model. Liu and Jordan model values were used to further
calculation.

Thesis Title Page 33
Month
Surface azimuth
angle,0
Surface azimuth
angle ,15
Surface azimuth
angle ,30
Jan 2.76 2.66 2.54
Feb 2.91 2.91 2.90
Mar 3.36 3.36 3.36
Apr 5.44 5.44 5.44
May 6.40 6.41 6.42
Jun 6.94 7.07 7.14
Jul 6.86 6.98 7.03
Aug 7.12 7.18 7.16
Sep 5.12 5.11 5.03
Oct 4.04 3.96 3.85
Nov 2.48 2.41 2.32
Dec 2.49 2.40 2.28
Annually average 4.64 4.64 4.60
Table. 5.5. Global tilt radiation using LJ model for monthly average

Page 34 Thesis Report
Figure 5.5. Global tilt radiation using Liu and Jordan of model for monthly average
All the 12 month average is showed in the table 6.4 and graph 6.4. the global solar tilt
radiation for 0,15 and 30 degree is 4.64khw/m2,4.64kwh/m2 and 4.60 kwh/m2.It is showing
that when the house is fully south oriented, It was getting the máximum value of global tilt
radiation. When the surface azimuth angle is getting higher, the global tilt radiation is getting
lower.
5.4. Power and energy generation in miraflores de la Sierra
efficiency energy(kwh)
Enrgy using
PR(kWh)
Si (crystalline) 22.90% 10903990 8177992
Si(multicrystalline) 15.50% 6550451 4912838
Si(thin film
polycrystalline) 8.20% 3465400 2599050
a-Si/a-SiGe/a-
SiGe 10.40% 4395141 3296356
Table. 5.6. Total anual energy output and total actual anual energy output considering PR

Thesis Title Page 35
Figure. 5.6. Total anual energy output using different technologies
In the table 5.6 and figure 5.6, total annual energy output was showed using different type of
solar pv technologies[19]. The maximum efficiency was containied by silicon crystalline type
and minimum efficiency was contained silicon(thin-film polycrystalline) type. The maximum
annual energy generation is 8177992kWh and the minimum is 2599050Wh.
Figure. 5.7. Total actual anual energy output using different technologies considering PR
To get the actual anual energy output, PR was considered and found out actual anual energy
output using different type of solar pv technologies[19]. The maximum annual energy
generation is 10903990kWh and the minimum is 3465400kWh.

Page 36 Thesis Report
efficiency
Enrgy using
PR(kWh) Power(kw)
Si (crystalline) 22.90% 8177992 934
Si(multi crystalline) 15.50% 4912838 561
Si(thin film
polycrystalline) 8.20% 2599050 297
a-Si/a-SiGe/a-SiGe 10.40% 3296356 376
Table. 5.7. Potential power output using different type of solar pv technologies
Figure. 5.8. Potential power output using different solar pv technologies
After finding out the actual energy annually, potential power also found out using different
type of solar pv technologies. The máximum power output was found by Si(crystalline), 934
kW and the mínimum power output was found by Si(thin-film polycrystalline), 297 kW.

Thesis Title Page 37
Conclusions
Using renewable energy now a days is a good option to meet the demand. To do it, it is very
important to know about the related parameter. To utilize the roof surface area of miraflores
and to use renewable energy, it’s very important to get the clear view of the available roof
surface area, solar radiation.
All the area of the roof top is calculated of the city of miraflores. all the 1883 houses are
considered in this project including all the main urban area and remaining urban area.
Because of 2D projection, at first the roofs are considered as flat roof and later inclined roof
surface area is calculated using formula. The available roof surface area for solar pv
installation is 28212.35 m2.
In the city of miraflores, all the roofs are inclined. So, to calculate the energy and power
potential, it is very important to know the global radiation on tilted surface of the area. But,
lack of the weather data of the city, the weather data of Madrid is considered and calculated.
Annual global radiation on 20 degree tilted surface result is 4.64 kWh/m2day. All the data is
calculated using the last 1year data from the research center. As all the houses are not south
oriented, so calculation were done for 0,15,20 degree surface azimuth angle.
There is many constraints considered in the roof top area of miraflores. Lots of coefficient
considered to get a better result for the available roof surface area for solar pv installation.
Calculating annual energy production using solar pv technologies, it was seen that higher
efficiency solar pv technologies gives higher energy output annually. But, it can be suggested
that before going to implement the solar pv technologies, the cost factor also should be
considered, as there has to be a trade off between the efficiency and cost of solar pv
technologies.
With a efficiency of 22.9% solar pv technologies( Si mono crystalline), annual energy output
is 8177992 kWh and the potential power output is 934 kW. Using a lower efficiency of 8.20%
solar pv technologies Si(thin film polycrystalline), annual energy output is 2599050 kWh and
the potential power output is 297 kW


Thesis Title Page 39
Future work
Doing this project, there was some constraints during the calculation. In the future work,
some part can be improved.
The inclined area- as there were no 3D projection remained, to calculate the inclined area,
some formula was used. It can suggested that getting the 3D projection of the city,can give a
better result for the inclined area of the city miraflores.
Solar tilt radiation- there was no available radiation data of miraflores, so the data from the
nearest weather station was used. Though all the calculated data was real data, it can be
suggested that getting the real data for miraflores will make a major change of calculated
energy and power potential of the city. The total inclined roof surface area is 462857m2. In
this work, only one year data was analyzed. It is strongly suggest that to take the real data of
10/12 years and analyze it because only one year data analyze cannot give a accurate
result.

Page 40 Thesis Report
References
[1] Bergamasco L., and Asinari P. Scalable methodology for the photovoltaic solar
energy potential assessment based on available roof surface area: Application to
Piedmont Region (Italy).Solar energy, volume 85 issue 5,May 2011, p. 1041-1055
[2] Hegedus S., and Luque A., Achievements and Challenges of Solar Electricity from
Photovoltaics. Handbook of Photovoltaic Science and Engineering (Second edition).p.
4-5.
[3] European photovoltaic industry association.Solar generation 6:solar photovoltaic
electricity empowering the world, 2011. p. 10.
[4] European photovoltaic industry association.Solar generation 6:solar photovoltaic
electricity empowering the world, 2011. p. 20.
[5] Hegedus S., and Luque A., Achievements and Challenges of Solar Electricity from
Photovoltaics. Handbook of Photovoltaic Science and Engineering (Second edition).p.
243.
[6] Hegedus S., and Luque A., Achievements and Challenges of Solar Electricity from
Photovoltaics. Handbook of Photovoltaic Science and Engineering (Second edition).p.
218.
[7] Hegedus S., and Luque A., Achievements and Challenges of Solar Electricity from
Photovoltaics. Handbook of Photovoltaic Science and Engineering (Second edition).p.
29.
[8] Hegedus S., and Luque A., Achievements and Challenges of Solar Electricity from
Photovoltaics. Handbook of Photovoltaic Science and Engineering (Second edition).p.
30.
[9] European photovoltaic industry association.Solar generation 6:solar photovoltaic
electricity empowering the world, 2011. p. 12.
[10] Izquierdo S.,Rodrigues M., and Fueyo N. A method for estimating the geographical
distribution of the available roof surface area for large-scale photovoltaic energy-
potential evaluations. Solar energy, volume 82 issue 10,October 2008, p. 929-939

Thesis Title Page 41
[11] Noorian A.M., Moradi I., Kamali G.A. Evaluation of 12 models to estimate hourly diffuse
irradiation on inclined surfaces. Renewable energy, volume 33 issue 6,June 2008, p.
1406-1412
[12] [http://files.sma.de/dl/7680/Perfratio-UEN100810.pdf, 31st August,2013]
[13] [http://www.pveducation.org/pvcdrom/properties-of-sunlight/declination-angle,1st
August,2013]
[14] Duffie A.J. and Beckman A.W., Solar Engineering of thermal Processes,(2nd edition).
John wiley and sons,Inc,1980, p. 10-15
[15] Hegedus S., and Luque A., Energy collected and delivered by PV modules. Handbook
of Photovoltaic Science and Engineering (Second edition).p. 986-987.
[16] [http://www.pveducation.org/pvcdrom/properties-of-sunlight/elevation-angle,1st
august,2013]
[17] Wiginton L.K., Nguyen H.T. and Pearce J.M.Quantifying rooftop solar photovoltaic
potential for regional renewable energy policy. Computers, Environment and Urban
Systems, volume 34 Issue 4, July 2010, p. 345–357
[18] [http://photovoltaic-software.com/PV-solar-energy-calculation.php,30th august,2013]
[19] Green, M. A., Emery, K., Hishikawa, Y., & Warta, W.Solar cell efficiency tables
(version 34). Progress in Photovoltaics: Research and Applications,volume 17 Issue
5,2009, p. 320-326
[20] Hegedus S., and Luque A., PV systems. Handbook of Photovoltaic Science and
Engineering (Second edition).p. 862-863.
[21] Duffie A.J. and Beckman A.W., Solar Engineering of thermal Processes,(2nd edition).
John wiley and sons,Inc,1980, p. 32-33
[22] European photovoltaic industry association.Solar generation 6:solar photovoltaic
electricity empowering the world, 2011. p. 14.
[23] Demain C., Journée M. And Bertrand C. Evaluation of different models to estimate the
global solar radiation on inclined surfaces. Renewable Energy, Volume 50, February
2013, p. 710-721
[24] [http://www.pveducation.org/pvcdrom/properties-of-sunlight/solar-time,1st august,2013]
[25] [http://www.esri.com/what-is-gis/overview#overview_panel, 29th august,2013]

Page 42 Thesis Report
[26] Eicker U.Solar technologies for Building,(1st edition). John wiley and sons,Inc,2001, p.
22
[27] [www.ign.es, 1st august,2013]
[28] [www.madrid.org/, 1st august,2013]
[29] [http://webtrans.geonica.com/index.php, 1st august,2013]


![EcoSummit Berlin - 2016€¦ · SMEs related to KIC InnoEnergy raising round 3 investments for further development: KIC InnoEnergy is } Ç^ µo] Ç_ µ v XtZ v]vÀ } ~ µ o] v ]À](https://img.dokumen.tips/doc/110x75/5fbcba6839b70e0dcd45e4c1/ecosummit-berlin-2016-smes-related-to-kic-innoenergy-raising-round-3-investments.jpg)