Embed Size (px)
Citation preview
© EIOPA –European Insurance and Occupational Pensions Authority–
email: [email protected]; Website: www.eiopa.europa.eu 1 of 31
EIOPA Solvency II DPM
Documentation
LAST UPDATE: 28/09/2015
© EIOPA –European Insurance and Occupational Pensions Authority–
email: [email protected]; Website: www.eiopa.europa.eu 2 of 31
Contents
I Abstract ................................................................................................ 3
II Introduction ......................................................................................... 3
III General building blocks and terminology of DPM methodology............. 4
III.1 DPM dictionary ................................................................................... 5
III.2 DPM framework ................................................................................. 9
III.3 Data point and fact ............................................................................12
IV Data Point Model for Solvency II ........................................................ 13
IV.1 Input materials: Reporting Templates and Business Logs .......................13
IV.2 MD and HD versions of the DPM ..........................................................14
IV.3 Structure of the Solvency II DPM ........................................................18
IV.3.1 Solvency II DPM Dictionary .............................................................19
IV.3.2 Solvency II Annotated Templates ....................................................24
IV.4 Differences between Reporting Templates and Annotated Templates .......30
© EIOPA –European Insurance and Occupational Pensions Authority–
email: [email protected]; Website: www.eiopa.europa.eu 3 of 31
I Abstract
This document described the Data Point Model [DPM] defined by EIOPA to support
reporting of Solvency II data. It introduces the DPM terminology, presents the resulting
artefacts (DPM Dictionary and Annotated Templates) and explains in details the approach
applied for data modelling.
II Introduction
One of the aims of EIOPA is to improve harmonisation and support coherent
application of rules applied for financial institutions and markets across the European
Union. In order to achieve this goal a set of common legal acts has been published: the
Framework Directive, the Implementing Technical Standards and the Public Guidelines.
These acts define among others a set of data to be reported by the undertakings (in
particular in the Reporting Templates and supporting Business Logs).
In order to facilitate the data exchange process, EIOPA decided to use an XBRL
standard as a mean for technical definition of information requirements (in form of XBRL
taxonomies) and as a technical data submission format (XBRL instance documents).
The Data Point Modelling methodology has emerged in the evolution process of
application of the XBRL standard for financial and prudential reporting1. In the beginning
and for the first few years XBRL taxonomies have been developed by the IT experts who
basically translated the tabular representation of information requirements to the
technical format. At some point though the maintenance and updates started to require
increasing business input and the business domain experts had been more and more
involved in the process. This caused the need for definition of a formal model for
description of requested data which could be provided by the data users and translated
to technical format by the IT without any loss of information or space for interpretation.
The resulting methodology has been called the Data Point Modelling to emphasise the
shift in the approach from the form centric representation of information requirements
(based on tabular views) to the data centric definitions (detailing properties of each
exchanged piece of information).
1 http://eurofiling.info/portal/data-point-model/
© EIOPA –European Insurance and Occupational Pensions Authority–
email: [email protected]; Website: www.eiopa.europa.eu 4 of 31
Currently DPM methodology is considered as an intermediary layer between the
information requirements definition in legal acts and its technical representation.
Following other European supervisors (such as EBA) and some National Competent
Authorities (NCAs) EIOPA decided to use this methodology to properly reflect in XBRL all
relevant properties of the exchanged data.
The result of the DPM modelling process is a structured description of the model in
form of a dictionary (listing and naming all breakdowns and their components identified
in the process of analysing the legal acts) and a set of annotated templates (tabular
views of requested data with description from the dictionary). These two documents are
subsequently used as the inputs for XBRL taxonomy generation process.
The result of application of the DPM methodology shall support fulfilment of the
following of requirements:
– remove redundancy of metadata definitions (no duplicated data points),
– increase consistency of metadata definitions (clarity and explicitness of
definitions),
– increase efficiency of data tagging and mapping (accuracy of assigning tags to
data points for generation to/from existing systems),
– advance metadata maintenance procedures (change management and
communication),
– facilitate non-IT technical experts’ involvement (data modelling is performed by
the business users),
– support data mapping procedures (manual and automatic).
III General building blocks and terminology of DPM
methodology
An important impact on the organization of the DPM has the process of its
definition. The starting point is a set of legal acts composed of the text of regulations,
guidelines, international standards and the tabular representation of the information
requirements. These input materials are analysed in order to define consistent
classifications (breakdowns with enumerated properties) used to categorise the content
© EIOPA –European Insurance and Occupational Pensions Authority–
email: [email protected]; Website: www.eiopa.europa.eu 5 of 31
of the tables2. The main division of in the DPM is therefore a clear separation of a
dictionary (definition of breakdowns in general) and the tabular representation of
current information requirements gathered in frameworks (which in case of the EIOPA
DPM takes form of the Annotated Templates). This is particularly important from the
standpoint of maintenance. While dictionary is expected to steadily grow it time and
assure backward compatibility (i.e. to support all previous versions), frameworks can
change more drastically and dynamically depending on actual information requirements.
III.1 DPM dictionary
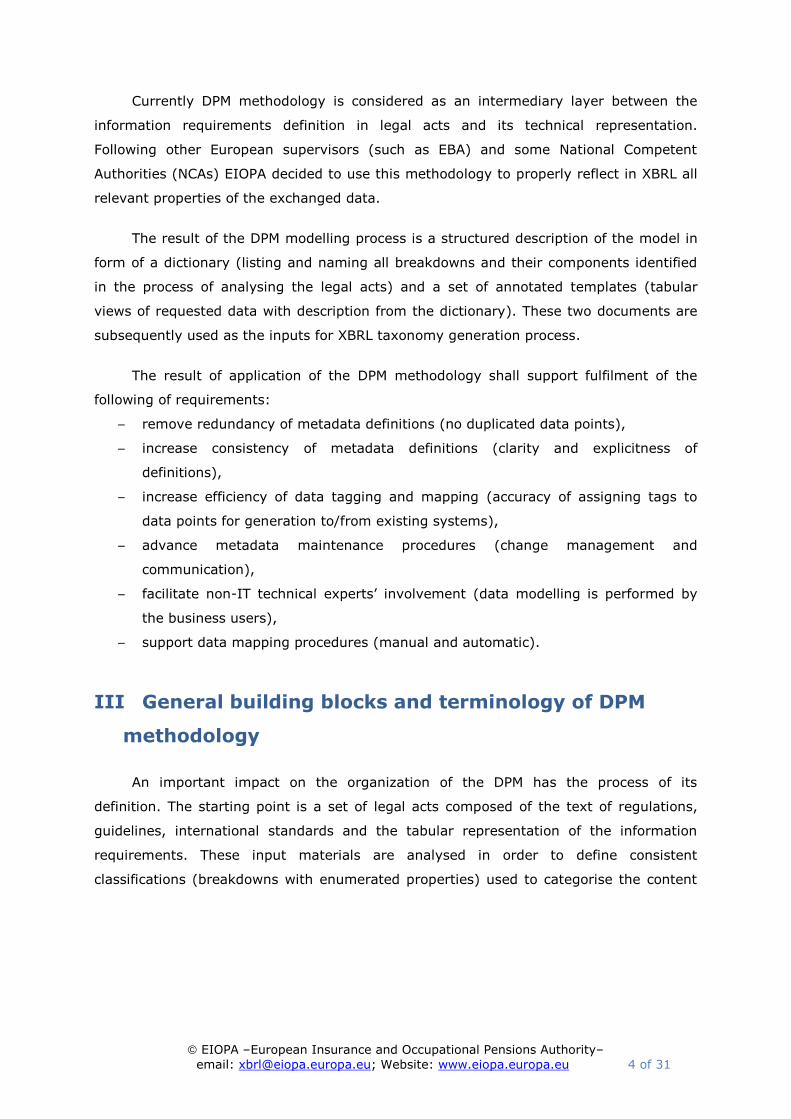
Dictionary defines the classifications used in data description. It does it by
identifying elements: metrics (that may be arranged in relationship sets), domains and
their value constraints or members (plus relationships between them) and dimension as
presented on Figure 1 and explained in the next paragraphs.
Figure 1. DPM dictionary
2 Ideally though, the process should be reversed, i.e. start with the definition of
breakdowns that would subsequently be applied in description of information
requirements presented in the tabular format.
© EIOPA –European Insurance and Occupational Pensions Authority–
email: [email protected]; Website: www.eiopa.europa.eu 6 of 31
Each dictionary element must have a unique (in scope of its definition3) name/code
and identify an owner (authority who defined it/is responsible for its maintenance).
Additionally it should have a human readable label (in one – usually English – or more
languages and optionally serving different roles/purposes) and may contain other
documentary properties (e.g. references to underlying legislation or guidelines, more
verbose explanations, etc.). For maintenance purposes declaration of each element must
contain a creation date, may include a date of last modification as well as a currency
period (from and to dates) when the element is considered to be in application.
A metric is the minimum description of each data point (each data point in the
model must include in its definition one, and only one, metric). It carries the information
on the expected value (data type) and the time context (period type)4. It may include
other semantics (business properties) depending on the approach taken by the author of
the model.
Other classifications are represented by domains. A domain is a set of
elements/values sharing a specified semantic nature. Domain can be of one of two kinds:
explicit and typed. An explicit domain has its elements enumerated in the model while
a typed domain values are assigned in the reports based on a specified format (data
type).
Elements of an explicit domain are called domain members. A domain member
(or simply a member) is enumerated element of an explicit domain. All members from a
domain share a certain common nature defined subjectively but applied consistently by
the model’s author. A typical example of a domain is “Geographical areas”. Members of
this domain could be different areas of the Earth, classified according to the physical
geography (“Europe”, “Pacific Ocean”, “Himalayas”, …) and/or human geography
(“France”, “EU”, “G-20 major economies”, …). Combining physical and human geography
into one domain is already the author’s subjective view of the classification. The number
of members in explicit domains varies from two (e.g. “Yes” and “No”) to hundreds (in
case of countries or currencies).
3 In general name/code must be unique for a given owner for metrics, domains and
dimensions. Relationship set and members’ names/codes must be unique for an owner
and a domain that they belong to.
4 Time context could be also carried by dimensional attributes.
© EIOPA –European Insurance and Occupational Pensions Authority–
email: [email protected]; Website: www.eiopa.europa.eu 7 of 31
An example of a typed domain could be the ISIN identifier (used to identify
uniquely financial instruments) which is restricted to a certain number of digits.
In order to document the relations between domain members or between metrics,
they can be gathered in relationship sets (sometimes called subdomains or
hierarchies). A relationship is constructed from nodes and arcs. A node refers to a
metric (in relationship sets for metrics) or to a domain member (in relationship set of
domain members). Nodes are arranged as directed graphs. An arc (edge) identifies the
source node, the target node and the order of the relation in a relationship set. It may
also identify a node as used for organizational purposes only (with usable property). Arcs
may also document the basic arithmetic relations by identifying the type of operation
(“≥”, “≤” or “=”) and weight by which the target node contributes to the value of a
source node (in applications of the DPM so far constrained mainly to identification of a
sign, i.e. “+1” and “-1”). In general all members of explicit domains should participate in
hierarchical relationships and whenever possible, these relationships shall reflect
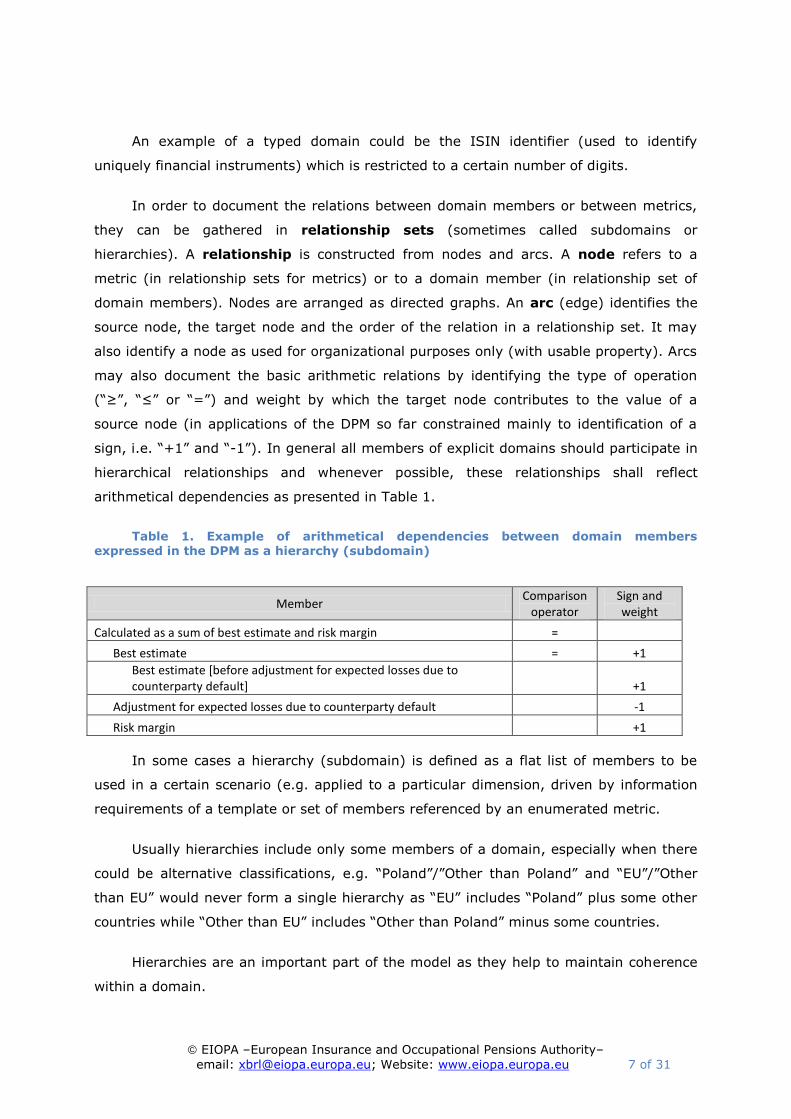
arithmetical dependencies as presented in Table 1.
Table 1. Example of arithmetical dependencies between domain members expressed in the DPM as a hierarchy (subdomain)
In some cases a hierarchy (subdomain) is defined as a flat list of members to be
used in a certain scenario (e.g. applied to a particular dimension, driven by information
requirements of a template or set of members referenced by an enumerated metric.
Usually hierarchies include only some members of a domain, especially when there
could be alternative classifications, e.g. “Poland”/”Other than Poland” and “EU”/”Other
than EU” would never form a single hierarchy as “EU” includes “Poland” plus some other
countries while “Other than EU” includes “Other than Poland” minus some countries.
Hierarchies are an important part of the model as they help to maintain coherence
within a domain.
Member Comparison
operator Sign and weight
Calculated as a sum of best estimate and risk margin = Best estimate = +1
Best estimate [before adjustment for expected losses due to counterparty default]
+1
Adjustment for expected losses due to counterparty default
-1
Risk margin
+1
© EIOPA –European Insurance and Occupational Pensions Authority–
email: [email protected]; Website: www.eiopa.europa.eu 8 of 31
In order to be used in description of information requirements a domain member or
a typed domain value requires a dimension that provides a context of its application. In
other words dimensions contextualise domain members when applied to a data point i.e.
they contribute to the semantics of a member which, without a dimension, may be
insufficient to represent the full meaning of a property. For instance, in case of
“Geographical areas” domain, “Spain” as a member could represent “Location of an
issuer” of a financial instrument, “Location of a stock exchange” where this instrument is
traded, “Location of a broker” who participated as a middleman in the transaction or
finally “Location of a buyer” who purchased this instrument. The same domain member
“Spain” was contextualised in this example by four different dimensions. A similar
situation may appear in case of a typed domain whose restriction could be different
based on the dimension contextualising its value, e.g. code = 123-345-567-890 could be
the “Identification number for tax purposes” or “Company registration number”, where
the kind/type of the number is given by the dimension.
Each dimension must be associated with a domain and may contextualize any
member or value of this domain. A domain may have associated more than one
dimension, in such a case a member of a domain can be contextualized with many
dimension when representing a reportable piece of information.
Explicit domain should specify a default member that is assumed to be applied to
all dimensions referring to this domain in case they are not explicitly used in description
of the required data, i.e. these default members are implicitly applied to every data point
that is not explicitly characterised by a particular dimension. For example, a dimension
“Original currency” may be associated with a default member “All currencies”. This
means that when a data point does not explicitly mention the “Original currency”
dimension, it is assumed that it takes the “All currencies” member for this dimension.
Default members are very useful when defining the model, as otherwise every data
point would have to explicitly mention each dimension and the applicable member. With
default members it is enough for a data point to name only the properties that are
important to distinguish this data point from other data points. Although technically in
XBRL the “default” is a property of a member with respect to a dimension, the DPM
assumes that all dimensions referring to a certain domain would have the same default
member. This means that only one member in a domain can be assigned as a default and
shall apply to all dimensions referring to this domain.
There could be dimensions in the model that do not apply to some data points. For
example, a data point representing “Equity instruments” is unlikely to be linked to the
© EIOPA –European Insurance and Occupational Pensions Authority–
email: [email protected]; Website: www.eiopa.europa.eu 9 of 31
“Original maturity” dimension (shares and other ownership rights usually do not have
maturity). Therefore, the default member is usually named “Total/Not-applicable”.
Data types of metrics and typed domains are in particular: monetary, decimal,
percentage, integer, boolean, date and URI but can be further extended (by defining new
data types or restricting existing data types) if needed. A metric may also be restricted to
a specific type of a typed domain or to an enumerated list of members. In the latter case
it refers to a relationship set of members, identifies a starting member and whether it is
included in the set of allowed values. In specific cases it may also inform how many
generations (children, grandchildren, …) of members form the list of allowed values and
take into account also the usable property (that may characterise the use of a member in
a hierarchy merely for grouping purposes).
III.2 DPM framework
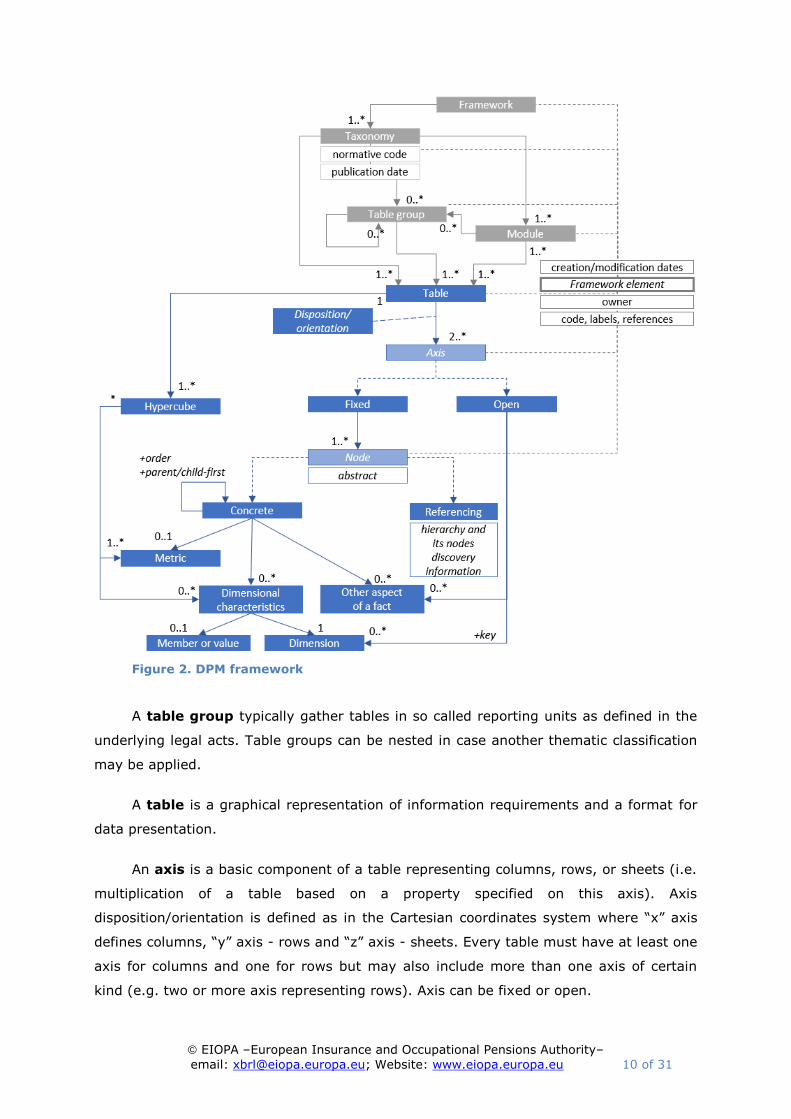
Framework represents information requirements for a specified scope.
Frameworks components and relations between them are presented schematically on
Figure 2.
A taxonomy is a version of a framework, identified by a reference to the
underlying legal acts (name and version of information requirements) plus a date stamp
(taxonomy publication date). A taxonomy consists of one or more tables that are usually
gathered in table groups and further referenced from modules. It is possible that a
taxonomy refers to and reuses tables from previous versions of a framework.
A module represents a set of information requirements that are supposed to be
submitted in a single report. Typical factors taken into account when defining the scope
of a module include:
- data nature homogeneity,
- frequency of reporting (i.e. scope of data transmitted on monthly, quarterly,
yearly basis),
- subject scope (e.g. solo and consolidated data),
- accounting or other regulations impacting definitions of data.
Reporting entity classifies a report for submission according to one of modules
predefined in the taxonomy.
© EIOPA –European Insurance and Occupational Pensions Authority–
email: [email protected]; Website: www.eiopa.europa.eu 10 of 31
Figure 2. DPM framework
A table group typically gather tables in so called reporting units as defined in the
underlying legal acts. Table groups can be nested in case another thematic classification
may be applied.
A table is a graphical representation of information requirements and a format for
data presentation.
An axis is a basic component of a table representing columns, rows, or sheets (i.e.
multiplication of a table based on a property specified on this axis). Axis
disposition/orientation is defined as in the Cartesian coordinates system where “x” axis
defines columns, “y” axis - rows and “z” axis - sheets. Every table must have at least one
axis for columns and one for rows but may also include more than one axis of certain
kind (e.g. two or more axis representing rows). Axis can be fixed or open.
© EIOPA –European Insurance and Occupational Pensions Authority–
email: [email protected]; Website: www.eiopa.europa.eu 11 of 31
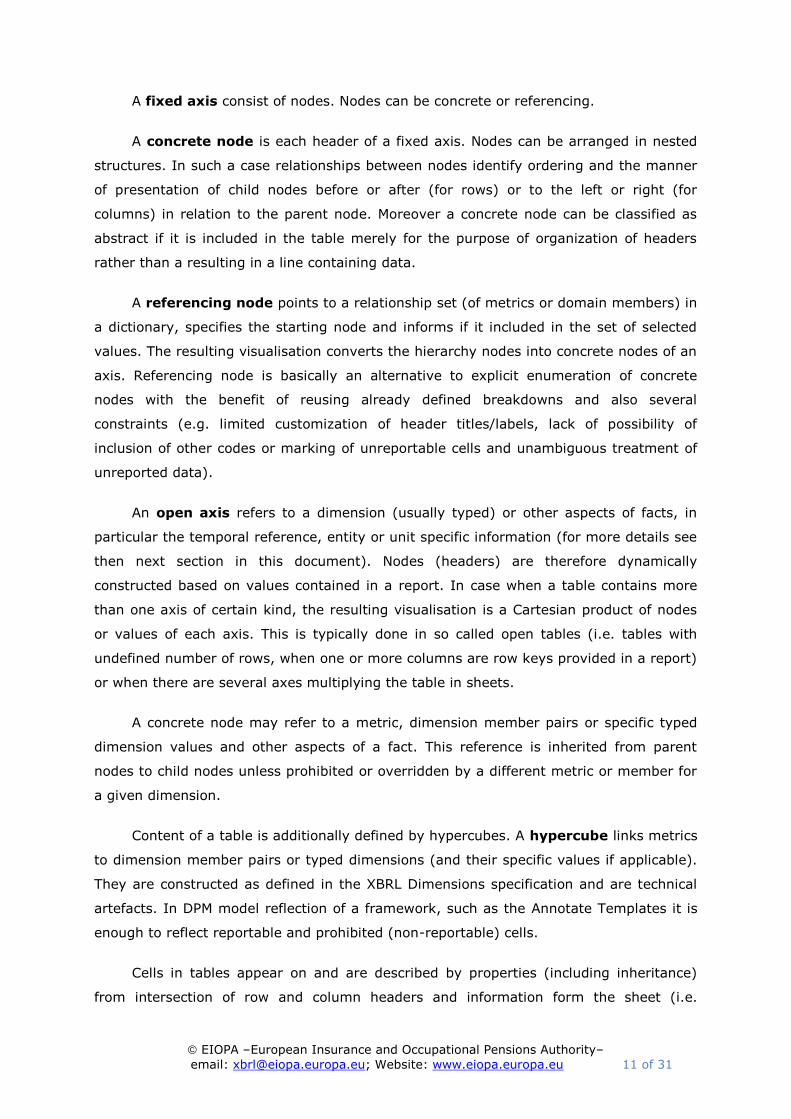
A fixed axis consist of nodes. Nodes can be concrete or referencing.
A concrete node is each header of a fixed axis. Nodes can be arranged in nested
structures. In such a case relationships between nodes identify ordering and the manner
of presentation of child nodes before or after (for rows) or to the left or right (for
columns) in relation to the parent node. Moreover a concrete node can be classified as
abstract if it is included in the table merely for the purpose of organization of headers
rather than a resulting in a line containing data.
A referencing node points to a relationship set (of metrics or domain members) in
a dictionary, specifies the starting node and informs if it included in the set of selected
values. The resulting visualisation converts the hierarchy nodes into concrete nodes of an
axis. Referencing node is basically an alternative to explicit enumeration of concrete
nodes with the benefit of reusing already defined breakdowns and also several
constraints (e.g. limited customization of header titles/labels, lack of possibility of
inclusion of other codes or marking of unreportable cells and unambiguous treatment of
unreported data).
An open axis refers to a dimension (usually typed) or other aspects of facts, in
particular the temporal reference, entity or unit specific information (for more details see
then next section in this document). Nodes (headers) are therefore dynamically
constructed based on values contained in a report. In case when a table contains more
than one axis of certain kind, the resulting visualisation is a Cartesian product of nodes
or values of each axis. This is typically done in so called open tables (i.e. tables with
undefined number of rows, when one or more columns are row keys provided in a report)
or when there are several axes multiplying the table in sheets.
A concrete node may refer to a metric, dimension member pairs or specific typed
dimension values and other aspects of a fact. This reference is inherited from parent
nodes to child nodes unless prohibited or overridden by a different metric or member for
a given dimension.
Content of a table is additionally defined by hypercubes. A hypercube links metrics
to dimension member pairs or typed dimensions (and their specific values if applicable).
They are constructed as defined in the XBRL Dimensions specification and are technical
artefacts. In DPM model reflection of a framework, such as the Annotate Templates it is
enough to reflect reportable and prohibited (non-reportable) cells.
Cells in tables appear on and are described by properties (including inheritance)
from intersection of row and column headers and information form the sheet (i.e.
© EIOPA –European Insurance and Occupational Pensions Authority–
email: [email protected]; Website: www.eiopa.europa.eu 12 of 31
particular multiplication of a table). Non-reportable cells (usually marked graphically as
criss-crossed or grey shaded and excluded from reporting as illogical or simply
unrequested) are a result superposition of the hypercubes (that define only allowed
combinations) on the table visualization (based on axes and their content).
Similarly to dictionary elements, framework elements such as frameworks itself,
taxonomy, module, table group, table, axis and node are identified by a code/name,
human readable label and owner. Axis nodes usually contain also a code (called “rc-
code”) that facilitates addressing of cells in a table.
III.3 Data point and fact
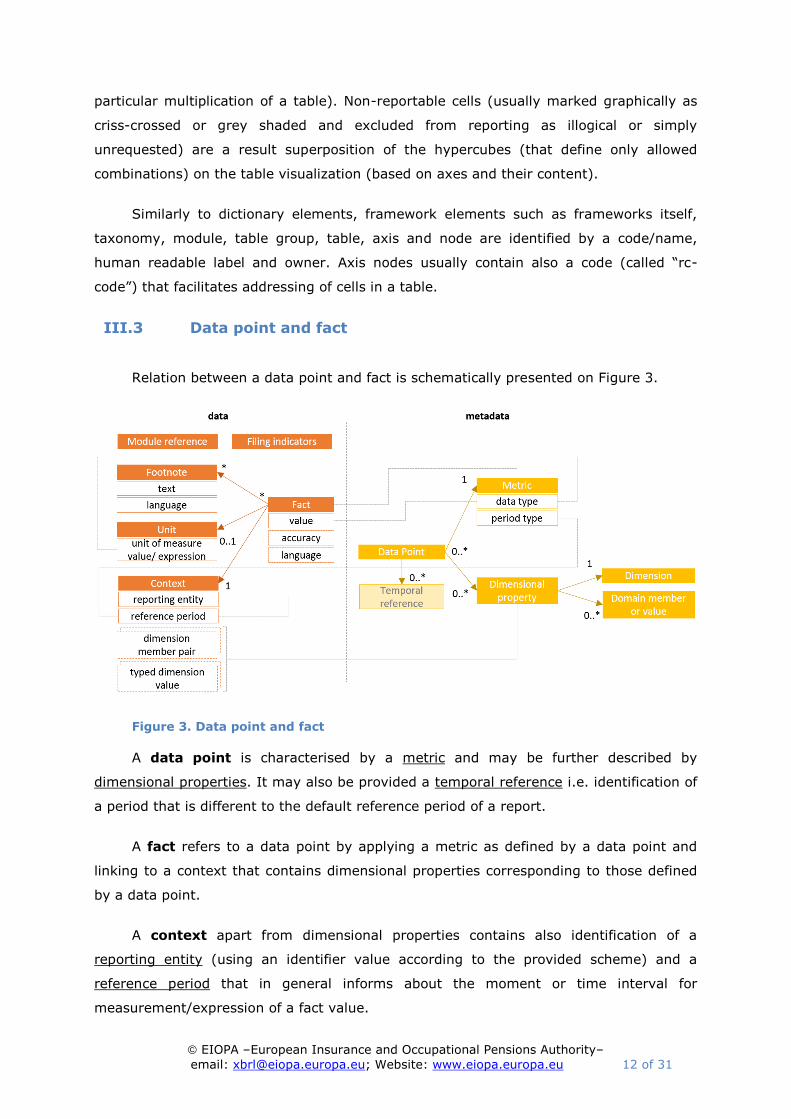
Relation between a data point and fact is schematically presented on Figure 3.
Figure 3. Data point and fact
A data point is characterised by a metric and may be further described by
dimensional properties. It may also be provided a temporal reference i.e. identification of
a period that is different to the default reference period of a report.
A fact refers to a data point by applying a metric as defined by a data point and
linking to a context that contains dimensional properties corresponding to those defined
by a data point.
A context apart from dimensional properties contains also identification of a
reporting entity (using an identifier value according to the provided scheme) and a
reference period that in general informs about the moment or time interval for
measurement/expression of a fact value.
© EIOPA –European Insurance and Occupational Pensions Authority–
email: [email protected]; Website: www.eiopa.europa.eu 13 of 31
Non-numeric facts may contain an attribute informing about the language for its
textual value.
Numeric facts contain an attribute expressing data accuracy and refer to declaration
of a unit of measure.
Footnotes can be provide additional textual explanation on facts.
As explained in the previous sections, a report must also identify a module based
on which it was created and contain a list of filing indicators referring to reported units
(table groups or tables) that are further used as preconditions for evaluations of
validation rules.
IV Data Point Model for Solvency II
Solvency II Data Point Model follows the organization as presented in the previous
section. However it has also many unique features that differentiate it from other existing
DPMs (such as the EBA model used in banking supervision). These are in particular:
– two layers approach (MD and HD),
– significant portion of complex open tables (with unknown and potentially large
number of rows) which requires simplification of their modelling in order to allow
usability,
– high number of entry points (modules) reflecting various reporting scenarios,
– Excel format for definition of the model in form of the DPM Dictionary and
Annotated Templates (aiming to resemble the Business Templates from the
Solvency II legal acts),
– technical constructs applied in these Excel files in order to extract all DPM
metadata in an automated manner to a structured format of a DPM database and
subsequently to XBRL taxonomy syntax.
The chapter describes in details the approach applied in the DPM modelling of
Solvency II information requirements.
IV.1 Input materials: Reporting Templates and Business Logs
The Solvency II information requirements are primarily defined in:
- the Draft ITS on Regular Supervisory Reporting (Draft ITS),
- the ITS on Special Purpose Vehicles (ITS),
© EIOPA –European Insurance and Occupational Pensions Authority–
email: [email protected]; Website: www.eiopa.europa.eu 14 of 31
- the Guidelines on Financial Stability Reporting (Guidelines),
- the Guidelines on Third Country Branches (Final Report),
- Unofficial reporting templates including ECB add-ons (ECB add-ons).
The main inputs for definition of the Solvency II DPM model are the Reporting
Templates and the Business Logs supporting the above legal acts.
Reporting Templates reflect Solvency II information requirements arranged in the
form of tabular views while the Business Logs specify in more detail manner the
requested content by giving the meaning of information described by particular rows and
columns of each template.
From the data modelling perspective, they provided all necessary information for
identification of the general breakdowns describing the requested data (defined in the
DPM Dictionary), current reporting requirements (in the form of sets of data points
represented by the DPM Annotated Templates) as well as the checks and constraints on
values to be reported.
IV.2 MD and HD versions of the DPM
The main purpose of the DPM methodology is to identify each reportable piece of
information (a data point) in a precise and unambiguous manner. As a result the DPM
defines usually high number of dimensions. This situation has a number of advantages:
– the model is data centric and independent from the particular views of data
(templates),
– each data point is classified in detailed according to all applicable characteristics
that are defined separately,
– dependencies between concepts are explicit and clearly identifiable,
– supports change management (based on defining specific differences),
– applied breakdowns can be used for various purposes including data querying for
analysis,
– a bridge with other reporting frameworks can be established using specific
properties on each data point,
– data model is less subjective and has fewer space for arbitrary modelling
decisions (e.g. if a certain property shall be included in the semantics of a metrics
or represented by a dimensional property).
Detailed definition of each property comes however at cost of readability of a
model. It also impacts the technical representation of the model in the XBRL format:
© EIOPA –European Insurance and Occupational Pensions Authority–
email: [email protected]; Website: www.eiopa.europa.eu 15 of 31
instance documents are larger in terms of size and code which hinders performance of
their parsing and validation. Additionally the XBRL Formula assertions require to use a
high number of dimensions in order to properly filter the facts for evaluation of variables
in the context of a report.
To overcome the drawbacks while maintaining of all benefits the Solvency II DPM
applies two layers for data modelling and representation:
– a Highly Dimensional (HD) approach and
– a Moderately Dimensional (MD) approach.
© EIOPA –European Insurance and Occupational Pensions Authority–
email: [email protected]; Website: www.eiopa.europa.eu 16 of 31
In HD approach the model is defined according the DPM methodology where
metrics resemble the very basic properties of a data point that typically determine only
its data type. In MD approach the semantics of each metric is extended by inclusion in its
definition a number of dimensional properties that in the HD approach are represented by
separate and independent dimension-member pairs. Decision on which properties are
included in the MD metric is closely aligned with the template view of the required data
set (as described in the next paragraphs of this chapter). Other dimensional properties
are shared between the two approaches and applied to data points in both versions. This
means that MD and HD versions resemble the same model, but MD includes some of the
business properties in the definition of a metric while the HD approach keeps all business
semantics as dimension-member pairs.
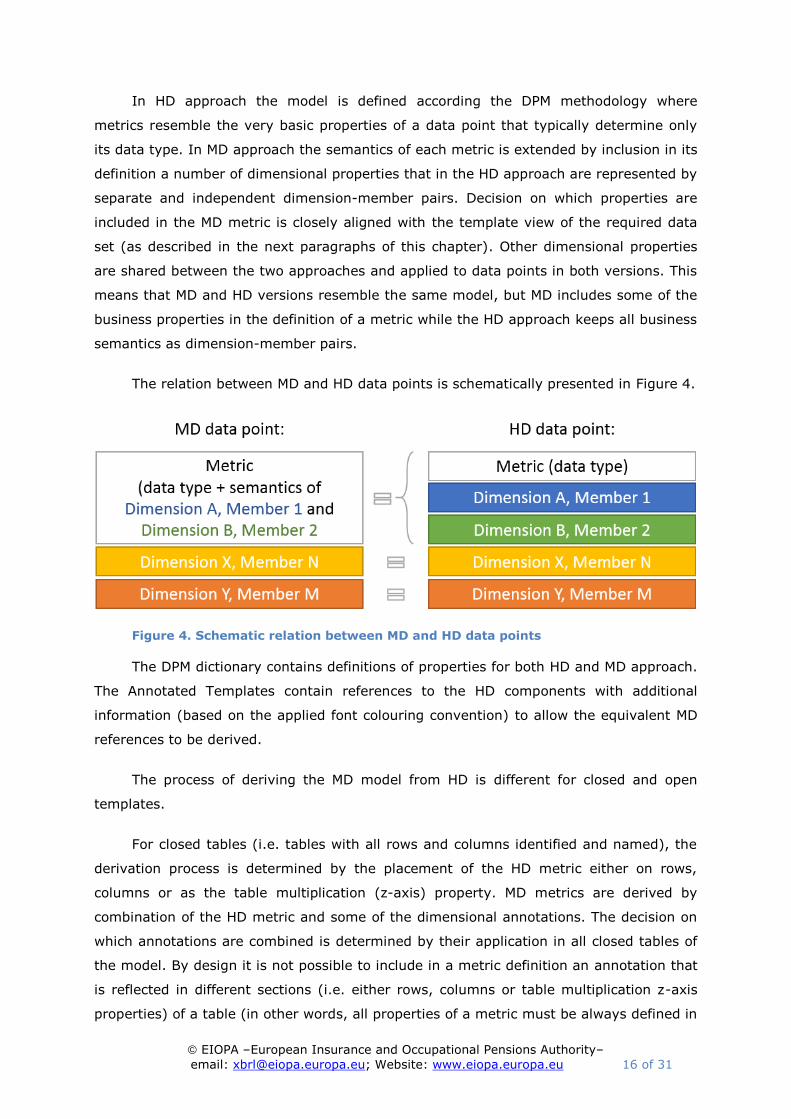
The relation between MD and HD data points is schematically presented in Figure 4.
Figure 4. Schematic relation between MD and HD data points
The DPM dictionary contains definitions of properties for both HD and MD approach.
The Annotated Templates contain references to the HD components with additional
information (based on the applied font colouring convention) to allow the equivalent MD
references to be derived.
The process of deriving the MD model from HD is different for closed and open
templates.
For closed tables (i.e. tables with all rows and columns identified and named), the
derivation process is determined by the placement of the HD metric either on rows,
columns or as the table multiplication (z-axis) property. MD metrics are derived by
combination of the HD metric and some of the dimensional annotations. The decision on
which annotations are combined is determined by their application in all closed tables of
the model. By design it is not possible to include in a metric definition an annotation that
is reflected in different sections (i.e. either rows, columns or table multiplication z-axis
properties) of a table (in other words, all properties of a metric must be always defined in
© EIOPA –European Insurance and Occupational Pensions Authority–
email: [email protected]; Website: www.eiopa.europa.eu 17 of 31
a single section of a table). All dimensions that must not be included in the definition of
MD metrics in closed tables are marked in the DPM Dictionary as “Dimension in MD
closed”5.
Open tables (i.e. tables with unknown number of rows) include three types of
columns:
a) columns which are a part of a key for unique identification of each row (and
are therefore modelled as typed or explicit dimensions)6,
b) columns which are not part of a key and are modelled as dimensions,
c) columns that resemble data points to be reported for each row (annotation
of these columns include identification of metrics).
Columns which can be part of the key (a) or are not part of a key but are modelled
as dimensions (b) are resembled in the same way in the MD version as they are in the
HD version. Columns that resemble data points (c) are in MD version described as a
single metric that combines information from the HD metric and all HD dimensional
properties. Note that in this case the “Dimension in MD closed” property is not applicable
for exclusion of certain dimensions from being included in the MD metric definition as it is
very important for the XBRL file size and processing performance that all facts in a row
have the same dimensional description (identified by the dimensions which are part of a
key).
As a result the same data point appearing in an open and closed table of the model
may be theoretically defined in a different manner in the MD approach (using a different
5 Dimensions are marked as “Dimension in MD closed” when such dimension is used
on a different section (row/columns/table multiplication) than a metric in at least one of
the closed table of the model. In such case the dimension cannot be merged in the MD
metric definition. This helps to avoid situations of the same data point being defined
differently in the MD model (i.e. using two different MD metrics).
6 In some cases, particularly when multiple columns contribute to a key (resulting
in a so-called composite natural key), the DPM may include an additional property that
should serve solely as a unique key (also known as an artificial key). This property is
represented by a typed dimension, whose domain is a set of identifiers for rows defined
by each filer in the submitted report.
© EIOPA –European Insurance and Occupational Pensions Authority–
email: [email protected]; Website: www.eiopa.europa.eu 18 of 31
metric that in case of open table includes some dimensional annotation in its definition
while in a close table this annotation is defined separately to the metric).
In general annotations which identify a default member for a dimension should not
be present in the Annotate Templates. If such case occurs that annotation would never
be included in the MD metric definition.
MD metric labels are derived from the HD model by concatenating the HD metric
label and those HD dimension-member pairs that are included in MD metric definition (as
explained in derivation process above). These dimension-member pairs are ordered
according to an algorithm (sorted alphabetically by domain code, dimension code and
member label) to ensure consistency, and are separated by pipe characters (“|”). As a
result, labels of MD metrics follow the general pattern:
Metric: {label of HD metric}|{dimension code}/{label of domain
member}|{dimension code}/{label of domain member}|…
For example:
Metric: Monetary|TA/Maximum value|VG/Solvency II|BC/Loss|CC/Facultative
Please note that technical XBRL representation of the Solvency II framework
components and reporting in XBRL format is made only in the MD version of the model;
the HD version is defined for reference purposes only
IV.3 Structure of the Solvency II DPM
There is no single predefined format for representation of the DPM. The ones
commonly used is an Excel workbook (in this format the DPM is usually created and
edited)7, a database (used for maintenance and quality/consistency checks) and an XBRL
taxonomy (applied for reporting in XBRL). EIOPA applies all these three formats. The
latter two are IT artefacts explained in separate documentations. This document focuses
on description of an Excel format where the business users define the DPM.
7 Excel format is commonly known to the business experts developing the model
and open source or inexpensive commercial tools allow editing and reviewing of its
content.
© EIOPA –European Insurance and Occupational Pensions Authority–
email: [email protected]; Website: www.eiopa.europa.eu 19 of 31
As described in the section III of this document, a DPM consists of Dictionary and
Framework. The latter can be organized for instance in a form of an Analysis Matrix, as in
case of the EBA, or as Annotated Templates in case of EIOPA. Annotated Templates have
several advantages over the Analysis Matrix:
– they are close to the Business Templates,
– each table is modelled at once (not by row/columns/table multiplication
approach),
– it is possible to identify crossed-out cells in a single view.
The original disadvantage of the Annotated Templates was high flexibility of its
structure which made it complex to develop an automated process of XBRL taxonomy
development. This obstacle has been overcome in the current Solvency II DPM Annotated
Templates by applying named ranges and cell styles.
IV.3.1 Solvency II DPM Dictionary
Solvency II DPM Dictionary is defined in the form of an MS Excel workbook. It
consists of numerous worksheets as described below and presented on screenshot on
Figure 5:
– worksheet listing all owners together with their codes8,
– worksheet listing all domains together with their codes and types (explicit/typed),
– worksheet listing all dimensions together with their codes and reference to
domains,
– two worksheets listing metrics, one for HD and one for MD version of the model;
declaration of a metric includes identification of the constraint towards the
reportable values to a specified type (e.g. monetary, string, etc.) or enumeration
(by identification of the hierarchy and optionally also the starting member whose
descendants – taking into account the usable property – form the list of allowed
values to be reported),
– one worksheet for each explicit domain defining (among others):
o unstructured list of all domain members (of which at least one is marked
as a default member),
o relationships between domain members (arithmetical if possible).
8 As explained in section III.1 of this document Owner is an authority who defines
the concepts in the dictionary and is responsible for their maintenance.
© EIOPA –European Insurance and Occupational Pensions Authority–
email: [email protected]; Website: www.eiopa.europa.eu 20 of 31
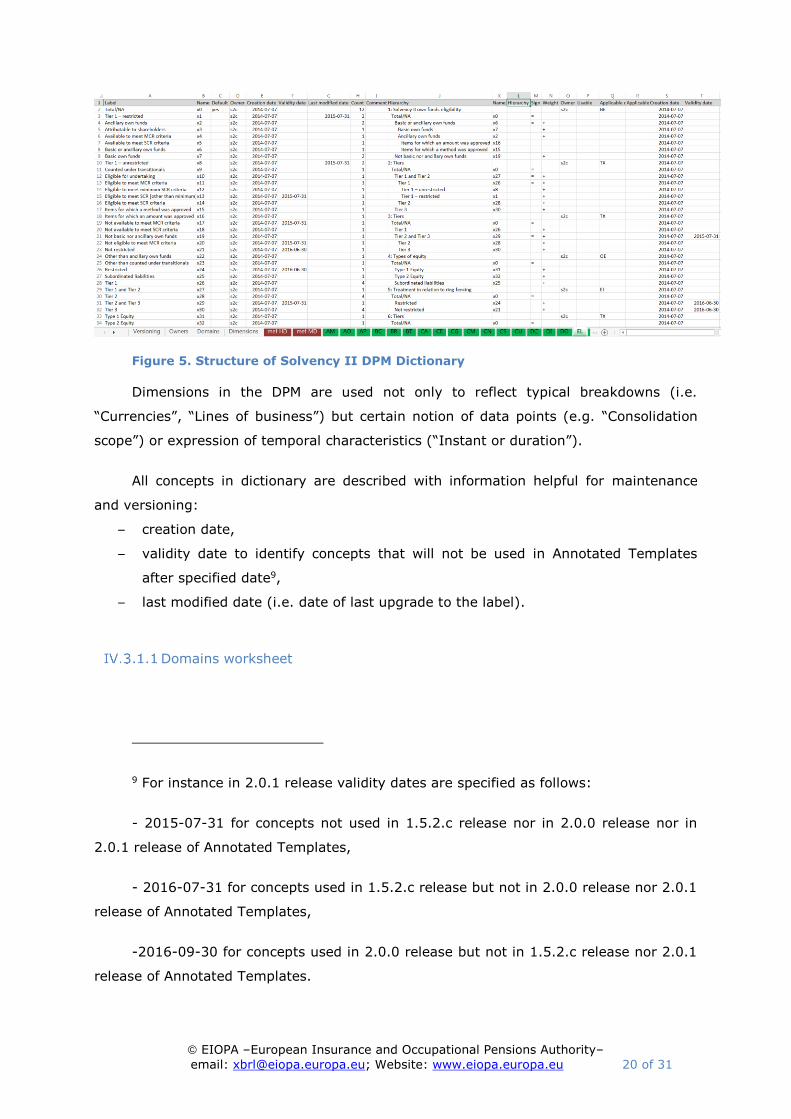
Figure 5. Structure of Solvency II DPM Dictionary
Dimensions in the DPM are used not only to reflect typical breakdowns (i.e.
“Currencies”, “Lines of business”) but certain notion of data points (e.g. “Consolidation
scope”) or expression of temporal characteristics (“Instant or duration”).
All concepts in dictionary are described with information helpful for maintenance
and versioning:
– creation date,
– validity date to identify concepts that will not be used in Annotated Templates
after specified date9,
– last modified date (i.e. date of last upgrade to the label).
Domains worksheet
9 For instance in 2.0.1 release validity dates are specified as follows:
- 2015-07-31 for concepts not used in 1.5.2.c release nor in 2.0.0 release nor in
2.0.1 release of Annotated Templates,
- 2016-07-31 for concepts used in 1.5.2.c release but not in 2.0.0 release nor 2.0.1
release of Annotated Templates,
-2016-09-30 for concepts used in 2.0.0 release but not in 1.5.2.c release nor 2.0.1
release of Annotated Templates.
© EIOPA –European Insurance and Occupational Pensions Authority–
email: [email protected]; Website: www.eiopa.europa.eu 21 of 31
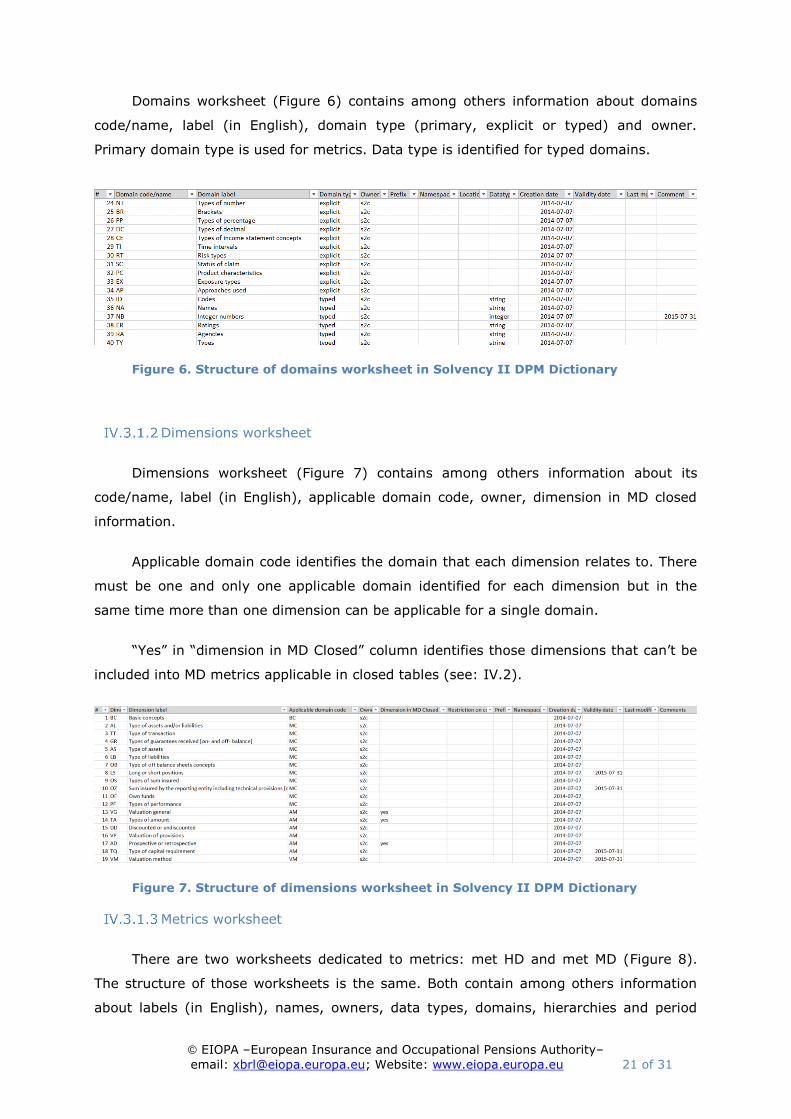
Domains worksheet (Figure 6) contains among others information about domains
code/name, label (in English), domain type (primary, explicit or typed) and owner.
Primary domain type is used for metrics. Data type is identified for typed domains.
Figure 6. Structure of domains worksheet in Solvency II DPM Dictionary
Dimensions worksheet
Dimensions worksheet (Figure 7) contains among others information about its
code/name, label (in English), applicable domain code, owner, dimension in MD closed
information.
Applicable domain code identifies the domain that each dimension relates to. There
must be one and only one applicable domain identified for each dimension but in the
same time more than one dimension can be applicable for a single domain.
“Yes” in “dimension in MD Closed” column identifies those dimensions that can’t be
included into MD metrics applicable in closed tables (see: IV.2).
Figure 7. Structure of dimensions worksheet in Solvency II DPM Dictionary
Metrics worksheet
There are two worksheets dedicated to metrics: met HD and met MD (Figure 8).
The structure of those worksheets is the same. Both contain among others information
about labels (in English), names, owners, data types, domains, hierarchies and period
© EIOPA –European Insurance and Occupational Pensions Authority–
email: [email protected]; Website: www.eiopa.europa.eu 22 of 31
types10. MD metrics labels are derived from HD components according to procedure
described in section IV.2.
Domain information is applicable only to enum:enumerationItemType metrics. Two
additional columns are referenced in those cases:
Hierarchy – identifying the a relationship set of domain members that are
potential value of a metric. The set can be of nested structure,
Member (optional) - it identifies in case of nested relationship sets starting
nodes that are excluded from the set of selected values (i.e. if it is
“Total/NA” then it means that children of “Total/NA” are available values but
“Total/NA” is not)(see section Error! Reference source not found.).
Figure 8. Structure of metrics worksheet in Solvency II DPM Dictionary
Domain worksheet
Domain worksheets (Figure 9) contain two sections of information:
unstructured list of elements, including its label (in English), name and owner.
This section is also used to identify a default member (“Yes” in “Default” column)
and to count, how many times each domain member is being referenced from
relationship sets section (“Count” column),
10 All Solvency II metrics are of instant period type. DI domain is used to specify
period type attribute.
© EIOPA –European Insurance and Occupational Pensions Authority–
email: [email protected]; Website: www.eiopa.europa.eu 23 of 31
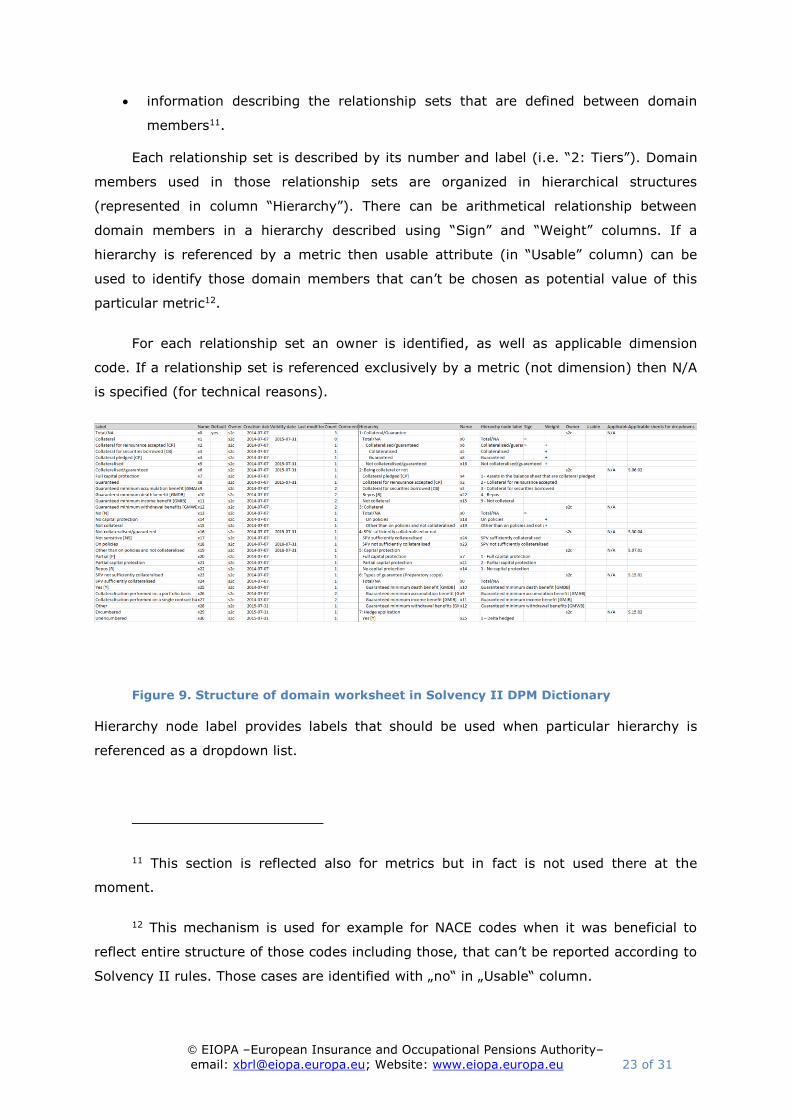
information describing the relationship sets that are defined between domain
members11.
Each relationship set is described by its number and label (i.e. “2: Tiers”). Domain
members used in those relationship sets are organized in hierarchical structures
(represented in column “Hierarchy”). There can be arithmetical relationship between
domain members in a hierarchy described using “Sign” and “Weight” columns. If a
hierarchy is referenced by a metric then usable attribute (in “Usable” column) can be
used to identify those domain members that can’t be chosen as potential value of this
particular metric12.
For each relationship set an owner is identified, as well as applicable dimension
code. If a relationship set is referenced exclusively by a metric (not dimension) then N/A
is specified (for technical reasons).
Figure 9. Structure of domain worksheet in Solvency II DPM Dictionary
Hierarchy node label provides labels that should be used when particular hierarchy is
referenced as a dropdown list.
11 This section is reflected also for metrics but in fact is not used there at the
moment.
12 This mechanism is used for example for NACE codes when it was beneficial to
reflect entire structure of those codes including those, that can’t be reported according to
Solvency II rules. Those cases are identified with „no“ in „Usable“ column.
© EIOPA –European Insurance and Occupational Pensions Authority–
email: [email protected]; Website: www.eiopa.europa.eu 24 of 31
IV.3.2 Solvency II Annotated Templates
Solvency II Annotated Templates reflect DPM framework (see section III.2). They
provide a mapping between the Reporting Templates and DPM dictionary.
The Annotated Templates contain the HD model only and enough information to
derive the MD from it (see section IV.2). This means that the Annotated Templates do
not have to duplicate information (which must be kept in sync between the two models)
causing a maintenance burden and a risk of errors.
Annotated Templates are defined in the form of an Excel workbook containing a
number of worksheets. In general one worksheet describes one Business Template
(however more than one graphical table may be annotated in one worksheet).
DPM qualifiers used in annotation represent the codes or labels of concepts defined
in the dictionary. They may be associated with each row, column and entire table (if
applicable). Details explaining the DPM qualifiers are described in the next sections of
this chapter.
Organization of Annotated Templates
Organization of Annotated Templates follows the Technical Standard (ITS). The
general assumption is to assign the same template code when a template is used,
without any changes, across different variants and entry points (modules). For example,
S.02.02 is the same for solo and group variants, therefore in the Annotate Templates
codification there is one template S.02.02.01 used in two entry points (01 and 04).
Table codes in Annotated Templates use the predefined structure
{(S|SR).XX.YY.ZZ.WW} comprising the following elements:
S|SR13: an alphanumeric code for the global reporting package. For
Solvency II reporting it is either regular S (for regular Solvency II) or SR (for
ring-fenced funds). Other frameworks like the Solvency II ECB add-ons or
Special Purpose Vehicles (SPVs) have different prefixes.
XX: a numeric code for the templates group, for example 01 (for Basic
Information), 02 (for Balance Sheet), etc.,
13 Note that the code SR was not used in Public Consultation but is planned to be
added for ring-fenced funds on the final package.

© EIOPA –European Insurance and Occupational Pensions Authority–
email: [email protected]; Website: www.eiopa.europa.eu 25 of 31
YY: a numeric code for the specific template (sequential code kept stable over
time),
ZZ: two digits assigned to an entry point (reporting obligation) which can be
reused by other entry points (with a higher number) if the template is the
same14 as presented on Figure 10.
o the annual individual templates are considered the “default” one (as it
is the largest package) and has code “01”;
o for other entry points it is assessed if the template with code “01” can
be reused; if not, the template is assigned a sequential code: “02”;
subsequent entry points may reuse template “01” or “02” if they are
identical; if not the template is assigned another sequential code “03”
and so on (see example for S.01.03 in Figure 10),
WW: table number within an Annotated Templates; it is related to the XBRL
taxonomy implementation; EIOPA has made a commitment to keep the code
stable as long as there are no business changes to the particular table
requirements (if there are modifications, a new table with a new code will be
assigned and the previous table will become obsolete or will be replaced)15.
Figure 10. Organisation of Annotated Templates
Annotation process
The process of annotating templates aims to associate the Reporting Templates
with comprehensive, precise and explicit descriptions of business characteristics relevant
to all data cells.
14 A similar approach was used for this code in the IT implementation of the
codification for the Solvency II Preparatory Phase.
15 This helps, for example, during an IT mapping exercise to identify tables that
need to be remapped because something has changed.
© EIOPA –European Insurance and Occupational Pensions Authority–
email: [email protected]; Website: www.eiopa.europa.eu 26 of 31
The characteristics (breakdowns and their components) used to annotate the cells
are documented in a comprehensive manner in the DPM Dictionary.
The annotation process consists of the following steps:
1. Business experts analyse a template row by row, column by column,
including the header information (e.g. title of a template) and related
documentation (in particular Business Logs).
2. In case of an open table (with unknown number of rows) the key columns
are identified and annotated as typed or explicit dimensions. They serve as a
key to each row. If among columns there is no candidate for the key or the
number of potential keys is high a new columns serving as an artificial key is
added to a table.
3. HD metric (primary characteristic) must be assigned to every data cell,
either as a property of a table and hence applying to the entire content of a
table (all cells in a table), or to all rows or columns,
4. Remaining applicable business properties (pairs of dimension-members) are
assigned to data cells similarly as in case of metrics, as a table header or for
one or more rows/columns,
5. Consistency of characteristics is verified and (optionally) DPM is updated for
required but missing metrics or remaining business properties (dimensions,
domains and members).
© EIOPA –European Insurance and Occupational Pensions Authority–
email: [email protected]; Website: www.eiopa.europa.eu 27 of 31
Annotation convention
Annotation of Business Templates is conducted through assignment of metrics and
other business properties (dimension-member pairs) to each identifiable data cell by their
application to the entire table, its row or column (and hence to a data cell which is on the
intersection). It is possible to apply multiple sets of characteristics to each data cell.
Characteristics applicable to data cells are arranged graphically in either
subsequent vertical columns (below each column of an annotated template) or horizontal
rows (on the right-hand side of each row of an annotated template). Characteristics
applicable to the entire table are described in a separate location on the worksheet (as a
“Z axis:” property usually above the table). In case of semi open tables (i.e. which rows
or columns are multiplied by a specified explicit dimension members hierarchy) the
expandable rows or columns are annotated as “X axis:” or “Y axis:”.
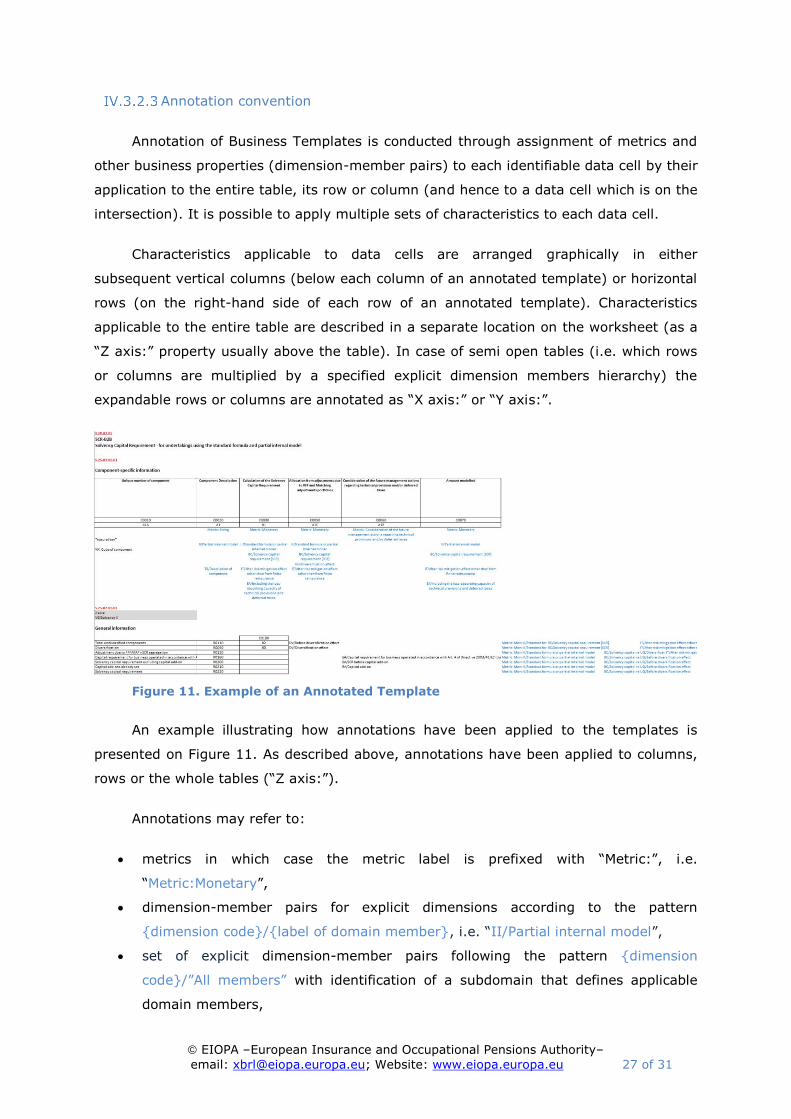
Figure 11. Example of an Annotated Template
An example illustrating how annotations have been applied to the templates is
presented on Figure 11. As described above, annotations have been applied to columns,
rows or the whole tables (“Z axis:”).
Annotations may refer to:
metrics in which case the metric label is prefixed with “Metric:”, i.e.
“Metric:Monetary”,
dimension-member pairs for explicit dimensions according to the pattern
{dimension code}/{label of domain member}, i.e. “II/Partial internal model”,
set of explicit dimension-member pairs following the pattern {dimension
code}/”All members” with identification of a subdomain that defines applicable
domain members,
© EIOPA –European Insurance and Occupational Pensions Authority–
email: [email protected]; Website: www.eiopa.europa.eu 28 of 31
typed dimensions annotated as {dimension code}:{label of dimension}, i.e. “NF:
Number of fund”.
Note that when there are multiple variants of a template which differ only by the “Z
axis:” property, they can be combined onto one sheet using multiple “Z axis:” sections.
For open tables, the columns which uniquely identify the row are annotated with
identification of the type of key:
*natural key* if a column is required to uniquely identify the row,
*artificial key*, when a columns was introduced to replace/in addition to a
number of potential *natural keys*,
*foreign key* to identify the relation between tables that were normalized (i.e.
*foreign key to S.06.02.01.02*). In a table where information is classified as
*foreign key* such information can be reported multiple times.In a table where
the foreign key refers to (S.06.02.01.02 in provided example) information can be
reported just once.
Blue font identifies the HD annotation that is replaced by the MD metric (for each
row, column or table “Z axis:” property. Black font identifies dimensional annotation
applicable to both MD and HD approaches.
Named ranges and cell styles
To allow the automated process of parsing of the Annotated Templates to a
structured format (database, XBRL, etc.), each template and table is described using MS
Excel named ranges and (if applicable) cell styles. Examples and explanation of some
named ranges in provided in Table 2.
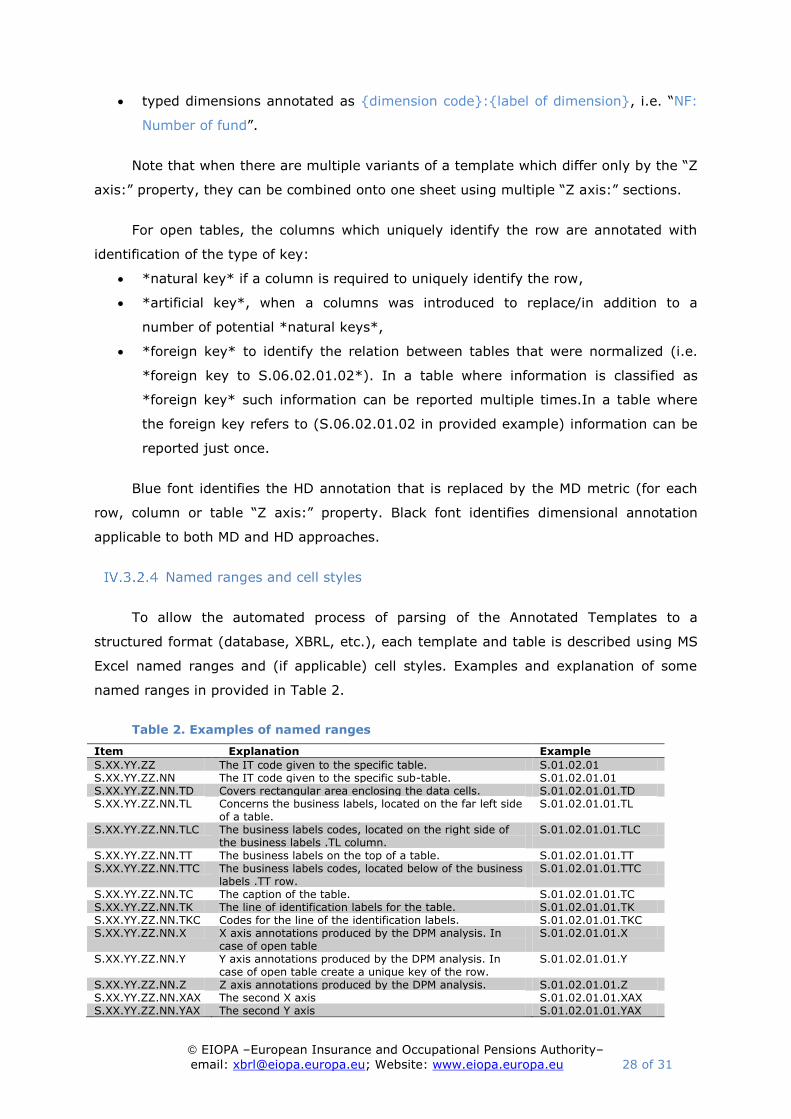
Table 2. Examples of named ranges
Item Explanation Example
S.XX.YY.ZZ The IT code given to the specific table. S.01.02.01 S.XX.YY.ZZ.NN The IT code given to the specific sub-table. S.01.02.01.01 S.XX.YY.ZZ.NN.TD Covers rectangular area enclosing the data cells. S.01.02.01.01.TD S.XX.YY.ZZ.NN.TL Concerns the business labels, located on the far left side
of a table. S.01.02.01.01.TL
S.XX.YY.ZZ.NN.TLC The business labels codes, located on the right side of the business labels .TL column.
S.01.02.01.01.TLC
S.XX.YY.ZZ.NN.TT The business labels on the top of a table. S.01.02.01.01.TT S.XX.YY.ZZ.NN.TTC The business labels codes, located below of the business
labels .TT row. S.01.02.01.01.TTC
S.XX.YY.ZZ.NN.TC The caption of the table. S.01.02.01.01.TC S.XX.YY.ZZ.NN.TK The line of identification labels for the table. S.01.02.01.01.TK S.XX.YY.ZZ.NN.TKC Codes for the line of the identification labels. S.01.02.01.01.TKC S.XX.YY.ZZ.NN.X X axis annotations produced by the DPM analysis. In
case of open table S.01.02.01.01.X
S.XX.YY.ZZ.NN.Y Y axis annotations produced by the DPM analysis. In case of open table create a unique key of the row.
S.01.02.01.01.Y
S.XX.YY.ZZ.NN.Z Z axis annotations produced by the DPM analysis. S.01.02.01.01.Z S.XX.YY.ZZ.NN.XAX The second X axis S.01.02.01.01.XAX S.XX.YY.ZZ.NN.YAX The second Y axis S.01.02.01.01.YAX
© EIOPA –European Insurance and Occupational Pensions Authority–
email: [email protected]; Website: www.eiopa.europa.eu 29 of 31
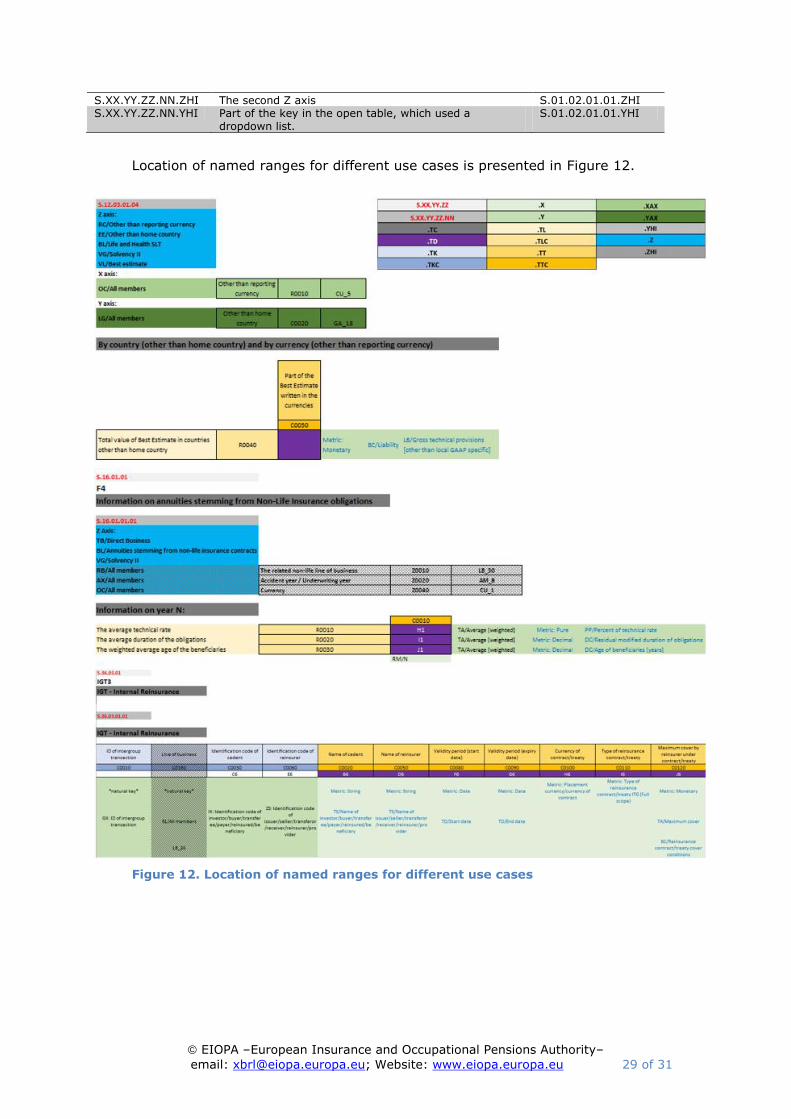
S.XX.YY.ZZ.NN.ZHI The second Z axis S.01.02.01.01.ZHI S.XX.YY.ZZ.NN.YHI Part of the key in the open table, which used a
dropdown list. S.01.02.01.01.YHI
Location of named ranges for different use cases is presented in Figure 12.
Figure 12. Location of named ranges for different use cases
© EIOPA –European Insurance and Occupational Pensions Authority–
email: [email protected]; Website: www.eiopa.europa.eu 30 of 31
IV.4 Differences between Reporting Templates and Annotated
Templates
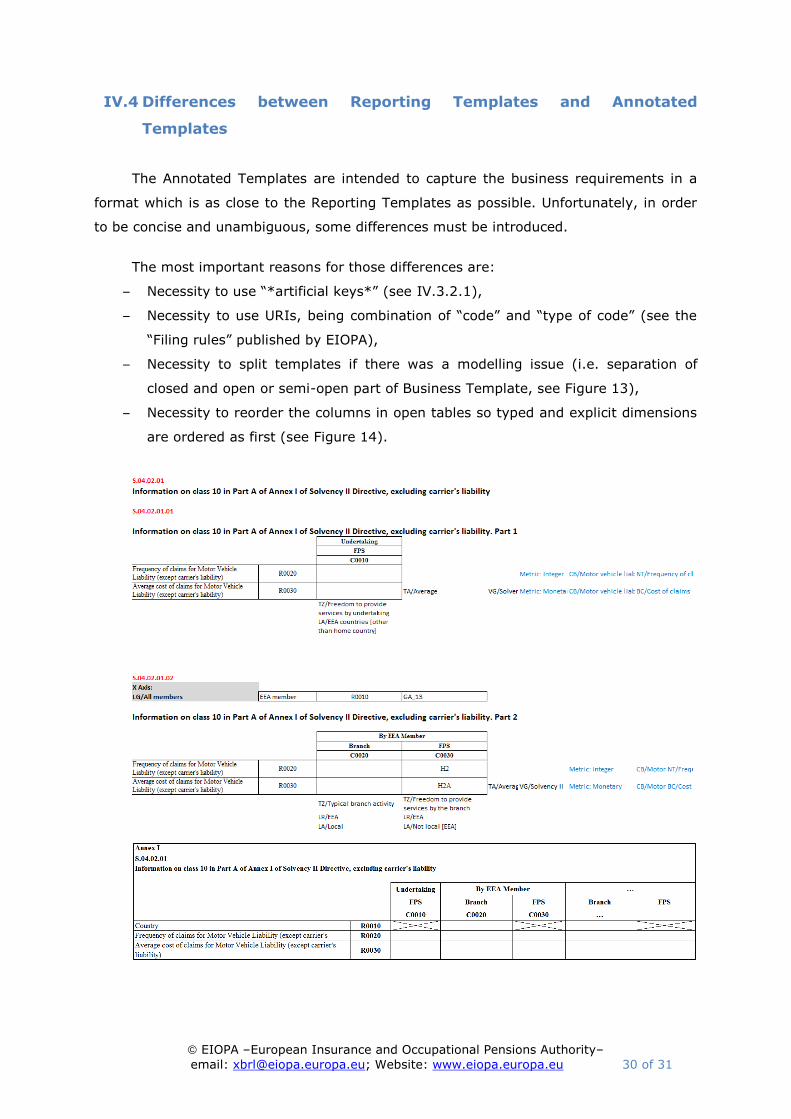
The Annotated Templates are intended to capture the business requirements in a
format which is as close to the Reporting Templates as possible. Unfortunately, in order
to be concise and unambiguous, some differences must be introduced.
The most important reasons for those differences are:
– Necessity to use “*artificial keys*” (see IV.3.2.1),
– Necessity to use URIs, being combination of “code” and “type of code” (see the
“Filing rules” published by EIOPA),
– Necessity to split templates if there was a modelling issue (i.e. separation of
closed and open or semi-open part of Business Template, see Figure 13),
– Necessity to reorder the columns in open tables so typed and explicit dimensions
are ordered as first (see Figure 14).
© EIOPA –European Insurance and Occupational Pensions Authority–
email: [email protected]; Website: www.eiopa.europa.eu 31 of 31
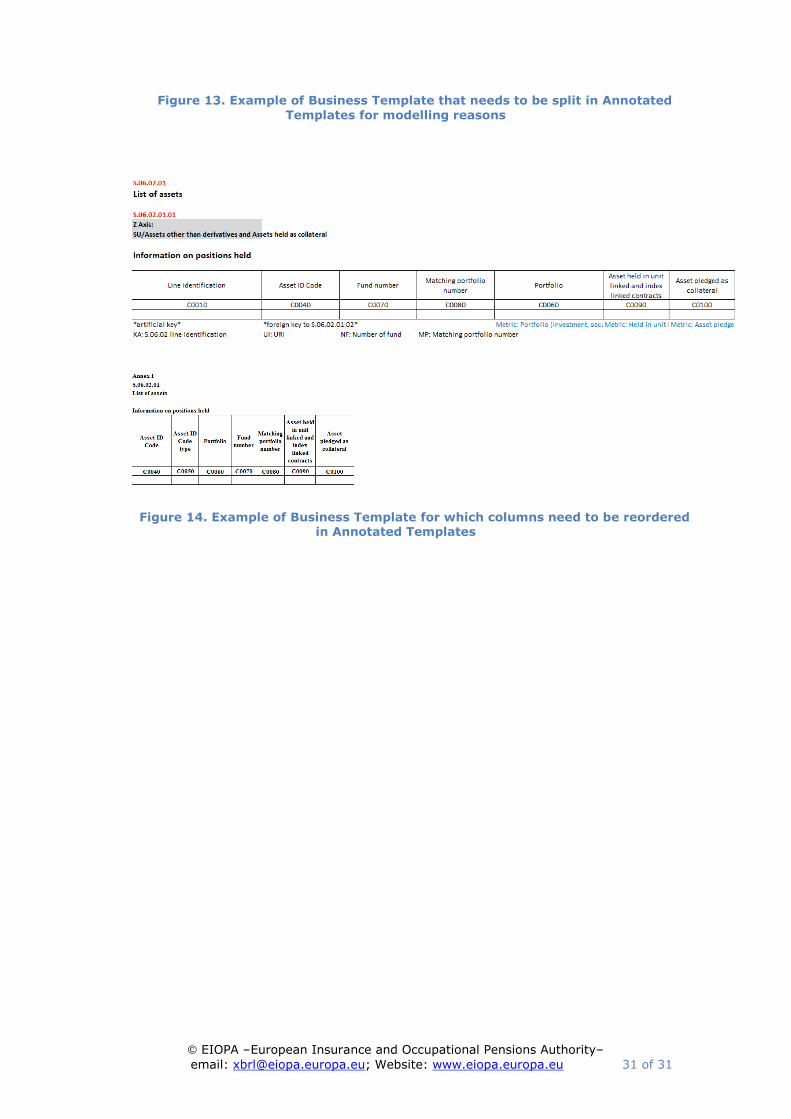
Figure 13. Example of Business Template that needs to be split in Annotated
Templates for modelling reasons
Figure 14. Example of Business Template for which columns need to be reordered in Annotated Templates