Embed Size (px)
Citation preview
DMB
Dr. Perdana Wahyu Santosa
Delineating
Efficient
Portfolio
Key Concepts and Skills
Combination of Two Risky Assets
Shape of The Portfolio Curve
The Efficient Frontier
Examples and Applications

Combination of Two Risky Assets
1 1 2 2
1
2
The expected return on a portfolio of two assets is given by:
(1)
is the proportion asset 1 in the portfolio
is the proportion asset 2 in the portfolio
is the ex
P
P
R w R w R
where
w
w
R
1
2
pected return on the portfolio
is the expected return on the asset 1
is the expected return on the asset 2
R
R
( )i iE R R
Combination of Two Risky Assets
1 2
2 1
1 1 1 2
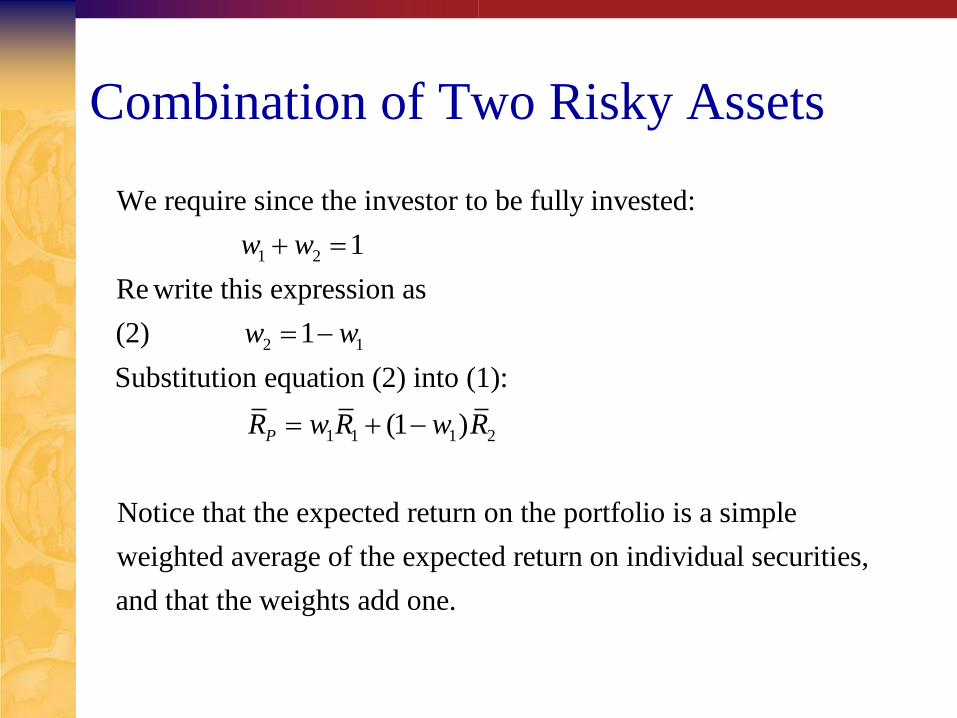
We require since the investor to be fully invested:
1
Re write this expression as
(2) 1
Substitution equation (2) into (1):
(1 )
Notice
P
w w
w w
R w R w R
that the expected return on the portfolio is a simple
weighted average of the expected return on individual securities,
and that the weights add one.
4
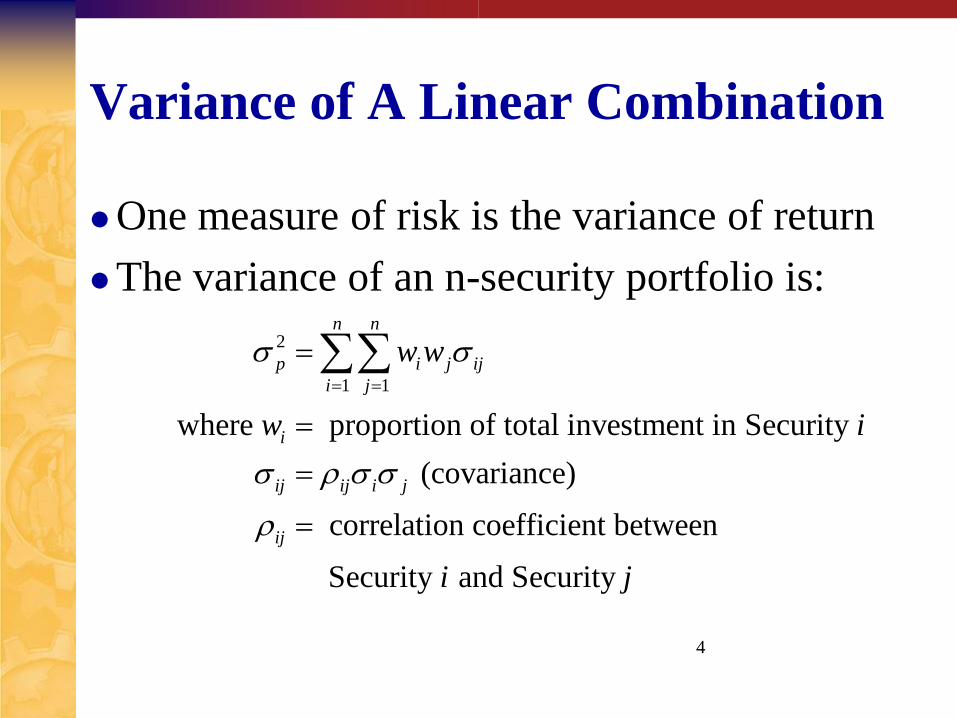
Variance of A Linear Combination
One measure of risk is the variance of return
The variance of an n-security portfolio is:
2
1 1
where proportion of total investment in Security
(covariance)
correlation coefficient between
Security and Security
n n
p i j ij
i j
i
ij ij i j
ij
w w
w i
i j
Combination of Two Risky Assets
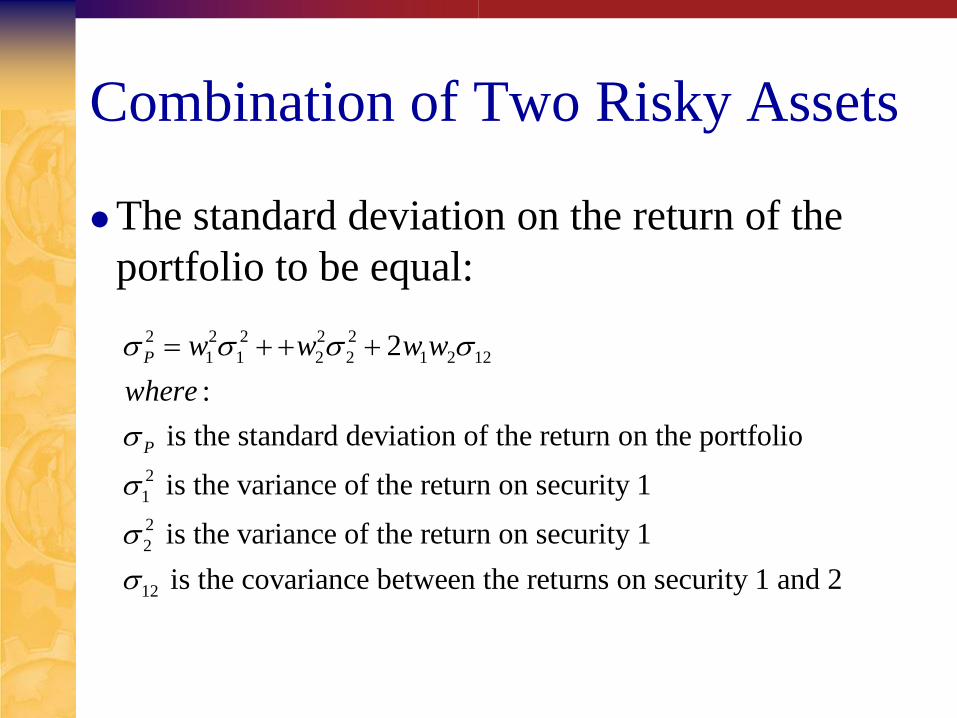
The standard deviation on the return of the
portfolio to be equal:
2 2 2 2 2
1 1 2 2 1 2 12
2
1
2
2
12
2
:
is the standard deviation of the return on the portfolio
is the variance of the return on security 1
is the variance of the return on security 1
is the cov
P
P
w w w w
where
ariance between the returns on security 1 and 2
Combination of Two Risky Assets
22 2 2 2
1 1 1 2 1 1 12
1212 12 12 1 2
1 2
12
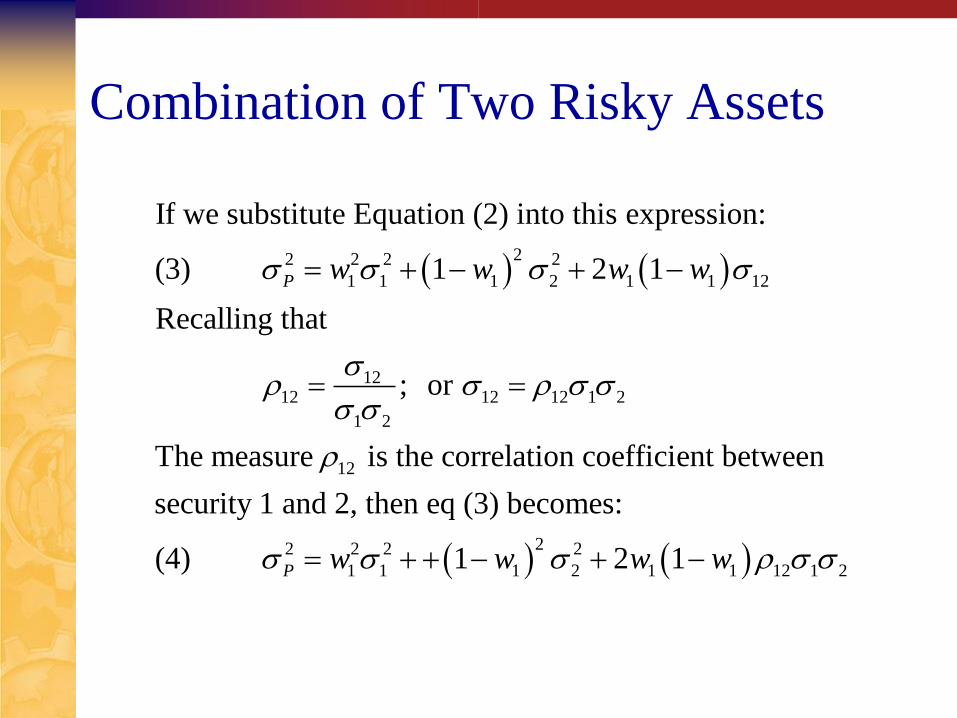
If we substitute Equation (2) into this expression:
(3) 1 2 1
Recalling that
; or
The measure is the correlation coefficient bet
P w w w w
22 2 2 2
1 1 1 2 1 1 12 1 2
ween
security 1 and 2, then eq (3) becomes:
(4) 1 2 1P w w w w
7
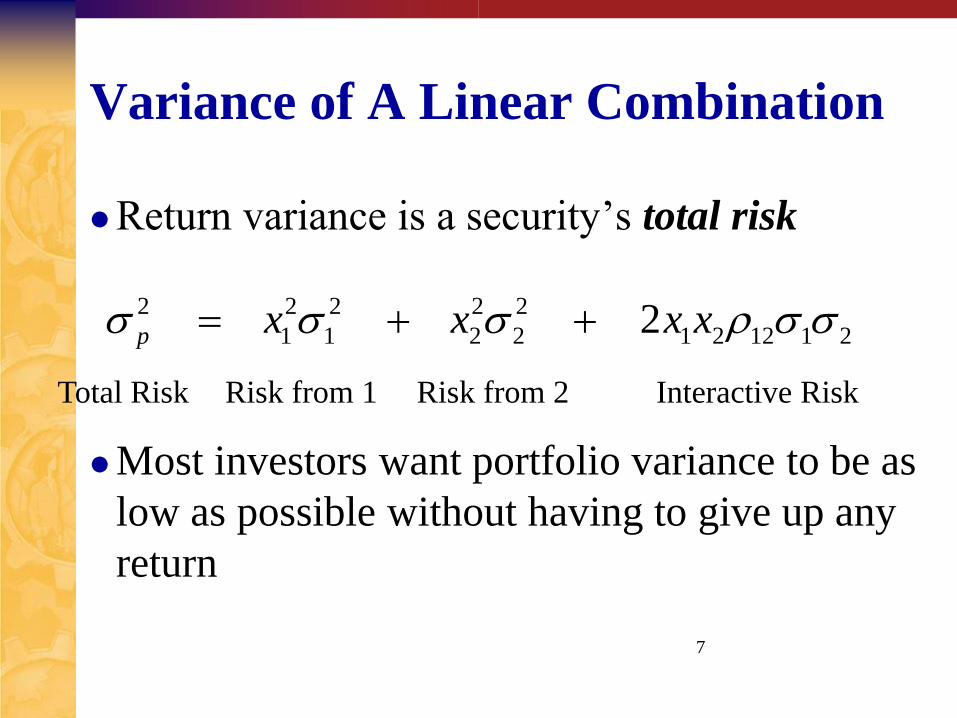
Variance of A Linear Combination
Return variance is a security’s total risk
Most investors want portfolio variance to be as
low as possible without having to give up any
return
2 2 2 2 2
1 1 2 2 1 2 12 1 2 2p x x x x
Total Risk Risk from 1 Risk from 2 Interactive Risk

Combination of Two Risky Assets
The standard deviation of the portfolio is not,
in general, a simple-weighted average of the
standard deviation each security.
Some specific cases involving different degrees
of co-movement between securities (covariance
and coefficient of correlation).
A correlation coefficient has: 1 1ij
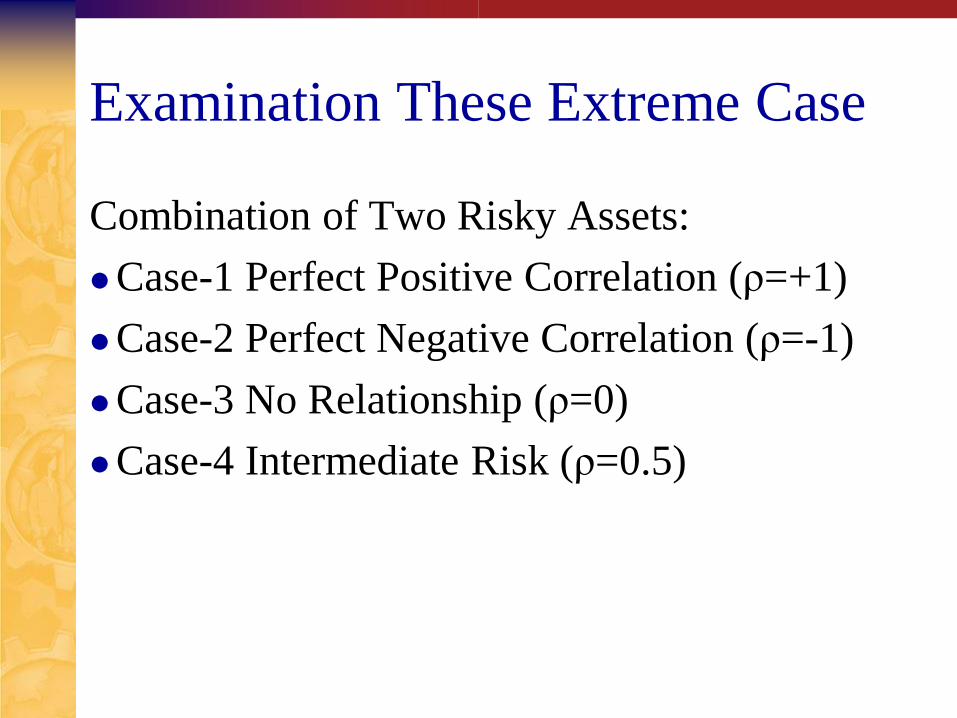
Examination These Extreme Case
Combination of Two Risky Assets:
Case-1 Perfect Positive Correlation (ρ=+1)
Case-2 Perfect Negative Correlation (ρ=-1)
Case-3 No Relationship (ρ=0)
Case-4 Intermediate Risk (ρ=0.5)
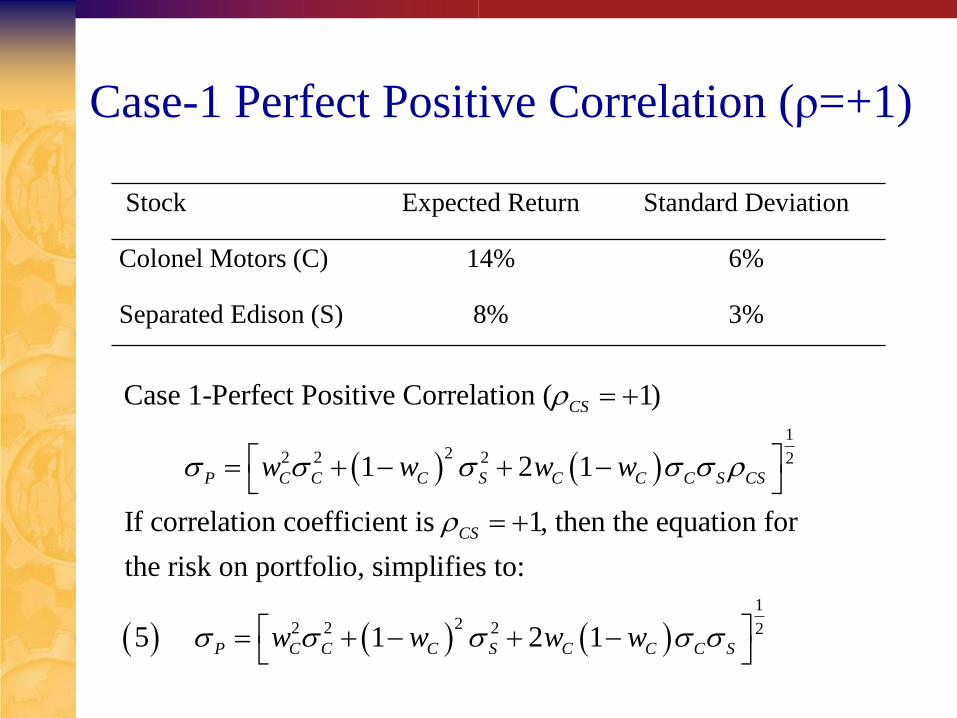
Case-1 Perfect Positive Correlation (ρ=+1)
Stock Expected Return Standard Deviation
Colonel Motors (C) 14% 6%
Separated Edison (S) 8% 3%
122 2 2 2
2
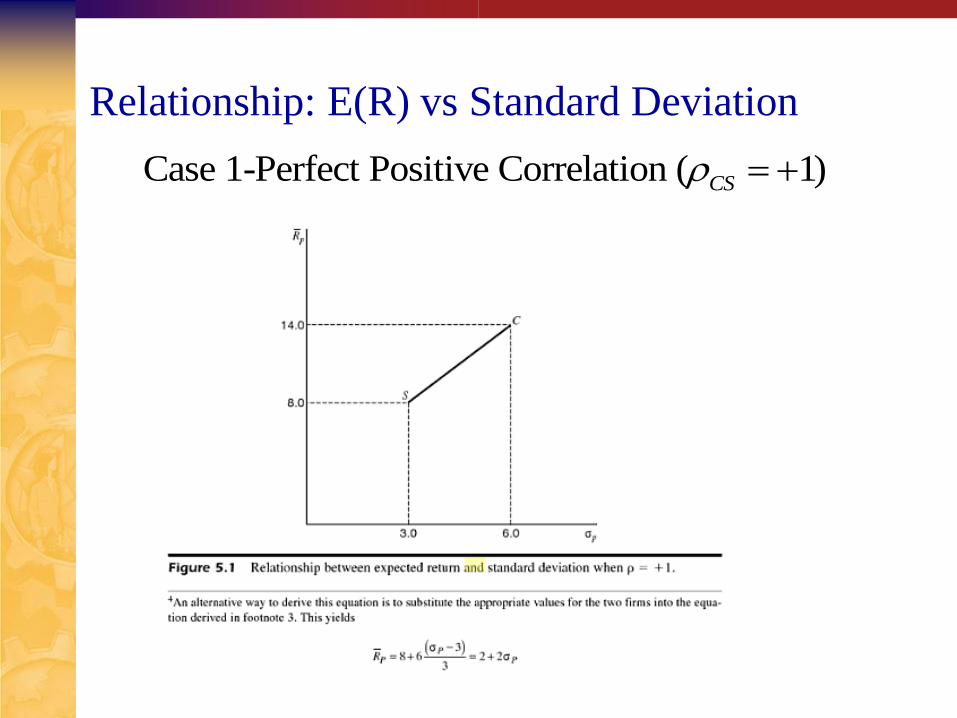
Case 1-Perfect Positive Correlation ( 1)
1 2 1
If correlation coefficient is 1, then the equation for
the risk on portfolio, simplifies to:
5
CS
P C C C S C C C S CS
CS
P C C
w w w w
w
1
22 2 21 2 1C S C C C Sw w w
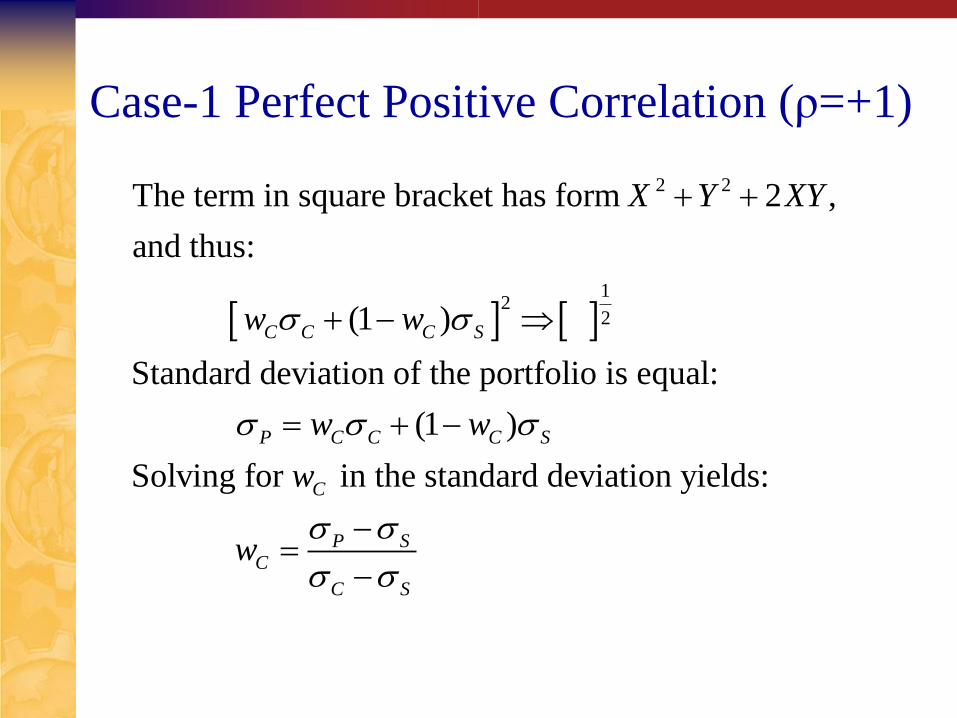
Case-1 Perfect Positive Correlation (ρ=+1)
2 2
12
2
The term in square bracket has form 2 ,
and thus:
(1 )
Standard deviation of the portfolio is equal:
(1 )
Solving for in the standard deviation yie
C C C S
P C C C S
C
X Y XY
w w
w w
w
lds:
P SC
C S
w

Case-1 Perfect Positive Correlation (ρ=+1)
While the expected return on the portfolio is:
(1 )
substitute :
For two stocks under study,
(1 )
Which is the equation of a straight line
P C C C S
P SC
C S
P S P SP C S
C S C S
R w R w R
w
R R R
connecting C and S in
expected return and standard deviation space.
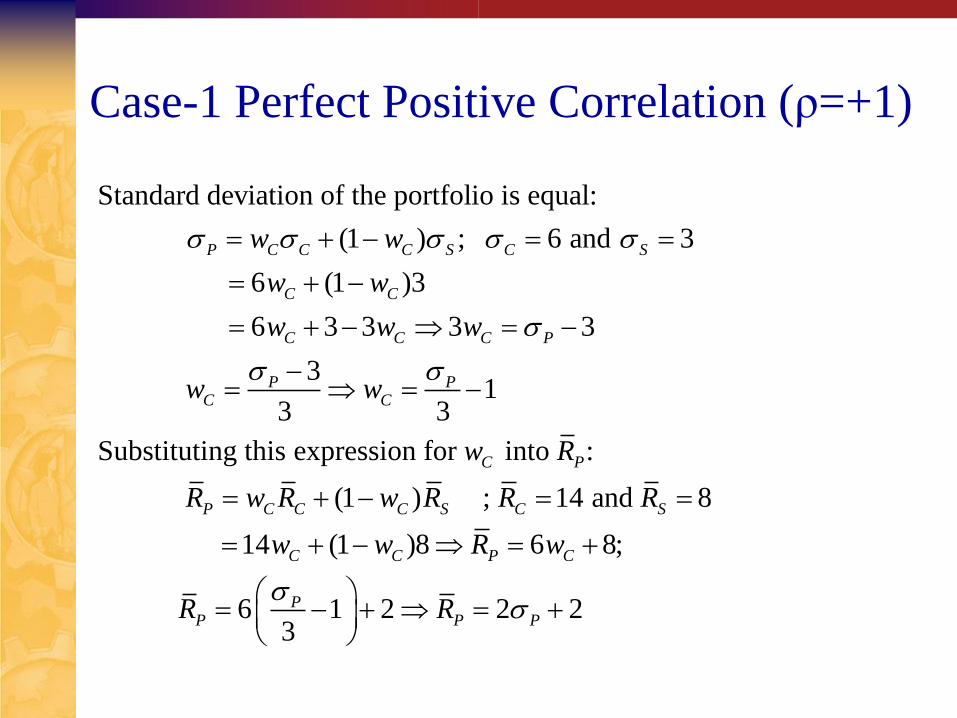
Case-1 Perfect Positive Correlation (ρ=+1)
Standard deviation of the portfolio is equal:
(1 ) ; 6 and 3
6 (1 )3
6 3 3 3 3
3 1
3 3
Substituting this
P C C C S C S
C C
C C C P
P PC C
w w
w w
w w w
w w
expression for into :
(1 ) ; 14 and 8
14 (1 )8 6 8;
6 1 2 2 23
C P
P C C C S C S
C C P C
PP P P
w R
R w R w R R R
w w R w
R R
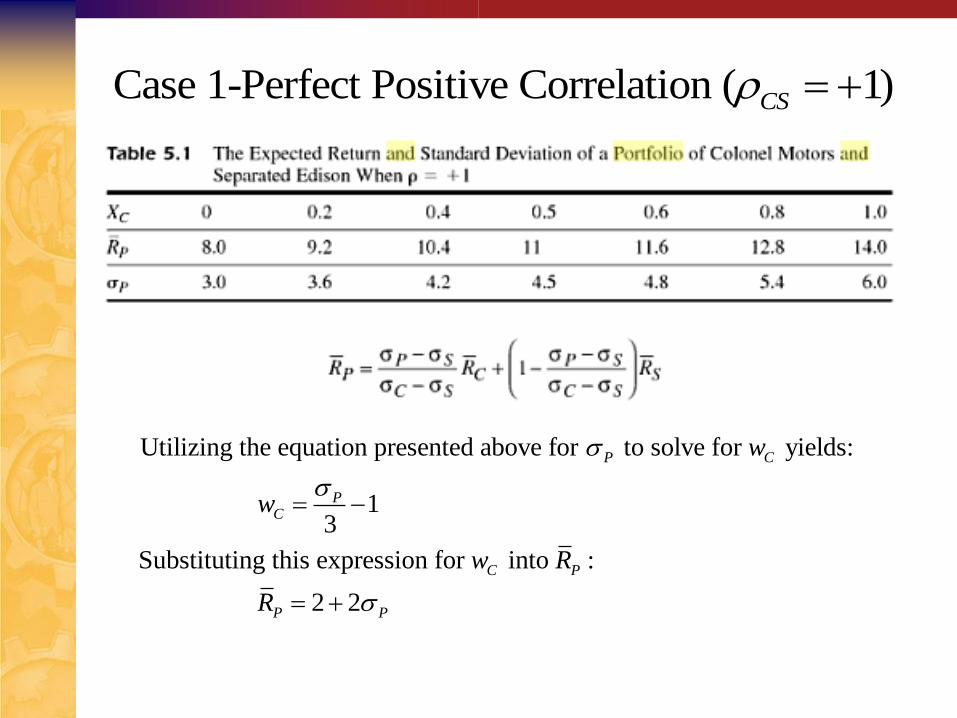
Case 1-Perfect Positive Correlation ( 1)CS
Utilizing the equation presented above for to solve for yields:
13
Substituting this expression for into :
2 2
P C
PC
C P
P P
w
w
w R
R
Relationship: E(R) vs Standard Deviation
Case 1-Perfect Positive Correlation ( 1)CS

Case-2 Perfect Negative Correlation (ρ=-1)
Stock Expected Return Standard Deviation
Colonel Motors 14% 6%
Separated Edison 8% 3%
122 2 2 2
2
Case 2-Perfect Negative Correlation ( 1)
1 2 1
If correlation coefficient is 1, then the equation for
the risk on portfolio, simplifies to:
6
CS
P C C C S C C C S CS
CS
P C C
w w w w
w
1
22 2 21 2 1C S C C C Sw w w
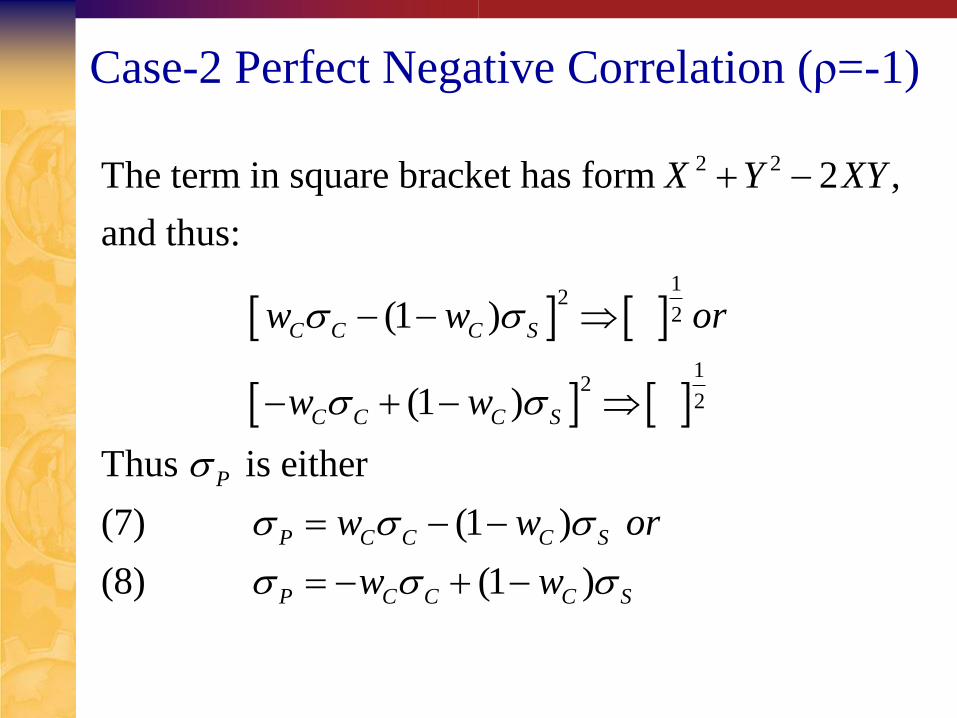
Case-2 Perfect Negative Correlation (ρ=-1)
2 2
12
2
12
2
The term in square bracket has form 2 ,
and thus:
(1 )
(1 )
Thus is either
(7) (1 )
(8) (1
C C C S
C C C S
P
P C C C S
P C C C
X Y XY
w w or
w w
w w or
w w
) S
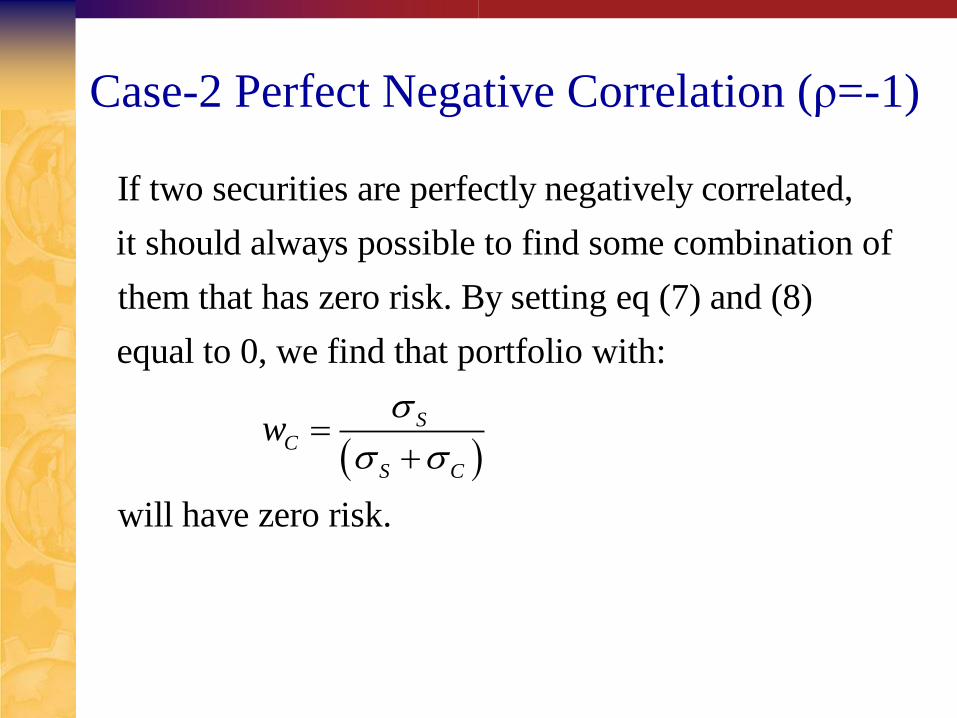
Case-2 Perfect Negative Correlation (ρ=-1)
If two securities are perfectly negatively correlated,
it should always possible to find some combination of
them that has zero risk. By setting eq (7) and (8)
equal to 0, we find that portfolio with:
will have zero risk.
SC
S C
w
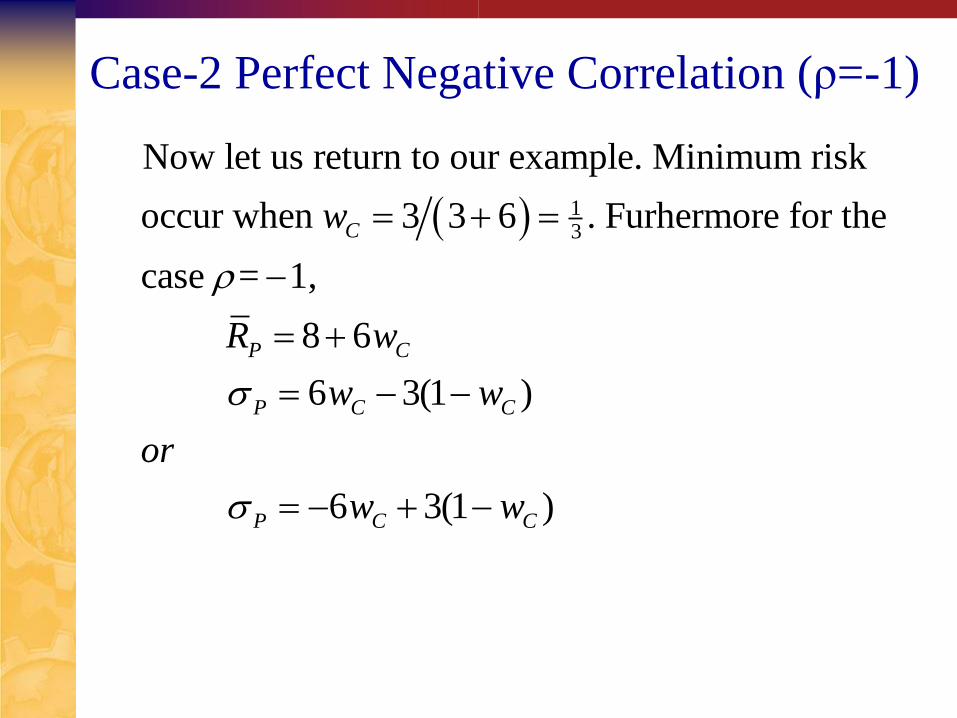
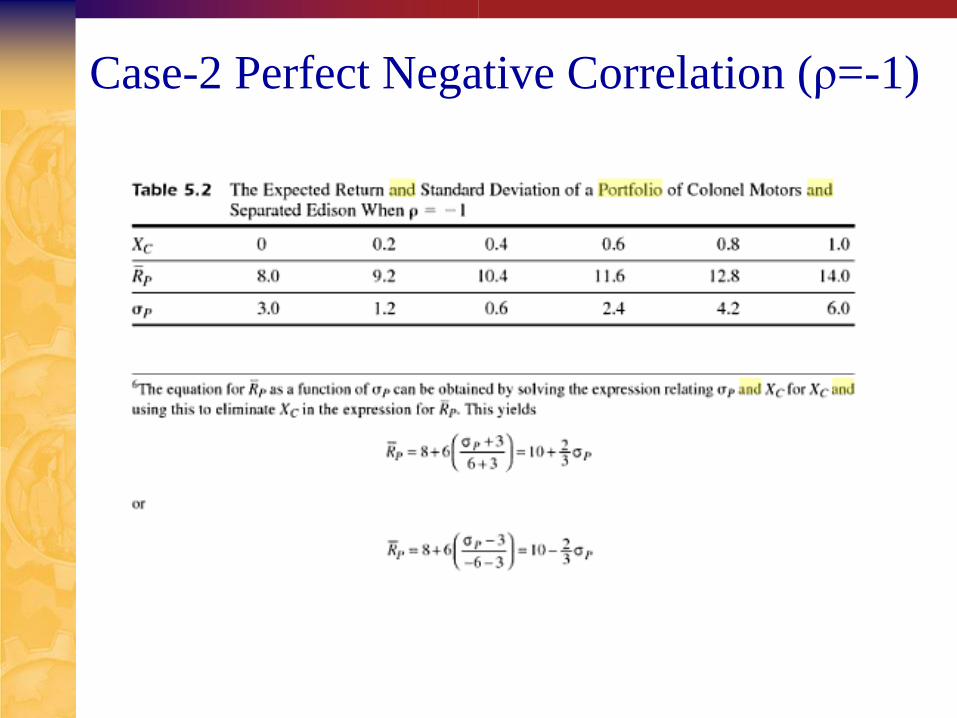
Case-2 Perfect Negative Correlation (ρ=-1)
13
Now let us return to our example. Minimum risk
occur when 3 3 6 . Furhermore for the
case = 1,
8 6
6 3(1 )
6 3(1 )
C
P C
P C C
P C C
w
R w
w w
or
w w

Case-2 Perfect Negative Correlation (ρ=-1)
There are two equation relating to . Only one is
appropriate for any value of . The appropriate equation
to define for any value of is that equation for
which 0.
See Table 5.2 and Figur
P C
C
P C
P
w
w
w
e 5.2
Case-2 Perfect Negative Correlation (ρ=-1)
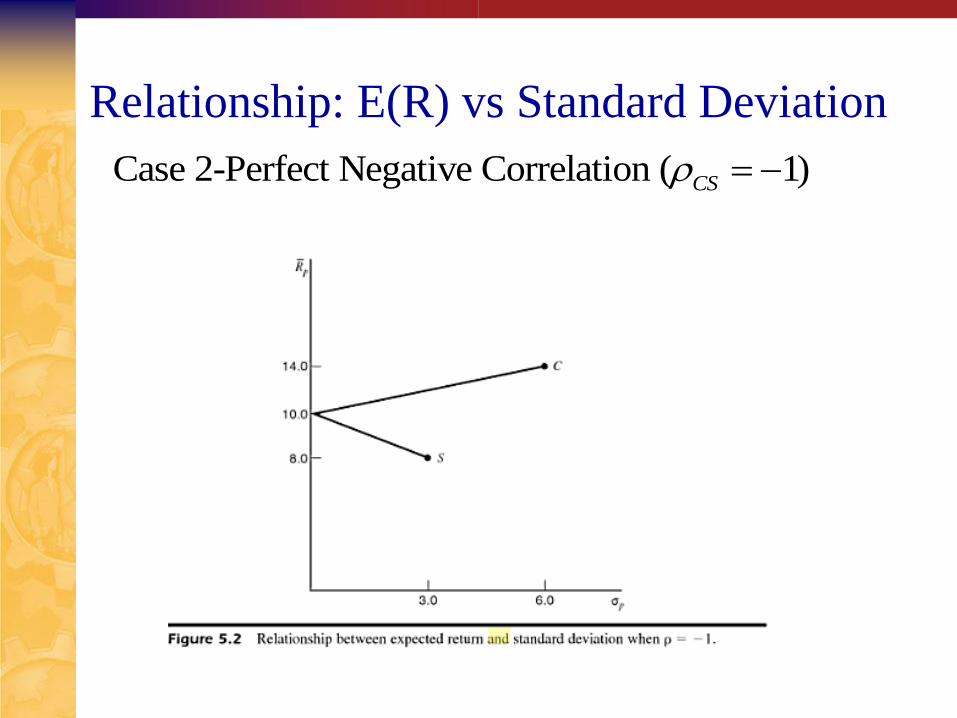
Relationship: E(R) vs Standard Deviation
Case 2-Perfect Negative Correlation ( 1)CS
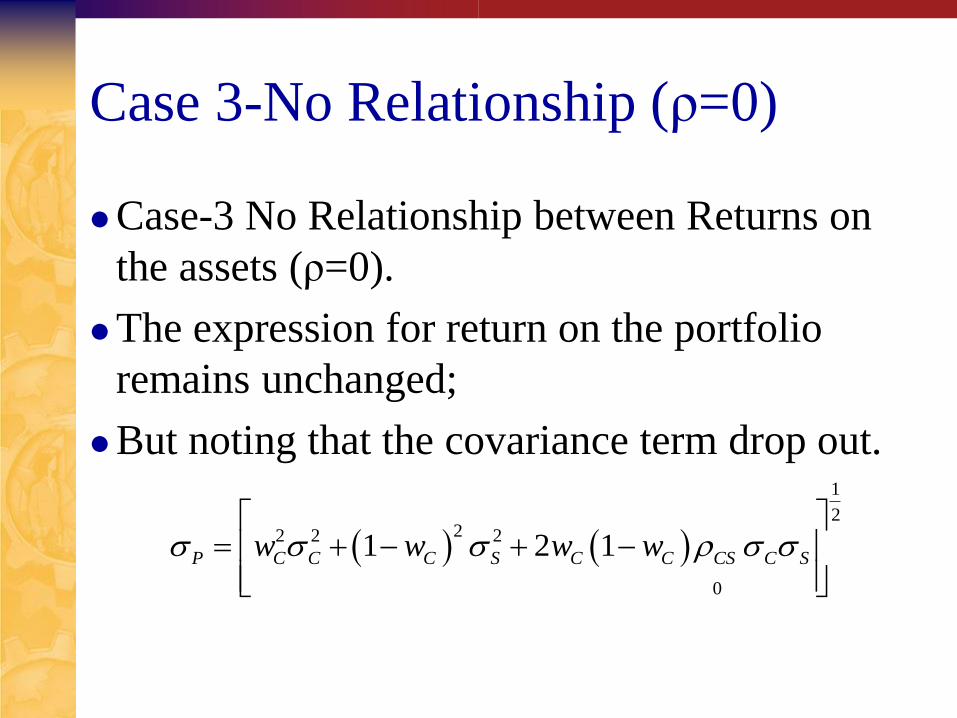
Case 3-No Relationship (ρ=0)
Case-3 No Relationship between Returns on
the assets (ρ=0).
The expression for return on the portfolio
remains unchanged;
But noting that the covariance term drop out.
1
222 2 2
0
1 2 1P C C C S C C CS C Sw w w w
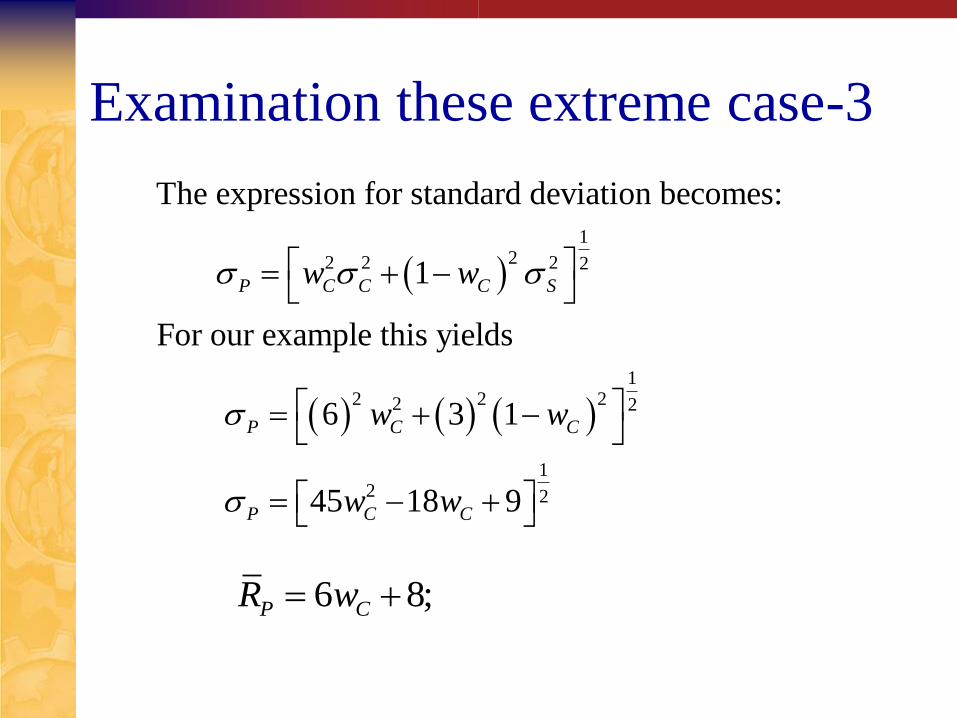
Examination these extreme case-3
122 2 2 2
12 2 22 2
12 2
The expression for standard deviation becomes:
1
For our example this yields
6 3 1
45 18 9
P C C C S
P C C
P C C
w w
w w
w w
6 8; P CR w
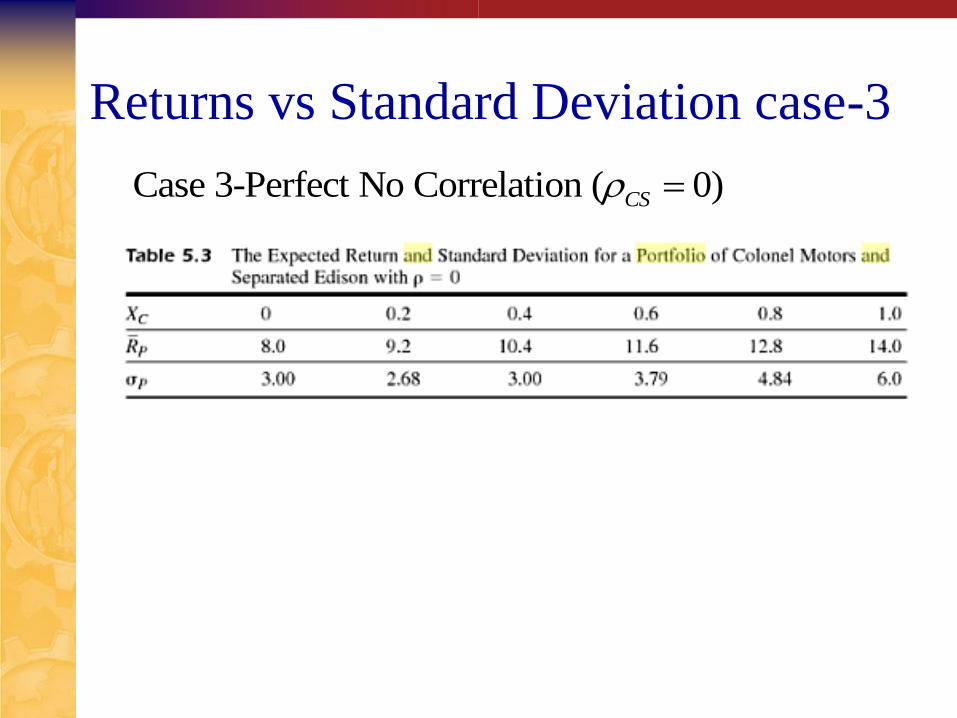
Returns vs Standard Deviation case-3
Case 3-Perfect No Correlation ( 0)CS

The Minimum Risk
1
22 2 2 2
The portfolio has minimum risk!. The portfolio can be found
in general by looking at the equation for risk:
1 2 1
To find the value of that minimize, take the deriv
P C C C S C C C S CS
C
w w w w
w
2 2 2
122 2 2 2
ative of it
with respect to , set derivative equal zero, and solve for :
2 2 2 2 41
21 2 1
C C
C C C C S C S CS C C S CSP
C
C C C S C C C S CS
w w
w w w
ww w w w
The Minimum Risk
2
2 2
2
2 2
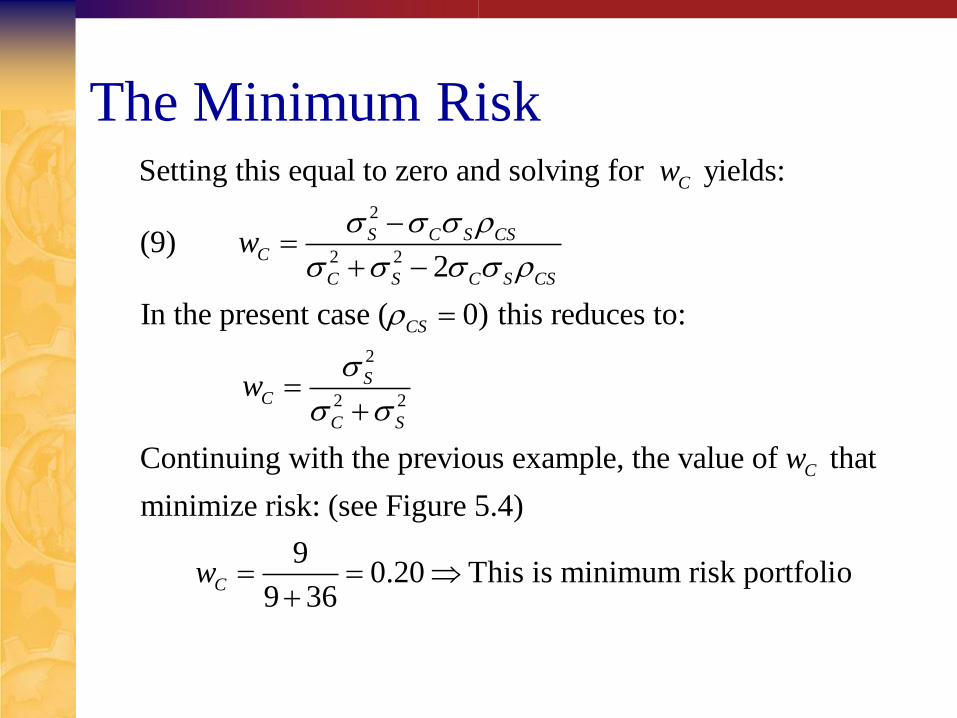
Setting this equal to zero and solving for yields:
(9) 2
In the present case ( 0) this reduces to:
Continuing with the previous exampl
C
S C S CSC
C S C S CS
CS
SC
C S
w
w
w
e, the value of that
minimize risk: (see Figure 5.4)
9 0.20 This is minimum risk portfolio
9 36
C
C
w
w
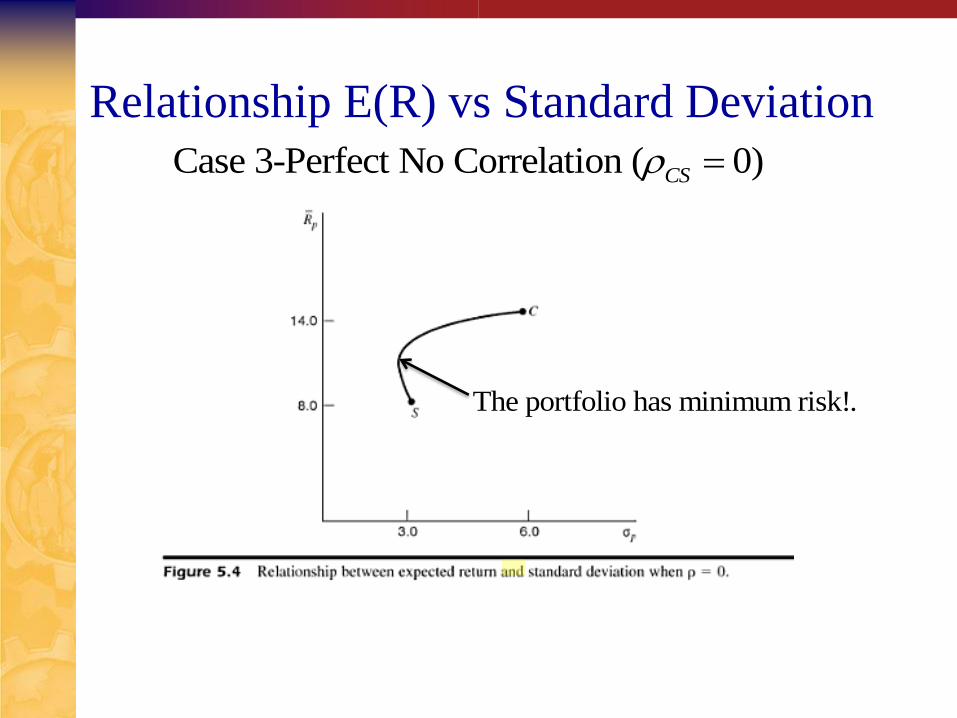
Relationship E(R) vs Standard Deviation
Case 3-Perfect No Correlation ( 0)CS
The portfolio has minimum risk!.
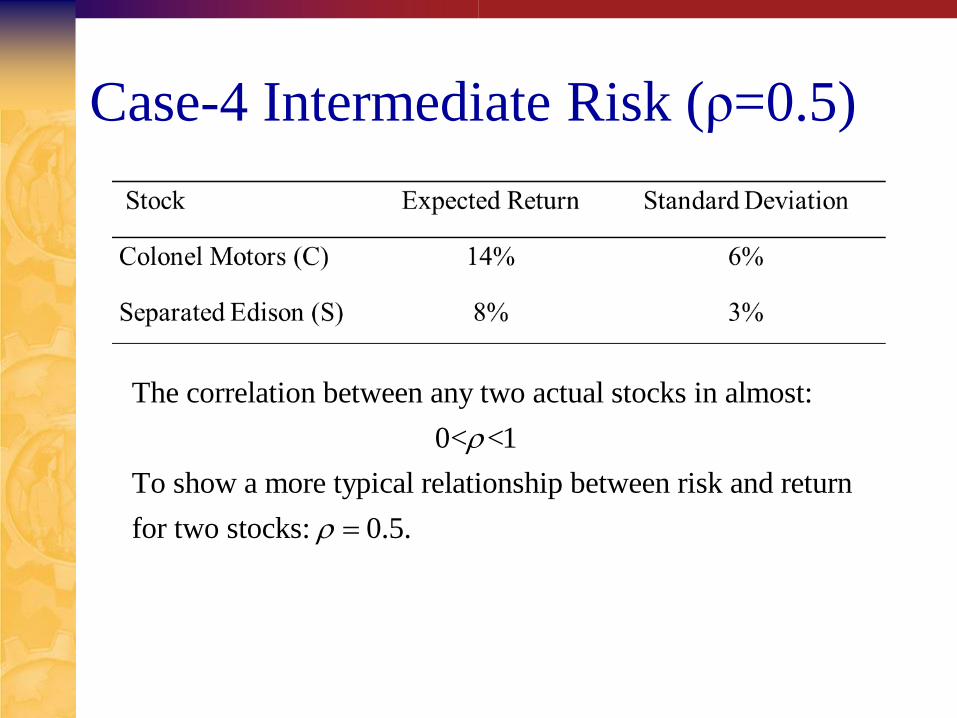
Case-4 Intermediate Risk (ρ=0.5)
The correlation between any two actual stocks in almost:
0< <1
To show a more typical relationship between risk and return
for two stocks: 0.5.
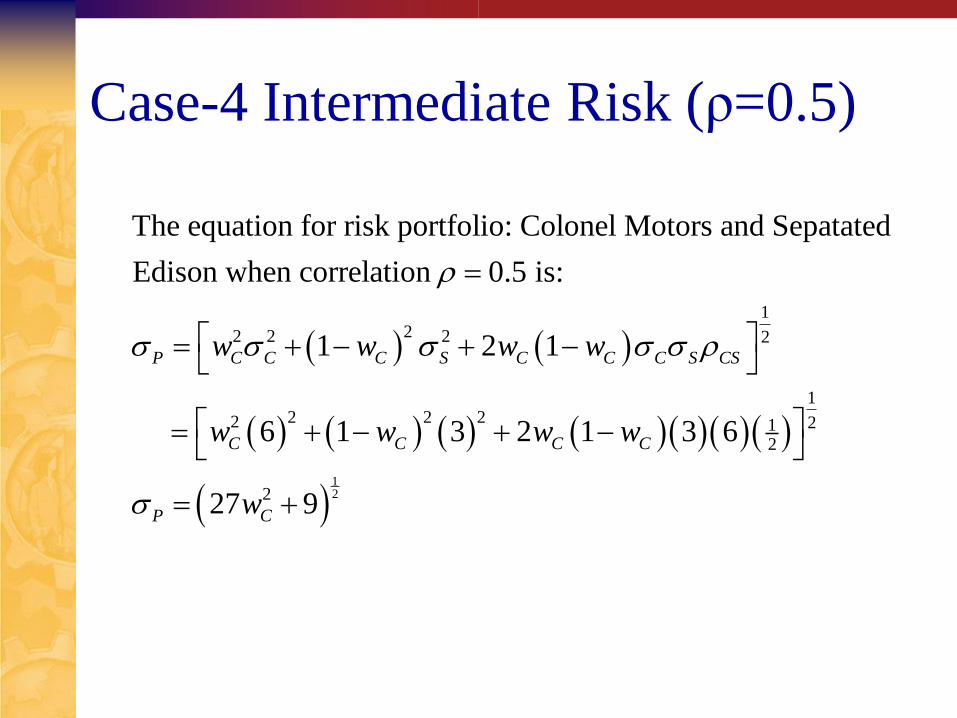
Case-4 Intermediate Risk (ρ=0.5)
12
122 2 2 2
12 2 22 21
2
2
The equation for risk portfolio: Colonel Motors and Sepatated
Edison when correlation 0.5 is:
1 2 1
6 1 3 2 1 3 6
27 9
P C C C S C C C S CS
C C C C
P C
w w w w
w w w w
w
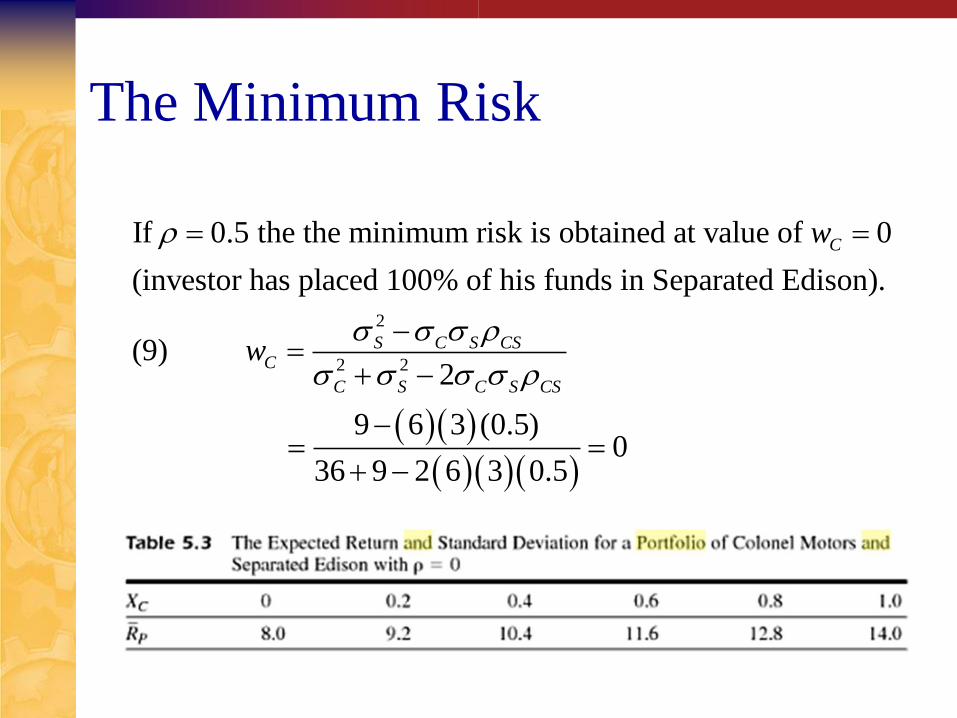
The Minimum Risk
2
2 2
If 0.5 the the minimum risk is obtained at value of 0
(investor has placed 100% of his funds in Separated Edison).
(9) 2
9 6 3 (0.5)
36 9 2 6 3 0.
C
S C S CSC
C S C S CS
w
w
0
5
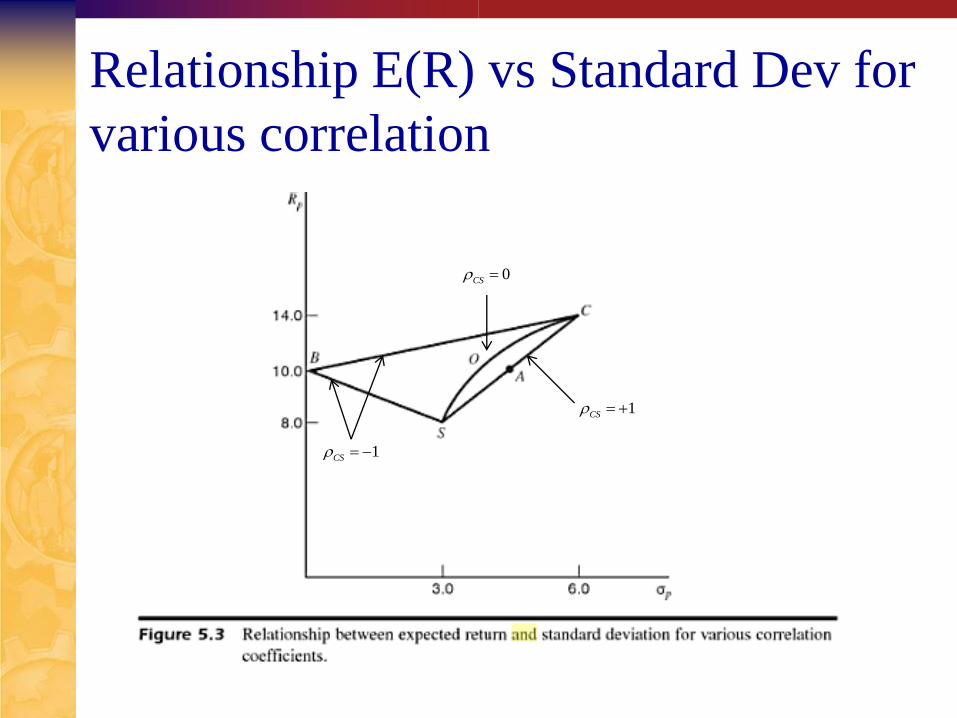
Relationship E(R) vs Standard Dev for
various correlation
1CS
0CS
1CS
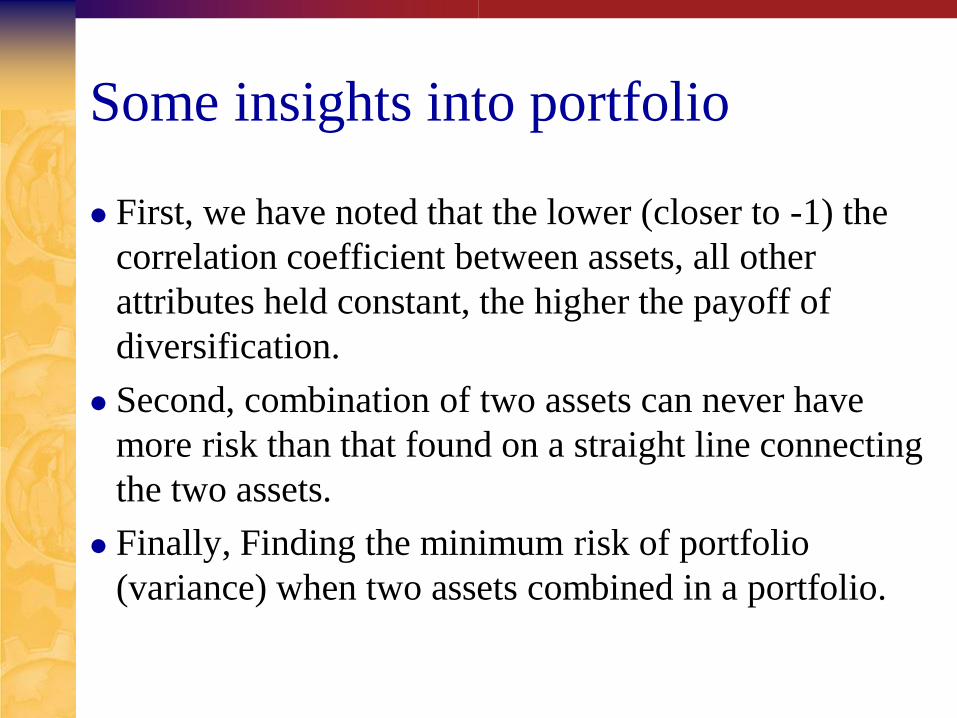
Some insights into portfolio
First, we have noted that the lower (closer to -1) the
correlation coefficient between assets, all other
attributes held constant, the higher the payoff of
diversification.
Second, combination of two assets can never have
more risk than that found on a straight line connecting
the two assets.
Finally, Finding the minimum risk of portfolio
(variance) when two assets combined in a portfolio.
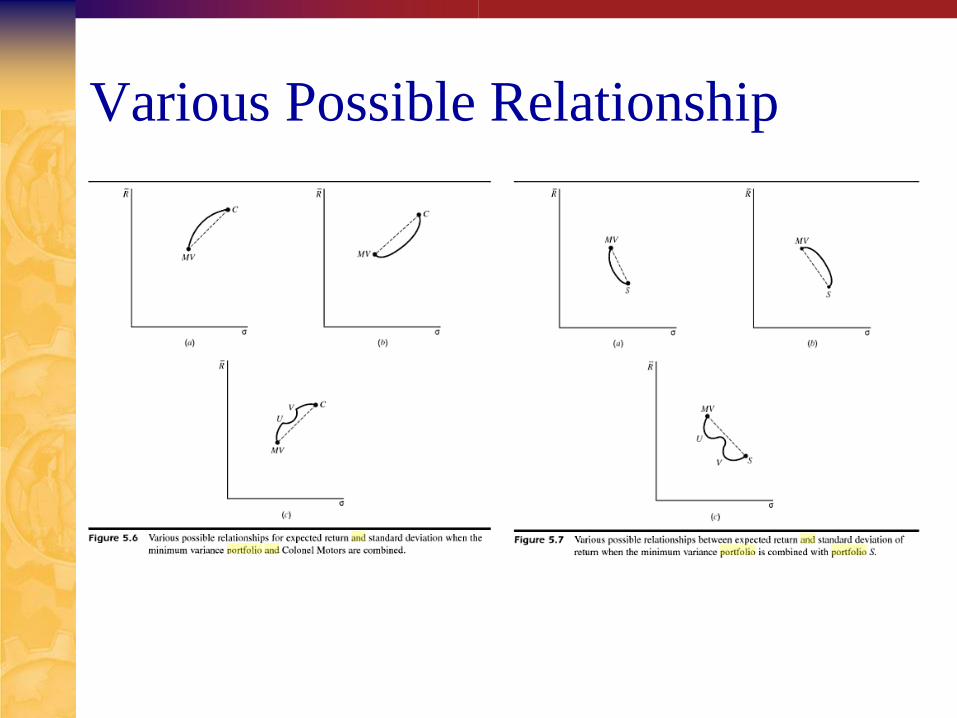
Various Possible Relationship
The efficient frontier (No short sales)
Risk Averter?
We reasoned that an investor would prefer
more return to less risk and would prefer less
risk to more.
Set of portfolio:
Offered a bigger return for the same risk, or
Offered a lower risk for the same return
Indentified all portfolio an investor could
consider holding.
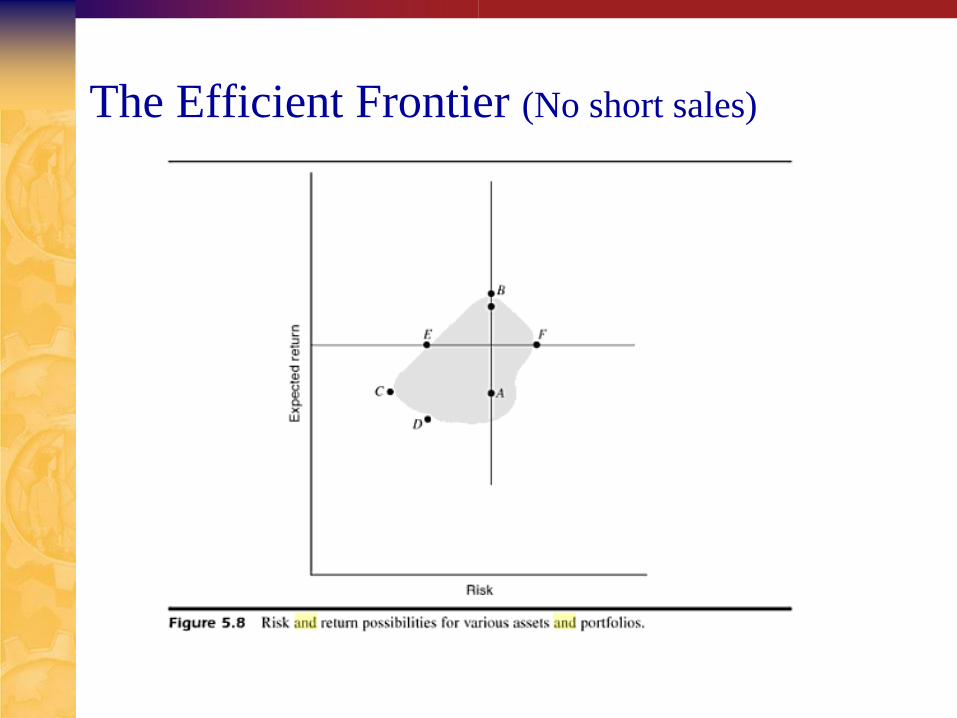
The Efficient Frontier (No short sales)
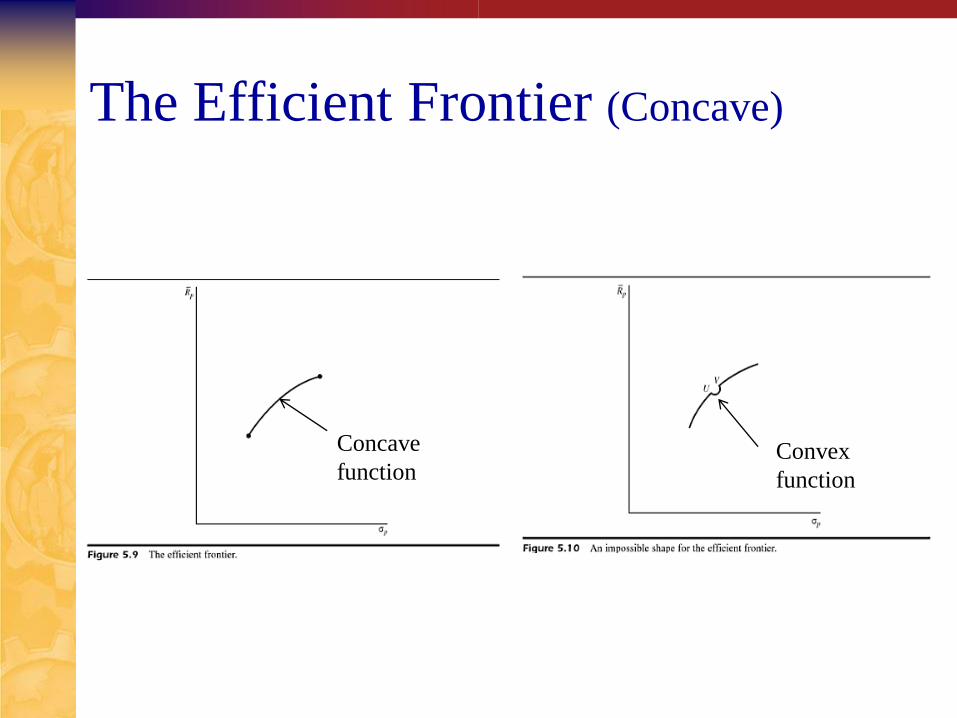
The Efficient Frontier (Concave)
Concave
function Convex
function
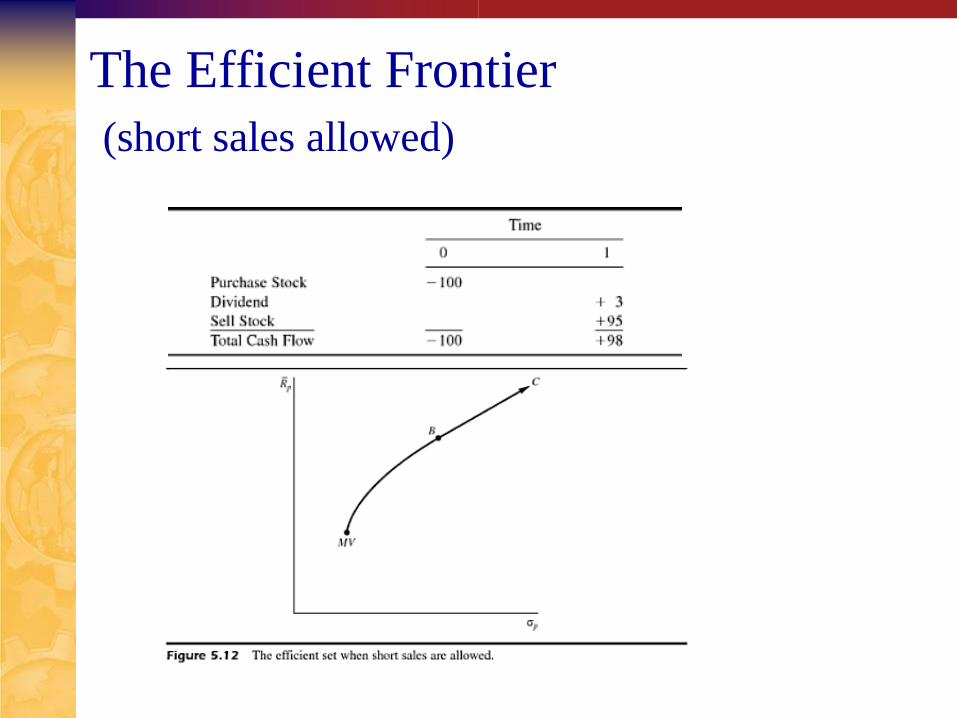
The Efficient Frontier
(short sales allowed)
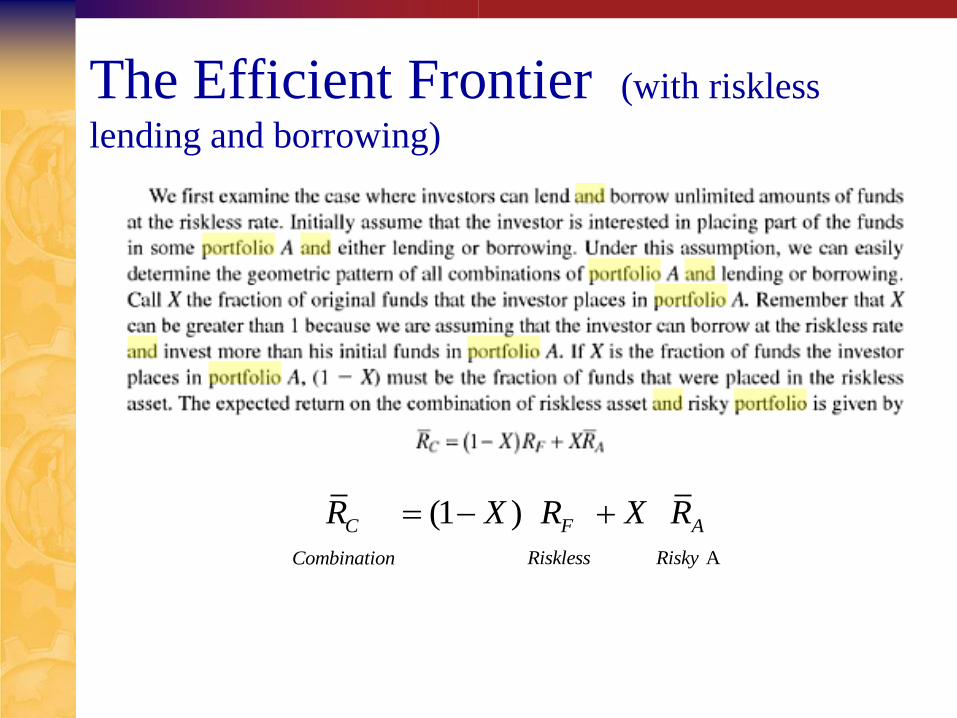
The Efficient Frontier (with riskless
lending and borrowing)
A
(1 )C F A
Riskless RiskyCombination
R X R X R
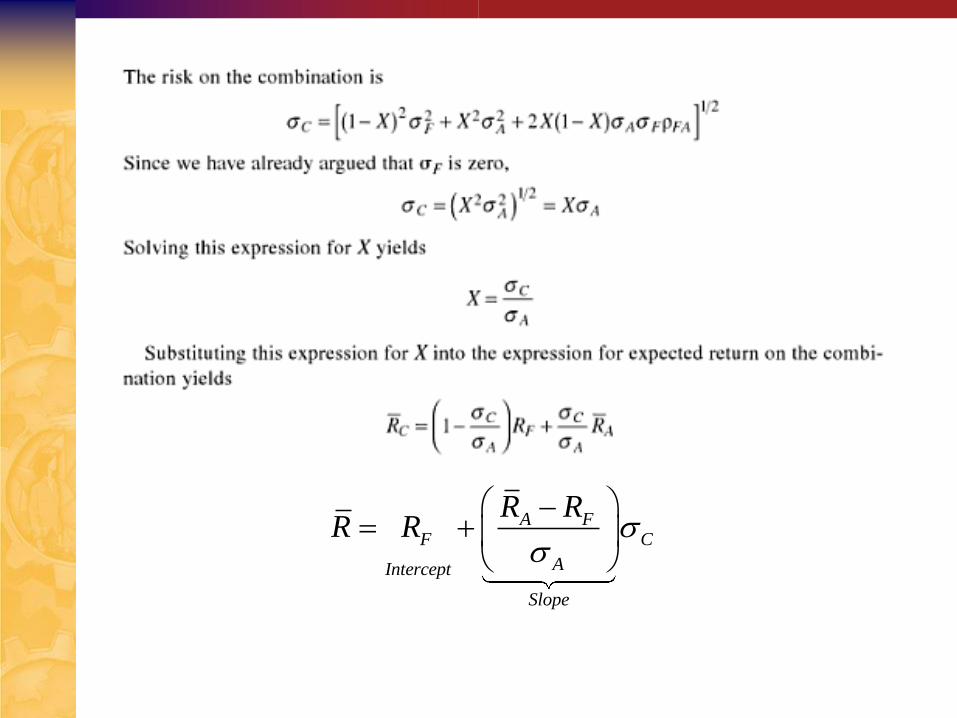
A FF C
AIntercept
Slope
R RR R
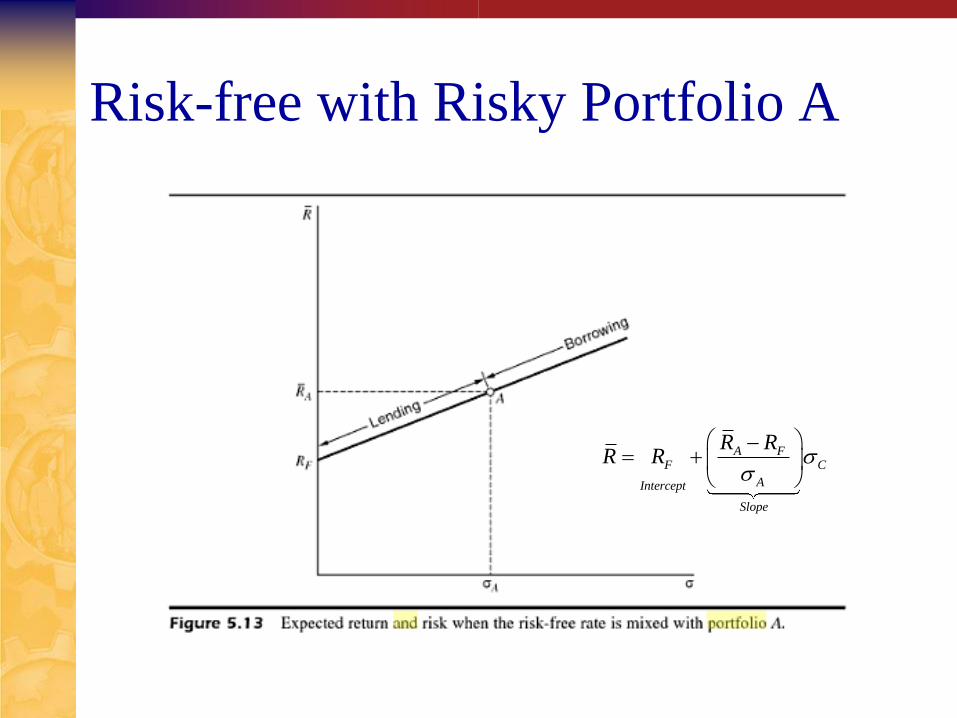
Risk-free with Risky Portfolio A
A FF C
AIntercept
Slope
R RR R
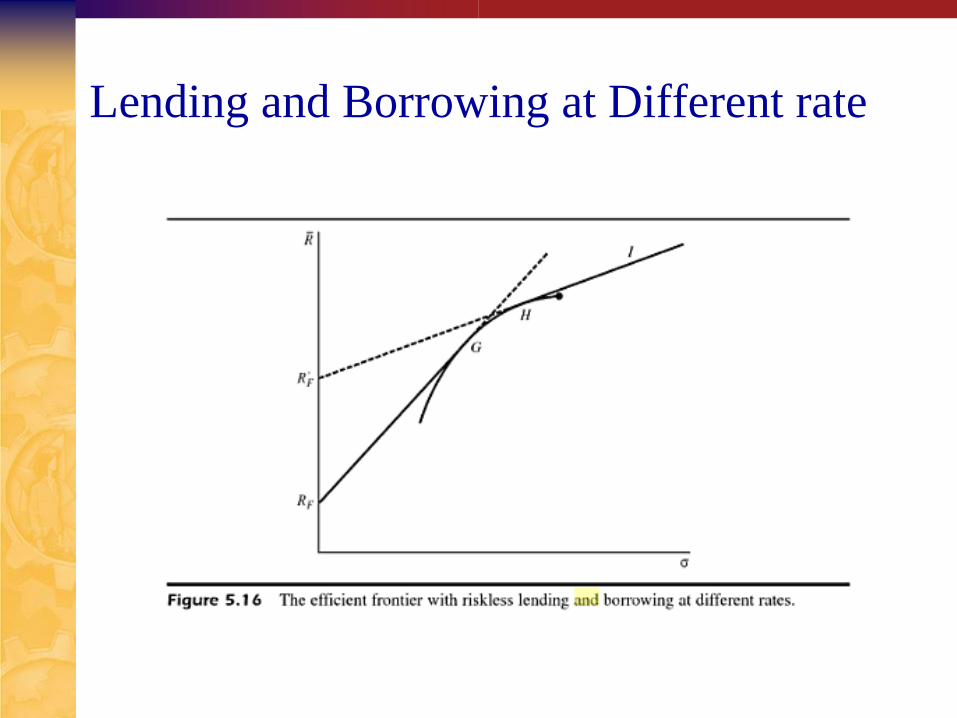
Lending and Borrowing at Different rate
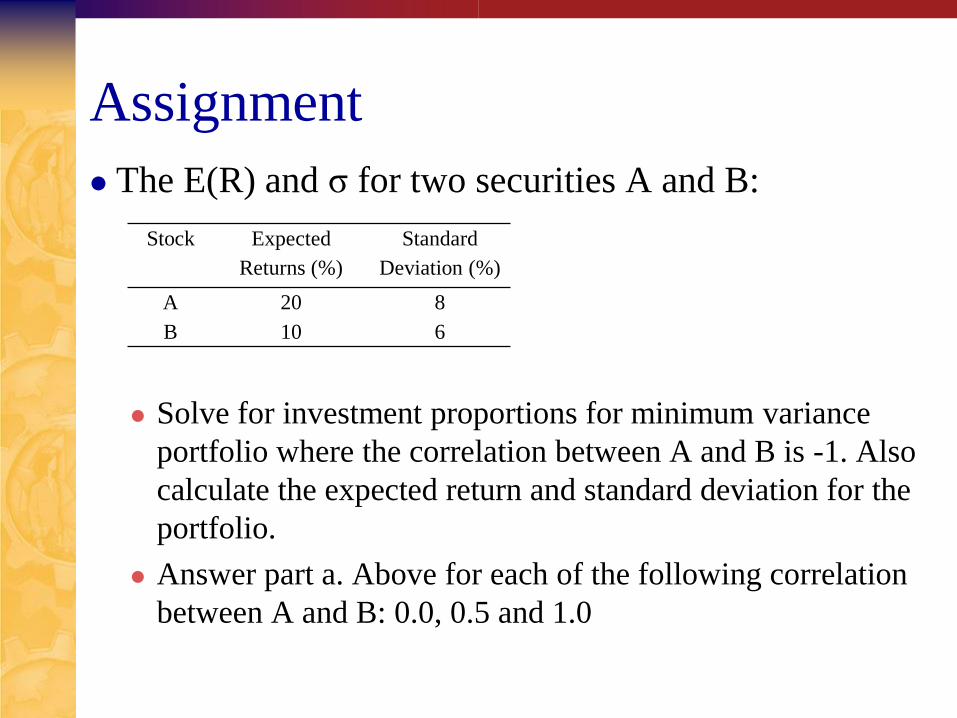
Assignment
The E(R) and σ for two securities A and B:
Solve for investment proportions for minimum variance
portfolio where the correlation between A and B is -1. Also
calculate the expected return and standard deviation for the
portfolio.
Answer part a. Above for each of the following correlation
between A and B: 0.0, 0.5 and 1.0
Stock Expected
Returns (%)
Standard
Deviation (%)
A 20 8
B 10 6
References
Elton, E.J, Gruber, M.J, et al (2003) Modern Portfolio
Theory and Investment Analysis, 6th Ed, Willey
International.
Brealy & Myers (2008) Principle of Corporate
Finance, 7th Ed, McGraw-Hill, USA
Martin, John.D et al (1988) Theory of Finance:
Evidence & Applications, The Dryden Press, NY.