Embed Size (px)
Citation preview
MSc Chemistry Molecular Design, Synthesis and Catalysis
Master Thesis
Efficient Iridium Water
Oxidation Catalysts based
on Substituted Pyridine-
carboxylate Ligands
by
Sybren van Dijk
10444572
September 2017
42 EC
February – September 2017
Supervisor: Examiner:
Gabriel Menendez Rodriguez, MSc Prof. Dr. Alceo Macchioni
Università di Perugia,
Dipartimento di Chimica,
Biologia e Biotecnologie
2
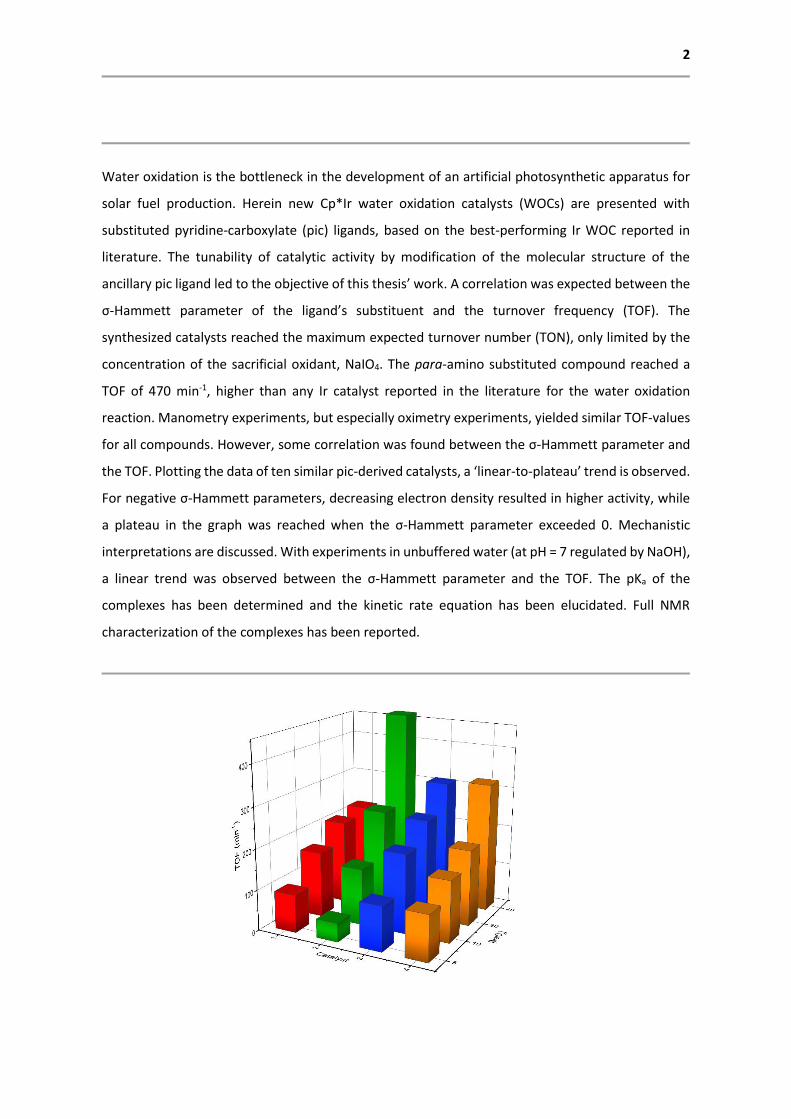
Water oxidation is the bottleneck in the development of an artificial photosynthetic apparatus for
solar fuel production. Herein new Cp*Ir water oxidation catalysts (WOCs) are presented with
substituted pyridine-carboxylate (pic) ligands, based on the best-performing Ir WOC reported in
literature. The tunability of catalytic activity by modification of the molecular structure of the
ancillary pic ligand led to the objective of this thesis’ work. A correlation was expected between the
σ-Hammett parameter of the ligand’s substituent and the turnover frequency (TOF). The
synthesized catalysts reached the maximum expected turnover number (TON), only limited by the
concentration of the sacrificial oxidant, NaIO4. The para-amino substituted compound reached a
TOF of 470 min-1, higher than any Ir catalyst reported in the literature for the water oxidation
reaction. Manometry experiments, but especially oximetry experiments, yielded similar TOF-values
for all compounds. However, some correlation was found between the σ-Hammett parameter and
the TOF. Plotting the data of ten similar pic-derived catalysts, a ‘linear-to-plateau’ trend is observed.
For negative σ-Hammett parameters, decreasing electron density resulted in higher activity, while
a plateau in the graph was reached when the σ-Hammett parameter exceeded 0. Mechanistic
interpretations are discussed. With experiments in unbuffered water (at pH = 7 regulated by NaOH),
a linear trend was observed between the σ-Hammett parameter and the TOF. The pKa of the
complexes has been determined and the kinetic rate equation has been elucidated. Full NMR
characterization of the complexes has been reported.
3
“
Where vegetation is rich, photochemistry may be left to the plants and, by rational cultivation, solar
radiation may be used for industrial purposes. In the desert regions, unsuitable to any kind of
cultivation, photochemistry will artificially put their solar energy to practical uses. On the arid lands,
there will spring up industrial colonies without smoke and without smokestacks; forests of glass
tubes will extend over the plants and glass buildings will rise everywhere; inside of these will take
place the photochemical processes that hitherto have been the guarded secret of the plants, but
that will have been mastered by human industry which will know how to make them bear even more
abundant fruit than nature, for nature is not in a hurry and mankind is. And if in a distant future the
supply of coal becomes completely exhausted, civilization will not be checked by that, for life and
civilization will continue as long as the sun shines!
”
– Giacomo Ciamician, pioneer of photochemistry and prophet of the energy transition, 1912
4
List of abbreviations
Å Ångström, 10-10 m
ACN acetonitrile, CH3CN
atm atmosphere, 1.01325∙105 Pascal
bpy bipyridine
CAN cerium(IV) ammonium nitrate, [Ce(NO3)6](NH4)2
cat catalyst
Cp* 1,2,3,4,5-pentamethylcyclopentadienyl, ion (-1)
d day(s)
DCM dichloromethane, CH2Cl2
DMF dimethylformamide, (CH3)2NCOH
DMSO dimethylsulfoxide, (CH3)2SO
DO dissolved oxygen
e.g. exempli gratia, for example
et al. et alii, and others
eq equivalent(s)
g gram(s)
Gt gigaton, 1012 kg
h hour(s)
i.e. id est, that is
kg kilogram(s)
mmol millimole(s)
mg milligram(s)
mL millilitre(s)
NMR nuclear magnetic resonance
NOE nuclear Overhauser effect
OEC oxygen-evolving complex
ox oxidant
PCET proton-coupled electron transfer
pic κ2-pyridine-2-carboxylic acid, picolinate, ion (-1)
(in bold: used to indicate Cp*Ir(pic)NO3)

5
ppy 2-phenylpyridine
PSI photosystem I
PSII photosystem II
RDS rate-determining step
r.t. room temperature
TW tera watt, 1012 watts
µmol micromole(s)
µg microgram(s)
µL microliter(s)
W watt(s), J∙s-1
yr year(s)
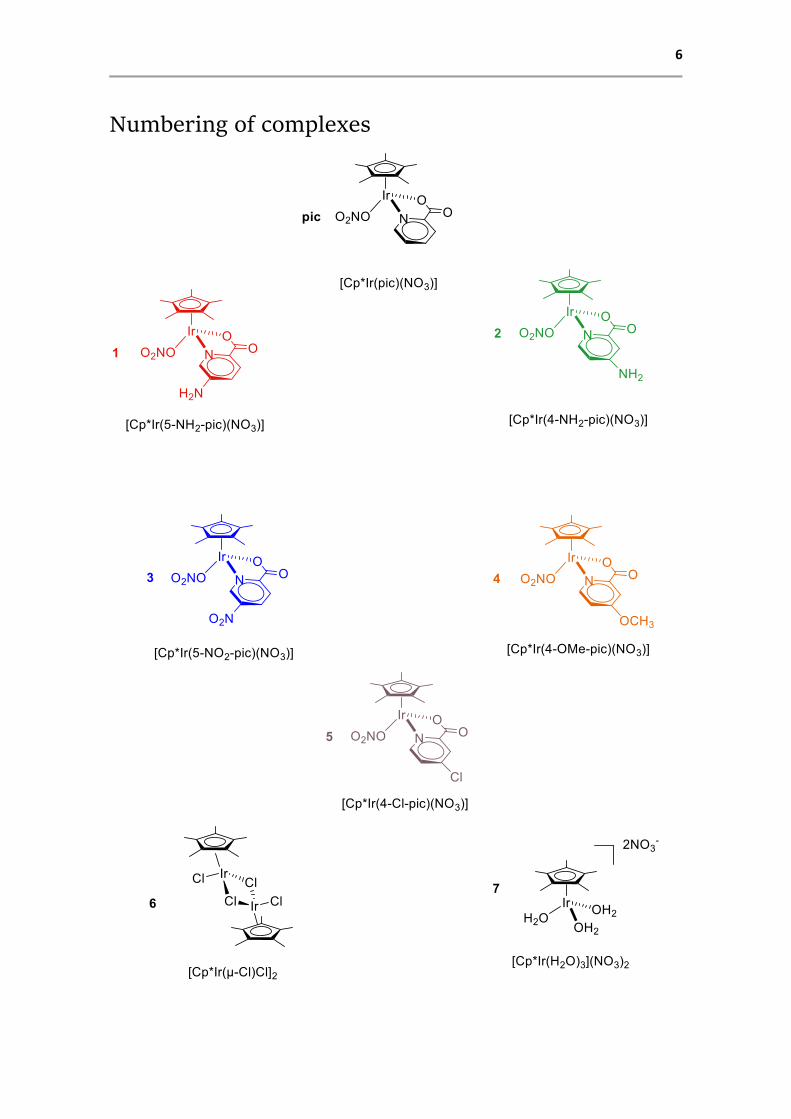
6
Numbering of complexes
7
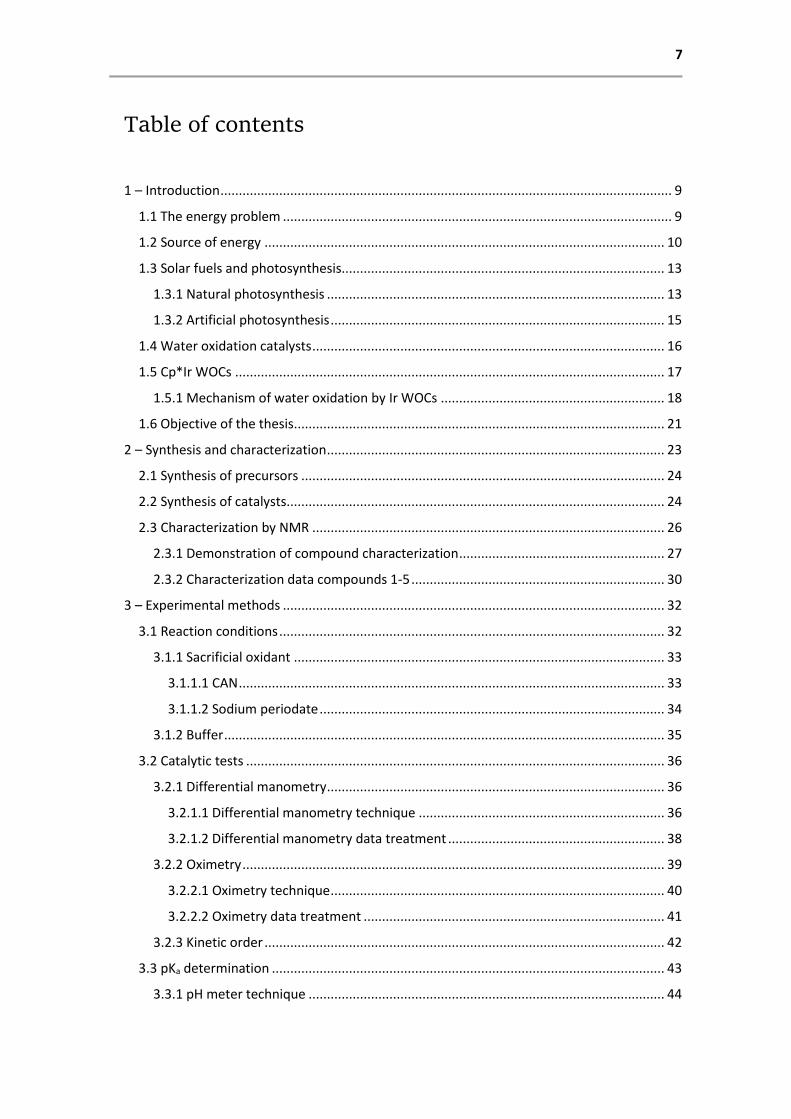
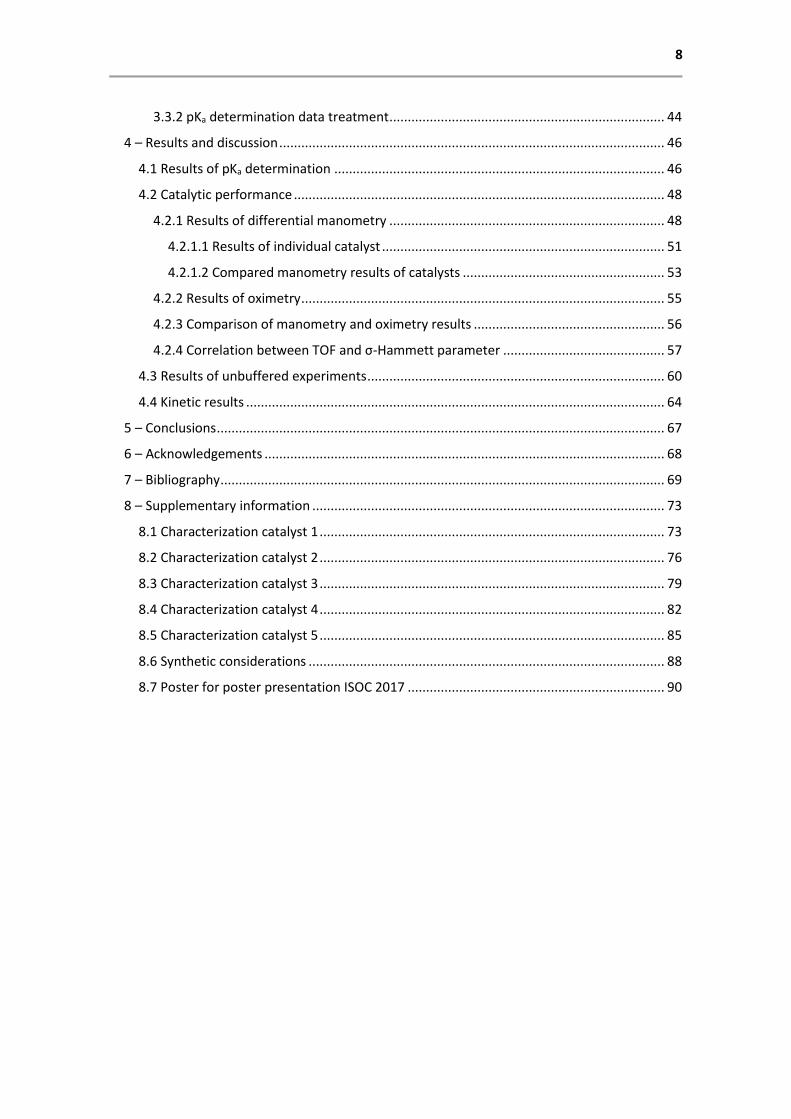
Table of contents
1 – Introduction ........................................................................................................................... 9
1.1 The energy problem .......................................................................................................... 9
1.2 Source of energy ............................................................................................................. 10
1.3 Solar fuels and photosynthesis........................................................................................ 13
1.3.1 Natural photosynthesis ............................................................................................ 13
1.3.2 Artificial photosynthesis ........................................................................................... 15
1.4 Water oxidation catalysts ................................................................................................ 16
1.5 Cp*Ir WOCs ..................................................................................................................... 17
1.5.1 Mechanism of water oxidation by Ir WOCs ............................................................. 18
1.6 Objective of the thesis ..................................................................................................... 21
2 – Synthesis and characterization ............................................................................................ 23
2.1 Synthesis of precursors ................................................................................................... 24
2.2 Synthesis of catalysts....................................................................................................... 24
2.3 Characterization by NMR ................................................................................................ 26
2.3.1 Demonstration of compound characterization ........................................................ 27
2.3.2 Characterization data compounds 1-5 ..................................................................... 30
3 – Experimental methods ........................................................................................................ 32
3.1 Reaction conditions ......................................................................................................... 32
3.1.1 Sacrificial oxidant ..................................................................................................... 33
3.1.1.1 CAN .................................................................................................................... 33
3.1.1.2 Sodium periodate .............................................................................................. 34
3.1.2 Buffer ........................................................................................................................ 35
3.2 Catalytic tests .................................................................................................................. 36
3.2.1 Differential manometry ............................................................................................ 36
3.2.1.1 Differential manometry technique ................................................................... 36
3.2.1.2 Differential manometry data treatment ........................................................... 38
3.2.2 Oximetry ................................................................................................................... 39
3.2.2.1 Oximetry technique ........................................................................................... 40
3.2.2.2 Oximetry data treatment .................................................................................. 41
3.2.3 Kinetic order ............................................................................................................. 42
3.3 pKa determination ........................................................................................................... 43
3.3.1 pH meter technique ................................................................................................. 44
8
3.3.2 pKa determination data treatment ........................................................................... 44
4 – Results and discussion ......................................................................................................... 46
4.1 Results of pKa determination .......................................................................................... 46
4.2 Catalytic performance ..................................................................................................... 48
4.2.1 Results of differential manometry ........................................................................... 48
4.2.1.1 Results of individual catalyst ............................................................................. 51
4.2.1.2 Compared manometry results of catalysts ....................................................... 53
4.2.2 Results of oximetry ................................................................................................... 55
4.2.3 Comparison of manometry and oximetry results .................................................... 56
4.2.4 Correlation between TOF and σ-Hammett parameter ............................................ 57
4.3 Results of unbuffered experiments ................................................................................. 60
4.4 Kinetic results .................................................................................................................. 64
5 – Conclusions .......................................................................................................................... 67
6 – Acknowledgements ............................................................................................................. 68
7 – Bibliography ......................................................................................................................... 69
8 – Supplementary information ................................................................................................ 73
8.1 Characterization catalyst 1 .............................................................................................. 73
8.2 Characterization catalyst 2 .............................................................................................. 76
8.3 Characterization catalyst 3 .............................................................................................. 79
8.4 Characterization catalyst 4 .............................................................................................. 82
8.5 Characterization catalyst 5 .............................................................................................. 85
8.6 Synthetic considerations ................................................................................................. 88
8.7 Poster for poster presentation ISOC 2017 ...................................................................... 90
1 – Introduction 9
1 – Introduction
1.1 The energy problem
Supplying mankind with secure, abundant and sustainable energy is the most important scientific
and technological challenge of the 21st century.1,2 At the moment, global energy consumption is
approximately 4.1 x10²⁰ J∙yr-1, equivalent to a continuous power consumption of 17.2 TW.3
Several institutions and research groups have worked out projections for future energy use. The
International Energy Outlook 2016, by the U.S. Energy Information Administration, predicts 27
TW power consumption in 2040 and 30 TW by 2050.4 Jacobson and Delucchi hypothesize an
energy use of 38 TW in 20305 and according to the U.N. Development Programme, we can expect
a shortage of 10 TW in 2050.6
The International Panel on Climate Change (IPCC) has developed a model to predict global energy
use (E) based on the following equation
𝐸 = 𝑁 ∙ (𝐺𝐷𝑃
𝑁) ∙ (
𝐸
𝐺𝐷𝑃) (1)
where N is the global population, GDP/N is the globally averaged gross domestic product (GDP)
per capita and E/GDP is the energy used per unit of capita (the globally averaged energy
intensity).1,7 In the ‘business as usual’-scenario of the model, the global population is assumed to
grow by 0.9 %∙yr-1, the factor GDP/N is assumed to increase by 1.4 %∙yr-1 and the global energy
intensity is assumed to remain constant, leading to a growth in the world energy consumption of
2.3 %∙yr-1 to 40.8 TW in 2050. However, anticipating continued improvements in energy
technology, thus assuming a decrease in global energy intensity, this value can be adjusted to 27
TW in 2050. An overview of the projections of this ‘business as usual’-scenario by IPCC is given in
Table 1.1.

1 – Introduction 10
Table 1.1. World energy projections. Adapted from Nocera and Lewis.1,7
Quantity Definition Units 2001 2050 2100
N Global population 109 persons 6.145 9.4 10.4
GDP GDP 1012 $∙yr-1 46 140 284
GDP/N Per capita GDP $∙person-1∙yr-1 7 470 14 850 27 320
E/GDP Energy intensity W∙$-1∙yr-1 0.294 0.20 0.15
E Power consumption TW 13.5 27.6 43.0
C Equivalent CO2 emission
rate
GtCO2∙yr-1 (Gt = 1012
kg)
24.07 40.3 48.8
Along with increasing energy use comes increasing carbon emission. The expected CO2 emission
rate, calculated according to the same model by the IPCC, is shown in Table 1.1. Although climate
change is dismissed as ‘a hoax’ by some,8 it is recognized and handled worldwide as a major
challenge. Efforts to counteract climate change are made in the form of e.g. the 2016 Paris
Agreement, Obama’s 2013 Climate Action Plan and the 2008 Kyoto Protocol, mostly with the aim
to reduce greenhouse gas emission.9
Climate change has numerous irreversible effects on the planet and its people, including
biosphere pollution, temperature rise, alteration of the planet’s radiation balance and an increase
of extreme weather events.2,3,5 Forzieri et al. recently made the prognosis that the number of
deaths caused by climate change will be increased fifty-fold at the end of the century compared
to the last 30 years (150 000 deaths resulting from climate change in Europe by 2100).10
Carbon emission lies at the base of many climate consequences and therefore the source of
energy is crucial to ensure a sustainable future.
1.2 Source of energy
In the past two centuries, the mix of energy sources has been dominated by wood, coal, oil and
natural gas, in chronological order. Because of the higher H/C ratio of oil and gas, this shift has
had the consequence of decreasing the average carbon intensity of the energy mix.1 In order to
1 – Introduction 11
decrease the carbon footprint even more, eventually to zero, society is in need of new, carbon-
free sources of energy. Several energy sources and their feasibility for continued use are discussed
below.
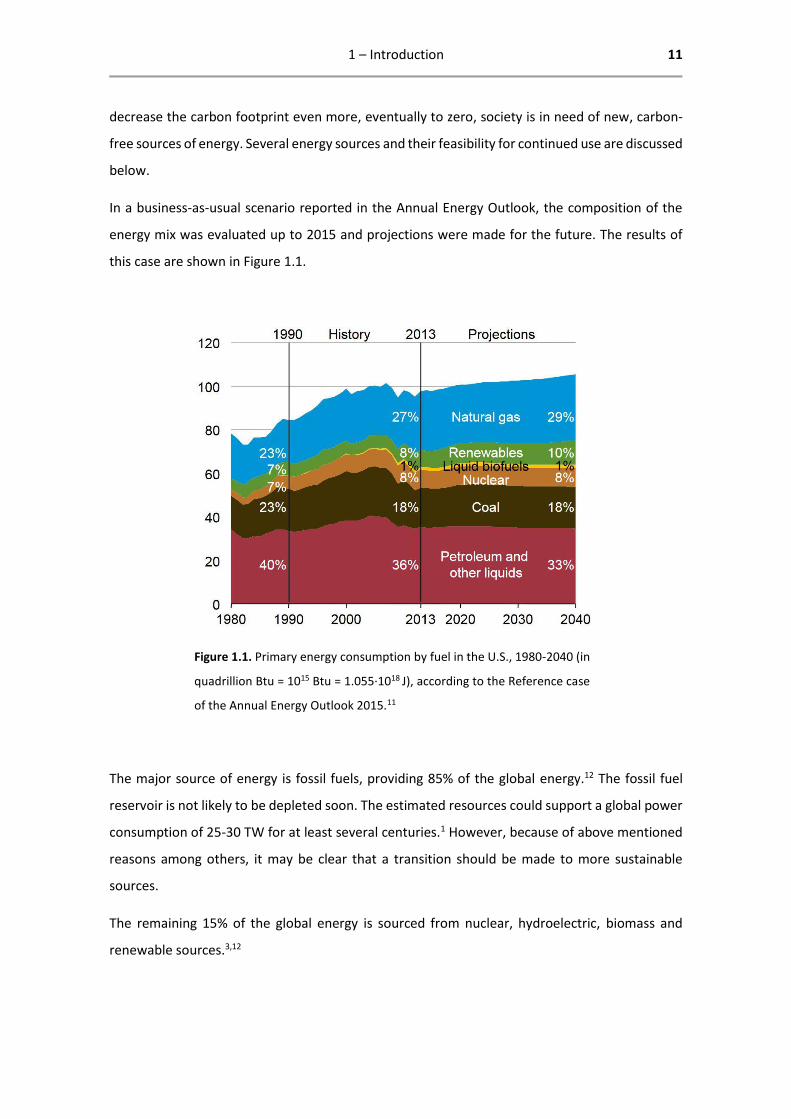
In a business-as-usual scenario reported in the Annual Energy Outlook, the composition of the
energy mix was evaluated up to 2015 and projections were made for the future. The results of
this case are shown in Figure 1.1.
Figure 1.1. Primary energy consumption by fuel in the U.S., 1980-2040 (in
quadrillion Btu = 1015 Btu = 1.055∙1018 J), according to the Reference case
of the Annual Energy Outlook 2015.11
The major source of energy is fossil fuels, providing 85% of the global energy.12 The fossil fuel
reservoir is not likely to be depleted soon. The estimated resources could support a global power
consumption of 25-30 TW for at least several centuries.1 However, because of above mentioned
reasons among others, it may be clear that a transition should be made to more sustainable
sources.
The remaining 15% of the global energy is sourced from nuclear, hydroelectric, biomass and
renewable sources.3,12
1 – Introduction 12
Nuclear energy is mostly regarded as clean energy, but power plants are expensive to build and
safe disposal of nuclear waste has not yet been discovered. Furthermore, to supply in our energy
needs, a new one-gigawatt (1 GW) nuclear fission plant should be constructed every other day
for the next 50 years.2 Apart from this being a seemingly impossible task, it would cause the
earth’s uranium supply to be exhausted within less than a decade.1 Another interesting source of
energy is a recently invented diamond battery made of nuclear waste. Scott et al. encapsulated
radioactive material in a man-made diamond that subsequently generated a small electric charge
without leaking of radiation. The life expectancy of the diamond would be determined by the
half-life of the radioactive isotope, i.e. 5730 years for carbon sourced from nuclear waste.
However promising this method sounds for both energy supply and nuclear waste treatment, the
generated current would be small and the batteries would find application mostly in remote
places like high-altitude drones and spacecrafts.13
Jacobson compared several long-term energy systems and found WWS (wind, water, solar)
systems to be superior to nuclear, fossil-fuel, and biofuel systems on environmental and other
criteria.14
Hydroelectric energy has advantages like low operating cost, long plant lifetime and easy
harvesting of potential energy for peak energy demand, but disadvantages are excessive land
occupation and low yield.2 The exploitable hydroelectric resource is estimated to be less than 0.5
TW.15
Wind energy is another component of WWS which is widely used as a renewable resource. It is a
viable energy source as wind, the primary ‘fuel’ from which energy is harvested, has zero cost,
wind energy has no atmospheric emission and turbines can be constructed fast and with a wide
range of capacities. Disadvantages are distance between source and consumption point of the
energy and ecological and aesthetic objections.2 Globally extractable wind energy has been
estimated to be 2-6 TW.16
Finally, solar energy is an energy source with huge sustainable potential. Although planet Earth is
a closed system (sometimes called spaceship Earth2,17), it receives high energy input at zero cost,
making life itself possible. Sunlight strikes the earth at a continuous rate of 120 000 TW, exceeding
the anthropomorphic energy demands by orders of magnitude.18 The planet receives more
energy from sunlight in one hour than it consumes in a year.6
It has been estimated that about 20 TW of energy would be generated by covering 0.16 % of the
planet with a material of 10% solar conversion efficiency.19 This calculation is an
1 – Introduction 13
oversimplification because the solar radiation should be captured, converted and stored prior to
use. Nocera and Lewis argue that solar energy will never be a primary energy source for society
without cost-effective storage methods, because of the diurnal variation in local insolation (i.e.
the day-night-cycle).1
The inherent storage problem of electrical energy will not be solved by batteries only in an energy-
demanding future. Abandoning fossil fuels for electric energy is not likely with a battery energy
storage density of 30-50 times less than gasoline.20 Combination of both forms of storage on the
other hand, electrical and chemical storage, yields an electro-chemical energy storage medium
that is arguably the yellow brick road to sustainable energy: solar fuels.1,21
1.3 Solar fuels and photosynthesis
The production of solar fuels as energy vector ranks amongst the most important challenges for
a future based on regenerative primary energy sources. It fulfils the requirement for energy
storage in dense, transportable media by converting diffuse, intermittent solar energy to
potential energy captured in chemical bonds.22 Compared to batteries, with a storage capacity of
0.1-0.5 MJ∙kg-1, liquid fuels and compressed H2 (at 700 atm) are viable energy storage media (50
and 140 MJ∙kg-1, respectively).23 The concept of solar fuels is something that Italian
photochemistry pioneer Giacomo Ciamician foresaw as early as a century ago,17,24 but that Nature
has already been practicing for some 3 billion years.
1.3.1 Natural photosynthesis
An estimated 100 TW of solar energy go into photosynthesis on our green planet. It is our prime
example for harvesting solar energy, producing reducing equivalents from water and fixing solar
energy together with CO2 in high-energy organic molecules. Green plants, algae and
cyanobacteria carry out photosynthesis via a complex pathway of coupled enzyme reactions.25
An antenna system (chlorophyll and other accessory pigments in photosystem II (PSII)) harvests
photons and converts their energy into a chemical potential by excitation of the primary acceptor
P680. The chemical potential comprises the separation (photo-induced charge separation) of a
negatively charged electron and a positively charged hole (or more specifically, an electron
1 – Introduction 14
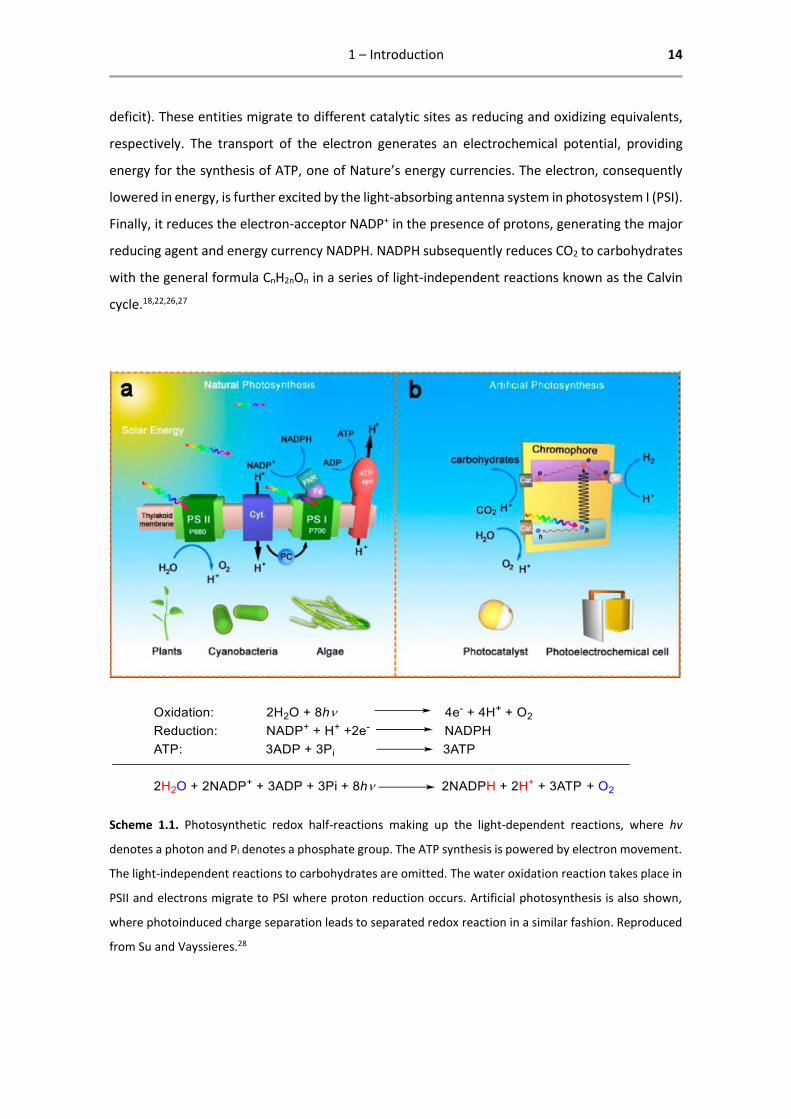
deficit). These entities migrate to different catalytic sites as reducing and oxidizing equivalents,
respectively. The transport of the electron generates an electrochemical potential, providing
energy for the synthesis of ATP, one of Nature’s energy currencies. The electron, consequently
lowered in energy, is further excited by the light-absorbing antenna system in photosystem I (PSI).
Finally, it reduces the electron-acceptor NADP+ in the presence of protons, generating the major
reducing agent and energy currency NADPH. NADPH subsequently reduces CO2 to carbohydrates
with the general formula CnH2nOn in a series of light-independent reactions known as the Calvin
cycle.18,22,26,27
Scheme 1.1. Photosynthetic redox half-reactions making up the light-dependent reactions, where hv
denotes a photon and Pi denotes a phosphate group. The ATP synthesis is powered by electron movement.
The light-independent reactions to carbohydrates are omitted. The water oxidation reaction takes place in
PSII and electrons migrate to PSI where proton reduction occurs. Artificial photosynthesis is also shown,
where photoinduced charge separation leads to separated redox reaction in a similar fashion. Reproduced
from Su and Vayssieres.28
1 – Introduction 15
The electron deficit generated in PSII by this series of reactions must be balanced by another
reaction providing the missing electrons. The electron source for the re-reduction of P680 is
water. The oxidizing equivalents oxidize a Mn4CaOx cluster inside PSII known as the oxygen-
evolving complex (OEC) via four consecutive charge separation reactions. After this charge-up of
oxidizing potential, PSII releases dioxygen with an overall energy storage efficiency of 46 % and a
maximum turnover frequency of 50 s-1.29 The protons and electrons follow the pathway above
and dioxygen is released into the atmosphere as a by-product of photosynthesis (being vital for
most life on Earth nonetheless).18,22,26,27
In summary, water is photochemically split into electrons and protons, capable of storing solar
energy in carbohydrate bonds, and dioxygen. The separate and total reactions are shown in
Scheme 1.1.
1.3.2 Artificial photosynthesis
Although photosynthesis is much appreciated by the majority of Earth’s inhabitants, the reaction
sequence is relatively inefficient. For example, one of the fastest-growing crops, switch grass,
stores energy in biomass at an annual average of less than 1 W∙m-2, which is an energy conversion
and storage efficiency of less than 0.5 %.6 Biofuels derived from existing plants could contribute
to liquid fuels as energy storage medium for transportation uses, but even if energy crops would
be grown on all naturally irrigated cultivatable land that is not currently used for food production,
it would maybe yield a skimpy 5-10 TW of total power.1
Photosynthesis is an ancient process that evolved without efficiency as selection pressure. Some
inefficiencies that contribute to the low energy storage yield of photosynthesis by cyanobacteria,
algae and green plants are listed by Larkum:25
1. The existence of two photosystems (in series) rather than one.
2. Incomplete solar light usage by dependency on the absorption spectrum of chlorophyll
and on energy harvesting from its first-excited singlet state.
3. Photo-inhibitory damage to PSII.
Apart from modifying plants to increase the efficiency of the photosynthetic process, humankind
has embarked on the mission of redesigning the process accommodating his own demands. Based
on Nature’s blueprint, artificial photosynthesis relies on the same five major components as
natural photosynthesis:30
1 – Introduction 16
1. An antenna system, for harvesting and concentrating solar light.
2. A charge separation unit, that generates electrons and positive charges utilizing the
accumulated energy.
3. A catalyst for proton reduction.
4. A catalyst for water oxidation.
5. A membrane that separates these two redox processes by being selectively permeable
for protons only.
To generate a fuel that releases energy upon combustion (oxidation), reducing equivalents –
protons and electrons – will be needed, whatever the form of the fuel.18 Using water is ideal, as
it is the most abundant, sustainable and cheap source of these reducing equivalents on Earth, and
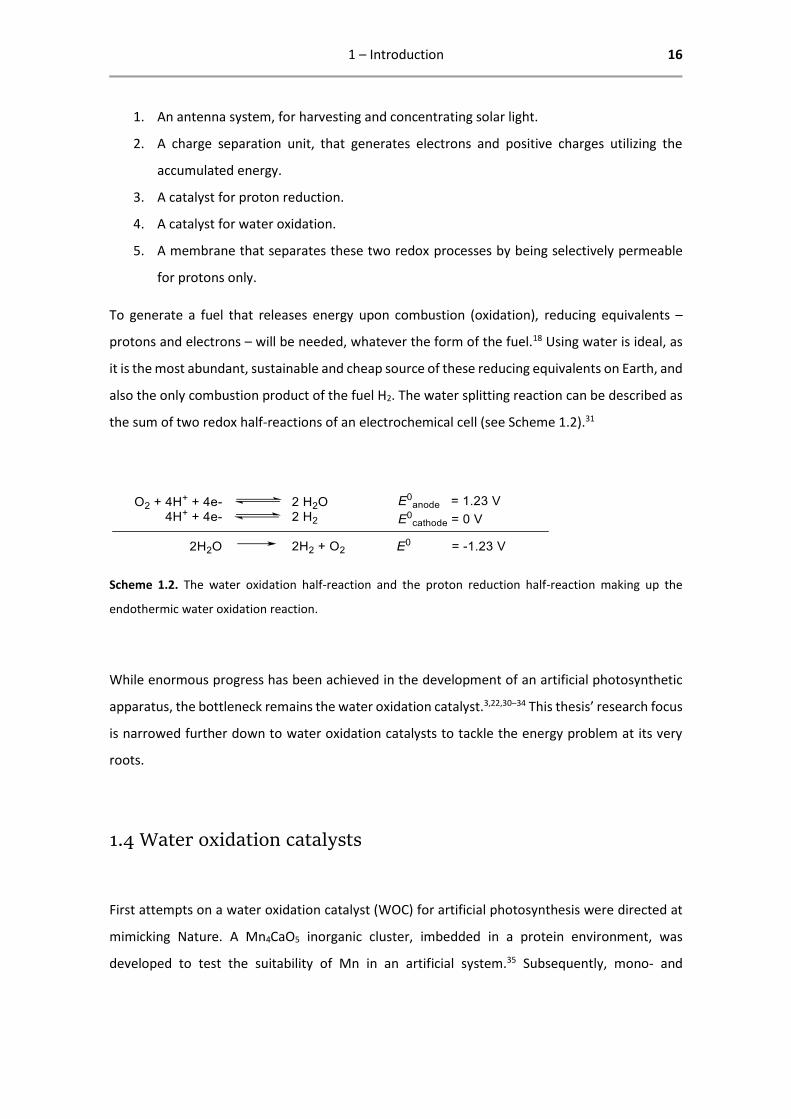
also the only combustion product of the fuel H2. The water splitting reaction can be described as
the sum of two redox half-reactions of an electrochemical cell (see Scheme 1.2).31
Scheme 1.2. The water oxidation half-reaction and the proton reduction half-reaction making up the
endothermic water oxidation reaction.
While enormous progress has been achieved in the development of an artificial photosynthetic
apparatus, the bottleneck remains the water oxidation catalyst.3,22,30–34 This thesis’ research focus
is narrowed further down to water oxidation catalysts to tackle the energy problem at its very
roots.
1.4 Water oxidation catalysts
First attempts on a water oxidation catalyst (WOC) for artificial photosynthesis were directed at
mimicking Nature. A Mn4CaO5 inorganic cluster, imbedded in a protein environment, was
developed to test the suitability of Mn in an artificial system.35 Subsequently, mono- and
1 – Introduction 17
bimetallic Ru complexes were synthesized with remarkable performance.36 More recently Fe, Co
and Cu have been successfully applied in WOCs based on cheaper and more abundant metals.30
Some general molecular properties can be adumbrated for the rational design of an effective
WOC. The catalytic precursor should consist of at least one active metal centre, coordinated by
robust ligands to withstand a harsh oxidative environment. These ligands should stabilize the high
oxidation states to be reached for mediating the O-O bond formation step. Therefore, electron-
donating ligands are self-evident candidates, usually containing heteroatoms like oxygen or
nitrogen. Furthermore, the water oxidation reaction requires one or more free coordination sites
on the metal centre for the coordination of water.3 Ideally, the catalyst would operate at low
over-potential (i.e. near the thermodynamic oxidation potential of water), be long-lived and
employ only earth-abundant metals. Fundamental research, however, is now mostly focussed on
metals like Ru and Ir to optimize the ration design before implementing more sustainable
metals.18
1.5 Cp*Ir WOCs
The first Ir WOC, and at the same time the first organometallic molecular WOC, was reported by
Bernhard et al. in 2008.37 It consisted of an Ir centre, surrounded by two 2-phenylpyridine (ppy)
ligands and two water molecules. Soon after this, Crabtree et al. demonstrated the effectiveness
of Cp*Ir(ppy)X compounds as WOCs.38 The introduction of the Cp* ligand stimulated an enormous
increase in research on Cp*Ir compounds as WOCs, as a large variety of this class of compounds
was already known in the organometallic scientific community.30 The Cp* ligand has proven to
play a beneficial role in reaching high Ir oxidation states.39 Iridium organometallic catalysts are
researched thoroughly because of their extremely high activity40,41 and tunability by changing the
ancillary ligands.32,42
Several benchmarks in the development of Cp*Ir WOCs have led to the work in this thesis. In
2012, Fukuzumi et al. synthesized [Cp*Ir(4,4′-R2-2,2′-bpy)(H2O)]2+ precursors (R = OH, OMe, Me,
and COOH; bpy = bipyridine), reaching TOF-values of 45 min-1 in water oxidation driven by cerium
ammonium nitrate (CAN).43 A year later, Papish et al. reported pH-responsive catalysts driven by
sodium periodate (NaIO4), [Cp*Ir{4,4′-(OH)2-2,2′-bpy}Cl]+ and [Cp*Ir{6,6′-(OH)2- 2,2′-bpy}Cl]+,
reaching TOF-values of 112 min-1.44 Then, in 2014, Fujita et al. reported pH-responsive catalysts

1 – Introduction 18
driven by NaIO4 in phosphate buffer, [Cp*Ir{6,6′-(OH)2-2,2′-bpy}(H2O)]2+, reaching TOF-values
among the highest ever reported (210 min-1).45 Our group introduced the strongly electron-
donating and oxidatively stable pyridine-carboxylate ligand and reported record TOF-values of
288 min-1 for [Cp*Ir(pic)NO3] (pic = picolinate = κ2-pyridine-2-carboxylic acid; catalyst further
referred to as pic) driven by CAN.46 This high activity was maintained for a short time, making
place for a long-term TOF of only 5 min-1, as confirmed by Reek et al. in 2016.47 Recently, pic has
shown to be even more active, and for the whole time of catalysis, in water oxidation driven by
NaIO4. The maximum observed TOF was 7.6 s-1, or 458 min-1, the highest ever reported for an Ir
WOC and for any WOC driven by NaIO4.32 Furthermore, all expected cycles were performed; the
TON was limited only by the concentration of NaIO4.
Key concepts for improving on WOCs include stabilization of the high Ir oxidation state and
efficient proton transfer. These challenges can be met by introduction of strong donor sites to
facilitate high oxidation states and proton acceptor and donor sites for increasing the proton
transfer steps. Combination of these features enables proton-coupled electron transfer (PCET), a
crucial step in lowering the energy surface of the transfer of four protons and electrons that takes
place in the oxidation of water. The mechanism of water oxidation is discussed below.
1.5.1 Mechanism of water oxidation by Ir WOCs
Much experimental and computational study has been directed at the mechanistic steps of the
cycle of the water oxidation reaction involving the transfer of four protons and electrons. The
mechanism of water oxidation remains a subject of much uncertainty and study, for both PSII and
its artificial reproductions. However, generally two mechanisms are distinguished for water
oxidation by Ir WOCs: water nucleophilic attack (WNA) and radical oxo coupling (ROC), shown in
Scheme 1.3.18,41
The main factor that differentiates these pathways is the electron density on the metal centre.
Although assigning the correct mechanism and rate determining step (RDS) remains hampered
by assumptions and uncertainty for many WOCs, it is generally believed that a high-valent oxo
species is involved.31,41 For both proposed mechanisms, an IrIII-aqua catalytic precursor is oxidized
in two PCET steps to an IrV-oxo species. In the ROC pathway, electron-donating ligands facilitate
high electron density on Ir, giving rise to a radical Ir-oxyl species. Two equivalents couple in an
oxo-bridging fashion. After O-O bond formation, O2 is released in a step resembling reductive
1 – Introduction 19
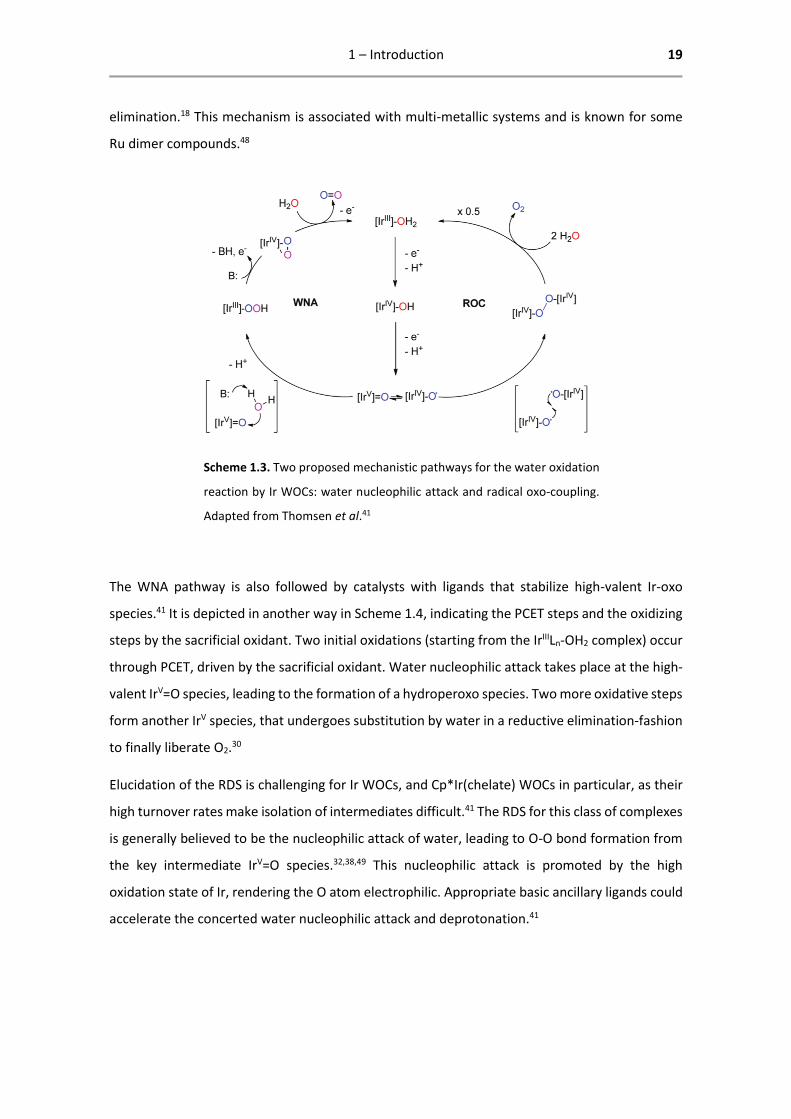
elimination.18 This mechanism is associated with multi-metallic systems and is known for some
Ru dimer compounds.48
Scheme 1.3. Two proposed mechanistic pathways for the water oxidation
reaction by Ir WOCs: water nucleophilic attack and radical oxo-coupling.
Adapted from Thomsen et al.41
The WNA pathway is also followed by catalysts with ligands that stabilize high-valent Ir-oxo
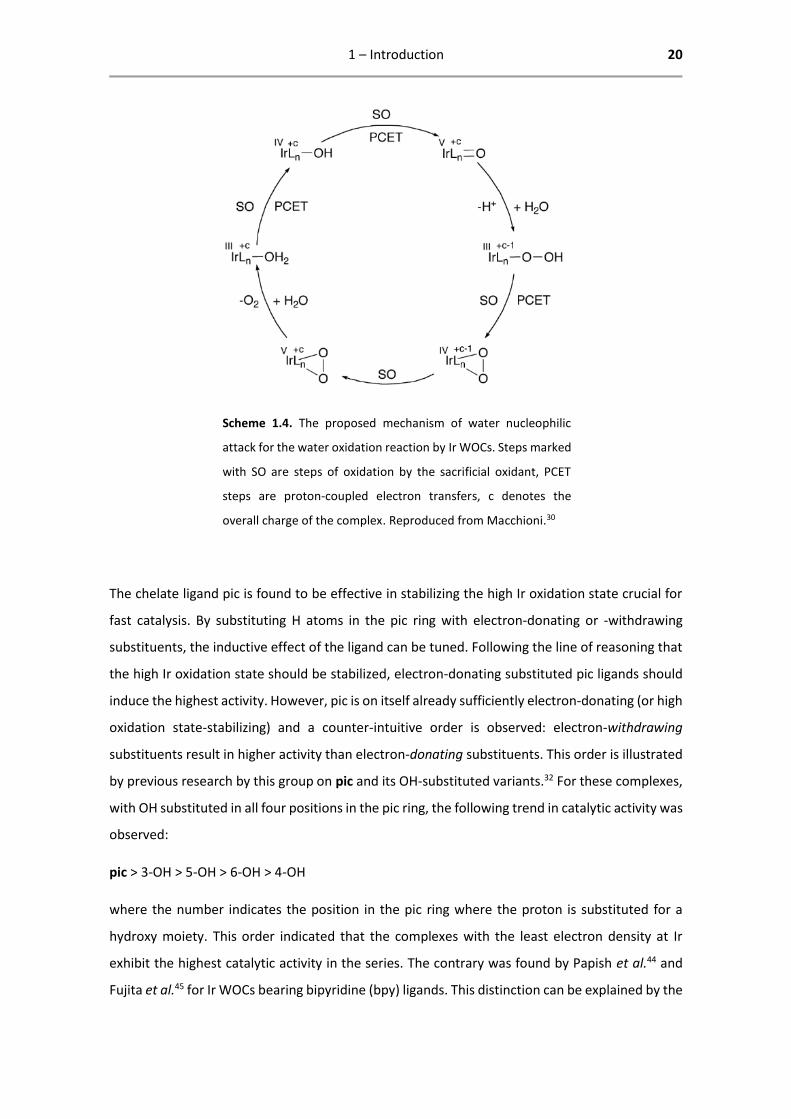
species.41 It is depicted in another way in Scheme 1.4, indicating the PCET steps and the oxidizing
steps by the sacrificial oxidant. Two initial oxidations (starting from the IrIIILn-OH2 complex) occur
through PCET, driven by the sacrificial oxidant. Water nucleophilic attack takes place at the high-
valent IrV=O species, leading to the formation of a hydroperoxo species. Two more oxidative steps
form another IrV species, that undergoes substitution by water in a reductive elimination-fashion
to finally liberate O2.30
Elucidation of the RDS is challenging for Ir WOCs, and Cp*Ir(chelate) WOCs in particular, as their
high turnover rates make isolation of intermediates difficult.41 The RDS for this class of complexes
is generally believed to be the nucleophilic attack of water, leading to O-O bond formation from
the key intermediate IrV=O species.32,38,49 This nucleophilic attack is promoted by the high
oxidation state of Ir, rendering the O atom electrophilic. Appropriate basic ancillary ligands could
accelerate the concerted water nucleophilic attack and deprotonation.41
1 – Introduction 20
Scheme 1.4. The proposed mechanism of water nucleophilic
attack for the water oxidation reaction by Ir WOCs. Steps marked
with SO are steps of oxidation by the sacrificial oxidant, PCET
steps are proton-coupled electron transfers, c denotes the
overall charge of the complex. Reproduced from Macchioni.30
The chelate ligand pic is found to be effective in stabilizing the high Ir oxidation state crucial for
fast catalysis. By substituting H atoms in the pic ring with electron-donating or -withdrawing
substituents, the inductive effect of the ligand can be tuned. Following the line of reasoning that
the high Ir oxidation state should be stabilized, electron-donating substituted pic ligands should
induce the highest activity. However, pic is on itself already sufficiently electron-donating (or high
oxidation state-stabilizing) and a counter-intuitive order is observed: electron-withdrawing
substituents result in higher activity than electron-donating substituents. This order is illustrated
by previous research by this group on pic and its OH-substituted variants.32 For these complexes,
with OH substituted in all four positions in the pic ring, the following trend in catalytic activity was
observed:
pic > 3-OH > 5-OH > 6-OH > 4-OH
where the number indicates the position in the pic ring where the proton is substituted for a
hydroxy moiety. This order indicated that the complexes with the least electron density at Ir
exhibit the highest catalytic activity in the series. The contrary was found by Papish et al.44 and
Fujita et al.45 for Ir WOCs bearing bipyridine (bpy) ligands. This distinction can be explained by the

1 – Introduction 21
electronic difference between pic and bpy ligands. Ir-bpy WOCs have a lower electron density at
the metal centre than Ir-pic WOCs and an electron-donating substituent allows the metal to reach
the highest oxidation state needed for water oxidation. On the other hand, Ir-pic WOCs already
possess enough electron density to stabilize the IrV state and further electron donation leads to
minor polarization of the Ir=O bond. In this way, addition of electron-withdrawing substituents
slightly decreases the electron density on Ir, increasing the oxygen atom’s electrophilicity and
favouring water nucleophilic attack.32 The tunability of catalytic activity by modification of the
molecular structure of the ancillary ligand led to the objective of this thesis’ work.
Regarding pic and its OH-derivatives, the WNA pathway is hypothesized. Assuming that O-O bond
formation is the RDS, the effect of changing the substituent on the TOF only agrees with the WNA
pathway. If the catalytic cycle would follow the ROC pathway with O-O bond formation as the
RDS, a lower electron density on Ir would have a negative effect on the TOF.
1.6 Objective of the thesis
The objective of this project is to correlate the electron density on Ir with the TOF and
simultaneously to increase the catalytic performance of Ir catalysts for water oxidation by
optimizing the molecular structure of the most active Ir WOC so far. Record TOFs were obtained
with pic and substituted Ir-pic WOCs,32 and this project continues in its footsteps.
In this thesis, several variants of pic have been synthesized with different electron-donating and
electron-withdrawing substituents in different positions of the pic-ring. The degree of the
inductive effect is determined by comparison of the substituents’ σ-Hammett parameters. A
strongly electron-withdrawing catalyst, with a high σ-Hammett parameter (i.e. with a meta-nitro
substituent, 3), a strongly electron-donating catalyst, with a highly negative σ-Hammett
parameter (i.e. with a para-amino moiety, 2) and catalysts with intermediate σ-Hammett
parameters have been synthesized and subjected to catalytic tests. Both the nature and the
position of the substituent influence the electron density on the metal, as shown in Scheme 1.5.
A correlation between the σ-Hammett parameter and the TOF is hypothesized. Successful
correlation of the inductive effect of the ligand and the TOF would be a step forward in the
rational molecular design of catalysts for water oxidation.

1 – Introduction 22
Scheme 1.5. The inductive effect of electron-donating (D) and withdrawing (W) substituents on the electron
density distribution in a phenyl ring. The partial positive and negative charges (δ+ and δ-) underlie the high
electron-donating effect to Ir of 2 and the electron-withdrawing effect of 3. With a nitro moiety in para
position, the electron-withdrawing effect is indeed even stronger than with the nitro moiety in meta-
position (0.78 compared to 0.71), and the electron-donating effect of an amino moiety is stronger in para
position than in meta-position (-0.66 compared to -0.16).50
2 – Synthesis and characterization 23
2 – Synthesis and characterization
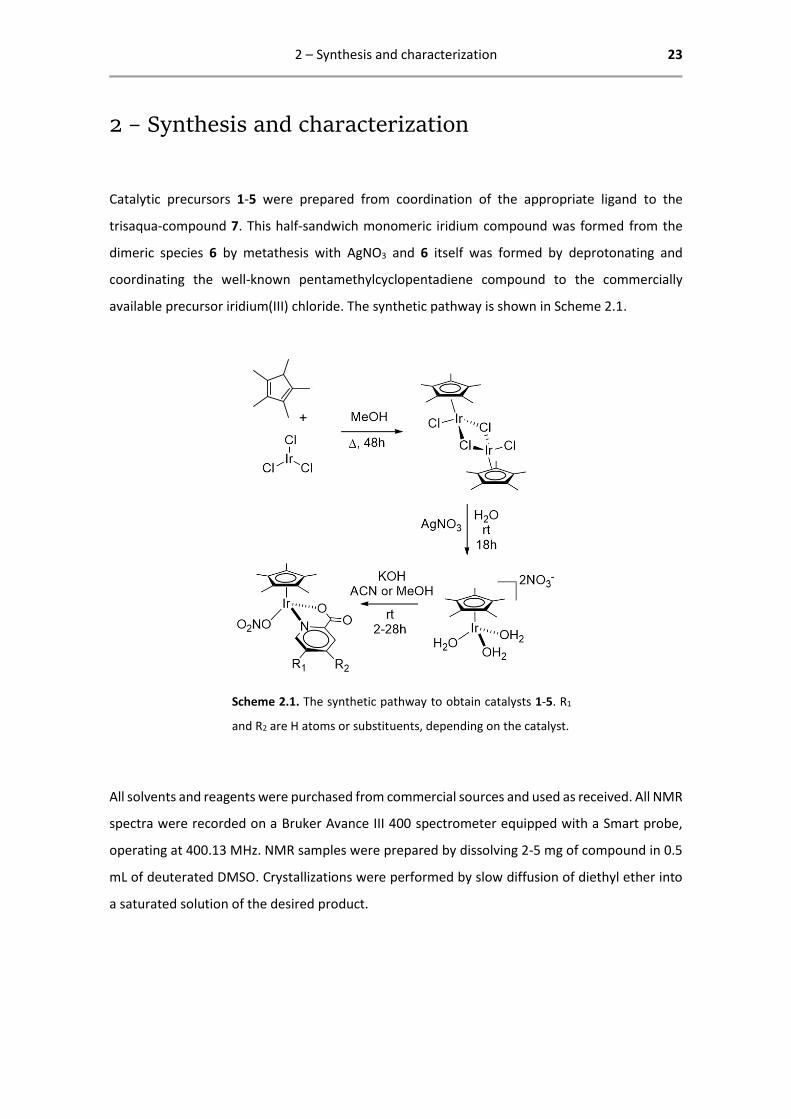
Catalytic precursors 1-5 were prepared from coordination of the appropriate ligand to the
trisaqua-compound 7. This half-sandwich monomeric iridium compound was formed from the
dimeric species 6 by metathesis with AgNO3 and 6 itself was formed by deprotonating and
coordinating the well-known pentamethylcyclopentadiene compound to the commercially
available precursor iridium(III) chloride. The synthetic pathway is shown in Scheme 2.1.
Scheme 2.1. The synthetic pathway to obtain catalysts 1-5. R1
and R2 are H atoms or substituents, depending on the catalyst.
All solvents and reagents were purchased from commercial sources and used as received. All NMR
spectra were recorded on a Bruker Avance III 400 spectrometer equipped with a Smart probe,
operating at 400.13 MHz. NMR samples were prepared by dissolving 2-5 mg of compound in 0.5
mL of deuterated DMSO. Crystallizations were performed by slow diffusion of diethyl ether into
a saturated solution of the desired product.
2 – Synthesis and characterization 24
2.1 Synthesis of precursors
Dichloro(pentamethylcyclopentadienyl)iridium(III) dimer – [Cp*IrIII(µ-Cl)Cl]2 – 6
To a suspension of iridium(III) chloride (IrCl3) (3.749 g, 12.56 mmol, 1 eq) in
methanol (50 mL), cyclopentadiene (2.395 g, 17.58 mmol, 1.4 eq) was added
and the mixture was stirred under vigorous reflux and nitrogen atmosphere
for 48 h. The resulting bright orange mixture was allowed to separate into a
deep red solution and a bright orange precipitate. The solution was
concentrated, filtered over vacuum and the product (3.590 g, 72 %) was washed with ether.
Trisaqua(pentamethylcyclopentadienyl)iridium(III) – [Cp*IrIII(H2O)3](NO3)2 – 7
6 (1.000 g, 1.26 mmol, 1 eq) was dissolved in water (15 mL) and AgNO3
(0.896 g, 5.27 mmole, 4.2 eq) was added, at which the colour changed
from deep orange to white-yellow. The mixture was stirred vigorously
at r.t. under nitrogen atmosphere for 18 h. The resulting suspension of
yellow-white foam was filtered through membrane and the yellow filtrate was dried. The product
was extracted from the resulting sticky yellow oil with DCM. The solution was dried and the
product (1.060 g, 84 %) was obtained as bright orange powder.
2.2 Synthesis of catalysts
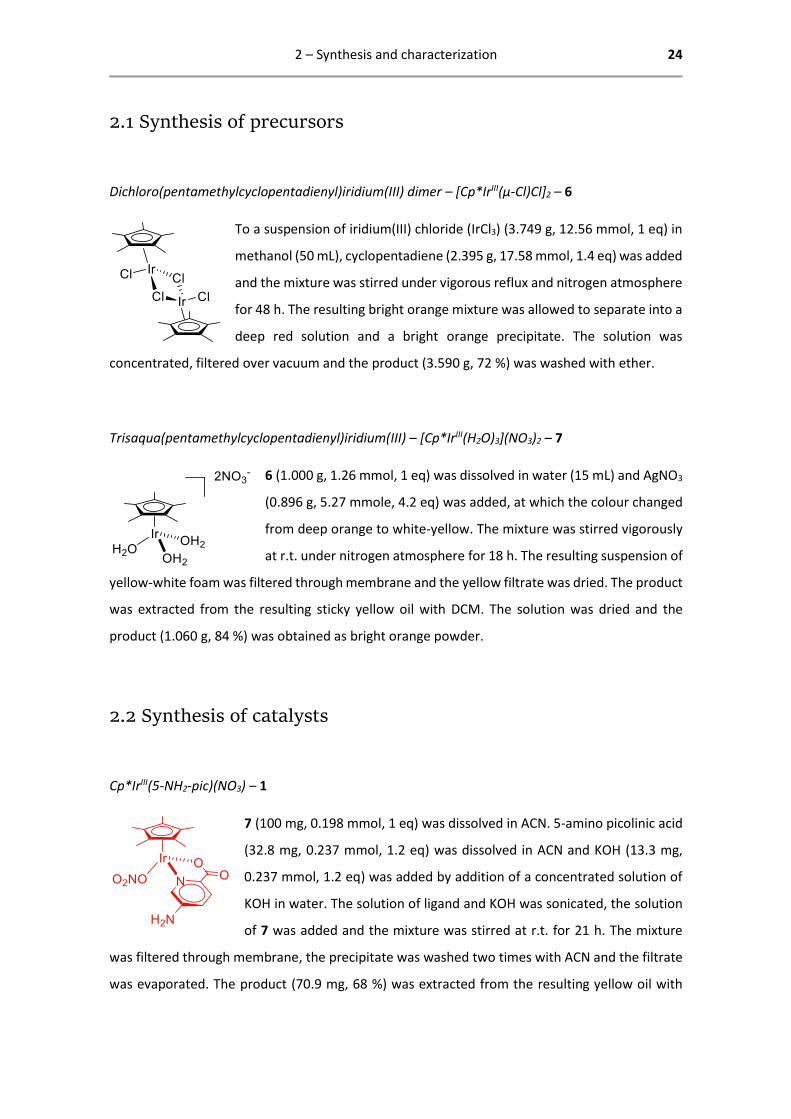
Cp*IrIII(5-NH2-pic)(NO3) – 1
7 (100 mg, 0.198 mmol, 1 eq) was dissolved in ACN. 5-amino picolinic acid
(32.8 mg, 0.237 mmol, 1.2 eq) was dissolved in ACN and KOH (13.3 mg,
0.237 mmol, 1.2 eq) was added by addition of a concentrated solution of
KOH in water. The solution of ligand and KOH was sonicated, the solution
of 7 was added and the mixture was stirred at r.t. for 21 h. The mixture
was filtered through membrane, the precipitate was washed two times with ACN and the filtrate
was evaporated. The product (70.9 mg, 68 %) was extracted from the resulting yellow oil with
2 – Synthesis and characterization 25
DCM. The product was crystallized from DCM with diethyl ether for 6 d. The solvent was removed
by pipette and the yellow product was washed with diethyl ether and dried under vacuum for 5
h.
Cp*IrIII(4-NH2-pic)(NO3) – 2
7 (100 mg, 0.198 mmol, 1 eq) was dissolved in ACN. 4-amino picolinic acid
(32.8 mg, 0.237 mmol, 1.2 eq) was dissolved in ACN and KOH (13.3 mg,
0.237 mmol, 1.2 eq) was added by addition of a concentrated solution of
KOH in water. This mixture was sonicated, the solution of 7 was added
and the mixture was stirred at r.t. for 21 h. The mixture was filtered
through membrane, the precipitate was washed two times with ACN and the filtrate was
evaporated. The resulting yellow powder (89.7 mg, 86 %) was dissolved in DMF and crystallized
using diethyl ether at 0 °C. After two days, the solvent was removed by pipette and the dark
yellow crystals were washed with diethyl ether. The product was dried under vacuum for 2.5 h.
Cp*IrIII(5-NO2-pic)(NO3) – 3
7 (80.8 mg, 0.16 mmol, 1 eq) was dissolved in MeOH. 5-nitro picolinic acid
(32.3 mg, 0.192 mmol, 1.2 eq) was dissolved in MeOH, KOH (10.8 mg, 0.192
mmol, 1.2 eq) was added and the solution was sonicated. The solution of
7 was added and the mixture was stirred at r.t. for 2 h. The reaction
mixture was concentrated and the product was precipitated with diethyl
ether. The solution was decanted and the product (73.8 mg, 83%) was washed with diethyl ether
and dried overnight under vacuum.
Cp*IrIII(4-OMe-pic)(NO3) – 4
7 (100 mg, 0.198 mmol, 1 eq) was dissolved in MeOH. 4-methoxy
picolinic acid (32.5 mg, 0.237 mmol, 1.2 eq) and KOH (13.3 mg, 0.237
mmol, 1.2 eq) were dissolved in MeOH and sonicated. The solution of 7
was added and the mixture was stirred at r.t. for 20 h. The product (70.3
mg, 66 %) was dried and taken up in DCM. The mixture was filtered
2 – Synthesis and characterization 26
through membrane and the resulting solution was crystallized using diethyl ether. After a month,
the solvent was removed by pipette and the big bright yellow crystals were washed with diethyl
ether and dried under vacuum.
Cp*IrIII(4-Cl-pic)(NO3) – 5
7 (100 mg, 0.198 mmol, 1 eq) was dissolved in MeOH. 4-chloro picolinic
acid (33.5 mg, 0.237 mmol, 1.2 eq) and KOH (13.3 mg, 0.237 mmol, 1.2 eq)
were dissolved in MeOH. The solution of 7 was added and the mixture was
stirred at r.t. for 28 h. The crude product was filtered, dried and taken up
in DCM. The mixture was filtered through membrane and the product
(104.2 mg, 96 %) was obtained as an oily layer after drying under vacuum.
2.3 Characterization by NMR
Upon successful synthesis, the catalysts were characterized by a battery of NMR experiments
commonly used to elucidate the molecular structure of a compound. The conducted experiments,
1H, 13C, COSY, NOESY, HSQC and HMBC NMR, are described briefly below, together with their
application in this thesis.
1H NMR gives fast insight in the synthesis progress and quickly identifies aromatic and Cp* protons
at compound characterization. 13C NMR provides information about the chemical shift of all
carbon atoms. Because of the used 1H-decoupling sequence, meaning that all signals appear as
singlets because 1JC,H-coupling to protons is eliminated, the 13C-spectrum is more informative in
combination with 2D heteronuclear spectroscopy.
Correlation spectroscopy (COSY) is a 2D homonuclear NMR technique that detects spin-spin
coupling through chemical bonds (scalar coupling) between neighbouring protons (usually up to
four bonds). Cross peaks, resulting from magnetization transfer between close protons, allow for
the different protons in the aromatic pic ring to be assigned.51
2 – Synthesis and characterization 27
Nuclear Overhauser effect spectroscopy (NOESY) detects spin-spin through-space coupling
between spatially close protons (within about 5 Å).51 For the synthesized catalysts, the contact
between the Cp* protons and the proton in the pic ring closest to Ir (H-5) is detected.
Heteronuclear single-quantum correlation spectroscopy (HSQC) is a 2D through-bond correlation
method that detects scalar coupling between nuclei of different types, separated by one bond.52
It is used to elucidate the 13C spectrum once the 1H spectrum is assigned.
Heteronuclear multiple-bond correlation spectroscopy (HMBC) is a 2D through-bond technique
that detects scalar coupling between nuclei of different types over a range of 2-4 bonds.52 Here it
is used to distinguish the quaternary carbon atoms that cannot be identified using HSQC.
2.3.1 Demonstration of compound characterization
As an illustration of the method of molecular structure elucidation, the characterization of
catalyst 4 is reported below.
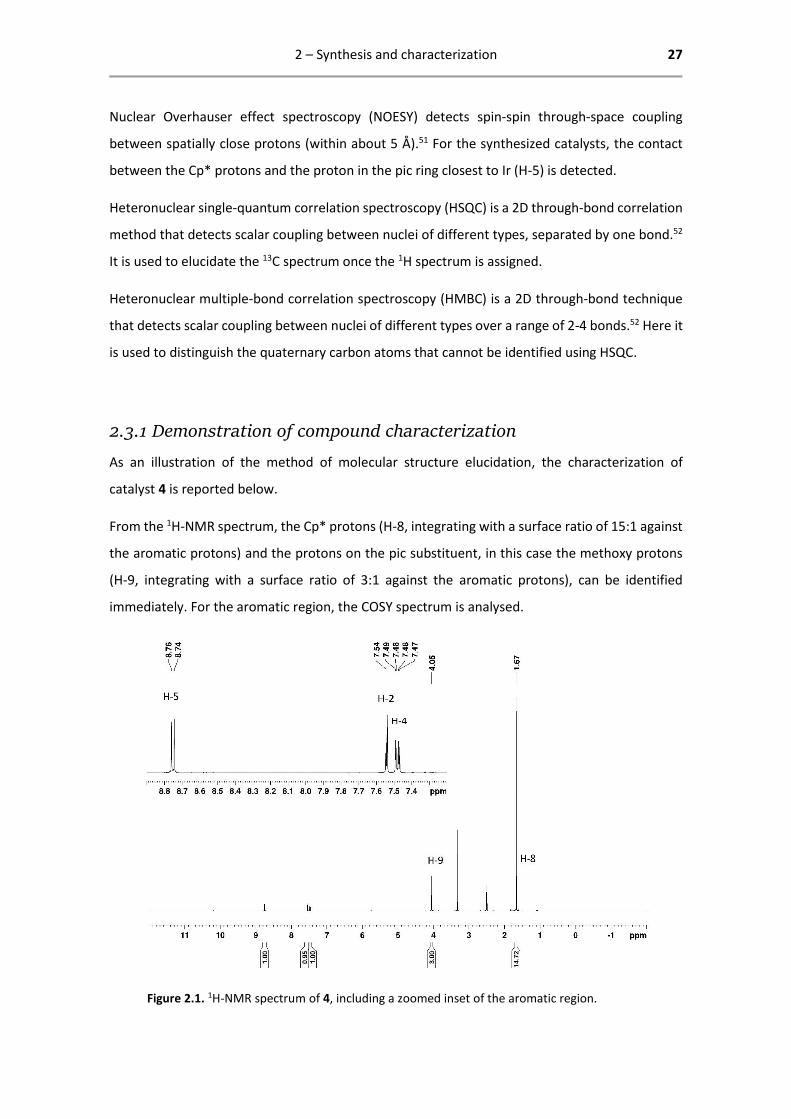
From the 1H-NMR spectrum, the Cp* protons (H-8, integrating with a surface ratio of 15:1 against
the aromatic protons) and the protons on the pic substituent, in this case the methoxy protons
(H-9, integrating with a surface ratio of 3:1 against the aromatic protons), can be identified
immediately. For the aromatic region, the COSY spectrum is analysed.
Figure 2.1. 1H-NMR spectrum of 4, including a zoomed inset of the aromatic region.
2 – Synthesis and characterization 28
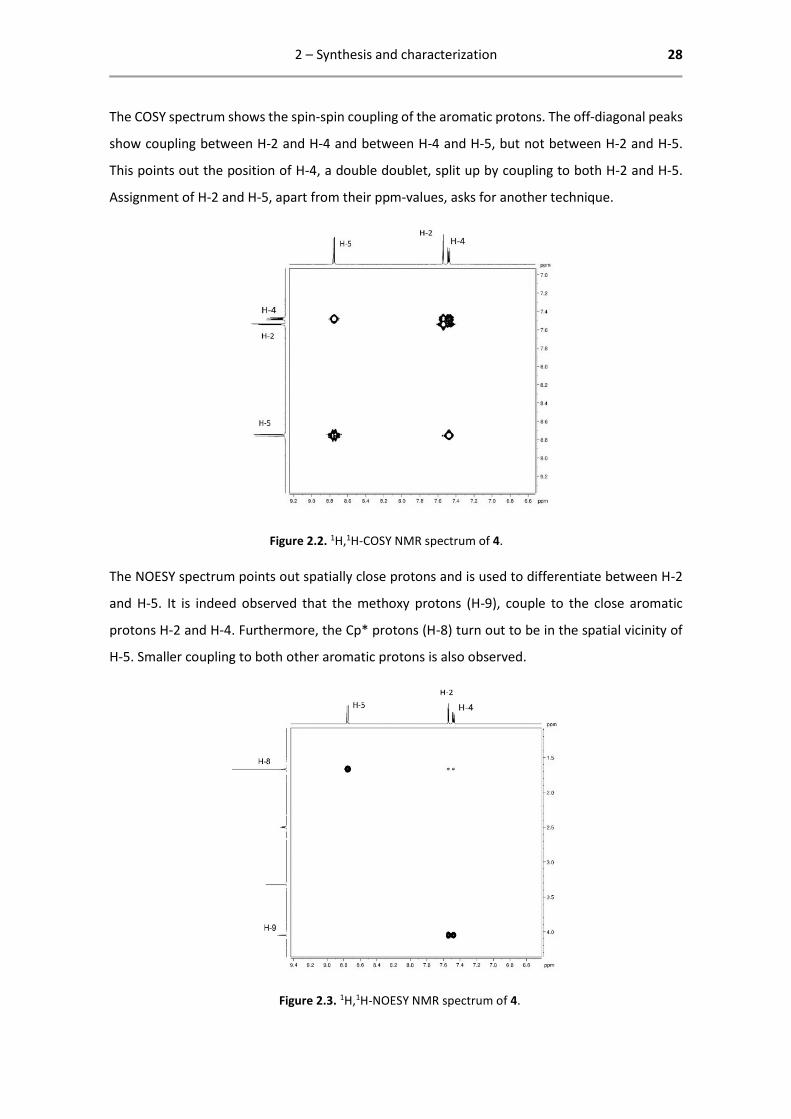
The COSY spectrum shows the spin-spin coupling of the aromatic protons. The off-diagonal peaks
show coupling between H-2 and H-4 and between H-4 and H-5, but not between H-2 and H-5.
This points out the position of H-4, a double doublet, split up by coupling to both H-2 and H-5.
Assignment of H-2 and H-5, apart from their ppm-values, asks for another technique.
Figure 2.2. 1H,1H-COSY NMR spectrum of 4.
The NOESY spectrum points out spatially close protons and is used to differentiate between H-2
and H-5. It is indeed observed that the methoxy protons (H-9), couple to the close aromatic
protons H-2 and H-4. Furthermore, the Cp* protons (H-8) turn out to be in the spatial vicinity of
H-5. Smaller coupling to both other aromatic protons is also observed.
Figure 2.3. 1H,1H-NOESY NMR spectrum of 4.

2 – Synthesis and characterization 29
From the 13C-NMR spectrum, the aliphatic Cp*-CH3 carbon atoms are easily assigned (C-8). The
methoxy carbon is most probably found at C-9 and the aromatic Cp* carbons at C-7. The aromatic
pic carbons are found by 2D NMR.
Figure 2.4. 13C-NMR spectrum of 4.
Now all proton signals are assigned, the carbon spectrum can be further analysed via the HSQC
spectrum. The spectrum reveals which carbon atoms are bound to the aromatic protons, i.e. C-5
is bound to H-5, C-2 to H-2 and C-4 to H-4. Furthermore, with the right window, the connection
between the methoxy C-9 and H-9 can be observed. The three remaining carbon atoms are
quaternary, bound to no protons.
Figure 2.5. 1H,13C-HSQC NMR spectrum of 4.
2 – Synthesis and characterization 30
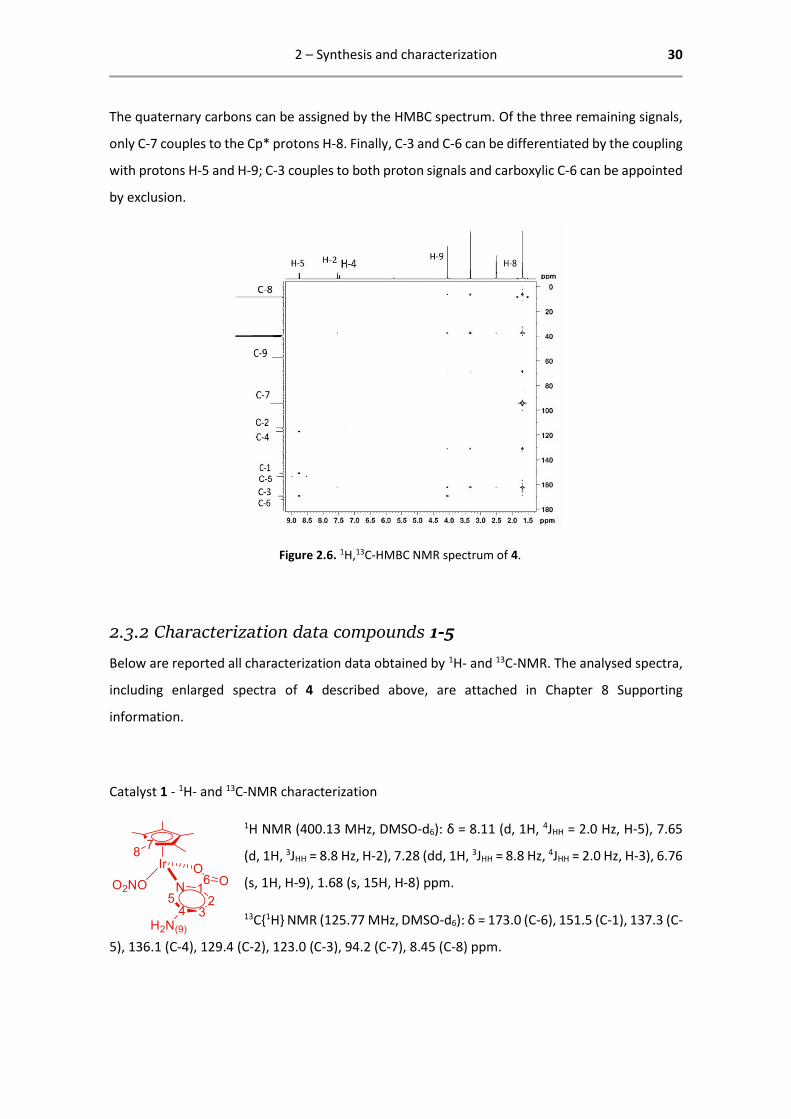
The quaternary carbons can be assigned by the HMBC spectrum. Of the three remaining signals,
only C-7 couples to the Cp* protons H-8. Finally, C-3 and C-6 can be differentiated by the coupling
with protons H-5 and H-9; C-3 couples to both proton signals and carboxylic C-6 can be appointed
by exclusion.
Figure 2.6. 1H,13C-HMBC NMR spectrum of 4.
2.3.2 Characterization data compounds 1-5
Below are reported all characterization data obtained by 1H- and 13C-NMR. The analysed spectra,
including enlarged spectra of 4 described above, are attached in Chapter 8 Supporting
information.
Catalyst 1 - 1H- and 13C-NMR characterization
1H NMR (400.13 MHz, DMSO-d6): δ = 8.11 (d, 1H, 4JHH = 2.0 Hz, H-5), 7.65
(d, 1H, 3JHH = 8.8 Hz, H-2), 7.28 (dd, 1H, 3JHH = 8.8 Hz, 4JHH = 2.0 Hz, H-3), 6.76
(s, 1H, H-9), 1.68 (s, 15H, H-8) ppm.
13C{1H} NMR (125.77 MHz, DMSO-d6): δ = 173.0 (C-6), 151.5 (C-1), 137.3 (C-
5), 136.1 (C-4), 129.4 (C-2), 123.0 (C-3), 94.2 (C-7), 8.45 (C-8) ppm.

2 – Synthesis and characterization 31
Catalyst 2 - 1H- and 13C-NMR characterization
1H NMR (400.13 MHz, DMSO-d6): δ = 8.17 (d, 1H, 3JHH = 8.0 Hz, H-5),
7.45 (s, 2H, H-9), 7.10 (d, 1H, 4JHH = 4.0 Hz, H-2), 6.84 (dd, 1H, 3JHH = 8.0
Hz, 4JHH = 4.0 Hz, H-4), 1.66 (s, 15H, H-8) ppm.
13C{1H} NMR (125.77 MHz, DMSO-d6): δ = 173.0 (C-6), 158.1 (C-1), 151.0
(C-5), 148.5 (C-3), 113.9 (C-4), 112.6 (C-2), 93.8 (C-7), 8.47 (C-8) ppm.
Catalyst 3 - 1H- and 13C-NMR characterization
1H NMR (400.13 MHz, DMSO-d6): δ = 9.64 (s, 1H, H-5), 9.08 (d, 1H, 3JHH =
8.0 Hz, 4JHH = 4.0 Hz, H-3), 8.27 (d, 1H, 3JHH = 8.0 Hz, H-2), 1.68 (s, 15H, H-8)
ppm.
13C{1H} NMR (125.77 MHz, DMSO-d6): δ = 170.5 (C-6), 152.8 (C-4), 184.8
(C-1), 184.4 (C-5), 137.2 (C-3), 129.1 (C-2), 95.0 (C-7), 8.45 (C-8) ppm.
Catalyst 4 - 1H- and 13C-NMR characterization
1H NMR (400.13 MHz, DMSO-d6): δ = 8.75 (d, 1H, 3JHH = 8.0 Hz, H-5), 7.54
(d, 1H, 4JHH = 4.0 Hz, H-2), 7.48 (dd, 1H, 3JHH = 8.0 Hz, 4JHH = 4.0 Hz, H-4),
4.05 (s, 1H, H-9), 1.67 (s, 15H, H-8) ppm.
13C{1H} NMR (125.77 MHz, DMSO-d6): δ = 172.1 (C-6), 169.4 (C-3), 153.4
(C-5), 151.0 (C-1), 117.4 (C-4), 114.4 (C-2), 94.3 (C-7), 57.6 (C-9), 8.49 (C-
8) ppm.
Catalyst 5 - 1H- and 13C-NMR characterization
1H NMR (400.13 MHz, DMSO-d6): δ = 8.96 (d, 1H, 3JHH = 8.0 Hz, H-5), 8.64
(d, 1H, 3JHH = 8.0 Hz, H-5b), 8.12 (AB-system, 2H, H-2 and H-4), 7.92 (AB-
system, 2H, H-2b and H-4b), 1.67 (s, 15H, H-8), 1.64 (s, 15H, H-8b) ppm.
13C{1H} NMR (125.77 MHz, DMSO-d6): δ = 172.0 (C-6), 171.2 (C-6b), 153.8
(C-5), 152.6 (C-1b, 5b), 150.6 (C-1), 149.0 (C-3), 146.9 (C-3b), 131.5 (C-4),
129.5 (C-4b), 128.9 (C-2), 127.0 (C-2b), 94.7 (C-7), 90.8 (C-7b), 8.5 (C-8), 8.7 (C-8b) ppm.

3 – Experimental methods 32
3 – Experimental methods
After successful synthesis and characterization of the catalysts, catalytic tests were performed. It
is worth mentioning that catalyst 5 has only been successfully synthesized near the end of the
thesis’ work. Due to time restrictions, this catalyst has not been subjected to the same battery of
catalytic experiments as catalysts 1-4, but only to catalytic tests in unbuffered water, as will be
explained in Section 4.3 Results of unbuffered experiments.
In this chapter, the methods used for testing the catalytic performance are elaborated. The
reaction conditions (3.1), including the sacrificial oxidant and the buffer, and the different testing
techniques (3.2), manometry and oximetry, are explained. Furthermore, the method of
determining the pKa is described (3.3). Treatment of the data is explained and exemplified with
graphs where necessary. The water oxidation reaction with the synthesized catalysts is shown in
Scheme 3.1.
Scheme 3.1. The water oxidation reaction with catalysts 1-5.
3.1 Reaction conditions
For all catalytic tests a similar procedure was followed.3,32,39,53,54 A solution of catalyst was made
to inject into the reaction chamber at the start of the measurement. The sacrificial oxidant, NaIO4,
was weighted directly into the reaction chamber and buffer was added. A flea (stir bar) was added
3 – Experimental methods 33
and the flask was sealed off air-tight with a septum. After waiting, while stirring, for the baseline
of the instrument to be stabilized, the measurement was started and the catalyst solution was
injected with a precision syringe. The choice for sacrificial oxidant and buffer are explained below.
3.1.1 Sacrificial oxidant
In the process towards the sustainable production of solar fuels, different components are
developed separately. Therefore, the WOC is optimized in a controlled and tuneable environment
prior to application in a fuel cell device that runs on sunlight and water only. To this end, the
water oxidation performance of the developed catalyst is measured with a sacrificial oxidant (SO)
as an electron acceptor. In previous work on Cp*Ir WOCs, both cerium(IV) ammonium nitrate
(CAN) and sodium periodate (NaIO4) have been used as SOs.3,32,41,55–57
3.1.1.1 CAN
Cerium(IV) is often used as a sacrificial oxidant in the form of CAN ([Ce(NO3)6](NH4)2). Being a one-
electron oxidant, CAN may mimic the multiple, sequential, single-electron transfer steps
occurring in natural photosynthesis more accurately than (usually) two-electron oxidants like
NaIO4.57 Other advantages are high solubility in water and very low reactivity with water in the
absence of a catalyst.3 Furthermore, its molecular structure does not contain an activated oxygen
unit that could interfere with water oxidation and it has a strong absorption band that facilitates
monitoring its consumption by UV-Vis spectroscopy.58
A disadvantages of CAN is the harsh condition (strongly acidic pH) needed to stabilize the
oxidant.57 Another reason to refrain from using CAN are the findings of Fukuzumi and co-workers.
They examined the effect of changing R groups in [Cp*Ir(4,4’-R2-2,2’-bpy)(H2O)]X2 pre-catalysts
(bpy = 2,2’-bipyridine), with CAN as SO. They showed that (with R = OH) the active species were
likely Ir(OH)3 nanoparticles, formed by complete degradation of the Cp* and bpy ligands.43
Oxidative degradation of different Cp*Ir catalysts has also been reported by other groups,43,59,60
starting from oxidation of the quaternary carbon atoms in the Cp* ring.61 However, uncertainty
remains about the homogeneous or heterogeneous nature of the species resulting from this
degradation process.
3 – Experimental methods 34
3.1.1.2 Sodium periodate
As an alternative, NaIO4 is a common SO. It has a slightly lower oxidant potential (overpotential
approximately 420 mV, about 20 % lower than Ce4+), which may prevent degradation of the
catalyst.55 It is also highly stable at a pH range of 2 to 7.5, facilitating research on the pH
dependency of catalyst activity.32 Meyer et al. suggested that increasing the pH can have a
beneficial effect on the catalytic performance by facilitating a concerted atom–proton transfer
(APT) step in the critical step of the O-O bond formation.36
But the most prominent reason to use NaIO4 in the study of pic-derived catalysts is the increased
TOF and extended activity of 7 that Menendez Rodriguez et al. observed when using NaIO4 instead
of CAN as SO. The catalytic performance of pic-derivatives containing OH in 3-, 4-, 5- and 6-
position was determined with both CAN and NaIO4. With CAN, a similar TOF was observed for all
catalysts (23-28 min-1). With NaIO4, a bigger range of TOF could be observed, as the pH
dependency could be investigated at pH 5-7.32
Blakemore et al. also reported decreased oxygen evolution over time for Cp*Ir(bpy)(OSO3), when
NaIO4 instead of CAN was used as SO.49
Parent et al. confirmed the oxidative degradation of Cp*Ir(bpy)(OSO3) by CAN as opposed to
NaIO4 by GC-MS. Catalytic tests with CAN at pH ca. 1 yielded not only O2 but also CO2 in the
headspace of the reaction tube. With NaIO4 at pH ca. 5 only O2 was observed.55
Water oxidation with NaIO4 as SO occurs according to the reaction equation depicted in eq 3.1.
However, due to the relatively labile oxygen atoms of NaIO4, it is not trivial to determine whether
the source of O2 is the catalysed reaction of an IrV=O species with water or the direct oxidation of
water by NaIO4.55 Even isotope-labelling experiments remain inconclusive since the oxygen atoms
exchange rapidly with bulk water.3,62
(3.1)
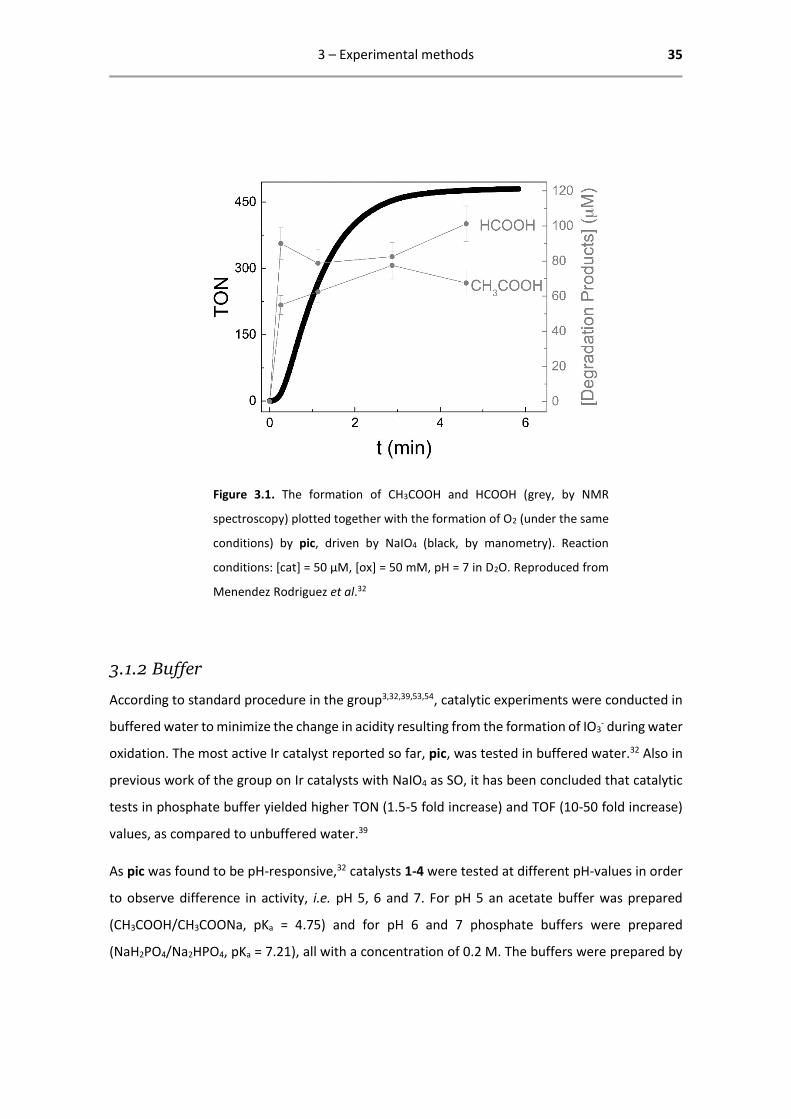
Also with NaIO4, strong oxidative degradation of the Cp* ligand of pic has been observed. The
water oxidation reaction was followed by 1H-NMR to investigate the nature of the active species,
using acetic and formic acid as molecular probes for Cp* degradation. These degradation products
are mostly formed already before oxygen evolution starts, indicating that the active species bears
a strongly degraded Cp* moiety (see Figure 3.1). However, the ancillary ligand is presumed to be
still attached to the metal centre.32 Hetterscheid et al. recently confirmed that Cp* does not
degrade completely.63
3 – Experimental methods 35
Figure 3.1. The formation of CH3COOH and HCOOH (grey, by NMR
spectroscopy) plotted together with the formation of O2 (under the same
conditions) by pic, driven by NaIO4 (black, by manometry). Reaction
conditions: [cat] = 50 µM, [ox] = 50 mM, pH = 7 in D2O. Reproduced from
Menendez Rodriguez et al.32
3.1.2 Buffer
According to standard procedure in the group3,32,39,53,54, catalytic experiments were conducted in
buffered water to minimize the change in acidity resulting from the formation of IO3- during water
oxidation. The most active Ir catalyst reported so far, pic, was tested in buffered water.32 Also in
previous work of the group on Ir catalysts with NaIO4 as SO, it has been concluded that catalytic
tests in phosphate buffer yielded higher TON (1.5-5 fold increase) and TOF (10-50 fold increase)
values, as compared to unbuffered water.39
As pic was found to be pH-responsive,32 catalysts 1-4 were tested at different pH-values in order
to observe difference in activity, i.e. pH 5, 6 and 7. For pH 5 an acetate buffer was prepared
(CH3COOH/CH3COONa, pKa = 4.75) and for pH 6 and 7 phosphate buffers were prepared
(NaH2PO4/Na2HPO4, pKa = 7.21), all with a concentration of 0.2 M. The buffers were prepared by
3 – Experimental methods 36
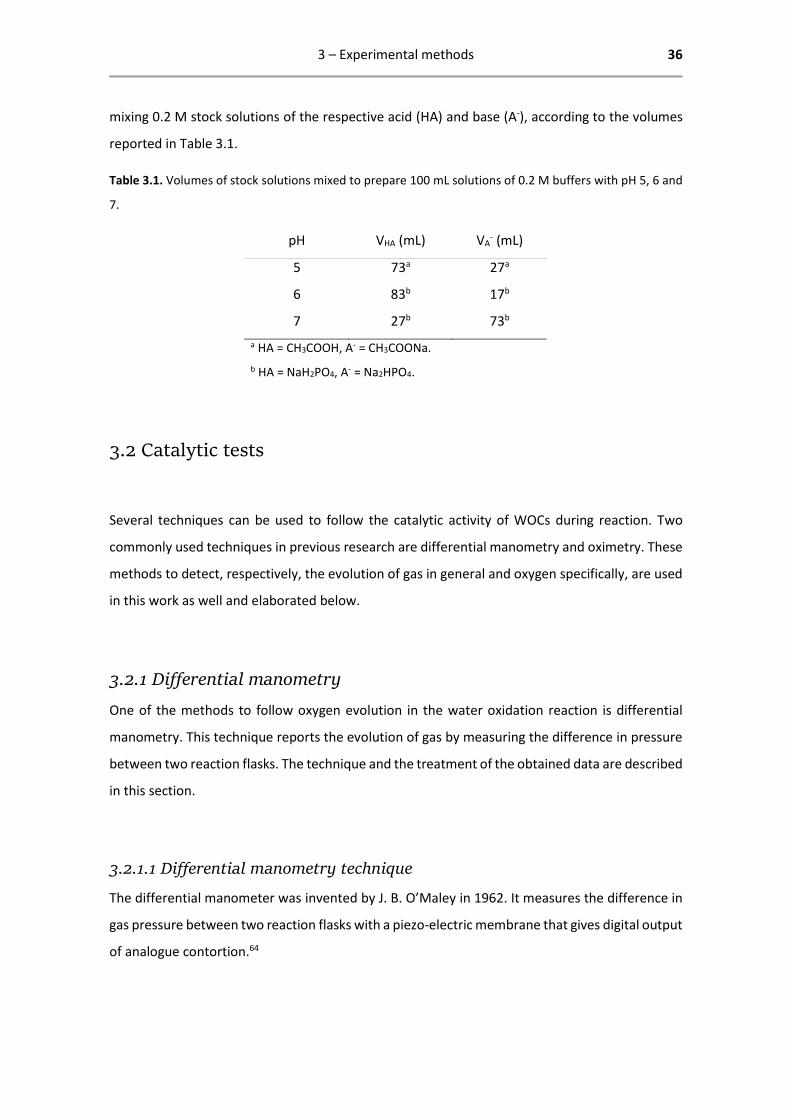
mixing 0.2 M stock solutions of the respective acid (HA) and base (A-), according to the volumes
reported in Table 3.1.
Table 3.1. Volumes of stock solutions mixed to prepare 100 mL solutions of 0.2 M buffers with pH 5, 6 and
7.
pH VHA (mL) VA- (mL)
5 73a 27a
6 83b 17b
7 27b 73b
a HA = CH3COOH, A- = CH3COONa.
b HA = NaH2PO4, A- = Na2HPO4.
3.2 Catalytic tests
Several techniques can be used to follow the catalytic activity of WOCs during reaction. Two
commonly used techniques in previous research are differential manometry and oximetry. These
methods to detect, respectively, the evolution of gas in general and oxygen specifically, are used
in this work as well and elaborated below.
3.2.1 Differential manometry
One of the methods to follow oxygen evolution in the water oxidation reaction is differential
manometry. This technique reports the evolution of gas by measuring the difference in pressure
between two reaction flasks. The technique and the treatment of the obtained data are described
in this section.
3.2.1.1 Differential manometry technique
The differential manometer was invented by J. B. O’Maley in 1962. It measures the difference in
gas pressure between two reaction flasks with a piezo-electric membrane that gives digital output
of analogue contortion.64
3 – Experimental methods 37
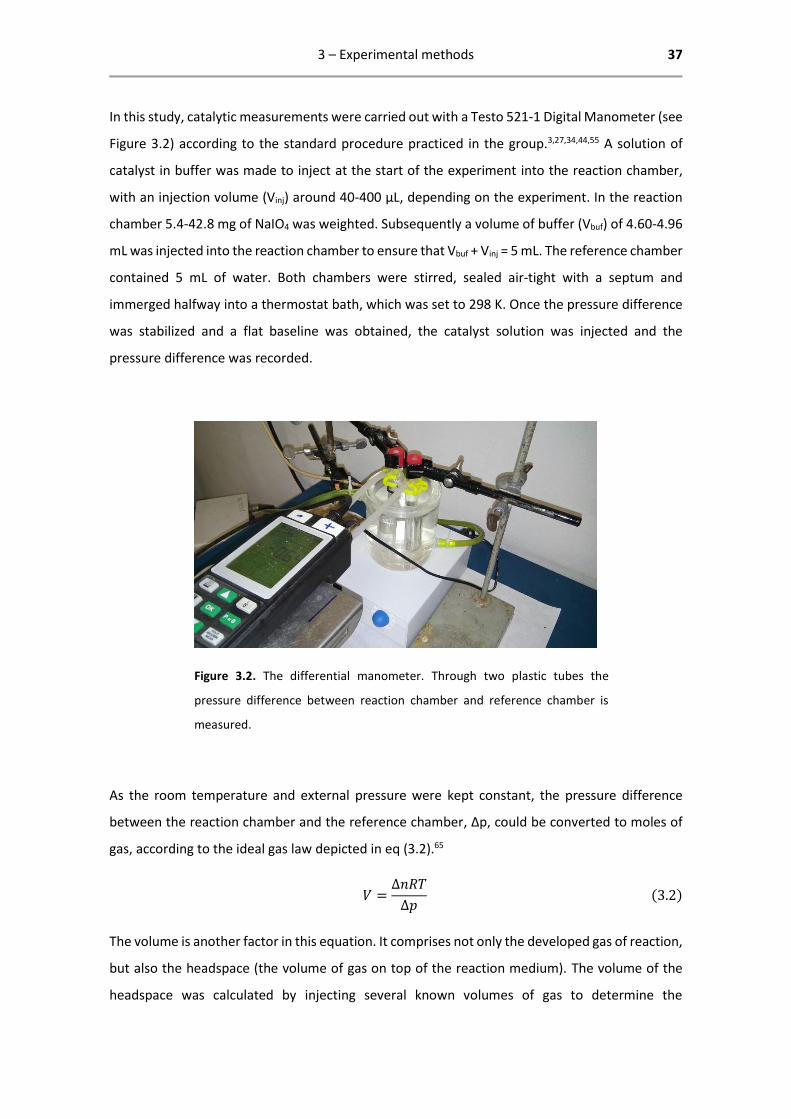
In this study, catalytic measurements were carried out with a Testo 521-1 Digital Manometer (see
Figure 3.2) according to the standard procedure practiced in the group.3,27,34,44,55 A solution of
catalyst in buffer was made to inject at the start of the experiment into the reaction chamber,
with an injection volume (Vinj) around 40-400 µL, depending on the experiment. In the reaction
chamber 5.4-42.8 mg of NaIO4 was weighted. Subsequently a volume of buffer (Vbuf) of 4.60-4.96
mL was injected into the reaction chamber to ensure that Vbuf + Vinj = 5 mL. The reference chamber
contained 5 mL of water. Both chambers were stirred, sealed air-tight with a septum and
immerged halfway into a thermostat bath, which was set to 298 K. Once the pressure difference
was stabilized and a flat baseline was obtained, the catalyst solution was injected and the
pressure difference was recorded.
Figure 3.2. The differential manometer. Through two plastic tubes the
pressure difference between reaction chamber and reference chamber is
measured.
As the room temperature and external pressure were kept constant, the pressure difference
between the reaction chamber and the reference chamber, Δp, could be converted to moles of
gas, according to the ideal gas law depicted in eq (3.2).65
𝑉 =∆𝑛𝑅𝑇
∆𝑝(3.2)
The volume is another factor in this equation. It comprises not only the developed gas of reaction,
but also the headspace (the volume of gas on top of the reaction medium). The volume of the
headspace was calculated by injecting several known volumes of gas to determine the
3 – Experimental methods 38
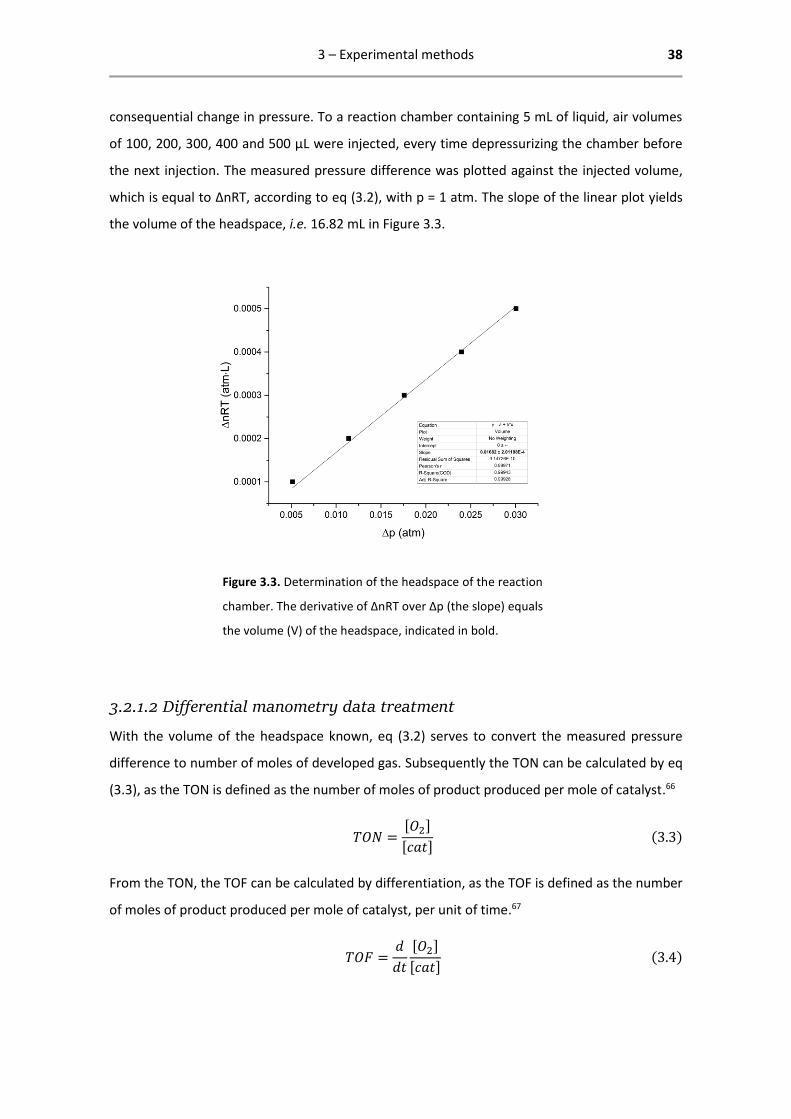
consequential change in pressure. To a reaction chamber containing 5 mL of liquid, air volumes
of 100, 200, 300, 400 and 500 µL were injected, every time depressurizing the chamber before
the next injection. The measured pressure difference was plotted against the injected volume,
which is equal to ΔnRT, according to eq (3.2), with p = 1 atm. The slope of the linear plot yields
the volume of the headspace, i.e. 16.82 mL in Figure 3.3.
Figure 3.3. Determination of the headspace of the reaction
chamber. The derivative of ∆nRT over ∆p (the slope) equals
the volume (V) of the headspace, indicated in bold.
3.2.1.2 Differential manometry data treatment
With the volume of the headspace known, eq (3.2) serves to convert the measured pressure
difference to number of moles of developed gas. Subsequently the TON can be calculated by eq
(3.3), as the TON is defined as the number of moles of product produced per mole of catalyst.66
𝑇𝑂𝑁 =[𝑂2]
[𝑐𝑎𝑡] (3.3)
From the TON, the TOF can be calculated by differentiation, as the TOF is defined as the number
of moles of product produced per mole of catalyst, per unit of time.67
𝑇𝑂𝐹 =𝑑
𝑑𝑡
[𝑂2]
[𝑐𝑎𝑡] (3.4)
3 – Experimental methods 39
However, the raw plot of TON data yields an ambiguous derivative that does not accurately
describe the TOF. Therefore, the TON graph was fitted with a nonlinear function developed by
Peters and Baskin to describe the sigmoidal and bi-linear curves exhibited by growth of plant
roots.68 Differentiation of the obtained curve yields a smooth, continuous graph that describes
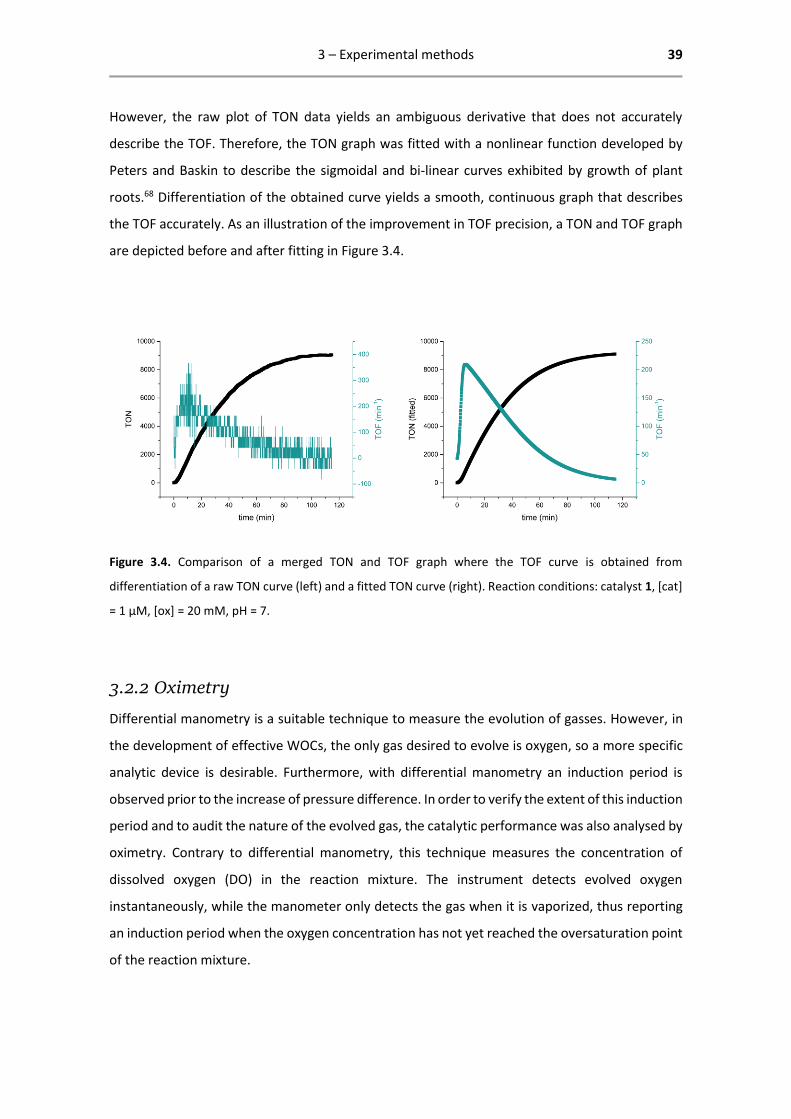
the TOF accurately. As an illustration of the improvement in TOF precision, a TON and TOF graph
are depicted before and after fitting in Figure 3.4.
Figure 3.4. Comparison of a merged TON and TOF graph where the TOF curve is obtained from
differentiation of a raw TON curve (left) and a fitted TON curve (right). Reaction conditions: catalyst 1, [cat]
= 1 µM, [ox] = 20 mM, pH = 7.
3.2.2 Oximetry
Differential manometry is a suitable technique to measure the evolution of gasses. However, in
the development of effective WOCs, the only gas desired to evolve is oxygen, so a more specific
analytic device is desirable. Furthermore, with differential manometry an induction period is
observed prior to the increase of pressure difference. In order to verify the extent of this induction
period and to audit the nature of the evolved gas, the catalytic performance was also analysed by
oximetry. Contrary to differential manometry, this technique measures the concentration of
dissolved oxygen (DO) in the reaction mixture. The instrument detects evolved oxygen
instantaneously, while the manometer only detects the gas when it is vaporized, thus reporting
an induction period when the oxygen concentration has not yet reached the oversaturation point
of the reaction mixture.
3 – Experimental methods 40
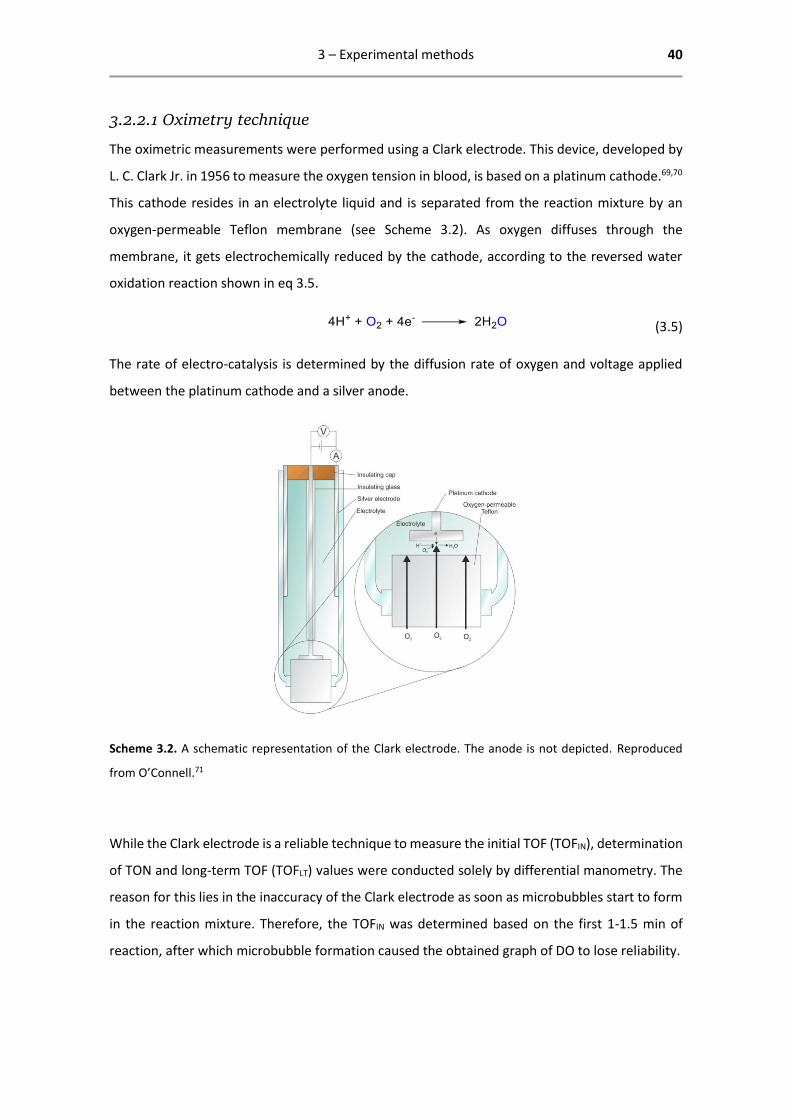
3.2.2.1 Oximetry technique
The oximetric measurements were performed using a Clark electrode. This device, developed by
L. C. Clark Jr. in 1956 to measure the oxygen tension in blood, is based on a platinum cathode.69,70
This cathode resides in an electrolyte liquid and is separated from the reaction mixture by an
oxygen-permeable Teflon membrane (see Scheme 3.2). As oxygen diffuses through the
membrane, it gets electrochemically reduced by the cathode, according to the reversed water
oxidation reaction shown in eq 3.5.
(3.5)
The rate of electro-catalysis is determined by the diffusion rate of oxygen and voltage applied
between the platinum cathode and a silver anode.
Scheme 3.2. A schematic representation of the Clark electrode. The anode is not depicted. Reproduced
from O’Connell.71
While the Clark electrode is a reliable technique to measure the initial TOF (TOFIN), determination
of TON and long-term TOF (TOFLT) values were conducted solely by differential manometry. The
reason for this lies in the inaccuracy of the Clark electrode as soon as microbubbles start to form
in the reaction mixture. Therefore, the TOFIN was determined based on the first 1-1.5 min of
reaction, after which microbubble formation caused the obtained graph of DO to lose reliability.
3 – Experimental methods 41
The general procedure of oximetry measurements was similar to the differential manometry
experiments. A solution of catalyst in buffer was made to inject at the start of the experiment
into the reaction chamber, with an injection volume (Vinj) of around 1.0-1.8 mL in order to obtain
a catalyst concentration of 5 µM in the reaction chamber. 171 mg of NaIO4 was weighted (to
obtain [ox] = 20 mM in the reaction chamber) and buffer was added in such a volume (Vbuf) that
Vbuf + Vinj = 40 mL. The reactor was stirred, sealed air-tight with a septum and immerged halfway
into the thermostat bath, which was set to 298 K. Once a flat baseline was obtained, the catalyst
solution was injected and the DO concentration was recorded with a Hanna Instruments HI 4421
Clark Electrode. All experiments were conducted at least in doppio.
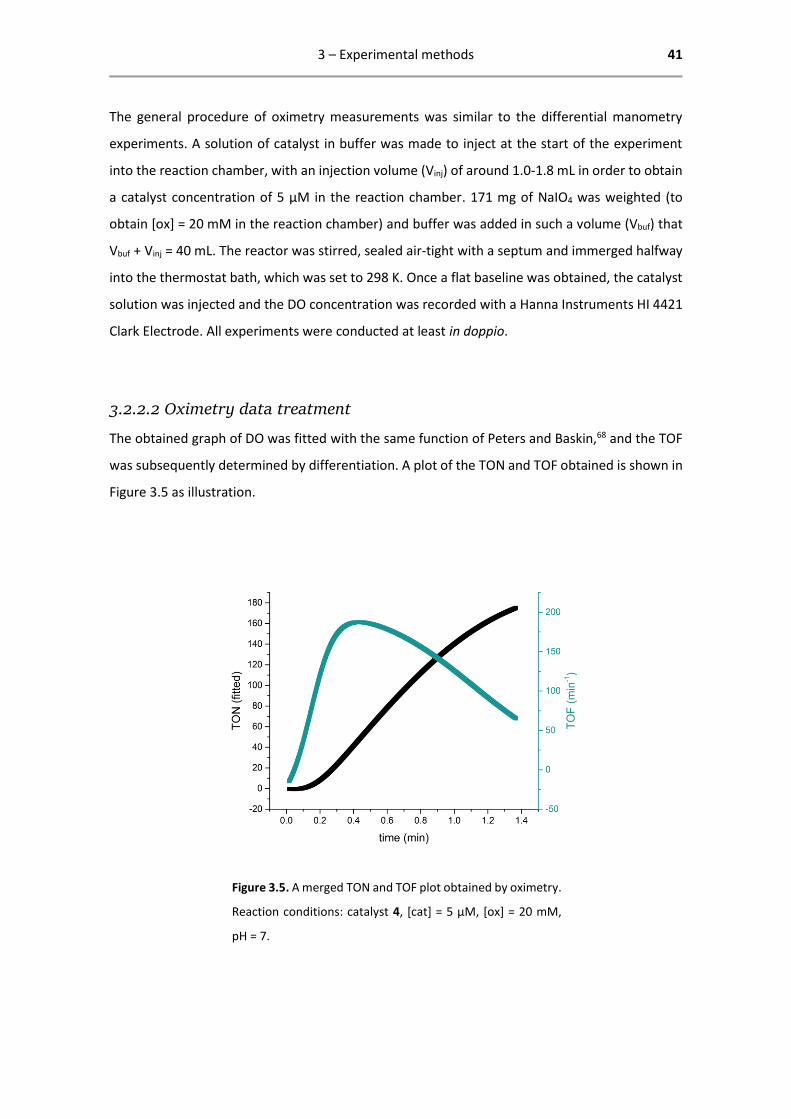
3.2.2.2 Oximetry data treatment
The obtained graph of DO was fitted with the same function of Peters and Baskin,68 and the TOF
was subsequently determined by differentiation. A plot of the TON and TOF obtained is shown in
Figure 3.5 as illustration.
Figure 3.5. A merged TON and TOF plot obtained by oximetry.
Reaction conditions: catalyst 4, [cat] = 5 µM, [ox] = 20 mM,
pH = 7.
3 – Experimental methods 42
3.2.3 Kinetic order
To optimize the structure and reactivity of WOCs and the reaction conditions for the water
oxidation reaction, it is crucial to gain insight into the mechanism of water oxidation. Therefore,
much research attention is aimed at elucidating the kinetics of the water oxidation
reaction.21,30,32,41,55,57
As described in Section 3.2.1 Differential manometry, the TON and TOF are defined as follows.
𝑇𝑂𝑁 =[𝑂2]
[𝑐𝑎𝑡] (3.3)
𝑇𝑂𝐹 =𝑑
𝑑𝑡
[𝑂2]
[𝑐𝑎𝑡] (3.4)
These quantities are intrinsic of the catalyst and are used to evaluate the catalytic performance.
A more general quantity, that describes the kinetics of reaction, is the reaction rate. As shown in
eq 3.6, it can be converted to depend on the TOF using eq 3.4.
𝑟𝑎𝑡𝑒 =𝑑
𝑑𝑡[𝑂2] = 𝑇𝑂𝐹 ∙ [𝑐𝑎𝑡] (3.6)
The rate can also be described as exponentially dependent on the concentration of both catalyst
and oxidant, adjusted by the observed rate constant kobs. This rate constant must be empirically
determined.72
𝑟𝑎𝑡𝑒 = 𝑘𝑜𝑏𝑠 ∙ [𝑐𝑎𝑡]𝑚 ∙ [𝑜𝑥]𝑛 (3.7)
To elucidate the role of the catalyst and the oxidant in the water oxidation reaction, the order in
catalyst (m in eq 3.7) and oxidant (n in eq 3.7) must be resolved. This is done by converting eq 3.7
into the logarithmic eq 3.8 and subsequently plotting log(rate) against log(cat) or log(ox), to
obtain m or n respectively.
log(𝑟𝑎𝑡𝑒) = log(𝑘𝑜𝑏𝑠) + 𝑚 ∙ log[𝑐𝑎𝑡] + 𝑛 ∙ log [𝑜𝑥] (3.8)
To obtain, for example, the order in catalyst, m, log(rate) is plotted against log[cat]. The slope will
be m and the other factors, log(kobs) + n∙log[ox], will make up the intercept of the graph. The rate
is obtained from eq 3.6 and the TOF-values are obtained from the experiments in which [ox] is
held constant (i.e. with reaction conditions [ox] = 20 mM and [cat] = 1, 2.5, 5 and 10 µM).
3 – Experimental methods 43
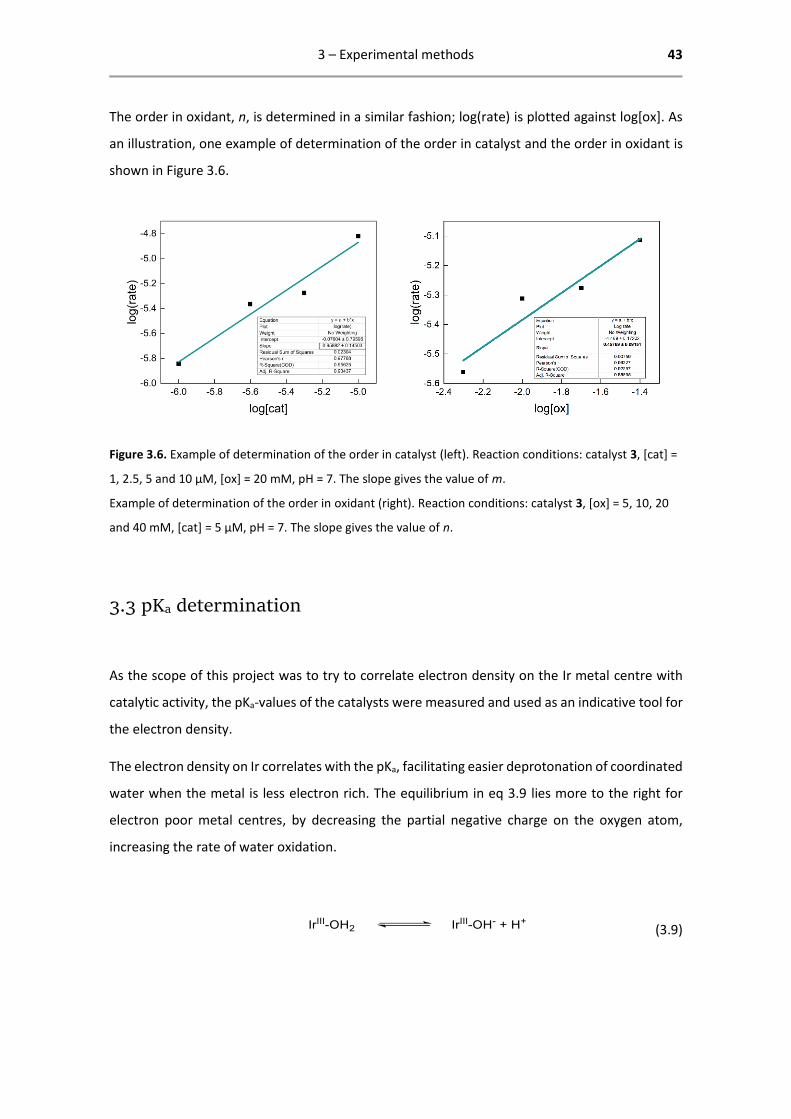
The order in oxidant, n, is determined in a similar fashion; log(rate) is plotted against log[ox]. As
an illustration, one example of determination of the order in catalyst and the order in oxidant is
shown in Figure 3.6.
Figure 3.6. Example of determination of the order in catalyst (left). Reaction conditions: catalyst 3, [cat] =
1, 2.5, 5 and 10 µM, [ox] = 20 mM, pH = 7. The slope gives the value of m.
Example of determination of the order in oxidant (right). Reaction conditions: catalyst 3, [ox] = 5, 10, 20
and 40 mM, [cat] = 5 µM, pH = 7. The slope gives the value of n.
3.3 pKa determination
As the scope of this project was to try to correlate electron density on the Ir metal centre with
catalytic activity, the pKa-values of the catalysts were measured and used as an indicative tool for
the electron density.
The electron density on Ir correlates with the pKa, facilitating easier deprotonation of coordinated
water when the metal is less electron rich. The equilibrium in eq 3.9 lies more to the right for
electron poor metal centres, by decreasing the partial negative charge on the oxygen atom,
increasing the rate of water oxidation.
(3.9)

3 – Experimental methods 44
3.3.1 pH meter technique
The pKa was measured with a Hanna Instruments HI 2221 pH/ORP Meter, which was calibrated
with standard solutions of pH 4.01, 7.01 and 10.01.
The procedure of pKa determination for all catalysts was as follows. 5 mL of catalyst solution was
made with [cat] = 2 mM. A KOH titrant was made with [OH-] = 14 mM. Under stirring, volumes of
25 µL of titrant were added to the catalyst solution in a plastic test tube while the pH was
recorded. The measured pH range of solution was in all cases around pH 3-11.
3.3.2 pKa determination data treatment
To determine the pKa from the obtained data set, the [OH-] in the reaction tube ([OH-]tube) was
plotted against the measured pH. [OH-]tube (in M) was calculated via
[𝑂𝐻−]𝑡𝑢𝑏𝑒 =𝑉𝑡𝑖𝑡 ∙ [𝑂𝐻−]𝑡𝑖𝑡
𝑉𝑡𝑢𝑏𝑒 + 𝑉𝑡𝑖𝑡 (3.10)
where Vtit is the volume of KOH titrant added (in L), [OH-]tit is the concentration of the titrant (=
0.014 M) and Vtube is the volume of the solution in the reaction tube (= 5∙10-3 L).
Figure 3.7. A plot of the [OH-]tube against the pH for catalyst 3.
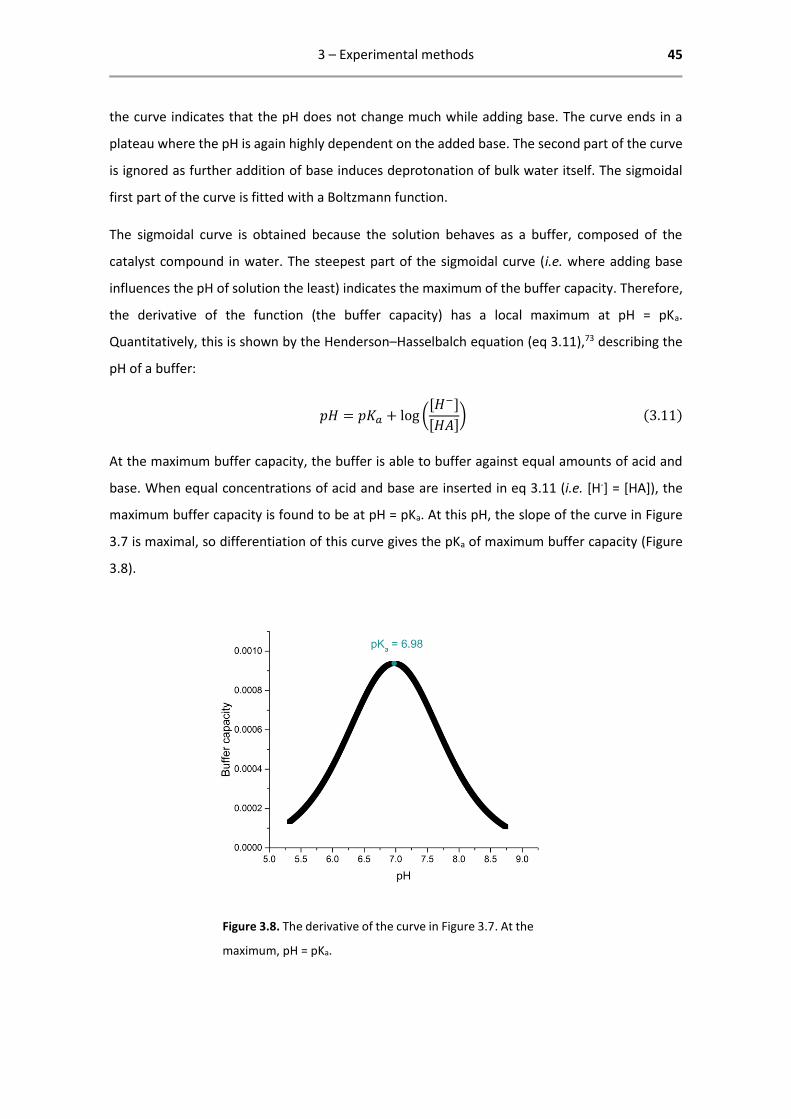
The obtained variation in [OH-]tube was plotted against the pH (Figure 3.7). As can be seen, the pH
of solution changes substantially after the first addition of base. Then, an increase of the slope of
3 – Experimental methods 45
the curve indicates that the pH does not change much while adding base. The curve ends in a
plateau where the pH is again highly dependent on the added base. The second part of the curve
is ignored as further addition of base induces deprotonation of bulk water itself. The sigmoidal
first part of the curve is fitted with a Boltzmann function.
The sigmoidal curve is obtained because the solution behaves as a buffer, composed of the
catalyst compound in water. The steepest part of the sigmoidal curve (i.e. where adding base
influences the pH of solution the least) indicates the maximum of the buffer capacity. Therefore,
the derivative of the function (the buffer capacity) has a local maximum at pH = pKa.
Quantitatively, this is shown by the Henderson–Hasselbalch equation (eq 3.11),73 describing the
pH of a buffer:
𝑝𝐻 = 𝑝𝐾𝑎 + log ([𝐻−]
[𝐻𝐴]) (3.11)
At the maximum buffer capacity, the buffer is able to buffer against equal amounts of acid and
base. When equal concentrations of acid and base are inserted in eq 3.11 (i.e. [H-] = [HA]), the
maximum buffer capacity is found to be at pH = pKa. At this pH, the slope of the curve in Figure
3.7 is maximal, so differentiation of this curve gives the pKa of maximum buffer capacity (Figure
3.8).
Figure 3.8. The derivative of the curve in Figure 3.7. At the
maximum, pH = pKa.

4 – Results and discussion 46
4 – Results and discussion
In this chapter the results of the pKa determination (4.1) and the catalytic experiments with buffer
(4.2) and without buffer (4.3) are reported. Furthermore, the kinetic order of the water oxidation
reaction with catalysts 1-4 is described (4.4) and the results are discussed.
4.1 Results of pKa determination
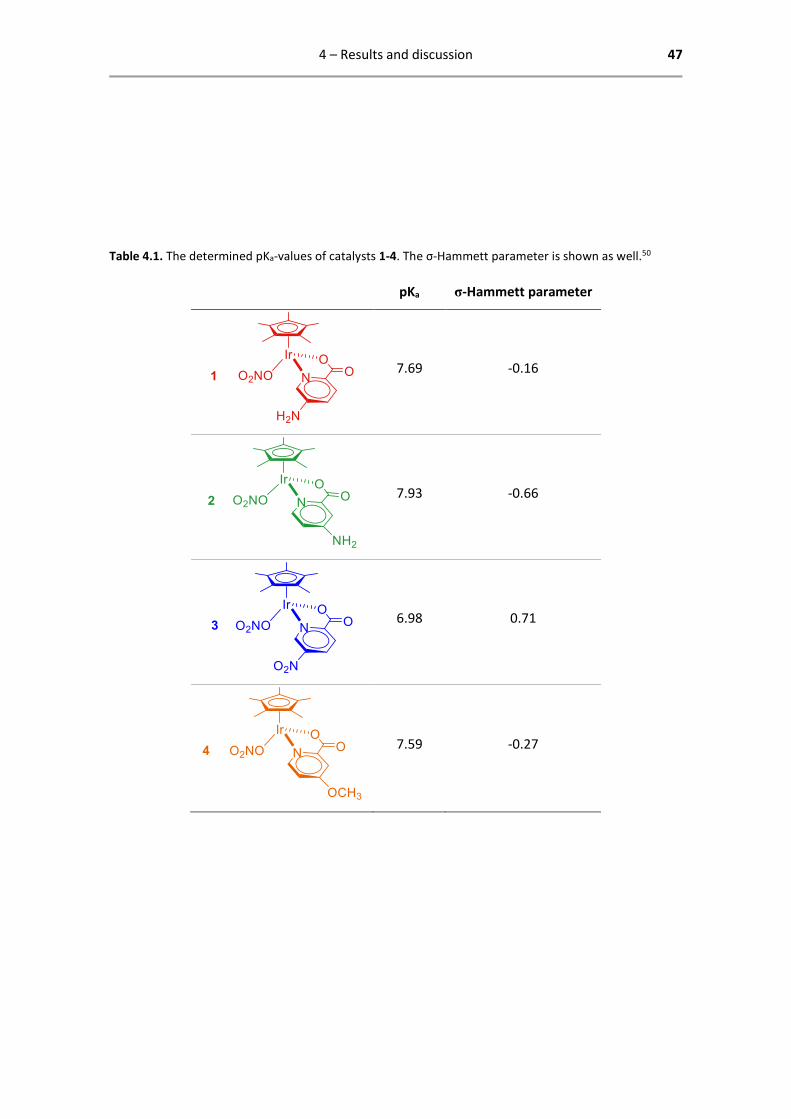
To get insight in the electron density on the Ir metal centre, the pKa-values of catalysts 1-4 were
determined. The results are reported in Table 4.1.
As explained in Section 3.3 pKa determination, the pKa of a complex is an indicative tool for the
electron density on the metal centre. The σ-Hammett parameter has the same purpose and is
defined by σ-Hammett from the ionization constants of benzoic acids by
σ𝑋 = log 𝐾𝑋 − log 𝐾𝐻 (4.1)
where KH is the ionization constant for benzoic acid in water at 25 °C and KX is the corresponding
constant for meta- or para-substituted benzoic acid. The electronic effects of substituents are
composed of an inductive component and a resonance component, as postulated by the English
School of Chemists. The empirically obtained σ-Hammett parameter is a quantization for these
electronic effects.50 Frequently, it correctly predicts equilibrium and rate constants for many
groups of reactions in solution.74,75 As the σ-Hammett parameter of a compound is derived from
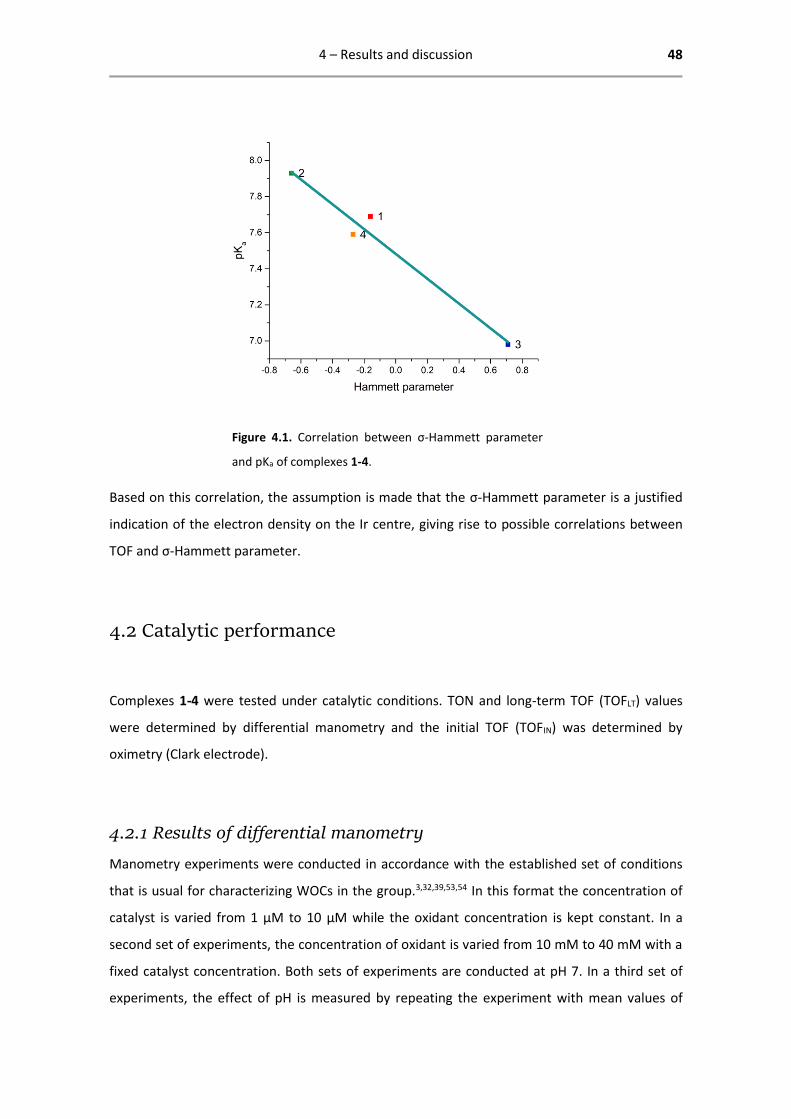
an ionization constant, it is expected to correlate with its pKa. Indeed, a linear correlation is found,
as shown in Figure 4.1.
4 – Results and discussion 47
Table 4.1. The determined pKa-values of catalysts 1-4. The σ-Hammett parameter is shown as well.50
pKa σ-Hammett parameter
7.69 -0.16
7.93 -0.66
6.98 0.71
7.59 -0.27
4 – Results and discussion 48
Figure 4.1. Correlation between σ-Hammett parameter
and pKa of complexes 1-4.
Based on this correlation, the assumption is made that the σ-Hammett parameter is a justified
indication of the electron density on the Ir centre, giving rise to possible correlations between
TOF and σ-Hammett parameter.
4.2 Catalytic performance
Complexes 1-4 were tested under catalytic conditions. TON and long-term TOF (TOFLT) values
were determined by differential manometry and the initial TOF (TOFIN) was determined by
oximetry (Clark electrode).
4.2.1 Results of differential manometry
Manometry experiments were conducted in accordance with the established set of conditions
that is usual for characterizing WOCs in the group.3,32,39,53,54 In this format the concentration of
catalyst is varied from 1 µM to 10 µM while the oxidant concentration is kept constant. In a
second set of experiments, the concentration of oxidant is varied from 10 mM to 40 mM with a
fixed catalyst concentration. Both sets of experiments are conducted at pH 7. In a third set of
experiments, the effect of pH is measured by repeating the experiment with mean values of
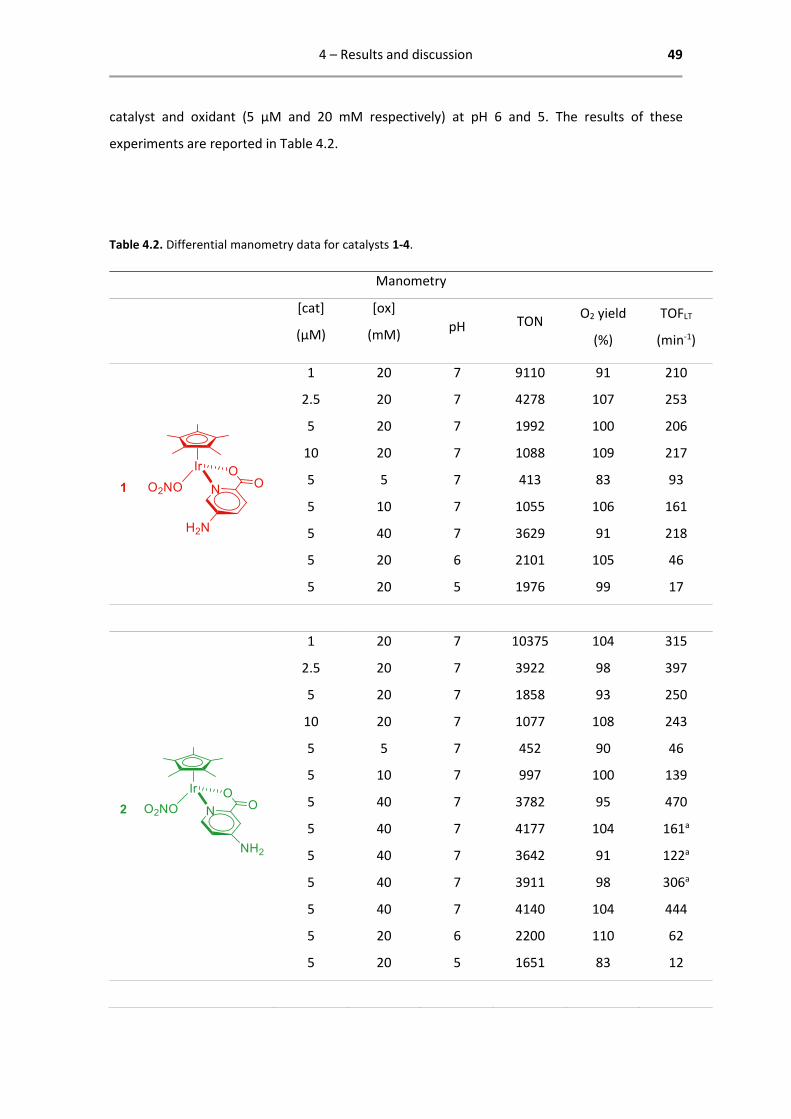
4 – Results and discussion 49
catalyst and oxidant (5 µM and 20 mM respectively) at pH 6 and 5. The results of these
experiments are reported in Table 4.2.
Table 4.2. Differential manometry data for catalysts 1-4.
Manometry
[cat]
(µM)
[ox]
(mM) pH TON
O2 yield
(%)
TOFLT
(min-1)
1 20 7 9110 91 210
2.5 20 7 4278 107 253
5 20 7 1992 100 206
10 20 7 1088 109 217
5 5 7 413 83 93
5 10 7 1055 106 161
5 40 7 3629 91 218
5 20 6 2101 105 46
5 20 5 1976 99 17
1 20 7 10375 104 315
2.5 20 7 3922 98 397
5 20 7 1858 93 250
10 20 7 1077 108 243
5 5 7 452 90 46
5 10 7 997 100 139
5 40 7 3782 95 470
5 40 7 4177 104 161a
5 40 7 3642 91 122a
5 40 7 3911 98 306a
5 40 7 4140 104 444
5 20 6 2200 110 62
5 20 5 1651 83 12
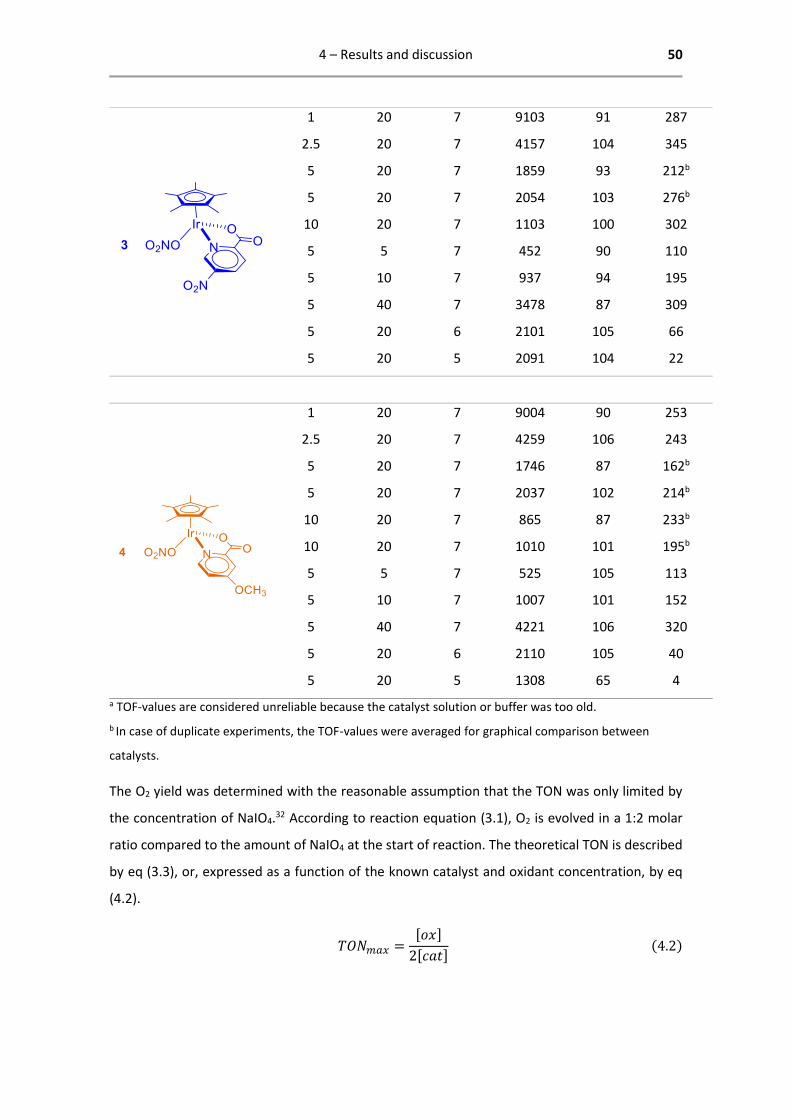
4 – Results and discussion 50
1 20 7 9103 91 287
2.5 20 7 4157 104 345
5 20 7 1859 93 212b
5 20 7 2054 103 276b
10 20 7 1103 100 302
5 5 7 452 90 110
5 10 7 937 94 195
5 40 7 3478 87 309
5 20 6 2101 105 66
5 20 5 2091 104 22
1 20 7 9004 90 253
2.5 20 7 4259 106 243
5 20 7 1746 87 162b
5 20 7 2037 102 214b
10 20 7 865 87 233b
10 20 7 1010 101 195b
5 5 7 525 105 113
5 10 7 1007 101 152
5 40 7 4221 106 320
5 20 6 2110 105 40
5 20 5 1308 65 4
a TOF-values are considered unreliable because the catalyst solution or buffer was too old.
b In case of duplicate experiments, the TOF-values were averaged for graphical comparison between
catalysts.
The O2 yield was determined with the reasonable assumption that the TON was only limited by
the concentration of NaIO4.32 According to reaction equation (3.1), O2 is evolved in a 1:2 molar
ratio compared to the amount of NaIO4 at the start of reaction. The theoretical TON is described
by eq (3.3), or, expressed as a function of the known catalyst and oxidant concentration, by eq
(4.2).
𝑇𝑂𝑁𝑚𝑎𝑥 =[𝑜𝑥]
2[𝑐𝑎𝑡] (4.2)
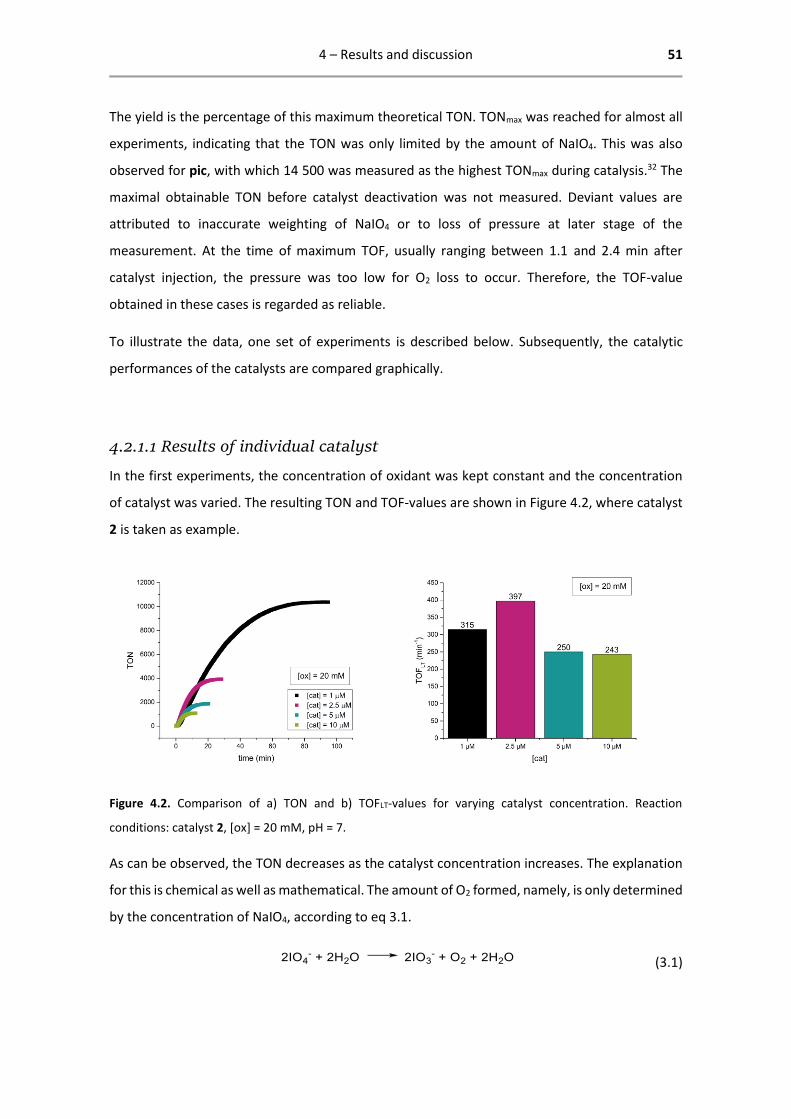
4 – Results and discussion 51
The yield is the percentage of this maximum theoretical TON. TONmax was reached for almost all
experiments, indicating that the TON was only limited by the amount of NaIO4. This was also
observed for pic, with which 14 500 was measured as the highest TONmax during catalysis.32 The
maximal obtainable TON before catalyst deactivation was not measured. Deviant values are
attributed to inaccurate weighting of NaIO4 or to loss of pressure at later stage of the
measurement. At the time of maximum TOF, usually ranging between 1.1 and 2.4 min after
catalyst injection, the pressure was too low for O2 loss to occur. Therefore, the TOF-value
obtained in these cases is regarded as reliable.
To illustrate the data, one set of experiments is described below. Subsequently, the catalytic
performances of the catalysts are compared graphically.
4.2.1.1 Results of individual catalyst
In the first experiments, the concentration of oxidant was kept constant and the concentration
of catalyst was varied. The resulting TON and TOF-values are shown in Figure 4.2, where catalyst
2 is taken as example.
Figure 4.2. Comparison of a) TON and b) TOFLT-values for varying catalyst concentration. Reaction
conditions: catalyst 2, [ox] = 20 mM, pH = 7.
As can be observed, the TON decreases as the catalyst concentration increases. The explanation
for this is chemical as well as mathematical. The amount of O2 formed, namely, is only determined
by the concentration of NaIO4, according to eq 3.1.
(3.1)
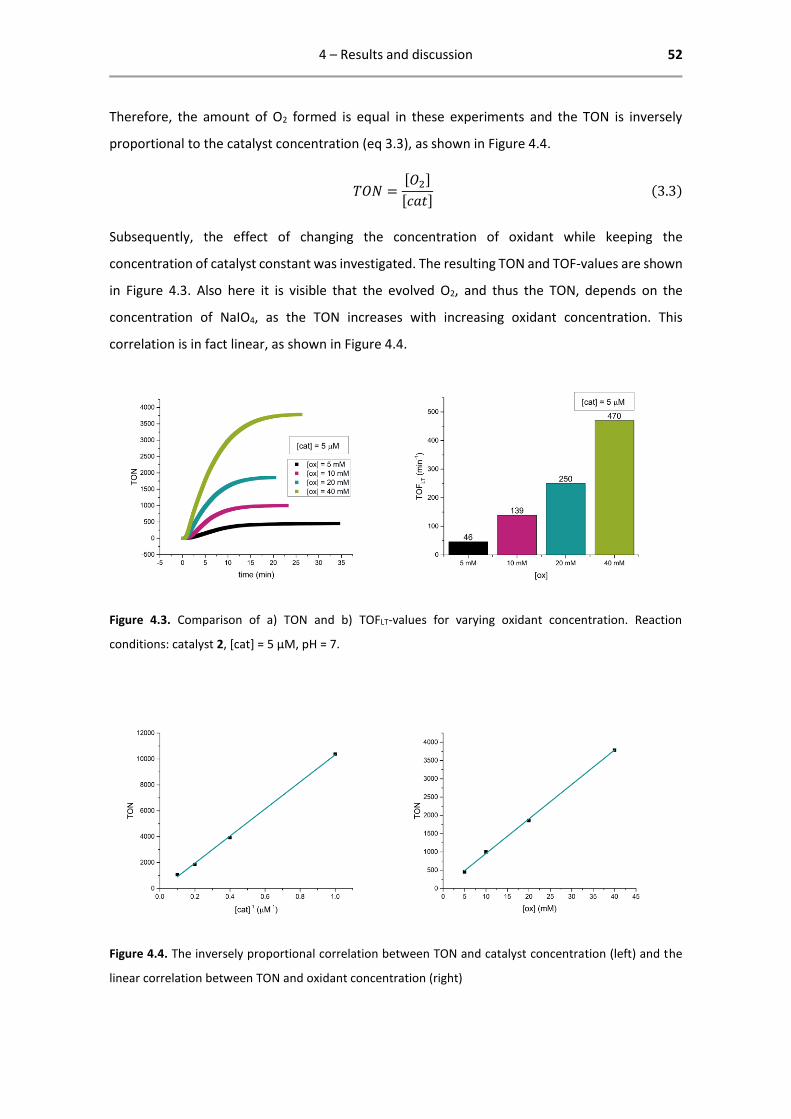
4 – Results and discussion 52
Therefore, the amount of O2 formed is equal in these experiments and the TON is inversely
proportional to the catalyst concentration (eq 3.3), as shown in Figure 4.4.
𝑇𝑂𝑁 =[𝑂2]
[𝑐𝑎𝑡] (3.3)
Subsequently, the effect of changing the concentration of oxidant while keeping the
concentration of catalyst constant was investigated. The resulting TON and TOF-values are shown
in Figure 4.3. Also here it is visible that the evolved O2, and thus the TON, depends on the
concentration of NaIO4, as the TON increases with increasing oxidant concentration. This
correlation is in fact linear, as shown in Figure 4.4.
Figure 4.3. Comparison of a) TON and b) TOFLT-values for varying oxidant concentration. Reaction
conditions: catalyst 2, [cat] = 5 µM, pH = 7.
Figure 4.4. The inversely proportional correlation between TON and catalyst concentration (left) and the
linear correlation between TON and oxidant concentration (right)
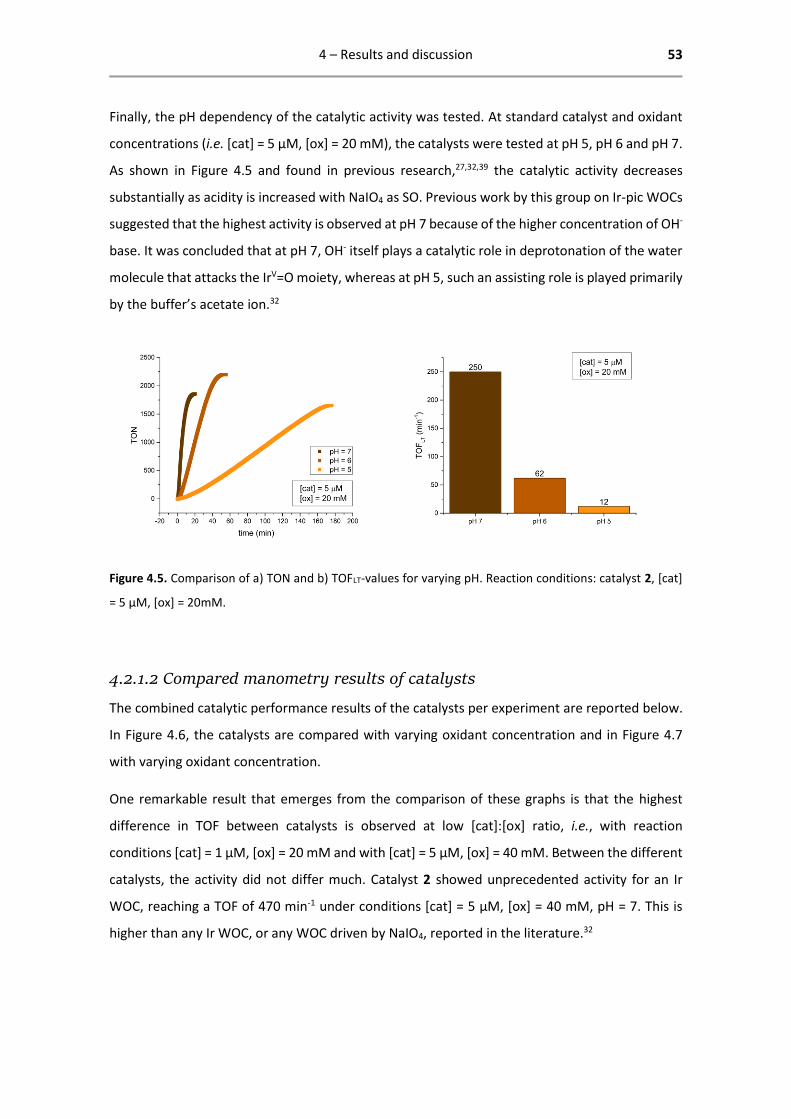
4 – Results and discussion 53
Finally, the pH dependency of the catalytic activity was tested. At standard catalyst and oxidant
concentrations (i.e. [cat] = 5 µM, [ox] = 20 mM), the catalysts were tested at pH 5, pH 6 and pH 7.
As shown in Figure 4.5 and found in previous research,27,32,39 the catalytic activity decreases
substantially as acidity is increased with NaIO4 as SO. Previous work by this group on Ir-pic WOCs
suggested that the highest activity is observed at pH 7 because of the higher concentration of OH-
base. It was concluded that at pH 7, OH- itself plays a catalytic role in deprotonation of the water
molecule that attacks the IrV=O moiety, whereas at pH 5, such an assisting role is played primarily
by the buffer’s acetate ion.32
Figure 4.5. Comparison of a) TON and b) TOFLT-values for varying pH. Reaction conditions: catalyst 2, [cat]
= 5 µM, [ox] = 20mM.
4.2.1.2 Compared manometry results of catalysts
The combined catalytic performance results of the catalysts per experiment are reported below.
In Figure 4.6, the catalysts are compared with varying oxidant concentration and in Figure 4.7
with varying oxidant concentration.
One remarkable result that emerges from the comparison of these graphs is that the highest
difference in TOF between catalysts is observed at low [cat]:[ox] ratio, i.e., with reaction
conditions [cat] = 1 µM, [ox] = 20 mM and with [cat] = 5 µM, [ox] = 40 mM. Between the different
catalysts, the activity did not differ much. Catalyst 2 showed unprecedented activity for an Ir
WOC, reaching a TOF of 470 min-1 under conditions [cat] = 5 µM, [ox] = 40 mM, pH = 7. This is
higher than any Ir WOC, or any WOC driven by NaIO4, reported in the literature.32

4 – Results and discussion 54
Figure 4.6. Comparison of catalysts 1-4 with varying catalyst concentration and fixed oxidant concentration.
Figure 4.7. Comparison of catalysts 1-4 with varying oxidant concentration and fixed catalyst concentration.

4 – Results and discussion 55
4.2.2 Results of oximetry
As to confirm the TOFIN, the set of experiments with standard conditions ([cat] = 5 µM, [ox] = 20
mM, pH = 7) was repeated and followed by oximetry. The data is analysed up to the point of
microbubble formation, from where on the calculated TON and TOF are not reliable anymore.
The results of these experiments are reported in Table 4.3 and visualized in Figure 4.8.
Table 4.3. Oximetry data for catalysts 1-4.
Oximetry
cat [cat] (µM) [ox] (mM) pH TOFIN (min-1)
5 20 7 218
5 20 7 219
5 20 7 218
5 20 7 132
5 20 7 202
5 20 7 187
5 20 7 185
5 20 7 187
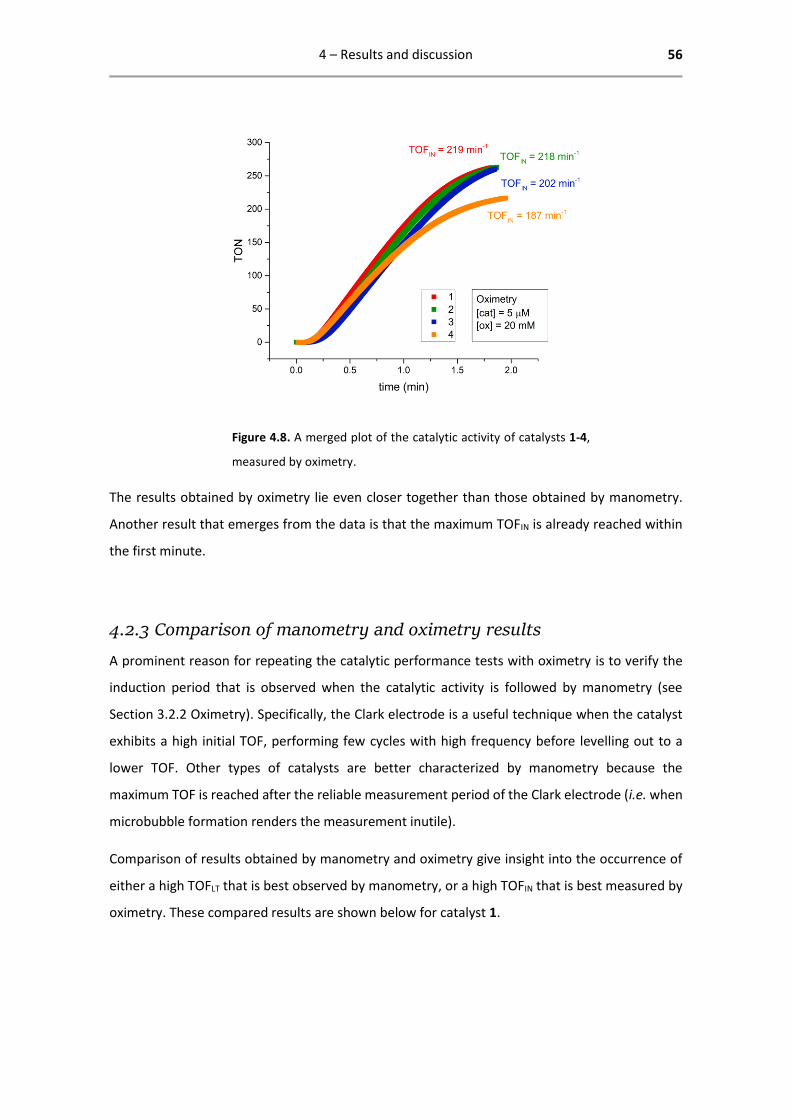
4 – Results and discussion 56
Figure 4.8. A merged plot of the catalytic activity of catalysts 1-4,
measured by oximetry.
The results obtained by oximetry lie even closer together than those obtained by manometry.
Another result that emerges from the data is that the maximum TOFIN is already reached within
the first minute.
4.2.3 Comparison of manometry and oximetry results
A prominent reason for repeating the catalytic performance tests with oximetry is to verify the
induction period that is observed when the catalytic activity is followed by manometry (see
Section 3.2.2 Oximetry). Specifically, the Clark electrode is a useful technique when the catalyst
exhibits a high initial TOF, performing few cycles with high frequency before levelling out to a
lower TOF. Other types of catalysts are better characterized by manometry because the
maximum TOF is reached after the reliable measurement period of the Clark electrode (i.e. when
microbubble formation renders the measurement inutile).
Comparison of results obtained by manometry and oximetry give insight into the occurrence of
either a high TOFLT that is best observed by manometry, or a high TOFIN that is best measured by
oximetry. These compared results are shown below for catalyst 1.
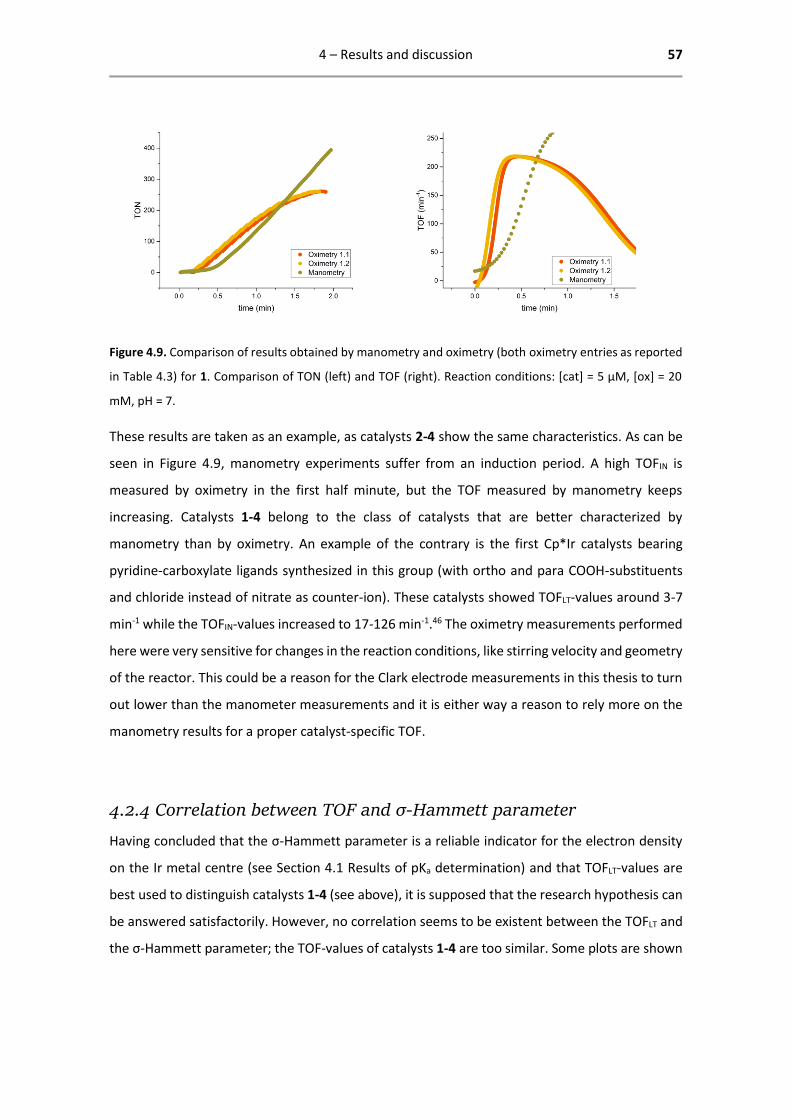
4 – Results and discussion 57
Figure 4.9. Comparison of results obtained by manometry and oximetry (both oximetry entries as reported
in Table 4.3) for 1. Comparison of TON (left) and TOF (right). Reaction conditions: [cat] = 5 µM, [ox] = 20
mM, pH = 7.
These results are taken as an example, as catalysts 2-4 show the same characteristics. As can be
seen in Figure 4.9, manometry experiments suffer from an induction period. A high TOFIN is
measured by oximetry in the first half minute, but the TOF measured by manometry keeps
increasing. Catalysts 1-4 belong to the class of catalysts that are better characterized by
manometry than by oximetry. An example of the contrary is the first Cp*Ir catalysts bearing
pyridine-carboxylate ligands synthesized in this group (with ortho and para COOH-substituents
and chloride instead of nitrate as counter-ion). These catalysts showed TOFLT-values around 3-7
min-1 while the TOFIN-values increased to 17-126 min-1.46 The oximetry measurements performed
here were very sensitive for changes in the reaction conditions, like stirring velocity and geometry
of the reactor. This could be a reason for the Clark electrode measurements in this thesis to turn
out lower than the manometer measurements and it is either way a reason to rely more on the
manometry results for a proper catalyst-specific TOF.
4.2.4 Correlation between TOF and σ-Hammett parameter
Having concluded that the σ-Hammett parameter is a reliable indicator for the electron density
on the Ir metal centre (see Section 4.1 Results of pKa determination) and that TOFLT-values are
best used to distinguish catalysts 1-4 (see above), it is supposed that the research hypothesis can
be answered satisfactorily. However, no correlation seems to be existent between the TOFLT and
the σ-Hammett parameter; the TOF-values of catalysts 1-4 are too similar. Some plots are shown

4 – Results and discussion 58
as an illustration in Figure 4.10, where the TOF is plotted against the σ-Hammett parameter of
the catalysts.
Figure 4.10. Some plots of the TOF against the σ-Hammett parameter for different [cat]:[ox] ratios. No
consistent correlation seems to exist that accords with the varying results obtained per reaction condition.
To demonstrate that neither with oximetry a linear correlation was found, a plot of the TOF IN against the
σ-Hammett parameter is shown in the bottom right.
In quest for a correlation and to obtain a bigger database, manometry data of other substituted
pyridine-carboxylate catalysts were taken into account as well. The TOF-values of pic and all its
derivatives that were synthesized in this group, are plotted against their σ-Hammett parameter
in Figure 4.11.

4 – Results and discussion 59
Figure 4.11. The TOFLT plotted against the σ-Hammett parameter
for pic and all its synthesized derivatives. For catalysts other than
pic and the ones reported in this thesis, the number indicates the
position of the substituent in the pic-ring. Reaction conditions:
[cat] = 5 µM, [ox] = 20 mM, pH = 7.
With this expanded database of catalysts, some trend is revealed. From σ-Hammett parameter
values -0.8 to 0.0, a linear relationship between the TOF and the σ-Hammett parameter is
observed. On the positive side of the x-axis, the TOF-values level out onto a plateau. This would
mean that the TOF can be increased by increasing the σ-Hammett parameter of the substituent,
but for higher values than 0, this acceleratory effect disappears.
On mechanistic level, this would confirm the previous hypothesis32 that the water oxidation
reaction with (substituted) Cp*Ir-pic compounds follows the WNA pathway as depicted
previously in Scheme 1.4. Decreasing the electron density on Ir accelerates the water nucleophilic
attack RDS, thereby increasing the TOF. Decreasing the electron density too much, though, could
hamper the initial PCET steps where IrIII-OH2 is oxidized through IrIV-OH to IrV=O, as electron
withdrawing ancillary ligands destabilize the high oxidation state that is to be reached. The RDS
would change from the water nucleophilic attack (for ligands with negative σ-Hammett
parameters) to an oxidative step (for ligands with σ-Hammett parameters). To expand these
interpretations to mechanistic proof, however, more data points should be generated and the
mechanistic pathway of the catalysts should be elucidated further.
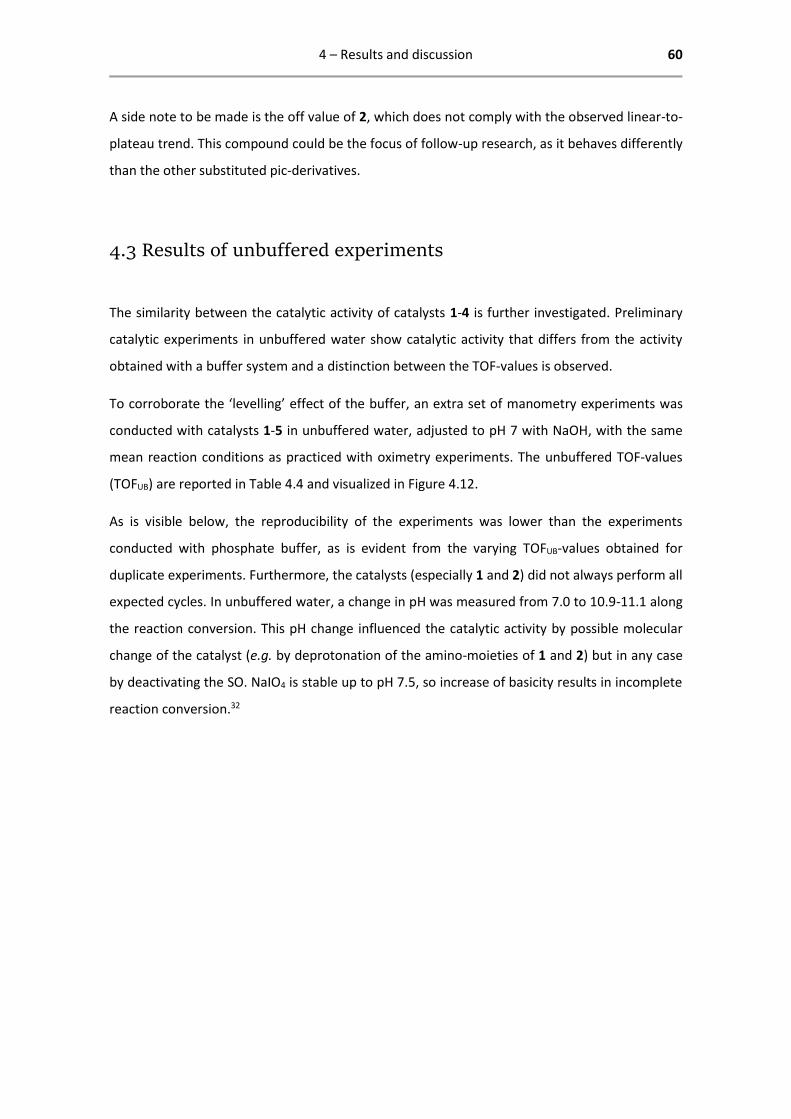
4 – Results and discussion 60
A side note to be made is the off value of 2, which does not comply with the observed linear-to-
plateau trend. This compound could be the focus of follow-up research, as it behaves differently
than the other substituted pic-derivatives.
4.3 Results of unbuffered experiments
The similarity between the catalytic activity of catalysts 1-4 is further investigated. Preliminary
catalytic experiments in unbuffered water show catalytic activity that differs from the activity
obtained with a buffer system and a distinction between the TOF-values is observed.
To corroborate the ‘levelling’ effect of the buffer, an extra set of manometry experiments was
conducted with catalysts 1-5 in unbuffered water, adjusted to pH 7 with NaOH, with the same
mean reaction conditions as practiced with oximetry experiments. The unbuffered TOF-values
(TOFUB) are reported in Table 4.4 and visualized in Figure 4.12.
As is visible below, the reproducibility of the experiments was lower than the experiments
conducted with phosphate buffer, as is evident from the varying TOFUB-values obtained for
duplicate experiments. Furthermore, the catalysts (especially 1 and 2) did not always perform all
expected cycles. In unbuffered water, a change in pH was measured from 7.0 to 10.9-11.1 along
the reaction conversion. This pH change influenced the catalytic activity by possible molecular
change of the catalyst (e.g. by deprotonation of the amino-moieties of 1 and 2) but in any case
by deactivating the SO. NaIO4 is stable up to pH 7.5, so increase of basicity results in incomplete
reaction conversion.32
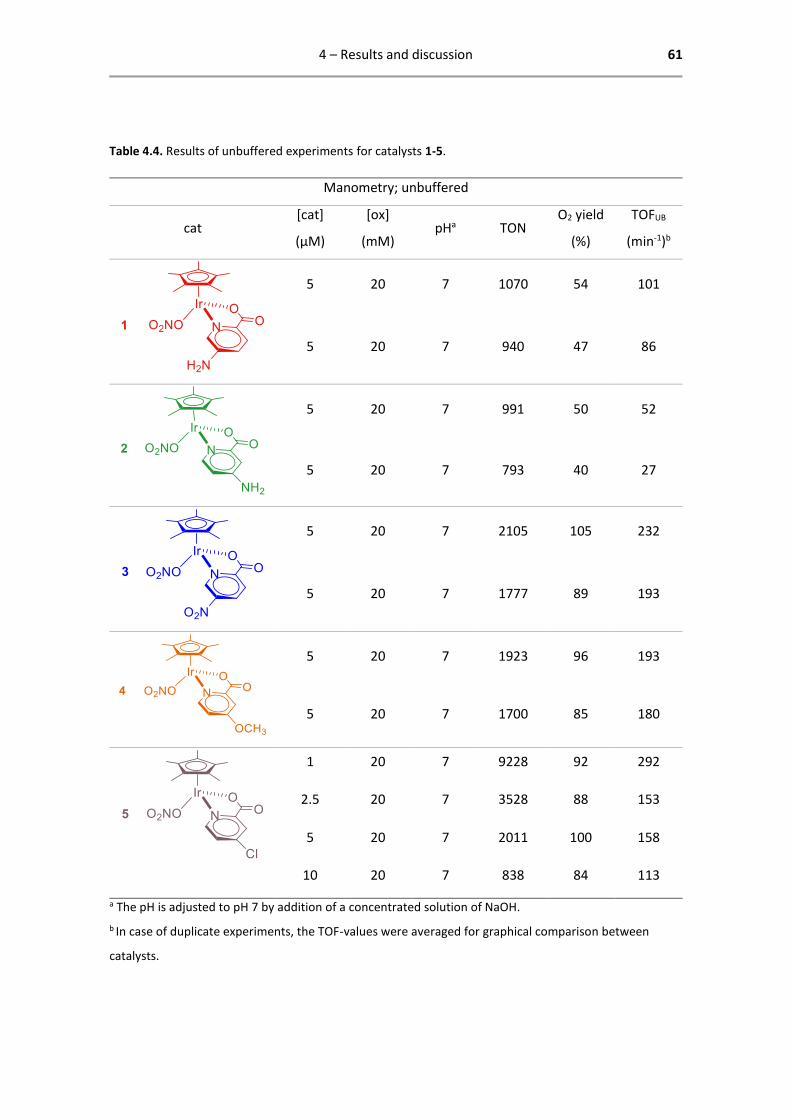
4 – Results and discussion 61
Table 4.4. Results of unbuffered experiments for catalysts 1-5.
Manometry; unbuffered
cat [cat]
(µM)
[ox]
(mM) pHa TON
O2 yield
(%)
TOFUB
(min-1)b
5 20 7 1070 54 101
5 20 7 940 47 86
5 20 7 991 50 52
5 20 7 793 40 27
5 20 7 2105 105 232
5 20 7 1777 89 193
5 20 7 1923 96 193
5 20 7 1700 85 180
1 20 7 9228 92 292
2.5 20 7 3528 88 153
5 20 7 2011 100 158
10 20 7 838 84 113
a The pH is adjusted to pH 7 by addition of a concentrated solution of NaOH.
b In case of duplicate experiments, the TOF-values were averaged for graphical comparison between
catalysts.

4 – Results and discussion 62
Figure 4.12. The catalytic activity of catalysts 1-5 in unbuffered
water, measured by manometry.
Despite the unsatisfactory yields, a remarkable variety in TOFUB-values between the catalysts is
observed, as opposed to previous results. Plotted against the σ-Hammett parameter, these
TOFUB-values do show some correlation, as shown in Figure 4.13.
Figure 4.13. TOFUB plotted against the σ-Hammett
parameter. The σ-Hammett parameter of 5 is 0.23.
Reaction conditions: [cat] = 5 µM, [ox] = 20 mM, pH = 7
by addition of NaOH.

4 – Results and discussion 63
Omitting the TOFUB of 4, a linear trend is observed between the TOFUB and the σ-Hammett
parameter. This could mean that the expected relation between electron density on Ir and the
catalyst’s activity is expressed better in unbuffered water than in buffer solution. The evolution
of the TOF through time for catalysts 1, 2, 3 and 5 is shown in Figure 4.14.
Figure 4.14. The evolution of TOFUB through time plotted
against the σ-Hammett parameter for catalysts 1, 2, 3 and
5. An increasing maximum TOF is observed for increasing σ-
Hammett parameter. Reaction conditions: [cat] = 5 µM, [ox]
= 20 mM, pH = 7 by addition of NaOH.
The off value of 4 cannot be rationalized with the current knowledge. Because the experiments
indicating the levelling effect of the buffer were conducted near the end of this thesis’ work, little
time remained for elaboration of the preliminary results. These open ends will have to be
answered in future research so are unfortunately not taken up in this thesis.
Also in this section, data from previous research is called to aid in the quest for a correlation.
When the TOFUB of pic32 is included in the database, the off value of 4 seems to be part of a trend.
The data suggest a linear correlation between the TOFUB and the σ-Hammett parameter, as shown
in Figure 4.15. Although the data points are scattered around the linear fit, a trend is clearly visible
that suggests that decreased electron density on Ir results in higher catalytic activity in unbuffered
water.
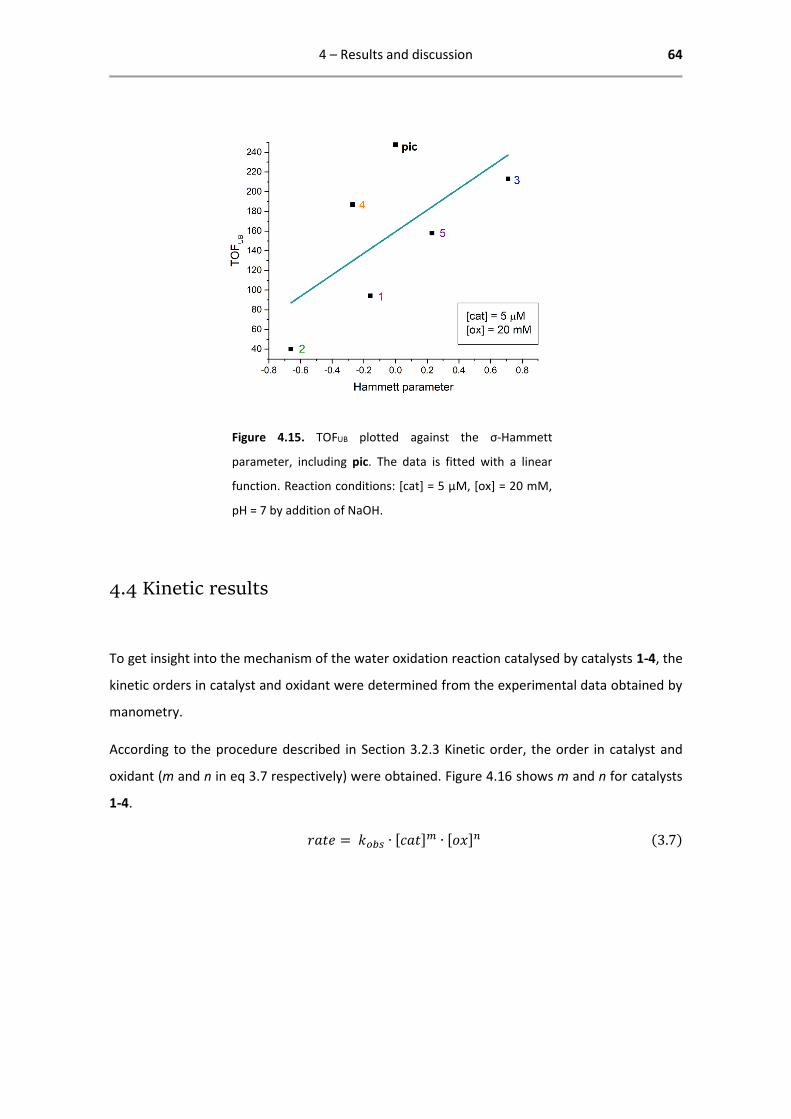
4 – Results and discussion 64
Figure 4.15. TOFUB plotted against the σ-Hammett
parameter, including pic. The data is fitted with a linear
function. Reaction conditions: [cat] = 5 µM, [ox] = 20 mM,
pH = 7 by addition of NaOH.
4.4 Kinetic results
To get insight into the mechanism of the water oxidation reaction catalysed by catalysts 1-4, the
kinetic orders in catalyst and oxidant were determined from the experimental data obtained by
manometry.
According to the procedure described in Section 3.2.3 Kinetic order, the order in catalyst and
oxidant (m and n in eq 3.7 respectively) were obtained. Figure 4.16 shows m and n for catalysts
1-4.
𝑟𝑎𝑡𝑒 = 𝑘𝑜𝑏𝑠 ∙ [𝑐𝑎𝑡]𝑚 ∙ [𝑜𝑥]𝑛 (3.7)
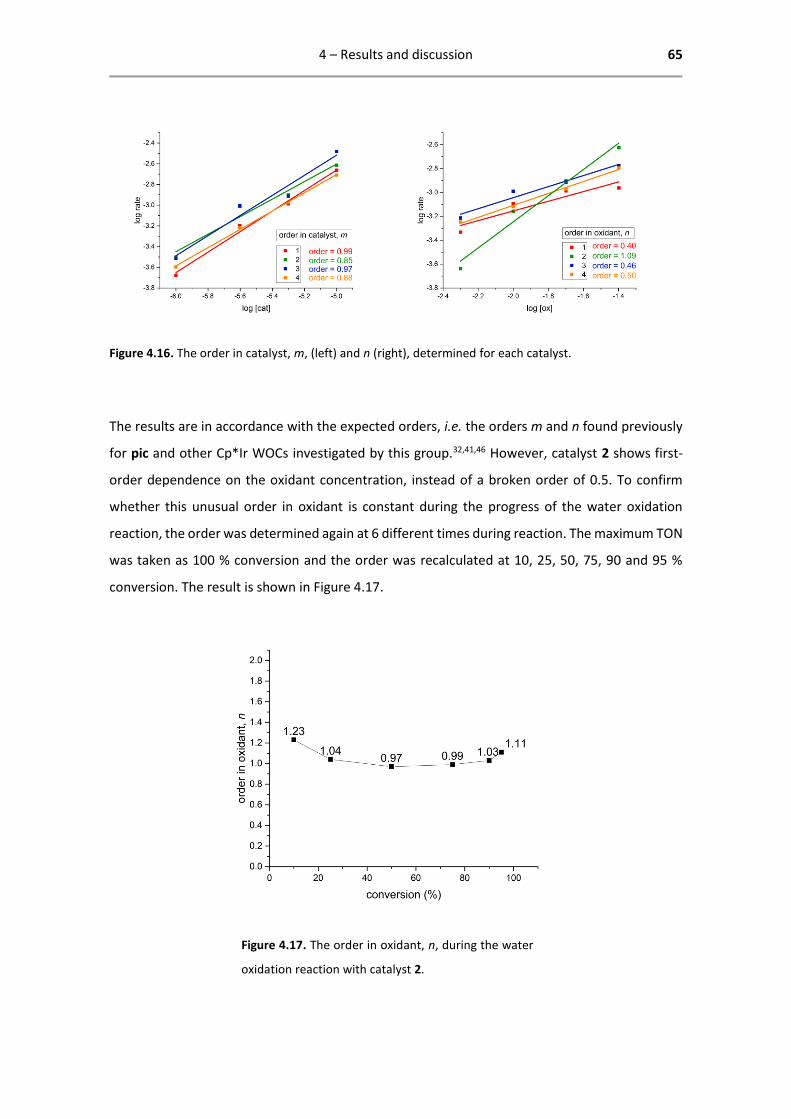
4 – Results and discussion 65
Figure 4.16. The order in catalyst, m, (left) and n (right), determined for each catalyst.
The results are in accordance with the expected orders, i.e. the orders m and n found previously
for pic and other Cp*Ir WOCs investigated by this group.32,41,46 However, catalyst 2 shows first-
order dependence on the oxidant concentration, instead of a broken order of 0.5. To confirm
whether this unusual order in oxidant is constant during the progress of the water oxidation
reaction, the order was determined again at 6 different times during reaction. The maximum TON
was taken as 100 % conversion and the order was recalculated at 10, 25, 50, 75, 90 and 95 %
conversion. The result is shown in Figure 4.17.
Figure 4.17. The order in oxidant, n, during the water
oxidation reaction with catalyst 2.

4 – Results and discussion 66
It is confirmed that n is more or less constantly 1 during the water oxidation reaction, differing
from catalysts 1, 3 and 4, that all show around half-order dependence on oxidant. This explains
why the TOFLT for catalyst 2 is remarkably higher when the oxidant concentration is increased.
However, the origin of this first-order dependence on oxidant cannot be explained with the
current knowledge of catalyst 2. As mentioned before, this catalyst is interesting to investigate
further, because of its differing rate equation and its catalytic activity which does not comply with
the linear-to-plateau trend that is described in Section 4.2.4 Correlation between TOF and σ-
Hammett parameter.

5 – Conclusions 67
5 – Conclusions
New Cp*Ir WOCs were synthesized with substituted pic ligands, based on the very active Ir WOC
pic. With 2, the highest observed TOF was 470 min-1, higher than any Ir WOC, or any WOC driven
by NaIO4, reported in the literature. Furthermore, with all catalysts all expected cycles were
performed; the TON was limited only by the concentration of NaIO4. A correlation was expected
between the electron density on Ir and the catalytic activity. As an indication of the electron
density on the metal centre, the pKa of complexes 1-4 was determined and compared with the σ-
Hammett parameter of the ancillary ligand. The pKa correlated well with the σ-Hammett
parameter, validating the use of the parameter as a quantization of the ligand’s inductive effect.
When the dependency of the TOF on the σ-Hammett parameter was investigated, seemingly no
correlation was found for catalysts 1-4. For manometry experiments, but especially for oximetry
experiments, the obtained TOF-values were very similar for all catalysts. Expanding the database
with similar pic-derived catalysts synthesized in the group, however, revealed a trend that is best
described as a linear-to-plateau trend. For negative σ-Hammett parameters, decreasing electron
density resulted in higher activity, while a plateau in the graph was reached when the σ-Hammett
parameter exceeded 0. On mechanistic level, this could mean that water oxidation occurs
according to the WNA pathway, with water nucleophilic attack as the RDS. Electron-withdrawing
substituents in the pic-ring decrease the electron density on Ir, rendering the IrV=O moiety more
susceptible to nucleophilic attack, increasing the TOF. The plateau for positive σ-Hammett
parameters could be interpreted as counteraction of a too low electron density on Ir. This could
shift the RDS to the initial oxidation of IrIII-OH2 through IrIV-OH to IrV=O, where a low electron
density means slower deprotonation, because of destabilization of the high-valent Ir species.
Elucidating the kinetic rate equation, first-order catalyst-dependency was found for 1-4 and half-
order oxidant-dependency was found for 1, 3 and 4, analogous with previous pic-derived
catalysts. 2 showed first-order dependency on oxidant.
In unbuffered water, at pH 7 by addition of NaOH, the TOF-values of 1-5 were more distinctive.
For 1, 2, 3 and 5, a linear correlation could be found between the electron density on Ir and the
TOF. Including 4 and pic in the graph, a similar trend was observed, where lower electron density
resulted in higher activity. For a better correlation, the pic-OH derivatives that were synthesized
previously in the group32 could be tested in unbuffered water as well.

6 – Acknowledgements 68
The results sketch a blueprint for the design of an efficient WOC, of which the activity can be
modified by rational design of the ancillary ligand. Further research can and does already focus
on the peculiar behaviour of 2, with its deviant kinetic order in oxidant, off-value in the linear-to-
plateau trend and high activity. Apart from improving the catalytic activity, future research should
aim at application of the gathered knowledge and catalysts. To be implemented in a sustainable
artificial photosynthetic apparatus, the water oxidation reaction should be driven by solar light
instead of a sacrificial reagent. A low overpotential is crucial for photo-activation and Cp*Ir WOCs
based on pyridine-carboxylate ligands have previously proven to have a lower oxidation potential
than other Ir WOCs.46 Anchoring homogeneous catalysts on a support combines the advantages
of both homogeneous and heterogeneous catalysts and could show promise for tuneable
molecular heterogenized catalysts in solar fuel cells. This could pave the way for a sustainable
future powered by solar fuels, in which “life and civilization will continue as long as the sun
shines!”24
6 – Acknowledgements
I would like to thank Alberto Bucci for being my supervisor in the first months. I am grateful for
Gabriel Menendez Rodriguez and prof. Alceo Maccioni for the supervision, the helpful discussions
and proof-reading this thesis. I acknowledge prof. Cristiano Zuccaccia and the Leonardi for their
enthusiastic help with NMR sequences. I thank everybody on the lab, Leo, Lucia, Chiara, Leo and
Giordano, for nights of Bang and card games and for speaking English every once in a while.
Hereby I give a shout-out to Annemiek and the coffee corner in UniStraPG for moral support.
Finally, I want to thank the EU Erasmus+ committee for aid in my monthly expenses on rent and
pizza.
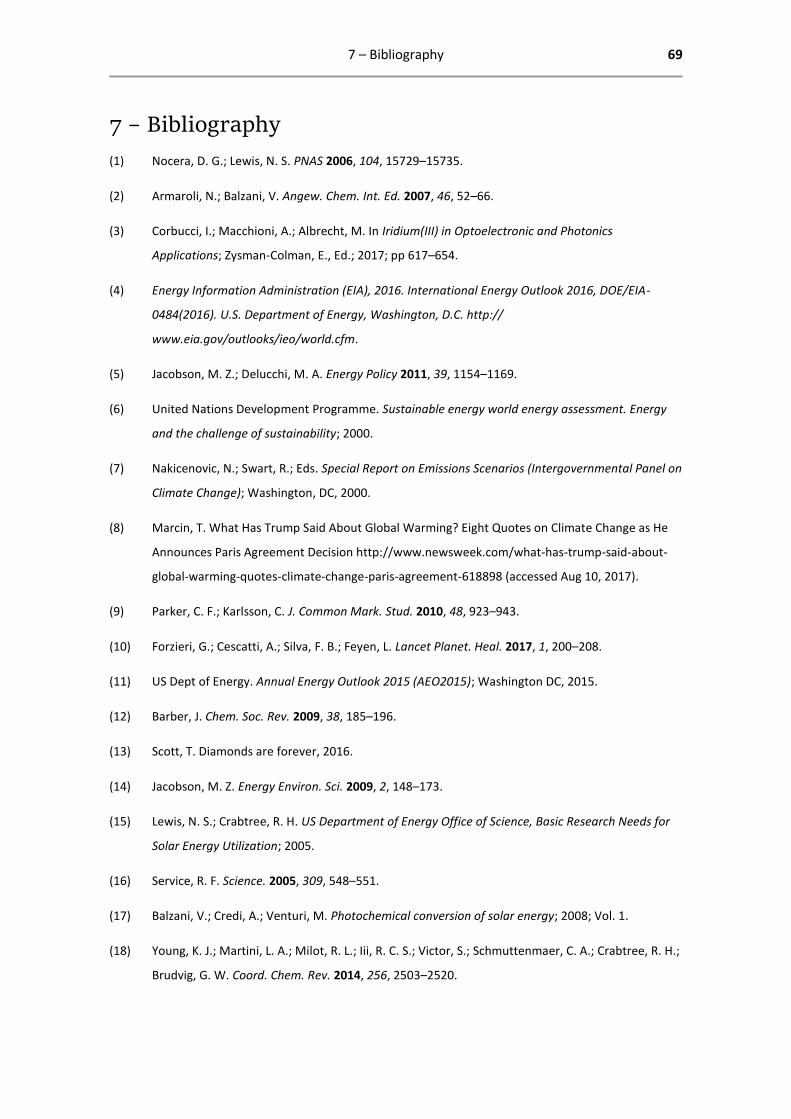
7 – Bibliography 69
7 – Bibliography
(1) Nocera, D. G.; Lewis, N. S. PNAS 2006, 104, 15729–15735.
(2) Armaroli, N.; Balzani, V. Angew. Chem. Int. Ed. 2007, 46, 52–66.
(3) Corbucci, I.; Macchioni, A.; Albrecht, M. In Iridium(III) in Optoelectronic and Photonics
Applications; Zysman-Colman, E., Ed.; 2017; pp 617–654.
(4) Energy Information Administration (EIA), 2016. International Energy Outlook 2016, DOE/EIA-
0484(2016). U.S. Department of Energy, Washington, D.C. http://
www.eia.gov/outlooks/ieo/world.cfm.
(5) Jacobson, M. Z.; Delucchi, M. A. Energy Policy 2011, 39, 1154–1169.
(6) United Nations Development Programme. Sustainable energy world energy assessment. Energy
and the challenge of sustainability; 2000.
(7) Nakicenovic, N.; Swart, R.; Eds. Special Report on Emissions Scenarios (Intergovernmental Panel on
Climate Change); Washington, DC, 2000.
(8) Marcin, T. What Has Trump Said About Global Warming? Eight Quotes on Climate Change as He
Announces Paris Agreement Decision http://www.newsweek.com/what-has-trump-said-about-
global-warming-quotes-climate-change-paris-agreement-618898 (accessed Aug 10, 2017).
(9) Parker, C. F.; Karlsson, C. J. Common Mark. Stud. 2010, 48, 923–943.
(10) Forzieri, G.; Cescatti, A.; Silva, F. B.; Feyen, L. Lancet Planet. Heal. 2017, 1, 200–208.
(11) US Dept of Energy. Annual Energy Outlook 2015 (AEO2015); Washington DC, 2015.
(12) Barber, J. Chem. Soc. Rev. 2009, 38, 185–196.
(13) Scott, T. Diamonds are forever, 2016.
(14) Jacobson, M. Z. Energy Environ. Sci. 2009, 2, 148–173.
(15) Lewis, N. S.; Crabtree, R. H. US Department of Energy Office of Science, Basic Research Needs for
Solar Energy Utilization; 2005.
(16) Service, R. F. Science. 2005, 309, 548–551.
(17) Balzani, V.; Credi, A.; Venturi, M. Photochemical conversion of solar energy; 2008; Vol. 1.
(18) Young, K. J.; Martini, L. A.; Milot, R. L.; Iii, R. C. S.; Victor, S.; Schmuttenmaer, C. A.; Crabtree, R. H.;
Brudvig, G. W. Coord. Chem. Rev. 2014, 256, 2503–2520.

7 – Bibliography 70
(19) Simmons, M. R. Twilight in the Desert: The Coming Saudi Oil Shock and the World Economy; John
Wiley & Sons, Inc: Hoboken, NJ, 2005.
(20) Crabtree, G. Introduction to the Photon Workshop Process and Report Development (US
Department of Energy), 2009.
(21) Nocera, D. G. Acc. Chem. Res. 2012, 45, 767–776.
(22) Gust, D.; Moore, T. A.; Moore, A. L. Acc. Chem. Res. 2009, 42, 1890–1898.
(23) Armaroli, N.; Balzani, V. Chem. Eur. J. 2016, 22, 32–57.
(24) Ciamician, G. Science. 1912, 36, 385.
(25) Larkum, A. W. D. Curr. Opin. Biotechnol. 2010, 21, 271–276.
(26) Wasielewski, M. R., Johnson, D. G., Seibert, M., Govindjee Proc. Natl. Acad.Sci. U.S.A. 1989, 86,
524.
(27) Bucci, A. Molecular Iridium Catalysts for Artificial Photosyntesis. PhD Dissertation, Universita degli
studi di Perugia, Perugia, 2015.
(28) Su, J.; Vayssieres, L. ACS Energy Lett. 2016, 1, 121–135.
(29) McConnell, I. G.; Brudvig, G. W. Chem. Biol. 2010, 17, 434–440.
(30) Macchioni, A. Proc. SPIE 2014, 9176, 917608 1-8.
(31) Hetterscheid, D. G. H.; Van Der Vlugt, J. I.; De Bruin, B.; Reek, J. N. H. Angew. Chemie - Int. Ed.
2009, 48, 8178–8181.
(32) Menendez Rodriguez, G.; Bucci, A.; Hutchinson, R.; Bellachioma, G.; Zuccaccia, C.; Giovagnoli, S.;
Idriss, H.; Macchioni, A. ACS Energy Lett. 2017, 2, 105–110.
(33) Hurst, J. K. Science. 2010, 328, 315–316.
(34) Youngblood, W. J.; Lee, S.-H. A.; Kobayashi, Y.; Hernandez- Pagan, E. A.; Hoertz, P. G.; Moore, T.
A.; Moore, A. L.; Gust, D.; Mallouk, T. E. J. Am. Chem. Soc. 2009, 131, 926–927.
(35) Pokhrel, R.; Brudvig, G. W. Phys.Chem.Chem.Phys. 2014, 16, 11812–11821.
(36) Chen, J. J.; Concepcion, X.; Hu, W.; Yang, P. G.; Hoertz, T. J.; Meyer, Z. Proc. Natl. Acad. Sci. USA
2010, 107, 7225–7229.
(37) McDaniel, N. D.; Coughlin, F. J.; Tinker, L. L.; Bernhard, S. J. Am. Chem. Soc. 2008, 130, 210–217.
(38) Hull, J. F.; Balcells, D.; Blakemore, J. D.; Incarvito, C. D.; Eisenstein, O.; Brudvig, G. W.; Crabtree, R.
H. J. Am. Chem. Soc. 2009, 131, 8730–8731.
7 – Bibliography 71
(39) Corbucci, I. Catalytic and photocatalytic water oxidation by organometallic iridium complexes.
PhD Dissertation, Universita degli studi di Perugia, Perugia, 2016.
(40) Woods, J. A.; Bernhard, S.; Albrecht, M. In Molecular Water Oxidation; Llobet, A., Ed.;
Wiley−Interscience: New York, 2014; p 113−133.
(41) Thomsen, J. M.; Huang, D. L.; Crabtree, R. H.; Brudvig, G. W. Dalt. Trans. 2015, 44, 12452–12472.
(42) Corbucci, I.; Petronilho, A.; Muller-Bunz, H.; Rocchigiani, L.; Albrecht, M.; Macchioni, A. ACS Catal.
2015, 5, 2714−2718.
(43) Hong, D.; Murakami, M.; Yamada, Y.; Fukuzumi, S. Energy Environ. Sci. 2012, 5, 5708–5716.
(44) DePasquale, J.; Nieto, I.; Reuther, L. E.; Herbst-Gervasoni, C. J.; Paul, J. J.; Mochalin, V.; Zeller, M.;
Thomas, C. M.; Addison, A. W.; Papish, E. T. Inorg. Chem. 2013, 52, 9175−9180.
(45) Lewandowska-Andralojc, A.; Polyansky, D. E.; Wang, C.; Wang, H.; Himeda, W. H. Y.; Fujita, E.
Phys. Chem. Chem. Phys. 2014, 16, 11976–11987.
(46) Bucci, A.; Savini, A.; Rocchigiani, L.; Zuccaccia, C.; Rizzato, S.; Albinati, A.; Llobet, A.; MacChioni, A.
Organometallics 2012, 31, 8071–8074.
(47) Koelewijn, J. M.; Lutz, M.; Dzik, W. I.; Detz, R. J.; Reek, J. N. H. ACS Catal. 2016, 6, 3418−3427.
(48) Duan, L.; Bozoglian, F.; Mandal, S.; Stewart, B.; Privalov, T.; Llobet, A.; Sun, L. Nat. Chem. 2012, 4,
418–423.
(49) Blakemore, J. D.; Schley, N. D.; Balcells, D.; Hull, J. F.; Olack, G. W.; Incarvito, C. D.; Eisenstein, O.;
Brudvig, G. W.; Crabtree, R. H. J. Am. Chem. Soc. 2010, 132, 16017−16029.
(50) Hansch, C.; Leo, A.; Taft, R. W. Chem. Rev. 1991, 91, 165–195.
(51) Aue, W. P.; Bartholdi, E.; Ernst, R. R. J. Chem. Phys. 1976, 64, 2229–2246.
(52) Keeler, J. Understanding NMR Spectroscopy, 2nd ed.; Wiley: New York, 2010.
(53) Savini, A.; Bucci, A.; Bellachioma, G.; Rocchigiani, L.; Zuccaccia, C.; Llobet, A.; Macchioni, A. Eur. J.
Inorg. Chem. 2014, No. 4, 690–697.
(54) Savini, A.; Bucci, A.; Bellachioma, G.; Giancola, S.; Palomba, F.; Rocchigiani, L.; Rossi, A.; Suriani,
M.; Zuccaccia, C.; MacChioni, A. J. Organomet. Chem. 2014, 771, 24–32.
(55) Parent, A. R.; Brewster, T. P.; De Wolf, W.; Crabtree, R. H.; Brudvig, G. W. Inorg. Chem. 2012, 51,
6147–6152.
(56) Parent, A. R.; Crabtree, R. H.; Brudvig, G. W.; Parent, A. R. Chem. Soc. Rev. 2013, 42, 2247–2252.
7 – Bibliography 72
(57) Blakemore, J. D.; Schley, N. D.; Balcells, D.; Hull, J. F.; Olack, G. W.; Incarvito, C. D.; Eisenstein, O.;
Brudvig, G. W.; Crabtree, R. H. J. Am. Chem. Soc. 2010, 132, 16017–16029.
(58) Wasylenko, D. J.; Ganesamoorthy, C.; Henderson, M. A.; Berlinguette, C. P. Inorg. Chem. 2011, 50,
3662–3672.
(59) Savini, A.; Belanzoni, P.; Bellachioma, G.; Zuccaccia, C.; Zuccaccia, D.; Macchioni, A. Green Chem.
2011, 13, 3360–3374.
(60) Grotjahn, D. B.; Brown, D. B.; Martin, J. K.; Marelius, D. C.; Abadjian, M.-C.; Tran, H. N.; Kalyuzhny,
G.; Vecchio, K. S.; Specht, Z. G.; Cortes-Llamas, S. A.; Miranda-Soto, V.; Van, N. C.; Moore, C. E.;
Rheingold, A. L. J. Am. Chem. Soc. 2011, 133, 19024–19027.
(61) Zuccaccia, C.; Bellachioma, G.; Bolaño, S.; Rocchigiani, L.; Savini, A.; Macchioni, A. Eur. J. Inorg.
Chem. 2012, 1462–1468.
(62) Pecht, I.; Luz, Z. J. Am. Chem. Soc. 1965, 87, 4068−4072.
(63) Abril, P.; del Río, M. P.; Tejel, C.; Verhoeven, T. W. G. M.; Niemantsverdriet, J. W. H.; Van der Ham,
C. J. M.; Kottrup, K. G.; Hetterscheid, D. G. H. ACS Catal. 2016, 6, 7872−7875.
(64) O’Maley, J. B. Digital manometer. US3212338 A, 1965.
(65) Clapeyron, E. J. l’École Polytech. 1834, 14, 153–190.
(66) Gates, B. C. Catalytic Chemistry; Academic Press: New York, 1992.
(67) Boudart, M. Chem. Rev. 1995, 95, 661–666.
(68) Peters, W. S.; Baskin, T. I. Plant Methods 2006, 2, 11.
(69) Clark, L. C. Trans. Am. Soc. Artif. Intern. Organs 1956, 2, 41–48.
(70) Clark, L. C. Oxygen electrode. US 33539455, 1970.
(71) O’Connell, L. Clark Electrode https://howlingpixel.com/wiki/Clark_electrode (accessed Aug 10,
2017).
(72) Atkins, P.; de Paula, J. Physical Chemistry, 8th ed.; W.H. Freeman: Oxford, 2006.
(73) Henderson, L. J. Am. J. Physiol. 1908, 21, 173–179.
(74) Leffler, J. E.; Grunwald, E. Rates and Equilibria of Organic Reactions; Wiley: New York, 1963.
(75) Chapman, N. B.; Shorter, J. Correlation Analysis in Chemistry; Plenum Press: New York, 1978.

8 – Supplementary information 73
8 – Supplementary information
8.1 Characterization catalyst 1
Figure S8.1. 1H-NMR and 1H,1H-COSY NMR spectrum of 1.
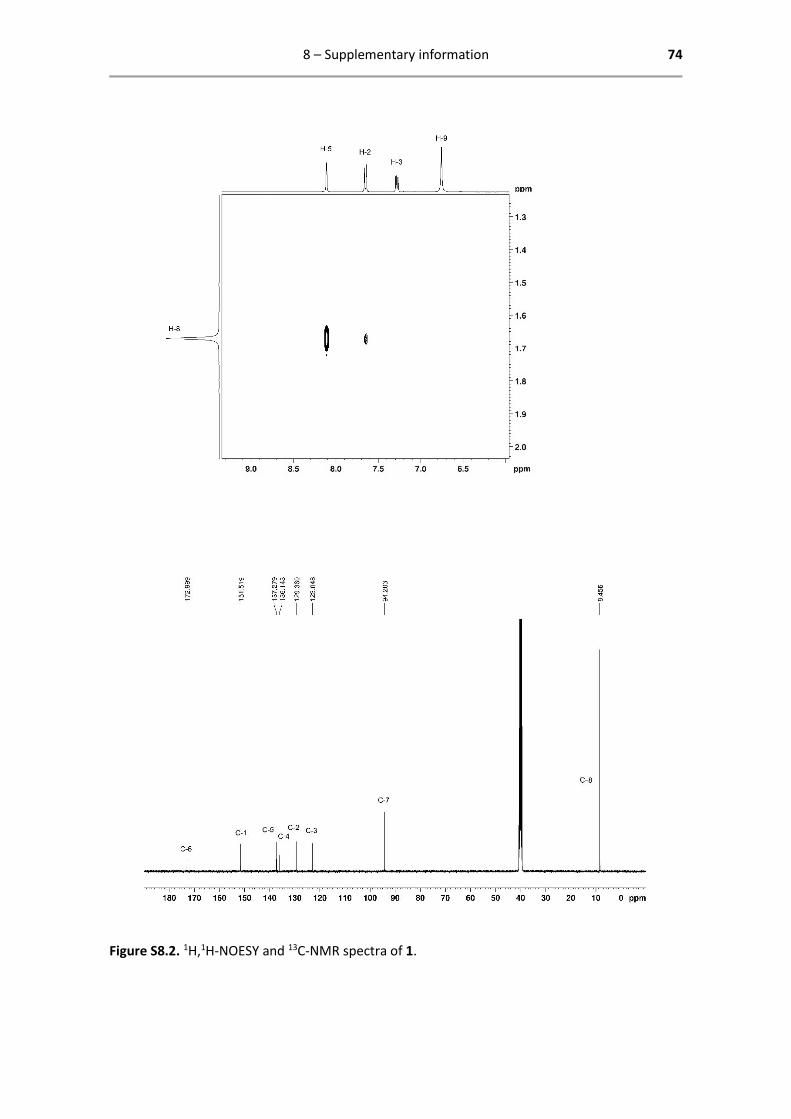
8 – Supplementary information 74
Figure S8.2. 1H,1H-NOESY and 13C-NMR spectra of 1.
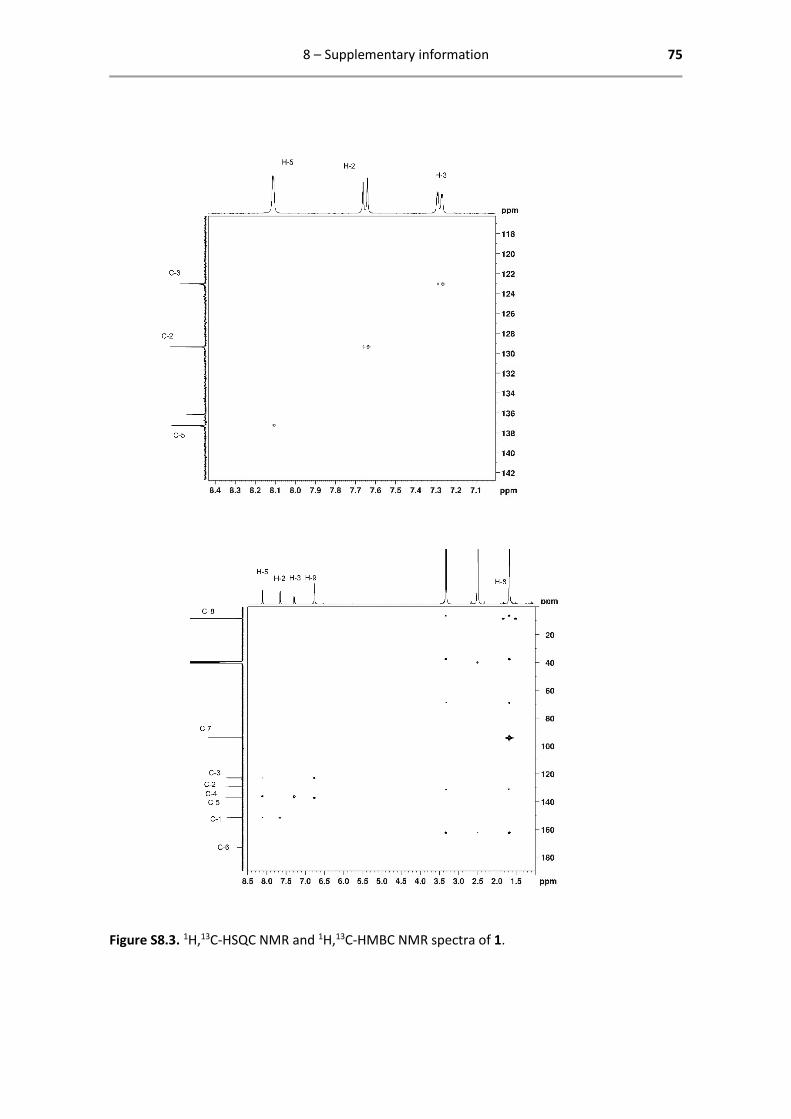
8 – Supplementary information 75
Figure S8.3. 1H,13C-HSQC NMR and 1H,13C-HMBC NMR spectra of 1.
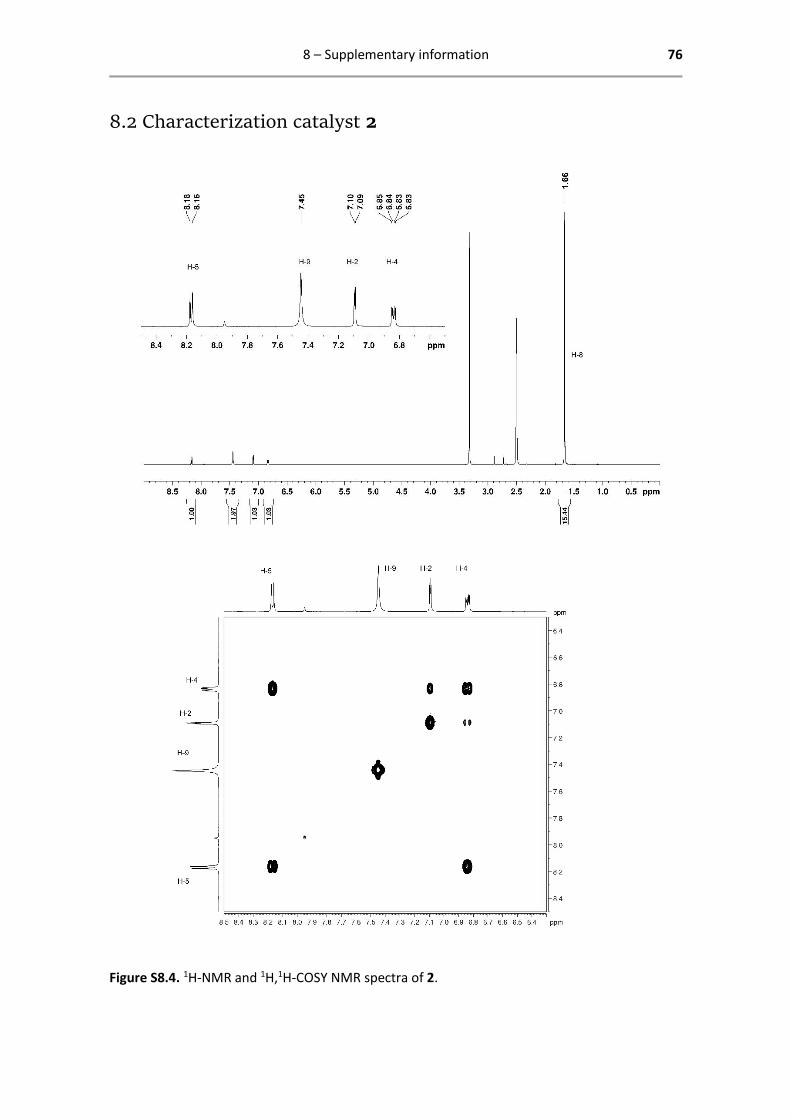
8 – Supplementary information 76
8.2 Characterization catalyst 2
Figure S8.4. 1H-NMR and 1H,1H-COSY NMR spectra of 2.
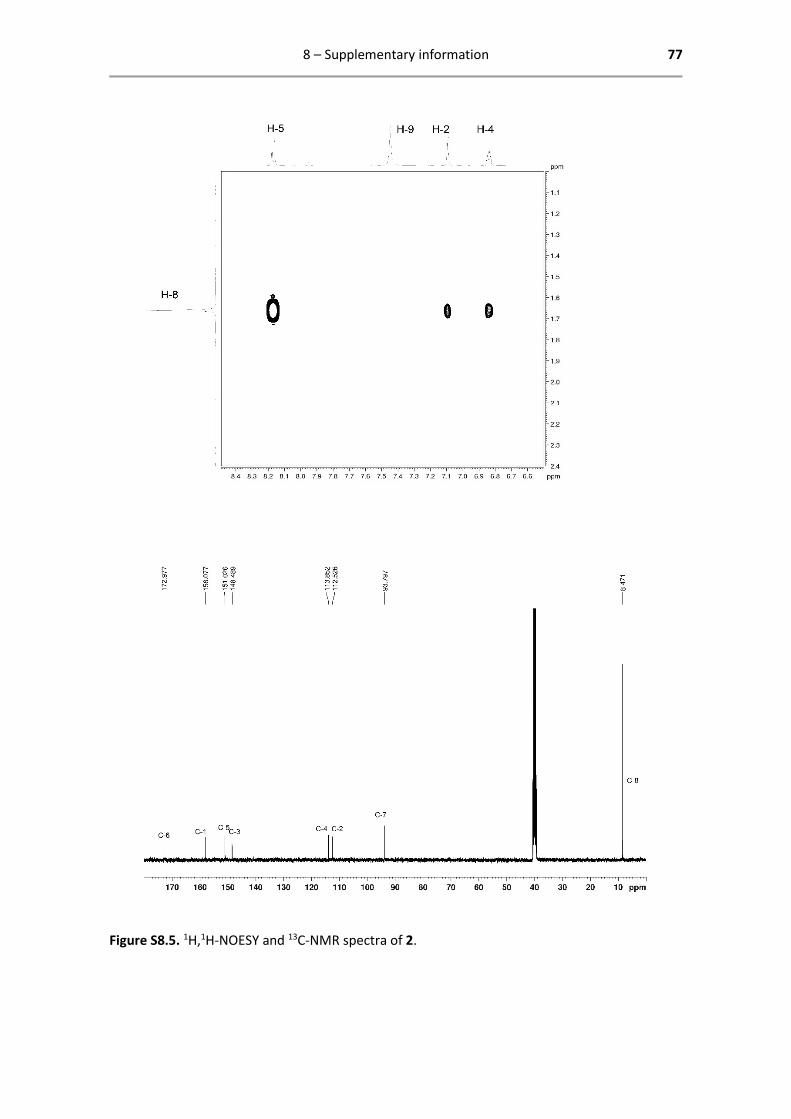
8 – Supplementary information 77
Figure S8.5. 1H,1H-NOESY and 13C-NMR spectra of 2.
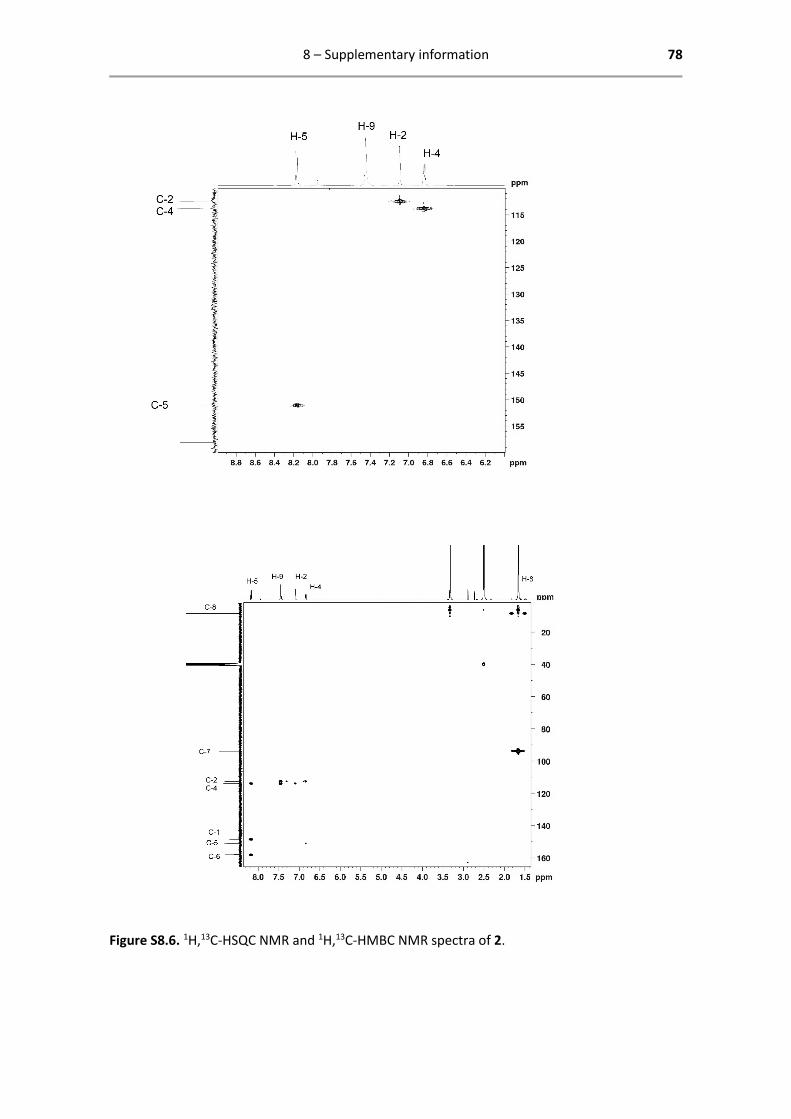
8 – Supplementary information 78
Figure S8.6. 1H,13C-HSQC NMR and 1H,13C-HMBC NMR spectra of 2.
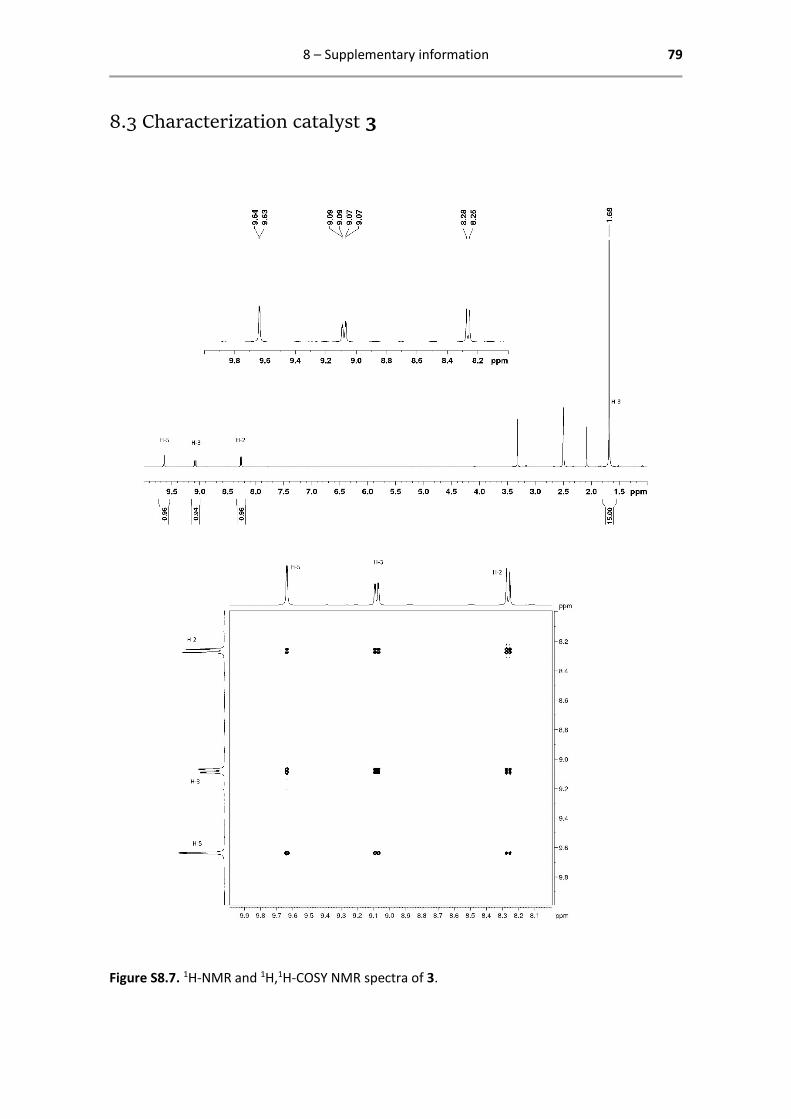
8 – Supplementary information 79
8.3 Characterization catalyst 3
Figure S8.7. 1H-NMR and 1H,1H-COSY NMR spectra of 3.

8 – Supplementary information 80
Figure S8.8. 1H,1H-NOESY and 13C-NMR spectra of 3.
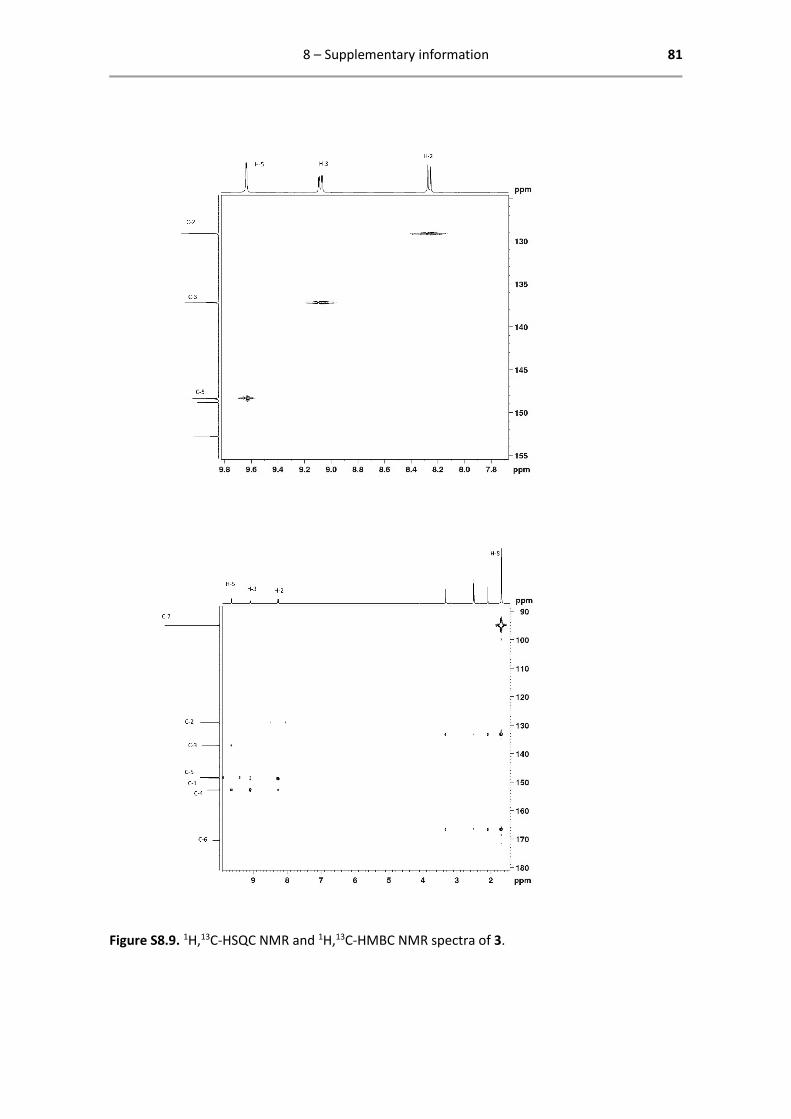
8 – Supplementary information 81
Figure S8.9. 1H,13C-HSQC NMR and 1H,13C-HMBC NMR spectra of 3.
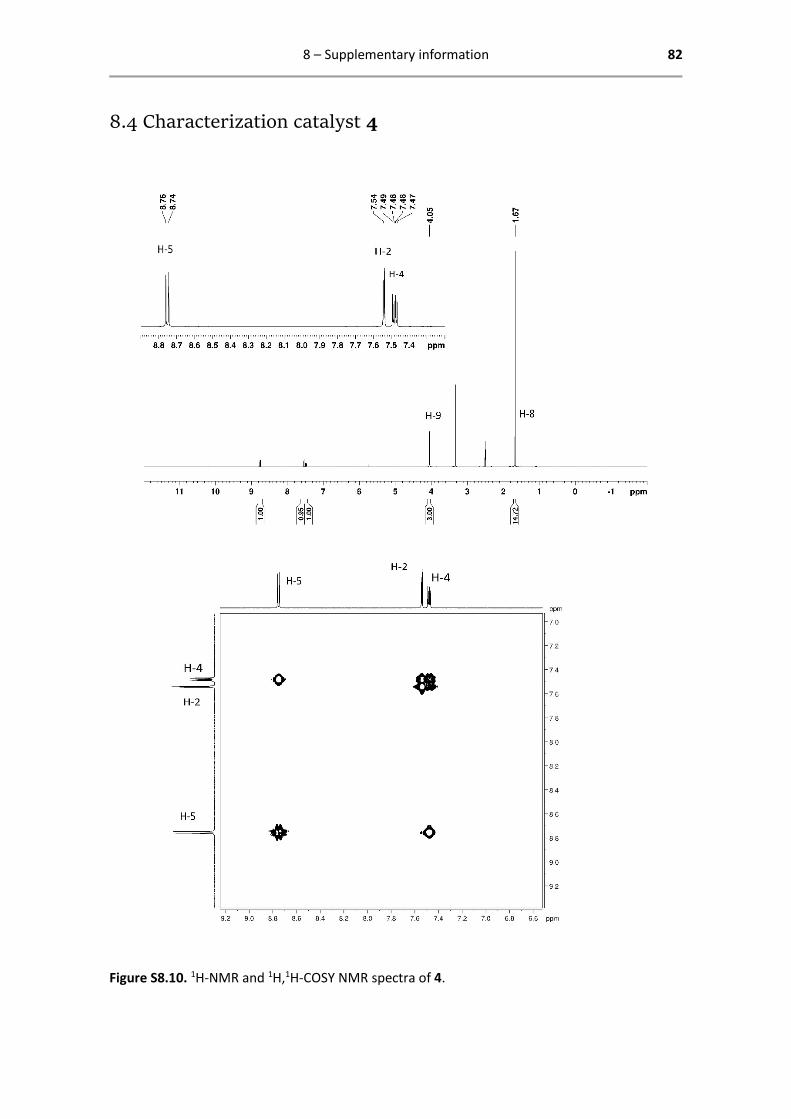
8 – Supplementary information 82
8.4 Characterization catalyst 4
Figure S8.10. 1H-NMR and 1H,1H-COSY NMR spectra of 4.
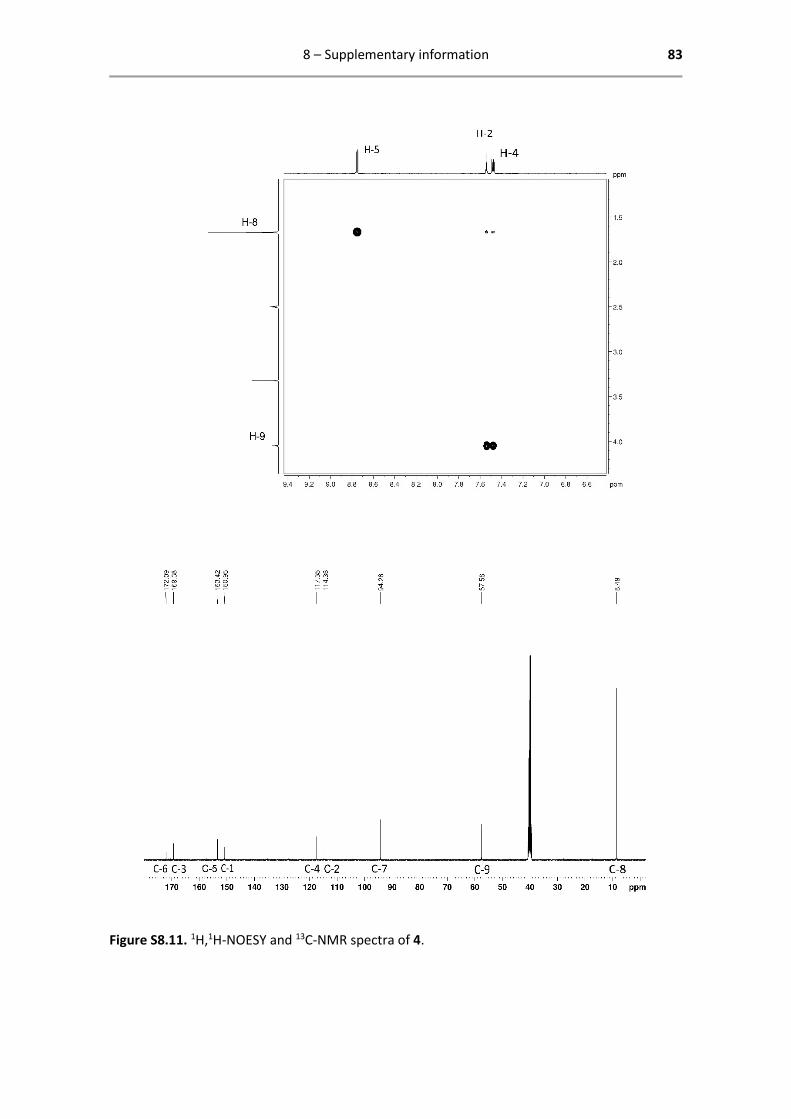
8 – Supplementary information 83
Figure S8.11. 1H,1H-NOESY and 13C-NMR spectra of 4.
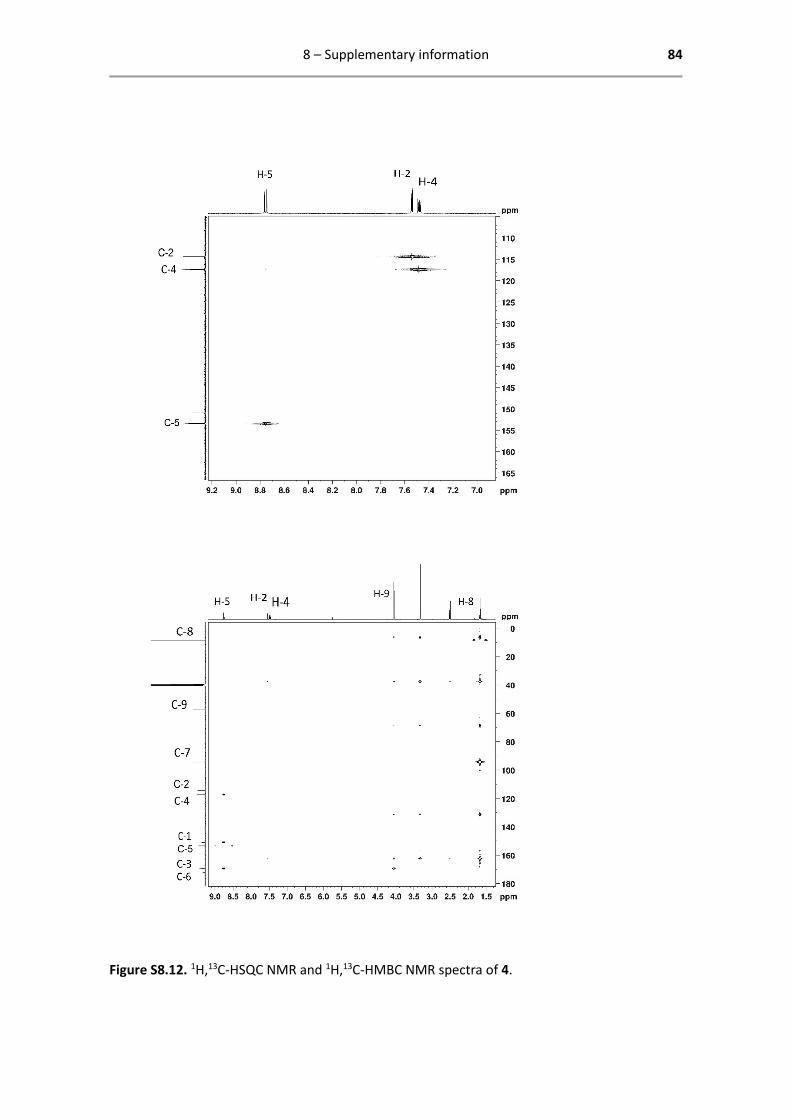
8 – Supplementary information 84
Figure S8.12. 1H,13C-HSQC NMR and 1H,13C-HMBC NMR spectra of 4.

8 – Supplementary information 85
8.5 Characterization catalyst 5
Figure S8.13. 1H-NMR and 1H,1H-COSY NMR spectra of 5.
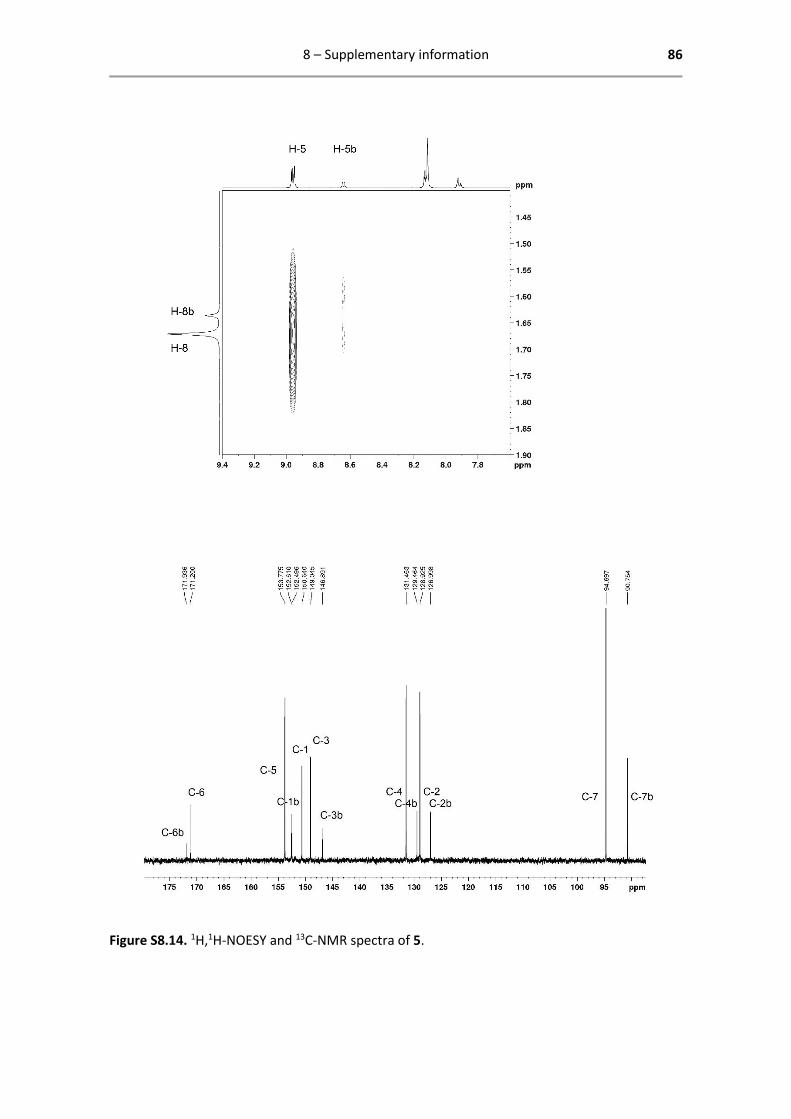
8 – Supplementary information 86
Figure S8.14. 1H,1H-NOESY and 13C-NMR spectra of 5.

8 – Supplementary information 87
Figure S8.15. 1H,13C-HSQC NMR and 1H,13C-HMBC NMR spectra of 5.
8 – Supplementary information 88
8.6 Synthetic considerations
Science is not only a story of success. It might be useful to prevent researchers from repeating
failed experiments and trying synthetic routes that are new as far as they know, but were actually
already tried and proved to be unsuccessful. To this end, some learning points are described
below, for me personally and for researchers that intend to reproduce the synthetic routes
followed in this work.
Ir is more azophilic than oxophilic, so to prevent chelate coordination of the amino-substituted
ligands (of catalysts 1 and 3) with both N-atoms (instead of with the carboxylate-moiety), KOH
was added to the ligand solution prior to addition of the ligand solution to the solution of 7.
The usually successful synthetic method for coordinating the substituted pic ligand to the Ir centre
made use of MeOH as solvent and the reaction mixture was stirred for no longer than 2 h. This
synthesis was successful for 3, but for 4 a reaction time of 22 h was needed. 5 also gave a high
yield with this elongated reaction time, but 3 slightly different products were observed by NMR.
The two minor species, present in 24 % and 10 % respectively, were most likely the same complex,
but with MeO- and H2O coordinating to Ir instead of NO3. Catalysis was performed with this
mixture of products anyway, because in the water oxidation reaction conditions, the equilibrium
between these species will lie to the side of water as coordinated 6-position ligand. The synthesis
of the other complexes proved more difficult. The synthesis of 1 was tried with MeOH, DCM and
ACN as solvents. Neither by reacting the dimer 6, instead of 7, with the ligand, the desired product
was obtained. Finally, the right conditions were found to be ACN with an elongated reaction time.
Also 2 was only successfully synthesized with ACN instead of MeOH as solvent and with a longer
reaction time. Attempts were made at the synthesis of Cp*Ir(3-NH2-pic)(NO3), but an astonishing
diversity of products was observed by NMR, when using MeOH as well as ACN and DCM as
solvents. Neither a reaction time of 21 h yielded the right product. This could be due to the vicinity
of the amine group to the carboxylic moiety, facilitating multiple chelate-fashion coordination
possibilities. Crystallization was not a successful purification method and because of time
constraints the synthesis was intermitted.
In many synthetic attempts, the initial dissolution of the ligand posed issues, in MeOH as well as
in ACN and DCM. Addition of a concentrated solution of KOH in MeOH or water was not always
sufficient and neither were sonication and heating of the suspension. Initiating the synthesis

8 – Supplementary information 89
nonetheless, by adding the catalyst solution to this suspension, quickly caused dissolution of the
suspended starting material. Probably the equilibrium between insoluble and soluble ligand
shifted because of consumption of free ligand. The catalyst solution was in all cases added to the
ligand solution and not vice versa, to prevent a high metal:ligand ratio which could lead to
formation of bi- or polymetallic species.

8 – Supplementary information 90
8.7 Poster for poster presentation ISOC 2017

8 – Supplementary information 91


![Supplementary Content S1Supplementary Content S1 Isoform-selective thiazolo[5,4-b]pyridine S1P1 agonists possessing acyclic amino carboxylate head-groups ... 8b 2 0.0005 0.0003 115](https://img.dokumen.tips/doc/110x75/5f6a4eb069c3af5c8f212b07/supplementary-content-s1-supplementary-content-s1-isoform-selective-thiazolo54-bpyridine.jpg)