Embed Size (px)
Citation preview
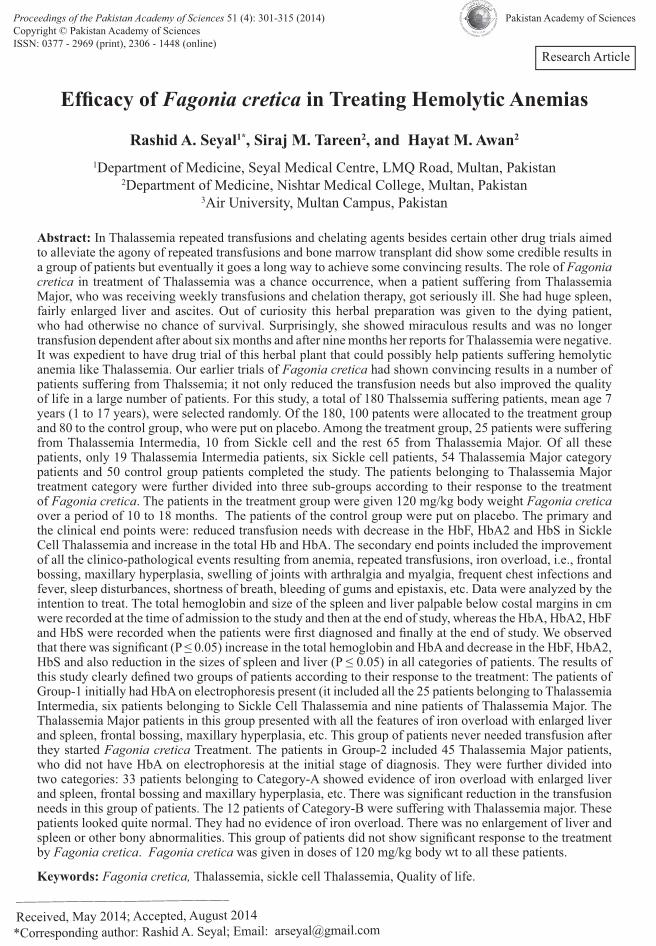
Research Article
————————————————Received, May 2014; Accepted, August 2014*Corresponding author: Rashid A. Seyal; Email: [email protected]
Proceedings of the Pakistan Academy of Sciences 51 (4): 301-315 (2014) Pakistan Academy of SciencesCopyright © Pakistan Academy of SciencesISSN: 0377 - 2969 (print), 2306 - 1448 (online)
Fagonia cretica1* 2 2
1Department of Medicine, Seyal Medical Centre, LMQ Road, Multan, Pakistan2Department of Medicine, Nishtar Medical College, Multan, Pakistan
3Air University, Multan Campus, Pakistan
In Thalassemia repeated transfusions and chelating agents besides certain other drug trials aimed to alleviate the agony of repeated transfusions and bone marrow transplant did show some credible results in a group of patients but eventually it goes a long way to achieve some convincing results. The role of Fagoniacretica in treatment of Thalassemia was a chance occurrence, when a patient suffering from Thalassemia Major, who was receiving weekly transfusions and chelation therapy, got seriously ill. She had huge spleen, fairly enlarged liver and ascites. Out of curiosity this herbal preparation was given to the dying patient, who had otherwise no chance of survival. Surprisingly, she showed miraculous results and was no longer transfusion dependent after about six months and after nine months her reports for Thalassemia were negative. It was expedient to have drug trial of this herbal plant that could possibly help patients suffering hemolytic anemia like Thalassemia. Our earlier trials of Fagonia cretica had shown convincing results in a number of patients suffering from Thalssemia; it not only reduced the transfusion needs but also improved the quality of life in a large number of patients. For this study, a total of 180 Thalssemia suffering patients, mean age 7 years (1 to 17 years), were selected randomly. Of the 180, 100 patents were allocated to the treatment group and 80 to the control group, who were put on placebo. Among the treatment group, 25 patients were suffering from Thalassemia Intermedia, 10 from Sickle cell and the rest 65 from Thalassemia Major. Of all these patients, only 19 Thalassemia Intermedia patients, six Sickle cell patients, 54 Thalassemia Major category patients and 50 control group patients completed the study. The patients belonging to Thalassemia Major treatment category were further divided into three sub-groups according to their response to the treatment of Fagonia cretica. The patients in the treatment group were given 120 mg/kg body weight Fagonia creticaover a period of 10 to 18 months. The patients of the control group were put on placebo. The primary and the clinical end points were: reduced transfusion needs with decrease in the HbF, HbA2 and HbS in Sickle Cell Thalassemia and increase in the total Hb and HbA. The secondary end points included the improvement of all the clinico-pathological events resulting from anemia, repeated transfusions, iron overload, i.e., frontal bossing, maxillary hyperplasia, swelling of joints with arthralgia and myalgia, frequent chest infections and fever, sleep disturbances, shortness of breath, bleeding of gums and epistaxis, etc. Data were analyzed by the intention to treat. The total hemoglobin and size of the spleen and liver palpable below costal margins in cm were recorded at the time of admission to the study and then at the end of study, whereas the HbA, HbA2, HbF
Group-1 initially had HbA on electrophoresis present (it included all the 25 patients belonging to Thalassemia Intermedia, six patients belonging to Sickle Cell Thalassemia and nine patients of Thalassemia Major. The Thalassemia Major patients in this group presented with all the features of iron overload with enlarged liver and spleen, frontal bossing, maxillary hyperplasia, etc. This group of patients never needed transfusion after they started Fagonia cretica Treatment. The patients in Group-2 included 45 Thalassemia Major patients, who did not have HbA on electrophoresis at the initial stage of diagnosis. They were further divided into two categories: 33 patients belonging to Category-A showed evidence of iron overload with enlarged liver
needs in this group of patients. The 12 patients of Category-B were suffering with Thalassemia major. These patients looked quite normal. They had no evidence of iron overload. There was no enlargement of liver and
by Fagonia cretica. Fagonia cretica was given in doses of 120 mg/kg body wt to all these patients.
Fagonia cretica, Thalassemia, sickle cell Thalassemia, Quality of life.

302 Rashid A. Seyal et al
Hemolytic anemias present a real challenge in the treatment. These anemias are usually caused, when the lifespan of the red cells is shortened either due to genetically determined defects involving the structure or metabolism of the membrane,
involving the main metabolic pathways or it may be acquired as immune (iso- or auto) or non- immune like trauma, membrane defects, drugs and chemicals, bacterial or parasitic infections and due to hyper-spleenism. This results in reduced circulating red cell mass, which leads to relative tissue hypoxia that eventuates in many clinical manifestations [1, 2].
we further elucidate the role of dried aerial partsof Fagonia creticahemolytic anemias particularly Thalassemia Syndrome and Sickle Cell Thalassemia. Local medical practitioners use Fagonia cretica fortreating a wide variety of ailments, including different malignant conditions [4]. This substance is well tolerated and does not exhibit adverse effects like vomiting, diarrhea or alopecia, which are common side effects of standard cytotoxic therapy [4]. To the authors’ best knowledge this is the second of the series of our study that elucidates the genetic mutation activity in thalassemia. Herein, we have shown that dried aerial parts of Fagoniacretica is able to induce genetic mutation and increase the percentage of HbA, while reducing the HbF, HbA2 and HbS, besides exerting a substantial effect on primary Erythropoiesis. The sickle-cell anemia is another common hemolytic disorder often associated with Thalssemia [1, 2].The clinical features of a sickling disorder are found in association with a peripheral blood picture
-thalassemia red-cell changes, i.e., a low MCH and MCV. In the more secure forms of sickle-cell thalassemia there may be an elevated reticulocyte count, and sickled red cells are found
+-thalassemia shows hemoglobin
S together with 10 to 30 % hemoglobin A and an elevated hemoglobin A2 value [1, 2]. In sickle-cell B-thalassemia the hemoglobin consists mainly of hemoglobin S with an elevated level of hemoglobin F and A2 to be absolutely certain about the diagnosis it is necessary to examine the parents; one should have the sickle-cell trait and the other
During the last couple of years it has become clear that Thalassemia is extremely heterogeneous and that its clinical picture can result from the interaction of many different genetic defects , which result from a reduced rate of production of one or more of the globins chain (s) of hemoglobin [7-17]. Because Thalassemia occurs in populations in which structural hemoglobin carriers are common, it is not at all unusual for an individual to receive a Thalassemia gene from one parent and a gene for a structural hemoglobin variant from the other. These different interactions produce an extremely complex and clinically diverse series of genetic disorders, which range in severity from death in utero to extremely mild, symptomless, hypochronmic anemia and perhaps quite divide response to the treatment in different patients [18-22].
Convincing results of the herbal plant treatment
collected from mid February to mid May, besides providing congenial atmosphere while drying the plant under shade. Its aqueous extract gives satisfactory results, but is not palatable because of its bitter taste.
The roles of Fagonia cretica in different malignant conditions have already been described [3, 4, 20, 21] but our observations in hemolytic anemias present a new epoch of research in Thalassemia and the like conditions. There are quite a few chemical ingredients in Fagoniacretica , like Saponin-1 and Saponin-2, besides it contains beta-sitosterol; ceryl-alcohol; chivonic acid; water soluble Saponin, i.e., glucose rhamose; xylose; arabinose; fagogenine and lipids 0.3-1.14%: Campesterol; aglycone; fagonine; oleonolic acid; betulic acid the later four are derived from
303
Saponin fraction (18-20). However, it is not clear exactly which of the particular ingredient alone or in combination is effective against different clinical conditions [20-22].
A total of 180 patients were picked randomly from the Dr A.Q. Khan Thalassemia Research Center, Multan, Pakistan. Among them, 100 patents were allocated to the treatment group and 80 to the control group, who were put on placebo. Clinical
different categories was arranged according to Kazazian [11]. In all the patients, the detection of HbA, F A2 and S was done on high performance liquid chromatography (HPLC).
Among the treatment group, 25 patients were suffering from Thalassemia Intermedia, 10 patents from Sickle cell and the rest 65 belonged to Thalassemia Major Category; but only 19 in Thalassemia Intermedia, 6 in Sickle cell, 54 in Thalassemia Major Category, and 50 in control group completed the study. The patients belonging to Thalassemia Major Treatment category were divided into three groups according to their response to the treatment of Fagonia cretica. The patients picked for the study belonged to the following three categories: (i) Thalassemia Major; (ii) Thalassemia Intermedia; and (iii) Sickle Cell Thalassemia.
The Thalassemia Major patientswere further divided into three groups according to their response to the treatment particularly the transfusion needs.
Group-1. Included nine patients, who never needed transfusion after they started the Fagonia cretica treatment.
Group-2. Included 33 patients, who showed
Group-3. Included 12 patients, whose transfusion needs did not quite changed.
: The data collected for the computation of
after 10 to 18 months of Fagonia cretica treatment,
during which no blood was given to these patients.
: The data collected for the computation
to 18 months of Fagonia cretica treatment, during
reduced.
: The data collected for the computation
to 18 months of Fagonia cretica treatment, during which blood transfusions needs did not change
patients was delayed as much as possible to avoid possible overlay of the donor’s blood. This period was six to eight weeks after the last transfusion.
The patients belonging to Thalassemia Intermedia and Sickle Cell Thalassemia never needed transfusion after they started using Fagoniacretica.
The patients belonging to Group-1, 2 and 3 of Thalassemia Major were studied for the HbF,
hemoglobin, size of the spleen and liver (at the time of admission to the study), and similar observations were made in all the patients belonging to Intermedia
for HbS at the end of study, i.e., 10 to 18 months after the treatment had started.
The paired t-test was used for the comparison of means to see the effect of the treatment of Fagoniacretica on various parameters of Thalassemia.
.
Clinical investigations of nine patients of Thalassemia major included total hemoglobin, the size of spleen and liver palpable below costal margin measured at the start of the study and again at the end of study (Table 1), whereas the values for HbA, HbF and HbA2 were
These patients were given herbal medicine for 7 to 18 months and it was observed that they were no

304 Rashid A. Seyal et al
longer in need of any blood transfusion.
The mean values of different parameters are listed
various factors of blood tests and sizes of the liver/
1.79 to 4.28 g/dL (P<0.01). The mean hemoglobin content in patients before treatment was 6.59 g/dL whereas after a period of 7-18 months treatment of the Fagonia cretica (no need of blood transfusion)
Hb A before the treatment was 5.18% and 29.44% after treatment and the minimum improvement is above 13% (P<0.01), whereas the reduction in HbF was from 8.69% to 52.51% (P<.0.01). The HbA2
<0.01). The value before treatment was 2.85 and reduced to 2.19 after
the treatment. The mean values for spleen before and after treatment were 5.25 cm and 0.50 cm and the reduction to size of spleen is 2.07 cm to 7.42 cm (P<
to 4.60 cm (P<0.05). The mean values of the size of the liver before and after the start of treatment were 2.50 cm and 0.00 cm, respectively.
In this group there were 33 patients. The Interval between the two transfusions increased from 10±3 days to 60±10 days (Electrophoresis after treatment was done just before the subsequent transfusion after about 50-70 days).
Their total hemoglobin, the size of spleen and
. Group-1 Patients of Thalassemia Major: No transfusion was needed after Fagonia cretica treatment was started; follow up period varied from 10 to 18 months.
2
8 M 5.5 6.6 15.0 22.3 2 1.5 83.0 76.2 3 0 6 2
14 M 5.5 6.8 12.7 18.2 1.7 1.0 85.6 79.8 6 0 12 2
7.5 M 6.5 10.9 0 17.4 3.3 2.1 96.7 80.5 0 0 2 0
3.0 M 6.9 09.1 3.7 23.8 3.1 2.6 93.2 73.6 3 0 6 0
3 ¼ M 7.2 10.4 0 32.0 3.6 3.2 96.4 64.8 6 0 8 0
3 ¼ M 8.2 14.1 4.2 28.6 3.2 3.0 92.6 69.4 0 0 0
2 F 4.5 9.1 0 26.0 4.2 2.8 95.8 71.2 2 0 4 0
17 M 7.8 10.1 11.0 62.7 2.0 1.1 87.0 36.2 0 0 4 0
14 F 7.2 9.5 - 34 2.6 2.4 97.4 - 0 0 0
HbA2, HbF) and at the time of entry into the study (for Total Hb, size of the liver and spleen) and at end of the study for all parameters: There was no need of transfusion in this group of patients soon after starting the Fagonia cretica treatment.
Hb (g/dL) 6.59 9.62 1.79-4.28
HbA2 (%) 2.85 2.19 0.34-0.99
HbA (%) 5.18 29.44 13.35-35.19
HbF (%) 91.9 61.30 8.69-52.51
Spleen, cm below coastal margin 5.25 0.50 2.07-7.42
Liver, cm below coastal margin 2.50 0.00 0.40-4.60

305
(Electrophoresis after treatment done just before the next transfusion, i.e., 60±10 days after the last transfusion).
2
6 M 7.6 9.4 - 42 3.5 3.2 96.5 54.8 6—8 2--25 F 6.8 8.8 - 53 3.4 3.3 96.6 43.7 3—7 0---27 F 5.6 8.6 - 54 3.4 3.1 96.6 42.9 4—11 2--43 M 8.2 9.8 - 63 3.2 3.2 96.8 34.8 6—10 2--36 M 6.8 9.8 - 45 4.8 3.2 95.2 51.8 5—8 2--25 M 8.2 10.2 - 34 3.8 3.2 96.2 62.8 5—8 2--35 M 6.8 9.3 - 47 3.4 3.4 96.6 49.6 4—11 2--56 F 7.6 8.4 - 52 3.3 3.3 96.7 44.7 2—9 0--36 F 8.4 8.8 - 34 3.5 3.4 96.5 62.6 6—9 2--43 M 9.2 9.4 - 41 3.1 3.1 96.9 55.9 5—8 2--37 F 7.5 8.9 - 42 3.2 3.3 96.8 54.7 6—9 2--33 M 9.2 9.8 - 36 3.5 3.2 96.5 60.8 4—9 0--25 F 8.2 10.2 - 38 3.4 3.2 96.6 58.8 4—9 2--34 M 9 10.2 - 38.6 3.4 3.2 96.6 58.2 5---11 2---46 F 8.4 8.8 - 37 3.6 3.3 96.4 58.7 4—8 2--211 M 10.2 11.2 - 41 3.4 3.5 96.6 55.5 6---9 2---412 F 8.5 9.8 - 36 3.4 3.3 96.6 59.7 6--11 0--33 M 9.5 9.8 - 41 3.6 3.2 96.4 55.8 0----0 0---07 F 7.8 10.8 - 36 3.2 3.1 96.8 60.9 6—14 2--65 M 4.6 7.4 - 28 3.8 3.2 96.2 68.8 4---6 0--24 F 5.8 8.5 - 34 5.7 3.2 94.3 63.8 0—5 0--04 M 6.8 10.8 - 41 4.6 3.5 95.4 55.5 0—4 0--04 M 7.4 9.8 - 45 3.4 3.2 96.6 51.8 0—6 0--22 F 3.6 7.4 - 36 3.2 3.2 96.8 60.8 0--0 0--01 M 4.6 7.7 - 28 4.6 3.4 95.4 68.6 0—0 0--02 M 7.8 7.8 - 22 6.8 3.6 93.2 74.4 2—2 4--25 M 5.8 7.5 - 22 3.6 3.4 96.4 74.6 4—2 6--23 M 6.8 9.7 - 36 3.8 3.2 96.2 60.8 5—2 6---24 F 6.5 8.6 - 26 3.8 3.2 96.2 70.8 4--2 8--32 M 4.5 6.8 - 22 6.6 4.3 93.4 73.7 0—0 0--01 M 5.8 7.5 - 16 8.3 5.6 91.7 78.4 0—0 0--06 F 9.4 9.6 - 28 4.4 3.2 95.6 68.8 4—8 0--24 M 6.8 9.2 - 24 3.6 3.5 96.4 74.5 3—5 0---2
liver below costal margin were measured at the start of the study and again at the end of study (Table 3), whereas the initial reports for HbF, HbA2,
diagnosed and again at the end of study.
The mean values of different parameters are
1.45 g/dL to 2.22 g/dL (P<0.05). The mean values for hemoglobin before and after the treatment were 7.26 g/dL and 9.10 g/dL respectively. The HbA also
<0.05).
The respective values for HbA were 0.00% and
the mean values for HbF before and after treatment were 95.99% and 59.76%, respectively. The HbF was reduced from 32.36% to 40% (P<0.05). The average values for HbA2 were 4.01% and 3.38% before and after treatment, respectively, and the reduction was from 0.32 to 0.94 (P<0.05). The liver
2.66 cm (P<0.05). The mean values of the size of the liver before and after the start of treatment were

306 Rashid A. Seyal et al
3.42 and 1.58 cm, respectively. The mean values for spleen before and after treatment were 6.00 and 2.15 cm and the reduction to size of spleen was 2.79 cm to 4.91 cm (P<
There were 12 patients in Group-3. In these
the interval between the two transfusions, even after eighteen months of treatment (Electrophoresis after treatment done just before the next transfusion, i.e., 40±6 days after the last transfusion)
Their total hemoglobin, the size of spleen and liver below costal margin were measured at the start of the study and again at the end of study (Table 5); whereas HbF, HbA2, HbA, HBS were
and then at the end of the study.
The mean values of different parameters are
0.95 g/dL to 1.58 g/dL (P<.05). The mean values for hemoglobin before and after the treatment were 6.27 g/dL and 7.54 g/dL, respectively. The HbA also
<0.05).
HbA2, HbF) and at the time of entry into the study (for Total Hb, size of the liver and spleen) and at end of
Hb (g/dL) 7.26 9.10 1.45-2.22
HbA2 (%) 4.01 3.38 0.32-0.94
HbA (%) 0.00 36.93 33.23-40.62
HbF (%) 95.99 59.76 32.36-40.11
Liver, cm below costal margin 3.42 1.58 1.04-2.66
Spleen, cm below costal margin 6.00 2.15 2.79-4.91
Group-3 Patients in Thalassemia Major: Various parameters selected were the same as in the previ-ous studies. This Group of patient did not respond to the treatment, i.e., transfusion needs remained almost the same. (Electrophoresis after the treatment done just before the next transfusion,i.e., 40±6 days after the last transfusion).
2
15 F 6.5 7.8 - 32 64 3.5 3.2 96.5 32.8 -/2 -/-
11 M 7.2 7.9 - 28 54 3.6 3.2 96.4 42.8 2/3 -/-
15 M 4.6 5.8 - 34 62 3.2 3.2 96.8 34.8 -/- -/-
16 F 5.8 7.6 - 28 42 3.8 3.1 96.2 54.9 -/2 -/-
14 M 6.5 7.8 - 28 34 3.2 3.2 96.8 62.8 -/- -/-
17 M 7.2 8.1 - 29 28 3.6 3.1 96.4 68.9 -/- -/-
15 M 5.4 7.6 - 32 35 3.3 3.1 96.7 61.9 2/4 -/-
13 M 6.4 8.2 - 35 42 3.5 3.2 96.5 54.8 3/4 -/-
8 M 5.8 7.2 - 28 36 5.6 3.2 94.5 60.8 4/5 2/2
15 M 6.3 7.4 - 25 42 3.2 3.1 96.8 54.9 -/- -/-
16 M 7.8 8.2 - 32 32 3.5 3.2 96.5 64.8 -/- -/-
13 M 5.8 6.9 - 35 42 4.8 3.2 95.2 54.8 -/- -/-

307
The respective these values for HbA were 0.00%
the mean values for HbF before and after treatment were 96.28% and 54.08%, respectively. The HbF was reduced from 34.75% to 49.63% (P<0.05). The average values for HbA2 were 3.73% and 3.17% before and after treatment, respectively and the reduction was from 0.11% to 1.02% (P<0.05). The size of the liver reduced in the range of 0.03 cm to 1.47 cm (P<0.05). The mean values of the size of liver
before and after the start of medicine are 0.92 cm and 0.17 cm, respectively. The mean values for spleen before and after treatment were 1.67 cm and 0.17 cm and the reduction to size of spleen was 0.43 cm to 2.57 cm (P<
Thalassemia Intermedia is invariably recognized by infrequent blood transfusions with usually enlarged spleen.
HbA2, HbF) and at the time of entry into the study (for Total Hb, size of the liver and spleen) and at end of the study for all the parameters for the patients not responding to the treatment.
Hb (g/dL) 6.27 7.54 0.95-1.58
HbA2 (%) 3.73 3.17 0.11-1.02
HbA (%) 0.00 42.75 35.41-50.09
HbF (%) 96.28 54.08 34.75-49.63
Liver, cm below costal margin 0.92 0.17 0.03-1.47
Spleen, cm below costal margin 1.67 0.17 0.43-2.57
Thalassemia Intermedia (no transfusion was required after the Fagonia cretica treatment was started. Follow up period varied from 10 to 18 months).
2
14 M 9.4 12.5 34.0 43 6.5 3.6 59.5 53.4 6 219 F 8.7 12.8 44.0 58 5.8 3.4 59.2 38.6 4 -
18 F 8.8 13.2 41.0 64 3.4 3.2 55.6 32.8 5 2
16 M 7.8 11.8 38.0 78 3.2 3.1 58.8 18.9 - -
21 F 8.2 12.4 28.0 67 3.4 3.3 68.6 29.7 5 2
14 M 9.2 13.4 31.0 66 5.4 3.2 63.6 30.8 5 -
16 M 10.4 14.2 44.0 67 4.3 3.1 51.7 29.9 4 1
24 M 11 13.0 34.0 45 3.6 3.3 62.4 51.7 - -
16 F 7.8 11.4 32.0 54 3.2 3.2 64.8 42.8 3 -
14 M 8.4 11.6 41.0 68 3.2 3.1 55.8 28.9 5 2
12 M 9.5 12.6 38.6 64 3.8 3.1 57.6 32.9 4 1
14 F 11 12.8 36.4 71 6.2 3.1 57.4 25.9 3 2
23 F 7.9 11.8 42.5 82 4.5 3.2 53.0 18.8 5 -
22 F 8.4 13.2 28.5 78.2 3.6 3.1 67.9 18.6 4 2
16 M 9.4 12.8 32.8 82.5 3.6 3.4 63.6 14.1 6 2
15 F 8.8 10.8 41.2 78.4 3.8 3.2 55.0 18.4 - -
11 F 9.2 12.6 38.4 78.8 3.5 2.8 58.1 18.4 4 2
14 M 11 12.6 42.0 81.4 3.2 3.2 54.8 15.4 2 -
11 F 8.0 11.0 26.0

308 Rashid A. Seyal et al
The response to the treatment with Fagoniacretica in Thalassemia Intermedia patient in termsof their total hemoglobin, and the size of spleen palpable below costal margin were measured at the start of the study and again at the end of study (Table 7), whereas the values for HbF, HbA2, HbA, were
then at the end of study No transfusion was needed after the treatment of Fagonia cretica started. This follow up period varied from 10 to 18 months.
The mean values of different parameters are
from 2.89 g/dL to 3.84 g/dL (P<0.05). The mean values for hemoglobin before and after the treatment were 9.16 g/dL and 12.53 g/dL, respectively. The
(P<0.05). The respective these values for HbA were 37.08% and 68.13% before and after the
and after treatment were 59.30% and 28.89% respectively. The HbF was reduced from 24.46% to 36.36% (P<0.05). The average values for HbA2
were 4.12% and 3.20% before and after treatment, respectively, and the reduction was from 0.40% to 1.44% (P<0.05). The mean values for spleen before and after treatment were 3.61 cm and 1.00 cm and the reduction to size of spleen is 1.83 cm to 3.40 cm (P<
The total hemoglobin, and the size of spleen below costal margin were measured at the start of the study and again at the end of study, whereas the values for HbF, HbS, HbA2, HbA, were had initially from
from 1.92 g/dL to 5.18 g/dL (P<.0.05). The mean values of different parameters are listed in Table 10. The mean values for hemoglobin before and after the treatment were 7.78 g/dL and 11.33 g/dL
from 25% to 33% (P<0.05). The respective these values for HbA were 7.66% and 36.50% before and
before and after treatment were 33.50 and 16.16,
HbA2, HbF) and at the time of entry into the study (for Total Hb, size of the liver and spleen) and at end of the study, for the Intermedia Patients.
Hb (g/dL) 9.16 12.53 2.89-3.84
HbA2 (%) 4.12 3.20 0.40-1.44
HbA (%) 37.08 68.13 24.94-37.17
HbF (%) 59.30 28.89 24.46-36.36
Spleen, cm below costal margin 3.61 1.00 1.83-3.40
Sickle Cell Thalassemia: No transfusion was required after the Fagonia cretica Treatment was started.) Follow up period varied from 7 to 18 months.
2
11 M 7.8 8.8 - 24 3.6 3.3 34 21 62.4 51.7 6 4
27 M 5.6 9.4 - 32 3.4 3.4 28 8 68.6 57.6 9 5
22 F 8.2 11.6 - 28 3.4 3.3 38 17 58.6 51.7 7 5
15 M 7.2 13.1 12 38 3.5 3.4 42 21 57.5 37.6 3 2
16 M 9.2 12.8 22 52 3.6 3.4 24 12 50.4 32.6 9 2
17 M 8.7 12.3 12 45 3.7 3.2 35 18 49.3 33.8 6 -
309
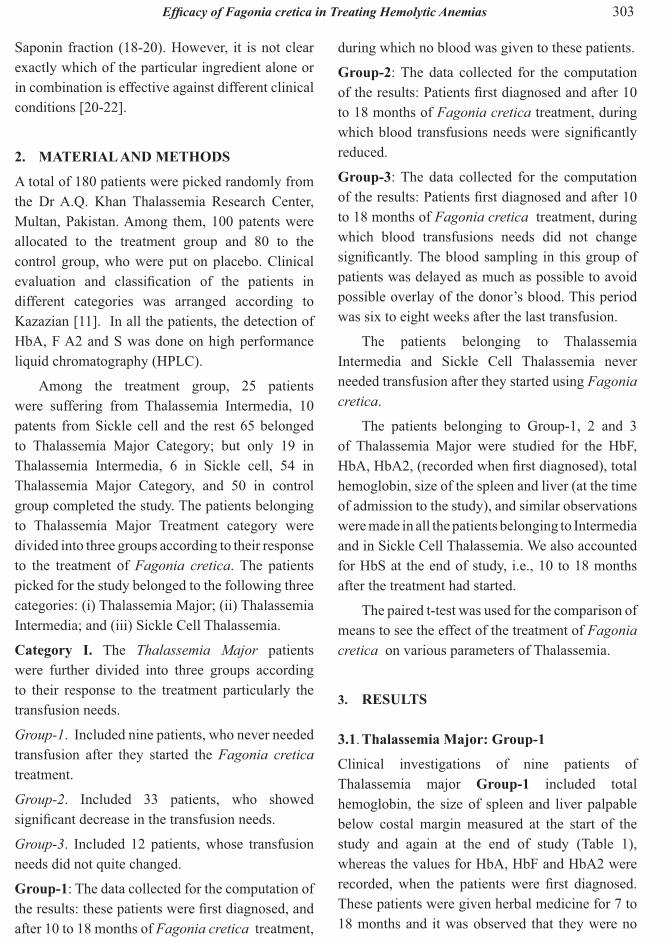
Mean and standard deviation of different parameters, in Sickle Cell Thalassemia, selected at the
the liver and spleen) and at end of the study.
Hb (g/dL) 7.78 11.33 1.92-5.18
HbS (%) 57.80 44.17 8.47-18.80
HbA2 (%) 3.53 3.33 0.01-0.39
HbA (%) 7.66 36.50 25.17-32.49
HbF (%) 33.50 16.16 13.10-21.57
Spleen, cm below costal margin 6.66 3.00 1.12-6.20
respectively. The HbF was reduced from 13.10 to 21.57% (P<0.05). The average values for HbA2 were 3.53% and 3.33% before and after treatment, respectively and the reduction was from 0.01% to 0.39% (P<the range of 8.47% to 18.80% (P<0.05). The mean values of HBS before and after the start of medicine were 57.80% and 44.17%, respectively. The mean values for spleen before and after treatment were 6.66 cm and 3.00 cm and the reduction to size of spleen is 1.12 cm to 6.20 cm (P<0.05) which was
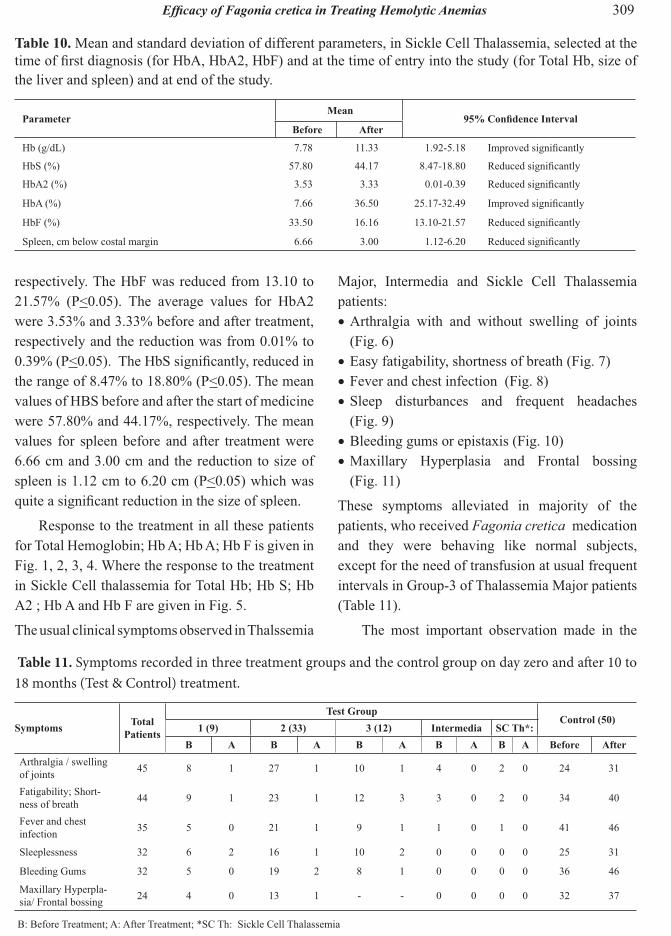
Response to the treatment in all these patients for Total Hemoglobin; Hb A; Hb A; Hb F is given in
in Sickle Cell thalassemia for Total Hb; Hb S; Hb A2 ; Hb A and Hb F are given in Fig. 5.
The usual clinical symptoms observed in Thalssemia
Table 11. Symptoms recorded in three treatment groups and the control group on day zero and after 10 to 18 months (Test & Control) treatment.
B B B B BArthralgia / swelling of joints 45 8 1 27 1 10 1 4 0 2 0 24 31
Fatigability; Short-ness of breath 44 9 1 23 1 12 3 3 0 2 0 34 40
Fever and chest infection 35 5 0 21 1 9 1 1 0 1 0 41 46
Sleeplessness 32 6 2 16 1 10 2 0 0 0 0 25 31
Bleeding Gums 32 5 0 19 2 8 1 0 0 0 0 36 46
Maxillary Hyperpla-sia/ Frontal bossing 24 4 0 13 1 - - 0 0 0 0 32 37
B: Before Treatment; A: After Treatment; *SC Th: Sickle Cell Thalassemia
Major, Intermedia and Sickle Cell Thalassemia patients:
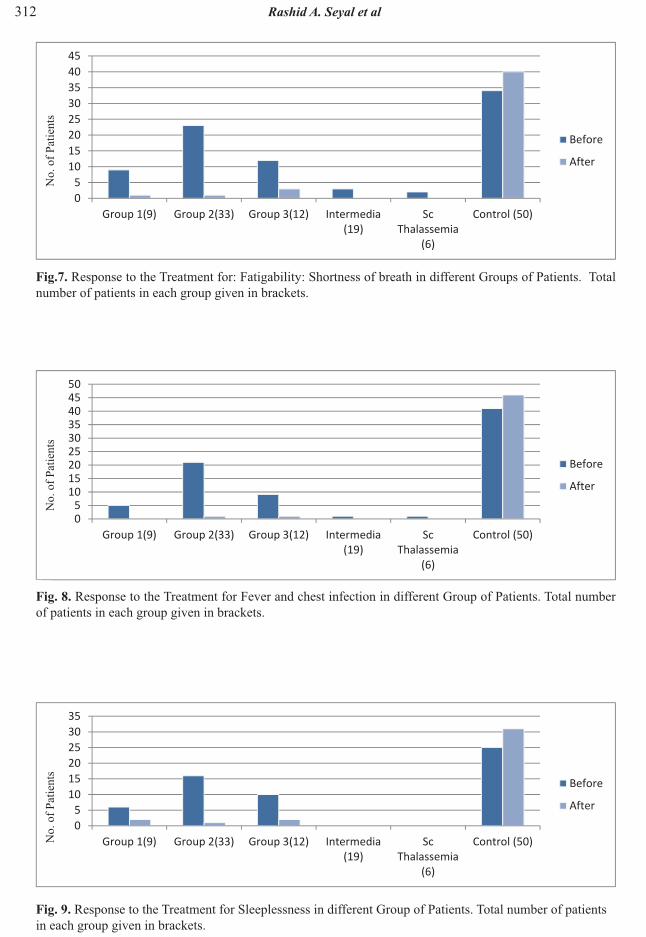
Arthralgia with and without swelling of joints (Fig. 6)Easy fatigability, shortness of breath (Fig. 7)Fever and chest infection (Fig. 8)Sleep disturbances and frequent headaches (Fig. 9)Bleeding gums or epistaxis (Fig. 10)Maxillary Hyperplasia and Frontal bossing (Fig. 11)
These symptoms alleviated in majority of the patients, who received Fagonia cretica medication and they were behaving like normal subjects, except for the need of transfusion at usual frequent intervals in Group-3 of Thalassemia Major patients (Table 11).
The most important observation made in the
310 Rashid A. Seyal et al
Total hemoglobin response to Fagonia cretica treatment in different groups of patients Number of pa-tients for each group given in brackets
HbA2 in response to Fagonia cretica treatment in different groups of patients. The number of patients for each group is given in brackets.
HbA in response to Fagonia cretica treatment in different groups of patients. The number of patients for each group given in brackets.
Hem
oglo
bin
(g/d
L)H
emog
lobi
n A
2(%)
Hem
oglo
bin
A(%
)

311
Response to the Treatment for Arthralgia with swelling of joints in different Groups of Patients. Total number of patients in each group given in brackets.
No.
of P
atie
nts
HbF in response to Fagonia cretica treatment in different groups of patients. The number of patients for each group given in brackets.
HbF
(%)
Sickle Cell Thalassemia: Response of different parameters: Total Hb, HbS, HbA2, HbA, HbF to Fagonia cretica treatment: There was no need of Transfusion soon after the treatment in this group.
(%)
Hb (g/dL)
HbF(%)
HbA(%)
HbA2(%)
HbS(%)
312 Rashid A. Seyal et al
Response to the Treatment for: Fatigability: Shortness of breath in different Groups of Patients. Total number of patients in each group given in brackets.
Response to the Treatment for Sleeplessness in different Group of Patients. Total number of patients in each group given in brackets.
Response to the Treatment for Fever and chest infection in different Group of Patients. Total number of patients in each group given in brackets.
No.
of P
atie
nts
No.
of P
atie
nts
No.
of P
atie
nts
313
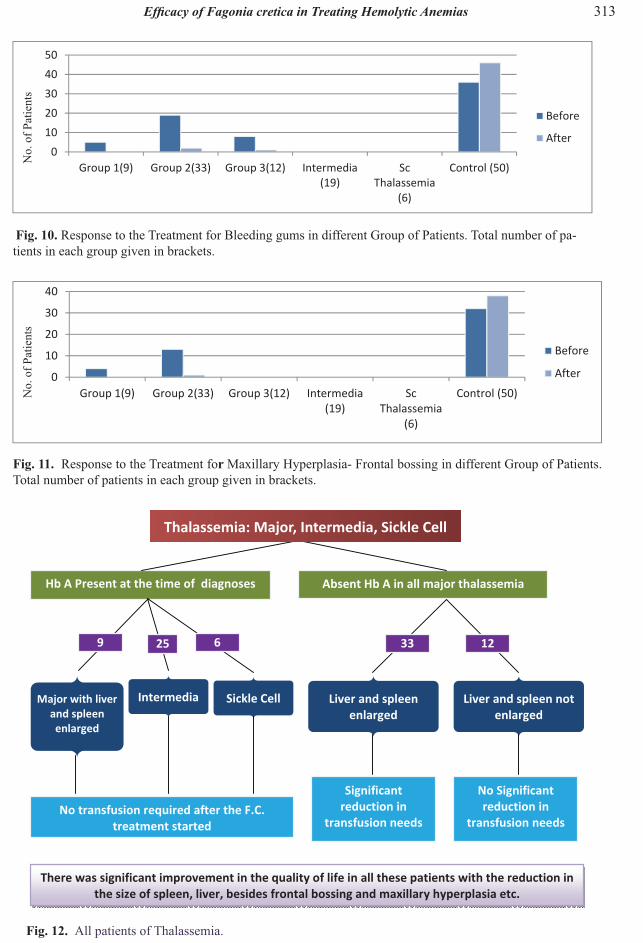
All patients of Thalassemia.
Response to the Treatment fo Maxillary Hyperplasia- Frontal bossing in different Group of Patients. Total number of patients in each group given in brackets.
Response to the Treatment for Bleeding gums in different Group of Patients. Total number of pa-tients in each group given in brackets.
No.
of P
atie
nts
No.
of P
atie
nts
Thalassemia: Major, Intermedia, Sickle Cell
314 Rashid A. Seyal et al
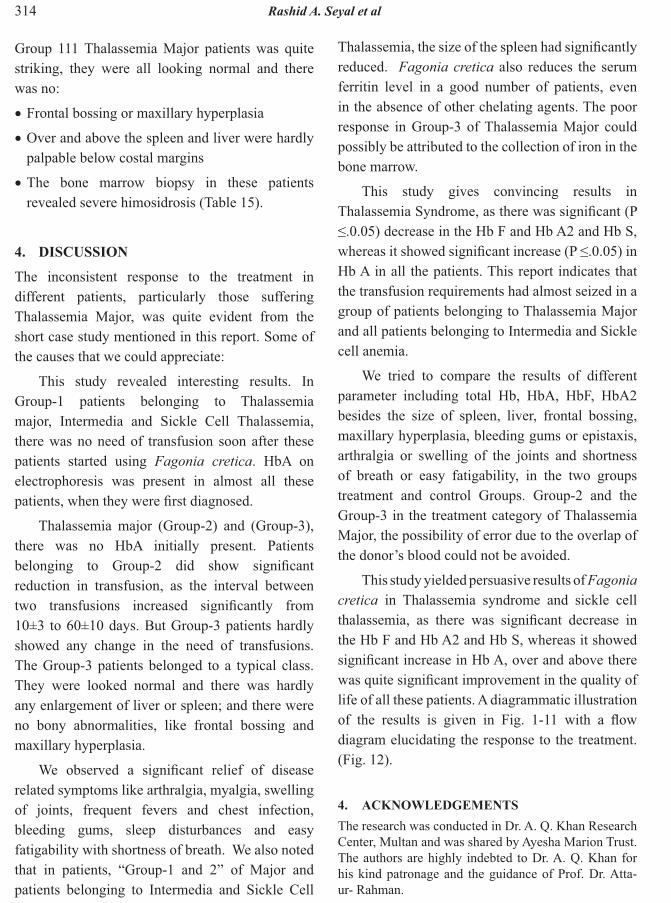
Group 111 Thalassemia Major patients was quite striking, they were all looking normal and there was no:
Frontal bossing or maxillary hyperplasia
Over and above the spleen and liver were hardly palpable below costal margins
The bone marrow biopsy in these patients revealed severe himosidrosis (Table 15).
The inconsistent response to the treatment in different patients, particularly those suffering Thalassemia Major, was quite evident from the short case study mentioned in this report. Some of the causes that we could appreciate:
This study revealed interesting results. In Group-1 patients belonging to Thalassemia major, Intermedia and Sickle Cell Thalassemia, there was no need of transfusion soon after these patients started using Fagonia cretica. HbA on electrophoresis was present in almost all these
Thalassemia major (Group-2) and (Group-3), there was no HbA initially present. Patients
reduction in transfusion, as the interval between
10±3 to 60±10 days. But Group-3 patients hardly showed any change in the need of transfusions. The Group-3 patients belonged to a typical class. They were looked normal and there was hardly any enlargement of liver or spleen; and there were no bony abnormalities, like frontal bossing and maxillary hyperplasia.
related symptoms like arthralgia, myalgia, swelling of joints, frequent fevers and chest infection, bleeding gums, sleep disturbances and easy
that in patients, “Group-1 and 2” of Major and patients belonging to Intermedia and Sickle Cell
reduced. Fagonia cretica also reduces the serum ferritin level in a good number of patients, even in the absence of other chelating agents. The poor response in Group-3 of Thalassemia Major could possibly be attributed to the collection of iron in the bone marrow.
This study gives convincing results in
Hb A in all the patients. This report indicates that the transfusion requirements had almost seized in a group of patients belonging to Thalassemia Major and all patients belonging to Intermedia and Sickle cell anemia.
parameter including total Hb, HbA, HbF, HbA2 besides the size of spleen, liver, frontal bossing, maxillary hyperplasia, bleeding gums or epistaxis, arthralgia or swelling of the joints and shortness of breath or easy fatigability, in the two groups treatment and control Groups. Group-2 and the Group-3 in the treatment category of Thalassemia Major, the possibility of error due to the overlap of the donor’s blood could not be avoided.
This study yielded persuasive results of Fagoniacretica in Thalassemia syndrome and sickle cell
the Hb F and Hb A2 and Hb S, whereas it showed
life of all these patients. A diagrammatic illustration
diagram elucidating the response to the treatment. (Fig. 12).
The research was conducted in Dr. A. Q. Khan Research Center, Multan and was shared by Ayesha Marion Trust. The authors are highly indebted to Dr. A. Q. Khan for his kind patronage and the guidance of Prof. Dr. Atta-ur- Rahman.
315
1. Erslev, A.J. Anemia in chronic disease. In: Williams Hematology, E. Bentler, M.A. Lichtman, B.S. Coller & T.J. Kipps (Ed.). McGraw-Hill, New York (1994).
2. Lee. G.R.. The anemia of chronic disease. Seminarsin Hematology 37: 61-80 (1983).
3. Seyal, A.R., H.M. Awan & S.M. Tareen. Can we really treat thalassemia major? Proceedings of the Pakistan Academy of Sciences 50(4): 315-325 (2013)
aqueous extract of Fagonia cretica induces DNA damage, cell cycle arrest and apoptosis in breast cancer cells via FOXO3a and p53 expression. Public Library of Scienc- One (PLOS One) 7(6):1-11 (2012).
5. Fathallah, H. & G.F. Atweh. Induction of fetal hemoglobin in the treatment of Sickle Cell disease. Hematology (American Society of Hematological Education Program), p. 58-62 (2006).
6. Esposito, G., M. Grosso, E. Gottardi, P. Izzo, C. Camaschella & F. Salvatore. A unique origin for the
and its rapid diagnostic characterization by PCR analysis. Human Genetics 93: 691-693 (1994).
7. Bunn, H.F. and Forget, B.G. Hemoglobin:Molecular, Genetic and Clinical Aspects. Saunders,Philadelphia, USA (1986).
8. Drayna, D. Founder mutations. 78: 60-63 (October 2005).
OrphanetJournal of Rare Diseases
10. Kattamis A.C., C. Camaschella, P. Sivera, S. Surrey & P. Fprtoma. Human-thalassemia syndromes: Detection of molecular defects. American Journalof Hematology 53: 81-91 (1996).
11. Kazazian, H.H. The Thalassemia syndromes: Molecular basis and prenatal diagnosis. Seminars in Hematology 27: 209-228 (1990).
12. Grosso, M., R. Sessa, S. Puzone, M.R. Storino & P. Izzo. Molecular basis of Thalassemia, In: Anemia
Causes. Dipartimento di Biochimica e Biotecnologie Mediche, University of Naples, Federico II, Italy, p. 341-360 (2012).
Majerus & H. Varmus. The Molecular Basis ofBlood Diseases, 2nd ed. Saunders, Philadelphia, USA (1994).
14. Ansari, A.A. Isolation and Characterization of Chemical Constituents of Cretical. PhD Thesis,HEJ Research Institute of Chemistry, University ofKarachi, Karachi, Pakistan (1983).
Fagonia creticacomplex. Biochemical Systematics and Ecology 16:57-58 (1988).
16. Ansari, A.A., L. Kenne, & Atta-ur-Rahman. Isolation and characterization of two saponins from Fagonia cretica. Phytochemistry 26: 1487-1490 (1987).
17. Chopra R.M., K.L. Handa, L.D. Kapur & I.C. Chopra. Indigenous Drugs of India, 2nd ed. Academic Publisher, New Delhi, India, 507 pp. (1982).
18. Chopra, R.N, S.L. Nayar & I.C. Chopra. Glossary of Indian Medicinal Plants. CSIR, New Delhi, India,116 pp. (1956).
19. Helleday, T, E. Petermann, G. Lundin, B. Hodgson & R.A. Sharma. DNA repair pathways as targets for cancer therapy. Nature Reviews Cancer 8: 193-204 (2008).
20. Harash, M.L., G.R. Purohit, C.S. Mathur & T.N. Nag. Nutritive value of dried terrestrial plants growing in Rajasthan - Chemical composition. ComparativePhysiology and Ecology 6: 30-32 (1981).
21. Saeed, M.A. Hamdard Pharmacopoeia of Eastern Medicine. Hamdard Academy, Karachi, Pakistan, p.41-43 (1969).
22. Saleh, N.A.M., M.N. El-Hadidi, & S.A.M. Al-
Fagonia species. Bull. Liaison-Groupe Polyphenols14: 46-49 (1988).