Embed Size (px)
Citation preview

V
Journal of Agricultural Sciences (Tarim Bilimleri Dergisi) 2021, 27 (2) : 155 - 163 DOI: 10.15832/ankutbd.605018
Journal of Agricultural Sciences (Tarim Bilimleri Dergisi)
J Agr Sci-Tarim Bili e-ISSN: 2148-9297
jas.ankara.edu.tr
Effects of Scalding Parameters and Ripening
on the Chemical, Textural and Microstructural Properties of Urfa Cheese
Ahmet Ferit ATASOYa* , Mehmet ÇİÇEKa , Huriye Gözde CEYLANb , Ali Adnan HAYALOGLUc
aFaculty of Engineering, Department of Food Engineering, Harran University, 63010 Sanlıurfa, TURKEY
bFaculty of Engineering, Department of Food Engineering, Adıyaman University, 02040 Adıyaman, TURKEY
cFaculty of Engineering, Department of Food Engineering, Inonu University, 442840 Malatya, TURKEY
ARTICLE INFO Research Article
Corresponding Author: Ahmet Ferit ATASOY, E-mail: [email protected]
Received: 10 August 2019 / Revised: 06 November 2019 / Accepted: 16 December 2019 / Online: 31 May 2021
ABSTRACT The objectives of this study were to determine the effect of cheese
scalding temperature, scalding time, and ripening time on the chemical,
textural and microstructural properties of ovine milk Urfa cheese. Dry
salted fresh cheeses were scalded in whey at 70 °C, 80 °C, and 90 °C for
5 and 10 minutes and ripened for 90 days, respectively. Scalding
temperature significantly affected fat in dry matter and salt in dry matter
(P<0.05), total solids and nitrogen, hardness, cohesiveness, gumminess,
and chewiness (P<0.001). Scalding time significantly affected total
nitrogen and gumminess (P<0.05), total solids, and hardness (P<0.001).
Ripening time significantly affected chemical, textural and color
properties of ovine milk Urfa cheese (P<0.001), except fat in dry matter
(P<0.05). The color properties of Urfa cheese were not significantly
affected by the scalding temperature and time (P>0.05). Besides, scalding
treatments have improved the microstructure of ovine milk Urfa cheeses.
Urfa cheese exhibited a more compact, coarser, and uniform structure
with increasing scalding temperature and time. As a result, scalding
treatments and ripening on the chemical, textural and microstructural
characteristics of Urfa cheeses were substantially effective.
Keywords: Urfa cheese; Scalding; Ripening; Microstructure; Texture
© Ankara University, Faculty of Agriculture
1. Introduction
Textural features are an expression of the rheological properties of the physical structure of food. Cheese quality and identity are
largely dependent on textural properties. Cheese texture is very important on consumer acceptability and the end-use of the
cheese (Hort & Le Grys 2001; Alinovi et al. 2018). Furthermore, there is a relationship between the microstructure and
rheological properties of the cheese, and both are influenced by the chemical cheese composition (El Bakry & Sheehan 2014).
On the other hand, numerous reactions take place during the ripening of cheese. It is known that the texture of the cheese is
extensively affected by the chemical composition of cheese, cheese production, and biochemical changes during the ripening
(Tomaszewska et al. 2019).
Urfa cheese is a traditional semi-hard brined Turkish cheese variety, which is manufactured mainly in the southeast Anatolia
region of Turkey from raw bovine milk or mixtures of ovine and caprine milk. However, the industrial Urfa cheese has been
made from cow’s milk, because of the very short lactation period of ewe’s and goat’s milk in Turkey. Urfa cheese is consumed
fresh and/or mature. The unripened Urfa cheese is only used for the production of traditional cheese dessert products, such as
“cheese helva”, “cheese bread”, and “kadayif” (Atasoy et al. 2013). Urfa cheese is produced without milk pasteurization and
starter bacteria, and cheese microflora consists of indigenous microorganisms obtained from raw milk or transmitted from the
environment. The presence of natural microorganisms provides the cheese with unique characteristics and cheeses made from
raw milk are preferred by consumers (Atasoy et al. 2008; Kırmacı 2016). The microbial safety of Urfa cheese is supplied by dry
salting technology by the manual spreading of salt onto the cheese surface. Alternatively, scalding of fresh cheese blocks in
boiling whey is an alternative practical way of reducing microbial counts in Urfa cheese. Although there is no standard scalding
temperature and time in the traditional Urfa cheese production, general scalding temperature and time are applied as 65-90 °C
and about 5-10 minutes, respectively. These methods have different effects on natural microflora and also chemical, textural,
and microstructural properties during storage. Following scalding and/or dry salting, Urfa cheese is ripened in brine.
Although numerous studies on the microstructural and textural characteristics of many cheese varieties were conducted,
studies on the microstructural and textural characteristics of Urfa cheese are limited (Özer et al. 2003). As far as we know, no
study has been conducted on the color characteristics of Urfa cheese up to now. Moreover, any study investigated the effect of

Atasoy et al. - Journal of Agricultural Sciences (Tarım Bilimleri Dergisi), 2021, 27(2): 155-163
156
scalding time on the properties of Urfa cheese was not encountered. The objective of this study was to investigate the effects of
scalding temperature, scalding time, and ripening time on the color, chemical, textural and microstructural properties of Urfa
cheese made from raw ewe milk.
2. Material and Methods
2.1. Materials
Ewe milk used in cheese production was obtained from Şanlıurfa province. The commercial rennet (Surer, Konya, Turkey) was
used to coagulate the milk.
2.2. Cheesemaking and sampling
Fresh dry salted and scalded cheeses were designated as A5 (scalded at 70 °C for 5 min), A10 (scalded at 70 °C for 10 min), B5
(scalded at 80 °C for 5 min), B10 (scalded at 80 °C for 10 min), C5 (scalded at 90 °C for 5 min) and C10 (scalded at 90 °C for
10 min). Cheese production is carried out according to Atasoy et al. (2013) by the traditional method. The flow diagram of
experimental Urfa cheeses is demonstrated in Figure 1. The Urfa cheese production was replicated 2 times on different days.
From each batch, 1, 30, 60, and 90-day old cheese were sampled and analyzed. Each batch consisted of four cheese blocks (each
block contained approximately 250 g of cheese).
Figure 1- Flow chart of traditional Urfa cheese production
2.3. Cheese analyses
The titratable acidity, total solids, and salt analyses were carried out according to Turkish Standards (1989). The IDF (1993)
method for total nitrogen was used. pH was measured by pH meter (Hanna, HI 2215). The fat analysis was performed with the
Gerber method according to Turkish Standards (TS 1978).
Texture profile analyses were performed using Texture Analyzer Model LF Plus (Lloyd Instruments Ltd., Hampshire, UK).
Color values were determined using the Hunter Lab instrument (color Quest XE, UK). Lightness, redness, yellowness values of
samples were measured according to the CIE system and the ΔE value of samples was calculated.
Microstructures of samples were determined as described by Hayaloglu et al. (2014). Images were monitored with a scanning
electron microscope (LEO, EVO 40 Model, Carl Zeiss SMT, Oberkochen, Germany) at 20 kV.
Atasoy et al. - Journal of Agricultural Sciences (Tarım Bilimleri Dergisi), 2021, 27(2): 155-163
157
2.4. Statistical analyses
Results were performed by analysis of variance using the Minitab version 16 packet statistic programs. The differences between
the samples were determined by Tukey’s test.
3. Results and Discussion
3.1. Chemical composition
The effects of scalding parameters and ripening time on the chemical compositions of Urfa cheese are presented in Table 1 and
the chemical compositions of the Urfa cheese samples during ripening are demonstrated in Table 2. Total solid contents of the
samples were significantly (P<0.001) affected by scalding temperature, scalding time, and ripening time. Also, the effects of
scalding temperature (P<0.001), scalding time (P<0.05) on total nitrogen contents were found to be significant. Also, the total
solid and total nitrogen contents of Urfa cheese were significantly increased with increasing scalding temperature and time. This
is likely to be due to whey expulsion during scalding treatments. Kahyaoglu & Kaya (2003) stated that heat treatment applied to
curds reduced the moisture content of Gaziantep cheese. Similar results have been reported by Tunick et al. (1993) for Mozzarella
cheeses. Moreover, total solids and total nitrogen contents of Urfa cheese were significantly decreased during ripening. Changes
in total solids can be attributed to the breakdown of peptide bonds and new ionic groups. These decreases may be due to the
transition of the soluble nitrogen fractions into the brine during cheese storage. Further losses are referred to as hydrolysis of
caseins by proteolytic enzymes to lower molecular weight compounds (Grappin & Beuvier 1997) and scattering of water-soluble
nitrogen into the brine (Prasad & Alvarez 1999). Previous studies (Atasoy & Türkoğlu 2008) showed that total nitrogen and
solid contents of Urfa cheese declined during storage.
While the effect of ripening time on pH and titratable acidity of Urfa cheeses were found to be significant (P<0.001), the
effects of scalding parameters were insignificant (P>0.05). Also, titratable acidity and pH values of Urfa cheese decreased and
increased (P<0.05), respectively, until the 30th day of ripening. However, no any change was found during the rest of the storage
period. These can be explained by the continued fermentation during the maturation, completed by the end of the first month.
Additionally, the decrease in titratable acidity may be due to the assimilation of lactic acid and the production of ammonia
(Kırmacı et al. 2014). These results are in agreement with those of Atasoy & Türkoğlu (2008) for Urfa cheese.
Fat in dry matter contents of Urfa cheese was significantly affected by scalding temperature, and ripening time (P<0.05). In
particular, the C5 sample was found to have lower fat content than others. A group of researchers (Ozer et al. 2004) have reported
that scalded Urfa cheeses contained higher fat than unscalded ones. Furthermore, fat contents (as dry matter) of B10, C5, and
C10 samples decreased (P<0.05) during the first 30 days of ripening and remained almost constant after this day. Sahingil et al.
(2014) reported that fat contents in dry matter of white cheeses depended on the ripening time.
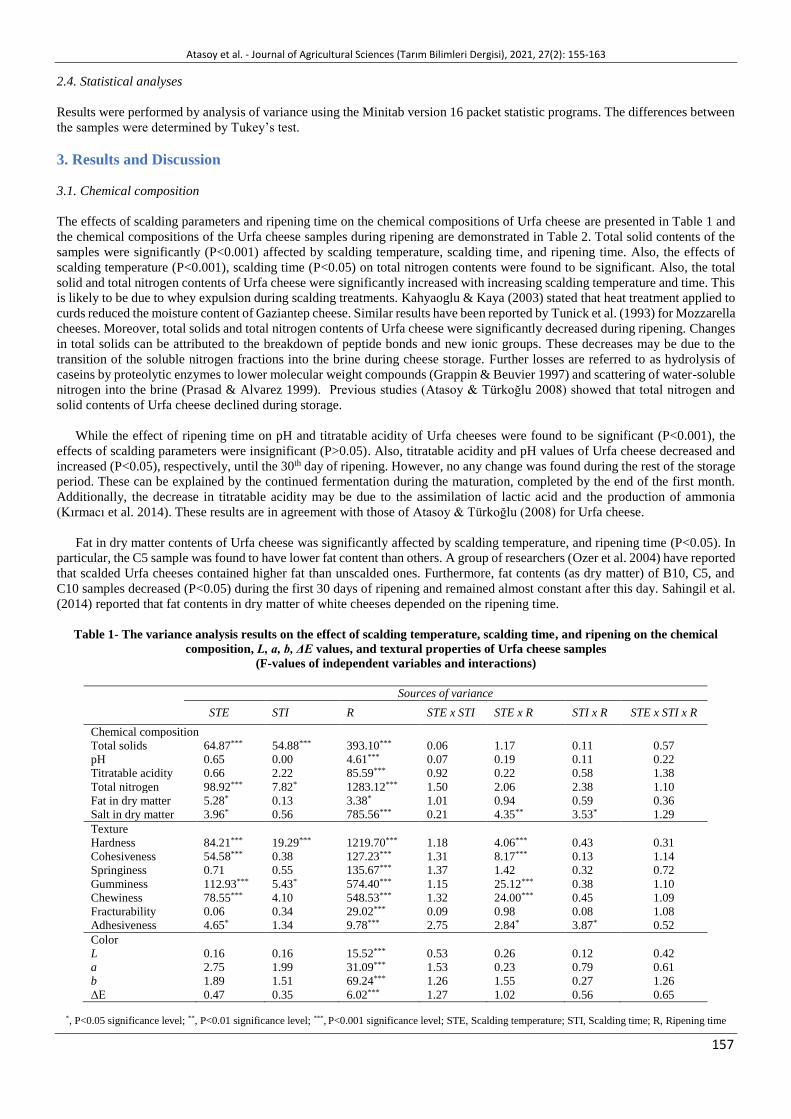
Table 1- The variance analysis results on the effect of scalding temperature, scalding time, and ripening on the chemical
composition, L, a, b, ΔE values, and textural properties of Urfa cheese samples
(F-values of independent variables and interactions)
*, P<0.05 significance level; **, P<0.01 significance level; ***, P<0.001 significance level; STE, Scalding temperature; STI, Scalding time; R, Ripening time
Sources of variance
STE STI R STE x STI STE x R STI x R STE x STI x R
Chemical composition
Total solids 64.87*** 54.88*** 393.10*** 0.06 1.17 0.11 0.57
pH 0.65 0.00 4.61*** 0.07 0.19 0.11 0.22
Titratable acidity 0.66 2.22 85.59*** 0.92 0.22 0.58 1.38
Total nitrogen 98.92*** 7.82* 1283.12*** 1.50 2.06 2.38 1.10
Fat in dry matter 5.28* 0.13 3.38* 1.01 0.94 0.59 0.36
Salt in dry matter 3.96* 0.56 785.56*** 0.21 4.35** 3.53* 1.29
Texture
Hardness 84.21*** 19.29*** 1219.70*** 1.18 4.06*** 0.43 0.31
Cohesiveness 54.58*** 0.38 127.23*** 1.31 8.17*** 0.13 1.14
Springiness 0.71 0.55 135.67*** 1.37 1.42 0.32 0.72
Gumminess 112.93*** 5.43* 574.40*** 1.15 25.12*** 0.38 1.10
Chewiness 78.55*** 4.10 548.53*** 1.32 24.00*** 0.45 1.09
Fracturability 0.06 0.34 29.02*** 0.09 0.98 0.08 1.08
Adhesiveness 4.65* 1.34 9.78*** 2.75 2.84* 3.87* 0.52
Color
L 0.16 0.16 15.52*** 0.53 0.26 0.12 0.42
a 2.75 1.99 31.09*** 1.53 0.23 0.79 0.61
b 1.89 1.51 69.24*** 1.26 1.55 0.27 1.26
ΔE 0.47 0.35 6.02*** 1.27 1.02 0.56 0.65

Atasoy et al. - Journal of Agricultural Sciences (Tarım Bilimleri Dergisi), 2021, 27(2): 155-163
158
Salt in the dry matter contents was significantly affected by scalding temperature (P<0.05), ripening time (P<0.001), the
interaction of the scalding temperature and ripening time (P<0.01), and scalding time and ripening time (P<0.05). Salt contents
in the dry matter of samples increased (P<0.05) during the ripening. In particular, the salt contents in the dry matter of the cheese
samples increased until the 60th day of ripening then almost unchanged (except for the A5 sample). The changes in salt contents
of Urfa cheeses were similar in previous studies (Atasoy et al. 2008). When cheese is placed in brine, salt molecules transfer
from the brine into the cheese as a result of the osmotic pressure difference between the cheese and the brine. Until the osmotic
balance between cheese and brine is reached, salt molecules diffusion continues. Thus, salt diffusion was faster into the cheese
from brine at the beginning of the ripening.
Table 2- The chemical composition of Urfa cheese samples during the ripening
Cheese samples Ripening Time (days)
1 30 60 90
Total solids
(g 100 g-1)
A5 58.73±0.03Ad 56.80±0.64ABb 54.92±0.26Bc 52.92±0.44Ca
A10 59.61±0.15Ac 58.03±0.28Aab 55.22±0.06Bbc 53.56±0.76Ba
B5 60.71±0.09Ab 58.09±0.29ABab 55.86±0.60BCabc 53.88±0.77Ca
B10 61.49±0.19Aab 58.63±0.28Bab 56.74±0.01Cabc 54.29±0.02Da
C5 61.57±0.26Aab 58.68±0.31Bab 56.43±0.03Cab 54.61±0.31Da
C10 61.85±0.05Aa 59.41±0.01Ba 57.42±0.29Ca 55.47±0.08Da
pH
A5 5.25±0.00Ba 5.42±0.03Aa 5.43±0.22Aa 5.47±0.01Aa
A10 5.26±0.10Ba 5.32±0.07Aba 5.46±0.12Aa 5.49±0.09Aa
B5 5.21±0.11Ba 5.44±0.01Aa 5.42±0.14Aa 5.52±0.04Aa
B10 5.23±0.07Ba 5.34±0.15ABa 5.40±0.01Aa 5.58±0.16Aa
C5 5.15±0.12Ba 5.31±0.09ABa 5.42±0.16Aa 5.40±0.18Aa
C10 5.24±0.00Aa 5.42±0.20Aa 5.35±0.18Aa 5.38±0.18Aa
Titratable acidity
(g 100 g-1 la)
A5 0.20±0.01Aa 0.10±0.01Ba 0.09±0.01Ba 0.09±0.01Ba
A10 0.21±0.02Aa 0.09±0.00Ba 0.11±0.01ABa 0.08±0.01Ba
B5 0.20±0.01Aa 0.07±0.01Ba 0.11±0.02ABa 0.08±0.01ABa
B10 0.21±0.02Aa 0.08±0.01Ba 0.08±0.01Ba 0.06±0.01Ba
C5 0.21±0.01Aa 0.12±0.02ABa 0.08±0.01Ba 0.07±0.01Ba
C10 0.19±0.01Aa 0.05±0.01Ba 0.09±0.02Ba 0.06±0.01Ba
Total nitrogen
(g 100 g-1)
A5 22.81±0.19Acd 19.51±0.48Bb 17.24±0.24Cb 15.75±0.02Cc
A10 22.61±0.15Acd 19.98±0.01Ba 17.98±0.01Cab 16.31±0.01Dbc
B5 23.20±0.07Abc 20.21±0.03Bab 18.18±0.31Cab 16.88±0.17Dbc
B10 23.42±0.02Abc 20.12±0.34Bab 18.28±0.00Cab 16.95±0.02Db
C5 24.29±0.18Aa 20.69±0.06Bab 18.36±0.39Cab 17.76±0.14Ca
C10 23.97±0.12Aba 20.96±0.12Ba 18.96±0.04Ca 18.01±0.24Da
Fat in dry matter
(g 100 g-1)
A5 45.44±0.40Aa 45.51±0.56Aa 46.09±0.12Aa 45.81±0.33Aa
A10 45.18±0.42Aa 45.02±0.21Aa 45.67±0.33Aa 45.97±0.28Aa
B5 45.86±0.02Aa 45.13±0.39Aa 45.48±0.55Aa 45.39±0.56Aa
B10 45.48±0.19Aa 44.76±0.21Ba 45.27±0.56Aa 45.71±0.14Aa
C5 44.99±0.08Ab 44.46±0.40Bb 45.07±0.57Aa 44.91±0.37Ab
C10 45.87±0.26Aa 44.50±0.32Bb 45.01±0.06Aa 45.06±0.60Aa
Salt in dry matter
(g 100 g-1)
A5 14.63±0.06Da 18.75±0.20Ca 21.38±0.57Ba 23.48±0.16Aa
A10 15.66±0.54Ca 19.29±0.15Ba 20.99±0.59ABa 22.55±0.11Aab
B5 14.94±0.24Ca 19.48±0.37Ba 21.49±0.19Aa 22.39±0.06Ab
B10 14.94±0.28Ca 20.30±0.44Ba 21.71±0.25ABa 22.15±0.21Ab
C5 14.44±0.27Ca 19.33±0.31Ba 21.50±0.16Aa 21.85±0.27Ab
C10 14.51±0.07Ca 19.63±0.03Ba 21.27±0.23Aa 21.76±0.01Ab
A-D Means in each row with different uppercase letters were significantly affected by storage periods (P<0.05). a-d Means with different lowercase letters were
significantly different among cheese samples within the column of the similar ripening period (P<0.05). A5 (scalded at 70 °C for 5 min), A10 (scalded at 70 °C
for 10 min), B5 (scalded at 80 °C for 5 min), B10 (scalded at 80 °C for 10 min), C5 (scalded at 90 °C for 5 min) and C10 (scalded at 90 °C for 10 min).
3.2. Textural properties of Urfa cheeses
The effects of scalding parameters and ripening time on the textural properties of Urfa cheese are shown in Table 1. Also, textural
properties of Urfa cheese samples during the ripening period are given in Table 3. The hardness values of Urfa cheese were
significantly influenced (P<0.001) by scalding temperature, scalding time, ripening time, and interaction of scalding temperature
and ripening time. Also, the hardness of Urfa cheese was significantly increased with increasing scalding temperature and time.
This is likely to be due to an increase in the protein concentration per unit area in the cheese matrix during scalding treatments.
Tunick et al. (1993) reported that the hardness of Mozzarella cheese was influenced by curd scalding temperature. Similar results
were determined in Gaziantep cheese (Kahyaoglu & Kaya 2003). Besides, the hardness of Urfa cheese samples significantly
decreased (P<0.05) during storage, and mature Urfa cheese was found less hard than fresh cheese. Reduction in hardness during
storage may be due to proteolysis of the casein network. There is a positive correlation between the hardness of cheese and the
quantity of intact αs1-casein (Lawrence et al. 1987). The products of proteolysis are generally water-soluble and cannot contribute
Atasoy et al. - Journal of Agricultural Sciences (Tarım Bilimleri Dergisi), 2021, 27(2): 155-163
159
to the protein network (Lawrence et al. 1987). The decreases in cheese during the ripening period were also observed by some
researchers (Sahan et al. 2008). Reduction in the hardness of cheeses was not surprising considering the decreased total nitrogen
and total solid contents (Table 2) during the ripening.
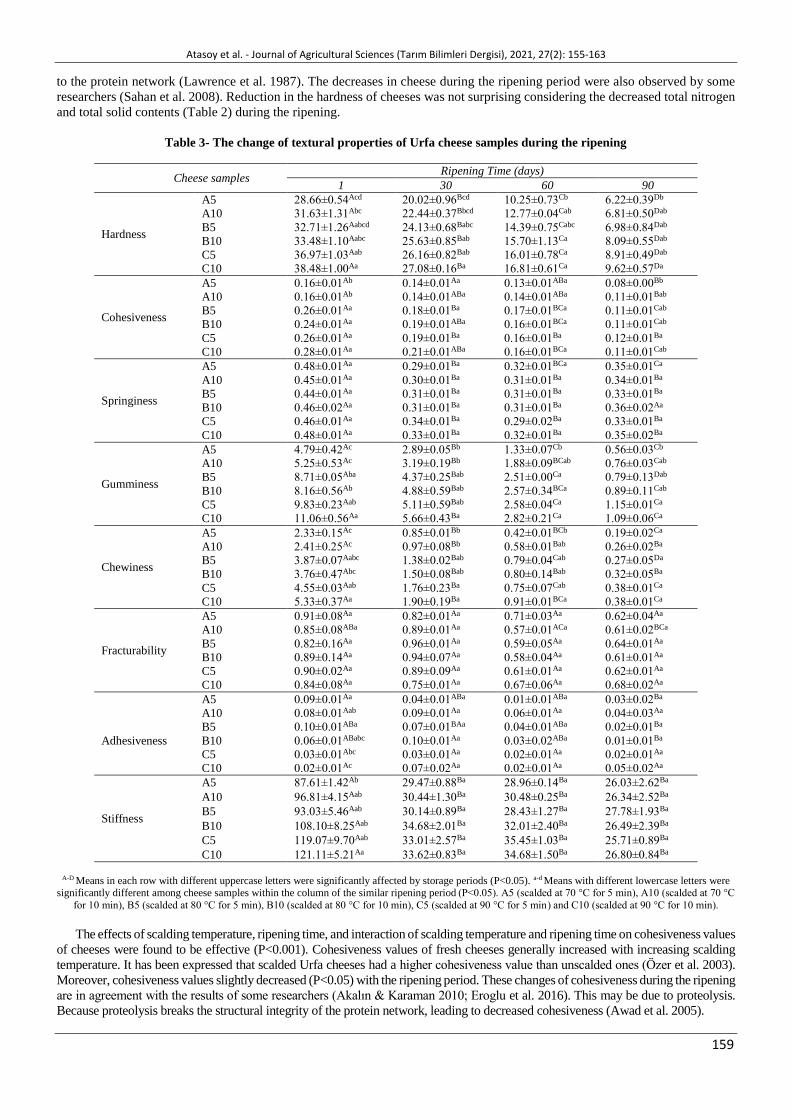
Table 3- The change of textural properties of Urfa cheese samples during the ripening
Cheese samples Ripening Time (days)
1 30 60 90
Hardness
A5 28.66±0.54Acd 20.02±0.96Bcd 10.25±0.73Cb 6.22±0.39Db
A10 31.63±1.31Abc 22.44±0.37Bbcd 12.77±0.04Cab 6.81±0.50Dab
B5 32.71±1.26Aabcd 24.13±0.68Babc 14.39±0.75Cabc 6.98±0.84Dab
B10 33.48±1.10Aabc 25.63±0.85Bab 15.70±1.13Ca 8.09±0.55Dab
C5 36.97±1.03Aab 26.16±0.82Bab 16.01±0.78Ca 8.91±0.49Dab
C10 38.48±1.00Aa 27.08±0.16Ba 16.81±0.61Ca 9.62±0.57Da
Cohesiveness
A5 0.16±0.01Ab 0.14±0.01Aa 0.13±0.01ABa 0.08±0.00Bb
A10 0.16±0.01Ab 0.14±0.01ABa 0.14±0.01ABa 0.11±0.01Bab
B5 0.26±0.01Aa 0.18±0.01Ba 0.17±0.01BCa 0.11±0.01Cab
B10 0.24±0.01Aa 0.19±0.01ABa 0.16±0.01BCa 0.11±0.01Cab
C5 0.26±0.01Aa 0.19±0.01Ba 0.16±0.01Ba 0.12±0.01Ba
C10 0.28±0.01Aa 0.21±0.01ABa 0.16±0.01BCa 0.11±0.01Cab
Springiness
A5 0.48±0.01Aa 0.29±0.01Ba 0.32±0.01BCa 0.35±0.01Ca
A10 0.45±0.01Aa 0.30±0.01Ba 0.31±0.01Ba 0.34±0.01Ba
B5 0.44±0.01Aa 0.31±0.01Ba 0.31±0.01Ba 0.33±0.01Ba
B10 0.46±0.02Aa 0.31±0.01Ba 0.31±0.01Ba 0.36±0.02Aa
C5 0.46±0.01Aa 0.34±0.01Ba 0.29±0.02Ba 0.33±0.01Ba
C10 0.48±0.01Aa 0.33±0.01Ba 0.32±0.01Ba 0.35±0.02Ba
Gumminess
A5 4.79±0.42Ac 2.89±0.05Bb 1.33±0.07Cb 0.56±0.03Cb
A10 5.25±0.53Ac 3.19±0.19Bb 1.88±0.09BCab 0.76±0.03Cab
B5 8.71±0.05Aba 4.37±0.25Bab 2.51±0.00Ca 0.79±0.13Dab
B10 8.16±0.56Ab 4.88±0.59Bab 2.57±0.34BCa 0.89±0.11Cab
C5 9.83±0.23Aab 5.11±0.59Bab 2.58±0.04Ca 1.15±0.01Ca
C10 11.06±0.56Aa 5.66±0.43Ba 2.82±0.21Ca 1.09±0.06Ca
Chewiness
A5 2.33±0.15Ac 0.85±0.01Bb 0.42±0.01BCb 0.19±0.02Ca
A10 2.41±0.25Ac 0.97±0.08Bb 0.58±0.01Bab 0.26±0.02Ba
B5 3.87±0.07Aabc 1.38±0.02Bab 0.79±0.04Cab 0.27±0.05Da
B10 3.76±0.47Abc 1.50±0.08Bab 0.80±0.14Bab 0.32±0.05Ba
C5 4.55±0.03Aab 1.76±0.23Ba 0.75±0.07Cab 0.38±0.01Ca
C10 5.33±0.37Aa 1.90±0.19Ba 0.91±0.01BCa 0.38±0.01Ca
Fracturability
A5 0.91±0.08Aa 0.82±0.01Aa 0.71±0.03Aa 0.62±0.04Aa
A10 0.85±0.08ABa 0.89±0.01Aa 0.57±0.01ACa 0.61±0.02BCa
B5 0.82±0.16Aa 0.96±0.01Aa 0.59±0.05Aa 0.64±0.01Aa
B10 0.89±0.14Aa 0.94±0.07Aa 0.58±0.04Aa 0.61±0.01Aa
C5 0.90±0.02Aa 0.89±0.09Aa 0.61±0.01Aa 0.62±0.01Aa
C10 0.84±0.08Aa 0.75±0.01Aa 0.67±0.06Aa 0.68±0.02Aa
Adhesiveness
A5 0.09±0.01Aa 0.04±0.01ABa 0.01±0.01ABa 0.03±0.02Ba
A10 0.08±0.01Aab 0.09±0.01Aa 0.06±0.01Aa 0.04±0.03Aa
B5 0.10±0.01ABa 0.07±0.01BAa 0.04±0.01ABa 0.02±0.01Ba
B10 0.06±0.01ABabc 0.10±0.01Aa 0.03±0.02ABa 0.01±0.01Ba
C5 0.03±0.01Abc 0.03±0.01Aa 0.02±0.01Aa 0.02±0.01Aa
C10 0.02±0.01Ac 0.07±0.02Aa 0.02±0.01Aa 0.05±0.02Aa
Stiffness
A5 87.61±1.42Ab 29.47±0.88Ba 28.96±0.14Ba 26.03±2.62Ba
A10 96.81±4.15Aab 30.44±1.30Ba 30.48±0.25Ba 26.34±2.52Ba
B5 93.03±5.46Aab 30.14±0.89Ba 28.43±1.27Ba 27.78±1.93Ba
B10 108.10±8.25Aab 34.68±2.01Ba 32.01±2.40Ba 26.49±2.39Ba
C5 119.07±9.70Aab 33.01±2.57Ba 35.45±1.03Ba 25.71±0.89Ba
C10 121.11±5.21Aa 33.62±0.83Ba 34.68±1.50Ba 26.80±0.84Ba
A-D Means in each row with different uppercase letters were significantly affected by storage periods (P<0.05). a-d Means with different lowercase letters were significantly different among cheese samples within the column of the similar ripening period (P<0.05). A5 (scalded at 70 °C for 5 min), A10 (scalded at 70 °C
for 10 min), B5 (scalded at 80 °C for 5 min), B10 (scalded at 80 °C for 10 min), C5 (scalded at 90 °C for 5 min) and C10 (scalded at 90 °C for 10 min).
The effects of scalding temperature, ripening time, and interaction of scalding temperature and ripening time on cohesiveness values
of cheeses were found to be effective (P<0.001). Cohesiveness values of fresh cheeses generally increased with increasing scalding
temperature. It has been expressed that scalded Urfa cheeses had a higher cohesiveness value than unscalded ones (Özer et al. 2003).
Moreover, cohesiveness values slightly decreased (P<0.05) with the ripening period. These changes of cohesiveness during the ripening
are in agreement with the results of some researchers (Akalın & Karaman 2010; Eroglu et al. 2016). This may be due to proteolysis.
Because proteolysis breaks the structural integrity of the protein network, leading to decreased cohesiveness (Awad et al. 2005).

Atasoy et al. - Journal of Agricultural Sciences (Tarım Bilimleri Dergisi), 2021, 27(2): 155-163
160
Even though springiness was affected (P<0.001) by the ripening time, it was not affected by the scalding parameters.
However, some researchers (Hayaloglu et al. 2014) reported that the scalding process is required to provide elasticity in cheese.
Özer et al. (2003) observed that scalding treatment increased the springiness value of Urfa cheeses. Also, springiness values of
samples decreased (P<0.05) until the 30 days of ripening, then remained constant (except for A5 and B10 samples). The decreases
in springiness during cheese storage may be due to degradation of the protein, especially the hydrolysis of para κ-caseinate
molecules (Awad et al. 2005), and reduction of free water. Hort & Le Grys (2001) reported that the springiness of Cheddar cheese
decreased during the ripening, but also somewhat remained constant in the middle period of ripening.
The effects of ripening time, scalding temperature, the interaction of scalding temperature and ripening time (P<0.001), and
scalding time (P<0.05) on the gumminess values of Urfa cheese were significantly found. This textural parameter of Urfa cheese
was significantly increased with increasing scalding temperature. The variation in the aforementioned textural characteristic
during the scalding was due largely to the variations in the scores for hardness. Similar results were also obtained from Kahyaoglu
et al. (2005) for Gaziantep cheese which is scalded and ripened in brine like Urfa cheese. Moreover, gumminess values of Urfa
cheese statistically declined (P<0.05) during cheese ripening. Increasing the level of NaCl during cheese maturation may be
decreasing in the gumminess parameter due to increased water retention in the cheese. Eroglu et al. (2016) reported that the
gumminess value of Kashar cheese was influenced by ripening time. Gumminess is the product of hardness and cohesiveness
(Famenin et al. 2019). For this reason, the variables affecting cohesiveness and hardness also affect values of the gumminess
during the ripening.
Chewiness values of Urfa cheese were influenced by the ripening time, scalding temperature, interaction of scalding
temperature, and ripening time (P<0.001). As the scalding temperature increased, chewiness values of Urfa cheeses were
generally increased. Furthermore, a decrease in chewiness values of cheeses was observed during the first 60 days of ripening
(P<0.05). The chewiness is one of the secondary textural parameters of the cheeses and it is calculated by the hardness,
cohesiveness, and springiness of the product (Famenin et al. 2019). Thus, changes in chewiness values may be associated with
the variations of the hardness, cohesiveness, and springiness values during the ripening.
Fracturability was only influenced by ripening time (P<0.001). Nuñez et al. (1991) reported that fracturability value of ewe’s
milk Manchego cheese was affected by ripening time. Only fracturability value of A10 sample showed a fluctuation during the
ripening (P<0.05). The higher fracturability value means the lower fracturability of the product (Aminifar et al. 2010). The
fracturability value of the A10 sample decreased from the 30th day of maturation, which means that the A10 sample was more
fragile during the maturation. This may be related to pore formation during maturation (Aminifar & Emam-Djomeh 2014). These
findings are in good agreement with previous studies for different brined cheese (Aminifar & Emam-Djomeh 2014).
Ripening time (P<0.001), scalding temperature, interactions of scalding temperature and ripening time, and scalding time
and ripening time (P<0.05) on the adhesiveness of samples were found effective. Adhesiveness value of only A5 cheese
significantly reduced (P<0.05) during the ripening. Sahingil et al. (2014) pointed out that the adhesiveness values of white
cheeses slightly decreased during maturation, but these declines were not significant. Also, the increase in scalding temperature
caused a decrease in the adhesiveness values of 1-day old cheeses. It is known that the adhesiveness value is closely related to
the fat and total solid content of the cheese (Motevalizadeh et al. 2018). This change in adhesiveness was following the changes
in the total solid (Table 2) and fat (data not shown) during the ripening period.
Stiffness values, in other words, firmness, were influenced by the ripening time, scalding temperature, interaction of scalding
temperature and ripening time (P<0.001), and scalding time (P<0.05). Although stiffness values of samples decreased (P<0.05)
until the 30th day of ripening, they did not change during the rest of the maturation period. The decreases in springiness during
the first month of storage may be due to increased moisture content and pH and breakdown of proteins (Table 2). It is known
that the firmness of fresh cheeses decreases after the ripening due to biochemical and physical changes (Aminifar et al. 2010).
Furthermore, there is a close relationship between the firmness of cheese and intact αs1-casein. This reduction of stiffness was
not surprising due to proteolysis (Lawrence et al. 1987). Also, stiffness values of Urfa cheeses increased with the scalding
treatment. This is likely to be due to whey removal and increasing total solid content of Urfa cheese. Additionally, the curd
shrinks in size and becomes firmer during the scalding process. Especially, the stiffness value of fresh C10 samples was found
higher than fresh A5 sample.
3.3. Microstructures of Urfa cheeses
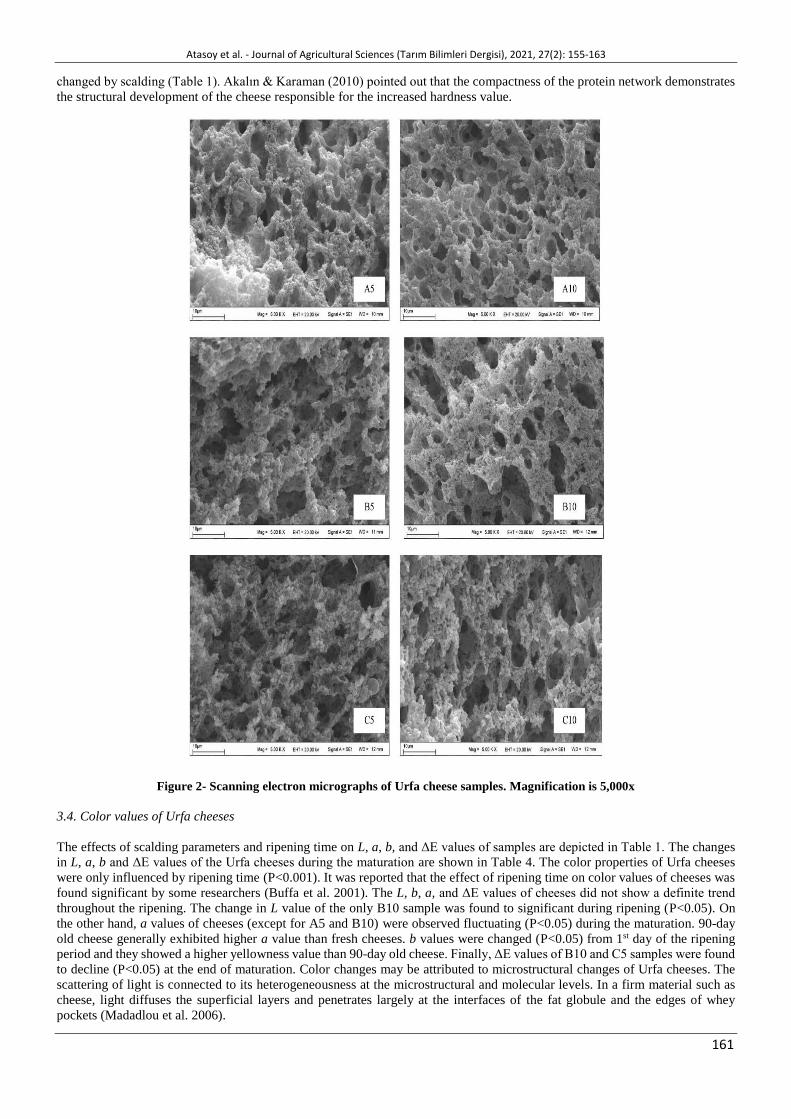
Scanning electron micrographs of samples are presented in Figure 2. The microstructures of cheeses were evaluated before the
ripening process. It was observed that scalding treatment was affected microstructures of Urfa cheeses. Scalding treatment
resulted in a coarser and more uniform microstructure in Urfa cheeses. It has been stated that the scalding process gives a more
compact structure in Malatya cheese (Hayaloglu et al. 2010). Özer et al. (2003) also reported that the scalding provided a more
homogeneous microstructure in Urfa cheeses. Especially, it has been found that the cheeses have a more compact structure with
increasing scalding time. Scalded cheeses for 10 minutes were characterized by a compact protein network, with small pores.
The relationship between cheese microstructure and rheology is known (Buffa et al. 2001). These changes in the microstructure
can be associated with textural changes. Thus, it has been determined that some of the textural properties of the Urfa cheeses are
Atasoy et al. - Journal of Agricultural Sciences (Tarım Bilimleri Dergisi), 2021, 27(2): 155-163
161
changed by scalding (Table 1). Akalın & Karaman (2010) pointed out that the compactness of the protein network demonstrates
the structural development of the cheese responsible for the increased hardness value.
Figure 2- Scanning electron micrographs of Urfa cheese samples. Magnification is 5,000x
3.4. Color values of Urfa cheeses
The effects of scalding parameters and ripening time on L, a, b, and ΔE values of samples are depicted in Table 1. The changes
in L, a, b and ΔE values of the Urfa cheeses during the maturation are shown in Table 4. The color properties of Urfa cheeses
were only influenced by ripening time (P<0.001). It was reported that the effect of ripening time on color values of cheeses was
found significant by some researchers (Buffa et al. 2001). The L, b, a, and ΔE values of cheeses did not show a definite trend
throughout the ripening. The change in L value of the only B10 sample was found to significant during ripening (P<0.05). On
the other hand, a values of cheeses (except for A5 and B10) were observed fluctuating (P<0.05) during the maturation. 90-day
old cheese generally exhibited higher a value than fresh cheeses. b values were changed (P<0.05) from 1st day of the ripening
period and they showed a higher yellowness value than 90-day old cheese. Finally, ΔE values of B10 and C5 samples were found
to decline (P<0.05) at the end of maturation. Color changes may be attributed to microstructural changes of Urfa cheeses. The
scattering of light is connected to its heterogeneousness at the microstructural and molecular levels. In a firm material such as
cheese, light diffuses the superficial layers and penetrates largely at the interfaces of the fat globule and the edges of whey
pockets (Madadlou et al. 2006).

Atasoy et al. - Journal of Agricultural Sciences (Tarım Bilimleri Dergisi), 2021, 27(2): 155-163
162
Table 4- The changes in L, a, b, and ΔE values of Urfa cheese samples during the ripening
Cheese samples Ripening Time (days)
1 30 60 90
L
A5 82.52±0.01Aa 80.32±1.67Aa 82.67±0.51Aa 83.10±1.99Aa
A10 85.27±1.75Aa 82.10±0.01Aa 82.49±0.40Aa 82.55±0.12Aa
B5 84.79±2.47Aa 81.40±1.12Aa 82.63±0.84Aa 80.68±1.05Aa
B10 86.09±1.09Aa 81.43±0.53Ba 82.90±0.58ABa 82.53±0.03ABa
C5 85.87±1.80Aa 82.10±2.08Aa 82.47±0.46Aa 81.87±0.30Aa
C10 85.37±0.24Aa 81.66±1.44Aa 82.32±0.44Aa 81.94±0.38Aa
a
A5 -1.41±0.07Aa -1.50±0.05Aa -1.50±0.04Ab -1.33±0.13Aa
A10 -1.38±0.06Aa -1.53±0.01Ba -1.46±0.03Ba -1.11±0.02Ba
B5 -1.36±0.07ABa -1.50±0.03Ba -1.44±0.03ABa -1.22±0.02Aa
B10 -1.33±0.12Aa -1.45±0.03Aa -1.37±0.02Aa -1.16±0.05Aa
C5 -1.30±0.01ABa -1.48±0.04Ba -1.38±0.07ABa -1.17±0.03ABa
C10 -1.36±0.04ABa -1.50±0.01Ba -1.36±0.02Ba -1.19±0.02Aa
b
A5 16.17±0.36Aa 13.12±0.91ABa 12.77±0.37Ba 13.82±0.21ABa
A10 15.75±0.09Aa 13.41±0.34Ba 13.32±0.12Ba 13.09±0.07Bab
B5 16.23±0.31Aa 13.95±0.42Ba 13.56±0.06Ba 12.71±0.11Bb
B10 15.53±0.90Aa 13.64±0.08ABa 12.51±0.05ABa 12.91±0.35Bab
C5 15.60±0.51Aa 12.62±0.53Ba 12.56±0.34Ba 13.11±0.16Bab
C10 16.05±0.36Aa 12.35±0.85Ba 13.39±0.04ABa 12.81±0.09Bab
ΔE
A5 88.05±0.06Aa 81.40±1.80Aa 83.66±0.45Aa 84.25±2.00Aa
A10 86.71±1.75Aa 69.71±13.42Aa 83.57±0.37Aa 83.72±0.13Aa
B5 86.35±2.36Aa 82.61±1.04Aa 83.75±081Aa 81.81±0.94Aa
B10 87.49±0.91Aa 82.47±0.42Ba 83.93±0.65Ba 83.54±0.09Ba
C5 87.29±1.67Aa 80.66±0.08Ba 83.33±0.41ABa 82.17±1.06ABa
C10 86.91±0.14Aa 82.61±1.55Aa 83.42±0.45Aa 82.95±0.39Aa
A-D Means in each row with different uppercase letters were significantly affected by storage periods (P<0.05). a-d Means with different lowercase letters were significantly different among cheese samples within the column of the similar ripening period (P<0.05). A5 (scalded at 70 °C for 5 min), A10 (scalded at 70 °C
for 10 min), B5 (scalded at 80 °C for 5 min), B10 (scalded at 80 °C for 10 min), C5 (scalded at 90 °C for 5 min) and C10 (scalded at 90 °C for 10 min).
4. Conclusions
The results of this research showed that ripening time was effective on chemical, textural and color parameters of Urfa cheese.
Scalding parameters on textural properties (except springiness and fracturability) of Urfa cheese were found to be important at
the beginning of maturation. However, scalding parameters on hardness, cohesiveness, and gumminess were significant at the
end of storage. Urfa cheese gained a more compact and uniform structure with the scalding parameters. Increasing scalding
temperature and time positively improved the textural and microstructural properties of Urfa cheese. However, the effects of
scalding temperature and time on the proteolysis, lipolysis, and volatiles compounds of Urfa cheese were not yet known. For
this reason, further studies should be focused on the determination of the effect of scalding temperature and time on biochemical
properties of lipolysis and proteolysis in Urfa cheese.
Acknowledgements
This study was supported financially by Harran University Scientific Research Projects Authority (HUBAK Project No.: 13041).
References
Akalın A S & Karaman A D (2010). Influence of packaging conditions on the textural and sensory characteristics, microstructure and color of
industrially produced Turkish white cheese during ripening. Journal of Texture Studies 41(4): 549-562 https://doi.org/10.1111/j.1745-
4603.2010.00241.x
Alinovi M, Cordioli M, Francolino S, Locci F, Ghiglietti R, Monti L, Tidona F, Mucchetti G & Giraffa G (2018). Effect of fermentation-
produced camel chymosin on quality of Crescenza cheese. International Dairy Journal 84: 72-78 https://doi.org/10.1016/j.idairyj.2018.04.001
Aminifar M, Hamedi M, Emam-Djomeh Z & Mehdinia A (2010). Microstructural, compositional and textural properties during ripening of
Lighvan cheese, a traditional raw sheep cheese. Journal of Texture Studies 41(4): 579-593 https://doi.org/10.1111/j.1745-
4603.2010.00244.x
Aminifar M & Emam-Djomeh Z (2014). Changes of Texture, Microstructure and free fatty acid contents of Lighvan cheese during accelerated
ripening with lipase. Journal of Agricultural Science and Technology 16: 113-123
Atasoy A F & Türkoğlu H (2008). Changes of composition and free fatty acid contents of Urfa cheeses (a white-brined Turkish cheese) during
ripening: Effects of heat treatments and starter cultures. Food Chemistry 110(3): 598-604 https://doi.org/10.1016/j.foodchem.2008.02.046
Atasoy A F, Yetişmeyen A, Türkoğlu H & Özer B (2008). Effects of heat treatment and starter culture on the properties of traditional Urfa
cheeses (a white-brined Turkish cheese) produced from bovine milk. Food Control 19(3): 278-285
https://doi.org/10.1016/j.foodcont.2007.04.004
Atasoy et al. - Journal of Agricultural Sciences (Tarım Bilimleri Dergisi), 2021, 27(2): 155-163
163
Atasoy A F, Hayaloglu A A, Kırmacı H, Levent O & Türkoğlu H (2013). Effects of partial substitution of caprine for ovine milk on the volatile
compounds of fresh and mature Urfa cheeses. Small Ruminant Research 115(1-3): 113-123
https://doi.org/10.1016/j.smallrumres.2013.09.002
Awad S, Hassan A N & Muthukumarappan K (2005). Application of exopolysaccharide-producing cultures in reduced-fat cheddar cheese:
Texture and melting properties. Journal of Dairy Science 88(12): 4204-4213 https://doi.org/10.3168/jds.s0022-0302(05)73106-4
Buffa M N, Trujillo A J, Pavia M & Guamis B (2001). Changes in textural, microstructural, and colour characteristics during ripening of
cheeses made from raw, pasteurized or high-pressure-treated goats' milk. International Dairy Journal 11(11): 927-934
https://doi.org/10.1016/s0958-6946(01)00141-8
El Bakry M & Sheehan J (2014). Analysing cheese microstructure: A review of recent developments. Journal of Food Engineering 125: 84-
96 https://doi.org/10.1016/j.jfoodeng.2013.10.030
Eroglu A, Toker O S & Dogan M (2016). Changes in the texture, physicochemical properties and volatile compound profiles of fresh Kashar
cheese (<90 days) during ripening. International Journal of Dairy Technology 69(2): 243-253 https://doi.org/10.1111/1471-0307.12250
Famenin B K, Hosseini H, Zayeri F, Ghanati K, Lorenzo J M, Barba F J & Mousavi Khaneghah A (2019). Effect of mechanically deboning of
chicken on the rheological and sensory properties of chicken sausages. Journal of Food Processing and Preservation 43(5): e13938
https://doi.org/10.1111/jfpp.13938
Grappin R & Beuvier E (1997). Possible Implications of Milk Pasteurization on the Manufacture and Sensory Quality of Ripened Cheese.
International Dairy Journal 7(12): 751-761 https://doi.org/10.1016/s0958-6946(98)00006-5
Hayaloglu A A, Deegan K C & Mcsweeney P L (2010). Effect of milk pasteurization and curd scalding temperature on proteolysis in Malatya,
a Halloumi-type cheese. Dairy Science & Technology 90(1): 99-109 https://doi.org/10.1051/dst/2009052
Hayaloglu A A, Karatekin B & Gurkan H (2014). Thermal stability of chymosin or microbial coagulant in the manufacture of Malatya, a
Halloumi type cheese: Proteolysis, microstructure and functional properties. International Dairy Journal 38(2): 136-144
https://doi.org/10.1016/j.idairyj.2014.04.001
Hort J & Le Grys G (2001). Developments in the textural and rheological properties of UK Cheddar cheese during ripening. International
Dairy Journal 11(4-7): 475-481 https://doi.org/10.1016/s0958-6946(01)00074-7
IDF (1993). Milk Determination of Nitrogen Content. IDF Standard 20B, International Dairy Federation, Brussels
Kahyaoglu T & Kaya S (2003). Effects of heat treatment and fat reduction on the rheological and functional properties of Gaziantep cheese.
International Dairy Journal 13(11): 867-75 https://doi.org/10.1016/s0958-6946(03)00113-4
Kahyaoglu T, Kaya S & Kaya A (2005). Effects of fat reduction and curd dipping temperature on viscoelasticity, texture and appearance of
Gaziantep cheese. Food Science and Technology International 11(3): 191-198 https://doi.org/10.1177/1082013205055002
Kırmacı H A, Hayaloğlu A A, Özer H B & Türkoğlu H (2014). Evolution of proteolysis in Urfa cheese made from ewe's milk by wild type
starter culture systems. Small Ruminant Research 119(1-3): 120-129 https://doi.org/10.1016/j.smallrumres.2014.01.006
Kırmacı H A (2016). Effect of Wild Strains Used as Starter Cultures on Free Fatty Acid Profile of Urfa Cheese. Polish Journal of Food and
Nutrition Sciences 66(4): 303-310 https://doi.org/10.1515/pjfns-2015-0034
Lawrence R C, Creamer L K & Gilles J (1987). Texture development during cheese ripening. Journal of Dairy Science 70(8): 1748-1760
https://doi.org/10.3168/jds.s0022-0302(87)80207-2
Madadlou A, Khosroshahi A, Mousavi S M & Djome Z E (2006). Microstructure and rheological properties of Iranian white cheese coagulated
at various temperatures. Journal of Dairy Science 89(7): 2359-2364 https://doi.org/10.3168/jds.s0022-0302(06)72308-6
Motevalizadeh E, Mortazavi S A, Milani E & Hooshmand‐Dalir M A R (2018). Optimization of physicochemical and textural properties of
pizza cheese fortified with soybean oil and carrot extract. Food Science & Nutrition 6(2): 356-372 https://doi.org/10.1002/fsn3.563
Nuñez M, Guillén A M, Rodríguez-Marín M A, Marcilla A M, Gaya P & Medina M (1991). Accelerated ripening of ewes’ milk Manchego
cheese: The effect of neutral proteinases. Journal of Dairy Science 74(12): 4108-4118 https://doi.org/10.3168/jds.s0022-0302(91)78605-0
Ozer H B, Uraz G, Beyzi-Yılmaz E & Atasoy A F (2004). The effects of brine concentration and scalding on survival of some pathogens in
Urfa cheese: a traditional white-brined Turkish cheese. International Journal of Food Science & Technology 39(7): 727-735
https://doi.org/10.1111/j.1365-2621.2004.00837.x
Özer B H, Robinson R K & Grandison A S (2003). Textural and microstructural properties of Urfa cheese (a white-brined Turkish cheese).
International Journal of Dairy Technology 56(3): 171-176 https://doi.org/10.1046/j.1471-0307.2003.00100.x
Prasad N & Alvarez V B (1999). Effect of salt and chymosin on the physico-chemical properties of Feta cheese during ripening. Journal of
Dairy Science 82(6): 1061-1067 https://doi.org/10.3168/jds.s0022-0302(99)75327-0
Sahan N, Yasar K, Hayaloglu A A, Karaca O B & Kaya A (2008). Influence of fat replacers on chemical composition, proteolysis, texture
profiles, meltability and sensory properties of low-fat Kashar cheese. Journal of Dairy Research 75: 1-7
https://doi.org/10.1017/s0022029907002786
Sahingil D, Hayaloglu A A, Simsek O & Ozer B (2014). Changes in volatile composition, proteolysis and textural and sensory properties of
white-brined cheese: effects of ripening temperature and adjunct culture. Dairy Science & Technology 94(6): 603-623
https://doi.org/10.1007/s13594-014-0185-2
Tomaszewska J, Cais-Socolinska D, Bierzunska P, Kaczynski L K, Walkowiak W & Baranowska H M (2019). Behaviour of water in different
types of goats' cheese. International Dairy Journal 95: 18-24 https://doi.org/10.1016/j.idairyj.2019.02.015
Tunick M H, Malin E L, Smith P W, Shieh J J, Sullivan B C, Mackey K L & Holsinger V H (1993). Proteolysis and rheology of low fat and
full fat Mozzarella cheeses prepared from homogenized milk. Journal of Dairy Science 76(12): 3621-3628
https://doi.org/10.3168/jds.s0022-0302(93)77703-6
Turkish Standards (1978). Determination of Fat in Cheese. TS 3046, Turkish Standards Institute, Ankara, Turkey
Turkish Standards (1989). White Cheese Standard. TS 591, Turkish Standards Institute, Ankara, Turkey
© 2021 by the authors. Licensee Ankara University, Faculty of Agriculture, Ankara, Turkey. This article is an open access article distributed under the terms and conditions of the Creative Commons Attribution (CC BY) license (http://creativecommons.org/licenses/by/4.0/).