Embed Size (px)
Citation preview

Effects of Foreign Direct Investment
and human capital formation on labour
markets in India
Gunja Baranwal*
Corresponding Author
*Research Fellow, Centre for Studies in Social Sciences, Calcutta, R-1, B.P.Township, Calcutta,
700094, India. e-mail: [email protected] +91-7890059582
Abstract
Foreign Direct Investment (FDI) and human capital formation‟s interaction has strong implications
for labour demand and supply factors in developing economies. Multi-national Enterprises invest in
their employees through provision of training, direct technological diffusion and up-gradation,
innovation and imitation. They also tend to affect the scale and composition of labour demand in
economy. Indian economy has featured rising wage inequality and demographic dividend
simultaneously since the last decade. In our first attempt to empirically assess the human capital
formation effect of Foreign Direct Investment in Indian manufacturing firms, we use unbalanced
panel data for 568 firms for the period 2001-2013. FDI is found out to be stirring up wage inequality.
We find an evidence of negative relation between relative wages and interaction term of training and
foreign direct investment suggestive of positive human capital formation effect of FDI only through
this channel. Results are the same when we do it for sub-classifications of industries.
Keywords: Foreign direct investment, Human capital, Labour demand, Labour supply, Wages
JEL codes: F24, J31, J24, J31.
1 Introduction
Inquiry into the growth drivers of countries has always been a major issue of research. Over the
period of time these drivers have changed. Trade, Foreign Direct Investment (FDI) and human capital
have emerged as the new factors causing growth of economies. Free capital mobility among the
countries led to advent of Multinational Enterprises (MNE‟s)1 , thus providing a substitute to domestic
investment. This FDI has the potential to affect the host country‟s macroeconomic variables like
income, investment and employment (Borensztien et.al.1998; Gregario, 2003; Fry, 1993). FDI
directly ameliorates production through better technologies, financial capabilities, and provision of
state of the art (Luiz and Mello, 1999). It affects level of domestic investment via crowding in and
crowding out effect (Agosin and Mayer, 2000).The indirect effects of FDI include spill-over effects
(Kokko, 1994).Similarly human capital also has significant long run impact on an economy‟s income
and employment (Romer, 1986; Lucas, 1988; Barro, 1998, Pissarides,2000; Wilson and
Briscoe,2004). Human capital formation takes place through on the job training, schooling, and other
knowledge gained through experience and learning by labour force (Becker, 1974; Blundell, 1999).
Investments in human capital affect wages (Constantine and Neumark, 1994; Liu, 2013). This stock of
human capital determines the technological absorptive capacity of country (Nelson and Phelps, 1966;
Benhabib and Spiegel, 1994). Human capital creates positive spillovers to economy (Acemoglou and
Angrist, 2000; Ciccone and Peri, 2002). FDI also affects the labour market through changes in
employment and wage structure of labour force (Baldwin, 1995), leads to human capital formation
through upgrading the skills of human capital of host countries by provision of formal training,
schooling and spill-over effects of layoffs and turn overs of labour force from international firm to
domestic firms (Michie, 2001; Kapstien, 2001; Miyamoto, 2003; Ritchie, 2002). Thus these may be
considered supply side effects of FDI on human capital formation process of the host country. On the
supply side, FDI may affect the human capital formation in terms of skill up-gradation of labour
force, thus contribute to supply of human capital. However in the process, FDI also demands specific
kind of human capital thus also affects the wages of different catagories; highly skilled, mid skilled
1We use the terms Foreign Direct Investment and Multinational Enterprises interchangeably henceforth.
and low skilled of human capital (Feenstra and Hanson, 1995; Figini and Gorg, 2006; Gorg and
Stroble, 2002). Both of these effects are crucial as they have long term consequences on labour force
of host economy. The significance of either effect is important in determining the overall effect of
FDI in a country. Ours is the first attempt to assess this effect empirically in Indian manufacturing
industries for the last decade. The structure of the paper is organised as followed: in section 2 we
discuss trends of FDI, human capital formation and wage inequality in India. In section 3 we discuss
the theoretical framework. Empirical strategy has been developed in section 4 where. Data has been
discussed in section 5. In section 6 we discuss our variables formation. Section 7 presents the results
of effect of FDI on human capital formation and relative wages. We also check for inter- industry and
time differences of this effect in this section. Section 8 concludes the discussion.
2.1 Trends of FDI and Human Capital Formation, Wage inequality in India
India remains the third most attractive destination for FDI, after China and the United States of
America, for 2013-15, according to a survey of global companies conducted by UNCTAD. Foreign
Direct Investment in India has increased from $ 1,04,411 in year 2000-2001 to $ 6,96,011 in 2011-
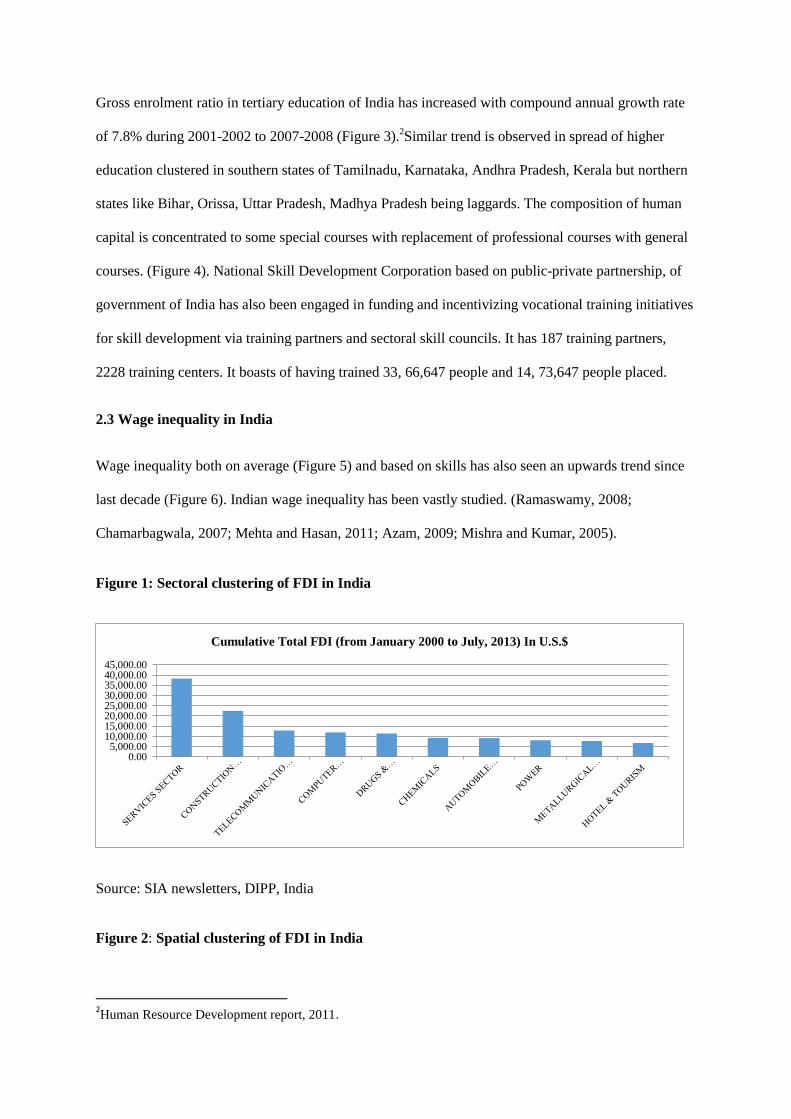
2012. The distribution of FDI inflow is concentrated to some sectors. Services, Construction,
Communication, Drugs and Pharmaceuticals, Chemicals, Automobile Industry etc. are among the
leading sectors which bag major share of FDI inflows. Similarly there is spatial clustering in spread of
FDI as some economically advanced regions have accounted for the lion‟s share of FDI inflows. Top
of them are states of Maharashtra, Delhi, Tamilnadu, Karnataka, Gujarat and Andhra Pradesh.
Whereas states like Uttar Pradesh, Madhya Pradesh, Bihar, Orissa, Rajasthan and North- eastern
region managed to receive no or only a meagre amount of FDI inflows. In literature there are several
determinants responsible for this clustering like availability of quality labour force, size and growth of
local markets, physical infrastructure, policy environment, business climate, and presence of
agglomeration economies (Mukherji, 2011; Goldar, 2007 ; Moriss,2007 ; Nunnenkamp and Stracke,
2007).
2.2 Human Capital Base in India
Gross enrolment ratio in tertiary education of India has increased with compound annual growth rate
of 7.8% during 2001-2002 to 2007-2008 (Figure 3).2Similar trend is observed in spread of higher
education clustered in southern states of Tamilnadu, Karnataka, Andhra Pradesh, Kerala but northern
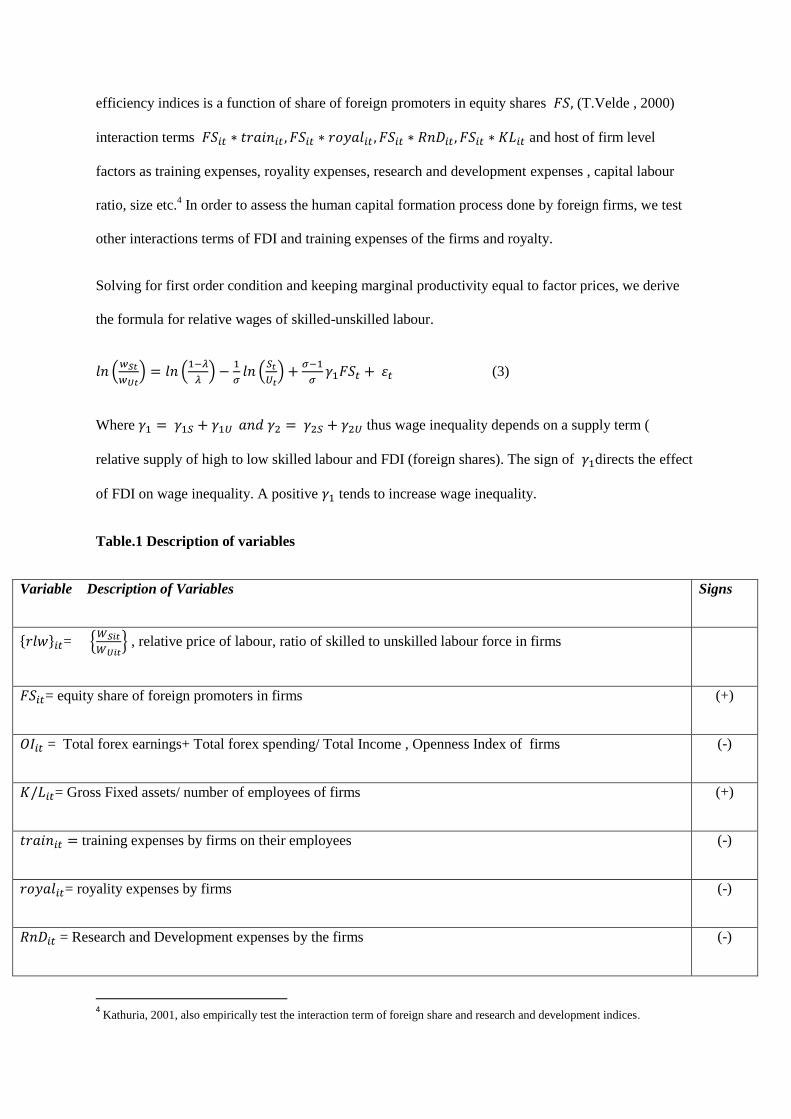
states like Bihar, Orissa, Uttar Pradesh, Madhya Pradesh being laggards. The composition of human
capital is concentrated to some special courses with replacement of professional courses with general
courses. (Figure 4). National Skill Development Corporation based on public-private partnership, of
government of India has also been engaged in funding and incentivizing vocational training initiatives
for skill development via training partners and sectoral skill councils. It has 187 training partners,
2228 training centers. It boasts of having trained 33, 66,647 people and 14, 73,647 people placed.
2.3 Wage inequality in India
Wage inequality both on average (Figure 5) and based on skills has also seen an upwards trend since
last decade (Figure 6). Indian wage inequality has been vastly studied. (Ramaswamy, 2008;
Chamarbagwala, 2007; Mehta and Hasan, 2011; Azam, 2009; Mishra and Kumar, 2005).
Figure 1: Sectoral clustering of FDI in India
Source: SIA newsletters, DIPP, India
Figure 2: Spatial clustering of FDI in India
2Human Resource Development report, 2011.
0.005,000.00
10,000.0015,000.0020,000.0025,000.0030,000.0035,000.0040,000.0045,000.00
Cumulative Total FDI (from January 2000 to July, 2013) In U.S.$
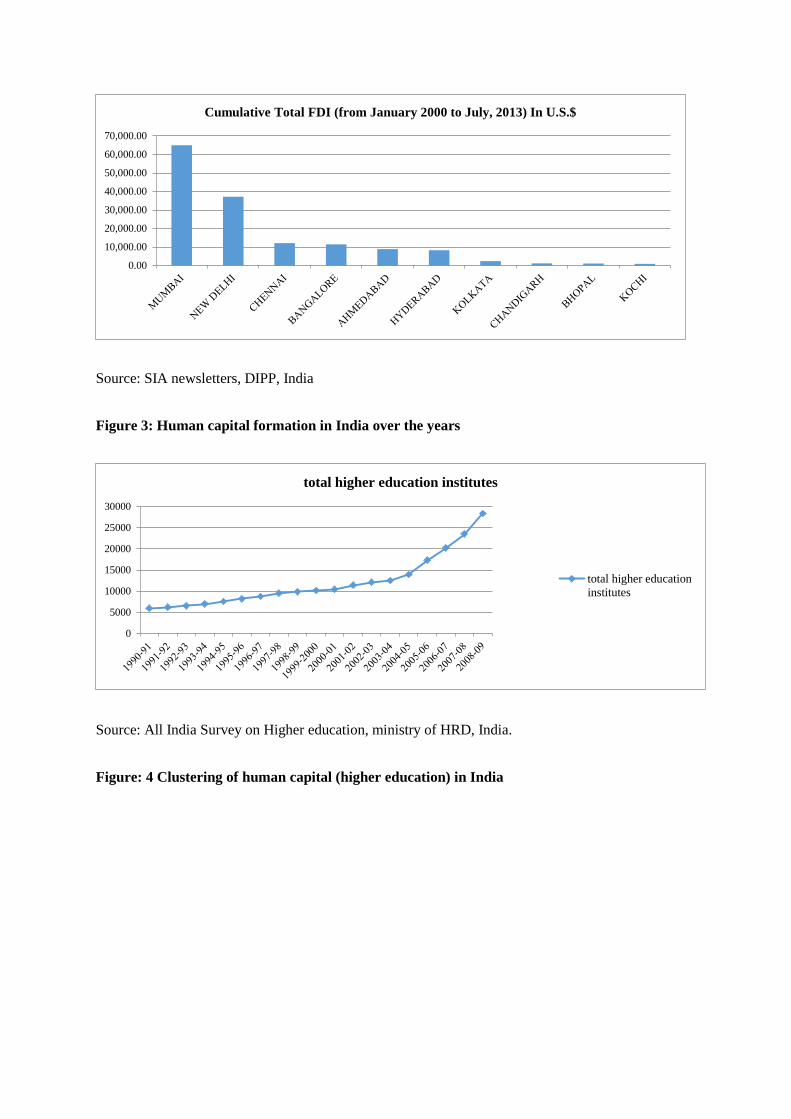
Source: SIA newsletters, DIPP, India
Figure 3: Human capital formation in India over the years
Source: All India Survey on Higher education, ministry of HRD, India.
Figure: 4 Clustering of human capital (higher education) in India
0.00
10,000.00
20,000.00
30,000.00
40,000.00
50,000.00
60,000.00
70,000.00
Cumulative Total FDI (from January 2000 to July, 2013) In U.S.$
0
5000
10000
15000
20000
25000
30000
total higher education institutes
total higher education
institutes
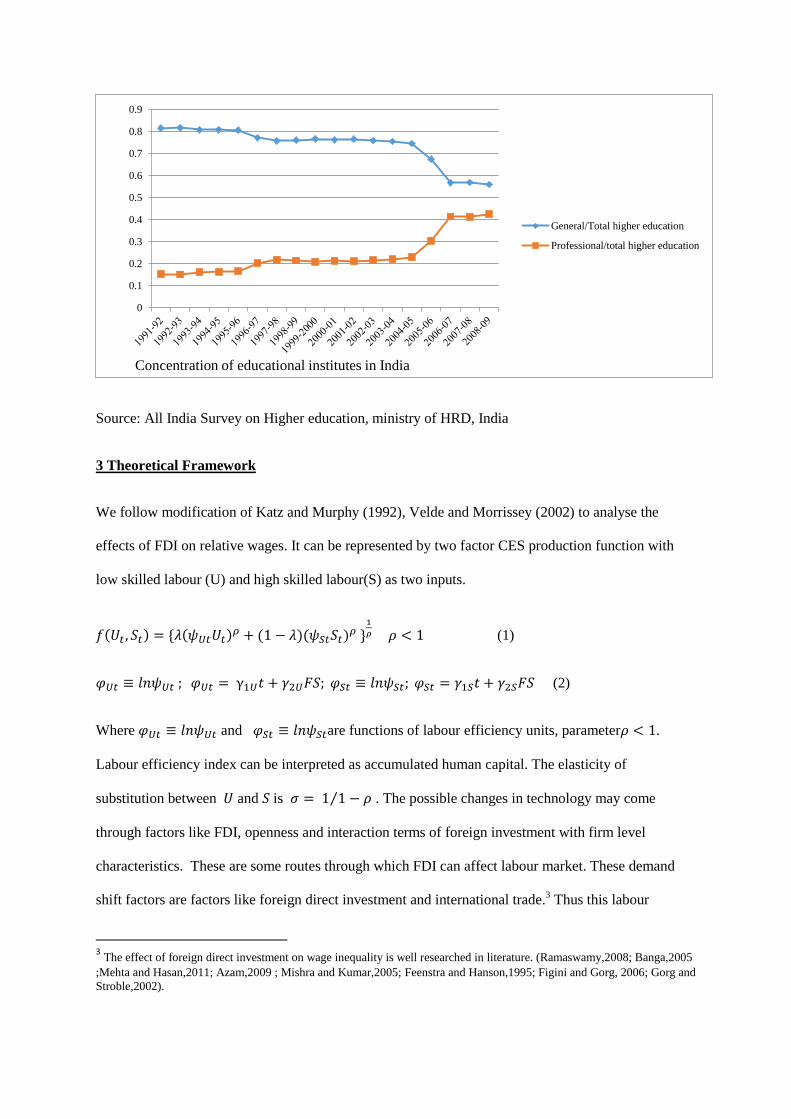
Source: All India Survey on Higher education, ministry of HRD, India
3 Theoretical Framework
We follow modification of Katz and Murphy (1992), Velde and Morrissey (2002) to analyse the
effects of FDI on relative wages. It can be represented by two factor CES production function with
low skilled labour (U) and high skilled labour(S) as two inputs.
( ) * ( ) ( )( )
+
(1)
(2)
Where and are functions of labour efficiency units, parameter .
Labour efficiency index can be interpreted as accumulated human capital. The elasticity of
substitution between and is ⁄ . The possible changes in technology may come
through factors like FDI, openness and interaction terms of foreign investment with firm level
characteristics. These are some routes through which FDI can affect labour market. These demand
shift factors are factors like foreign direct investment and international trade.3 Thus this labour
3 The effect of foreign direct investment on wage inequality is well researched in literature. (Ramaswamy,2008; Banga,2005
;Mehta and Hasan,2011; Azam,2009 ; Mishra and Kumar,2005; Feenstra and Hanson,1995; Figini and Gorg, 2006; Gorg and
Stroble,2002).
0
0.1
0.2
0.3
0.4
0.5
0.6
0.7
0.8
0.9
General/Total higher education
Professional/total higher education
Concentration of educational institutes in India
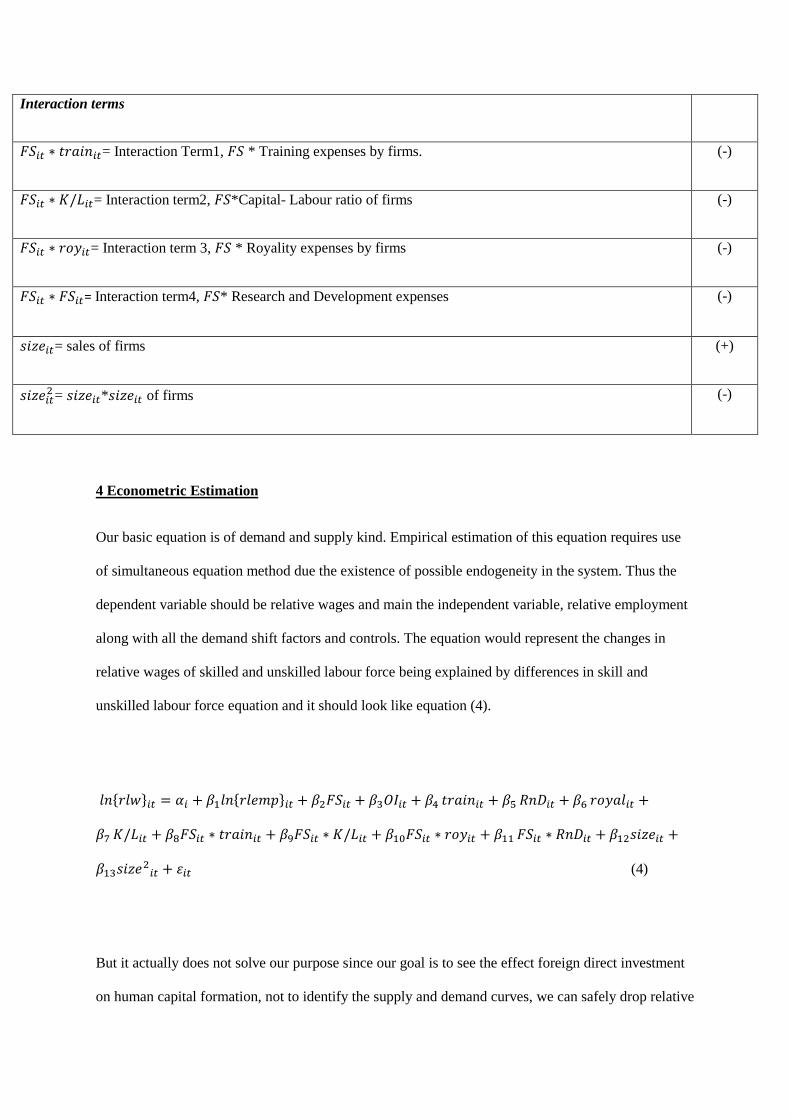
efficiency indices is a function of share of foreign promoters in equity shares (T.Velde , 2000)
interaction terms and host of firm level
factors as training expenses, royality expenses, research and development expenses , capital labour
ratio, size etc.4 In order to assess the human capital formation process done by foreign firms, we test
other interactions terms of FDI and training expenses of the firms and royalty.
Solving for first order condition and keeping marginal productivity equal to factor prices, we derive
the formula for relative wages of skilled-unskilled labour.
(
) (
)
(
)
(3)
Where thus wage inequality depends on a supply term (
relative supply of high to low skilled labour and FDI (foreign shares). The sign of directs the effect
of FDI on wage inequality. A positive tends to increase wage inequality.
Table.1 Description of variables
Variable Description of Variables Signs
* + = {
} , relative price of labour, ratio of skilled to unskilled labour force in firms
= equity share of foreign promoters in firms (+)
= Total forex earnings+ Total forex spending/ Total Income , Openness Index of firms (-)
= Gross Fixed assets/ number of employees of firms (+)
training expenses by firms on their employees (-)
= royality expenses by firms (-)
= Research and Development expenses by the firms (-)
4 Kathuria, 2001, also empirically test the interaction term of foreign share and research and development indices.
Interaction terms
= Interaction Term1, * Training expenses by firms. (-)
= Interaction term2, *Capital- Labour ratio of firms (-)
= Interaction term 3, * Royality expenses by firms (-)
= Interaction term4, * Research and Development expenses (-)
= sales of firms (+)
= * of firms (-)
4 Econometric Estimation
Our basic equation is of demand and supply kind. Empirical estimation of this equation requires use
of simultaneous equation method due the existence of possible endogeneity in the system. Thus the
dependent variable should be relative wages and main the independent variable, relative employment
along with all the demand shift factors and controls. The equation would represent the changes in
relative wages of skilled and unskilled labour force being explained by differences in skill and
unskilled labour force equation and it should look like equation (4).
* + * +
(4)
But it actually does not solve our purpose since our goal is to see the effect foreign direct investment
on human capital formation, not to identify the supply and demand curves, we can safely drop relative
employment from equation (4). In other words it also implies that we are interested in the shifts in
relative labour demand caused by foreign direct investment Figure 7(a) rather than identifying
demand and supply curve. In latter case there is a condition of multiple equilibria Figure 7(b). To this
end, our equation boils down to equation (5). We estimate our final equation5:
* +
(5)
So now we implicitly assume relative employment is given exogenously and we are estimating the
shifts in demand side of labour market explained by other factors like FDI, openness firm specific
factors and their interaction terms.
5 Data:
Paucity of skill based firm level employer-employee data in India poses a strong challenge in testing
our hypothesis. This leaves us with the alternative to create relative indices with all possible data
available. We use CMIE database to test our hypothesis. CMIE provides data on listed Indian firms
based on their income statements and balance sheets. This is the only source of micro data on Indian
firms which gives minute details of income, expenses, structure and other resources of the firms. This
is the virtue of PROWESS data in comparison with ASI (Annual Survey of Industries) data which
does not give plant level information of Indian industries on such distinct aspects. The empirical
exercise has been conducted using Prowess database published by Centre for Monitoring Indian
Economy for the period from 2001-2013 for NIC two digit non-financial public and private limited
manufacturing firms trading on National Stock Exchange and Bombay Stock Exchange. The
industries included are Food (88 firms), Metal and Metal products (101firms), Textile (91 firms),
Chemicals (231 firms) and Consumer goods (49 firms). The result is an unbalanced sample of 568
firms as our final sample.
6 Variables Formation
5 This also makes us drop the log specification since we are not interested in estimating elasticity of substitution
between skilled and unskilled labour.
Labour demand is proxied by the relative changes in wages. Thus, our dependent variable is relative
price of labour. It is the ratio of skilled to unskilled labour in a firm. We derive this indicator by
dividing wages and salaries paid by firms in prowess data base to the average wages of rural sector6
for men over the years at all India level provided by Labour Bureau. This creates our index of relative
labour prices that we use for relative labour demand changes. The table below explains all the
variables used in model.
Demand shift indicators
Foreign Direct Investment: Many studies have attempted to find out the impact of FDI on
development process of countries. The results are very different for developed and developing
countries. We try to assess the impact of FDI on relative wage ratio of skilled and unskilled labour.
We measure it by share of foreign equity in annual equity shares of firms. (Aitken and harrison, 1999;
Almeida, 2002; Arnold and Jevorcik, 2009) Some studies use binary measure of private and foreign
ownership at the expense of information. But the relation between foreign ownership is better
approximated as linear than binary. (Bircan, 2011)
Openness Index: Openness is the frequently used indicator in literature to explain effect of
international exposure of firms on wage inequality. (Ramaswamy, 2008) Our openness indicator is
constituted by the ratio of sum total forex earnings, total forex spending by the total income of the
firms. Openness may lead to increase in demand for skilled labour force in case of skill intensive
exports.
Human capital Indicators: We use four indicators of human capital which may directly or indirectly
lead to skill up-gradation.
On the job training: On the job training provided increases the supply of skilled labour force and
therefore should affect the level of wages in economy by increasing the productivity and bargaining
power of labour. (Tan and Batra, 1996, Mincer1991, Becker, 1974, Veum, 1995) Our measure of
6Rural sector includes activities like ploughing, sowing , weeding ,transplanting, harvesting, winnowing,
threshing, picking, herdsmen, well digging, cane crushing, carpenter, blacksmith, cobbler, mason, tractor driver,
sweeper and unskilled labourers. Labour Bureau.
training is annual expenses financed by firms on training their employees which upgrades the level of
skills. It has been normalised by dividing it by sales of firms.
Research and Development (RnD): It is an endogenous tool of innovation in new growth theory.
Firms invest for accumulation of knowledge capital (Grossman and Helpman, 1990; 1994; Redding,
1996). This accumulation of knowledge capital increases the productivity, wages and thus sharpens
the skills of labour force. We use annual investment by the firms in research and development
activities normalised by sales of firms.
Royalties: Imitation is another indirect form of human capital formation coming through adoption of
technologies. Along with RnD activities firms also invest in purchasing already patented technologies.
It increases the skill level indirectly by imitation of technologies. The indicator of royalty payment is
expenses by firms on royalty payments normalised by sales of the firms.
Capital-labour ratio: This is also an indirect indicator for human capital formation which works
through technological changes. Multi-national enterprises encourage technological up-gradation for
domestic firms. We create our capital- labour ratio by dividing gross fixed assets by number of
employees in the firm. Capital-skill complementarity increases the demand for skilled labour and
therefore increases wage inequality between skilled and unskilled.
Interaction terms: In order to separate the role of foreign firms on human capital formation from
domestic, we use four interaction terms. These terms show the effect of foreign firms on human
capital formation.
FDItrain: This indicator looks at the direct effect of foreign firms on human capital formation and
skill up gradation of employees by imparting them training. It is product of annual foreign share and
training expenses by the firms. It affects the wages directly by increasing productivity and bargaining
power of labour force.
FDIRnD: It shows the innovation practices made by the foreign firms in India. Theses foreign
innovation practices lead to skill up gradation. It is a product of foreign share and research and
development expenses by firms. (Kathuaria, 2001; 2008)
FDIroyalties: Foreign firms also spend on purchasing technologies to imitate them. This variable
reflects the indirect effect of imitation of technology on wages of labour. Foreign share and royalty
payment make up this variable.
FDIkl: Another indicator of technological change brought about by the foreign firms is a product of
foreign share and capital-labour ratio of the firms. It shows the direct effect of foreign technology on
wage inequality.
Size: We take the size of firms in all the specifications in order to control for the firm specific
characteristics. It is the total annual sales of the firms. Larger firms give higher packages to their
employees.
Size2: This term is included to account for the non- linarites‟ in firm specific indicators. It is a square
term of size of firms. It represents that as the size of the firm increases the size of packages they offer
to their employees declines.
7 Relative wages, FDI and human capital formation results
Our panel includes missing values on some of the variables which actually leads to reduce the sample
size. Another problem caused by systematic missing data is that it may produce the selection bias. But
in case of missing data completely at random also termed as Missing Completely At Random
(MCAR), any value of an observation neither depends on its own value nor on values of other
variables in the set (Schafer, 1997; Cameron and Trivedi, 2005). It does not produce biases though it may
have less precision. Since these missing values are randomly missing, they do not affect our results of
estimation and we also take robust standard errors to minimise the possibility of less precision.7 First
7 Other studies using PROWESS database also faced this problem due to unbalance panel, but it does not affect
their results. (Kathuria, 2001; Kumar and Siddharthan,1994; Chowdhuri et.al.,2013; Parameswaran,2009;
Sahu,2009)
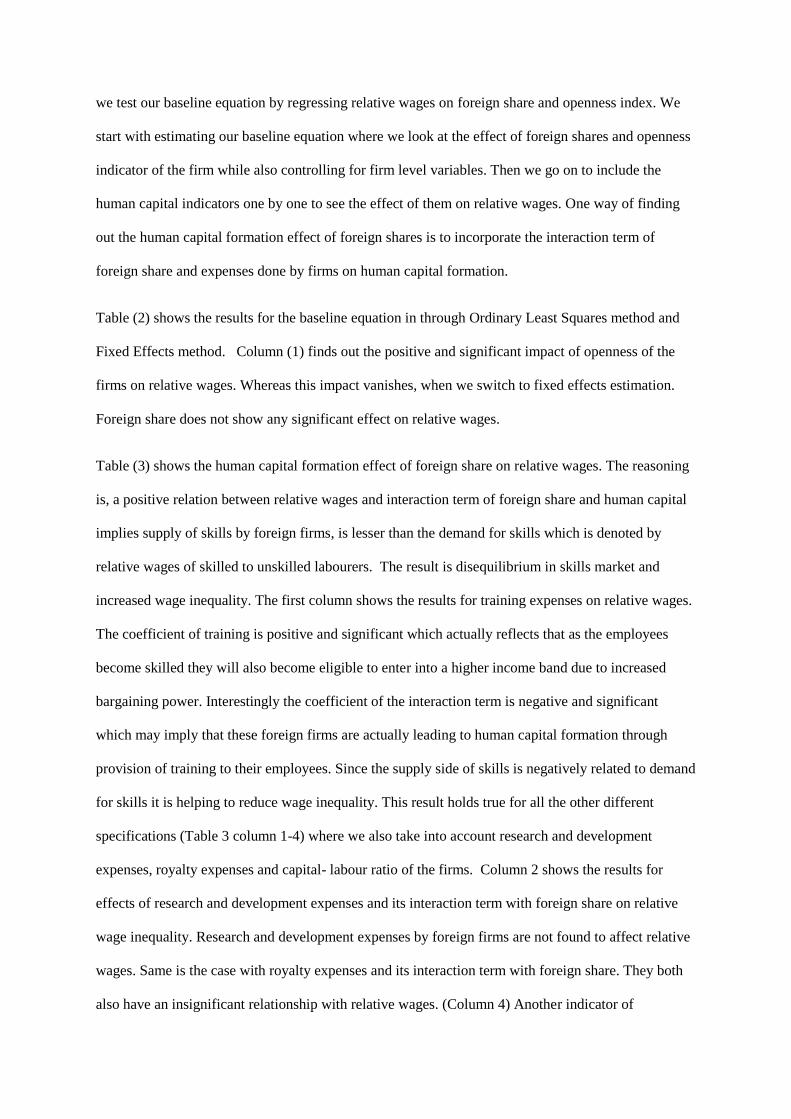
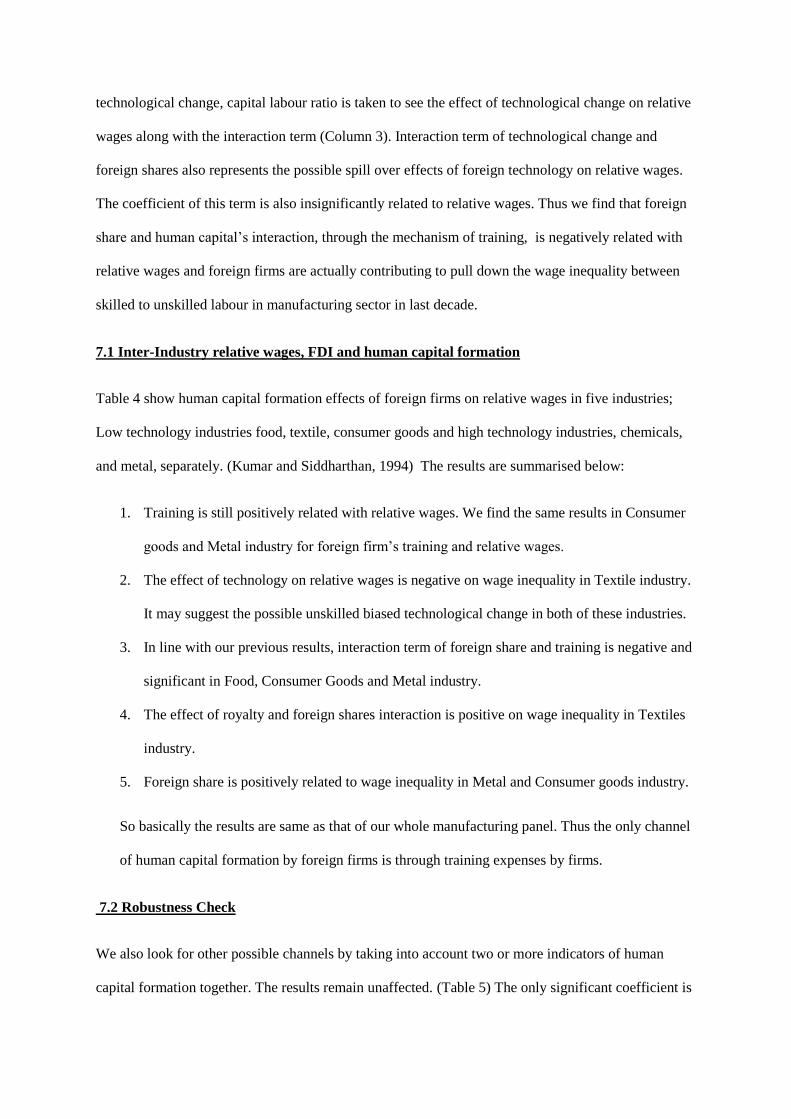
we test our baseline equation by regressing relative wages on foreign share and openness index. We
start with estimating our baseline equation where we look at the effect of foreign shares and openness
indicator of the firm while also controlling for firm level variables. Then we go on to include the
human capital indicators one by one to see the effect of them on relative wages. One way of finding
out the human capital formation effect of foreign shares is to incorporate the interaction term of
foreign share and expenses done by firms on human capital formation.
Table (2) shows the results for the baseline equation in through Ordinary Least Squares method and
Fixed Effects method. Column (1) finds out the positive and significant impact of openness of the
firms on relative wages. Whereas this impact vanishes, when we switch to fixed effects estimation.
Foreign share does not show any significant effect on relative wages.
Table (3) shows the human capital formation effect of foreign share on relative wages. The reasoning
is, a positive relation between relative wages and interaction term of foreign share and human capital
implies supply of skills by foreign firms, is lesser than the demand for skills which is denoted by
relative wages of skilled to unskilled labourers. The result is disequilibrium in skills market and
increased wage inequality. The first column shows the results for training expenses on relative wages.
The coefficient of training is positive and significant which actually reflects that as the employees
become skilled they will also become eligible to enter into a higher income band due to increased
bargaining power. Interestingly the coefficient of the interaction term is negative and significant
which may imply that these foreign firms are actually leading to human capital formation through
provision of training to their employees. Since the supply side of skills is negatively related to demand
for skills it is helping to reduce wage inequality. This result holds true for all the other different
specifications (Table 3 column 1-4) where we also take into account research and development
expenses, royalty expenses and capital- labour ratio of the firms. Column 2 shows the results for
effects of research and development expenses and its interaction term with foreign share on relative
wage inequality. Research and development expenses by foreign firms are not found to affect relative
wages. Same is the case with royalty expenses and its interaction term with foreign share. They both
also have an insignificant relationship with relative wages. (Column 4) Another indicator of
technological change, capital labour ratio is taken to see the effect of technological change on relative
wages along with the interaction term (Column 3). Interaction term of technological change and
foreign shares also represents the possible spill over effects of foreign technology on relative wages.
The coefficient of this term is also insignificantly related to relative wages. Thus we find that foreign
share and human capital‟s interaction, through the mechanism of training, is negatively related with
relative wages and foreign firms are actually contributing to pull down the wage inequality between
skilled to unskilled labour in manufacturing sector in last decade.
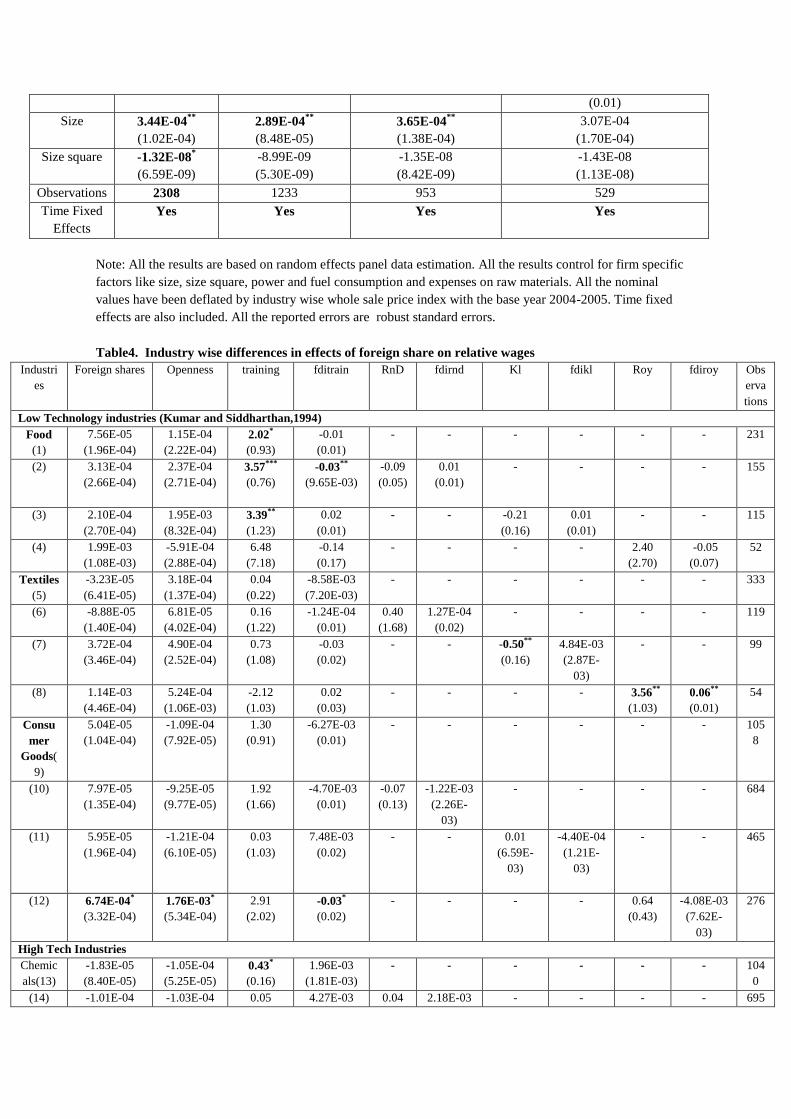
7.1 Inter-Industry relative wages, FDI and human capital formation
Table 4 show human capital formation effects of foreign firms on relative wages in five industries;
Low technology industries food, textile, consumer goods and high technology industries, chemicals,
and metal, separately. (Kumar and Siddharthan, 1994) The results are summarised below:
1. Training is still positively related with relative wages. We find the same results in Consumer
goods and Metal industry for foreign firm‟s training and relative wages.
2. The effect of technology on relative wages is negative on wage inequality in Textile industry.
It may suggest the possible unskilled biased technological change in both of these industries.
3. In line with our previous results, interaction term of foreign share and training is negative and
significant in Food, Consumer Goods and Metal industry.
4. The effect of royalty and foreign shares interaction is positive on wage inequality in Textiles
industry.
5. Foreign share is positively related to wage inequality in Metal and Consumer goods industry.
So basically the results are same as that of our whole manufacturing panel. Thus the only channel
of human capital formation by foreign firms is through training expenses by firms.
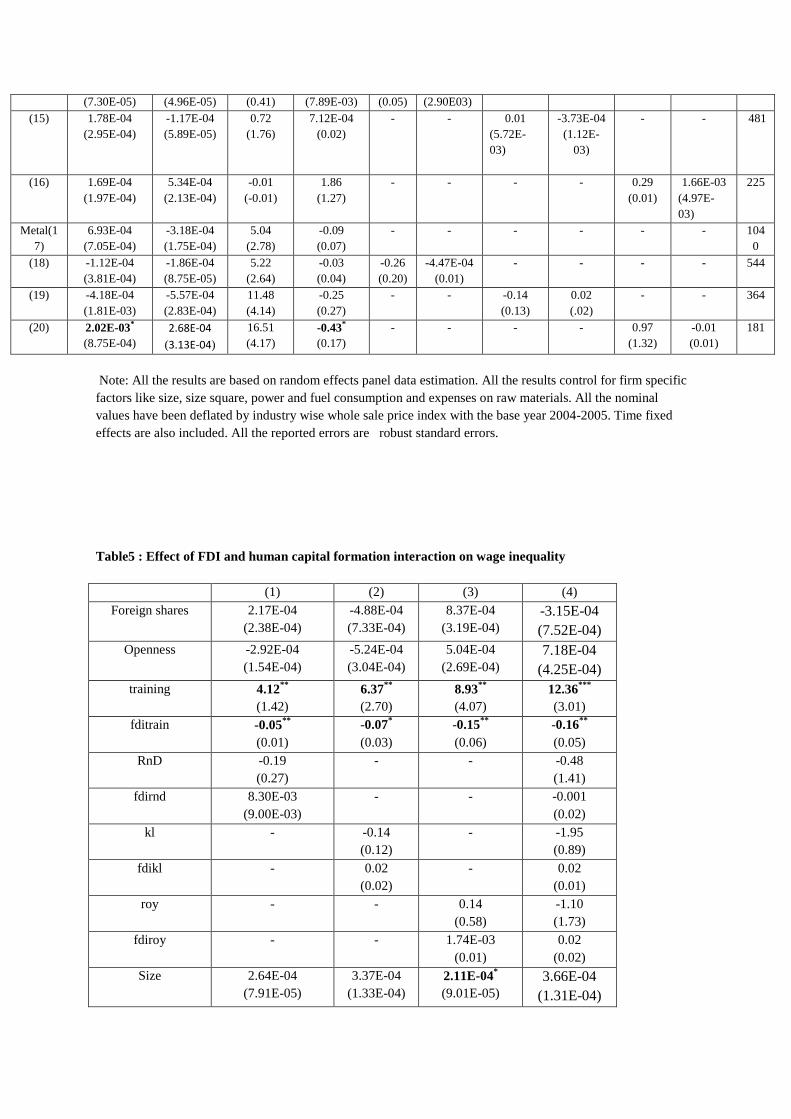
7.2 Robustness Check
We also look for other possible channels by taking into account two or more indicators of human
capital formation together. The results remain unaffected. (Table 5) The only significant coefficient is
of foreign share and training interaction. All other indicators of human capital are insignificant. In
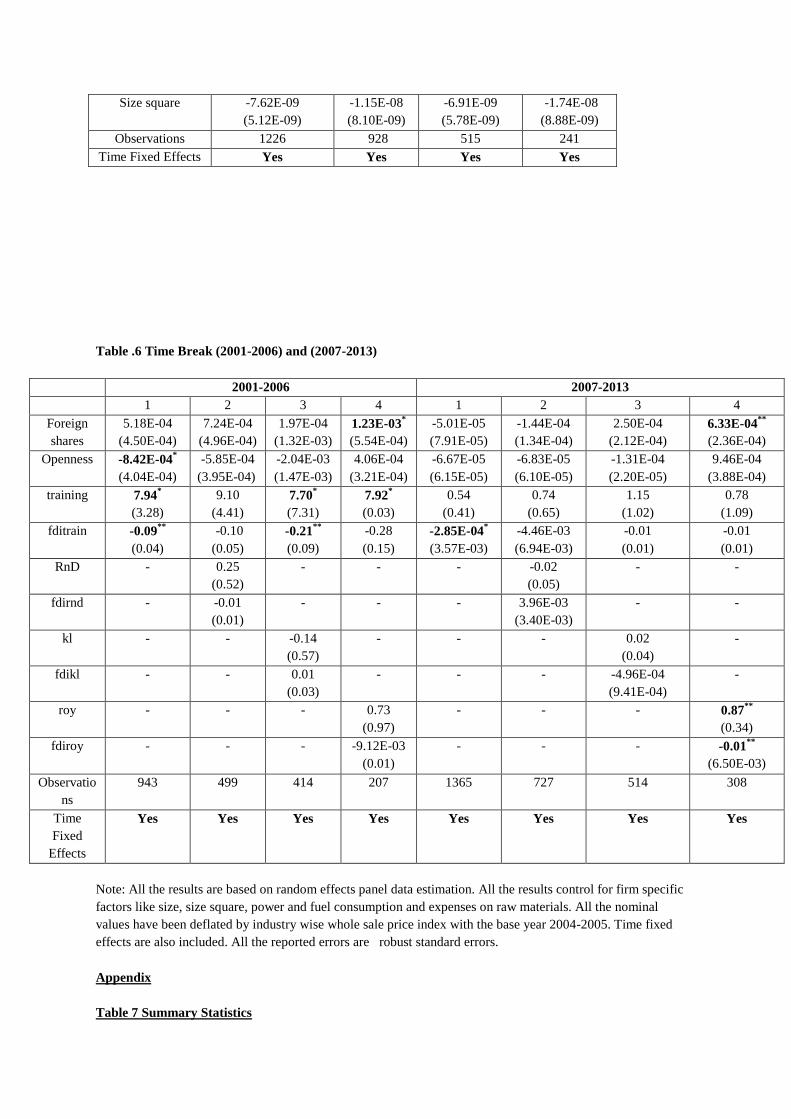
Table 6 test for any differences in the results for two different time periods. The first part shows the
results for 2001 to 2006. The results are in the same as here also we find a negative coefficient of
foreign share and training with a both a positive training and foreign share. This is the only channel
which is found to be significantly affecting relative wages and leading to possible human capital
formation for this period in manufacturing sector. In the second panel for 2007-2013, also we find
another indirect channel of royalty expenses which is negatively related to wage inequality.
8 Conclusion
We attempted to assess the effects of foreign direct investment on human capital formation in Indian
manufacturing sector for the period 2001-2013. Our results indicate that the favourable human capital
formation effects of foreign direct investment. Training provided by foreign firms to their employees
is the main channel of his human capital formation done by foreign direct investment.
Table2.
Effect of
FDI and
opennes
s on
relative
wages
Table3. Effect of FDI and human capital indicators on relative wages
(1) (2) (3) (4)
Foreign
shares
4.83E-04
(2.67E-04)
-1.72E-05
(2.20E-04)
-7.74E-04
(6.12E-04)
-5.57E-05
(3.05E-04)
Openness -3.63E-04
(1.78E-04)
-3.40E-04*
(1.55E-04)
-5.53E-04
(2.96E-04)
6.54E-04
(4.75E-04)
training 3.60**
(1.36)
- - -
fditrain -0.05**
(0.01)
- - -
RnD - 0.08
(0.22)
- -
fdirnd - 4.77E-03
(8.45E-03)
- -
kl -0.14
(0.12)
-
fdikl 0.01
(0.02)
-
roy - 0.16
(0.88)
fdiroy - 8.56E-03
Variables OLS Fixed Effects
Foreign shares 4.27E-04
(2.53E-04)
1.58E-03
(9.82E-04)
Openness -4.12E-04***
(9.77E-05)
-9.18E-05
(2.06E-04)
Size 3.45E-04***
(4.09E-05)
-4.05E-04
( 1.50E-04)
Sizesquare -1.26E-08***
(3.00E-09 )
-3.16E-10***
( 4.26E-08)
constant 0.03
(0.009)
0.04
(0.02)
Observations 2437 2437
F 33.82 2.79
(0.01)
Size 3.44E-04**
(1.02E-04)
2.89E-04**
(8.48E-05)
3.65E-04**
(1.38E-04)
3.07E-04
(1.70E-04)
Size square -1.32E-08*
(6.59E-09)
-8.99E-09
(5.30E-09)
-1.35E-08
(8.42E-09)
-1.43E-08
(1.13E-08)
Observations 2308 1233 953 529
Time Fixed
Effects
Yes Yes Yes Yes
Note: All the results are based on random effects panel data estimation. All the results control for firm specific
factors like size, size square, power and fuel consumption and expenses on raw materials. All the nominal
values have been deflated by industry wise whole sale price index with the base year 2004-2005. Time fixed
effects are also included. All the reported errors are robust standard errors.
Table4. Industry wise differences in effects of foreign share on relative wages
Industri
es
Foreign shares Openness training fditrain RnD fdirnd Kl fdikl Roy fdiroy Obs
erva
tions
Low Technology industries (Kumar and Siddharthan,1994)
Food
(1)
7.56E-05
(1.96E-04)
1.15E-04
(2.22E-04)
2.02*
(0.93)
-0.01
(0.01)
- - - - - - 231
(2) 3.13E-04
(2.66E-04)
2.37E-04
(2.71E-04)
3.57***
(0.76)
-0.03**
(9.65E-03)
-0.09
(0.05)
0.01
(0.01)
- - - - 155
(3) 2.10E-04
(2.70E-04)
1.95E-03
(8.32E-04)
3.39**
(1.23)
0.02
(0.01)
- - -0.21
(0.16)
0.01
(0.01)
- - 115
(4) 1.99E-03
(1.08E-03)
-5.91E-04
(2.88E-04)
6.48
(7.18)
-0.14
(0.17)
- - - - 2.40
(2.70)
-0.05
(0.07)
52
Textiles
(5)
-3.23E-05
(6.41E-05)
3.18E-04
(1.37E-04)
0.04
(0.22)
-8.58E-03
(7.20E-03)
- - - - - - 333
(6) -8.88E-05
(1.40E-04)
6.81E-05
(4.02E-04)
0.16
(1.22)
-1.24E-04
(0.01)
0.40
(1.68)
1.27E-04
(0.02)
- - - - 119
(7) 3.72E-04
(3.46E-04)
4.90E-04
(2.52E-04)
0.73
(1.08)
-0.03
(0.02)
- - -0.50**
(0.16)
4.84E-03
(2.87E-
03)
- - 99
(8) 1.14E-03
(4.46E-04)
5.24E-04
(1.06E-03)
-2.12
(1.03)
0.02
(0.03)
- - - - 3.56**
(1.03)
0.06**
(0.01)
54
Consu
mer
Goods(
9)
5.04E-05
(1.04E-04)
-1.09E-04
(7.92E-05)
1.30
(0.91)
-6.27E-03
(0.01)
- - - - - - 105
8
(10) 7.97E-05
(1.35E-04)
-9.25E-05
(9.77E-05)
1.92
(1.66)
-4.70E-03
(0.01)
-0.07
(0.13)
-1.22E-03
(2.26E-
03)
- - - - 684
(11) 5.95E-05
(1.96E-04)
-1.21E-04
(6.10E-05)
0.03
(1.03)
7.48E-03
(0.02)
- - 0.01
(6.59E-
03)
-4.40E-04
(1.21E-
03)
- - 465
(12) 6.74E-04*
(3.32E-04)
1.76E-03*
(5.34E-04)
2.91
(2.02)
-0.03*
(0.02)
- - - - 0.64
(0.43)
-4.08E-03
(7.62E-
03)
276
High Tech Industries
Chemic
als(13)
-1.83E-05
(8.40E-05)
-1.05E-04
(5.25E-05)
0.43*
(0.16)
1.96E-03
(1.81E-03)
- - - - - - 104
0
(14) -1.01E-04 -1.03E-04 0.05 4.27E-03 0.04 2.18E-03 - - - - 695
(7.30E-05) (4.96E-05) (0.41) (7.89E-03) (0.05) (2.90E03)
(15) 1.78E-04
(2.95E-04)
-1.17E-04
(5.89E-05)
0.72
(1.76)
7.12E-04
(0.02)
- - 0.01
(5.72E-
03)
-3.73E-04
(1.12E-
03)
- - 481
(16) 1.69E-04
(1.97E-04)
5.34E-04
(2.13E-04)
-0.01
(-0.01)
1.86
(1.27)
- - - - 0.29
(0.01)
1.66E-03
(4.97E-
03)
225
Metal(1
7)
6.93E-04
(7.05E-04)
-3.18E-04
(1.75E-04)
5.04
(2.78)
-0.09
(0.07)
- - - - - - 104
0
(18) -1.12E-04
(3.81E-04)
-1.86E-04
(8.75E-05)
5.22
(2.64)
-0.03
(0.04)
-0.26
(0.20)
-4.47E-04
(0.01)
- - - - 544
(19) -4.18E-04
(1.81E-03)
-5.57E-04
(2.83E-04)
11.48
(4.14)
-0.25
(0.27)
- - -0.14
(0.13)
0.02
(.02)
- - 364
(20) 2.02E-03*
(8.75E-04)
2.68E-04
(3.13E-04)
16.51
(4.17)
-0.43*
(0.17)
- - - - 0.97
(1.32)
-0.01
(0.01)
181
Note: All the results are based on random effects panel data estimation. All the results control for firm specific
factors like size, size square, power and fuel consumption and expenses on raw materials. All the nominal
values have been deflated by industry wise whole sale price index with the base year 2004-2005. Time fixed
effects are also included. All the reported errors are robust standard errors.
Table5 : Effect of FDI and human capital formation interaction on wage inequality
(1) (2) (3) (4)
Foreign shares 2.17E-04
(2.38E-04)
-4.88E-04
(7.33E-04)
8.37E-04
(3.19E-04)
-3.15E-04
(7.52E-04)
Openness -2.92E-04
(1.54E-04)
-5.24E-04
(3.04E-04)
5.04E-04
(2.69E-04)
7.18E-04
(4.25E-04)
training 4.12**
(1.42)
6.37**
(2.70)
8.93**
(4.07)
12.36***
(3.01)
fditrain -0.05**
(0.01)
-0.07*
(0.03)
-0.15**
(0.06)
-0.16**
(0.05)
RnD -0.19
(0.27)
- - -0.48
(1.41)
fdirnd 8.30E-03
(9.00E-03)
- - -0.001
(0.02)
kl - -0.14
(0.12)
- -1.95
(0.89)
fdikl - 0.02
(0.02)
- 0.02
(0.01)
roy - - 0.14
(0.58)
-1.10
(1.73)
fdiroy - - 1.74E-03
(0.01)
0.02
(0.02)
Size 2.64E-04
(7.91E-05)
3.37E-04
(1.33E-04)
2.11E-04*
(9.01E-05)
3.66E-04
(1.31E-04)
Size square -7.62E-09
(5.12E-09)
-1.15E-08
(8.10E-09)
-6.91E-09
(5.78E-09)
-1.74E-08
(8.88E-09)
Observations 1226 928 515 241
Time Fixed Effects Yes Yes Yes Yes
Table .6 Time Break (2001-2006) and (2007-2013)
2001-2006 2007-2013
1 2 3 4 1 2 3 4
Foreign
shares
5.18E-04
(4.50E-04)
7.24E-04
(4.96E-04)
1.97E-04
(1.32E-03)
1.23E-03*
(5.54E-04)
-5.01E-05
(7.91E-05)
-1.44E-04
(1.34E-04)
2.50E-04
(2.12E-04)
6.33E-04**
(2.36E-04)
Openness -8.42E-04*
(4.04E-04)
-5.85E-04
(3.95E-04)
-2.04E-03
(1.47E-03)
4.06E-04
(3.21E-04)
-6.67E-05
(6.15E-05)
-6.83E-05
(6.10E-05)
-1.31E-04
(2.20E-05)
9.46E-04
(3.88E-04)
training 7.94*
(3.28)
9.10
(4.41)
7.70*
(7.31)
7.92*
(0.03)
0.54
(0.41)
0.74
(0.65)
1.15
(1.02)
0.78
(1.09)
fditrain -0.09**
(0.04)
-0.10
(0.05)
-0.21**
(0.09)
-0.28
(0.15)
-2.85E-04*
(3.57E-03)
-4.46E-03
(6.94E-03)
-0.01
(0.01)
-0.01
(0.01)
RnD - 0.25
(0.52)
- - - -0.02
(0.05)
- -
fdirnd - -0.01
(0.01)
- - - 3.96E-03
(3.40E-03)
- -
kl - - -0.14
(0.57)
- - - 0.02
(0.04)
-
fdikl - - 0.01
(0.03)
- - - -4.96E-04
(9.41E-04)
-
roy - - - 0.73
(0.97)
- - - 0.87**
(0.34)
fdiroy - - - -9.12E-03
(0.01)
- - - -0.01**
(6.50E-03)
Observatio
ns
943 499 414 207 1365 727 514 308
Time
Fixed
Effects
Yes Yes Yes Yes Yes Yes Yes Yes
Note: All the results are based on random effects panel data estimation. All the results control for firm specific
factors like size, size square, power and fuel consumption and expenses on raw materials. All the nominal
values have been deflated by industry wise whole sale price index with the base year 2004-2005. Time fixed
effects are also included. All the reported errors are robust standard errors.
Appendix
Table 7 Summary Statistics
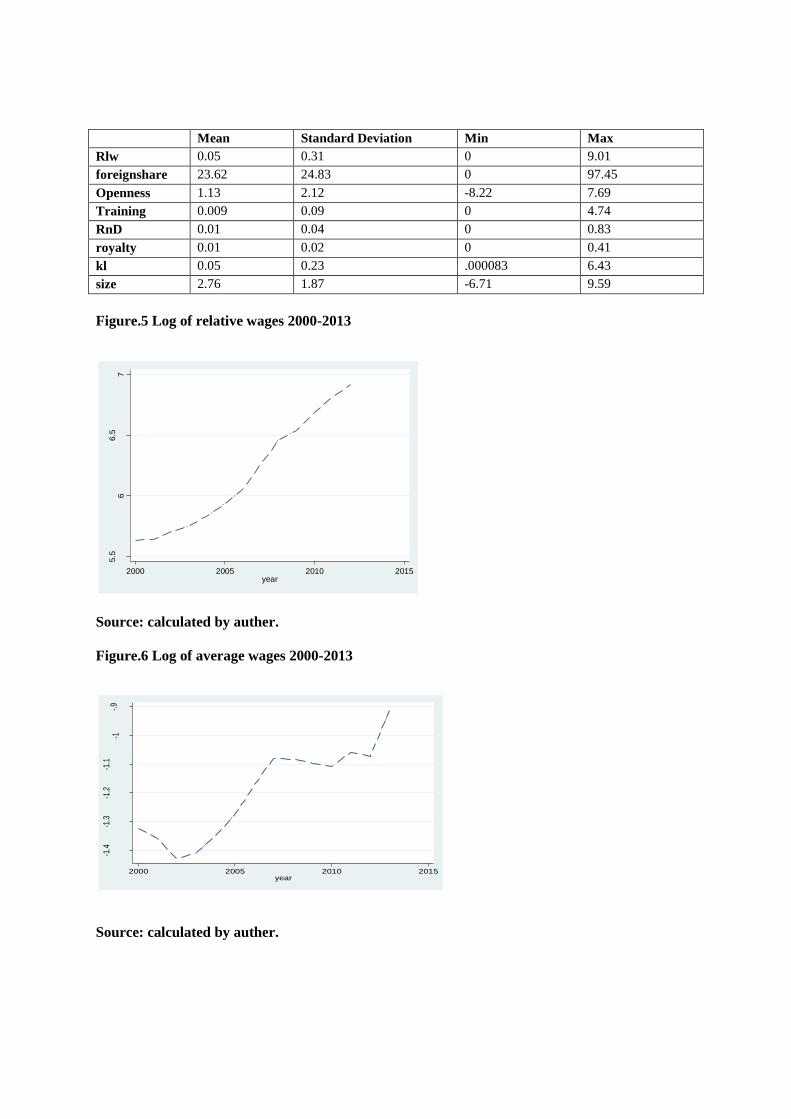
Mean Standard Deviation Min Max
Rlw 0.05 0.31 0 9.01
foreignshare 23.62 24.83 0 97.45
Openness 1.13 2.12 -8.22 7.69
Training 0.009 0.09 0 4.74
RnD 0.01 0.04 0 0.83
royalty 0.01 0.02 0 0.41
kl 0.05 0.23 .000083 6.43
size 2.76 1.87 -6.71 9.59
Figure.5 Log of relative wages 2000-2013
Source: calculated by auther.
Figure.6 Log of average wages 2000-2013
Source: calculated by auther.
5.5
66.5
7
lnavg
w
2000 2005 2010 2015year
-1.4
-1.3
-1.2
-1.1
-1-.9
lnrlw
2000 2005 2010 2015year
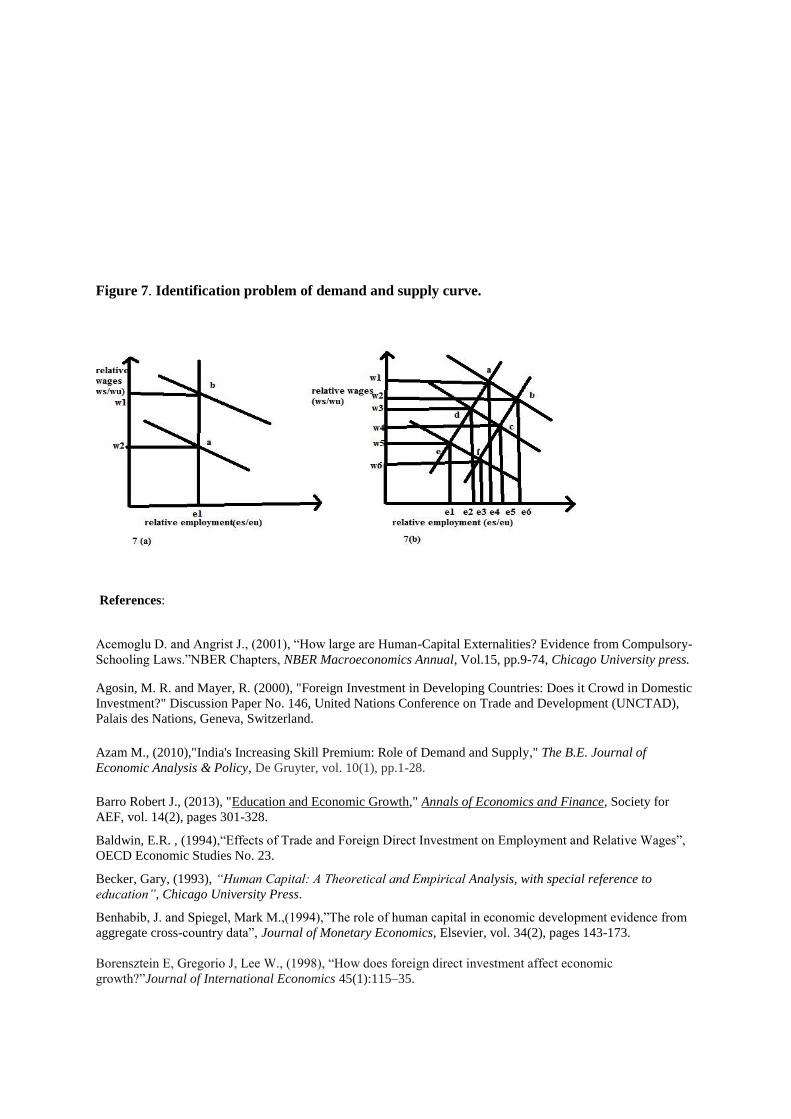
Figure 7. Identification problem of demand and supply curve.
References:
Acemoglu D. and Angrist J., (2001), “How large are Human-Capital Externalities? Evidence from Compulsory-
Schooling Laws.”NBER Chapters, NBER Macroeconomics Annual, Vol.15, pp.9-74, Chicago University press.
Agosin, M. R. and Mayer, R. (2000), "Foreign Investment in Developing Countries: Does it Crowd in Domestic
Investment?" Discussion Paper No. 146, United Nations Conference on Trade and Development (UNCTAD),
Palais des Nations, Geneva, Switzerland.
Azam M., (2010),"India's Increasing Skill Premium: Role of Demand and Supply," The B.E. Journal of
Economic Analysis & Policy, De Gruyter, vol. 10(1), pp.1-28.
Barro Robert J., (2013), "Education and Economic Growth," Annals of Economics and Finance, Society for
AEF, vol. 14(2), pages 301-328.
Baldwin, E.R. , (1994),“Effects of Trade and Foreign Direct Investment on Employment and Relative Wages”,
OECD Economic Studies No. 23.
Becker, Gary, (1993), “Human Capital: A Theoretical and Empirical Analysis, with special reference to
education”, Chicago University Press.
Benhabib, J. and Spiegel, Mark M.,(1994),”The role of human capital in economic development evidence from
aggregate cross-country data”, Journal of Monetary Economics, Elsevier, vol. 34(2), pages 143-173.
Borensztein E, Gregorio J, Lee W., (1998), “How does foreign direct investment affect economic
growth?”Journal of International Economics 45(1):115–35.
Blundell, R., Dearden, L.,Meghir, C. and Sianesi, B.,(1999), “Human Capital Investment: The Returns from
Education and Training to the Individual, the Firm and the Economy”, Fiscal Studies, 20(1), pp. 1–23.
doi: 10.1111/j.1475-5890.1999.tb00001.x.
Cameron C.A. and Trivedi K.P.,(2005), “ Microeconometrics Methods and Applications”, Cambridge
University Press.
Chamarbagwala, R.,(2006), "Economic Liberalization and Wage Inequality in India," World Development,
Elsevier, vol. 34(12), pp. 1997-2015.
Choudhaury, R.B., Pyne, K.P and Chowdhury R.A., 2013,“Determinants of Manufacturing FDI in India: A
sectoral Analysis”, The Journal of Industrial Statistics, 2 (2) pp.217-231
Constantine, J. and Neumark, D., (1996), “Training and the Growth of Wage Inequality. Industrial Relations”,
AJournal of Economy and Society, 35: 491–510. doi: 10.1111/j.1468-232X.1996.tb00418.x.
Ciccone, A. and Peri, G., (2002), “Identifying Human Capital Externalities: Theory with an Application to US
Cities”, IZA Discussion paper series, No. 488.
Dasgupta, P.andGoldar, B.,(2005), “ Female Labour Supply in Rural India, An Econometric Analysis, Working
Paper No.265, Institute of Economic Growth, New Delhi.
De Mello, L. R., (1999), "Foreign Direct Investment-Led Growth: Evidence from Time Series and Panel
Data," Oxford Economic Papers, 51, 1999, pp. 133-51.
Gorg H. and Strobl E. (2002) “Relative wages, openness and skill biased technological change”, IZA Discussion
paper series, No. 596.
GoldarB.andBangaR. ,(2007) ,”Impact of Trade Liberalization on Foreign Direct Investment in Indian
Industries", Working Papers No. 3607, Asia-Pacific Research and Training Network on Trade (ARTNeT), an
initiative of UNESCAP and IDRC, Canada.
Gregario, D. J. (2003), “The role of Foreign Direct Investment and Natural Resources in Economic
Development”, Working papers No. 196, Central bank of Chile.
Feenstra, R. C. and Hanson, G. H., (1997), "Foreign direct investment and relative wages: Evidence from
Mexico's maquiladoras," Journal of International Economics, Elsevier, vol. 42(3-4), pp. 371-393.
FiginiP.andGörgH., (1999), "Multinational companies and wage inequality in the host country: The case of
Ireland," Review of World Economics (WeltwirtschaftlichesArchiv), Springer, vol. 135(4), pp. 594-612.
Fry, J. M.,(1993), “Foreign Direct Investment in a Macroeconomic Framework: Finance, Efficiency, Incentives
and Distortions”, Policy Research Working paper series 1141, International Economic Department, The World
Bank.
Harnermesh S. D., (1993), “Labour Demand”, Princeton, Princeton University Press.
Hasan R., Mitra,D. and Ramaswamy, K.V. , (2007), “Trade Reforms, Labor Regulations, and Labor-Demand
Elasticities: Empirical Evidence from India”, Review of Economics and Statistics,Vol., 89(3), pp.466-481.
Katz, Lawrence F & Murphy, Kevin M, (1992),”Changes in Relative Wages, 1963-1987: Supply and Demand
Factors ", The Quarterly Journal of Economics,MIT Press, vol. 107(1), pp. 35-78, February.
KapstienB.E. ,(2001), “Virtuous Circles? Human Capital Formation, Economic Development, and the
Multinational Enterprise”, Paper presented to the OECD Conference on FDI, Human Capital, and Education in
Developing Countries Technical meeting, Paris.
Kathuria,V.,(2001), “Foreign firms, technology transfer and knowledge spillovers to Indian manufacturing
firms: a stochastic frontier analysis”, Applied Economics, 33(5), pp. 625-642.
Kokko, A.(1994). "Technology, Market Characteristics and Spillovers," Journal of Development Economics,
43(2), pp. 279-93.
Kumar N. , Siddharthan N.S., (1994),‟Technology, firm size and export behaviour in developing countries: The
case of Indian enterprises‟, Journal of Development Studies, Vol. 31(2).
Liu, Q. and Qiu, L. D. (2014), “Labor Training and Foreign Direct Investment”, Review of International
Economics, 22(1), pp.151–166. doi: 10.1111/roie.12102.
Lucas, E.RobertJr,(1988), “On the Mechanics of Economic Development”, Journal of Monetary Economics,
Vol. 22 (1), pp. 3-42.
Mehta A.andHasan R.,(2011), “Effetcs of Trade and Services Liberalisation on Wage Inequality in
India”,AsianDevelopmentBank Working Paper Series No.268.http://dx.doi.org/10.2139/ssrn.1920004
Mincer, J., 1991, “Human Capital, Technology, and the Wage Structure: What do the time series show?”, NBER
Working Paper No. 3581.
Miyamoto, K., (2003), “Human Capital Formation and Foreign Direct Investment in Developing Countries”,
Working Paper No. 211, OECD Development Centre.
Kumar U. and Mishra P., 2008. "Trade Liberalization and Wage Inequality: Evidence from India," Review of
Development Economics, Wiley Blackwell, vol. 12(2), pp. 291-311.
Morris, S., (2007), “A Study of the Regional Determinants of Foreign Direct Investments in India and the Case
of Gujarat”, Indian Institute of Management (Ahmedabad), Working Paper No. 2004/03/07.
Mukherjee A.,(2011), “Regional Inequality in Foreign Direct Investment Flows to India: The Problem and the
Prospects”, Reserve Bank of India Occasional Papers, Vol. 32( 2).
Nelson R.R. and Phelps,E.S., (1966), “Investment in Humans, Technological Diffusion, and Economic
Growth”, American Economic Review, Vol. 56(1/2), pp. 69-75.
Nunnenkamp, P. and Rudi S., (2007)“Foreign Direct Investment in Post Reform India: Likely to Work Wonder
for Regional Development?” Kiel Working Paper No. 1375.
Parameswaran M., (2009), „International Trade, R&D Spillovers and Productivity: Evidence from Indian
Manufacturing Industry‟, Journal of Development Studies, Vol. 45( 8).
Pissarides, A.C., (2000), “Human Capital and Growth: A synthesis Report”, OECD Development
Centre Working paper No. 168, OECD publishing.
Ramaswamy K.V., (2008), "Wage Inequality in Indian Manufacturing - Is it Trade, Technology or Labour
Regulations?," Labor Economics Working Papers 22361, East Asian Bureau of Economic Research.
Ritchie,K.B., (2002), “Foreign Direct Investment and Intellectual capital formation in South-East Asia” OECD
Development Centre, Working Paper No. 194.
Romer, M. P,(1986), “Increasing Returns and Long-Run Growth”, The Journal of Political Economy, Vol. 94,
No. 5.pp. 1002-1037.
Sahu, P, 2010, „FDI, wage inequality and employment in emerging economies: recent evidence from Indian
manufacturing‟, MPRA paper.
Schafer, Joe, (2005), “Missing Data in Longitudinal Studies: A Review”, Department of Statistics and The
Methodology Center , The Pennsylvania State University.
Tan Hong W. and BatraGeeta, (1996), “Enterprise Training in Developing Countries:Overview of Incidence,
Determinants, and Productivity Outcomes”, Private Sector Development Department, Occasional Paper No. 9,
World Bank.
Velde Dirk Te and Morrissey Oliver,(2004), “ Foreign Direct Investment, skills and wage inequality in East
Asia”,Journal of the Asia Pacific Economy , Vol. 9, Iss. 3.
Veum, R.J., (1995), “Training, Wages and the Human Capital Model”, Bureau of Labour Statistics, Department
of labour, U.S. Working paper No.262.
Wilson A. R. and G. B., (2004), “The impact of Human Capital on Economic Growth: a review” in Descy, P.;
Tessaring, M. (eds) “Impact of education and training”, Third report on vocational training research in Europe,
EUR-OP, (Cedefop Reference series, 54).


