Embed Size (px)
Citation preview
Effects of culture conditions on the photoautotrophic growth and biochemical composition of Chlamydomonas
reinhardtii, as a potential source for hydrogen production
Virkning av dyrkningsforholdene på fotoautotrof vekst og biokjemisk sammensetning av Chlamydomonas reinhardtii, som en potensiell kilde for bruk i produksjon av hydrogen
Philosophiae Doctor (PhD) Thesis
Daria Markina
Department of Plant Sciences Faculty of Veterinary Medicine and Biosciences
Norwegian University of Life Sciences
Ås 2014
Thesis number 2014:85 ISSN 1894-6402
ISBN 978-82-575-1244-6


1
Supervisors
Main supervisor:
Professor Hans Ragnar Gislerød
Department of Plant Sciences
Norwegian University of Life Sciences
Co-supervisors:
Dr. Leiv M. Mortensen
Department of Plant Sciences
Norwegian University of Life Sciences
Professor Jorunn Elisabeth Olsen
Department of Plant Sciences
Norwegian University of Life Sciences
Dr. Igor A. Yakovlev
Norwegian Forest and Landscape Institute
Evaluation committee
Associate Professor Dr. Niels Thomas Eriksen
Aalborg University, Denmark
Assistant Professor Dr. ir. Packo P. Lamers
Wageningen University, the Netherlands
Committee administrator:
Dr. Yeon Kyeong Lee
Department of Plant Sciences
Norwegian University of Life Sciences

2
Acknowledgments
The work presented in this thesis was carried out at the Department of Plant Sciences and at
the Plant Cell Laboratory at the Norwegian University of Life Sciences during the period 2011 –
2015. The project was financed by the Norwegian Research Council (Project 20328: Use of solar
energy for CO2 capture, algae cultivation and hydrogen production – BioH2) and the Norwegian
University of Life Sciences.
First of all, I would like to sincerely thank my main supervisor, Hans Ragnar Gislerød, for his
supervision, guidance, encouragement, and support throughout my PhD period. I would also like to
thank Leiv Mortensen for the lively scientific discussions and his many ideas that undoubtedly
maintained me aware of things I hadn’t take into consideration and that contributed a good deal to the
quality of my work. I am very grateful to Jorunn Olsen for her thorough reading and commenting on
my papers and my thesis, which greatly improved the quality of this thesis. I would also to thank
Yeon Kyeong for supporting me during the ‘re-submission’ period.
A special thank to all the people from the Plant Cell Laboratory. You made my days in the lab
enjoyable and made me feel at home there. I couldn’t have wished for a warmer welcome when I first
arrived, especially from Gry and Astrid. I also want to thank you all for your patience during the time
I was learning Norwegian. Without those countless conversations (and cakes, sweets, and ice cream)
at coffee breaks and lunches, I could have never progressed so rapidly. I value the ambience in the
lab, how easy it is to talk to people there and how friendly everyone is. I will remember the great
moments we had together with Gry, Astrid, Tone, Ida, Anne Guri, Yeon Kyeong, Linda, Dalia,
Anette, Marit, Trina, Lars Harald, Zhibo, Shiori, Luz, Paul, Meseret, Amsalu. My years in the lab
were a great life experience and more than colleagues, I consider you my friends. Thanks to Tone and
Linda for always ordering materials for me. I am also very grateful to Dag for all his patience and
technical help in the lab, without which I couldn’t have done half the experiments I made.
I really don’t have the words to express my gratitude to my best friend and my lab technician,
my ‘humble servant’, my ‘work wife’, Silje. You know I could never have done this without you. I
always dreamt about working with my best friend. But, I could never imagine how much fun it could
be and how happy it would make me. On the serious side, thank you for all your patience with me, for
helping me prepare the materials for my experiments and cleaning everything afterwards, for
weighing endless amounts of filters, for taking samples for me, for being always so thorough when

3
taking the dry weight or doing anything else, for always willing to learn new stuff and foreseeing all
my lab needs before I could even think about them myself. One couldn’t really wish for a more
perfect co-worker. Thank you for bringing in the radio to the lab. It was the best idea ever.
Morgenklubben med Loven og Co at the radio Norge couldn’t be a better start to a day of sample-
taking and the disco-mood at top volume inside the algae room, in the media kitchen and the
weighing room, as well as at my bench (although at lower volume) made the repetitive endless tasks
so much more bearable. I don’t think I can even start thanking you for all the other wonderful things
you brought to my life, I would need a whole other thesis just for that. Thank you for always being
there for me when I needed you, for fun stuff and less fun stuff like moving and driving me and my
things, like Christmas trees, for introducing me to the knitting, for all the dinners and parties we’ve
had together, for the best 17th of May week end in Bergen, for always listening to me, whether it was
complaining or any little detail of my life I felt like sharing with you, for your wise advice, for
teaching me Norwegian and correcting me, for all your perfect presents, for being so childish
sometimes and always sitting beside me at coffee breaks and lunches. I dedicate this thesis to you,
with all my love.
Huge thanks to all my friends in Ås that made my PhD years SO fun! Thanks to Rachel,
Stephanie, Valeriya, Anja, and Bianca for the indescribable and unforgettable wine nights. To
Davide, Paulo, and Sergio for all the dinners and parties we had at their houses. To Dimitris for our
memorable birthday parties. To Emilio, because ‘life is good’. Thanks to Felipe for bringing Latin
America to Ås. To Michele for all the activities we did together and the conversation we had. And to
all the others that I had the pleasure to meet and spend time with during these last four years. This
PhD gave me a second opportunity to have a proper student life and I enjoyed it immensely.
I would especially like to thank Mauricio for your patience and for always listening to me, for
being at my side when I needed you, for your advice and for all that you give me with your affection.
Above all, thanks to my parents for believing in me, for listening and advising me during my PhD
period, for always being there for me, no matter what. My mom has always been an inspiration to me,
my role model, my everything. No words could express my gratitude and my love.
Ås, 2015.
4
Table of contents
1. Abstract _________________________________________________________________ 6
2. Sammendrag _____________________________________________________________ 9
3. List of papers ___________________________________________________________ 12
4. Abbreviations ___________________________________________________________ 13
5. Introduction ____________________________________________________________ 15
5.1. Bioenergy from microalgae _______________________________________________ 15
Biofuels __________________________________________________________________ 15
Biofuels from microalgae ____________________________________________________ 17
5.2. Chlamydomonas reinhardtii: morphology, physiology, and metabolism ___________ 23
Organism’s origin __________________________________________________________ 23
Cell morphology ___________________________________________________________ 24
The life cycle of Chlamydomonas reinhardtii ____________________________________ 25
Cell metabolism ___________________________________________________________ 28
5.3. Growing Chlamydomonas reinhardtii _______________________________________ 33
Photobioreactors ___________________________________________________________ 33
Cultivation regimes_________________________________________________________ 34
Culture conditions affecting growth and biochemical composition of Chlamydomonas
reinhardtii ________________________________________________________________ 41
5.4. Hydrogen production by Chlamydomonas reinhardtii __________________________ 65
Hydrogen production in green microalgae: historic overview of scientific discoveries ____ 65
Why do microalgae produce hydrogen? _________________________________________ 65
Biochemistry of hydrogen production in Chlamydomonas reinhardtii _________________ 66
Use of acetate for hydrogen production _________________________________________ 69
6. Aims of the present study __________________________________________________ 71
7. Materials and methods ____________________________________________________ 72
7.1. Experimental setup ______________________________________________________ 72

5
7.2. First series of experiments: concentrations of ammonium, phosphate, sulfate, and
carbon dioxide (Papers I and II) _______________________________________________ 74
7.3. Second series of experiments: light intensity, temperature, and CO2 concentration
(Paper III) _________________________________________________________________ 78
7.4. Third experiment: calcium and magnesium concentrations (Paper IV) ___________ 79
7.5. Determination of the dissolved CO2 concentration ____________________________ 80
7.6. Determination of the biomass content in the cultures __________________________ 82
7.7. Setup of the biochemical assays ____________________________________________ 84
8. Main results and discussion ________________________________________________ 86
8. 1. pH ___________________________________________________________________ 87
8. 2. Productivity ___________________________________________________________ 88
8. 3. Biomass yield __________________________________________________________ 91
8. 4. Starch content __________________________________________________________ 95
8. 5. Protein content _________________________________________________________ 98
8. 6. Chlorophyll content ____________________________________________________ 100
8.7. Tables ________________________________________________________________ 102
9. Concluding remarks and future perspectives _________________________________ 106
10. References _____________________________________________________________ 108
6
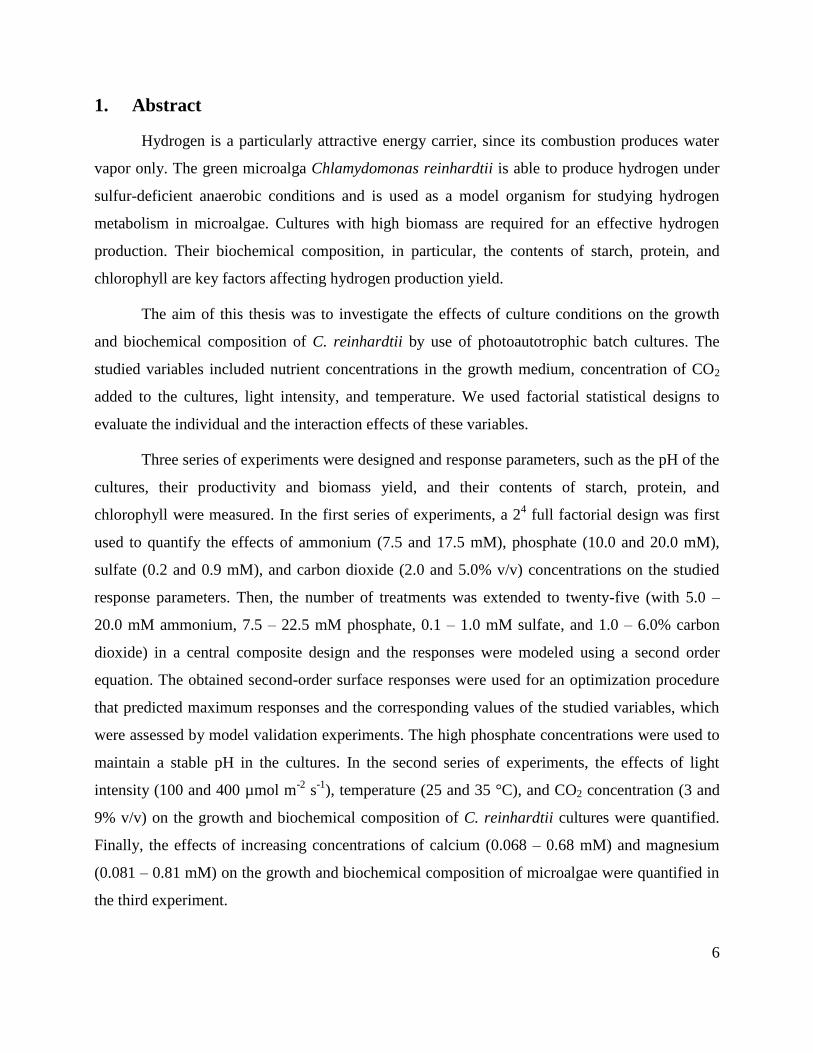
1. Abstract
Hydrogen is a particularly attractive energy carrier, since its combustion produces water
vapor only. The green microalga Chlamydomonas reinhardtii is able to produce hydrogen under
sulfur-deficient anaerobic conditions and is used as a model organism for studying hydrogen
metabolism in microalgae. Cultures with high biomass are required for an effective hydrogen
production. Their biochemical composition, in particular, the contents of starch, protein, and
chlorophyll are key factors affecting hydrogen production yield.
The aim of this thesis was to investigate the effects of culture conditions on the growth
and biochemical composition of C. reinhardtii by use of photoautotrophic batch cultures. The
studied variables included nutrient concentrations in the growth medium, concentration of CO2
added to the cultures, light intensity, and temperature. We used factorial statistical designs to
evaluate the individual and the interaction effects of these variables.
Three series of experiments were designed and response parameters, such as the pH of the
cultures, their productivity and biomass yield, and their contents of starch, protein, and
chlorophyll were measured. In the first series of experiments, a 24 full factorial design was first
used to quantify the effects of ammonium (7.5 and 17.5 mM), phosphate (10.0 and 20.0 mM),
sulfate (0.2 and 0.9 mM), and carbon dioxide (2.0 and 5.0% v/v) concentrations on the studied
response parameters. Then, the number of treatments was extended to twenty-five (with 5.0 –
20.0 mM ammonium, 7.5 – 22.5 mM phosphate, 0.1 – 1.0 mM sulfate, and 1.0 – 6.0% carbon
dioxide) in a central composite design and the responses were modeled using a second order
equation. The obtained second-order surface responses were used for an optimization procedure
that predicted maximum responses and the corresponding values of the studied variables, which
were assessed by model validation experiments. The high phosphate concentrations were used to
maintain a stable pH in the cultures. In the second series of experiments, the effects of light
intensity (100 and 400 µmol m-2
s-1
), temperature (25 and 35 °C), and CO2 concentration (3 and
9% v/v) on the growth and biochemical composition of C. reinhardtii cultures were quantified.
Finally, the effects of increasing concentrations of calcium (0.068 – 0.68 mM) and magnesium
(0.081 – 0.81 mM) on the growth and biochemical composition of microalgae were quantified in
the third experiment.

7
The maximum productivity was predicted to be 0.87 g L-1
d-1
for 5 mM ammonium, 0.65
mM sulfate, and 6% CO2 in the first series of experiments, and this result was confirmed by the
model validation experiment. The productivity of the cultures was greatly influenced by
increasing CO2 concentrations. The productivity increased significantly (to 1.12 g L-1
d-1
) by
increasing the light intensity to 400 µmol m-2
s-1
and the temperature to 35 ºC in the second series
of experiments. A further increase in productivity to 1.97 g L-1
d-1
was achieved in the third
experiment by increasing ten times the concentrations of calcium and magnesium in the medium
in relation to the medium used in the two first series of experiments.
The biomass yield was positively influenced by the ammonium and sulfate
concentrations, as well as by their interaction, but to a less extend by the CO2 concentration. The
maximum biomass yield measured in the first series of experiments was 1.57 g L-1
and it was
1.35 g L-1
in the second series of experiments. The concentrations of calcium (0.068 mM) and
magnesium (0.081 mM) in the growth media used in these cultures were shown to be limiting for
growth over a biomass of about 1 g L-1
, as we obtained a biomass of 4.83 g L-1
by increasing ten
times the concentrations of calcium and magnesium.
The maximum predicted contents of starch and protein were quite high in the first series
of experiments: 55 and 65% of dry weight, respectively. These results were confirmed by the
model validation experiments. Starch and protein contents varied inversely to each other as
response to varying growth medium composition. High concentrations of ammonium and sulfate
enhanced protein accumulation, while cells grown in media with low concentrations of
ammonium and sulfate accumulated starch as a general response to nutrient limitation, even if
these two nutrients were not completely depleted from the medium. Both starch and protein
contents increased with increasing light intensity in the second series of experiments, although
starch did not exceed 11% of dry weight, due to the nutrient sufficiency of the growth medium.
The chlorophyll content of the cultures increased with increasing concentrations of ammonium
and sulfate in the media of the first series of experiments and with decreasing light intensity and
increasing temperature in the second series of experiments.
For obtaining cultures with high biomass, high protein, and high chlorophyll contents, we
recommend using media with increased concentrations of ammonium, sulfate, calcium, and
magnesium. In such cultures, use of a good pH buffer is encouraged. Media with low ammonium

8
content are recommended for cultures with high productivity and starch content. By increasing
light intensity (up to 400 µmol m-2
s-1
), temperature (up to 35 °C), CO2 (up to 9% v/v), and
calcium (to 0.68 mM or higher) and magnesium (to 0.81 mM or higher) concentrations, the
productivity and starch content can be further increased.
Key-words
Biochemical composition, carbon dioxide, Chlamydomonas reinhardtii, light intensity, modeling,
nutrient concentrations, photoautotrophic growth, temperature.

9
2. Sammendrag
Hydrogen er en spesiell attraktiv energikilde, siden utslippet ved forbrenning er
vanndamp. Grønnalgen Chlamydomonas reinhardtii er i stand til å produsere hydrogen ved
mangel på svovel under anaerobe forhold og brukes som modellorganisme for å studere
hydrogenmetabolismen hos mikroalger. Det kreves kulturer med høy biomasse for en effektiv
hydrogenproduksjon. Den biokjemiske sammensetningen av algene og spesielt innholdet av
stivelse, protein og klorofyll er sentrale faktorer som påvirker effektiviteten i
hydrogenproduksjonen.
Hensikten med dette arbeidet var å studere virkningen av dyrkingsbetingelsene på vekst
og biokjemisk sammensetning hos C. reinhardtii dyrket fotoautotroft i batch kulturer. Innholdet
av næringsstoffer i dyrkingsmediet, CO2-konsentrasjon tilført algekulturen, belysningsstyrke og
temperatur ble studert. Faktoriell design ble brukt som statistisk analyse for å studere hoved- og
samspillseffekter av de ulike variablene.
Det ble lagt opp tre forsøksserier hvor en studerte pH i kulturene, produktivitet og
biomassetetthet, og innholdet av stivelse, protein og klorofyll. I den første forsøksserien, som var
et 24
faktorielt forsøk, ble virkningen av ammonium (7.5 og 17.5 mM), fosfat (10.0 og 20.0 mM),
sulfat (0.2 og 0.9 mM) og karbondioksid (2 og 5 %) undersøkt. Forsøket ble så utvidet til 25
behandlinger (med 5.0 – 20.0 mM ammonium, 7.5 – 22.5 mM fosfat, 0.1 – 1.0 mM sulfat, og 1.0
– 6.0 % karbondioksid) i en «central composite design» og hvor virkningen av de ulike faktorene
ble modellert ved bruk av andregradsligninger. De oppnådde resultatene ble brukt for å
optimalisere virkningen på de studerte variablene, som igjen ble testet. Det høye fosfatinnholdet
ble tilført for å holde en stabil pH i kulturene. I den andre forsøksserien ble virkningen av
belysningsstyrke (100 og 400 µmol m-2
s-1
), temperatur (25 og 35 °C) og CO2 (3 og 9 %) på vekst
og biokjemisk sammensetning undersøkt. I den siste forsøksserien undersøkte en virkningen av
kalsium (0.068 – 0.68 mM), og magnesium (0.081 – 0.81 mM), på vekst og biokjemisk innhold i
C. reinhardtii.
Den maksimale veksthastigheten ble beregnet til 0.87 g L-1
d-1
ved bruk av 5 mM
ammonium, 0.65 mM sulfat og 6% CO2 i den første forsøksserien og resultatene ble bekreftet i
testforsøk. Produktiviteten til C. reinhardtii økte ved økende tilførsel av CO2. Produktiviteten
10
økte signifikant (til 1.12 g L-1
d-1
) ved å øke belysningsstyrken til 400 µmol m-2
s-1
og
temperaturen til 35 ºC. En videre økning i produktiviteten til 1.97 g L-1
d-1
ble oppnådd i den
tredje forsøksserien med å ti-doble kalsium og magnesium konsentrasjonen i forhold til innholdet
i mediet brukt i de to første forsøksseriene.
Maksimal biomasse ble påvirket av konsentrasjonen av både ammonium og sulfat, så vel
som samspillet mellom disse, men noe mindre av CO2-tilførselen. Den maksimale
biomassetettheten oppnådd i den første forsøksserien var 1.57 g L-1
og 1.35 g L-1
i forsøksserie to.
Konsentrasjonen av kalsium (0.068 mM) og magnesium (0.081 mM) brukt i disse forsøksseriene
viste seg å være for liten når tettheten i kulturene oversteg ca. 1 g L-1
, og det ble oppnådd en
tetthet på 4.83 g L-1
ved å ti-doble disse konsentrasjonene.
Det maksimalt beregnede innholdet av stivelse og protein var meget høyt i den første
forsøksserien, henholdsvis 55 og 65 % av tørrvekten. Disse resultatene ble bekreftet av
testforsøkene. Innholdet av stivelse og protein i algene var negativt korrelert og reagerte
forskjellig avhengig av sammensetningen av mediet. Høy konsentrasjon av ammonium og sulfat i
dyrkingsmediet fremmet innholdet av protein, mens lav konsentrasjon av ammonium og sulfat
førte til betydelig økning av stivelse, selv om det var en del igjen av disse stoffene i
dyrkingsmediet. Både stivelse og proteininnholdet i algene økte med økende belysningsstyrke i
forsøksserie to, men innholdet av stivelse oversteg ikke 11 % av tørrvekten, trolig fordi det var
rikelig med ammonium og sulfat i dyrkingsmediet. Klorofyllinnholdet i algene økte med økende
innhold av ammonium og sulfat i dyrkingsmediet og var høyest ved lav belysningsstyrke (100
µmol m-2
s-1
).
For å oppnå kulturer med høy biomassetetthet, høyt innhold av protein og klorofyll bør
det anvendes høye konsentrasjoner av ammonium, sulfat, kalsium og magnesium. I slike opplegg
er det viktig å bruke gode buffere for å holde en stabil pH i dyrkingsmediet. For å oppnå høy
produktivitet og høyt innhold av stivelse, bør konsentrasjonen av ammonium i dyrkingsmediet
være på et nivå slik at det oppstår en mangelsituasjon mot slutten av kulturene. Ved å bruke høye
belysningsstyrker (opp til 400 µmol m-2
s-1
), temperaturer (opp til) 35 °C, konsentrasjon av CO2
(opp til 9 %), kalsium (0.68 mM) og magnesium (0.81 mM) vil produktiviteten og
stivelsesinnholdet kunne økes ytterligere.

11
Emneord
Biokjemisk sammensetning, Chlamydomonas reinhardtii, fotoautotrof vekst, karbondioksid,
modellering, næringssammensetning av vekstmediet, temperatur, vekstlys.

12
3. List of papers
This thesis is based on the following articles:
Paper I:
Effects of ammonium, phosphate, sulfate, and carbon dioxide concentrations on starch, protein,
and chlorophyll contents during photoautotrophic growth of Chlamydomonas reinhardtii
Daria Markina, Leiv M. Mortensen, Hans Ragnar Gislerød
Submitted to the Journal of Phycology
Paper II:
Modeling the effects of nutrient concentrations on the photoautotrophic growth and biochemical
composition of Chlamydomonas reinhardtii
Daria Markina, Hans Ragnar Gislerød
Manuscript
Paper III:
Effects of light intensity, temperature, and carbon dioxide concentration on photoautotrophic
growth and biochemical composition of Chlamydomonas reinhardtii
Daria Markina, Hans Ragnar Gislerød
Manuscript
Paper IV:
The importance of calcium and magnesium for the growth of Chlamydomonas reinhardtii
Daria Markina, Hans Ragnar Gislerød
Submitted to the Journal of Plant Physiology
13
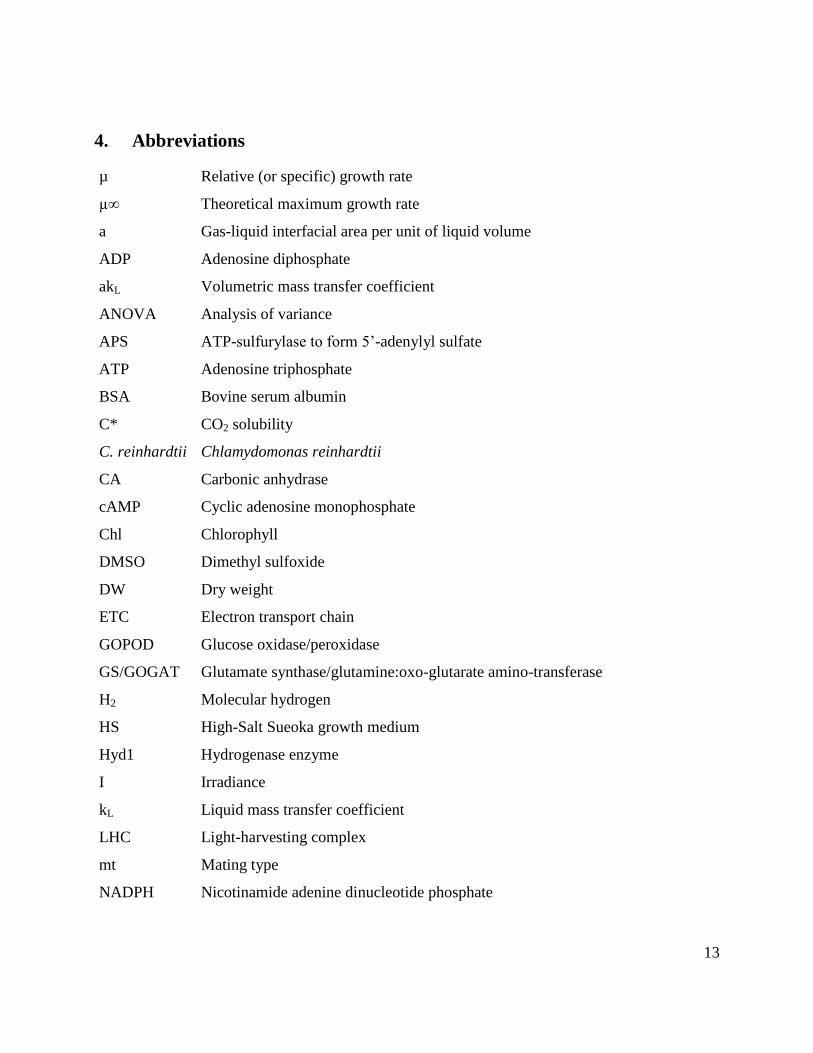
4. Abbreviations
µ Relative (or specific) growth rate
µ∞ Theoretical maximum growth rate
a Gas-liquid interfacial area per unit of liquid volume
ADP Adenosine diphosphate
akL Volumetric mass transfer coefficient
ANOVA Analysis of variance
APS ATP-sulfurylase to form 5’-adenylyl sulfate
ATP Adenosine triphosphate
BSA Bovine serum albumin
C* CO2 solubility
C. reinhardtii Chlamydomonas reinhardtii
CA Carbonic anhydrase
cAMP Cyclic adenosine monophosphate
Chl Chlorophyll
DMSO Dimethyl sulfoxide
DW Dry weight
ETC Electron transport chain
GOPOD Glucose oxidase/peroxidase
GS/GOGAT Glutamate synthase/glutamine:oxo-glutarate amino-transferase
H2 Molecular hydrogen
HS High-Salt Sueoka growth medium
Hyd1 Hydrogenase enzyme
I Irradiance
kL Liquid mass transfer coefficient
LHC Light-harvesting complex
mt Mating type
NADPH Nicotinamide adenine dinucleotide phosphate

14
nit Nitrate reductase
NIVA Norsk institutt for Vannforskning – Norwegian Institute for Water Research
OD Optical density
P Photosynthetic rate
p p-value
PAPS 3’-phospho-5’-adenylyl sulfate
PAR Photosynthetically active radiation
PBR(s) Photobioreactor(s)
PFD Photon flux density
PFOR Pyruvate:ferredoxin oxidoreductase
Pmax Maximum photosynthetic rate
PS Photosystem
Psr Phosphorus starvation response
Q Intracellular nutrient quota
Q10 Temperature coefficient
Qmin Minimum intracellular cell quota
RNA Ribonucleic acid
ROS Reactive oxygen species
Rubisco Ribulose-1,5-bisphosphate carboxylase-oxygenase
SAG Sammlung von Algenkulturen – Culture collection of algae
TAG(s) Triacylglycerol(s)
TAP Tris-Acetate-Phosphate growth medium
15
5. Introduction
5.1. Bioenergy from microalgae
The current world energy supply is largely dependent on fossil fuels. Indeed, according to
the International Energy Agency (2013), over 80% of the energy we use today derives from
petroleum, coal, and natural gas. The intensive use of fossil fuels leads to major pollution
problems. The major issue with the use of fossil fuels is the greenhouse gas emissions that drive
climate change, increasing the atmospheric and oceans temperatures. On the other hand, the
energy demand is rising in a world with growing population and increasing standard of living.
Fossil fuels are, however, an exhaustible resource and their shortage is predicted to happen in the
21st century. To solve this environmental and energy crisis situation, we need to find alternative
renewable and environment-friendly sources of energy. The development of renewable energies
has enormous potential and some technologies are currently available, such as hydropower, wind
energy with windmill parks, and solar energy with photovoltaics. Nevertheless, the transport
fuels require liquid or gas fuels, which can be obtained from biomass, and are called biofuels.
Biofuels
Biofuels are produced from the sunlight energy and carbon dioxide through
photosynthesis by plants, algae, and cyanobacteria. Solar energy is a major energy source, the
total solar energy received at Earth’s surface being over three orders of magnitude higher than the
world’s energy use (Larkum 2010). Biofuels are usually considered to be renewable and
environment-friendly, and constitute therefore a sustainable alternative to fossil fuels. The main
advantage of the biofuels over other renewable energy sources, such as wind or solar energy, is
that the biofuels can be used in transportation, especially in air travel, and could eventually
replace the fossil fuels in this area.
The term biofuel refers to solid, liquid, or gas fuels that are predominantly produced from
biomass. The solid biofuels include wood, charcoal, plant residues, and animal dung, and are
usually used for heating through burning. The liquid biofuels are bioalcohols (methanol, ethanol,
propanol, and butanol), vegetable oils, and biodiesels and are usually used for transportation.

16
Biogas, biomethane, and biohydrogen are gas biofuels that can be used to produce electricity, for
heating, or as transportation fuels.
The biofuels produced from sugar, starch, or vegetable oil derived from arable crops, such
as cereals, sugarcane, and oil crops are commonly called first-generation biofuels (Juneja et al.
2013). The main limitations of producing biofuels in this way are the intensive agricultural input,
the pollution due to the use of pesticides and fertilizers, the extensive land requirements, the
intensive freshwater use, and, above all, the trade-off between the food crops and fuel crops
production (Juneja et al. 2013). The use of food crops to produce biofuels is, according to the
World Bank Group, the main factor driving up the food prices (Mitchell 2008). This affects
countries in development the most.
The second-generation biofuels are fuels derived from lignocellulosic biomass and
agricultural residues (Juneja et al. 2013). They circumvent several of the negative outcomes
associated with the first-generation biofuels, but also require agricultural input, land, and
freshwater that could be used for food crops (Juneja et al. 2013). The processing of this kind of
biomass to convert it into fuels is also problematic.
The biofuels from algae are considered to be the third-generation biofuels (Juneja et al.
2013). Production of algal biofuels avoids most of the limitations of the first- and second-
generation biofuels, including the food vs. fuel dilemma (Juneja et al. 2013). Algae have higher
photosynthetic efficiency compared to the terrestrial plants (Chisti 2007). The maximum
theoretical photosynthetic efficiency of conversion of solar energy into biomass is 4.6% for C3
plants and 6% for C4 plants (Zhu et al. 2008). Algae, however, can reach efficiencies up to 9%
(Dismukes et al. 2008). Microalgae can reach higher biomass productivities due to their faster
growth rates compared to terrestrial plants (Guschina and Harwood 2013; Marques et al. 2012).
They also produce 10 – 20 times more oil (ha-1
year-1
) than any oil crops (Guschina and Harwood
2013).
Microalgae can grow in saline, brackish, and coastal seawater with little competition
(Guschina and Harwood 2013). They are grown in liquid medium, which can be handled easily
and the nutrients can be recycled (Juneja et al. 2013). Microalgae cultures use much less water
than traditional crops, with the possibility of using non-potable water, including waste waters,
17
which can be treated in this way (Chisti 2007). Microalgae can also be cultivated in variable
climates and non-arable lands, including marginal areas unsuitable for agricultural purposes, such
as deserts and seashore lands (Marques et al. 2012). Production of microalgae can avoid certain
environmental impacts, such as soil desertification and deforestation and it does not require use
of pesticides (Chisti 2007). More importantly, cultivation of microalgae does not displace food
crop cultures.
Biofuels from microalgae
- Brief history
The concept of using algae as a source of renewable fuels and energy dates back to 1931
(Borowitzka and Moheimani 2013) and it regained much attention during the 1990’s oil crisis
(Borowitzka 2013). It was first proposed in 1942 that microalgae might be suitable sources of
lipids, which could be used to produce fuels (Harder and von Witsch 1942). Microalgae have
been the subject of applied research for their commercial and industrial potential since the early
1950’s when productivity and yield were first studied in mass culture by J. S. Burlew (1953). The
commercial production of microalgae mainly for use as nutritional supplements and
nutraceuticals started in the 1960’s. The commercial farming of microalgae is, thus, less than 60
years old. The studies on microalgae mass culture in the 1970’s made significant progress in
understanding the nutrient requirements of microalgae and the effects of their limitations on
growth, as well as the effects of temperature and light in outdoors cultures (Borowitzka 2013).
Since then, several species of microalgae have been commercially produced, mainly in open pond
systems, for use as nutritional supplements, pigments, and for aquaculture feed. Between 1980
and 2000, large research programs in Japan and United States focused on developing microalgal
energy production systems (Barbosa and Wijffels 2013). In 1980, the United States Department
of Energy began the ‘Aquatic Species Program’, which aimed at developing microalgae as a
source of liquid oil fuels that would be able to compete with the fossil fuels (Ferrel and Sarisky-
Reed 2010). Sheehan et al. (1998) noted in the conclusion to their report on the findings of this
program that ‘perhaps the most significant observation is that the conditions that promote high
productivity and rapid growth (nutrient sufficiency) and the conditions that induce lipid

18
accumulation (nutrient limitation) are mutually exclusive. Further research will be needed to
overcome this barrier, probably in the area of genetic manipulation of algal strains to increase
photosynthetic efficiency or to increase constitutive levels of lipid synthesis in algal strains’.
Since then, considerable research efforts have been made in this direction (for review, see
Guschina and Harwood 2013).
- Liquid fuels from microalgae
When microalgal growth slows down due to nutrient limitation in the growth medium,
carbon energy storage compounds, such as lipids and carbohydrates are synthesized and are
accumulated in large amounts if the nutrient limitation situation is not reversed. Several species
of microalgae accumulate substantial amounts (up to 50% of the dry biomass and more) of non-
polar lipids, mainly in the form of triacylglycerols (TAGs) and hydrocarbons. Bioethanol also
can be produced from microalgae, either via fermentation of the algal carbohydrates, or produced
directly through microalgal photosynthesis (Chisti 2013). Then, the microalgae need to be
harvested, dewatered, and the desired products extracted. Microalgal lipids can be converted to
gasoline, kerosene (jet fuel), and diesel fuels that are indistinguishable from the equivalent fuels
derived from petroleum (Chisti 2012). Liquid fuels derived from microalgae have performed
outstandingly in tests (Haik et al. 2011). Microalgal transport fuels are therefore a proven
technology.
- Hydrogen production from microalgae
Microalgae can also be used to produce gas biofuels such as biogas and biohydrogen.
Hydrogen (H2) is a particularly attractive energy carrier, since the only by-product of its
combustion is water (Equation 1). H2 also offers the highest mass-based chemical energy density
and can be used in fuel cells or combustion engines (Lehr et al. 2012).
However, the current technologies, by which H2 is obtained are based on the fossil fuels cracking,
which is accompanied by CO2 emissions (Fouchard et al. 2005). One sustainable H2 production
process is the natural ability of certain green microalgae and cyanobacteria to produce H2 in a
19
defined environment (Lehr et al. 2012). BioH2 production using solar energy and electrons
derived from water for the use as a renewable energy carrier is regarded as one of the most
environmentally benign and sustainable energy solutions (Peters et al. 2013). The biggest
advantage of producing H2 using microalgae as compared to producing liquid biofuels is that H2
is a gas and it is released from the cells into the medium and can be collected in the gas phase of
the reactor. No elaborate down-stream processing is therefore required for its production. The
green microalga Chlamydomonas reinhardtii produces the highest levels of H2 reported to date
and has been extensively used as a model organism for studying microalgal H2 metabolism
(Ghysels and Franck 2010). It is for this reason that this particular microalga was the
microorganism of choice in the present study. Nevertheless, currently, the yields of H2 production
are far below those required for the production of H2 from microalgae to be economically viable
(Peters et al. 2013).
- Constrains and prospects to the commercialization of biofuels from microalgae
In spite of the immense potential of microalgae to produce liquid and gas biofuels, several
constrains exist to the commercialization of this technology. The challenges are both
technological and economical.
First of all, photosynthesis is an intrinsically inefficient process. Even if the microalgal
photosynthesis is more efficient than the plants’ one, the maximum theoretical efficiencies have
not yet been attained in practice (Zhu et al. 2008). The low yields and photochemical conversion
efficiencies are the main technological drawbacks (Akkerman et al. 2002). Other challenges
include photoinhibition and other stresses, decline in biomass production yields due to competing
microalgae, pathogens, and ageing, among others. Optimization of the light path length and of the
photobioreactors (PBRs) design is necessary (Akkerman et al. 2002). The photosynthetic
productivity and light use efficiencies could also be improved by reducing the size of the light-
harvesting antenna complexes of the chosen microalgae strains (Beckmann et al. 2009;
Borowitzka 2013; Melis et al. 1998; Polle et al. 2002).
On the other hand, production of microalgae is a rather energy-demanding process. A
positive energy balance in the microalgal fuel production is imperative for it to make sense. The

20
large-scale, at which microalgae need to be produced to meet the requirements of bioenergy
production, is challenging. Mixing of the cultures and sparging for both degassing and CO2
supply require important mechanical energy input. Large amounts of water and nutrients are
required for considerable amounts of microalgae to be produced. Sustainability of microalgal
biofuels production requires the development of almost complete recycling of phosphorous and
nitrogen in microalgal cultures (Chisti 2013). Sources of low-cost and concentrated CO2 would
also be necessary for large-scale production systems. The down-stream processes of harvesting,
dewatering, and extraction of lipids from the microalgal biomass are also very energy-demanding
and the current technologies are not suitable for the large-scale production of biofuels.
New microalgae strains need to be screened and improved through genetic engineering to
increase the lipid accumulation or the H2 production yields. Knowledge of how cultivation
conditions affect productivity and biochemical composition of microalgae is important for
choosing the optimal growth conditions for higher growth rates, biomass production, and level of
lipids or carbohydrates accumulation (Guschina and Harwood 2013). More knowledge needs to
be gained in different disciplines, integrated, applied, and demonstrated in an industrial context
(Barbosa and Wijffels 2013).
The high cost of producing microalgae biomass postpones into the future the use of
microalgal biofuels as an economical, renewable, and sustainable source of biofuels and
bioenergy (Borowitzka 2013). Therefore it is essential to optimize all the factors influencing
microalgae biomass production and reduce the costs. The costs of the PBRs and their operation
and maintenance are the most critical to be reduced (Akkerman et al. 2002). On the other hand, it
was early recognized that the economics of commercial utilization of microalgae largely depend
on the cost of harvesting and dewatering (Soeder 1978). This is valid for liquid biofuels
production. However, in the case of bioH2, harvesting and dewatering are not necessary as H2 is a
gas and is released by the microalgae into the medium and can be collected directly from the
overhead compartment of the PBRs.
A biorefinery approach (Figure 1) may be the only economically feasible way of using
microalgae to produce bioenergy. A biorefinery is a facility that integrates biomass conversion
processes and equipment to produce biofuels, power, and diverse chemicals from biomass
(Demirbas 2009). The lipid content in microalgae can be as high as 50% of the dry biomass and

21
even higher percentages (as high as 60% of the dry biomass) are found as proteins and starch
(Becker 2007; Singh and Gu 2010). These fractions can be used to produce biodiesel, bioethanol,
biohydrogen, bioplastic, and other products (Chisti 2007; Hempel et al. 2011; Hirano et al. 1997;
Hu et al. 2008; John et al. 2011; Melis et al. 2000; Nguyen et al. 2009; Ueno et al. 1998). The
residual microalgae cake can be used for producing valuable co-products, such as carotenoids,
astaxanthin, and other pigments, ω-3 fatty acids, vitamins, polysaccharides, and proteins, among
others (Becker 2007; Borowitzka and Borowitzka 1990; Chen and Zhang 1997; Tripathi et al.
2002). These compounds can be used in a variety of commercial applications, such as
aquaculture and animal feed, textile industry, nutraceuticals and dietary supplements, chemical
and cosmetic industries, fertilizers industry, and others. The residual protein from the biomass
also can be used for livestock, poultry, and fish feed additives (Singh and Gu 2010).
Figure 1. Schematic representation of the biorefinery concept, where sunlight energy, CO2 from
flue gases, and nutrients from wastewater are used to produce microalgae biomass for
applications in biofuels, food, feed, pigments, fertilizers, and other commercial areas.
22
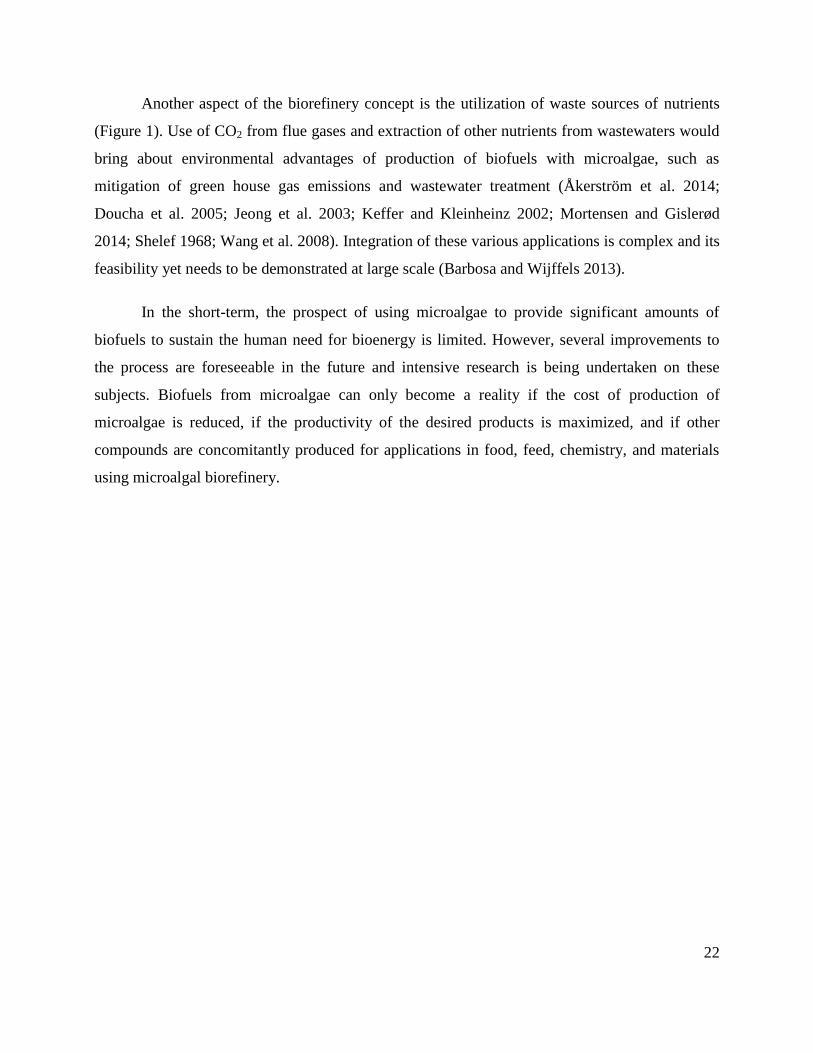
Another aspect of the biorefinery concept is the utilization of waste sources of nutrients
(Figure 1). Use of CO2 from flue gases and extraction of other nutrients from wastewaters would
bring about environmental advantages of production of biofuels with microalgae, such as
mitigation of green house gas emissions and wastewater treatment (Åkerström et al. 2014;
Doucha et al. 2005; Jeong et al. 2003; Keffer and Kleinheinz 2002; Mortensen and Gislerød
2014; Shelef 1968; Wang et al. 2008). Integration of these various applications is complex and its
feasibility yet needs to be demonstrated at large scale (Barbosa and Wijffels 2013).
In the short-term, the prospect of using microalgae to provide significant amounts of
biofuels to sustain the human need for bioenergy is limited. However, several improvements to
the process are foreseeable in the future and intensive research is being undertaken on these
subjects. Biofuels from microalgae can only become a reality if the cost of production of
microalgae is reduced, if the productivity of the desired products is maximized, and if other
compounds are concomitantly produced for applications in food, feed, chemistry, and materials
using microalgal biorefinery.

23
5.2. Chlamydomonas reinhardtii: morphology, physiology, and metabolism
Chlamydomonas reinhardtii is a green unicellular freshwater microalga, belonging to the
phylum Chlorophyta, of the order Chlorophyceae, which is characterized by their flagella. C.
reinhardtii was the first green microalga to have its genome sequenced (Merchant et al. 2007).
However, genetic studies on this microorganism have been performed since as early as 1875
(Harris 2009). Due to this early genetic characterization, its fast growth and its metabolic
adaptability, C. reinhardtii has been used as a model organism in various research aspects of cell
and molecular biology of microalgae and higher plants (Ball 2005; Harris 2001; Hicks et al.
2001; Pröschold et al. 2005). The main areas of current investigations using this model system
are chloroplast biogenesis, light perception, cell-cell recognition, cell cycle control, cell motility
(including flagella structure and function and genetics of basal bodies) (Harris 2001), and, most
recently, H2 production (Melis et al. 2000).
Organism’s origin
The species Chlamydomonas reinhardtii was first described in 1888 by P. A. Dangeard
(Dangeard 1888), and named after Ludwig Reinhard(t), an Ukrainian botanist (Harris 1989).
Most of the current laboratory strains of C. reinhardtii descend from a mating pair (of mating
type mt+
and mt -) of clones derived from a zygospore isolated in a potato field in Amherst,
Massachusetts, in 1945 and designated by G. M. Smith as isolate 137c (Harris 1989). In 1955,
Ebersold received cultures from Smith, but these microalgae had two nuclear gene mutations, nit-
1 and nit-2, which prevented these cells from utilizing nitrate for growth (Harris 1989). The strain
used in this study was the 137 c (mt+) strain originally obtained from the SAG (Sammlung von
Algenkulturen/Culture collection of algae) culture collection in Göttingen, Germany, where it is
named SAG 34.89. This strain is equivalent to the Ebersold-Levine phenotype nit-1, nit-2 Levine
137c(+), CC-125, and UTEX 2244 strains (SAG 2014). NIVA (Norsk institutt for vannforskning)
culture collection in Norway purchased the SAG 34.89 strain in 2001, and it has been stored
under the name CHL153 in the NIVA culture collection. We obtained the Chlamydomonas
reinhardtii 137c (mt+) NIVA strain personally on a Tris-Acetate-Phosphate (TAP) - agar solid
medium Petri dish from Dr. Kari Skjånes, Bioforsk, Ås, Norway, in February 2011.

24
Cell morphology
Vegetative C. reinhardtii cells are of ellipsoid shape of approximately 10 µm in diameter
and are characterized by two anterior flagella and a single cup-shaped basal chloroplast that
surrounds the nucleus (Figure 2).
The cell nucleus and nucleolus are prominent in cross-sections of C. reinhardtii. The 120
mega bases nuclear genome is distributed on its seventeen chromosomes in the haploid state
(Merchant et al. 2007). The nuclear membrane is continuous with the endoplasmic reticulum, and
one to four Golgi bodies are situated nearby (Harris 2001).
The chloroplast occupies the basal two thirds of the cell. The chloroplast genome is of 195
kilo bases. Thylakoid membranes have the form of flat vesicles or disks and can be single or
arranged in stacks inside the chloroplast (Harris 2009). This is the site for the light-dependent
reactions of photosynthesis. One or more pyrenoids surrounded by starch bodies are found within
the chloroplast (Ball et al. 1990). The pyrenoids are not membrane-bound organelles but
specialized areas of the chloroplast that contain high levels of the Ribulose-1,5-bisphosphate
carboxylase-oxygenase (Rubisco) enzyme (Kerby and Evans 1978). CO2 fixation reactions of
photosynthesis occur in pyrenoids.
Figure 2. Schematic representation of Chlamydomonas reinhardtii cell (modified from Harris
1989). C, chloroplast; E, eyespot; F, flagella; G, Golgi apparatus; M, mitochondria; N, nucleus;
P, pyrenoid; V, vacuole; W, cell wall.

25
The eyespot, or stigma, appears bright orange in light microscopy, due to high
concentration of carotenoids (Harris 2001). It is located just inside the chloroplast membrane at
the cell equator. The eyespot functions as a directional antenna that enables swimming cells to
orient themselves with respect to unidirectional light (Harris 2001).
Mitochondria have elongated or branching structure and are dispersed throughout the
cytosol (Harris 2001). The 15.8 kilo bases mitochondrial genome is linear and contains only a
few genes (Harris 2001). Mitochondria are the site of cell respiration, which provides the energy
(mainly in form of ATP) for the metabolic processes.
Two contractile vacuoles are located at the anterior end of the C. reinhardtii cell and are
involved in osmoregulation (Harris 2001).
The two flagella are of 10 – 12 µm length and they arise from a pair of basal bodies
located just beneath the apical end of the cell (Harris 2001). The flagella are responsible for cell
motility and mating. The basal bodies play an essential role during mitosis, as they assume their
role as centrioles.
Closely appressed to the plasma membrane, surrounding the cell, is the cell wall. The cell
wall of C. reinhardtii consists primarily of carbohydrates and hydroxyproline-rich glycoproteins
stacked in seven layers (Imam et al. 1985; Woessner and Goodenough 1994) and does not
contain cellulose (Roberts 1974).
The life cycle of Chlamydomonas reinhardtii
- Sexual cycle
C. reinhardtii has a simple life cycle (Figure 3) (Harris 2001) and an easily cultivated
haploid vegetative stage (marked ‘haploid progeny’ in Figure 3) (Pröschold et al. 2005). The
haploid C. reinhardtii cells can be of two mating types: mt+
and mt - (Harris 2001), which, when
deprived of nitrogen, differentiate into sexually competent gametes (Figure 3: gametogenesis).
Plus and minus gametes start pairing along the length of their flagella (Figure 3: aggregation)
initiating a cyclic adenosine monophosphate (cAMP)-mediated signal transduction cascade,
which results in ‘activation’ that consists of a morphological change in the flagellar tips and
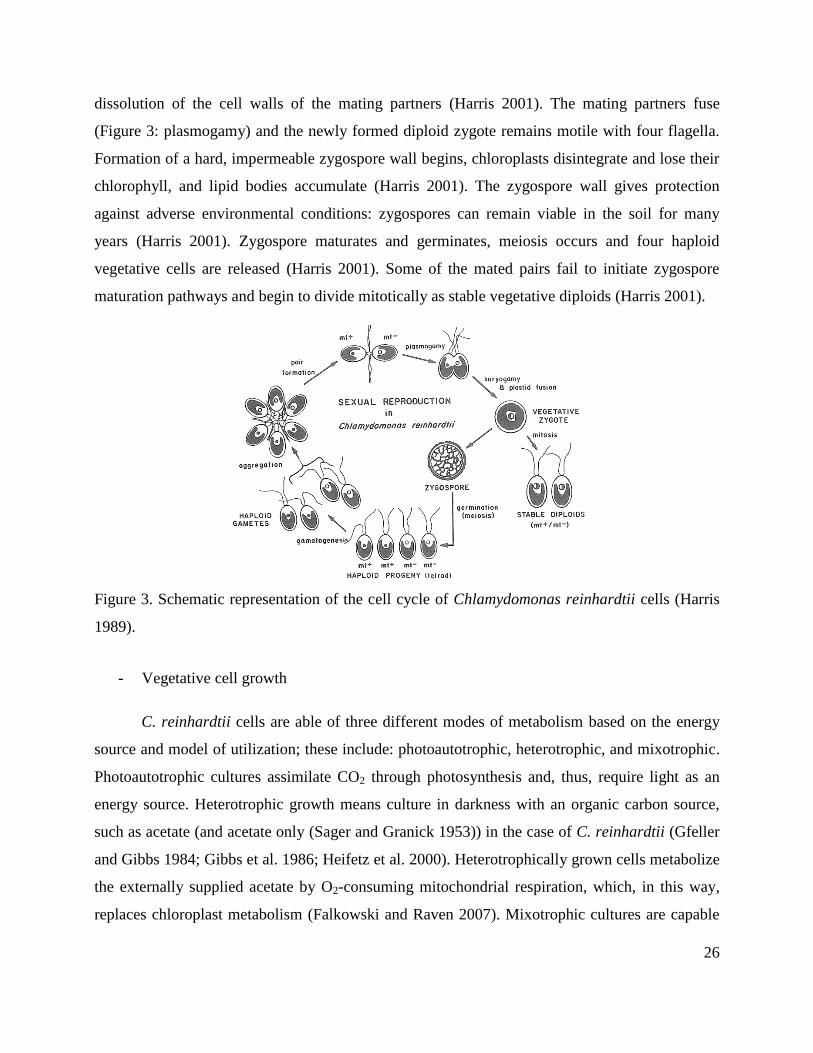
26
dissolution of the cell walls of the mating partners (Harris 2001). The mating partners fuse
(Figure 3: plasmogamy) and the newly formed diploid zygote remains motile with four flagella.
Formation of a hard, impermeable zygospore wall begins, chloroplasts disintegrate and lose their
chlorophyll, and lipid bodies accumulate (Harris 2001). The zygospore wall gives protection
against adverse environmental conditions: zygospores can remain viable in the soil for many
years (Harris 2001). Zygospore maturates and germinates, meiosis occurs and four haploid
vegetative cells are released (Harris 2001). Some of the mated pairs fail to initiate zygospore
maturation pathways and begin to divide mitotically as stable vegetative diploids (Harris 2001).
Figure 3. Schematic representation of the cell cycle of Chlamydomonas reinhardtii cells (Harris
1989).
- Vegetative cell growth
C. reinhardtii cells are able of three different modes of metabolism based on the energy
source and model of utilization; these include: photoautotrophic, heterotrophic, and mixotrophic.
Photoautotrophic cultures assimilate CO2 through photosynthesis and, thus, require light as an
energy source. Heterotrophic growth means culture in darkness with an organic carbon source,
such as acetate (and acetate only (Sager and Granick 1953)) in the case of C. reinhardtii (Gfeller
and Gibbs 1984; Gibbs et al. 1986; Heifetz et al. 2000). Heterotrophically grown cells metabolize
the externally supplied acetate by O2-consuming mitochondrial respiration, which, in this way,
replaces chloroplast metabolism (Falkowski and Raven 2007). Mixotrophic cultures are capable
27
of using acetate as supplement or replacement for light and CO2 as source of energy and carbon
for growth (Falkowski and Raven 2007).
In the laboratory, wild type C. reinhardtii cells are easily grown in liquid or on solid agar
media at pH in the range of 6.5 to 8.0, with no requirements for supplementary vitamins or other
co-factors (Harris 1989). E. Harris (1989) recommends to use deionized water when preparing
the culture medium for experimental work.
According to E. Harris (2001), optimal growth temperature is from 20 to 25 °C and
adequate irradiance is in the range of 200 to 400 µmol m-2
s-1
photosynthetic active radiation
(PAR). Photoautotrophic cultures of C. reinhardtii should be bubbled with 5% CO2 for maximum
growth (Harris 1989). Under these conditions, the average doubling time should be of 6 to 8 h.
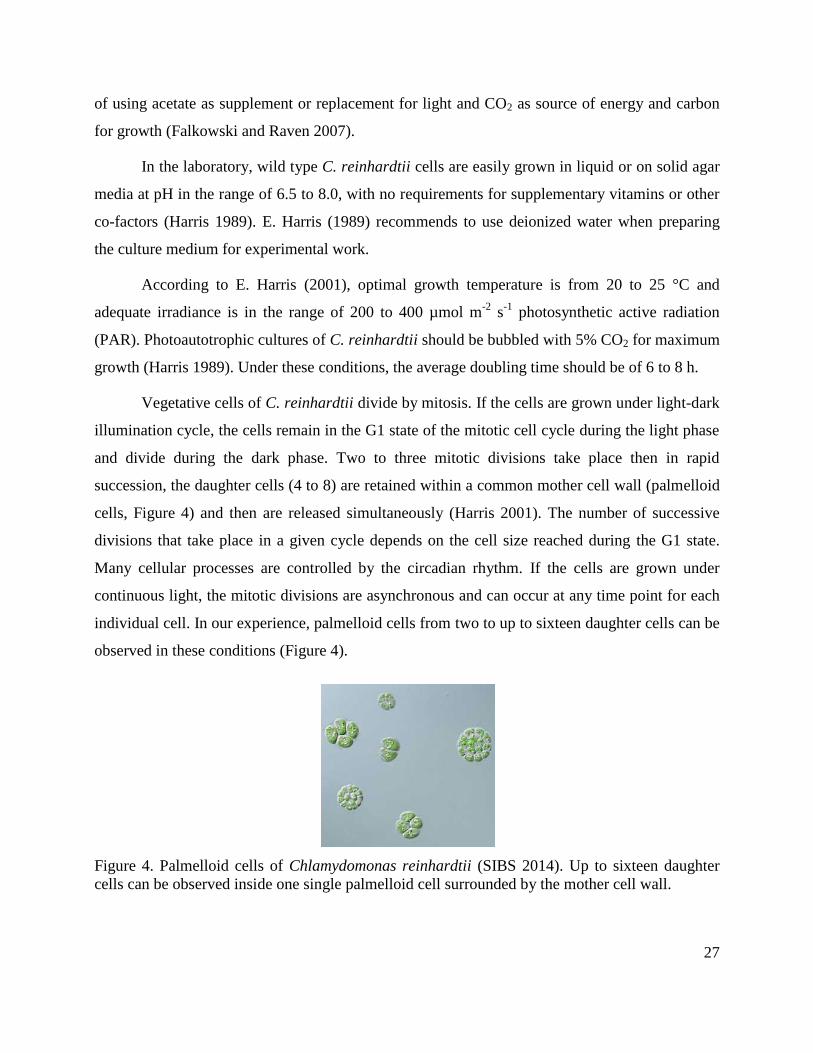
Vegetative cells of C. reinhardtii divide by mitosis. If the cells are grown under light-dark
illumination cycle, the cells remain in the G1 state of the mitotic cell cycle during the light phase
and divide during the dark phase. Two to three mitotic divisions take place then in rapid
succession, the daughter cells (4 to 8) are retained within a common mother cell wall (palmelloid
cells, Figure 4) and then are released simultaneously (Harris 2001). The number of successive
divisions that take place in a given cycle depends on the cell size reached during the G1 state.
Many cellular processes are controlled by the circadian rhythm. If the cells are grown under
continuous light, the mitotic divisions are asynchronous and can occur at any time point for each
individual cell. In our experience, palmelloid cells from two to up to sixteen daughter cells can be
observed in these conditions (Figure 4).
Figure 4. Palmelloid cells of Chlamydomonas reinhardtii (SIBS 2014). Up to sixteen daughter
cells can be observed inside one single palmelloid cell surrounded by the mother cell wall.

28
Cell metabolism
- Photosynthesis
Photosynthesis is the main process responsible for the fixation of inorganic CO2 into
organic molecules with sunlight as energy source (Shastri and Morgan 2005). Organisms capable
of photosynthesis obtain their energy by absorbing light energy for the reduction of CO2 through
oxidation of substrates, mainly water, and release O2 (Field et al. 1998). Aquatic photosynthetic
organisms fix almost half of the inorganic carbon from the atmosphere (Field et al. 1998).
The photosynthetic reactions occur in two steps. First, the light-dependent reactions are
responsible for light absorption and oxidation of water molecules (Figure 5). These redox
reactions produce chemical energy in form of adenosine triphosphate (ATP) and reductants in
form of nicotinamide adenine dinucleotide phosphate (NADPH). The light-dependent reactions
occur inside the chloroplast, across the thylakoid membranes (Raven 1980). The second step of
photosynthesis consists of biochemical reactions that are responsible for CO2 fixation.
In the first step of photosynthesis (Figure 5), light is intercepted by light-absorbing
pigments, i.e. chlorophyll a and other photosynthetic pigments, which are organized in supra-
molecular structures called antennae. The pigments are associated with specific proteins, forming
the light-harvesting protein – chlorophyll a complexes (LHC), which are embedded in the
thylakoid membranes (Dubinsky et al. 1995). By absorbing photons from the incident light beam,
the pigments become excited. The excitation energy is then transferred to the reaction centers in
the photosystems (PS), where it is trapped as chemical energy by oxidation of the excited state of
primary electron donor by a primary electron acceptor (Ley 1980). The water molecule is
oxidized at the PSII and charge separation occurs, one electron leaving the water molecule and
O2 being released (Dubinsky et al. 1995).
This electron is then transported by a cascade of redox reactions through what is called
the electron transport chain (ETC). The ETC consists of several membrane-bound and membrane
associated electron carriers. Two photosystems (PSII and PSI), each with a LHC, act in series
through an intermediary complex containing cytochromes b6 and f, among other redox molecules
(Figure 5).

29
The net result is that the redox state of the electrons passing through the ETC is elevated
from a level that brings about oxidation of water to a level capable of NADP+ reduction (Harris
2009). The energy of the electrons excited by light is used to generate a proton motive force by
the pumping of H+
across the thylakoid membrane from the stroma into the lumen, against the pH
gradient. A membrane-bound ATP synthase utilizes these protons to generate ATP. The ATP
synthase is a complex machinery that utilizes the proton motive force by letting the protons flow
along the pH gradient from the thylakoid lumen to the stroma to drive the phosphorylation of
ADP into ATP. The ATP synthase couples in this way the reducing power generated by
photosynthetic electron flow to the production of chemical energy storage compound, ATP
(Harris 2009).
Figure 5. Schematic representation of the light-harvesting reactions of photosynthesis (Taiz and
Zeiger 2010).
The ATP and NADPH generated by the light-dependent reactions are then used in the
carbon fixing reactions of photosynthesis. The initial fixation of CO2 is catalyzed by the Rubisco
enzyme through the following reaction:
Ribulose-1,5-bisphosphate + CO2 → 2 * 3-phosphoglycerate
30
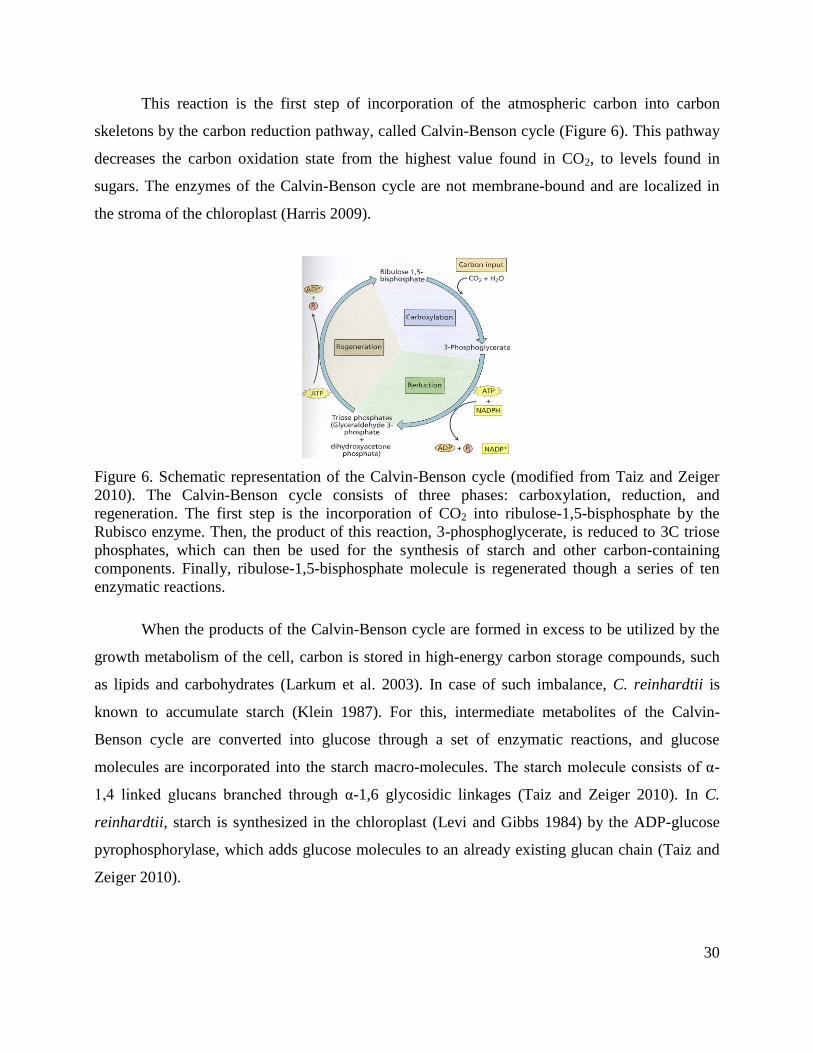
This reaction is the first step of incorporation of the atmospheric carbon into carbon
skeletons by the carbon reduction pathway, called Calvin-Benson cycle (Figure 6). This pathway
decreases the carbon oxidation state from the highest value found in CO2, to levels found in
sugars. The enzymes of the Calvin-Benson cycle are not membrane-bound and are localized in
the stroma of the chloroplast (Harris 2009).
Figure 6. Schematic representation of the Calvin-Benson cycle (modified from Taiz and Zeiger
2010). The Calvin-Benson cycle consists of three phases: carboxylation, reduction, and
regeneration. The first step is the incorporation of CO2 into ribulose-1,5-bisphosphate by the
Rubisco enzyme. Then, the product of this reaction, 3-phosphoglycerate, is reduced to 3C triose
phosphates, which can then be used for the synthesis of starch and other carbon-containing
components. Finally, ribulose-1,5-bisphosphate molecule is regenerated though a series of ten
enzymatic reactions.
When the products of the Calvin-Benson cycle are formed in excess to be utilized by the
growth metabolism of the cell, carbon is stored in high-energy carbon storage compounds, such
as lipids and carbohydrates (Larkum et al. 2003). In case of such imbalance, C. reinhardtii is
known to accumulate starch (Klein 1987). For this, intermediate metabolites of the Calvin-
Benson cycle are converted into glucose through a set of enzymatic reactions, and glucose
molecules are incorporated into the starch macro-molecules. The starch molecule consists of α-
1,4 linked glucans branched through α-1,6 glycosidic linkages (Taiz and Zeiger 2010). In C.
reinhardtii, starch is synthesized in the chloroplast (Levi and Gibbs 1984) by the ADP-glucose
pyrophosphorylase, which adds glucose molecules to an already existing glucan chain (Taiz and
Zeiger 2010).

31
- Photosynthetic rate is a function of irradiance
The fraction of solar radiation that is usable by photosynthetic systems is in the 400 to 700
nm range and is called photosynthetically active radiation (PAR). The amount of PAR incident
per unit area is called photosynthetic photon flux density (PFD) and is expressed as micromoles
of incident PAR photons per area per second (µmol m-2
s-1
).
The photosynthetic rate is a Poisson function of the irradiance. Indeed, the photosynthetic
rate depends on the irradiance in a way that is usually graphically represented by the so called –
‘photosynthesis versus irradiance’ (P vs. I) curve (Figure 7).
Figure 7. Irradiance-response curve of photosynthesis (modified from Richmond 2003).
Photosynthetic rate is usually measured as O2-evolution rate by a Clark-type oxygen electrode
(Walker 1993). The intercept of the vertical axis, O, is the measure of O2 uptake due to dark
respiration. Ic is the light compensation point, where photosynthetic O2 production rate is
equivalent to the O2 uptake rate by respiration. The initial slope, α, is the maximum efficiency of
light harvesting and utilization. Is is the irradiance level of onset of light saturation. Pmax is the
light-saturated rate of photosynthesis. It is the maximal attainable photosynthetic rate under
saturating irradiance. Ih is the irradiance at which photoinhibition is set off.
The photosynthesis-irradiance curve can be divided into three distinct regions: a light-
limited region, a light-saturated region, and a photoinhibited region. In the first region, the
photosynthetic rate is linearly proportional to the irradiance. At low irradiance levels, the rate of
photon absorption determines the rate of the steady-state electron transport from water to CO2;
that is why it is called the light-limited region. As the irradiance increases, the photosynthetic rate
becomes increasingly non-linear and rises to the saturation level, Pmax. Photosynthesis becomes
less light-efficient. At light saturation, the rate of photon absorption exceeds the rate of steady-
Irradiance

32
state electron transport from water to CO2. The enzymatic reactions utilizing fixed light energy
become rate limiting. Further increases in irradiance beyond the light saturation can lead to a
reduction in photosynthetic rate from the maximum saturation level (Baker and Bowyer 1994).
This reduction, which is dependent on both, the irradiance and the duration of exposure, is called
photoinhibition.
- Respiration
Aerobic (O2-consuming) respiration is a set of catabolic reactions occurring in
mitochondria, by which reduced organic carbon compounds generated during photosynthesis are
oxidized. In this way, respiration generates the carbon precursors for biosynthesis of a full range
of cellular components, such as nucleic acids, lipids, proteins, and structural polysaccharides. It
results, thus, in cell growth, at the same time as it releases the energy stored in carbon
compounds, generating ATP. Respiration also leads to production of reductants (NADH) and it
releases CO2. Respiration is therefore essential for growth and maintenance processes of the
microalgal cell (Larkum et al. 2003).

33
5.3. Growing Chlamydomonas reinhardtii
Photobioreactors
In practice, microalgae are cultivated either in outdoors open ponds or in closed
photobioreactors (Figure 8). The open ponds (Figure 8a) allow for large scale outside production
of microalgae and are currently the most used in commercial production. They are relatively easy
and inexpensive to build and operate. However, they present the inconvenience of easy
contamination of the cultures and little control over growth conditions.
Closed PBRs, on the other hand, avoid these drawbacks, but they are more expensive and
difficult to build and operate. They allow for more or less strict control over the different factors
that affect microalgae growth, among others, light, temperature, mixing, pH, salinity, CO2 supply
and O2 removal, nutrients concentrations, and culture mode. Many different designs of PBRs
exist nowadays. Probably the most popular are the tubular PBRs that can be arranged vertically in
racks (Figure 8b) or horizontally on the ground (Figure 8c). The flat panel PBRs can also be
arranged at different angles (Figure 8d and e). A simpler version are the vertical plastic cylinders
(Figure 8f) or sleeves (Figure 8g and h). Column PBRs are bubble columns or airlifts, which are
placed vertically, aerated from below, and illuminated through transparent walls (Eriksen 2008).
Column PBRs offer the most efficient mixing, the highest volumetric gas transfer rate, and the
best controllable culture conditions (Eriksen 2008). Experimental PBRs are therefore often
designs as bubble column, as was the case in this study.
Quite a lot of research is focusing on the optimal design of PBRs. The main factor to take
into account is the light-use efficiency, a term that reflects how much biomass is produced with
the available light (Eriksen 2008). For this, surface-to-volume ratio and light-path length,
inclination and orientation, as well as mixing are important parameters to take into consideration
(Richmond 2004).

34
Figure 8. Different designs of photobioreactors (Gouveia 2011). (a) Race ponds in California,
US. (b) Vertical tubular PBRs, Germany. (c) Horizontal tubular PBRs, at AlgaePARC, the
Netherlands. (d) Vertical flat panel PBR, Portugal. (e) Inclined flat panel PBR, Portugal. (f)
Vertical plastic cylinder PBR, Portugal. (g) Vertical plastic sleeves PBRs, Portugal. (h) Inclined
plastic sleeves PBRs, Portugal.
Cultivation regimes
- Continuous cultures
Microalgae can be cultured in different regimes: continuous, batch, or even immobilized.
In continuous regime, fresh growth medium is supplied and some of the culture is removed from
the PBR continuously or intermittently (semi-continuous culture). In a continuous culture, the
microalgae are maintained in a steady-state exponential growth. Growth can be defined as any
form of accretion of the biomass of microalgae in a culture (Andersen 2005). The main factor
controlling cell growth in a continuous system is the rate at which fresh medium is added (Becker
1994). In such cultures, when all the required nutrients are provided in excess, microalgae grow
in a balanced way and display a uniform chemical and biochemical composition (Goldman
1980). Two kinds of control strategies of continuous systems are used in microalgae cultures:
Chemostats, where the nutrient concentrations are maintained constant, or
Turbidostats, where the microalgal concentration inside the PBR is constant.
35
- Batch cultures
In a batch culture, on the other hand, a limited amount of growth medium and microalgal
inoculum are placed in a PBR and incubated in favorable conditions for growth (Richmond
2004). This is the most common method for cultivation of microalgae and is widely used in
commercial cultivation systems (Richmond 2004). Batch cultures have some advantages in terms
of expense, ease of manipulation, and required volume of medium (Andersen 2005). Batch
culture mode was therefore chosen to be employed in this study.
The biomass concentration in a batch culture is a function of time and is usually
graphically represented as a growth curve as in Figure 9 (Fogg and Thake 1987). The evolution
of biomass concentration in a batch culture is commonly divided in five growth phases:
1) Frequently, just after fresh medium has been inoculated, a lag phase (zone 1 in Figure 9) occurs,
where no apparent increase in cell number is observed. The conditions in the culture are different
from the previous environment experienced by the microalgae cells (Becker 1994) and often, the
cells are not adapted to the new environment and might be in an unhealthy condition (Becker
1994; Spencer 1954). Also, a portion of the newly inoculated cells might be not viable and does
not contribute to the growth (Fogg and Thake 1987). On the other hand, the viable cells might not
be in a condition to divide immediately, especially if the parent culture was an old one. Enzymes
may have been inactivated and concentrations of metabolites may have decreased to a level
insufficient for cell division (Hinshelwood 1946; Spencer 1954). During the lag phase, thus, the
enzymes are restored and the substrate concentrations increase to the levels necessary for rapid
growth. Some growth-enhancing factors might need to accumulate in the growth medium before
the cells can start their division or, on the contrary, some toxic compounds that inhibit growth
might be present in the medium (Fogg and Thake 1987; Huntsman and Barber 1975). The length
of the lag growth phase is directly dependent on the age of the inoculum, diminishing as this
entered the exponential phase of growth, being zero if the inoculum has been growing
exponentially, then increasing according to the duration of the stationary phase (Fogg and Thake
1987). The length of the lag phase also varies inversely with the size of the inoculum (Fogg and
Thake 1987). In this growth phase, there is high metabolic activity in the culture. The cells are

36
also much more sensitive to temperature and other environmental changes than cells in more
mature stage of development (Becker 1994).
2) Once the cells have accumulated sufficient metabolites and the necessary enzymes are activated,
the culture enters into the exponential growth phase (zone 2 in Figure 9), where the relative or
specific growth rate (µ) accelerates continuously. The growth rate can be expressed in different
measures of growth, such as cell numbers, volume of microalgal material, or cell nitrogen, which
are approximately the same, but not necessarily identical, since the mean generation time may
remain constant, while the mean cell volume or dry weight per cell alters (Fogg and Thake 1987).
The increment in microalgal biomass (dN) in time (dt) is proportional (µ) to the biomass (N) in
the population at any given moment:
The cells divide at increasing rate, determined by the intrinsic nature of the organism and the
culture conditions (Becker 1994). Measured under standard conditions, the relative growth rate is
usually rather constant for a particular species (Fogg and Thake 1987). Cell size is the main
determinant of the relative growth rate of a species, since it reflects the surface/volume ratio and,
thus, the relative rate at which nutrients can be taken up (Fogg and Thake 1987). It is a general
observation than small species grow faster than large ones (Banse 1976; Foy 1980).
For a given species, the relative growth rate is a function of temperature, light intensity,
and other environmental factors. It increases with temperature, but optimal temperatures may
vary with light intensity and concentration of nutrients (Eppley 1972; Eppley and Sloan 1966;
Hutner et al. 1957; Maddux and Jones 1964). The relative growth rate has the same general
relationship to light intensity as does the rate of photosynthesis, increasing proportionally to light
intensity when light is the limiting factor and being independent of light intensity when saturating
levels are reached (Fogg and Thake 1987; Sorokin and Krauss 1958). No self-shading effect
occurs at the low cell densities in the exponential growth phase. However, the response to
different light intensities alters quickly, while exponential growth is taking place (Steemann
Nielsen et al. 1962). If nutrients are supplied in sufficient amounts, changes in nutrient
concentrations caused by the uptake by the microalgae are so small that their effect on growth
can be neglected (Becker 1994). The effect of supplying a low concentration of a particular

37
nutrient to a batch culture is observed on the shorter duration of the exponential phase rather than
on the reduction of the relative growth rate (Fogg and Thake 1987).
In this growth phase, microalgae grow in a balanced way and display a uniform chemical
and biochemical composition (Fogg and Thake 1987). The metabolic pattern characteristic of the
exponential phase is of high photosynthetic capacity, which is devoted to production of protein
and other cell constituents involved in growth, rather than storage products or cell wall
constituents (Fogg and Thake 1987). Such actively growing cells have a high protein content, as
much as 70% of dry weight, whatever the taxonomic position (Fogg and Thake 1987).
3) After some time, the cell concentration becomes high enough for the cells to begin to shade one
another (phenomenon known as the self-shading effect) so that gradually a high absorption of
incident light occurs. Only the cells at the surface will receive a light intensity saturating for
photosynthesis, the bulk of the culture being light-limited, and if the culture is very dense, in
virtual darkness. The culture transitions then into the linear growth phase (Melis et al. 1998;
Sinetova et al. 2012). This transition is accompanied by a marked decrease in protein content
(Fogg and Thake 1987).
In the linear growth phase (zone 3 in Figure 9), the growth rate (or productivity) is
constant and the cell concentration increases linearly with time (Ogbonna et al. 1995b):
It is in the linear growth phase where the highest amount of biomass is produced in absolute
terms. The linear growth phase lasts until exhaustion of a certain nutrient occurs (Sinetova et al.
2012) or the culture reaches a stage, where respiration begins to interfere. In nutrient-rich, well
maintained cultures, this linear phase remains over a certain period of time (Becker 1994). The
linear growth phase is relatively longer than the exponential growth phase, regardless of the
irradiance (Ogbonna et al. 1995b). Ogbonna et al. (1995b) argued that during light-limited batch
cultivation of photosynthetic cells, the linear growth rate is a better indicator of growth than the
specific growth rate of the exponential growth phase. Ogbonna et al. (1995b) found a good
correlation between the linear growth rates and the final cell concentrations for both Chlorella
and Spirulina cells. Therefore in his study, we chose to study the productivity (g L-1
d-1
) of C.

38
reinhardtii cultures in the linear growth phase rather than the relative growth rate in the
exponential growth phase.
4) As the culture enters the stationary growth phase, the overall growth rate decreases with increase
in cell concentration (transition zone between linear and stationary growth phases, between zones
3 and 4 in Figure 9) (Ogbonna et al. 1995b) and the nutrients start to become limiting. The
duration of this transition zone depends on the nature of the limiting factor (Fogg and Thake
1987). Nutrient limitation, experienced by the cells in the stationary growth phase, often leads to
decrease in gross protein abundance in relation to carbohydrate and lipids and results in
unbalanced growth (Falkowski and Raven 2007). Alteration of the pH of the medium results
from a preferential uptake of particular constituents of the medium. Especially in the case of the
use of ammonium as a nitrogen source, the pH decreases causing the medium to become too
acidic to support growth (Fogg and Thake 1987). Oxidative breakdown of synthesized substances
starts to reduce the constant increment of biomass and equilibrium is reached between the
maximum microalgal biomass concentration and biomass loss due to degradation process. In the
stationary growth phase (zone number 4 in Figure 9), the maximum attainable microalgal
biomass concentration (or biomass yield) in a closed system is reached (Becker 1994). The
biomass yield attained in the stationary phase depends on the nature of the limiting factor (Fogg
and Thake 1987). If a nutrient is limiting, it is to be expected that the yield will be proportional to
the amount supplied initially (Fogg and Thake 1987). Great changes in the pattern of metabolism
and cell composition occur in microalgae during the exponential growth phase (Fogg and Thake
1987). For example, nitrogen-deficient Monodus subterraneus cells from an advanced stationary
growth phase contain less than 10% of dry weight in protein, low amounts of chlorophyll and
nucleic acids, but high contents of storage polysaccharides and lipids, accompanied by extremely
low photosynthetic and respiratory activity (Fogg 1959). There may be some differences between
microalgal classes in relation to their composition in the stationary growth phase, but these
changes are small compared with the differences in cell composition, which a single species can
experience in the course of growth in a culture (Fogg and Thake 1987).
5) Eventually, the unfavorable environmental conditions, the old age of the culture, the limited
supply of light and nutrients, and the contamination by other microorganisms lead to the death of
the culture (zone 5 in Figure 9). The reduced viability of the cell population is also due to the

39
release of growth-inhibiting organic substances into the medium (Jørgensen 1956). The time of
the onset of the death phase varies enormously according to species and the conditions of culture.
Often, the stationary phase may be maintained for several weeks, but sometimes the growth may
decline catastrophically immediately at the end of the linear phase. Finally, the death rate
becomes exponential, suggesting that death depends on some random event, and is followed by a
complete collapse of the microalgal population (Becker 1994).
Figure 9. Evolution of microalgal biomass concentration with time in a batch culture (modified
from Becker 1994). (1) Lag growth phase, (2) exponential growth phase, (3) linear growth phase,
(4) stationary growth phase, and (5) death phase.
- Modeling of microalgal growth
Growth rate may be calculated directly from change of biomass with time, ir a single
biomass determination can be used together with a rate measurement to give µ (Eppley and
Strickland 1968). Growth modeling of organisms is important to understand their behavior under
different environmental conditions, such as temperature, light intensity, pH, and nutrients
(Carvalho and Malcata 2003; Çelekli et al. 2008; Çelekli and Yavuzatmaca 2009; Celekli et al.
2009; Dermoun et al. 1992; Ogbonna et al. 1995b; Tevatia et al. 2012; Xin et al. 2010; Zonneveld
1996; Zonneveld 1998b; Zwietering et al. 1990). Such models are used for prediction of
microbial biomass production and optimization of growth conditions (Carvalho and Malcata
2005; Çelekli et al. 2008; Çelekli and Yavuzatmaca 2009; Jeong et al. 2008; Vieira Costa et al.
2002).
Several models exist on the dependency of microalgae steady-state growth in continuous
culture on concentrations of nutrients dissolved in the growth medium. They describe the relative
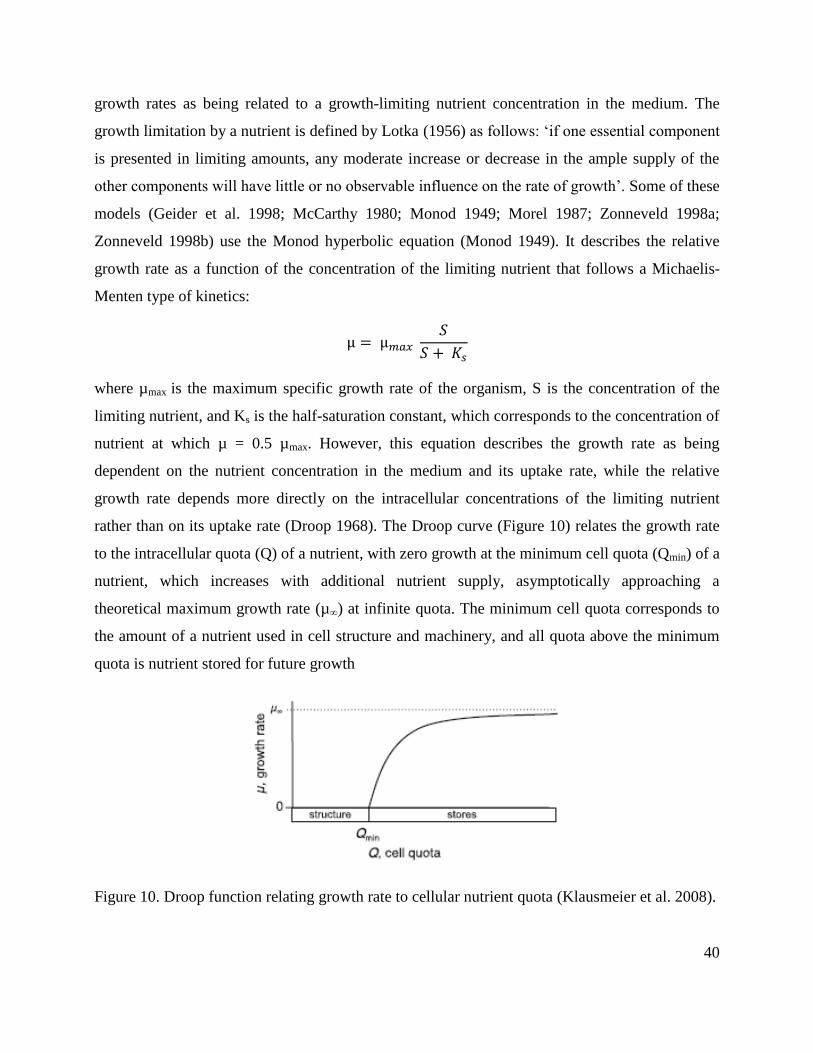
40
growth rates as being related to a growth-limiting nutrient concentration in the medium. The
growth limitation by a nutrient is defined by Lotka (1956) as follows: ‘if one essential component
is presented in limiting amounts, any moderate increase or decrease in the ample supply of the
other components will have little or no observable influence on the rate of growth’. Some of these
models (Geider et al. 1998; McCarthy 1980; Monod 1949; Morel 1987; Zonneveld 1998a;
Zonneveld 1998b) use the Monod hyperbolic equation (Monod 1949). It describes the relative
growth rate as a function of the concentration of the limiting nutrient that follows a Michaelis-
Menten type of kinetics:
where µmax is the maximum specific growth rate of the organism, S is the concentration of the
limiting nutrient, and Ks is the half-saturation constant, which corresponds to the concentration of
nutrient at which µ = 0.5 µmax. However, this equation describes the growth rate as being
dependent on the nutrient concentration in the medium and its uptake rate, while the relative
growth rate depends more directly on the intracellular concentrations of the limiting nutrient
rather than on its uptake rate (Droop 1968). The Droop curve (Figure 10) relates the growth rate
to the intracellular quota (Q) of a nutrient, with zero growth at the minimum cell quota (Qmin) of a
nutrient, which increases with additional nutrient supply, asymptotically approaching a
theoretical maximum growth rate (µ∞) at infinite quota. The minimum cell quota corresponds to
the amount of a nutrient used in cell structure and machinery, and all quota above the minimum
quota is nutrient stored for future growth
Figure 10. Droop function relating growth rate to cellular nutrient quota (Klausmeier et al. 2008).
41
Modeling of light-limited batch cultures of microalgae is, on the other hand, much more
complex since there are continuous changes in both intensity and distribution of light within the
reactor during the cultivation period. During high-cell density cultivation of photosynthetic cells,
incident light is absorbed within the periphery of the illuminated surface. Thus, only the surface
zone is illuminated, while the region away from the illumination surface may be completely dark.
The proportion of the reactor volume, which receives enough light for cell growth decreases with
increase in the cell concentration. Nutrient concentrations also vary over a wide range as the
batch culture progresses through its different phases, as the microalgal cells consume the
available nutrients for growth, in some cases until some nutrient becomes depleted. Many
industrial processes are conducted using batch cultures and modeling for design and optimization
of light-limited batch cultivation of microalgae is an important engineering challenge (Ogbonna
et al. 1995b). Culture experiments are often used to help evaluate the effects of different
environmental conditions on microalgal growth, physiology, or production of key metabolites
(Andersen 2005). An efficient method to optimize culture parameters is to employ a statistically
based factorial approach to experimental design (Anderson and Whitcomb 2000). This method
uses statistics to identify the culture parameters and the interactions between them that are the
most influential on achieving maximum biomass yield and productivity.
Culture conditions affecting growth and biochemical composition of Chlamydomonas reinhardtii
Growth factors such as nutrient concentrations, CO2 levels, pH, irradiance, and
temperature not only affect photosynthesis and productivity of the cell biomass of microalgae,
but also influence the activity of cellular metabolism and, thus, the cell composition. For a single
species, the variation in cell composition may vary manyfold, according to the culture conditions,
under which it is grown. The biochemical composition of cells changes in response to signals
received from the environment in a process known as acclimation. It is assumed that acclimation
serves to increase growth rate under suboptimal conditions over the value that would be achieved
if cellular biochemical composition was static (Geider et al. 1998). Acclimation may also serve to
limit the damage that may occur as a consequence of exposure to adverse environmental
conditions (Geider et al. 1998).
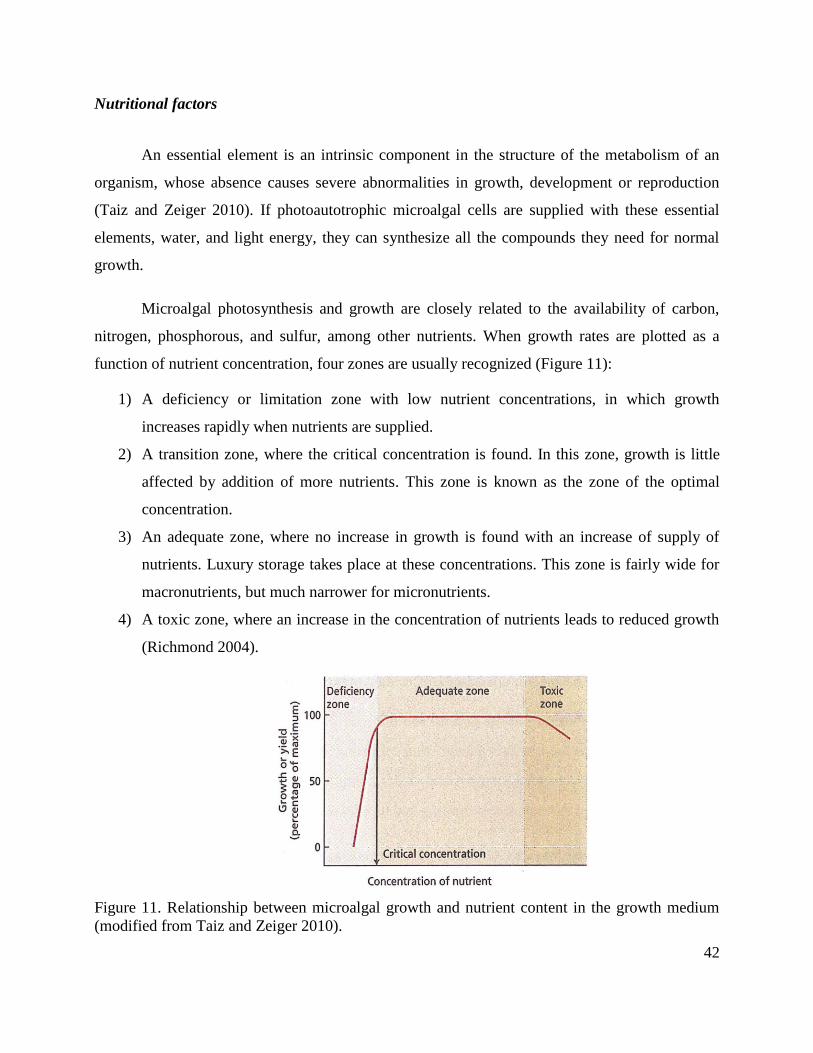
42
Nutritional factors
An essential element is an intrinsic component in the structure of the metabolism of an
organism, whose absence causes severe abnormalities in growth, development or reproduction
(Taiz and Zeiger 2010). If photoautotrophic microalgal cells are supplied with these essential
elements, water, and light energy, they can synthesize all the compounds they need for normal
growth.
Microalgal photosynthesis and growth are closely related to the availability of carbon,
nitrogen, phosphorous, and sulfur, among other nutrients. When growth rates are plotted as a
function of nutrient concentration, four zones are usually recognized (Figure 11):
1) A deficiency or limitation zone with low nutrient concentrations, in which growth
increases rapidly when nutrients are supplied.
2) A transition zone, where the critical concentration is found. In this zone, growth is little
affected by addition of more nutrients. This zone is known as the zone of the optimal
concentration.
3) An adequate zone, where no increase in growth is found with an increase of supply of
nutrients. Luxury storage takes place at these concentrations. This zone is fairly wide for
macronutrients, but much narrower for micronutrients.
4) A toxic zone, where an increase in the concentration of nutrients leads to reduced growth
(Richmond 2004).
Figure 11. Relationship between microalgal growth and nutrient content in the growth medium
(modified from Taiz and Zeiger 2010).
43
Stress responses to nutrient limitations
When microalgal growth is limited by some nutrient, two kinds of responses are triggered
in the cells: general responses and specific responses (Grossman 2000). The general responses
occur at the cellular level and apply to limitation by any nutrient. The specific responses, on the
other hand, are acclimation responses to a limitation in some specific nutrient.
The general responses entail various photosynthetic and metabolic changes that ultimately
result in the temporary cessation of cell growth and cell division (Grossman 2000). The general
responses to nutrient limitation include:
- cessation of cell division (Davies et al. 1996; Lien and Knutsen 1979),
- accumulation of carbohydrates (such as starch in the case of C. reinhardtii) or lipids,
synthesis of which diverts energy and fixed carbon from cell growth and division (Ball et
al. 1990; Ball et al. 1998),
- decline in photosynthetic rate and modification of photosynthetic activities (Davies et al.
1996; Peltier and Schmidt 1991; Wykoff et al. 1998),
- adaptation of the metabolism to reduced nutrient environment (Gauthier and Turpin 1994;
Theodorou and Plaxton 1993).
According to Grossman (2000), some of these responses may be a consequence of
changes in metabolism that occur because depriving a cell of nutrients blocks its growth and
limits the utilization of reductant (NAD(P)H) and chemical bond energy (ATP) generated by
photosynthetic electron transport. In this way, even if cells are grown under low to moderate
light, the photosynthetic ETC will be completely reduced and, thus, the redox potential of the cell
will be increased. This increase in the redox potential of the cell will have a global effect on
cellular metabolism. On the other hand, with the decreased demand for reductant, the cell will
tend to accumulate high potential electrons and excited chlorophyll molecules that can interact
with oxygen, producing reactive oxygen species (ROS). These molecules cause extensive cellular
damage, but they also function as regulatory signals that modulate metabolic activity.

44
Microalgae are also adapted to scavenge their environment for nutrients thanks to the
specific responses, be it through structural changes, storage, or increase in nutrient utilization
efficiency (Richmond 2004). The specific responses to nutrient limitation include:
- biosynthesis of transport systems that facilitate more efficient uptake of the limiting
nutrient into the cell,
- induction of hydrolytic enzymes that enable cells to access alternative sources of the
limiting nutrient. Some of these enzymes are exported to the surrounding medium or
associated with the cell wall,
- changes in the cellular organization that help minimize the use of the limiting nutrient.
Increase of specific intra-cellular enzymes that degrade macromolecules that contain the
limiting nutrient, such as protein (nitrogen and sulfur source), polyphosphate, RNA
(nitrogen and phosphorous source) and lipids (nitrogen and sulfur source),
- changes in components of the ETC, which are replaced by alternative molecules with
analogous functions, but that do not use or contain the limiting nutrient (Grossman 2000).
Responses to nutrient limitation are highly regulated and are the consequence of sensing a
specific deficiency and of alterations in cellular metabolism that result from the inability of the
cell to assimilate nutrients, grow and divide (Grossman 2000).
As a result of the combination of general and specific acclimation responses to nutrient
limitation, cell growth and secondary metabolism are altered, thus affecting cell composition. It is
well established that considerable variation in the biochemical composition under conditions of
nutrient limitation can be observed in microalgal cells, depending on which nutrient is limiting
and to what degree (Juneja et al. 2013). Furthermore, environmental conditions, such as light and
temperature, that are not strictly associated with nutrient limitation also integrate into acclimation
processes (Grossman 2000).
45
Carbon
Carbon constitutes about 50% of the microalgal cell dry biomass (Becker 1994) and it is
the most essential of the non-mineral nutrients for microalgae growth. Carbon atoms are the
building blocks of all the organic molecules and carbon skeletons are the core of all metabolites
in a cell. Carbon sources vary between organic carbon for heterotrophic and mixotrophic
microalgae growth, supplied in form of acetate in the case of C. reinhardtii, and inorganic carbon
in form of CO2, HCO3-, or CO3
2- for photoautotrophic and mixotrophic microalgae growth.
CO2 in varying concentrations is commonly supplied as bubbled gas into the microalgal
cultures. This CO2 needs to be transferred from a rising gas bubble into a liquid phase, in a
process known as gas-liquid mass transfer, and, ultimately, to the site of carboxylation by the
Rubisco enzyme inside the chloroplast of a microalgal cell, which can be considered as a solid
particle. The transport of CO2 from gas bubbles to the cells can be represented by a number of
steps and resistances, as shown in Figure 12. These steps include:
- transfer from the interior of the bubble to the gas film,
- movement across the gas-liquid interface,
- diffusion through the relatively stagnant liquid film surrounding the bubble,
- the transport through the bulk liquid,
- diffusion through the relatively stagnant film surrounding the cell,
- movement across the liquid-cell interface, and finally
- intracellular diffusion through the cytoplasm, into the chloroplast to the site of the
Rubisco enzyme.
The liquid film resistances around the bubbles usually control the overall transfer rate
(Chisti 1989; Moo-Young and Blanch 1981). Thus, the easiest way to increase the availability of
CO2 to microalgal cells is by increasing the gas-liquid mass transfer (Kapic 2005).

46
Figure 12. Steps and resistances for the gas transfer from a bubble into the cell. This figure
represent the case of oxygen; however, the same principle is applied for CO2. Source: Garcia-
Ochoa and Gomez 2009.
The simplest theory on the gas-liquid mass transfer is the two-film model developed by
Whitman (1923). Usually, the gas-liquid mass transfer rate is modeled according to this theory. It
describes the flux through each film as the product of the driving force by the mass transfer
coefficient, as follows:
where J0 is the molar flux of carbon dioxide (mol m
-2 s
-1) through the gas-liquid interface; kG and
kL are the gas and liquid mass transfer coefficients, respectively; pG is the carbon dioxide partial
pressure in the gas bubble; and CL is the dissolved carbon dioxide concentration in the bulk
liquid, with the index i referring to the values at the gas-liquid interface (Garcia-Ochoa and
Gomez 2009). Since the interfacial concentrations cannot be measured directly, the overall mass
transfer coefficients are usually considered. The equation can then be re-written as follows:
47
where p* is the carbon dioxide pressure in equilibrium with liquid phase; C* is the carbon
dioxide saturation concentration in the bulk liquid in equilibrium with the bulk gas phase; and KG
and KL are the overall mass transfer coefficients (Garcia-Ochoa and Gomez 2009; Kadic 2010).
Taking into account that carbon dioxide is little soluble in water, it is commonly accepted
that the greatest resistance for the mass transfer is on the liquid side of the interface and the gas
phase resistance is negligible (Chisti 1989). The overall mass transfer coefficient is then equal to
the local coefficient: KL = kL.
The carbon dioxide mass transfer rate per unit of PBR volume, NCO2, is obtained by
multiplying the overall gas flux by the gas-liquid interfacial area per unit of liquid volume (a):
Due to the difficulty of measuring kL and a separately, usually the product akL is measured
and this parameter, called volumetric mass transfer coefficient, characterizes the transport from
gas to liquid. To determine the CO2 transfer capacity in practice, the CO2 concentration in the gas
phase and the concentration of the dissolved inorganic carbon in the liquid phase are measured.
The driving force of the gas-liquid mass transfer is the CO2 concentration gradient
between the gas phase and the liquid phase. Factors affecting this gradient include the solubility
and the metabolic activity of the cells. The CO2 solubility, C*, in electrolyte solution is usually
smaller than the gas solubility in pure water, known as the salting-out effect. The CO2 solubility
depends on the pH (Figure 13) temperature, the pressure, concentration of nutrients,
concentration and type of salts present and the chemical reactions (Hermann et al. 1995; Linek
and Vacek 1981; Weissenborn and Pugh 1996).
It is the dissolved CO2 concentration in the medium that determined the availability of
CO2 to the microalgal cells, and not the CO2 concentration in the gas phase. To increase the
dissolved CO2 concentration in the growth medium, the concentration of CO2 in the bubbled gas
can be increased, the gas flow rate and the bubble-liquid interface surface can be increased, as
well as the solubility of CO2 in the liquid growth medium. By increasing the gas flow rate, the
mixing of the cultures will also increase, facilitating the dissolution of CO2 gas in the liquid and,
thus, increasing the availability of CO2 to the cells.

48
These three inorganic carbon species can be inter-converted through the following
equilibrium reactions:
When the pH of the growth medium decreases, the relative concentration of CO32-
decreases,
while CO2 and HCO3- levels increase (Figure 13). During photosynthetic CO2 fixation, OH
-
accumulates in the medium inducing a rise in pH (Azov 1982). However, when the cultures are
bubbled with gas containing high concentration of CO2, the pH of the medium decreases. This is
due to the excess of the amount of supplied CO2 in relation to the capacity of the microalgal
culture to take up the dissolved CO2. On the other hand, the affinity of microalgae for CO2
increases at lower pH (Azov 1982; Rotatore and Colman 1991).
Figure 13 Distribution of the three inorganic carbon species, CO2, HCO3-, and CO3
2-, in aqueous
solution as a function of the pH (Falkowski and Raven 2007).
Moroney and Tolbert (1985) have shown that C. reinhardtii cells grown under high CO2
concentration (5% v/v) take up CO2 from the medium, but not HCO3-, as do the cells grown at
air-level (0.03%) CO2 in a process known as carbon dioxide concentrating mechanism (Badger et
al. 1977; Badger et al. 1980; Moroney and Ynalvez 2007; Yamano and Fukuzawa 2009). They
postulated that the cells grown under high CO2 concentration did not synthesize the inorganic
carbon pump that facilitates HCO3- uptake (Moroney and Tolbert 1985). Microalgal cells take up
CO2 via passive diffusion (Berry et al. 1976).
49
The carbon assimilation pathway involves multiple forms of carbonic anhydrase (CA)
enzyme, which converts CO2 to H2CO3 and vice versa (Sultemeyer 1998). Expression of
periplasmic CA is regulated by acetate and pH in C. reinhardtii (Van and Spalding 1999).
Chloroplastic CA activity is required for photosynthesis of C. reinhardtii at ambient CO2
concentrations (Amoroso et al. 1996; Funke et al. 1997) and the mitochondrial CA is also known
to be induced at low CO2 concentration (Eriksson et al. 1998).
As described above, CO2 is incorporated into organic carbon skeletons by the Rubisco
enzyme during the Calvin-Benson cycle reactions in the chloroplast. Carbon fixed by the cell can
be utilized for respiration, as an energy source, and as raw material in the formation of new cells
(Berman-Frank and Dubinsky 1999). In this way, in C. reinhardtii, starch and growth metabolism
(use of carbon for biosynthesis) are the major sinks for photosynthetically fixed carbon. (Klein
1987). The level of starch is, however, controlled by other factors than the CO2 fixation. Non-
growing cells direct more than 50% of the fixed CO2 into starch (Klein 1987).
Elevated CO2 concentration leads to increased rates of carboxylation and decreased rates
of oxygenation of Rubisco enzyme in C3 plants, resulting in a higher net rate of photosynthesis
and increased synthesis of carbohydrates (Stitt and Krapp 1999). Elevated CO2 concentrations
have also been found to decrease the relative amount of proteins and pigments in Spirulina
platensis cells, but increase the carbohydrate content (Gordillo et al. 1999). This change in the
cell composition was accompanied by reduction in the maximum biomass yield (Gordillo et al.
1999).
Nitrogen
Nitrogen is one of the main nutrients in microalgal metabolism. It is an essential
constituent of all cellular proteins, nucleic acids, and chlorophylls. It constitutes between 1 and
20% of the cell dry biomass (Richmond 2004), depending on supply and availability. C.
reinhardtii does not accumulate intracellular nitrogen storage compounds (Harris 2009).
Therefore, nitrogen must be available in the medium for the growth of this microalga.
C. reinhardtii can assimilate a number of different nitrogen sources, such as nitrate,
nitrite, urea, and ammonium, among others (Harris 1989). However, its preferred nitrogen source
50
is ammonium (NH4+) (Florencio and Vega 1983). Assimilation of ammonium is less energy
demanding than that of other prevalent nitrogen sources, such as nitrate and nitrite (Grossman
2000; McCarthy 1980; Syrett 1981). Nitrate and nitrite need to be reduced to ammonium after
entering the cell in order to be assimilated. The reduction steps are energy-demanding, and
microalgae growth on nitrate is slower than on ammonium. Besides, the 137c strain of C.
reinhardtii (used in this study) lacks the nitrate reductase activity (Nichols et al. 1978). It can not
therefore utilize nitrate for growth and is usually grown on ammonium as nitrogen source.
The first step in the assimilation of extracellular ammonium is the uptake through
transporters localized to the plasma membrane, chloroplast, and mitochondria (Stern 2009). C.
reinhardtii has two ammonium transport systems (Franco et al. 1988). One is a low affinity
ammonium transporter with high maximum uptake velocity, which is constitutively expressed.
The other one is a high affinity ammonium transporter with a low maximum uptake velocity and
is repressed by ammonium. The low affinity system functions under nitrogen-replete conditions
while the high affinity system becomes predominant under ammonium limitation (Grossman
2000).
Once ammonium has entered the cell, its main flux is expected to be into the chloroplast,
which is the main site of ammonium assimilation (Stern 2009). Here, ammonium is incorporated
into carbon skeletons through enzymatic reactions of the glutamine synthetase/glutamine:oxo-
glutarate amino-transferase (GS/GOGAT) (Lam et al. 1996). The amination of glutamate to form
glutamine is catalyzed by GS, while the GOGAT reaction facilitates reductive amination of 2-
oxoglutarate using the amide of glutamine as the N donor in the reaction, the product of the
reaction being two glutamate molecule. Glutamate is a key molecule that couples the metabolism
of amino acids to that of carbohydrates and lipids (Stern 2009).
The assimilation pathways for inorganic nitrogen are intrinsically dependent on organic
carbon substrates, reductants (in case of nitrate and nitrite used as nitrogen sources), and ATP,
that are supplied by both photosynthetic and respiratory pathways (Turpin 1991). This
dependency is, however, a two-way street: when nitrogen is limiting, photosynthesis and
respiration are affected, and growth is decreased (Morris et al. 1971; Turpin and Bruce 1990).
Inorganic nitrogen taken up by the microalgal cell and assimilated into biochemically active
compounds is recycled within the cell to meet changing physiological needs (Fujita et al. 1988;

51
Vergara et al. 1995). When their assimilatory capacity is exceeded, cells secrete ammonium, thus,
avoiding any toxic effect of excessive intracellular amounts (Stern 2009).
Nitrogen-sufficient marine diatom Skeletonema costatum contains high concentration of
protein (Dortch 1982). Protein-nitrogen can constitute as little as 10% (Conover 1975) and as
much as 95% (Thomas and Krauss 1955) of the total cellular nitrogen. Non-limited cells of
Stephanodiscus minutulus had a significantly higher chlorophyll a content as compared to
nitrogen-limited cells in the study by Lynn et al. (2000).
Nitrogen deficiency, on the other hand, is known to reduce the protein content of
microalgae (Dortch 1982; Fogg 1956; Gordillo et al. 1999; Holm-Hansen et al. 1959; Kilham et
al. 1997; Lynn et al. 2000; Morris et al. 1974). This, in turn, results in a higher lipid/protein ratio
(Converti et al. 2009; Falkowski and Raven 2007; Round 1984), at the expense of growth rate (Li
et al. 2008). Microalgae grown in nitrogen-depleted cultures also tend to divert their
photosynthetically fixed carbon to carbohydrate synthesis (Falkowski and Raven 2007; Gordillo
et al. 1999; Lynn et al. 2000; Richmond 2004). In this way, nitrogen status, probably through its
effect on the intracellular glutamate levels, acts as a metabolic switch between protein synthesis,
under nitrogen-replete conditions, and carbohydrate or lipid synthesis, under nitrogen-limited
conditions. Other effects of nitrogen limitation include decrease in O2 evolution, CO2 fixation,
chlorophyll content, cell size and biomass production (Collier and Grossman 1992; Gordillo et al.
1999; Kolber et al. 1988; Lynn et al. 2000; Richardson et al. 1969; Round 1984). As nitrogen
source is consumed from the medium in a batch culture, photosynthesis continues at a reduced
rate, until cellular nitrogen falls below a particular species-specific threshold value (Qmin)
(Gordillo et al. 1999). It is interesting to note that, for example, nitrogen-limited Spriulina
platensis cells exhibit reduced CO2 fixation capacity even under normal to high available CO2
concentrations (Gordillo et al. 1999).
Phosphorous
Although C. reinhardtii cells contain less than 1% of the dry biomass of phosphorous
(Goldman 1980), it forms part of many structural and functional cellular components required for
normal growth and development of microalgal cells. It is present in ubiquitous molecules such as
52
reductants (NADPH) and energy carriers (ATP). It is also present in nucleic acids, phospholipids,
and intermediary metabolites, all essential for the cell.
The prevalent form of available phosphorous in the aquatic environment is inorganic
phosphate, either as H2PO4- or as HPO4
2- (Grossman and Takahashi 2001). Phosphate enters the
cell by active transport across the plasma membrane powered directly or indirectly by ATP
(Falkowski and Raven 2007). Phosphate is incorporated into organic compounds through various
types of phosphorylation (Richmond 2004). In the cytosol, phosphate is available via reactions
using ATP (or other nucleotide triphosphate) for direct incorporation into nucleic acid precursors
and carbohydrate and hydrocarbon skeletons without electron transfer reactions (Falkowski and
Raven 2007).
Under phosphate-replete conditions, microalgal cells are able to accumulate inorganic
phosphate intracellularly in the form of polyphosphates, which are stored in granules (Healey
1982). This process is known as luxury uptake of phosphate (Healey 1982). However, once
phosphate becomes deficient in the medium, the polyphosphate granules disappear (Healey
1982). It is probably due to this luxury uptake of phosphate and accumulation of polyphosphate
granules inside the cells, that microalgae are able to divide up to four times after phosphate
becomes deficient (Collier and Grossman 1992). Nitrogen and sulfur, in contrast, do not
accumulate inside the cell and their limitation provokes immediate arrest of cell division (Collier
and Grossman 1992).
The N:P ratio in the medium is important and determines the potential productivity of the
culture (Richmond 2004). Immediate effects of phosphate limitation induce a decrease in the
synthesis and regeneration of substrates of Calvin-Benson cycle and a consequential decrease in
the rate of light utilization for carbon fixation (Barsanti and Gualtieri 2014). Phosphate
deprivation also induces synthesis of several phosphatases and transporters (Chang et al. 2005;
Dumont et al. 1990; Quisel et al. 1996; Rubio et al. 2001), and of Psr1 regulatory protein
(Wykoff et al. 1999).
The supply of phosphate also determines the composition of the produced biomass
(Richmond 2004). It is especially the cellular content of lipids and carbohydrates that is affected
by the external and internal supplies of phosphate (Borowitzka 1988). Phosphorous starvation
53
also reduced chlorophyll a and protein content of microalgal cells, thereby increasing the relative
carbohydrate content (Celekli et al. 2009; Collier and Grossman 1992; Healey 1982; Healey and
Hendzel 1979; Kilham et al. 1997).
Sulfur
Sulfur is an essential element incorporated into proteins, sulfolipids, polysaccharides,
intermediary metabolites, molecules that function in photoprotection, electron carriers, and redox
controllers (Ghysels and Franck 2010; Grossman 2000). Microalgal cells have very limited
storage capacity for sulfur (Ghysels and Franck 2010), responding rapidly to the lack of sulfur in
the growth medium. Sulfur must, therefore, be supplied in sufficient amounts in the medium for
optimal growth of microalgae.
Sulfate anion (SO42-
) is the main form of sulfur taken up by the microalgae. The uptake of
sulfate is facilitated by specific transport systems (Leustek and Saito 1999; Zhang et al. 2004)
and is an ATP-dependent process, which involves secondary active transport facilitated by ion
gradients (Matsuda and Colman 1995; Raven 1984; Weis et al. 2001). Following uptake, the
sulfate anion must be activated by ATP-sulfurylase to form 5’-adenylyl sulfate or APS. The APS
generated can either be phosphorylated into 3’-phospho-5’-adenylyl sulfate (PAPS) and used for
sulfation of various metabolites by sulfotransferases (Varin et al. 1997), or it can serve as
substrate for reduction of sulfate to sulfide (S2-
) and integrated into cysteine and methionine,
which are then incorporated into proteins and other cellular metabolites (Bick and Leustek 1998;
Leustek and Saito 1999; Saito 2000).
Sulfur deprivation induces several responses in C. reinhardtii cells, which is being
thoroughly researched in relation to the H2 production mechanism. These include induction of
expression of high affinity transport systems (Yildiz et al. 1996) and of periplasmic arylsulfatase
(Ohresser et al. 1997). Photosynthetic activity (O2 evolution and CO2 fixation) is reduced and
protein synthesis is disrupted (Ghirardi et al. 2000; Wykoff et al. 1998). The chlorophyll content
of the cells decreases (Melis et al. 2000; Zhang et al. 2002) and the composition of the thylakoid
membrane changes upon sulfur deprivation (Melis et al. 2000). During the first day of sulfur

54
deprivation, cells stop dividing and start to accumulate large energy stores in the form of starch
and lipids (Ghysels and Franck 2010; Zhang et al. 2002).
Sulfur deprivation is known to induce decrease in chlorophyll content of microalgae
(Collier and Grossman 1992). Several species of microalgae are known to accumulate starch
under sulfur-deprived conditions (Branyikova et al. 2010; Dragone et al. 2011; Ji et al. 2011; Yao
et al. 2012).
Calcium
The fraction of calcium in the elementary composition of microalgae is in the range of 0 -
80 mg Ca2+
g-1
dry biomass (0.0 – 8.0% of dry weight) (Healey and Stewart 1973). Calcium is
required for cell membrane integrity and cell transport mechanisms (Fujii 1994). Calcium is also
implicated as a second messenger in signal transduction of a wide variety of biotic and abiotic
stimuli in both lower and higher plants (Rudd and Franklin-Tong 1999; Sanders et al. 1999). In
Chlamydomonas, calcium signaling has been shown to be associated with motile responses
(flagellar beat, phototaxis, chemotaxis), sensory responses (flagellar adhesion during mating),
and the maintenance and removal of the flagella (flagellar length control, flagella excision)
(Ermilova et al. 1998; Goodenough et al. 1993; Harz and Hegemann 1991; Kamiya and Witman
1984; Quarmby and Hartzell 1994; Tuxhorn et al. 1998). In addition to its role in signal
transduction, calcium is an essential co-factor in photosystem II-driven oxygenic photosynthesis
(Boussac et al. 1989; Krieger et al. 1993).
In Dunaliella tertiolecta, increased calcium concentrations (up to 0.3 mM) enhanced cell
growth (Chow et al. 2015). Calcium starvation, on the other hand, is known to induce lipid
accumulation in microalgae cultures (Deng et al. 2011; Gorain et al. 2013).
Magnesium
The fraction of magnesium in the elementary composition of microalgae is in the range of
0.5 – 75 mg Mg2+
g-1
dry biomass (0.05 – 7.5 % of dry weight) (Healey and Stewart 1973). The
magnesium content reported for Chlorella sp. ranges between 0.36 and 0.8% on a dry weight
basis (Oh-Hama and Miyachi 1988). Chlorophyll molecules contain magnesium in their

55
structure, making the supply of magnesium indispensable for the photosynthetic activities of
plants and algae. Furthermore, magnesium activates more enzymes than any other mineral
nutrient (Epstein and Bloom 2004), some of which are ATPases, Rubisco, RNA polymerase and
protein kinases (Marschner 1995; Shaul 2002).
Under increased concentration of magnesium (up to 6 mM), a significant rise in the
biomass of Chlorella vulgaris and Scenedesmus obliquus was recorded in the study by Gorain et
al. (2013). In Dunaliella tertiolecta, increased magnesium concentrations (up to 5.6 mM) also
enhanced cell growth (Chow et al. 2015). The chlorophyll concentration in Chlorella cultures
increased linearly about fifteen-fold when the initial magnesium concentration was increased
from 8 µM to 115 µM (Finkle and Appleman 1953a). A further two-fold increase in the
chlorophyll content was observed when the magnesium concentration was increased up to 2 mM
(Finkle and Appleman 1953a). In these cultures, the chlorophyll content attained by the cells
represented approximately 70 – 80% of the total magnesium that had been added to the growth
media (Finkle and Appleman 1953a).
The absence of magnesium, on the other hand, is expected to prevent cell division and
chlorophyll synthesis and, thus, to reduce growth yields (Finkle and Appleman 1953b). In plants,
magnesium deficiency in leaves is associated with a massive accumulation of carbohydrates and
elevated susceptibility to high light intensity (Cakmak and Kirkby 2008; Marschner and Cakmak
1989). In C. reinhardtii, magnesium deprivation decreases the protein content of the cells, but
increases carbohydrates and lipids (Çakmak et al. 2014).
Optimization of the growth medium composition for Chlamydomonas reinhardtii
Artificial media for growing fresh water microalgae have been developed empirically.
The simple solutions of a few mineral salts used by pioneers such as Benecke and Beijerinck
(1890) were modified by varying the proportions of the major solutes and trace elements were
added, as these were discovered to be essential for healthy microalgae growth (Fogg and Thake
1987). Usually, researchers have tested a number of well-established recipes and used the most
suitable one with a minimum of modifications (Fogg and Thake 1987). Only a few scientists
(Krauss 1953; Miller and Fogg 1957; Rodhe 1948) have undertaken determinations of growth in

56
series of media, in which the concentrations and proportions of the constituents were
systematically varied. Generally, the usefulness of a medium has been judged by the final yield of
microalgal biomass (Fogg and Thake 1987). An optimal medium for microalgae cultivation is, on
the other hand, strongly specific for each species and for each intended product (Mata et al.
2010).
Although C. reinhardtii has been grown in laboratories for several decades, there has been
little development of a growth medium specific for this microalga. This microorganism
acclimates rather easily to a variety of environmental conditions and media compositions (Dubini
et al. 2009; Grossman 2000; Harris 2009). Therefore, several different media are used for its
culturing (Harris 2009). Concentrations of nitrogen, phosphorus, and sulfur vary widely in the
recipes of these media. Carbon sources also vary between organic carbon, supplied in the form of
acetate, and inorganic carbon, in the form of HCO3- or CO2 supplied at different concentrations in
the bubbled gas. It is well documented that the nutrient status of the microalgae affects their
photosynthesis and, thus, the productivity of the culture’s biomass (Jo et al. 2006; Juneja et al.
2013; Richmond 2004). According to A. Richmond (2004), culture media should be formulated
to supply nutrients in excess to ensure that they never become the rate-limiting factor. However,
nitrogen, phosphorous, and carbon are often limiting. Oversupply of these nutrients is not a good
strategy either, since it may lead to stress and reduced growth (Richmond 2004). Whereas there
has been considerable interest in studying the responses of C. reinhardtii to conditions of nutrient
limitation (see Grossman 2000 for review), so far, there has been little interest in determining the
optimal growth conditions for this microalga (Jo et al. 2006; Lehr et al. 2012; Tamburic et al.
2011).
The culture conditions favoring specific product formation are usually not compatible
with those required for maximal growth and biomass production (Richmond 2004). However, the
cell composition of a microalga can be readily optimized by PBRs that control environmental
conditions and through the use of multistage (or multiphase) cultivation strategy (Richmond
2004). The concept of multistage cultivation strategy is to ensure maximum production of
biomass in one stage and maximum induction and accumulation of the desired products in the
other (Richmond 2004). On the other hand, Klok et al. (2013) have argued that cells accumulate
highly reduced carbon storage products, such as TAGs and starch, when the cultures are limited
57
for some nutrient as a result of energy imbalance between the anabolic processes and the
photosynthesis. They suggest that it should be possible to create an energy imbalance by reducing
the nutrient supply to the cells and, thus, force them to accumulate carbon storage compounds,
while simultaneously allowing cell division to continue (Klok et al. 2013).
Environmental factors
Light
Light is often considered to be the most important factor affecting microalgal growth and
it is also the most difficult parameter to control in PBRs. The amount of incident light that enters
the PBR is a function of light intensity and normal surface area (Hahn et al. 2004). At high cell
density, microalgal productivity is limited by light attenuation inside the PBR due to shading
effects of the layers of cells close to the surface of the PBR on the cells that are in the core of the
PBR (Benemann 2000; Melis et al. 1998). The following PBR and process parameters determine
the light distribution characteristics inside the PBR:
- the optical density (OD) of the culture, which depends on biomass concentration,
pigmentation, and cell size and geometry,
- path length of light within the culture, which depends on the light source and the
geometry of the PBR, and on latitude and season in outside cultures,
- mixing regime that affects light delivery to individual cells (Dubinsky et al. 1995).
In PBRs, microalgal cells are, therefore, exposed to varying irradiances (Grobbelaar 1991;
Ogbonna et al. 1995a; Perner-Nochta and Posten 2007). Light absorption by Chlorella cultures
approximately follows the Beer’s law, the intensity of light decreasing exponentially as the path
length through the algal suspension increases (Fogg and Thake 1987). The cells respond to this
variation by modifying their metabolism and, thus, also their growth potential. The major
physiological outcome of light-shade adaptation is the modification of growth rates (Falkowski
and Owens 1980). Light affects growth of microalgae primarily through its impact on
photosynthesis (Sorokin and Krauss 1958). The growth-irradiance curves are therefore similar to

58
photosynthesis-irradiance curves (Falkowski 1980). Accordingly, a typical irradiance curve for
growth (Figure 14) presents three different portions:
1) A light-dependent portion, where the growth rate increases with increasing irradiance.
2) A light-independent portion or plateau, where the irradiance is saturating for growth.
3) A light-dependent portion, where the rate declines with increase in irradiance and where
the cells are photoinhibited (Sorokin and Krauss 1958).
Figure 14. Irradiance curve for growth of four green microalgae species (Sorokin and Krauss
1958). The squares represent the response of C. reinhardtii growth to irradiance.
In addition to photosynthesis, light also drives photoacclimation. The photoacclimation
process in microalgae leads to changes in the optical, biophysical, structural, biochemical, and
physiological properties of the cell according to the availability of light (Dubinsky et al. 1995).
These changes lead to optimization of light harvesting and utilization, increasing, thus, the
photosynthetic efficiency (Dubinsky et al. 1995; Falkowski and Raven 2007). Photoacclimation
is most often related to changes in abundance and composition of the photosynthetic pigments.
The most obvious effect induced by acclimation to different light intensities is a strong reduction
in chlorophyll content per cell in high light. This leads to a reduction of capacity for light
absorption per volume of culture when the same cell density is considered, better penetration of
light into the PBR and protects against excess absorbed light energy and, thus, photoinhibition
(Bonente et al. 2012). In C. reinhardtii, acclimation to different light intensities also involves
modulation of photosynthetic protein content per cell. High light induces a decrease in the

59
transcription and translation of LHC proteins (Durnford et al. 2003), suggesting modulation of
antenna size.
Photoacclimation also affects carbon fixation, respiration rates, and biochemical
composition of the organism, as well as cell volume (Falkowski and Raven 2007). Variation of
growth rate under light limitation of photosynthesis has relatively little effect on the overall
cellular composition (Falkowski and Owens 1980). However, there is often a tendency to
accumulate more carbohydrates at higher light intensity levels (Falkowski and Owens 1980;
Richmond 2004). This is due to the excess absorbed energy by the photosystems that the cells
dissipate by directing it towards carbon fixation and synthesis of energy-rich carbohydrates (Hu
2004; Klok et al. 2013). Chlorella was found to accumulate high amounts of starch (from 8.5%
up to 40% of DW) as the photon flux density increased from a mean of 215 to 330 µmol m-2
s-1
prior to cell division (Branyikova et al. 2010). Dunaliella tertiolecta showed a decrease in protein
content and increase in lipid fraction with increased light intensities up to saturation (Cuhel et al.
1984). Carvalho et al. (2009), on the other hand, found that the cultures of Pavlova lutheri
increased their cellular protein content as response to an increase in light intensity up to 195 µmol
m-2
s-1
. Phaeodactylum tricornutum grown in low light also exhibits increased rate of protein
synthesis (Morris et al. 1974).
Temperature
Any microalgal specie’s response to temperature is characterized by three ‘cardinal
temperatures’ (Morita 1975): the lower and upper limits of temperature for growth, and the
optimum temperature for growth at some point between the extremes. At the low temperature
limit, there is loss of membrane function due to a phase change from liquid to gel or solid phase
(Nedwell 1999). Below optimal temperature, growth rate increases with increasing temperature
(Renaud et al. 2002). Growth at the optimum temperature results in maximum growth rate, but in
minimal cell size (Harris 1986; Rhee 1982) and minimal cell contents of carbon and nitrogen
(Rhee 1982). The efficiency of carbon and nitrogen utilization decreases at non-optimal
temperatures (Darley 1982), while the cell volume increases (Goldman 1980). This means that it
requires more carbon and nutrients to produce a cell at the same growth rate at non-optimal
temperatures than it does at the optimal one (Darley 1982). The temperature range allowing

60
growth above optimum is usually quite narrow (Li 1980), the growth rate declining abruptly
above the optimum temperature (Renaud et al. 2002). Increasing the temperature beyond the
optimum reduces protein synthesis and, consequently, results in decreased growth rates
(Konopka and Brock 1978). The upper limit of temperature is imposed by increasing rate of
denaturation of key cellular components as temperature increases to the point that denaturation
exceeds the rate at which these can be replaced, with consequent disruption of cell function
(Nedwell 1999). The responses and the characteristics of a microalgal organism at a given
temperature depend on the temperature experienced during growth (Li 1980). Harris (1989)
recommends growing C. reinhardtii at a temperature range of 20 – 25 °C, and states that most
strains tolerate temperatures in the range of 15 – 35 °C.
Temperature affects cell metabolism through several mechanisms. It affects the fluidity of
the membranes, the diffusion of molecules, and mainly, the cellular biochemical reactions,
through control of enzyme kinetics (Davison 1991; Raven and Geider 1988). Most biological
reactions vary with temperature in such a way that with every 10 °C increase in temperature, the
reaction rate approximately doubles (Vitova et al. 2011). This is expressed as a temperature
coefficient Q10 of about 2 (Vitova et al. 2011). It has also been suggested that changes in
citoplasmic viscosity under sub-optimal temperature conditions are responsible for less efficient
carbon and nitrogen utilization under this condition (Hope and Walker 1975; Raven and Geider
1988).
Temperature affects cell processes to a large extent by control of photosynthetic rate
(Setlík et al. 1972; Spudich and Sager 1980; Zachleder and van den Ende 1992). While the light-
driven redox reactions of photosynthesis are influenced mainly by the amount of the available
light, the carbon fixation reactions of photosynthesis are temperature-dependant enzymatic
reactions. Analyses of biological rate processes as a function of temperature are often based on
the Arrhenius equation that describes the influence of temperature on biochemical reactions rates
(Geider et al. 1998; Li 1980):
where k is the reaction rate constant, A is a constant (d-1
), E is the activation energy (J mol-1
), and
R is the universal gas constant (J K-1
mol-1
), T being the temperature expressed in Kalvin scale.
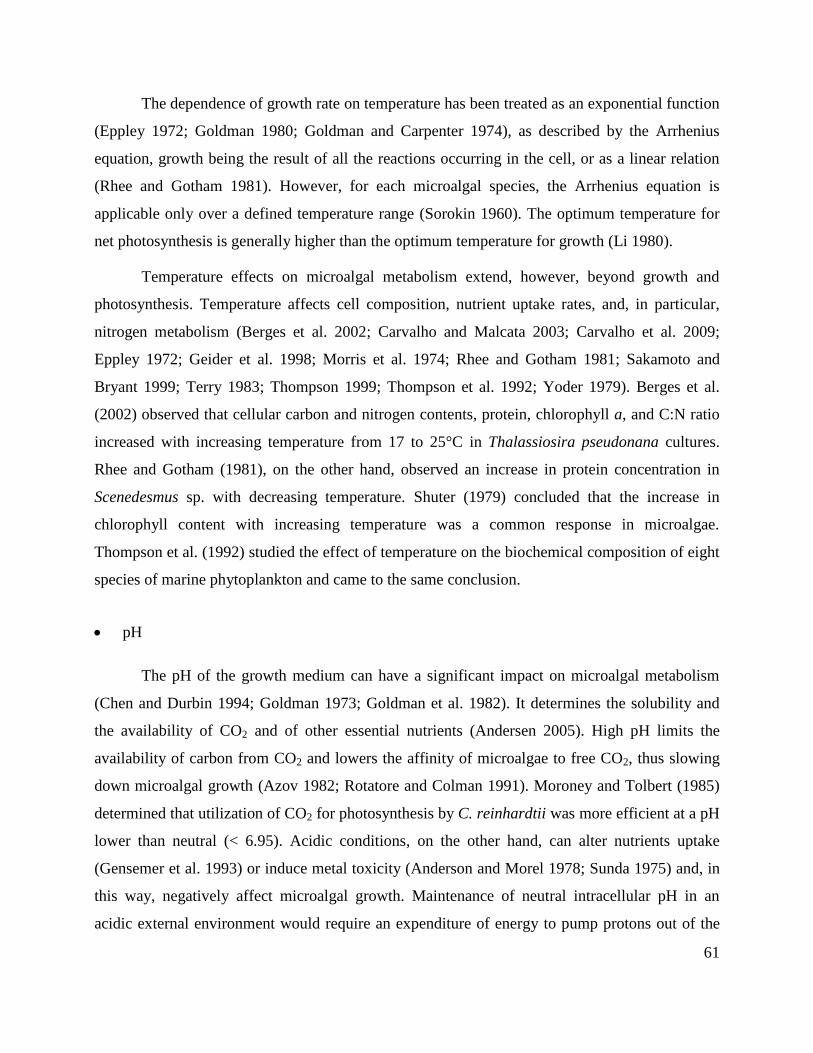
61
The dependence of growth rate on temperature has been treated as an exponential function
(Eppley 1972; Goldman 1980; Goldman and Carpenter 1974), as described by the Arrhenius
equation, growth being the result of all the reactions occurring in the cell, or as a linear relation
(Rhee and Gotham 1981). However, for each microalgal species, the Arrhenius equation is
applicable only over a defined temperature range (Sorokin 1960). The optimum temperature for
net photosynthesis is generally higher than the optimum temperature for growth (Li 1980).
Temperature effects on microalgal metabolism extend, however, beyond growth and
photosynthesis. Temperature affects cell composition, nutrient uptake rates, and, in particular,
nitrogen metabolism (Berges et al. 2002; Carvalho and Malcata 2003; Carvalho et al. 2009;
Eppley 1972; Geider et al. 1998; Morris et al. 1974; Rhee and Gotham 1981; Sakamoto and
Bryant 1999; Terry 1983; Thompson 1999; Thompson et al. 1992; Yoder 1979). Berges et al.
(2002) observed that cellular carbon and nitrogen contents, protein, chlorophyll a, and C:N ratio
increased with increasing temperature from 17 to 25°C in Thalassiosira pseudonana cultures.
Rhee and Gotham (1981), on the other hand, observed an increase in protein concentration in
Scenedesmus sp. with decreasing temperature. Shuter (1979) concluded that the increase in
chlorophyll content with increasing temperature was a common response in microalgae.
Thompson et al. (1992) studied the effect of temperature on the biochemical composition of eight
species of marine phytoplankton and came to the same conclusion.
pH
The pH of the growth medium can have a significant impact on microalgal metabolism
(Chen and Durbin 1994; Goldman 1973; Goldman et al. 1982). It determines the solubility and
the availability of CO2 and of other essential nutrients (Andersen 2005). High pH limits the
availability of carbon from CO2 and lowers the affinity of microalgae to free CO2, thus slowing
down microalgal growth (Azov 1982; Rotatore and Colman 1991). Moroney and Tolbert (1985)
determined that utilization of CO2 for photosynthesis by C. reinhardtii was more efficient at a pH
lower than neutral (< 6.95). Acidic conditions, on the other hand, can alter nutrients uptake
(Gensemer et al. 1993) or induce metal toxicity (Anderson and Morel 1978; Sunda 1975) and, in
this way, negatively affect microalgal growth. Maintenance of neutral intracellular pH in an
acidic external environment would require an expenditure of energy to pump protons out of the

62
cell (Terry and Abadía 1986). In their modeling study on Spirulina platensis, Celekli et al.
(2009), found that variations in pH significantly affected the amount of chlorophyll a and
produced biomass.
C. reinhardtii grows photoautotrophically in simple mineral salts media, such as the High-
Salt Sueoka (HS) medium (Sueoka 1960), over a pH range of 6.5 – 8.0 (Harris 1989). However,
bubbling the cultures with gas containing high CO2 concentrations, such as 5% v/v, uptake of
ammonium by microalgae from the growth medium and, probably, also excretion of metabolites
to the medium lead to a decrease in pH. A pH buffer is, therefore, usually used in the growth
medium to maintain a stable pH. A pH buffer consists of a mixture of a weak acid and its
conjugate base, or vice-versa, which inter-conversion tends to minimize changes in the
concentration of H+ in the solution, and, thus, to keep the pH stable. Phosphate buffer system,
such as K2HPO4/KH2PO4, is present in the HS medium in quite high concentration (13.6 mM
PO4) (Sueoka 1960). On the other hand, the CO2/HCO3-/CO3
2- system is the most important
buffer present in freshwater and is the best means available to control and maintain specific pH
levels that are optimal for the cultured microalga (Richmond 2004).
Interaction effects between the different growth factors on the growth and biochemical
composition of microalgae
Liebig’s minimum theory (1870) predicts that only one resource may limit growth at the
time, but the validity of this postulate has been challenged over the past three decades (Andersen
and Pedersen 2002). For many key resources, this theory inadequately describes the scenario,
because the exploitation of one resource is not independent of the availability of others (Andersen
and Pedersen 2002). There is evidence that some species may shift their acclimation strategies in
response to combination of growth parameters in a different way that if they acted independently
(Carvalho and Malcata 2003; Carvalho et al. 2009; Dermoun et al. 1992). The fact that the
resource utilization is not independent on the availability of other resources also has important
implications for the design of laboratory experiments (Andersen and Pedersen 2002).
When a microalgal cell is placed in a given environment that is adequate in terms of
prevailing physicochemical conditions, it will grow exponentially until a growth parameter

63
becomes growth-limiting. The uptake of nutrients from the surroundings and the release of cell
metabolites thereto occur at rates that depend on the internal cell control mechanisms, including
adaptability to environmental conditions and genetic heritage (Richmond 2004). Even if the
intrinsic characteristics of the cell population remain somewhat constant, the culture medium can
be engineered in terms of several parameters, such as temperature, irradiance, and pH, whereas
certain phenomena, such as acid-base equilibrium, ion strength, and gas-liquid equilibrium
eliminate further degrees of freedom (Bailey and Ollis 1986). This metabolic complexity makes it
rather difficult to describe the cell physiology as related to the combined effects of physical and
chemical parameters (Carvalho and Malcata 2003).
Complex interactions exist between the chemical components, their availability, and the
uptake by microalgae in cultures (Richmond 2004). Nutrient uptake depends on other
environmental factors that influence microalgal growth, such as light, temperature, pH, and
turbulence. The uptake and assimilation of one nutrient is also dependent on the availability and
cellular content of other nutrients, as their metabolism is inter-dependent.
The assimilation of most macronutrients requires carbon skeletons (Falkowski and Raven
2007). Carbon and nitrogen metabolism are known to be interdependent (Fonseca et al. 1997;
Huppe and Turpin 1994; Larsson et al. 1985; Stitt and Krapp 1999; Syrett 1981; Turpin 1991;
Turpin and Bruce 1990). Under normal CO2 (atmospheric level) and nitrogen sufficiency, the
biomass yield of Spirulina platensis was the highest, while cultures under high CO2 concentration
(1%) and nitrogen limitation showed the lowest yield (Gordillo et al. 1999).
During light-dependent photosynthesis, nutrient uptake will depend on the available light
energy, while at saturating irradiances nutrient uptake will be constant. Rhee and Gotham (1981)
investigated the simultaneous limitations of light and nutrient on growth, and found that the
combined effects were greater than the sum of individual effects and were not multiplicative.
They concluded that within a certain range of growth rates, light and cellular nitrogen quota
could compensate for each other in maintaining growth rate constant (Rhee and Gotham 1981).
Under nutrient-sufficient conditions, cell quotas of carbon, nitrogen, and phosphorous, as well as
cellular chlorophyll and protein concentrations were found to increase as irradiance decreased
below saturation (Rhee and Gotham 1981). Both, carbon and nitrogen cell quotas, have been
found to be positive exponential functions of irradiance (Thompson 1999). In C. reinhardtii, the

64
ferredoxin-dependent activity of the GOGAT enzyme in the ammonium assimilation pathway is
known to increase in the light (Cullimore and Sims 1981).
Temperature influences the enzymatic reactions that mediate nutrient assimilation and
utilization in the cell, and it also influences the rates of photosynthesis (Goldman and Carpenter
1974; Sorokin and Krauss 1962). This implies a synergism between temperature and light, which,
again, will affect nutrient uptake (Richmond 2004). Non-optimal growth temperatures reduce the
availability and utilization efficiency of nutrients (Sterner and Grover 1998).
Inversely, increased concentrations of some nutrients in the medium are known to
increase the tolerance to higher temperature (Hutner et al. 1957; Maddux and Jones 1964).
Eppley (1972) reported that both the temperature optimum and the maximum tolerated
temperature by Dunaliella tertiolecta increasing with increasing salinity of the medium.
Adaptations to higher or lower temperatures may also occur with varying light intensity (Hutner
et al. 1957).
Many microalgae, such as Chlorella pyrenoidosa, show an increased saturation irradiance
for growth at higher temperature compared to low temperature (Sorokin and Krauss 1962). High
irradiance and warm temperature have been observed to promote carbon fixation since this
pathway acts as a sink for excess energy (Morgan and Kalff 1979; Parker and Armbrust 2005).
On the other hand, at high irradiance and low temperature cells are oversensitive to
photoinhibition, in the sense that photoinhibition may be induced at relatively low irradiance due
to suboptimal temperature conditions (Sakamoto and Bryant 1999; Vonshak et al. 2001).
There is a lack of knowledge on how to combine the different growth factors in order to
optimize the biomass production and the desired chemical components of microalgae (Richmond
2004). Understanding the interactions between the various environmental variables is necessary
to develop viable high-productivity microalgae systems, which produce the compound of interest
at high rates. This is essential for successful scale-up of microalgal cultures in commercial
systems for production of microalgal biofuels and other by-products (Juneja et al. 2013).

65
5.4. Hydrogen production by Chlamydomonas reinhardtii
Production of H2 from solar energy using microalgae is an emerging field where
significant development has been achieved in the last two decades.
Hydrogen production in green microalgae: historic overview of scientific discoveries
It was first discovered in the late 1930s that some species of unicellular green algae are
able to metabolize H2, consuming H2 in the dark to drive cellular metabolism (Gaffron 1940) and
producing H2 in the light by oxidizing H2O (Gaffron and Rubin 1942). The biochemical and
genetic mechanisms behind H2 production process weren’t revealed until more than 50 years
later, when the hydrogenase enzyme (Hyd1), responsible for transferring electrons to protons
leading to molecular hydrogen, was purified and analyzed (Happe et al. 1994; Roessler and Lien
1984) and the HydA gene was isolated (Happe and Kaminski 2002). Hyd1 enzyme was shown to
be localized to the chloroplast (Happe et al. 1994) and to accept electrons from the photosynthetic
ferredoxin in the light (Happe and Naber 1993). H2 metabolism in Chlamydomonas occurs only
under anaerobic conditions, since the [FeFe]-hydrogenase is extremely sensitive to O2 at the
transcriptional and enzymatic activity levels (Ghirardi et al. 1997). H2 metabolism in C.
reinhardtii was considered to be of transient nature due to the need for anaerobic conditions,
which are difficult to maintain for a photosynthetic microorganism. For this reason, H2
production by C. reinhardtii was not regarded as having any biotechnological significance until
the year 2000 (Philipps et al. 2012), when the team of A. Melis showed that sulfur deprived C.
reinhardtii cultures were able to become anaerobic in gas-tight photobioreactors and produce
significant amounts of H2 for several days (Melis et al. 2000).
Why do microalgae produce hydrogen?
Production of H2 under anaerobic sulfur-deprived conditions is a stress response in C.
reinhardtii cells. Microalgae receive energy from light, but do not have access to sulfur or
oxygen. The excess electrons generated by the ETC receiving light energy are released through
the hydrogenase activity (Turner et al. 2008), H2 being, thus, a sink for electrons. Under
66
anaerobic conditions, the oxidative phosphorylation, which normally produces ATP in the
mitochondria is inactivated. Instead, electron transport via the hydrogenase pathway is coupled to
photosynthetic phosphorylation in the tylakoid membrane (Arnon et al. 1961), generating ATP in
the chloroplast, which is essential for the maintenance and repair function of the cell (Melis et al.
2000).
Biochemistry of hydrogen production in Chlamydomonas reinhardtii
Due to the extreme sensitivity to O2 of the hydrogenase enzyme in C. reinhardtii, the
protocol for H2 production established by Melis et al. (2000) consists in two stages. First, cells
are grown under normal aerobic conditions in order to accumulate biomass. Then, the culture is
centrifuged, the cells are re-suspended in a sulfur-free medium and incubated under continuous
illumination in gas-tight photobioreactors. The absence of sulfur in the medium blocks protein
biosynthesis. This provokes partial and reversible inactivation of the PSII activity (Wykoff et al.
1998) by blocking the replacement of the D1 protein in the PSII reaction center, which is very
rich in sulfur and has a rapid turnover. The photosynthetic activity of PSII declines gradually
until it becomes inferior to the levels of mitochondrial respiration after about 24 – 30 h (Figure
15) of incubation in sulfur-deprived conditions. After this point, the cells consume all the oxygen
they produce and the sealed culture becomes anaerobic in the light. Hydrogenase enzyme is then
synthesized and activated, allowing for the H2 formation.
Figure 15. Response of photosynthesis (P) and respiration (R) rates to sulfur deprivation of C.
reinhardtii cultures in gas-tight photobioreactors (Melis et al. 2000).

67
During the first 24 h of sulfur deprivation, the cells stop dividing and begin to accumulate
large amounts of energy storage compounds, such as protein and, especially, starch (Figure 16)
(Melis et al. 2000) as a general response to nutrient deprivation (Grossman 2000). On the other
hand, the rapid degradation of the Rubisco enzyme (Zhang et al. 2002) suggests a decline in CO2
fixation rates (Burgess et al. 2011).
Figure 16. Sulfur-deprived cultures of C. reinhardtii accumulate large amounts of protein and,
especially, of starch (measured as the amount of glucose) (Melis et al. 2000).
- Electron sources
H2 production can result from three different electron transfer pathways (represented by
the red numbers in Figure 17). The first is the PSII-dependent pathway, which involves residual
water photolysis by PSII, the electrons being transferred through the photosynthetic ETC to PSI
and then to ferredoxin. The ferredoxin donates the electrons to the hydrogenase enzyme (Gaffron
and Rubin 1942) instead of transferring them to NADP, which is used in the carbon fixation
pathway. The down-regulation of CO2 assimilatory pathway in sulfur-deprived C. reinhardtii
cells is an important pre-requisite for sustained H2 production (Hemschemeier et al. 2008), so that
the hydrogenase enzyme does not have to compete with alternative electron sinks (Cinco et al.
1993), like the carbon assimilation pathway.
The second pathway is PSII-independent, and it uses the photo-fermentation of
endogenous organic compounds (such as starch, proteins, and lipids) as a source of reducing
power, providing electrons to the photosynthetic ETC at the plastoquinone level through the
chlororespiratory pathway. Externally added sources of organic carbon, such as acetate, increase

68
the electron flow through this pathway and thus, the H2 production yields (Gfeller and Gibbs
1985).
The third pathway is light-independent and is a fermentative pathway, where pyruvate
generated by starch catabolism may be oxidatively decarboxylated by pyruvate:ferredoxin
oxidoreductase (PFOR) enzyme (Torzillo et al. 2014). This leads to a reduced state of the
ferredoxin, which acts as an electron donor to the hydrogenase (Noth et al. 2013).
Figure 17. Schematic representation of the biochemistry of hydrogen production by sulfur-
deprived C. reinhardtii cells.
- Required metabolites
Both water oxidation and endogenous catabolism of starch and protein contribute with
electrons to H2 production (Fouchard et al. 2005; Kosourov et al. 2003; Posewitz et al. 2004;
Zhang et al. 2002). Organic substrate degradation also contributes to the respiratory consumption
69
of O2, produced by the residual PSII activity of water splitting, during the H2 production process
and is, thus, responsible for maintaining the anaerobic state of the culture (Ghirardi et al. 2000;
Kosourov et al. 2003; Melis 2002). Finally, substrate catabolism during H2 production is
necessary to maintain a proper intracellular redox potential that controls the expression of the
hydrogenase gene in C. reinhardtii cells (Posewitz et al. 2004). The levels of accumulation of
intracellular starch and protein are, therefore, essential for the H2 production process.
Use of acetate for hydrogen production
Until now, the majority of laboratories studying H2 production in C. reinhardtii have used
the Tris-Acetate-Phosphate (TAP) medium (Gorman and Levine 1965), which contains acetate
(Hahn et al. 2004; Jo et al. 2006; Kruse et al. 2005; Melis et al. 2000; Torzillo et al. 2009).
Acetate is a relatively expensive compound, which is not available in nature and must be
synthesized (Fouchard et al. 2005). The use of acetate in the culture medium increases, therefore,
the cost of biomass and of H2 production (Ghirardi and Amos 2004). It also serves as growth
substrate to heterotrophic organisms, enhancing the risk of contamination by bacteria, fungi, and
other microalgae (Ferrel and Sarisky-Reed 2010; Fouchard et al. 2005). Moreover, since H2
combustion generates no carbon-based emissions, using an organic carbon source, such as
acetate, for growing C. reinhardtii does not seem to make sense. From an energy conversion
point of view, it appears more logical to use CO2 as carbon source in microalgal cultures. By
omitting acetate from the growth medium, C. reinhardtii is produced photoautotrophically with
CO2 and light as its only energy source. CO2 is readily available in the atmosphere or from
industrial sources, such as flue gas. Melis et al. (2000) argued that acetate is necessary as
substrate in respiration for establishing and maintaining anaerobiosis in the H2 production stage.
However, it has been demonstrated that production of H2 under photoautotrophic conditions is
possible (Tolstygina et al. 2009; Tsygankov et al. 2006).
H2 production under photoautotrophic conditions is, however, less efficient than under
heterotrophic or mixotrophic conditions (Tolstygina et al. 2009; Tsygankov et al. 2006). One of
the reasons for the low H2 output may be the low level of starch accumulation during the aerobic
phase of the sulfur deprivation stage (Tsygankov et al. 2006). Sulfur deprivation in itself is not
sufficient to decrease PSII activity to such a level that anoxia is maintained in an acetate-free
70
medium (Fouchard et al. 2005). In this study, we aimed at obtaining high starch accumulation
levels during the first stage of photoautotrophic production of biomass, prior to sulfur
deprivation. In this way, the cells that are subjected to sulfur deprivation would already have
accumulated enough starch before they are sulfur-deprived. Our working hypothesis was that
high intracellular starch content would allow for establishing anoxic conditions in the beginning
of the sulfur deprivation stage, with no need for acetate in the medium. Fouchard et al. (2005)
showed that the aerobic growth phase could be conducted either mixotrophically or
photoautotrophically without a major impact on the subsequent H2 production.
71
6. Aims of the present study
The aim of this thesis was to investigate the effects of culture conditions on the growth
and biochemical composition of C. reinhardtii photoautotrophic batch cultures, as a potential
source for H2 production. The individual and the interaction effects of nutrient concentrations in
the growth medium, CO2 concentration in the bubbled gas, light intensity, and temperature on the
pH of the cultures, their productivity and biomass yield, as well as on the contents of starch,
protein, and chlorophyll were examined.
Three series of experiments were designed:
1) The goal of the first one was to quantify (Paper I) and model (Paper II) the effects of
ammonium, phosphate, sulfate, and carbon dioxide concentrations on the growth and biochemical
composition of C. reinhardtii cultures.
2) The second series of experiments (Paper III) aimed at understanding how the combinations of
different levels of light intensity, temperature, and CO2 concentration affect the growth and
biochemical composition of this microalga.
3) The third experiment (Paper IV) aimed at evaluating whether the calcium and magnesium
concentrations used in previous experiments were limiting for the growth of C. reinhardtii batch
cultures.
72
7. Materials and methods
The experimental work in this study was conducted in the Plant Cell Laboratory, at the
Norwegian University of Life Sciences (NMBU), Ås, Norway. All the experiments were carried
out in a special ‘algae room’ with no natural light and constant temperature, maintained at 15 ± 2
°C by an air conditioning system.
This PhD work was part of a collaboration project between the microalgae research group
at the Plant Sciences Department, Norwegian University of Life Sciences, and the research
institute Bioforsk (Norwegian Institute for Agricultural and Environmental Research), Ås: ‘Use
of solar energy for CO2 capture, algae cultivation and hydrogen production – BioH2’. The project
consisted of two parts:
1) To gain knowledge about how the culture conditions affect the growth and biochemical
composition of C. reinhardtii (NMBU), and
2) Testing the conditions for H2 production by C. reinhardtii (Bioforsk).
7.1. Experimental setup
The details of the experimental setup used in each series of experiments are described in
the Materials and methods sections in the corresponding Papers. Here, a brief general description
is provided.
The experiments were performed in bubble column Pyrex glass tubular PBRs (Figure 18).
The PBRs were placed in water bath aquaria and the temperature was set up manually by using
aquarium heaters (Eheim Jager 3619, Eheim, Daizisau, Germany). Because it was not possible to
regulate the temperature in the aquaria, the air temperature was kept at 15 ± 2 °C by air
conditioning. The temperature in the aquaria was registered by a data logger connected to a
computer, equipped with the PicoLog software (Picolog, Pico Technology, St Neots, UK). Air
was mixed with pure CO2 in a plastic box (50 L) and injected through latex and glass tubing into
the bottom of the PBRs. The CO2 concentration in the bubbled gas was set up manually by a
capillary and water column system. The CO2 concentration in the bubbled gas was registered by a
data logger and a computer equipped with the PicoLog software. The variation in the CO2 supply
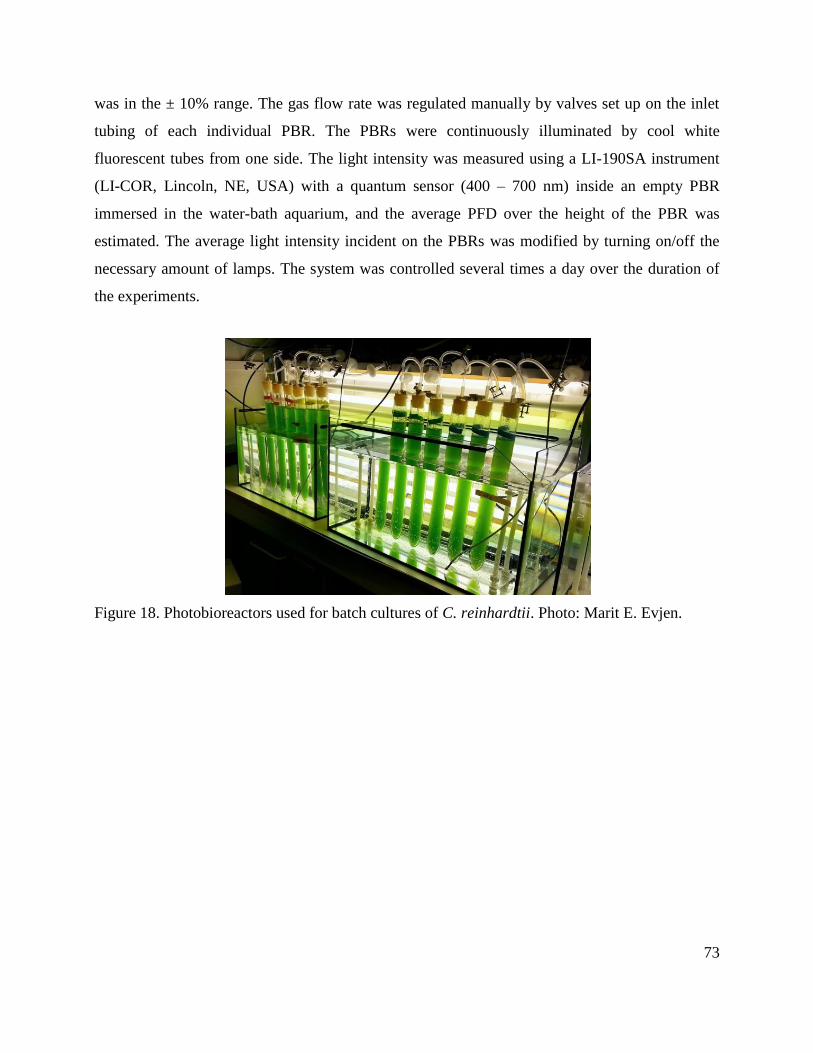
73
was in the ± 10% range. The gas flow rate was regulated manually by valves set up on the inlet
tubing of each individual PBR. The PBRs were continuously illuminated by cool white
fluorescent tubes from one side. The light intensity was measured using a LI-190SA instrument
(LI-COR, Lincoln, NE, USA) with a quantum sensor (400 – 700 nm) inside an empty PBR
immersed in the water-bath aquarium, and the average PFD over the height of the PBR was
estimated. The average light intensity incident on the PBRs was modified by turning on/off the
necessary amount of lamps. The system was controlled several times a day over the duration of
the experiments.
Figure 18. Photobioreactors used for batch cultures of C. reinhardtii. Photo: Marit E. Evjen.

74
7.2. First series of experiments: concentrations of ammonium, phosphate, sulfate, and
carbon dioxide (Papers I and II)
The aim of the first series of experiments was to quantify (Paper I) and model (Paper II)
the effects of ammonium, phosphate, sulfate, and carbon dioxide concentrations on the growth
and biochemical composition of C. reinhardtii cultures, as a potential source for H2 production.
For efficient H2 production, cultures with high biomass are necessary (Tamburic et al.
2011). Starch and protein have been shown to be important electron sources for the hydrogenase
enzyme (Melis et al. 2000; Zhang et al. 2002). Moreover, chlorophyll a concentration of 20 µg
mL-1
has been shown to be optimum for maximum H2 production yield (Hahn et al. 2004).
Therefore, the productivity and the biomass yield of the cultures, as well as their contents of
starch, protein, and chlorophyll were chosen as response parameters.
Preliminary experiments (data not shown) showed that varying concentrations of
ammonium and phosphate in the HS medium, as well as CO2 concentration bubbled into cultures
had a significant effect on the growth of C. reinhardtii. Based on the results of these preliminary
experiments, a range of nutrient concentrations was chosen, and the sampling times were
decided. Sulfate was added to the experimental designs of the first series of experiments, due to
its known effect on starch accumulation and its importance in the H2 production process. The
concentrations of ammonium in the first series of experiments varied between 5.0 and 20.0 mM,
phosphate concentrations were between 7.5 and 22.5 mM, sulfate concentration varied between
0.1 and 1.0 mM, and CO2 concentrations in the bubbled gas varied between 1.0 and 6.0 % v/v
(Table 1 in Paper I). The phosphate concentrations used in this study were quite high (7.5 – 22.5
mM), due to the fact that K2HPO4/KH2PO4 was used as a pH buffer system, necessary to avoid
acidification of the cultures as ammonium was consumed and metabolites excreted by the
microalgae. The results of the preliminary experiments showed that when the concentration of
phosphate was decreased below 7 mM, the pH of the cultures with high ammonium
concentrations decreased below 4.0 and these cultures died. Additional pH buffers were, then,
tested (data not shown) for their efficiency to stabilize the pH of the cultures. NaHCO3 showed to
be the most effective in maintaining stable pH and was, therefore, chosen to be used in the
growth media at a concentration of 2 mM per percent CO2 in the bubbled gas. The sampling

75
times were chosen to approximately correspond to the linear and the beginning of the stationary
growth phases.
In Paper I, two concentrations of ammonium, phosphate, sulfate, and carbon dioxide were
combined in a 24 full factorial design. One of the advantages of this experimental procedure is its
ability to identify interaction effects between the studied variables. It also reduces the number of
runs as compared to one-by-one factor experiments. The details of this statistical design are
presented in Table 1 in Paper I. The experimental setup and the details of the various analyses are
described in the Materials and methods section of Paper I. The individual and interaction effects
of the concentrations of the four studied nutrients we quantified and the results of the analysis of
variance (ANOVA) are presented in Table 2 in Paper I. The measured pH, dry weight (DW) of
the cultures and their contents of starch, protein, and chlorophyll are presented in the figures in
Paper I.
In Paper II, the number of treatments was extended from sixteen treatments in the 24
factorial design used in Paper I to twenty five treatments in a central composite design with
additional eight axial points and one central point (Figure 19). The details of this statistical design
are presented in Table 1 in Paper II and the experimental setup is described in the Materials and
methods section of Paper II. The response parameters (productivity, biomass yield, and starch,
protein, and chlorophyll contents) were modeled using a second order equation (Equation 2,
Paper II). The details of the statistical analysis are presented in the Materials and methods section
in Paper II. The obtained second-order response surfaces (Table 2 in Paper II) were then used for
an optimization procedure that predicted maximum responses and the corresponding values of the
studied variables. Model validation experiments were carried out.
Figure 19. An example of a central composite design, based on a 22 full factorial design with a
center point and four axial points.

76
The treatments in the first series of experiments were divided into blocks and carried out
successively, according to the CO2 concentration. The experiments were carried out over a seven-
week period. Control treatments were not performed in this first series of experiments and the
results could not been normalized. The vitality of the cultures could have varied over the
experimental period.
The statistical models used in Paper II use the ANOVA method, which was also used for
the analysis of the results in Papers I and III. For the ANOVA to be reliable, some basic
assumptions must be satisfied. Namely, it assumes that the errors of the response data follows a
normal distribution, that the observations are mutually independent and that the variances of the
responses within the treatments are constant. The models used in Paper II were validated using
the residuals analysis. The residuals are the differences between every individual observation and
the corresponding model estimate of that observation. If the model is adequate, the residuals
should present no structure; this means, they should not present any obvious distribution pattern
(Montgomery 2009). The normality assumption can be checked by plotting a histogram of the
residuals (Figure 20). If the normality assumption is satisfied, this histogram should look like a
sample from a normal distribution centered at zero. A normal probability plot of the residuals is
also usually constructed (Figure 20). It uses a t-test and if the error distribution is normal, this
plot will look like a straight line, especially in the central values, more than on the extremes. By
plotting the residuals vs. time (or observation order) (Figure 20), it is possible to detect
correlations between the residuals and to test the independence assumption. Finally, a non-
constant variance can be detected on the residuals vs. fitted values plot (Figure 20) if it presents
any obvious structure or pattern.

77
0.300.150.00-0.15-0.30
99
90
50
10
1
Residual
Per
cen
t
2.502.252.001.751.50
0.2
0.1
0.0
-0.1
-0.2
Fitted Value
Res
idu
al
0.240.120.00-0.12-0.24
8
6
4
2
0
Residual
Fre
qu
ency
30282624222018161412108642
0.2
0.1
0.0
-0.1
-0.2
Observation Order
Res
idu
al
Normal Probability Plot Versus Fits
Histogram Versus Order
Figure 20. An example of the residuals distribution plots generated by Minitab of one of the
models used in Paper II.
78
7.3. Second series of experiments: light intensity, temperature, and CO2 concentration
(Paper III)
The second series of experiments focused on the effects of the environmental factors:
light intensity (100 and 400 µmol m-2
s-1
), temperature (25 and 35 °C), and CO2 concentration (3
and 9% v/v) on the growth and biochemical composition of C. reinhardtii. A 23 full factorial
design was used to study the effects of these three factors and their interactions. Table 2 in Paper
III shows the details of this experimental design. The experimental setup is described in detail in
the Materials and methods section of Paper III. The composition of the growth medium used in
this series of experiments was determined by using the modeling results of the first series of
experiments (Paper II) and optimizing the concentrations of ammonium, phosphate, and sulfate
for maximum productivity and maximum biomass yield. The nutrient concentrations of this
medium are detailed in Table 1 in Paper III.
In this series of experiments, the treatments were divided into blocks and carried out
successively, at two different levels of light intensity. A control treatment (n = 3) with 100 µmol
m-2
s-1
, 25 °C, and 3% CO2 was carried out in parallel to the treatments at 400 µmol m-2
s-1
. A
simple t-test showed that there was no significant (p > 0.05) differences between the measured
dry weights of these control cultures compared to the cultures in treatment 1, with the same
conditions.

79
7.4. Third experiment: calcium and magnesium concentrations (Paper IV)
The results, obtained by Leiv Mortensen (Mortensen and Gislerød 2014; 2015) and Marit
Evjen (2014) from our research team, indicated a possible growth limitation by calcium and/or
magnesium when C. reinhardtii is grown in the HS medium. Indeed, the HS medium (and the
growth media used in the first two series of experiments) contains relatively low concentrations
of calcium and magnesium (0.068 mM Ca and 0.081 mM Mg) compared to other culture media
used for growing C. reinhardtii (Harris 2009). This experiment (Paper IV) was designed to
investigate whether the concentrations of calcium and magnesium used in the first two series of
experiments were limiting for growth. Four different concentrations of calcium and magnesium
were used, ranging from the concentrations found in the HS medium (0.068 mM Ca and 0.081
mM Mg) to their tenfold (0.68 mM Ca and 0.81 mM Mg). The details of the experimental setup
are described in the Materials and methods section of Paper IV.

80
7.5. Determination of the dissolved CO2 concentration
The concentration of the dissolved CO2 gas in the growth medium, and not the CO2
concentration in the bubbled gas, determines the availability of CO2 to the microalgae. A test was
performed to determine the relationship between the concentration of CO2 in the bubbled gas and
the concentration of the dissolved CO2 in the growth medium. The details of the experimental
setup are described in the Materials and methods section of Paper I. The results showed a
progressive increase in the dissolved CO2 concentration from 100 to 430 mg L-1
, with an
increasing CO2 concentration in the bubbled gas, from 0.04% to 9.0% (Figure 21). In parallel to
the increase in dissolved CO2 concentration, the pH decreased from 7.52 ± 0.01 to 6.59 ± 0.01
(mean ± SD, n = 3) (Figure 21). The linear regression curve (order 2) between the CO2
concentration in the bubbled gas and the concentration of dissolved CO2 was highly correlated
(R2
adj = 0.955) and followed the function y = – 4.2 x2 + 73 x + 108, where y = dissolved CO2
concentration in the medium (mg L-1
) and x = CO2 concentration in the bubbled gas (% v/v).
CO2 concentration in the bubbled gas (% v/v)
0 1 2 3 4 5 6 7 8 9 10
Dis
solv
ed C
O2
co
nce
ntr
atio
n (
mg
L-1
)
0
100
200
300
400
500
pH
6.4
6.6
6.8
7.0
7.2
7.4
7.6
7.8
Dissolved CO2
concentration
Regression curve of dissolved CO2
concentration: y = - 4.2 x2
+ 73 x + 108, R2
adj
= 0.955
pH
Figure 21. Effect of CO2 concentration in the bubbled gas (% v/v) on the dissolved CO2
concentration (mg L-1
) in the High-Salt Sueoka medium (means ± SD, n = 3) with the linear
regression curve (y = - 4.2 x2 + 73 x +108, R
2adj = 0.955) fitted to the data and on the pH of the
medium.
81
Additional measurements were performed to determine how different culture conditions
could influence the dissolved CO2 concentration in the PBRs. First, a test was carried out using
much higher flow rate than the one used throughout our experiments with 3 and 9% CO2 in HS
medium. The results shown that there was no significant (p > 0.1) difference between the
dissolved CO2 concentrations at the two flow rates tested. A second test with 35 °C and 9% CO2
showed that there was no significant (p > 0.1) difference between the dissolved CO2
concentrations at 25 or 35 °C. Finally, a test was performed using the growth medium used in
Paper III with 3 and 9% CO2. The measured dissolved CO2 concentrations in the growth medium
used in Paper III were significantly (p < 0.001) lower than in the HS medium, with 130 ± 5 mg L-
1 (mean ± SD, n = 3) instead of 293 ± 6 mg L
-1 at 3% CO2, and 187 ± 6 mg L
-1 instead of 430 ± 17
mg L-1
at 9% CO2. This difference in dissolved CO2 concentrations between the HS medium and
the medium used in Paper III was probably due to the different nutrient composition of the two
media.

82
7.6. Determination of the biomass content in the cultures
The biomass content of a culture can be measured by different methods. These methods
include cell counting, DW determination, optical density (OD) measurement, or assays of
chlorophyll or protein content. These last two methods of determination of chlorophyll or protein
content per unit volume of culture were not applicable for our experiments, since our study
hypothesis was that the biochemical content of the cells should vary with the different culture
conditions. Cell counting, especially using particle counters, such as Coulter counter, also
presents a difficulty in the case of C. reinhardtii since this microalga forms palmelloid cells upon
division. So, our methods of choice were measuring the DW of the cultures and their OD by
spectrophotometry.
The DW of a culture was measured by filtering a small sample through a pre-weighed
glass microfiber filter, which was then dried and weighed. The filters were pre-washed with
deionized water in order to remove any residual material that otherwise might be lost in the
procedure, thus affecting the measured DW of the sample, and dried. After a sample was filtered
using a vacuum pump, the filters were washed with deionized water to remove all the remaining
salts that are present in the growth medium. The filters were dried (4 h at 103.5 °C was enough to
obtain constant weight) and then cooled down in a desiccator containing silica gel that extracts all
the remaining water from the filter, and weighed again. We disposed of a microbalance (XP6,
Mettler Toledo, Greifensee, Switzerland) with a very high degree of precision, it being able to
measure the weight down to a µg. We were, therefore, able to use quite small filters (25 mm in
diameter) and very small sample volume for each DW determination, which is very convenient in
case of frequent sampling with an initial culture volume of 300 mL.
The various steps of this procedure had to be assayed and optimized before starting the
experiments. Three filters were used for measuring the DW of each culture, to eliminate the
errors associated with the method. The details of this procedure are described in the Materials and
Methods section of Paper I.
The productivity of the cultures was measured approximately in the linear growth phase.
The productivity (P) of the cultures (g L-1
d-1
) was calculated using the formula:

83
where DW1 (2) is the DW determined at time t1 (2) (in days). The biomass yield was defined as the
maximum attained biomass measured during the experiments.
The measurement of the OD of a sample is much simpler and required little effort to set
up. We needed, however, to determine the range of ODs, over which the method was linear.
Outside that range, the cultures had to be diluted before the measurement was done.
Theoretically, a linear relationship between the DW and the OD should exist. We plotted the DW
vs. the corresponding OD of each one of our samples from all three series of experiments in
Figure 22. The distribution was linear and could be approximated by the straight line of equation
DW = 0.534 OD + 0.013, with R2
adj = 95.5%. The Pearson correlation (Pearson and Hartley
1966) between the DW and the OD was 0.977 (p < 0.001). It would therefore be possible to
measure OD and calculate the corresponding DW using this linear regression equation. Gordillo
et al. (1999) also found a linear relationship between the OD at 750 nm and the DW of Spirulina
platensis photoautotrophic batch cultures. The slope of their curve was 0.89, meaning that the
conversion coefficient is species-specific and probably depends on the cell size and the pigment
content. We observed, however, that the variance was not constant within the measured range. It
was small for low values of OD and DW, and became larger as these increased.
9876543210
5
4
3
2
1
0
OD (750 nm)
DW
(g
/L)
Regression
95% Confidence interval
95% Prediction interval
DW = 0.534 OD + 0.013
R-Sq (adj) = 95.5%
Figure 22. The linear relationship between the dry weight (DW) and the optical density (OD at
750 nm) of the samples of C. reinhardtii cultures in our experiments.

84
7.7. Setup of the biochemical assays
The assays for starch, protein, and chlorophyll also needed to be set up. The details of
these biochemical assays are presented in the Materials and Methods sections of Paper I.
The major issue encountered was to disrupt the cells to extract the intracellular
compounds. Several methods of cell disruption were tested: sonication, solubilization by
detergents, freezing-thawing. The extent of cell breakage was evaluated by microscopic
observation of the number of remaining intact cells. Finally, the cells were disrupted by
mechanical force, by adding glass beads and shaking the samples on a mixer mill.
Different methods of starch assay were tested. First, the method of McCready et al.
(1950), modified by Branyikova et al. (2010) was tested. This method relies on hydrolysis of
starch by perchloric acid. Anthrone in 72% sulfuric acid is then used to colorimetrically
determine the starch content in the solution against glucose standard curve. This method uses
some quite ‘nasty’ solvents and it was difficult to establish its linearity. Sigma sa20 colorimetric
starch assay kit (Sigma-Aldrich, St. Louis, MO, USA) based on autoclaving for starch
solubilization followed by several enzymatic reactions was tested next. Due to some technical
difficulty in dissolving the starch assay reagent supplied in the kit, this method wasn’t used
either. Finally, Megazyme starch assay (K-TSTA, Megazyme International, Bray, Ireland) was
adapted to small volume samples (2 mL). Starch was solubilized by heat and dimethyl sulfoxide
(DMSO) solvent, hydrolyzed by α-amylase and amyloglucosidase enzymatic reactions, and
finally, the glucose concentration was assayed colorimetrically after the reaction with the glucose
oxidase/peroxidase (GOPOD) reagent. A formula supplied in the Megazyme starch assay kit was
used to calculate the starch content of the cultures as % of DW.
Proteins were solubilized by a buffer containing 1% Triton, after testing several buffers
with different detergents at different concentrations, and different pH levels, so the whole cell
protein extract was assayed. Bovine serum albumin (BSA) standard curve was prepared in the
same buffer, making sure of its linearity. The colorimetric microplate assay kit from Bio-Rad
(#500-0112, Bio-Rad, Hercules, CA, USA) based on the Lowry (1951) method was chosen over
the Bradford method based Bio-Rad assay kit because of its compatibility with detergents used
for protein solubilization. The protein concentrations in the samples were determined by
85
spectrophotometry measurements and using the BSA standard curve. The protein concentration
was normalized to the DW and expressed as protein content in % of DW.
Chlorophyll was extracted directly from the microalgal cells without previous cell
disruption. For this, several solvents were tested, and finally, 95% ethanol was chosen since it is
more environment-friendly than other solvents, such as acetone or methanol, easier to use, and
more efficient in extracting chlorophyll from C. reinhardtii cells. The absorbance of the
chlorophyll extracts was measured using spectrophotometry and the formula supplied by Harris
(1989) was applied to determine the total chlorophyll (a + b) concentration in the samples:
When needed, the chlorophyll concentration was normalized to the DW of the sample and
expressed as chlorophyll content in % of DW.

86
8. Main results and discussion
In this study, we quantified the effects of culture conditions, such as nutrient
concentrations in the growth medium, CO2 concentration in the bubbled gas, light intensity, and
temperature on the growth and biochemical composition of C. reinhardtii photoautotrophic batch
cultures. The first series of experiments (Papers I and II) aimed at evaluating the effects of
concentrations of ammonium, phosphate, sulfate and carbon dioxide on the productivity, the
biomass yield, and the contents of starch, protein, and chlorophyll for potential hydrogen
production with C. reinhardtii. Paper I presents the growth curves and the variation in
biochemical composition of a part of the data from the first series of experiments, while Paper II
presents the statistical models using the complete dataset and the results of the validation
experiments. Tables 1 and 2 (at the end of this section) summarize the main results of the first
series of experiments. Next, we studied the effects of light intensity, temperature, and CO2
concentrations on the same set of parameters. The results of the second series of experiments are
presented in Paper III and summarized in Tables 3 and 4 at the end of this section. Finally, a
question arose whether the concentrations of calcium and magnesium in the growth media used
in the first two series of experiments could be limiting for growth. An experiment with four
different concentrations of calcium and magnesium, ranging from those used in our media to their
ten-fold, was carried out. The results of this experiment are presented in Paper IV and
summarized in Table 5 at the end of this section.

87
8. 1. pH
The pH of the cultures decreased progressively with the time and the growth of
microalgae (Table 2 and Figure 1 in Paper I; Figure 1 in Paper III; Figure 1 in Paper IV). Indeed,
the pH of the cultures was negatively correlated to the measured dry weight (Tables 2 and 4). The
optimum pH range for C. reinhardtii growth is 6.5 – 8.0 (Harris 1989). In some of the cultures in
the different experiments carried out in this study, the pH decreased below 6.5. This was
especially the case in media containing high concentrations of ammonium (17.5 – 20 mM) and
relatively low concentrations of phosphate (7.5 – 10 mM) (Table 2 in Paper I). The pH at the end
of the experiments also tended to be lower in the cultures grown at lower carbon dioxide
concentrations (Table II in Paper I; Table 3 in Paper II), probably due to the fact that less
bicarbonate was added to these cultures, as the amount of bicarbonate added to the growth media
was proportional to the carbon dioxide concentration in the bubbled gas. This was a strategy that
did not yield enough bicarbonate at the low CO2 concentrations and culture conditions that
yielded high biomass. The decrease in pH was particularly marked in the second series of
experiments, in the cultures grown in 17.5 mM ammonium, 7.5 mM phosphate, at 3% carbon
dioxide and 400 µmol m-2
s-1
, where the pH dropped significantly after only 48 h of growth and
the cultures died (Figure 1 in Paper III). Consequently, for the experiments on calcium and
magnesium (Paper IV), we increased the phosphate concentration to 15.0 mM in order to
maintain a stable pH in a medium with high initial ammonium concentration (17.5 mM). This
strategy was effective, and the pH in these experiments was stable and did not decrease below
6.25 (Figure 1 in Paper IV).
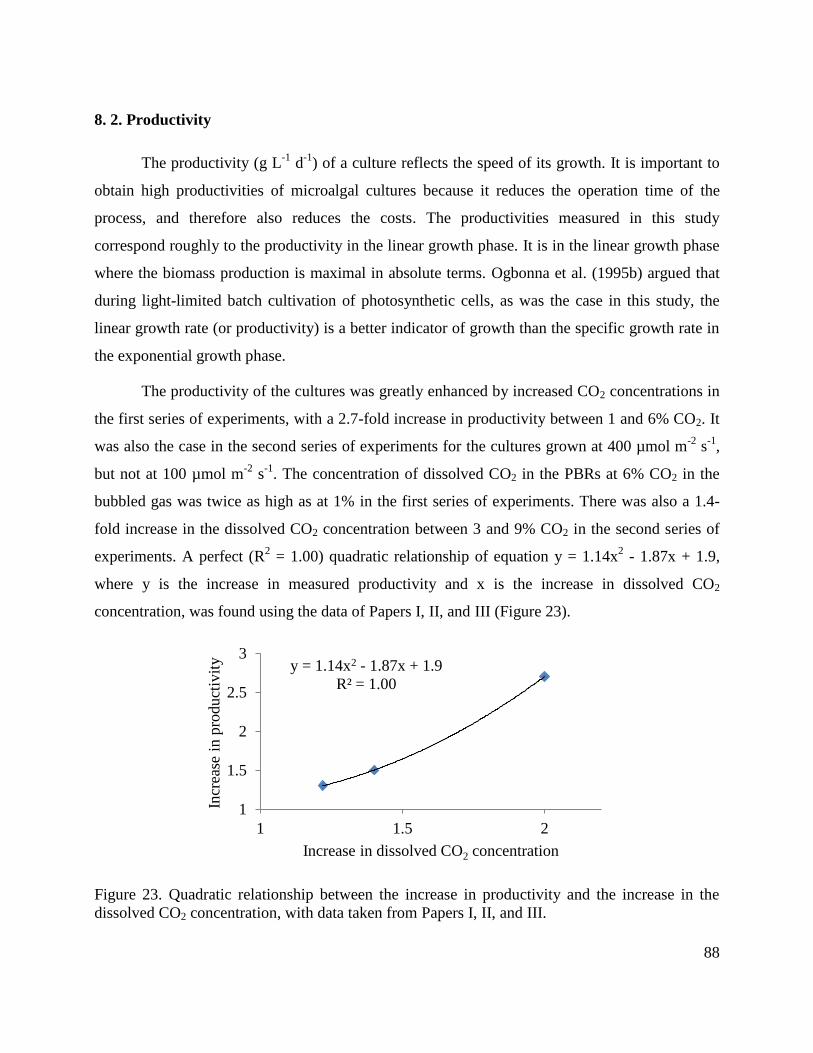
88
8. 2. Productivity
The productivity (g L-1
d-1
) of a culture reflects the speed of its growth. It is important to
obtain high productivities of microalgal cultures because it reduces the operation time of the
process, and therefore also reduces the costs. The productivities measured in this study
correspond roughly to the productivity in the linear growth phase. It is in the linear growth phase
where the biomass production is maximal in absolute terms. Ogbonna et al. (1995b) argued that
during light-limited batch cultivation of photosynthetic cells, as was the case in this study, the
linear growth rate (or productivity) is a better indicator of growth than the specific growth rate in
the exponential growth phase.
The productivity of the cultures was greatly enhanced by increased CO2 concentrations in
the first series of experiments, with a 2.7-fold increase in productivity between 1 and 6% CO2. It
was also the case in the second series of experiments for the cultures grown at 400 µmol m-2
s-1
,
but not at 100 µmol m-2
s-1
. The concentration of dissolved CO2 in the PBRs at 6% CO2 in the
bubbled gas was twice as high as at 1% in the first series of experiments. There was also a 1.4-
fold increase in the dissolved CO2 concentration between 3 and 9% CO2 in the second series of
experiments. A perfect (R2 = 1.00) quadratic relationship of equation y = 1.14x
2 - 1.87x + 1.9,
where y is the increase in measured productivity and x is the increase in dissolved CO2
concentration, was found using the data of Papers I, II, and III (Figure 23).
Figure 23. Quadratic relationship between the increase in productivity and the increase in the
dissolved CO2 concentration, with data taken from Papers I, II, and III.
y = 1.14x2 - 1.87x + 1.9
R² = 1.00
1
1.5
2
2.5
3
1 1.5 2
Incr
ease
in p
roduct
ivit
y
Increase in dissolved CO2 concentration

89
In the first series of experiment, the concentration of ammonium had little influence on
the productivity compared to the effect of CO2 (Figure 1b in Paper II), probably due to the fact
that it was not growth-limiting at the time points between which the productivity was measured.
Increased concentrations of sulfate up to 0.55 mM did increase the productivity of the cultures
(Figure 1b in Paper II), indicating that 0.1 and 0.2 mM sulfate were probably limiting for growth
even at the early stage where productivity was measured. The maximum productivity predicted
by the model in Paper II was 0.87 g L-1
d-1
for a medium containing 5.0 mM ammonium, 0.65
mM sulfate with 6.0% CO2 (Figure 2a in Paper II; Table 1), which was confirmed by the model
validation experiment (Figure 5a in Paper II). The maximum productivity corresponded to the
medium with the lowest concentration of ammonium and the highest concentration of carbon
dioxide tested in this study, showing for the negative interaction effect on the productivity
between the concentrations of these two nutrients (Table 2 in Paper II). The optimum sulfate
concentration for maximum productivity was 0.65 mM, which is much higher than the
concentration of sulfate in the HS medium (0.182 mM) (Sueoka 1960), but is closer to the sulfate
concentration in the TAP medium (0.51 mM) (Gorman and Levine 1965) (Table 1). We would
therefore recommend increasing the sulfate concentration in these two growth media to 0.65 mM.
In the second series of experiments, high light intensity (400 µmol m-2
s-1
) and high
temperature (35 °C) induced an earlier and faster growth of the cultures as compared to low light
(100 µmol m-2
s-1
) and low temperature (25 °C) (Figure 2 in Paper III). The maximum
productivity measured in these experiments was 1.12 g L-1
d-1
in the treatment with 400 µmol m-2
s-1
, 35 °C, and 9% CO2, between 36 and 48 h of growth (Figure 2 in Paper III). The cultures
clearly benefitted from the synergistic effect of high light intensity, high temperature, and high
CO2 concentration for their growth at early stage (Table 3 in Paper III). The productivity
measured in the same conditions of light intensity and CO2, but at 25 °C was not significantly (p
> 0.1) different from 1.12 g L-1
d-1
, but it was measured 24 h later, between 60 and 72 h of
growth, these cultures having a much longer lag phase than the cultures at 35 °C (Figure 2 in
Paper III). The cells in these cultures probably received enough light energy and carbon dioxide
available for fast growth. However, the temperature of 35 °C probably accelerated the
accumulation of sufficient intracellular compounds for cell division, which allowed the cultures
grown at 35 °C to start their fast growth earlier as compared to the cultures grown at 25 °C.

90
Mortensen and Gislerød (2014) also found that at 300 µmol m-2
s-1
there was no difference in
productivity in the temperature range of 24 – 33 °C. It is worth mentioning that 35 °C approaches
quite closely to the maximum temperature tolerated by C. reinhardtii cells. Indeed, Tanaka et al.
(2000) showed that at 35 °C there was no synthesis of heat-shock proteins in C. reinhardtii cells,
which are synthesized when cells are exposed to extreme high temperatures, however, they were
present in cells exposed to temperatures over 37 °C.
The maximum productivity in the second series of experiments (1.12 g L-1
d-1
) was
significantly (p < 0.05) higher than the maximum productivity measured in the first series of
experiments (0.87 g L-1
d-1
). The growth medium used in the second series of experiments was
designed using the results of the first series of experiments as to yield maximum productivity and
biomass yield. This medium contained 17.5 mM ammonium, 7.5 mM phosphate, and 0.65 mM
sulfate. The maximum productivity in the second series of experiments was measured at 400
µmol m-2
s-1
, 35 °C, and 9% CO2. These combined conditions of nutrient-rich medium, high CO2
concentration, and higher light intensity and temperature than the ones used in the first series of
experiments acted synergistically to yield the higher productivity measured in the second series
of experiments.
The productivity of the cultures was further increased by increasing the calcium and
magnesium concentrations in the growth medium, in the third series of experiments (Paper IV).
The maximum productivity measured in this experiment was 1.97 g L-1
d-1
in the treatment with
ten times the concentrations of calcium and magnesium used in the first and second series of
experiments and the HS medium. However, the difference in growth at different concentrations
of calcium and magnesium was not significant (p > 0.01) before 2.5 days of growth, up to a
biomass concentration of 0.95 – 1.18 g L-1
(Figure 2b in Paper IV). This indicates that the HS
medium (Sueoka 1960) and the media used in the first two series of experiments has sufficient
amount of calcium and magnesium to sustain microalgal growth up to about 1 g L-1
. The
concentrations of calcium and magnesium used in the first two series of experiments did not
therefore affect the growth of the microalgae up to this biomass.

91
8. 3. Biomass yield
Contrary to its effect on the productivity, increased CO2 concentration did not increase the
biomass yield of the cultures (Table 2 in Paper I; Table 3 in Paper III). The effect of CO2
concentration on the DW of the cultures at 96 h of growth in Paper I was not significant (Table 2
in Paper I). However, by adding three more levels of CO2 concentration in Paper II, we could
observe an increase in biomass yield with increasing CO2 concentration up to 3.5% (Figure 1c in
Paper II) and the CO2 concentration was included in the model for the biomass yield (Table 2 in
Paper II). In the second series of experiments, the increased CO2 concentration of 9% had a
negative effect on the biomass yield at 100 µmol m-2
s-1
(Table 3 in Paper III). This is in
accordance with the results obtained by Mortensen and Gislerød (2014; 2015), who also detected
a negative effect of CO2 concentrations higher than 9% on the growth of this strain of C.
reinhardtii. The cultures might have benefited from higher CO2 concentrations during their early
growth stage, increasing their productivity with the increase in the available CO2 concentration
(Figure 23). However, the cultures in a later growth stage might have been less sensitive to the
increase in CO2 concentration, since their growth might have been limited by the availability of
other nutrients in the growth medium (such as calcium and magnesium), hence no measured
increase in biomass yield at higher CO2 concentrations.
Both ammonium and sulfate concentrations, as well as their combination, influenced
positively the biomass yield of the cultures in the first series of experiments (Table 2 in Paper I;
Table 2 in Paper II). The growth of the cultures in low sulfate (0.1 – 0.2 mM) and low
ammonium (5.0 – 7.5 mM) concentrations was therefore probably limited by these two nutrients.
We calculated that 2.8 – 5.2 mM of nitrogen and 0.05 – 0.12 mM of sulfur was left in the
medium at the time when the biomass yield was determined (Figure 11 in Paper I). Even if the
cultures did not become depleted of these two nutrients, their growth might have been affected by
their remaining low concentrations in relation to the availability of other nutrients, especially of
carbon dioxide. The uptake and assimilation of ammonium, sulfate, and also phosphate are
closely related to the carbon fixation. A balance must exist in the growth medium between the
main macronutrients and carbon, so that these macronutrients are incorporated into carbon
skeletons in an equilibrated manner (Grossman and Takahashi 2001). When all the required

92
nutrients are provided in excess, microalgae grow in a balanced way and display a uniform
chemical and biochemical composition (Goldman 1980). This is rarely the case in batch cultures,
where most frequently one of the nutrients becomes limiting for growth. The cells in the cultures
grown at low ammonium and sulfate concentrations in the first series of experiments, probably
experienced an imbalance of the available nutrients, with high available carbon dioxide and low
ammonium and sulfate, which was reflected by their higher starch content as compared to the
cultures grown in media containing high initial concentrations of ammonium and sulfate (Figure
4 in Paper I).
The maximum biomass yield measured in the first series of experiments was 1.57 g L-1
in
the medium containing 12.5 mM ammonium, 7.5 mM phosphate, 0.55 mM sulfate, and 3.5%
CO2 (Table 1). The maximum predicted biomass yield by the model in Paper II was 1.66 g L-1
for
a medium containing 20.0 mM ammonium, 7.5 mM phosphate, 0.66 mM sulfate, and 4.5% CO2
(Figure 2b in Paper II; Table 2). However, the model validation experiment yielded a biomass of
1.26 g L-1
at 96 h of growth (Figure 5b in Paper II; Table 1), which was 24% lower than
predicted. The predicted optimum sulfate concentration for the maximum biomass yield was the
same as for the maximum predicted productivity. The predicted optimum ammonium
concentration, however, corresponded to the opposite extreme (20.0 mM) as for the maximum
predicted productivity (5.0 mM).
The medium composition used in the second series of experiments was similar to the one
predicted for the maximum biomass in Paper II. It contained 17.5 mM ammonium, 7.5 mM
phosphate, and 0.66 mM sulfate. The highest biomass measured in the second series of
experiments was 1.35 g L-1
for the same growth conditions that yielded the maximum
productivity, namely 400 µmol m-2
s-1
, 35 °C, and 9% CO2 (Figure 2b in Paper III; Table 3).
Surprisingly, it was lower than the maximum biomass measured in the first series of experiments
(1.57 g L-1
), even if the growth medium was rich in nutrients, and higher light intensity,
temperature, and CO2 concentrations were used in the treatment that gave the highest biomass
yield in the second series of experiments. We had expected that by increasing light intensity and
temperature the biomass yield would be higher than in the first series of experiments. Knutsen et
al. (2012) offer a somewhat speculative, but interesting, explanation for different growth yields

93
obtained in cultures grown during different seasons of the year. However, the lower biomass
yield in the second series of experiments as compared to the first one could also be due to the
negative effect of the CO2 concentration, which was also observed by Mortensen and Gislerød
(2014; 2015) in their studies with the same strain of C. reinhardtii. The results presented in Paper
II (Figure 1c in Paper II) showed that 3.5% CO2 yielded the highest biomass yield. The
optimization procedure in Paper II indicated 4.5% of CO2 as the optimal concentration for
obtaining maximum biomass yield (Table 1). However, the model validation experiment (Figure
5b in Paper II) carried out with 4.5% CO2 yielded a lower biomass (1.26 g L-1
) yield than the one
measured at 3.5% CO2 (1.57 g L-1
). The increased CO2 concentration of 9% in the second series
of experiments did not have a positive effect on the biomass yield, and a CO2 concentration of
about 3.5% could actually be the optimum one for obtaining high biomass yields with this
microalga. Due to the fact that the two treatments with 400 µmol m-2
s-1
and 3% CO2 showed a
sharp decrease in pH and died after 72 h (at 35 °C) and 96 h (at 25 °C), it is difficult to evaluate
the effects of the environmental factors studied in the second series of experiments on the
biomass yield. In the other cultures, we observed an increase in biomass up to 96 h of growth,
after which the cultures entered into a stationary growth phase. Light was limiting for growth at
the level of 100 µmol m-2
s-1
, as the cultures grown at 400 µmol m-2
s-1
had higher productivities
and higher biomass yields. A positive correlation was found between the biomass yield and the
productivity of the cultures in both series of experiments (Tables 2 and 4). Ogbonna et al.
(1995b) also found a good correlation between the linear growth rates and the final cell
concentrations for both Chlorella and Spirulina cells.
The results obtained in the third experiment showed that the biomass yields of the cultures
in the first and second series of experiment were limited by the concentrations of calcium and
magnesium. Indeed, when the concentrations of calcium and magnesium were increased ten
times (0.68 mM calcium and 0.81 mM magnesium) the biomass of the cultures attained 4.83 g L-
1, twice as much as in the treatment with calcium and magnesium concentrations used in first two
series of experiments (0.068 mM calcium and 0.081 mM magnesium) (Figure 2b in Paper IV).
The biomass concentration measured after 96 h of growth in the treatment with the lowest
concentrations of calcium was 1.44 g L-1
, and was not significantly (p > 0.1) different from the

94
biomass measured at 96 h of growth in the cultures with similar concentrations of ammonium,
sulfate, and carbon dioxide in the first series of experiments.
The cultures grown at the highest concentrations of calcium and magnesium entered into
stationary growth phase after six days of growth, as did the other cultures in the third experiment
(Figure 2b in Paper IV). The growth of these cultures might have been limited by nitrogen, and
probably also by sulfur. As we calculated in Paper IV, the supplied amount of ammonium (17.5
mM) in the growth medium was sufficient to yield 2.6 g L-1
biomass containing 9.4% of DW
nitrogen, which was the measured nitrogen content of the cells grown in media with non-limiting
concentrations of ammonium at 5% CO2 (as in Paper IV) in the first series of experiments (Figure
10 in Paper I). This would mean that the microalgae grown at the highest concentrations of
calcium and magnesium could have started to experience nitrogen limitation at some point
between days 3 and 4, as they reached a biomass higher than 2.6 g L-1
(Figure 2b in Paper IV).
This was reflected by the diminished productivity between days 3 and 4 as compared to the
productivity measured between days 2 and 3 in these cultures, with even further decrease in
productivity between days 4 and 6 (Figure 2b in Paper IV). As explained in the introduction to
Paper II, when the supply rate of one of the nutrient elements is lower than required for the
maximum biosynthetic capacity of the cell, that element becomes limiting for growth (Bailey and
Ollis 1986; Falkowski and Raven 2007). Growth of nutrient-limited populations slows down
before total exhaustion of that nutrient (Bailey and Ollis 1986). The cultures experience, then a
transitory growth phase between the linear and the stationary growth phases, where the growth
slows down (as in the cultures grown at the highest concentrations of calcium and magnesium in
the third experiment shown in Figure 2b in Paper IV). During this transitory growth phase, the
cell content of the limiting nutrient probably decreases until it reaches its minimum cell quota
(Droop 1973) and the cell division stops. The culture enters then into the stationary growth phase
(as did the cultures grown at the highest concentrations of calcium and magnesium in the third
experiment shown in Figure 2b in Paper IV), where the cell quota is maintained constant, at its
minimum. The parameter that determined nutrient sufficiency or nutrient limitation status of a
cell is the nutrient cell quota (Droop 1973), not the amount of nutrient in the growth medium,
although a relationship between the two is expected.

95
8. 4. Starch content
During the nutrient-limited growth, several biochemical processes are affected.
Photosynthesis and respiratory processes, as well as protein and pigments synthesis, are reduced
(for references, check Paper II). Under these conditions, the cells experience an energy
imbalance: the energy required for growth becomes lower than the energy supplied through
photosynthesis (Hu 2004; Klok et al. 2013). Accumulation of highly reduced compounds, such as
lipids and carbohydrates, that do not contain the limiting nutrient serves then as a sink for the
assimilated carbon and as an alternative sink for the excess energy (for references, check Paper
II). Klok et al. (2013) postulated that, if an energy imbalance is created by reducing the nutrient
supply to the cells, cells division continues at the same time as lipids or carbohydrates
accumulate, as they do in the classic nutrient depletion experiments (for references, check Paper
II). This was observed in the cultures grown at high calcium and magnesium concentration in the
third experiment, which accumulated starch (from 2 to 25% of DW) (Figure 3a in Paper IV) as
their growth slowed down between days 3 and 4 as the ammonium in the medium became
growth-limiting. The protein content of these cultures decreased accordingly from 30 to 14% of
DW (Figure 3b in Paper IV), as did their chlorophyll content (Figure 4b in Paper IV). However,
the starch content in these cultures decreased in the stationary growth phase after reaching its
maximum at day 6, probably due to the accumulation of lipids, which were not measured, but
their amount was that high as to be visible at the pipette tip when analyzing these samples for
their starch content. Gardner et al. (2013) also observed a rapid accumulation of starch in their
nitrogen-starved C. reinhardtii cultures, reaching its maximum and then gradually decreasing as
TAG accumulated. Algal carbon reallocation from starch into lipid is a consequence of a switch
in metabolic pathways to form lipid in preference to starch during nutrient limitation.
Similar responses to nutrient concentrations in the growth medium were observed in the
first series of experiments. Indeed, cells grown in media with low content of ammonium and
sulfate, especially at high CO2 concentrations, accumulated quite high amounts of starch, up to
42% of DW in the medium containing 7.5 mM ammonium, 20 mM phosphate, 0.2 mM sulfate,
with 5.0% CO2 (Table 2 and Figure 4 in Paper I; Figure 3a in Paper II; Table 1). Negative
interactions effects on the starch content of the cultures were observed between the

96
concentrations of ammonium and sulfate, ammonium and carbon dioxide, and between sulfate
and carbon dioxide (Table 2 in Paper I; Table 2 in Paper II).
The maximum predicted starch content by the model in Paper II was 55% of DW for a
medium containing 5 mM ammonium, 22.5 mM phosphate, 0.1 mM sulfate, with 6% CO2
(Figure 4a in Paper II; Table 1), which is quite high value for microalgae (Dragone et al. 2011).
The results of the model validation experiment confirmed the predicted response, with 52 ± 3%
of DW starch for the predicted medium composition (Figure 5c in Paper II), which was not
significantly (p > 0.1) different from the predicted value. The concentrations of ammonium and
sulfate predicted to be optimal for maximum starch content corresponded to the lowest
concentrations tested in the first series of experiments, while the concentrations of phosphate and
sulfate were the highest tested. The fact that the predicted optimum concentrations are boundary
values of the experimental design used in the first series of experiments leaves us with a question
of how much starch could be accumulated if the ranges of the studied nutrient concentrations
were expanded.
The goal of this study was to obtain high biomass cultures that contained high starch
content. However, the predicted optimum media composition for the maximum biomass yield
and for the maximum starch content were quite different (Table 1), with the medium for
maximum predicted biomass yield containing high concentrations of ammonium and sulfate,
conditions that are adverse for starch accumulation. Indeed, the starch content and the biomass
yield were negatively correlated in the first series of experiment (Table 2b). We used the models
obtained in Paper II for maximum biomass yield and for maximum starch content in an
optimization procedure to obtain a medium that would give simultaneous high biomass yield and
high starch content. This optimization procedure yielded the following medium composition: 5.0
mM ammonium, 7.5 mM phosphate, 0.65 mM sulfate, with 5.2% CO2 and predicted a biomass
yield of 1.14 g L-1
and a starch content of 44% of DW. The model validation experiment was
carried out using this predicted medium composition and yielded a biomass yield of 1.31 ± 0.04 g
L-1
(means ± SD, n = 3) and a starch content of 31.0 ± 1.9% of DW (means ± SD, n = 3). The
measured biomass yield was significantly (p < 0.001) higher than the predicted biomass yield, but
the measured starch content was significantly (p < 0.001) lower than the predicted. This predicted

97
medium composition was very similar to the medium predicted for the maximum productivity
(Table 1). The model validation experiment yielded a productivity of 0.87 ± 0.01 g L-1
d-1
, which
was the maximum productivity predicted by the model in Paper II (Table 1) and also measured in
the model validation experiment for productivity (Figure 5a in Paper II).
The starch content in the second series of experiments did not exceed 11% of DW (Figure
3a in Paper III; Table 3), probably due to the nutrient sufficiency of the growth medium. The
growth medium in the second series of experiments contained 17.5 mM ammonium and 0.65 mM
sulfate (Table 1 in Paper III), which were the nutrients that had the largest effect on the starch
content in the first series of experiments. The cultures in the first series of experiments grown in
media containing similar concentrations of ammonium and sulfate had about 8% of DW of starch
(Figure 4 in Paper I), which is on the same level as the starch content in the cultures in the second
series of experiment. The highest starch content of 10.8% of DW was measured in the treatment
with 400 µmol m-2
s-1
, 25 °C, and 3% CO2 (Figure 3a in Paper III; Table 3), just before these
cultures died.

98
8. 5. Protein content
The maximum protein content measured in the first series of experiment was quite high:
52% of DW in the medium containing 17.5 mM ammonium, 20.0 mM phosphate, 0.9 mM sulfate
with 5.0% CO2 (Figure 5b in Paper I; Table 1). The maximum predicted protein content by the
model in Paper II was 65% of DW for a medium containing 20 mM ammonium, 22.5 mM
phosphate, 1.0 mM sulfate, with 4.4% CO2 (Figure 4b in Paper II; Table 1), which was confirmed
by the model validation experiment (Figure 5d in Paper II, Table 1). The optimum predicted
medium composition corresponded with the boundary values of the experimental design, which
like in the case of predicted maximum starch content, leaves us with a question of how the
protein content would have varied if the limits of the ranges of the concentrations of testes
nutrients were expanded.
The protein content in the cultures in the first series of experiments was positively
influenced by the concentrations of ammonium and sulfate (Figure 3b in Paper II; Figure 5 and
Table 2 in Paper I). Positive interaction effects between the concentrations of carbon dioxide and
ammonium, and of ammonium and sulfate were detected (Table 2 in Paper I; Table 2 in Paper II),
opposite to the effects of these nutrients on the starch content of the cultures in the first series of
experiments. Indeed, starch and protein contents of the cultures were negatively correlated in the
first series of experiments, as response to varying nutrient concentrations in the growth medium
(Table 2, Figure 24). A linear relationship between the starch and the protein contents was found
(Figure 24). This was expected, as protein and starch make up for the major constituents of the
cell. The nitrogen status of the cell acts as a switch in metabolic pathways from protein synthesis
under nitrogen sufficiency to starch synthesis as nitrogen becomes limiting.
The protein content in the second series of experiments increased with increasing light
intensity (Figure 3b and Table 3 in Paper III), while temperature and CO2 concentration had no
significant effect on the protein content of the cultures (Table 3 in Paper III). The maximum
protein content was 43% of DW in the treatment with 400 µmol m-2
s-1
, 25 °C, and 9% CO2,
which was expected as the medium used in the second series of experiments contained high
amounts of ammonium and sulfate (Table 1 in Paper III).
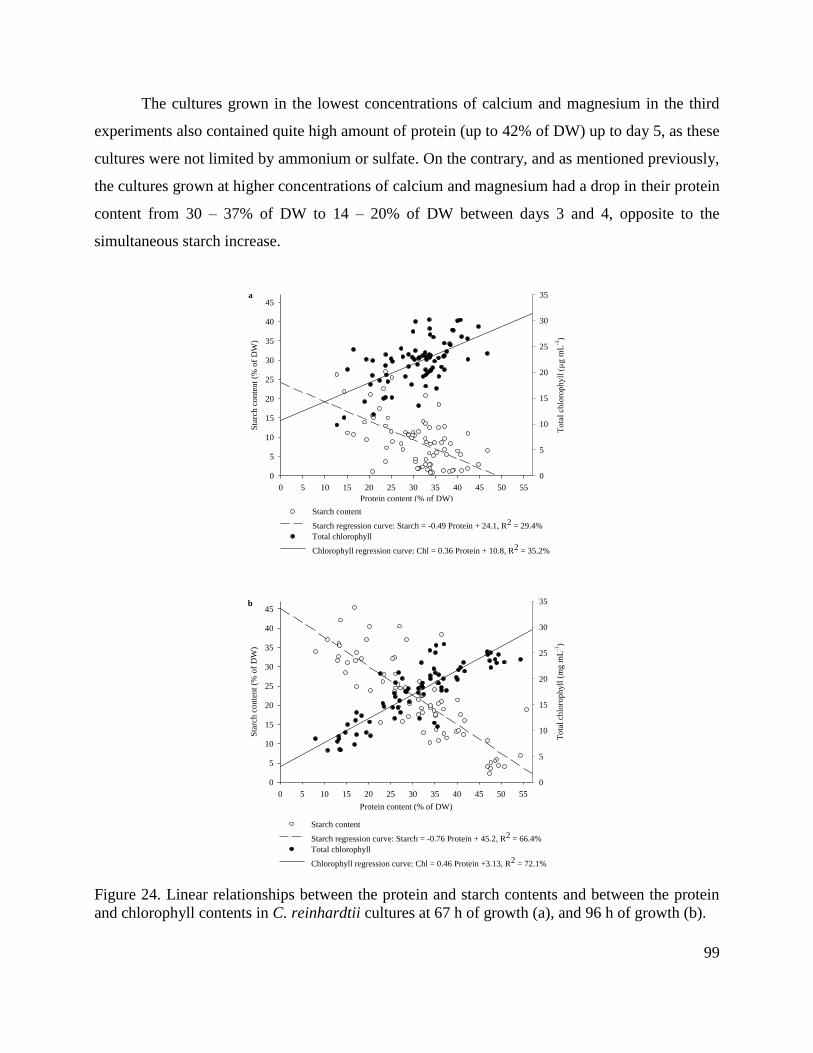
99
The cultures grown in the lowest concentrations of calcium and magnesium in the third
experiments also contained quite high amount of protein (up to 42% of DW) up to day 5, as these
cultures were not limited by ammonium or sulfate. On the contrary, and as mentioned previously,
the cultures grown at higher concentrations of calcium and magnesium had a drop in their protein
content from 30 – 37% of DW to 14 – 20% of DW between days 3 and 4, opposite to the
simultaneous starch increase.
Protein content (% of DW)
0 5 10 15 20 25 30 35 40 45 50 55
Sta
rch
co
nte
nt
(% o
f D
W)
0
5
10
15
20
25
30
35
40
45
To
tal
chlo
rop
hyll
(µ
g m
L-1
)
0
5
10
15
20
25
30
35
Starch content
Starch regression curve: Starch = -0.49 Protein + 24.1, R2 = 29.4%
Total chlorophyll
Chlorophyll regression curve: Chl = 0.36 Protein + 10.8, R2 = 35.2%
Protein content (% of DW)
0 5 10 15 20 25 30 35 40 45 50 55
Sta
rch
co
nte
nt
(% o
f D
W)
0
5
10
15
20
25
30
35
40
45
To
tal
chlo
rop
hyll
(m
g m
L-1
)
0
5
10
15
20
25
30
35
Starch content
Starch regression curve: Starch = -0.76 Protein + 45.2, R2 = 66.4%
Total chlorophyll
Chlorophyll regression curve: Chl = 0.46 Protein +3.13, R2 = 72.1%
a
b
Figure 24. Linear relationships between the protein and starch contents and between the protein
and chlorophyll contents in C. reinhardtii cultures at 67 h of growth (a), and 96 h of growth (b).
100
8. 6. Chlorophyll content
The chlorophyll content (as % of DW) increased with increasing concentrations of
ammonium in the first series of experiments (Figure 7 and Table 2 in Paper I; Figure 3 in Paper
II). This result was expected, as nitrogen is part of the structure of the chlorophyll molecule.
Positive interaction effects were also detected between ammonium and carbon dioxide
concentrations, and between ammonium and sulfate concentrations (Table 2 in Paper I; Table 2 in
Paper II). The cultures grown in higher nutrient concentrations gave rise to higher biomass
content (Table 2 in Paper I), and therefore higher chlorophyll content, due to photoacclimation to
increased mutual shading. The chlorophyll content was influenced by the different nutrient
concentrations as did the protein content of the cultures (Table 2 in Paper I). Indeed, a positive
correlation was found between the protein content and the chlorophyll concentration (Table 2)
and a linear relationship was established between these two parameters (Figure 24).
The model of Paper II predicted a chlorophyll concentration of 20 µg mL-1
, which was
determined to be the optimum one for H2 production by Hahn et al. (2004), for a medium
containing 5.0 mM ammonium, 22.5 mM phosphate, 0.6 mM sulfate, with 4.0% CO2 (Table 1).
However, the results of the model validation experiment (Figure 5e in Paper II) yielded a
chlorophyll content of only 5.5 µg mL-1
for that medium composition. Probably, the ammonium
concentration in this medium was not high enough to yield 20 µg chl mL-1
, as its highest content
was 13 µg mL-1
at 48 h after the start of the experiment and decreased thereafter.
Both the model for the chlorophyll content and the one for the biomass yield failed to
predict correctly the optimum medium compositions for the desired chlorophyll content and for
maximum biomass yield (Table 1). Both models had many significant terms in the equation
(Table 2 in Paper II), which probably was excessive, making them little precise. When modeling
a response, one should seek to establish a model with as little number of terms as possible. Both
these model also contained significant terms of phosphate concentration (Table 2 in Paper II).
The phosphate concentrations used in the first series of experiments were much higher than the
phosphate requirement as a nutrient for the growth of C. reinhardtii cultures, as it was used as a
pH buffer in the medium. Probably, if we would have eliminated those terms of phosphate

101
concentrations from these two models, their validity would have been improved and they would
make better prediction of the optimal conditions for the desired chlorophyll content and
maximum biomass yield of the cultures.
The chlorophyll concentration in the cultures (µg chl mL-1
) increased with the increasing
concentrations of calcium and magnesium (Figure 4a in Paper IV), reflecting higher biomass
concentration in the cultures grown at higher concentrations of calcium and magnesium. In their
study on Spirulina platensis, Celekli et al. (2009) also observed a direct relationship between the
biomass level and the amount of chlorophyll a throughout the culture period. However, when
expressed as chlorophyll content per unit dry weight, little variation was observed between the
treatments with different concentrations of calcium and magnesium (Figure 4b in Paper IV).
In the second series of experiment, the chlorophyll content of the cultures significantly
decreased with increasing light intensity (Figure 3c and Table 3 in Paper III), showing for the
photoacclimation of the microalgae to higher light intensity (Falkowski and Raven 2007).
Temperature also had a positive effect on the chlorophyll content of the cultures, although less
than the light intensity, as did the interactions of temperature with light intensity and CO2
concentration (Table 3 in Paper III). Shuter (1979) and Thomspon et al. (1992) concluded in their
studies that the increase in chlorophyll content with increasing temperature was a common
response in microalgae.
The chlorophyll concentration in the first series of experiments was positively correlated
to the biomass yield and to the protein content of the cultures (Table 2), as all three parameters
benefitted from nutrient-rich (especially in ammonium) growth media. Media with low
ammonium concentrations yielded higher pH, productivity, and starch contents, which were also
positively correlated between each other. In the second series of experiments other kinds of
correlations between the different parameter were found. Productivity, starch and protein contents
were all positively correlated to the biomass yield, as all these parameters increased with
increasing light intensity. Chlorophyll, on the other hand, correlated negatively with the biomass
yield, protein and starch contents, as it decreased with increasing light intensity.

102
8.7. Tables
Table 1. Summary of the results of the first series of experiments (Paper II). Concentrations of the four main nutrients: ammonium,
phosphate, sulfate, and carbon dioxide in the Tris-Acetate-Phosphate medium (Gorman and Levine 1965), the High-Salt Sueoka
medium (Sueoka 1960), and the experimental media that yielded the maximum responses of productivity between 43 and 67 h of
growth, biomass (dry weight) yield at 96 h of growth, as well as the maximum contents of starch, protein, and chlorophyll at 96 h of
growth. The optimized media compositions are also given for the corresponding predicted responses and the results of the model
validation experiments are indicated. NS, non significant.
Medium TAP HS Max.
productivity
Max.
predicted
productivity
Max.
biomass
Max.
predicted
biomass
Max. starch Max.
predicted
starch
Max. protein Max.
predicted
protein
Max.
chlorophyll
Predicted
20 µg chl mL-
1
NH4 (mM) 7.48 9.35 12.5 5.0 12.5 20.0 7.5 5.0 17.5 20.0 17.5 5.0
PO4 (mM) 1.0 13.6 15.0 NS 7.5 7.5 20.0 22.5 20.0 22.5 10.0 22.5
SO4 (mM) 0.51 0.182 0.55 0.65 0.55 0.66 0.2 0.1 0.9 1.0 0.9 0.6
CO2 (% v/v)
6.0 6.0 3.5 4.5 5.0 6.0 5.0 4.4 5.0 4.0
Predicted
response
0.87 g L-1
d-1
1.66 g L-1
55% of DW 52% of DW 65% of DW 37 µg mL-1
20 µg mL-1
Measured
response
0.87 g L-1
d-1
0.86 ± 0.06
g L-1
d-1
1.57 g L-1
1.26 ± 0.01
g L-1
42% of DW
52 ± 3
% of DW
64 ± 2
% of DW
5.5 ±0.5
µg mL-1

103
Table 2. Significant (p < 0.05) Pearson correlation coefficients between the different parameters
measured in the first series of experiments (of the complete data set with 25 treatments) at 67 h of
growth (a) and at 96 h of growth (b). Significance levels: ^, p < 0.05; *, p < 0.01; **, p < 0.001.
a
pH
Productivity
(g L-1
d-1
)
DW
(g L-1
)
Starch
(% of DW)
Protein
(% of DW)
Total
chlorophyll
(µg mL-1
)
pH 0.499** -0.681**
Productivity (g L
-1 d
-1) 0.499**
0.966**
-0.301^
DW (g L-1
) -0.681** 0.966**
-0.346*
Starch (% of DW)
-0.542** -0.664**
Protein (% of DW)
-0.542**
0.594**
Total chlorophyll (µg mL-1
) -0.301^ -0.346* -0.664** 0.594**
b
pH
Productivity
(g L-1
d-1
)
DW
(g L-1
)
Starch
(% of DW)
Protein
(% of DW)
Total
chlorophyll
(µg mL-1
)
pH
-0.556** 0.612** -0.556** -0.575**
Productivity (g L-1
d-1
)
0.349*
DW (g L-1
) -0.556** 0.349* -0.499** 0.513** 0.672**
Starch (% of DW) 0.612** -0.499** -0.899** -0.852**
Protein (% of DW) -0.556** 0.513** -0.899** 0.813**
Total chlorophyll (µg mL-1
) -0.575** 0.672** -0.852** 0.813**
104
Table 3. Summary of the results of the second series of experiments (Paper III). Levels of light
intensity, temperature, and CO2 concentration that yielded the maximum responses of
productivity, biomass yield, as well as the maximum contents of starch, protein, and chlorophyll.
Max.
productivity
Max.
biomass
Max. starch Max.
protein
Max.
chlorophyll
Light intensity (µmol m-2
s-1
) 400 400 400 400 100
Temperature (°C) 35 35 25 25 25
CO2 concentration (% v/v) 9 9 3 9 9
Response 1.12 g L-1
d-1
1.335 g L-1
10.8% of DW 43% of DW 3.9% of DW
Table 4. Significant (p < 0.05) Pearson correlation coefficients between the different parameters
measured in the second series of experiments at the first sampling time (a) and the second
sampling time (b). Significance levels: ^, p < 0.05; *, p < 0.01; **, p < 0.001
a
pH
Productivity
(g L-1
d-1
)
DW
(g L-1
)
Starch
(% of DW)
Protein
(% of DW)
Total
chlorophyll
(% of DW)
pH
-0.550*
Productivity (g L
-1 d
-1)
0.499^ 0.641* 0.643* -0.793**
DW (g L-1
) -0.793** 0.499^
0.556*
Starch (% of DW) 0.641* 0.556*
Protein (% of DW) 0.643*
-0.564*
Total chlorophyll (% of DW) -0.793**
-0.564*
b
pH
Productivity
(g L-1
d-1
)
DW
(g L-1
)
Starch
(% of DW)
Protein
(% of DW)
Total
chlorophyll
(% of DW)
pH
0.693**
Productivity (g L-1
d-1
)
0.532^
0.743** -0.692**
DW (g L-1
) -0.616* 0.532^
0.493^
Starch (% of DW)
Protein (% of DW) 0.743** 0.493^
-0.769**
Total chlorophyll (% of DW) 0.693** -0.692**
-0.769**

105
Table 5. Summary of the results of the third series of experiments (Paper IV). Maximum
responses of productivity, biomass yield, and the maximum contents of starch, protein, and
chlorophyll measured in treatments with different concentrations of calcium and magnesium.
Calcium - Magnesium
concentrations
(mM)
Maximum
productivity
(g L-1
d-1
)
Maximum
biomass
(g L-1
)
Maximum
starch content
(% of DW)
Maximum
protein content
(% of DW)
Maximum
chlorophyll
concentration
(µg mL-1
)
0.068 Ca - 0.081 Mg 1.16 2.28 33.2 42.0 39.3
0.17 Ca - 0.203 Mg 1.34 2.59 23.5 38.2 55.4
0.34 Ca - 0.405 Mg 1.73 3.53 26.7 37.0 62.5
0.68 Ca - 0.81 Mg 1.97 4.83 32.3 40.5 78.6

106
9. Concluding remarks and future perspectives
This work presents the first step in the direction of obtaining an optimized medium for the
growth of C. reinhardtii. We described how the different initial concentrations of nutrients in
batch cultures, as well as light intensity, in the range of 100 – 400 µmol m-2
s-1
, and temperature,
in the range of 25 – 35 °C, influence the biomass production and its composition. The statistical
approach of factorial experimental designs was an efficient method to detect interaction between
the different culture variables. This information is valuable when this microalga is to be
cultivated for different purposes. It is possible to use the results of this study in the design of an
appropriate growth medium and when defining culture conditions for obtaining fast growing and
high biomass cultures or for producing starch, protein, or chlorophyll.
For obtaining C. reinhardtii cultures with high biomass, high protein, and high
chlorophyll contents, we recommend using media with increased concentrations of ammonium,
sulfate, calcium, and magnesium. In such cultures, use of a good pH buffer is encouraged. Media
with low ammonium content are recommended for cultures with high productivity and starch
content. By increasing light intensity (up to 400 µmol m-2
s-1
), temperature (up to 35 °C), CO2
(up to 9% v/v), and calcium (0.68 mM or higher) and magnesium (0.81 mM or higher)
concentrations, the productivity and starch content can be further increased. Usually, two-stage
cultivation strategy is used to obtain cultures with high starch content, with biomass growth
under nutrient-replete conditions and starch accumulation under nutrient deprivation. However,
this study shows that high growth and accumulation of high levels of starch is possible in a single
batch culture, if appropriate growth conditions are defined for obtaining high productivity in the
linear growth phase in a medium that becomes nutrient-limited in the stationary growth phase for
starch accumulation.
These conclusions were made for a certain combination of culture condition, such as type
and geometry of PBR, culture regime, concentrations of nutrients not considered in this study,
and light regime for the strain used in this study. The extrapolation of these recommendations to
other culture conditions and systems is therefore difficult. The optimum culture conditions are
particular for each species and production system. However, the general effects and the type of

107
interactions between the different culture variables detected in this study can be used as a start
point when designing a production system.
The quality of the results obtained in this thesis could have been improved by using a
more advanced PBR, with automatically controlled pH, temperature, light intensity, CO2
concentration and the flow rate of the bubbled gas. However, by not controlling the pH, we could
obtain information on how it is affected by the culture conditions (the pH being a measured
parameter rather than a controlled study variable) and the growth kinetics of the microalgae. This
information could be valuable for establishing a pH control strategy.
More frequent sampling could also improve the results of the thesis, giving the possibility
for establishing models on the effects of culture conditions on the growth kinetics and detailed
variation of the biochemical composition throughout the different growth phases of the cultures.
More frequent analyses of the nutrient composition of the cells and of the growth medium could
permit to determine the growth-limiting cell quotas and concentrations of the different nutrients
in the medium.
It could be useful to extend the ranges of concentrations of the studied nutrients and
increase the concentrations of calcium and magnesium, and probably also of iron and other
elements, in the first two series of experiment to obtain a better overview of their effects and
improved models. Phosphate concentration in the medium could be reduced, by using higher
concentrations of bicarbonate in the medium or by establishing an automatic control of pH. In
this case, the real effects of the phosphate concentration on the growth and biochemical
composition of C. reinhardtii could be evaluated. It also would be interesting to repeat the third
experiment with higher concentrations of calcium, magnesium, ammonium, and sulfate to
determine if even higher biomass yield may be obtained with this microalga.

108
10. References
Åkerström AM, Mortensen LM, Rusten B, Gislerød HR (2014) Biomass production and nutrient removal by
Chlorella sp. as affected by sludge liquor concentration. J Environ Manage 144:118-124 doi:10.1016/j.jenvman.2014
Akkerman I, Janssen M, Rocha J, Wijffels RH (2002) Photobiological hydrogen production: photochemical
efficiency and bioreactor design Int J Hydrogen Energ 27:1195-1208 doi:10.1016/S0360-3199(02)00071-X
Amoroso G, Weber C, Sültemeyer D, Fock H (1996) Intracellular carbonic anhydrase activities in Dunaliella
tertiolecta (Butcher) and Chlamydomonas reinhardtii (Dangeard) in relation to inorganic carbon concentration
during growth: further evidence for the existence of two distinct carbonic anhydrases associated with the
chloroplasts. Planta 199:177-184 doi:10.1007/BF00196557
Andersen RA (ed) (2005) Algal culturing techniques., 1st edn. Elsevier Academic Press, London
Andersen T, Pedersen O (2002) Interactions between light and CO2 enhance the growth of Riccia fluitans.
Hydrobiologia 477:163-170 doi:10.1023/A:1021007124604
Anderson DM, Morel FMM (1978) Copper sensitivity of Gonyaulax tamarensis. Limnol Oceanogr 23:283-295
Anderson MJ, Whitcomb PJ (2000) DOE simplified: practical tools for effective experimentation. Productivity, Inc.,
Portland, Oregon
Arnon DI, Mitsui A, Paneque A (1961) Photoproduction of hydrogen gas coupled with photosynthetic
phosphorylation. Science 134:1425-1425
Azov Y (1982) Effect of pH on inorganic carbon uptake in algal cultures. Appl Environ Microbiol 43:1300-1306
Badger MR, Kaplan A, A. BJ (1977) The internal CO2 pool of Chlamdomonas reinhardtii: response to external CO2.
Carnegie Inst Year Book:362-336
Badger MR, Kaplan A, Berry JA (1980) Internal inorganic carbon pool of Chlamydomonas reinhardtii: Evidence for
a carbon dioxide-concentrating mechanism. Plant Physiol 66:407-413
Bailey JE, Ollis DF (eds) (1986) Biochemical engineering fundamentals. McGraw-Hill, New York
Baker NK, Bowyer JR (eds) (1994) Photoinhibition of photosynthesis: from molecular mechanisms to the field.
BIOS Scientific, Oxford
Ball SG (2005) Eukaryotic microalgae genomics. The essence of being a plant. Plant Physiol 137:397-398
doi:10.1104/pp.104.900136
Ball SG, Dirick L, Decq A, Martiat JC, Matagne RF (1990) Physiology of starch storage in the monocellular alga
Chlamydomonas reinhardtii. Plant Sci 66:1-9
Ball SG, van de Wal MHBJ, Visser RGF (1998) Progress in understanding the biosynthesis of amylose. Trends in
Plant Science 3:462-467
Banse K (1976) Rates of growth, respiration and photosynthesis of unicellular algae as related to cell size - a review.
J Phycol 12:135-140 doi:10.1111/j.1529-8817.1976.tb00490.x
Barbosa MJ, Wijffels RH (2013) Biofuels from microalgae. In: Richmond A, Hu Q (eds) Handbook of microalgal
culture. Applied phycology and biotechnology. 2nd edn. Wiley Blackwell, Chichester, UK, pp 566-577

109
Barsanti L, Gualtieri P (2014) Algae: anatomy, biochemistry and biotechnology., Second edition edn. CRC press,
London
Becker EW (1994) Microalgae biotechnology and microbiology. Cambridge Studies in Biotechnology. Cambridge
University Press, Cambridge
Becker EW (2007) Micro-algae as a source of protein. Biotechnol Adv 25:207-210
doi:10.1016/j.biotechadv.2006.11.002
Beckmann J, Lehr F, Finazzi G, Hankamer B, Posten C, Wobbe L, Kruse O (2009) Improvement of light to biomass
conversion by de-regulation of light-harvesting protein translation in Chlamydomonas reinhardtii. J Biotechnol
142:70-77 doi:10.1016/j.jbiotec.2009.02.015
Benemann JR (2000) Hydrogen production by microalgae. J Appl Phycol 12:291-300
doi:10.1023/A:1008175112704
Berges JA, Varela DE, Harrison PJ (2002) Effects of temperature on growth rate, cell composition and nitrogen
metabolism in the marine diatom Thalassiosira pseudonana (Bacillariophyceae). Mar Ecol Prog Ser 225:139-146
doi:10.3354/Meps225139
Berman-Frank I, Dubinsky Z (1999) Balanced growth in aquatic plants: Myth or reality? Phytoplankton use the
imbalance between carbon assimilation and biomass production to their strategic advantage. Bioscience 49:29-37
doi:10.2307/1313491
Berry J, Boynton J, Kaplan A, Badger M (1976) Growth and photosynthesis of Chlamydomonas reinhardtii as a
function of CO2 concentration. Carnegie Inst Wash Year Book 75:423-432
Beyerinck MW (1890) Kulturversuche mit Zoochlorellem, Lichenengonidien und anderen niederen Algen.
Botanische Zeitung 45-47:726-786
Bick JA, Leustek T (1998) Plant sulfur metabolism - the reduction of sulfate to sulfite. Curr Opin Plant Biol 1:240-
244
Bonente G, Pippa S, Castellano S, Bassi R, Ballottari M (2012) Acclimation of Chlamydomonas reinhardtii to
different growth irradiances. JBiol Chem 287:5833-5847 doi:10.1074/jbc.M111.304279
Borowitzka LJ, Borowitzka MA (1990) Commercial production of ß-carotene by Dunaliella salina in open ponds. B
Mar Sci 47:244-252
Borowitzka MA (1988) Fats, oils and carbohydrates. In: Borowitzka MA, Borowitzka LJ (eds) Microalgal
biotechnology. Cambridge University Press, Cambridge, pp 257-287
Borowitzka MA (2013) Energy from microalgae: a short history. In: Borowitzka MA, Moheimani NR (eds) Algae
for biofuels and energy., vol 5. Developments in applied phycology. Springer Netherlands, Dordrecht, pp 1-15
Borowitzka MA, Moheimani NR (eds) (2013) Algae for biofuels and energy. vol 5. Developments in applied
phycology. Springer Netherlands, Dordrecht
Boussac A, Zimmermann JL, Rutherford AW (1989) EPR signals from modified charge accumulation states of the
oxygen-evolving enzyme in calcium-deficient photosystem II. Biochemistry 28:8984-8989 doi:10.1021/bi00449a005
Branyikova I, Marsalkova B, Doucha J, Branyik T, Bisova K, Zachleder V, Vitova M (2010) Microalgae - novel
highly efficient starch producers. Biotechnol Bioeng 108:766-776
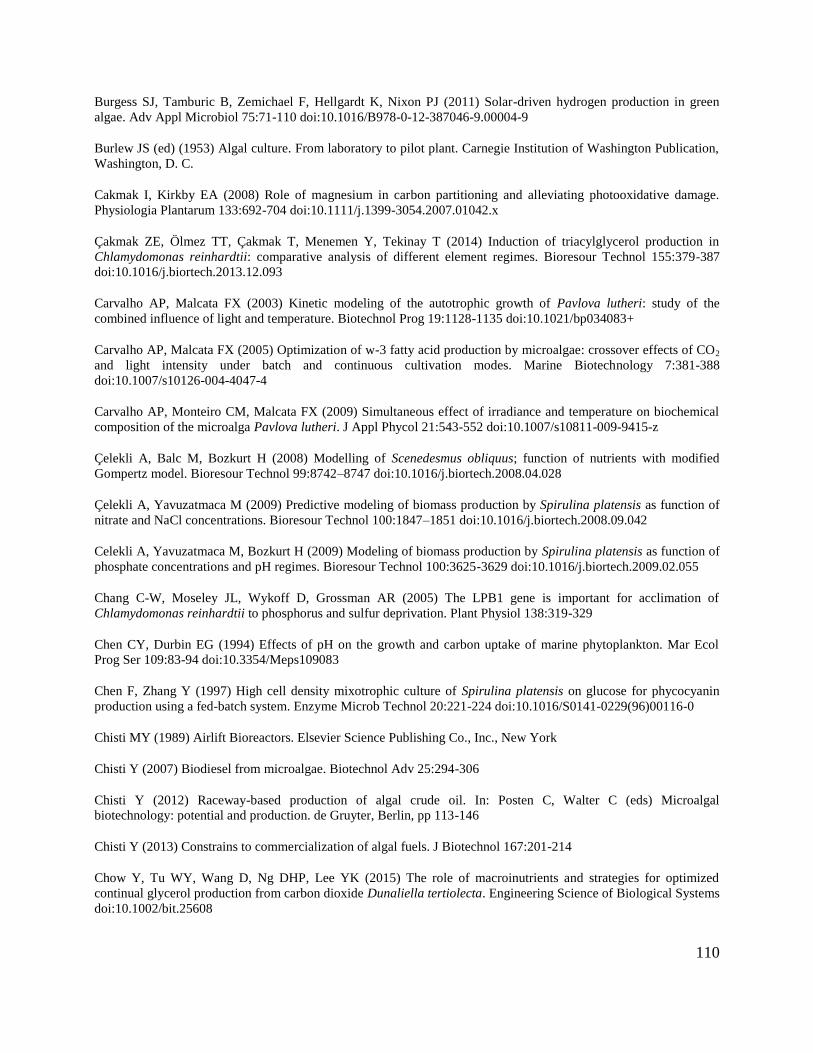
110
Burgess SJ, Tamburic B, Zemichael F, Hellgardt K, Nixon PJ (2011) Solar-driven hydrogen production in green
algae. Adv Appl Microbiol 75:71-110 doi:10.1016/B978-0-12-387046-9.00004-9
Burlew JS (ed) (1953) Algal culture. From laboratory to pilot plant. Carnegie Institution of Washington Publication,
Washington, D. C.
Cakmak I, Kirkby EA (2008) Role of magnesium in carbon partitioning and alleviating photooxidative damage.
Physiologia Plantarum 133:692-704 doi:10.1111/j.1399-3054.2007.01042.x
Çakmak ZE, Ölmez TT, Çakmak T, Menemen Y, Tekinay T (2014) Induction of triacylglycerol production in
Chlamydomonas reinhardtii: comparative analysis of different element regimes. Bioresour Technol 155:379-387
doi:10.1016/j.biortech.2013.12.093
Carvalho AP, Malcata FX (2003) Kinetic modeling of the autotrophic growth of Pavlova lutheri: study of the
combined influence of light and temperature. Biotechnol Prog 19:1128-1135 doi:10.1021/bp034083+
Carvalho AP, Malcata FX (2005) Optimization of w-3 fatty acid production by microalgae: crossover effects of CO2
and light intensity under batch and continuous cultivation modes. Marine Biotechnology 7:381-388
doi:10.1007/s10126-004-4047-4
Carvalho AP, Monteiro CM, Malcata FX (2009) Simultaneous effect of irradiance and temperature on biochemical
composition of the microalga Pavlova lutheri. J Appl Phycol 21:543-552 doi:10.1007/s10811-009-9415-z
Çelekli A, Balc M, Bozkurt H (2008) Modelling of Scenedesmus obliquus; function of nutrients with modified
Gompertz model. Bioresour Technol 99:8742–8747 doi:10.1016/j.biortech.2008.04.028
Çelekli A, Yavuzatmaca M (2009) Predictive modeling of biomass production by Spirulina platensis as function of
nitrate and NaCl concentrations. Bioresour Technol 100:1847–1851 doi:10.1016/j.biortech.2008.09.042
Celekli A, Yavuzatmaca M, Bozkurt H (2009) Modeling of biomass production by Spirulina platensis as function of
phosphate concentrations and pH regimes. Bioresour Technol 100:3625-3629 doi:10.1016/j.biortech.2009.02.055
Chang C-W, Moseley JL, Wykoff D, Grossman AR (2005) The LPB1 gene is important for acclimation of
Chlamydomonas reinhardtii to phosphorus and sulfur deprivation. Plant Physiol 138:319-329
Chen CY, Durbin EG (1994) Effects of pH on the growth and carbon uptake of marine phytoplankton. Mar Ecol
Prog Ser 109:83-94 doi:10.3354/Meps109083
Chen F, Zhang Y (1997) High cell density mixotrophic culture of Spirulina platensis on glucose for phycocyanin
production using a fed-batch system. Enzyme Microb Technol 20:221-224 doi:10.1016/S0141-0229(96)00116-0
Chisti MY (1989) Airlift Bioreactors. Elsevier Science Publishing Co., Inc., New York
Chisti Y (2007) Biodiesel from microalgae. Biotechnol Adv 25:294-306
Chisti Y (2012) Raceway-based production of algal crude oil. In: Posten C, Walter C (eds) Microalgal
biotechnology: potential and production. de Gruyter, Berlin, pp 113-146
Chisti Y (2013) Constrains to commercialization of algal fuels. J Biotechnol 167:201-214
Chow Y, Tu WY, Wang D, Ng DHP, Lee YK (2015) The role of macroinutrients and strategies for optimized
continual glycerol production from carbon dioxide Dunaliella tertiolecta. Engineering Science of Biological Systems
doi:10.1002/bit.25608

111
Cinco R, Macinnis J, Greenbaum E (1993) The role of carbon dioxide in light-activated hydrogen production by
Chlamydomonas reinhardtii. Photosynth Res 38:27-33
Collier JL, Grossman AR (1992) Chlorosis induced by nutrient deprivation in Synechococcus sp. strain PCC 7942:
not all bleaching is the same. J Bacteriol 174:4718-4726
Conover SAM (1975) Partitioning of nitrogen and carbon in cultures of the marine diatom Thalassiosira fluviatilis
supplied with nitrate, ammonium, or urea. Mar Biol 32:231-246 doi:10.1007/BF00399203
Converti A, Casazza AA, Ortiz EY, Perego P, del Borghi M (2009) Effect of temperature and nitrogen concentration
on the growth and lipid content of Nannochloropsis oculata and Chlorella vulgaris for biodiesel production.
Chemical Engineering and Processing: Process Intensification 48:1146-1151 doi:10.1016/j.cep.2009.03.006
Cuhel RL, Ortner PB, Lean DRS (1984) Night synthesis of protein by algae. Limnol Oceanogr 29:731-744
Cullimore JV, Sims AP (1981) Pathway of ammonia assimilation in illuminated and darkened Chlamydomonas
reinhardtii. Phytochemistry 20:933-940 doi:10.1016/0031-9422(81)83002-6
Dangeard MP-A (1888) Recherches sur les alges inferieures. Annales des sciences naturelles 7:105-175
Darley WM (1982) Algal biology: a physiological approach. vol 9. Blackwell, Oxford
Davies J, Yildiz F, Grossman AR (1996) Sac1, a putative regulator that is critical for survival of Chlamydomonas
reinhardtii during sulfur deprivation. EMBO J 15:2150-2159
Davison IR (1991) Environmental effects on algal photosynthesis - temperature. J Phycol 27:2-8 doi:10.1111/j.0022-
3646.1991.00002.x
Demirbas A (2009) Biorefineries: current activities and future developments. Energ Convers Manage 50:2782–2801
doi:10.1016/j.enconman.2009.06.035
Deng X, Fei X, Li Y (2011) The effects of nutritional restriction on neutral lipid accumulation in Chlamydomonas
and Chlorella. African J Microbiol Res 5:260-270
Dermoun D, Chaumont D, Thebault JM, Dauta A (1992) Modeling of growth of Porphyridium cruentum in
connection with two interdependent factors - light and temperature. Bioresour Technol 42:113-117
doi:10.1016/0960-8524(92)90069-A
Dismukes GC, Carrieri D, Bennette N, Ananyev GM, Posewitz MC (2008) Aquatic phototrophs: efficient
alternatives to land-based crops for biofuels. Current Opinion in Biotechnology 19:235-240
Dortch Q (1982) Effect of growth conditions on accumulation of internal nitrate, ammonium, amino acids, and
protein in three marine diatoms. J Exp Mar Biol Ecol 61:243–264 doi:10.1016/0022-0981(82)90072-7
Doucha J, Straka F, Lívanský K (2005) Utilization of flue gas for cultivation of microalgae (Chlorella sp.) in an
outdoor open thin-layer photobioreactor. J Appl Phycol 17:403-412 doi:10.1007/s10811-005-8701-7
Dragone G, Fernandez BD, Abreu AP, Vicente AA, Teixeira JA (2011) Nutrient limitation as a strategy for
increasing starch accumulation in microalgae. Appl Energ 88:3331-3335 doi:10.1016/j.apenergy.2011.03.012
Droop MR (1968) Vitamin B12 and marine ecology. IV. The kinetics of uptake, growth and inhibition in
Monochrysis lutheri. J Mar Biol Ass U K 48
Droop MR (1973) Some thoughts on nutrient limitation in algae. J Phycol 9:264-272
112
Dubini A, Mus F, Seibert M, Grossman AR, Posewitz MC (2009) Flexibility in anaerobic metabolism as revealed in
a mutant of Chlamydomonas reinhardtii lacking hydrogenase activity. J Biol Chem 284:7201-7213
doi:10.1074/jbc.M803917200
Dubinsky Z, Matsukawa R, Karube I (1995) Photobiological aspects of algal mass culture. J Mar Biotechnol 2:61-65
Dumont F, Loppes R, Kremers P (1990) New polypeptides and in-vitro-translatable mRNAs are produced by
phosphate-starved cells of the unicellular alga Chlamydomonas reinhardtii. Planta 182:610-616
doi:10.1007/BF02341039
Durnford DG, Price JA, Mckim SM, Sarchfield ML (2003) Light-harvesting complex gene expression is controlled
by both transcriptional and post-transcriptional mechanisms during photoacclimation in Chlamydomonas reinhardtii.
Physiol Plant 118:193-205 doi:10.1034/j.1399-3054.2003.00078.x
Eppley RW (1972) Temperature and phytoplankton growth in the sea. Fishery Bull 70:1063-1085
Eppley RW, Sloan PR (1966) Growth rates of marine phytoplankton correlation with light absorption by cell
chlorophyll a. Physiol Plant 19:47-59
Eppley RW, Strickland JDH (1968) Kinetics of marine phytoplankton growth. In: Droop MR, Ferguson Wood EJ
(eds) Advances in microbiology of the sea. Academic Press, San Diego, USA,
Epstein E, Bloom AJ (2004) Mineral nutrition of plants: principles and perspectives., 2nd edn. Sinauer Associates,
Sunderland, MA
Eriksen NT (2008) The technology of microalgal culturing. Biotechnol Lett 30:1525-1536 doi:10-1007/s10529-008-
9740-3
Eriksson M, Villand P, Gardestrom P, Samuelsson G (1998) Induction and regulation of expression of a low-CO2-
induced mitochondrial carbonic anhydrase in Chlamydomonas reinhardtii. Plant Physiol 116:637-641
Ermilova E, Zalutskaya Z, Munnik T, van den Ende H, Gromov B (1998) Calcium in the control of chemotaxis in
Chlamydomonas. Biologia 53:577-581
Evjen ME (2014) Effects of daylight and high light periods on growth and quality of the green microalga
Chlamydomonas reinhardtii., Norwegian University of Life Sciences
Falkowski PG (1980) Light-shade adaptation in marine phytoplankton. In: Falkowski PG (ed) Primary production in
the sea. Plenum press, New York, pp 99-119
Falkowski PG, Owens TG (1980) Light-shade adaptation: two strategies in marine phytoplankton. Plant Physiol
66:592-595
Falkowski PG, Raven JA (eds) (2007) Aquatic photosynthesis. Princeton University Press, New Jersey
Ferrel J, Sarisky-Reed V National algal biofuels technology roadmap. In: Fishman D, Majumdar R, Morello J, Pate
R, Yang J (eds) A technology roadmap resulting from the National Algal Biofuels Workshop, Maryland, 2010. U.S.
Department of Energy, p 140
Field CB, Behrenfeld MJ, Randerson JT, Falkowski P (1998) Primary production of the biosphere: integrating
terrestrial and oceanic components. Science 281:237-240
Finkle BJ, Appleman D (1953a) The effect of magnesium concentration on chlorophyll and catalase development in
Chlorella. Plant Physiol 28:652-663

113
Finkle BJ, Appleman D (1953b) The effect of magnesium concentration on growth of Chlorella. Plant Physiol
28:664-673
Florencio FJ, Vega JM (1983) Utilization of nitrate, nitrite and ammonium by Chlamydomonas reinhardtii. Planta
158:288-293
Fogg G (1956) Photosynthesis and formation of fats in a diatom. Ann Bot 20:265-285
Fogg GE (1959) Nitrogen nutrition and metabolic patterns in algae. Symp Soc Exp Biol 13:106-125
Fogg GE, Thake B (eds) (1987) Algal cultures and phytoplankton ecology., 3rd edn. The University of Wisconsin
press, Madison
Fonseca F, Bowsher CG, Stulen I (1997) Impact of elevated atmospheric CO2 on nitrate reductase transcription and
activity in leaves and roots of Plantago major. Physiologia Plantarum 100:940-948 doi:10.1111/j.1399-
3054.1997.tb00021.x
Fouchard S et al. (2005) Autotrophic and mixotrophic hydrogen photoproduction in sulfur-deprived Chlamydomonas
cells. Appl Environ Microb 71:199-205 doi:10.1128/AEM.71.10.6199-6205.2005
Foy RH (1980) The influence of surface to volume ratio on the growth rates of planktonic blue-green algae. Brit
Phycol J 15:279-289 doi:10.1080/00071618000650281
Franco AR, Cardenas J, Fernandez E (1988) Two different carriers transport both ammonium and methylammonium
in Chlamydomonas reinhardtii. J Biol Chem 263:14039-14043
Fujii S (1994) Effect of Ca2+
on the retention of glycerol and amino acids in Dunaliella tertiolecta. Plant Cell
Environ 17:227-230 doi:10.1111/j.1365-3040.1994.tb00287.x
Fujita RM, Wheeler PA, Edwards RL (1988) Metabolic regulation of ammonia uptake by Ulva rigida (Chlorophyta):
a compartmental analysis of the rate limiting step for uptake. J Phycol 24:560-566
Funke RP, Kovar JL, Weeks DP (1997) Intracellular carbonic anhydrase is essential to photosynthesis in
Chlamydomonas reinhardtii at atmospheric levels of CO2. Demonstration via genomic complementation of the high-
CO2-requiring mutant ca-1. Plant Physiol 114:237-244
Gaffron H (1940) Carbon dioxide reduction with molecular hydrogen in green algae. American Journal of Botany
27:273-283
Gaffron H, Rubin J (1942) Fermentative and photochemical production of hydrogen in algae. J Gen Physiol 26:219-
240
Garcia-Ochoa F, Gomez E (2009) Bioreactor scale-up and oxygen transfer in microbial processes: An overview.
Biotechnol Adv 27:153-176 doi:10.1016/j.biotechadv.2008.10.006
Gardner RD, Lohman E, Gerlach R, Cooksey KE, Peyton BM (2013) Comparison of CO2 and bicarbonate as
inorganic carbon sources for triacylglycerol and starch accumulation in Chlamydomonas reinhardtii. Biotechnol
Bioeng 110:87-96 doi:10.1002/bit.24592
Gauthier DA, Turpin DH (1994) Inorganic phosphate (Pi) enhancement of dark respiration in the Pi-limited green
alga Selenastrum minutum (Interactions between H+/Pi cotransport, the plasmalemma H
+-ATPase, and dark
respiratory carbon flow). Plant Physiol 104:629–637
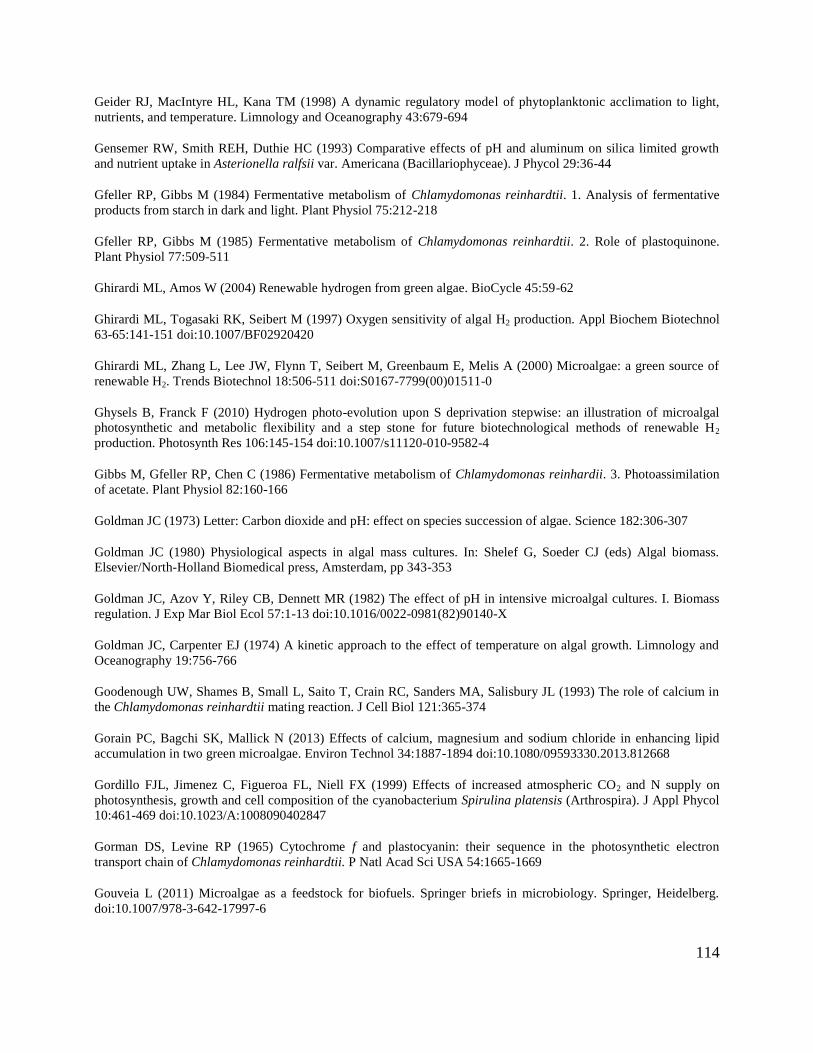
114
Geider RJ, MacIntyre HL, Kana TM (1998) A dynamic regulatory model of phytoplanktonic acclimation to light,
nutrients, and temperature. Limnology and Oceanography 43:679-694
Gensemer RW, Smith REH, Duthie HC (1993) Comparative effects of pH and aluminum on silica limited growth
and nutrient uptake in Asterionella ralfsii var. Americana (Bacillariophyceae). J Phycol 29:36-44
Gfeller RP, Gibbs M (1984) Fermentative metabolism of Chlamydomonas reinhardtii. 1. Analysis of fermentative
products from starch in dark and light. Plant Physiol 75:212-218
Gfeller RP, Gibbs M (1985) Fermentative metabolism of Chlamydomonas reinhardtii. 2. Role of plastoquinone.
Plant Physiol 77:509-511
Ghirardi ML, Amos W (2004) Renewable hydrogen from green algae. BioCycle 45:59-62
Ghirardi ML, Togasaki RK, Seibert M (1997) Oxygen sensitivity of algal H2 production. Appl Biochem Biotechnol
63-65:141-151 doi:10.1007/BF02920420
Ghirardi ML, Zhang L, Lee JW, Flynn T, Seibert M, Greenbaum E, Melis A (2000) Microalgae: a green source of
renewable H2. Trends Biotechnol 18:506-511 doi:S0167-7799(00)01511-0
Ghysels B, Franck F (2010) Hydrogen photo-evolution upon S deprivation stepwise: an illustration of microalgal
photosynthetic and metabolic flexibility and a step stone for future biotechnological methods of renewable H2
production. Photosynth Res 106:145-154 doi:10.1007/s11120-010-9582-4
Gibbs M, Gfeller RP, Chen C (1986) Fermentative metabolism of Chlamydomonas reinhardii. 3. Photoassimilation
of acetate. Plant Physiol 82:160-166
Goldman JC (1973) Letter: Carbon dioxide and pH: effect on species succession of algae. Science 182:306-307
Goldman JC (1980) Physiological aspects in algal mass cultures. In: Shelef G, Soeder CJ (eds) Algal biomass.
Elsevier/North-Holland Biomedical press, Amsterdam, pp 343-353
Goldman JC, Azov Y, Riley CB, Dennett MR (1982) The effect of pH in intensive microalgal cultures. I. Biomass
regulation. J Exp Mar Biol Ecol 57:1-13 doi:10.1016/0022-0981(82)90140-X
Goldman JC, Carpenter EJ (1974) A kinetic approach to the effect of temperature on algal growth. Limnology and
Oceanography 19:756-766
Goodenough UW, Shames B, Small L, Saito T, Crain RC, Sanders MA, Salisbury JL (1993) The role of calcium in
the Chlamydomonas reinhardtii mating reaction. J Cell Biol 121:365-374
Gorain PC, Bagchi SK, Mallick N (2013) Effects of calcium, magnesium and sodium chloride in enhancing lipid
accumulation in two green microalgae. Environ Technol 34:1887-1894 doi:10.1080/09593330.2013.812668
Gordillo FJL, Jimenez C, Figueroa FL, Niell FX (1999) Effects of increased atmospheric CO2 and N supply on
photosynthesis, growth and cell composition of the cyanobacterium Spirulina platensis (Arthrospira). J Appl Phycol
10:461-469 doi:10.1023/A:1008090402847
Gorman DS, Levine RP (1965) Cytochrome f and plastocyanin: their sequence in the photosynthetic electron
transport chain of Chlamydomonas reinhardtii. P Natl Acad Sci USA 54:1665-1669
Gouveia L (2011) Microalgae as a feedstock for biofuels. Springer briefs in microbiology. Springer, Heidelberg.
doi:10.1007/978-3-642-17997-6
115
Grobbelaar JU (1991) The influence of light/dark cycles in mixed algal cultures on their productivity. Bioresource
Technol 38:189-194 doi:10.1016/0960-8524(91)90153-B
Grossman A (2000) Acclimation of Chlamydomonas reinhardtii to its nutrient environment. Protist 151:201-224
doi:10.1078/1434-4610-00020
Grossman A, Takahashi H (2001) Macronutrient utilization by photosynthetic eukaryotes and the fabric of
interactions. Annu Rev Plant Phys 52:163-210 doi:10.1146/annurev.arplant.52.1.163
Guschina IA, Harwood JL (2013) Algal lipids and their metabolism. In: Borowitzka MA, Moheimani NR (eds)
Algae for biofuels and energy., vol 5. Developments in applied phycology. Springer Netherlands, Dordrecht, pp 17-
36
Hahn JJ, Ghirardi ML, Jacoby WA (2004) Effect of process variables on photosynthetic algal hydrogen production.
Biotechnol Progr 20:989-991 doi:10.1021/bp03341287
Haik Y, Selim MYE, Abdulrehman T (2011) Combustion of algae oil methyl ester in an indirect injection diesel
engine. Energy 36:1827-1835
Happe T, Kaminski A (2002) Differential regulation of the Fe-hydrogenase during anaerobic adaptation in the green
alga Chlamydomonas reinhardtii. Eur J Biochem 269:1022-1032
Happe T, Mosler B, Naber JD (1994) Induction, localization and metal content of hydrogenase in the green alga
Chlamydomonas reinhardtii. Eur J Biochem 222:769-774
Happe T, Naber JD (1993) Isolation, characterization and N-terminal amino acid sequence of hydrogenase from the
green alga Chlamydomonas reinhardtii. Eur J Biochem 214:475-481
Harder R, von Witsch H (1942) Bericht über Versuche zur Fettsynthese mittels autotropher Mikroorganismen.
Forschungsdienst Sonderheft 16:270-275
Harris EH (1989) The Chlamydomonas sourcebook: a comprehensive guide to biology and laboratory use., 1st edn.
Academic Press, Inc., San Diego
Harris EH (2001) Chlamydomonas as a model organism. Annu Rev Plant Phys 52:363-406
Harris EH (2009) The Chlamydomonas sourcebook. Introduction to Chlamydomonas and its laboratory use. vol 1.
2nd edn. Elseiver Inc, Oxford
Harris GP (1986) Phytoplankton ecology: structure, function and fluctuation. . Chapman and Hall, New York
Harz H, Hegemann P (1991) Rhodopsin-regulated calcium currents in Chlamydomonas. Nature 351:489-491
Healey FP (1982) Phosphate. In: Carr NG, Whitton BA (eds) The biology of cyanobacteria. Blackwell Scientific,
Oxford, pp 105-124
Healey FP, Hendzel LL (1979) Indicators of phosphorus and nitrogen deficiency in five algae in culture. Journal of
the Fisheries Research Board of Canada 36:1364-1369 doi:10.1139/f79-195
Healey FP, Stewart WPD (1973) Inorganic nutrient uptake and deficiency in algae. C R C Critical reviews in
microbiology 3:69-113 doi:10.3109/10408417309108746
116
Heifetz PB, Forster B, Osmond CB, Giles LJ, Boynton JE (2000) Effects of acetate on facultative autotrophy in
Chlamydomonas reinhardtii assessed by photosynthetic measurements and stable isotope analyses. Plant Physiol
122:1439-1445
Hempel F et al. (2011) Microalgae as bioreactors for bioplastic production. Microbial Cell Factories 10
doi:10.1186/1475-2859-10-81
Hemschemeier A, Fouchard S, Cournac L, Peltier G, Happe T (2008) Hydrogen production by Chlamydomonas
reinhardtii: an elaborate interplay of electron sources and sinks. Planta 227:397-407 doi:10.1007/s00425-007-0626-8
Hermann C, Dewes I, Shumpe A (1995) The estimation of gas solubilities in salt solutions. Chem Eng Sci 50:1673-
1675
Hicks GR, Hironaka CM, Dauvillee D, Funke RP, D'Hulst C, Waffenschmidt S, Ball SG (2001) When simpler is
better. Unicellular green algae for discovering new genes and functions in carbohydrate metabolism. Plant Physiol
127:1334-1338
Hinshelwood CN (1946) The chemical kinetics of the bacteria cell. Oxdord University Press, London
Hirano A, Ueda R, Hirayama S, Ogushi Y (1997) CO2 fixation and ethanol production with microalgal
photosynthesis and intracellular anaerobic fermentation. Energy 22:137-142 doi:10.1016/S0360-5442(96)00123-5
Holm-Hansen O, Nishida K, Moses V, Calvin M (1959) Effects of mineral salts on short-term incorporation of
carbon dioxide in Chlorella. J Exp Bot 10:109-124 doi:10.1093/jxb/10.1.109
Hope AB, Walker NA (1975) The physiology of giant algal cells. Cambridge University Press, London
Hu Q (2004) Environmental effects on cell composition. In: Richmond A (ed) Microalgal culture. Biotechnology and
applied phycology. Blackwell Science Ltd., Oxford, UK., pp 83-93
Hu Q, Sommerfeld M, Jarvis E, Ghirardi M, Posewitz M, Seibert M, Darzins A (2008) Microalgal triacylglycerols as
feedstocks for biofuel production: perspectives and advances. Plant J 54:621-639 doi:10.1111/j.1365-
313X.2008.03492.x
Huntsman SA, Barber RT (1975) Modification of phytoplankton growth by excreted compunds in low-density
populations. J Phycol 11:10-13 doi:10.1111/j.1529-8817.1975.tb02745.x
Huppe HC, Turpin DH (1994) Integration of carbon and nitrogen metabolism in plant and algal cells. Ann Rev Plant
Physiol Plant Moll Biol 45:577-607 doi:10.1146/annurev.pp.45.060194.003045
Hutner SH et al. (1957) Growing Ochromonas malhamensis above 35°C. J Eukaryot Microbiol 4:259-269
doi:10.1111/j.1550-7408.1957.tb02518.x
IEA (2013) http://www.worldenergyoutlook.org/. International Energy Agency.
Imam SH, Buchanan MJ, Shin HC, Snell WJ (1985) The Chlamydomonas cell wall: characterization of the wall
framework J Cell Biol 101:1599-1607
Jeong ML, Gillis JM, Hwang J-Y (2003) Carbon dioxide mitigation by microalgal photosynthesis. Bull Korean
Chem Soc 24:1763-1766 doi:10.5012/bkcs.2003.24.12.1763
Jeong SE, Park JK, Kim JD, Chang IJ, Hong SJ, Kang SH, Lee CG (2008) Statistical optimization of the growth
factors for Chaetoceros neogracile using fractional factorial design and central composite design. J Microbiol
Biotechnol 18:1919-1926

117
Ji C-F, Yu X-J, Chen Z-A, Xue S, Legrand J, Zhang W (2011) Effects of nutrient deprivation on biochemical
compositions and photo-hydrogen production of Tetraselmis subcordiformis. Int J Hydrogen Energ 36:5817-5821
doi:10.1016/j.ijhydene.2010.12.138
Jo JH, Lee DS, Park JM (2006) Modeling and optimization of photosynthetic hydrogen gas production by green alga
Chlamydomonas reinhardtii in sulfur-deprived circumstance. Biotechnol Prog 22:431-437 doi:10.1021/bp050258z
John RP, Anisha GS, Nampoothiri KM, Pandey A (2011) Micro and macroalgal biomass: a renewable source for
bioethanol. Bioresour Technol 102:186-193 doi:10.1016/j.biortech.2010.06.139
Jørgensen EG (1956) Growth inhibiting substances formed by algae. Physiol Plant 9:712-726 doi:10.1111/j.1399-
3054.1956.tb07833.x
Juneja A, Ceballos RM, Murthy GS (2013) Effects of environmental factors and nutrient availability on the
biochemical composition of algae for biofuels production: a review. Energies 6:4607-4638 doi:10.3390/en6094607
Kadic E (2010) Survey of gas-liquid mass transfer in bioreactors., Iowa State University
Kamiya R, Witman GB (1984) Submicromolar levels of calcium control the balance of beating between the 2
flagella in demembranated models of Chlamydomonas. J Cell Biol 98:97-107
Kapic A (2005) Mass transfer measurements for syngas fermentation., Iowa State University
Keffer JE, Kleinheinz GT (2002) Use of Chlorella vulgaris for CO2 mitigation in a photobioreactor. J Ind Microbiol
Biotechnol 29:275-280 doi:10.1038/sj.jim.7000313
Kerby NW, Evans LV (1978) Isolation and partial characterization of pyrenoids from the brown alga Pilayella
littoralis (L.) Kjellm. Planta 142:91-95 doi:10.1007/BF00385125
Kilham S, Kreeger D, Goulden C, Lynn S (1997) Effects of nutrient limitation on biochemical constituents of
Ankistrodesmus falcatus. Freshwater biology 38:591-596 doi:10.1046/j.1365-2427.1997.00231.x
Klausmeier CA, Litchman E, Daufresne T, Levin SA (2008) Pjytoplankton stoichiometry. Ecol Res 23:479-485
Klein U (1987) Intracellular carbon partitioning in Chlamydomonas reinhardtii. Plant Physiol 85:892-897
Klok AJ, Martens DE, Wijffels RH, Lamers PP (2013) Simultaneous growth and neutral lipid accumulation in
microalgae. Bioresour Technol 134:233-243 doi:10.1016/j.biortech.2013.02.006
Knutsen G, Amundsen M, Pettersen R (2012) Is annual metabolic cycling in the unicellular microalgae Chlorella
and Isochrysis coupled to the annual Earth gravity cycle? Astronomical and Astophysical Transactions 27:607-618
Kolber Z, Zehr J, Falkowski P (1988) Effects of growth irradiance and nitrogen limitation on photosynthetic energy
conversion in photosystem II. Plant Physiol 88:923-929
Konopka A, Brock TD (1978) Effect of temperature on blue-green algae (cyanobacteria) in lake Mendota. Appl
Environ Microbiol 36:572-576
Kosourov S, Seibert M, Ghirardi ML (2003) Effects of extracellular pH on the metabolic pathways in sulfur-
deprived, H2-producing Chlamydomonas reinhardtii cultures. Plant Cell Physiol 44:146-155
Krauss RW (1953) Inorganic nutrition of algae. In: Burlew JS (ed) Algal cultures from laboratory to pilot plant.
Carnegie Institution of Washington, Washington D.C. , pp 85-102
118
Krieger A, Weis E, Demeter S (1993) Low-pH-induced Ca2+
ion release in the water-splitting system is accompanied
by a shift in the midpoint redox potential of the primary quinone acceptor QA. BBA-Bioenergetics 1144:411-418
doi:10.1016/0005-2728(93)90128-3
Kruse O, Rupprecht J, Bader KP, Thomas-Hall S, Schenk PM, Finazzi G, Hankamer B (2005) Improved
photobiological H2 production in engineered green algal cells. J Biol Chem 280:34170-34177
doi:10.1074/jbc.M503840200
Lam HM, Coschigano KT, Oliveira IC, Melo-Oliveira R, Coruzzi GM (1996) The molecular genetics of nitrogen
assimilation into amino acids in higher plants. Annu Rev Plant Phys 47:569-593
doi:10.1146/annurev.arplant.47.1.569
Larkum A, Douglas S, Raven JA (eds) (2003) Photosynthesis in algae. vol 14. Advances in photosynthesis and
respiration. Springer Netherlands, New York. doi:10.1007/978-94-007-1038-2
Larkum AWD (2010) Limitations and prospects of natural photosynthesis for bioenergy production. Current Opinion
in Biotechnology 21:271-276
Larsson M, Larsson CM, Guerrero MG (1985) Photosynthetic nitrogen metabolism in high and low CO2-adapted
Scenedesmus: I. Inorganic carbon-dependent O2 evolution, nitrate utilization and nitrogen recycling. J Exp Bot
36:1373-1386 doi:10.1093/jxb/36.9.1373
Lehr F, Morweiser M, Rosello Sastre R, Kruse O, Posten C (2012) Process development for hydrogen production
with Chlamydomonas reinhardtii based on growth and product formation kinetics. J Biotechnol 162:89-96
doi:10.1016/j.jbiotec.2012.06.002
Leustek T, Saito K (1999) Sulfate transport and assimilation in plants. Plant Physiol 120:637-643
doi:10.1104/Pp.120.3.637
Levi C, Gibbs M (1984) Starch degradation in synchronously grown Chlamydomonas reinhardtii and
characterization of the amylase. Plant Physiol 74:459-463 doi:10.1104/Pp.74.3.459
Ley AC (1980) The distribution of absorbed light energy for algal photosynthesis. In: Falkowski PG (ed) Primary
productivity in the sea. Plenum press, New York, p 531
Li WKW (1980) Temperature adaptation in phytoplankton: cellular and photosynthetic characteristics. In: Falkowski
PG (ed) Primary productivity in the sea. Plenum press, New York, pp 259-279
Li Y, Horsman M, Wang B, Wu N, Lan CQ (2008) Effects of nitrogen sources on cell growth and lipid accumulation
of green alga Neochloris oleoabundans. Appl Microbiol Biotechnol 81:629-636 doi:10.1007/s00253-008-1681-1
Liebig J (1870) Chemistry and its application to agriculture and physiology. Taylor & Walton, London
Lien T, Knutsen G (1979) Synchronous growth of Chlamydomonas reinhardtii (Chlorophyceae): a review of optimal
conditions. J Phycol 15:191-200 doi:10.1111/j.1529-8817.1979.tb02984.x
Linek V, Vacek V (1981) Volumetric mass transfer coefficient in stirred reactors. Chem Eng Technol 11:249-251
Lotka AJ (1956) Elements of mathematical biology. Dover, New York
Lowry OH, Rosebrough NJ, Farr AL, Randall RJ (1951) Protein measurement with the Folin phenol reagent. J Biol
Chem 193:265-275

119
Lynn SG, Kilham SS, Kreeger DA, Interlandi SJ (2000) Effect of nutrient availability on the biochemical and
elemental stoichiometry in the freshwater diatom Stephanodiscus minutulus (Baxillariophyceae). J Phycol 36:510-
522 doi:10.1046/j.1529-8817.2000.98251.x
Maddux WS, Jones RF (1964) Some interactions of temperature, light intensity, and nutrient concentration during
the continuous culture of Nitzschia closterium and tetraselmis sp. Limnol Oceanogr 9:79-86
doi:10.4319/lo.1964.9.1.0079
Marques AE, Miranda JR, Batista AP, Gouveia L (2012) Microalgae biotechnological applications: nutrition, health
and environment. In: Johansen MN (ed) Microalgae. Biotechnology, microbiology and energy. Nova Science
Publishers, Inc. , New York, pp 1-60
Marschner H (1995) Mineral nutrition of higher plants., 2nd edn. Academic Press, San Diego, CA
Marschner H, Cakmak I (1989) High light intensity enhances chlorosis and necrosis in leaves of zinc, potassium, and
magnesium deficient bean (Phaseolus vulgaris L.) plants. J Plant Physiol 134:308-315
Mata TM, Martins AA, Caetano NS (2010) Microalgae for biodiesel production and other applications: A review.
Renew Sust Energ Rev 14:217-232 doi:10.1016/j.rser.2009.07.020
Matsuda Y, Colman B (1995) Characterization of sulfate transport in green alga Chlorella ellipsoidea. Plant Cell
Physiol 36:1291-1296
McCarthy JJ (1980) The kinetics of nutrient utilization. Can Bull Fish Aquat Sci 210:211-233
McCready RM, Guggolz J, Silviera V, Owens HS (1950) Determination of starch and amylose in vegetables.
Application to peas. Anal Chem 22:1156-1158
Melis A (2002) Green alga hydrogen production: progress, challenges and prospects. Int J Hydrogen Energ 27:1217-
1228 doi:S0360-3199(02)00110-6
Melis A, Neidhardt J, Benemann JR (1998) Dunaliella salina (Chlorophyta) with small chlorophyll antenna sizes
exhibit higher photosynthetic productivities and photon use efficiencies than normally pigmented cells. J Appl
Phycol 10:515-525 doi:10.1023/A:1008076231267
Melis A, Zhang LP, Forestier M, Ghirardi ML, Seibert M (2000) Sustained photobiological hydrogen gas production
upon reversible inactivation of oxygen evolution in the green alga Chlamydomonas reinhardtii. Plant Physiol
122:127-135
Merchant SS et al. (2007) The Chlamydomonas genome reveals the evolution of key animal and plant functions.
Science 318:245-250 doi:10.1126/science.1143609
Miller JD, Fogg GE (1957) Studies on the growth of Xanthophyceae in pure culture. I. The mineral nutrition of
Monodus subterraneus Petersen. Arch Mikrobiol 28:1-17
Mitchell D (2008) A note on rising food prices. . The World Bank, Washington
Monod J (1949) The growth of bacterial cultures. Annu Rev Microbiol 3:371-394
Montgomery DC (2009) Design and analysis of experiments., 7th edn. John Wiley & sons, Inc.,
Moo-Young M, Blanch HW (1981) Design of biochemical reactors mass transfer criteria for simple and complex
systems. Adv Biochem Eng 19:1-69

120
Morel FMM (1987) Kinetics of uptake and growth in phytoplankton. J Phycol 23:137-150
Morgan KC, Kalff J (1979) Effect of light and temperature interactions on growth of Cryptomonas erosa
(Cryptophyceae). J Phycol 15:127-134
Morita RY (1975) Psychrophilic bacteria. Bacteriol Rev 39:144-167
Moroney JV, Tolbert NE (1985) Inorganic carbon uptake by Chlamydomonas reinhardtii. Plant Physiol 77:253-260
Moroney JV, Ynalvez RA (2007) Proposed carbon dioxide concentrating mechanism in Chlamydomonas reinhardtii.
Eukaryotic Cell 6:1251-1259 doi:10.1128/EC.00064-07
Morris I, Glover HE, Yentsch CS (1974) Products of photosynthesis by marine phytoplankton - Effect of
environmental factors on relative rates of protein synthesis. Mar Biol 27:1-9 doi:10.1007/Bf00394754
Morris I, Yentsch CM, Yentsch CS (1971) The physiological state with respect to nitrogen of phytoplankton from
low-nutrient subtropical water as measured by the effect of ammonium ion on dark carbon dioxide fixation.
Limnology and Oceanography 16:859-868
Mortensen LM, Gislerød HR (2014) The effect on growth of Chlamydomonas reinhardtii of flue gas from a power
plant based on waste combustion. A M B Express 4:49 doi:10.1186/s13568-014-0049-4
Mortensen LM, Gislerød HR (2015) The growth of Chlamydomonas reinhardtii as influenced by high CO2 and low
O2 in flue gas from a silicomanganese smelter. J Appl Phycol 27:633-638 doi:10.1007/s10811-014-0357-8
Nedwell DB (1999) Effect of low temperature on microbial growth: lowered affnity for substrates limits growth at
low temperature. FEMS Microbiology Ecology 30:101-111
Nguyen MT, Choi SP, Lee J, Lee JH, Sim SJ (2009) Hydrothermal acid pretreatment of Chlamydomonas reinhardtii
biomass for ethanol production. J Microbiol Biotechnol 19:161-166 doi:10.4014/jmb.0810.578
Nichols GL, Shehata SAM, Syrett PJ (1978) Nitrate reductase deficient mutants of Chlamydomonas reinhardtii.
Biochemical characteristics. J Gen Microbiol 108:79-88
Noth J, Krawietz D, Hemschemeier A, Happe T (2013) Pyruvate-ferredoxin oxidoreductase is coupled to light-
independent hydrogen production in Chlamydomonas reinhardtii. Journal of Biological Chemistry 288:4368-4377
doi:10.1074/jbc.M112.429985
Ogbonna JC, Yada H, Tanaka H (1995a) Effect of cell movement by random mixing between the surface and bottom
of photobioreactors on algal productivity. J Ferment Bioeng 72:152-157 doi:10.1016/0922-338X(95)94083-4
Ogbonna JC, Yada H, Tanaka H (1995b) Kinetic study on light-limited batch cultivation of photosynthetic cells.
Journal of Fermentation and Bioengineering 80:259-264 doi:10.1016/0922-338x(95)90826-L
Oh-Hama T, Miyachi S (1988) Chlorella. In: Borowitzka MA, Borowitzka LJ (eds) Micro-algal biotechnology.
Cambridge University Press. , Cambridge, pp 3-26
Ohresser M, Matagne RF, Loppes R (1997) Expression of the arylsulphatase reporter gene under the control of the
nit1 promoter in Chlamydomonas reinhardtii. Curr Genet 31:264-271
Parker MS, Armbrust EV (2005) Synergistic effects of light, temperature, and nitrogen source on transcription of
genes for carbon and nitrogen metabolism in the centric diatom Thalassiosira pseudonana (Bacillariophyceae). J
Phycol 41:1142-1153 doi:10.1111/j.1529-8817.2005.00139.x
121
Pearson ES, Hartley HO (1966) Biometrika tables for statisticians vol 1. 3rd edn. Cambridge University Press,
Cambridge
Peltier G, Schmidt GW (1991) Chlororespiration: an adaptation to nitrogen deficiency in Chlamydomonas
reinhardtii. Proc Natl Acad Sci USA 88:4791–4795
Perner-Nochta I, Posten C (2007) Simulations of light intensity variation in photobioreactors. J Biotechnol 131:276-
285 doi:10.1016/j.jbiotec.2007.05.024
Peters JW, Boyd ES, D'Adamo S, Mulder DW, Therien J, Posewitz MC (2013) Hydrogenases, nitrogenases, anoxia,
and H2 production in water-oxidizing phototrophs. In: Borowitzka MA, Moheimani NR (eds) Algae for biofuels and
energy., vol 5. Developments in applied phycology. Springer Netherlands, Dordrecht, pp 37-76
Philipps G, Happe T, Hemschemeier A (2012) Nitrogen deprivation results in photosynthetic hydrogen production in
Chlamydomonas reinhardtii. Planta 235:729-745 doi:10.1007/s00425-011-1537-2
Polle JEW, Kanakagiri S, Jin E, Masuda T, Melis A (2002) Truncated chlorophyll antenna size of the photosystems -
a practical method to improve microalgal productivity and hydrogen production in mass culture. Int J Hydrogen
Energ 27:1257-1264 doi:S0360-3199(02)00116-7
Posewitz MC, Smolinski SL, Kanakagiri S, Melis A, Seibert M, Ghirardi ML (2004) Hydrogen photoproduction is
attenuated by disruption of an isoamylase gene in Chlamydomonas reinhardtii. Plant Cell 16:2151-2163
doi:10.1105/tpc.104.021972
Pröschold T, Harris EH, Coleman AW (2005) Portrait of a species: Chlamydomonas reinhardtii. Genetics 170:1601-
1610 doi:10.1534/genetics.105.044503
Quarmby LM, Hartzell HC (1994) Two distinct, calcium-mediated, signal transduction pathways can trigger
deflagellation in Chlamydomonas reinhardtii. J Cell Biol 124:807-815
Quisel JD, Wykoff DD, Grossman AR (1996) Biochemical characterization of the extracellular phosphatases
produced by phosphorus-deprived Chlamydomonas reinhardtii. Plant Physiol 111:839-848
Raven JA (1980) Chloroplasts of eukaryotic micro-otganisms. In: Gooday GW, Lloyd D, Trinci APJ (eds) The
eukaryotic microbial cell. Cambridge University Press, Cambridge, p 439
Raven JA (1984) Energetics and transport in aquatic plants. Wiley-Liss, New York
Raven JA, Geider RJ (1988) Temperature and algal growth. New Phytol 110:441-461
Renaud SM, Thinh L-V, Lambrinidis G, Parry DL (2002) Effect of temperature on growth, chemical composition
and fatty acid composition of tropical Australian microalgae grown in batch cultures. Aquaculture 211:195–214
doi:10.1016/S0044-8486(01)00875-4
Rhee G-Y (1982) Effects of environmental factors and their interactions on phytoplankton growth. Advances in
Microbial Ecology 6:33-74 doi:10.1007/978-1-4615-8318-9_2
Rhee G-Y, Gotham IJ (1981) The effect of environmental factors on phytoplankton growth: light and the interactions
of light with nitrate limitation. Limnol Oceanogr 26:649-659
Richardson B, Orcutt DM, Schwertner HA, Martinez CL, Wickline HE (1969) Effects of nitrogen limitation on the
growth and composition of unicellular algae in continuous culture. Appl Microbiol 18:245-250

122
Richmond A (ed) (2004) Handbook of microalgal culture. Biotechnology and applied phycology., 1st edn. Blackwell
Science Ltd., Oxford
Roberts K (1974) Crystalline glycoprotein cell walls of algae - their structure, composition and assembly.
Philosophical Transactions of the Royal Society of London B 268:129-146 doi:10.1098/rstb.1974.0021
Rodhe W (1948) Environmental requirements of fresh-water plankton algae: experimental studies in the ecology of
phytoplankton., Uppsala University
Roessler PG, Lien S (1984) Purification of hydrogenase from Chlamydomonas reinhardtii. Plant Physiol 75:705-709
doi:10.1104/Pp.75.3.705
Rotatore C, Colman B (1991) The acquisition and accumulation of inorganic carbon by the unicellular green alga
Chlorella ellipsoidea. Plant Cell Environ 14:377–382 doi:10.1111/j.1365-3040.1991.tb00946.x
Round FE (1984) The ecology of algae. Cambridge University press, Cambridge
Rubio V, Linhares F, Solano R, Martín AC, Iglesias J, Leyva A, Paz-Ares J (2001) A conserved MYB transcription
factor involved in phosphate starvation signaling both in vascular plants and in unicellular algae. Genes Dev
15:2122-2133
Rudd JJ, Franklin-Tong VE (1999) Calcium signaling in plants. Cell Mol Life Sci 55:214-232
SAG (2014) http://sagdb.uni-goettingen.de/detailedList.php?str_number=34.89. 2011-2014
Sager R, Granick S (1953) Nutritional studies with Chlamydomonas reinhardtii. Ann N Y Acad Sci 56:831-838
Saito K (2000) Regulation of sulfate transport and synthesis of sulfur-containing amino acids. Curr Opin Plant Biol
3:188-195 doi:10.1016/S1369-5266(00)80064-3
Sakamoto T, Bryant DA (1999) Nitrate transport and not photoinhibition limits growth of the freshwater
cyanobacterium Synechococcus species PCC 6301 at low temperature. Plant Physiol 119:785-794
Sanders D, Brownlee C, F. HJ (1999) Communicating with calcium. Plant Cell 11:691-706
Setlík I, Berková E, Doucha J, Kubín K, Vendlová J, Zachleder V (1972) The coupling of synthetic and reproduction
processes in Scenedesmus quadricauda. Algolog Stud 7:172-217
Shastri AA, Morgan JA (2005) Flux balance analysis of photoautotrophic metabolism. Biotechnol Prog 21:1617-
1626 doi:10.1021/bp050246d
Shaul O (2002) Magnesium transport and function in plants: the tip of the iceberg. Biometals 15:309-323
Sheehan J, Dunahay T, Benemann J, Roessler P (1998) A look back at the U.S. Department of Energy’s aquatic
species program - biodiesel from algae. National Renewable Energy Laboratory, Golden, Colorado
Shelef G (1968) Kinetics of algal systems in waste treatment. Light intensity and nitrogen concentration as growth-
limiting factors. Ph.D., University of California
Shuter B (1979) A model of physiological adaptation in unicellular algae. J Theor Biol 78:519-552
doi:10.1016/0022-5193(79)90189-9
SIBS (2014) http://www.salk.edu/news/pressrelease_details.php?press_id=300. Salk Institute for Biological Studies.

123
Sinetova MA, Cerveny J, Zavrel T, Nedbal L (2012) On the dynamics and constraints of batch culture growth of the
cyanobacterium Cyanothece sp. ATCC 51142. J Biotechnol 162:148-155 doi:10.1016/j.jbiotec.2012.04.009
Singh J, Gu S (2010) Commercialization potential of microalgae for biofuels production. Renew Sust Energ Rev
14:2596–2610 doi:10.1016/j.rser.2010.06.014
Soeder CJ (1978) Economic considerations concerning the autotrophic production of microalgae at the technical
scale. Arch Hydrobiol Beih 11:259-273
Sorokin C (1960) Kinetic studies of temperature effects on the cellular level. Biocheim Biophys Acta 38:197-204
Sorokin C, Krauss RW (1958) The effects of light intensity on the growth rates of green algae. Plant Physiol 33:109-
113 doi:10.1104/Pp.33.2.109
Sorokin C, Krauss RW (1962) Effects of temperature and illuminance on Chlorella growth uncoupled from cell
division. Plant Physiol 37:37-42
Spencer CP (1954) Studies on the culture of a marine diatom. J Mar Biol Ass U K 33:265-290
Spudich JL, Sager R (1980) Regulation of the Chlamydomonas cell cycle by light and dark. J Cell Biol 85:136-145
Steemann Nielsen E, Hansen VK, Jørgensen EG (1962) The adaptation to different light intensities in Chlorella
vulgaris and the time dependence on transfer to a new light intensity. Physiol Plant 15:505-517 doi:10.1111/j.1399-
3054.1962.tb08054.x
Stern DB (ed) (2009) The Chlamydomonas sourcebook. Organellar and metabolic processes. vol 2. The
Chlamydomonas sourcebook., 2nd edn. Elsevier Inc., Toronto
Sterner RW, Grover JP (1998) Algal growth in warm temperate reservoirs: Kinetic examination of nitrogen,
temperature, light, and other nutrients Water Res 32:3539-3548 doi:Doi 10.1016/S0043-1354(98)00165-1
Stitt M, Krapp A (1999) The interaction between elevated carbon dioxide and nitrogen nutrition: the physiological
and molecular background. Plant Cell Environ 22:583-621 doi:10.1046/j.1365-3040.1999.00386.x
Sueoka N (1960) Mitotic replication of deoxyribonucleic acid in Chlamydomonas reinhardtii. P Natl Acad Sci USA
46:83-91
Sultemeyer D (1998) Carbonic anhydrase in eukaryotic algae: characterization, regulation, and possible function
during photosynthesis. Can J Bot 76:962-972
Sunda W (1975) The relationship between cupric ion activity and the toxicity of copper to phytoplankton.,
Massachusetts Institute of Technology
Syrett PJ (1981) Nitrogen metabolism of microalgae. Can B Fish Aquat Sci:182-210
Taiz L, Zeiger E (2010) Plant physiology. Sinauer Associates Inc., Sunderland, Massachusetts
Tamburic B, Zemichael FW, Maitland GC, Hellgardt K (2011) Parameters affecting the growth and hydrogen
production of the green alga Chlamydomonas reinhardtii. Int J Hydrogen Energ 36:7872-7876
doi:10.1016/j.ijhydene.2010.11.074
Tanaka Y, Nishiyama Y, Murata N (2000) Acclimation of the photosynthetic machinery to high temperature in
Chlamydomonas reinhardtii requires synthesis de novo of proteins encoded by the nuclear and chloroplast genomes.
Plant Physiol 124:441-449

124
Terry K (1983) Temperature dependence of ammonium and phosphate uptake and their interaction in the marine
diatom Phaeodactylum tricornutum. Bohlin Mar Biol Lett 4:309-320
Terry N, Abadía J (1986) Function of iron in chloroplasts. J Plant Nutr 9:609–646
Tevatia R, Demirel Y, Blum P (2012) Kinetic modeling of photoautotropic growth and neutral lipid accumulation in
terms of ammonium concentration in Chlamydomonas reinhardtii Bioresour Technol 119:419-424 doi:DOI
10.1016/j.biortech.2012.05.124
Theodorou ME, Plaxton WC (1993) Metabolic adaptations of plant respiration to nutritional phosphate deprivation.
Plant Physiol 101:339-344 doi:10.1104/pp.101.2.339
Thomas WH, Krauss RW (1955) Nitrogen metabolism in Scenedesmus as affected by environmental changes. Plant
Physiol 30:113–122
Thompson P (1999) The response of growth and biochemical composition to variations in daylength, temperature,
and irradiance in the marine diatom Thalassiosira pseudonana (Bacillariophyceae). J Phycol 35:1215-1223
doi:10.1046/j.1529-8817.1999.3561215.x
Thompson PA, Guo M, Harrison PJ (1992) Effects of variation in temperature. I. On the biochemical composition of
eight species of marine phytoplankton. J Phycol 28:481-488 doi:10.1111/j.0022-3646.1992.00481.x
Tolstygina IV, Antal TK, Kosourov SN, Krendeleva TE, Rubin AB, Tsygankov AA (2009) Hydrogen production by
photoautotrophic sulfur-deprived Chlamydomonas reinhardtii pre-grown and incubated under high light. Biotechnol
Bioeng 102:1055-1061 doi:10.1002/bit.22148
Torzillo G, Scoma A, Faraloni C, Ena A, Johanningmeier U (2009) Increased hydrogen photoproduction by means
of a sulfur-deprived Chlamydomonas reinhardtii D1 protein mutant. Int J Hydrogen Energ 34:4529-4536
doi:10.1016/j.ijhydene.2008.07.093
Torzillo G, Scoma A, Faraloni C, Giannelli L (2014) Advances in the biotechnology of hydrogen production with the
microalga Chlamydomonas reinhardtii. Crit Rev Biotechnol doi:10.3109/07388551.2014.900734
Tripathi U, Sarada R, Ravishankar GA (2002) Effect of culture conditions on growth of green alga - Haematococcus
pluvialis and astaxanthin production. Acta Physiol Plant 24:323-329 doi:10.1007/s11738-002-0058-9
Tsygankov AA, Kosourov SN, Tolstygina IV, Ghirardi ML, Seibert M (2006) Hydrogen production by sulfur-
deprived Chlamydomonas reinhardtii under photoautotrophic conditions. Int J Hydrogen Energ 31:1574-1584
doi:10.1016/j.ijhydene.2006.06.024
Turner J et al. (2008) Renewable hydrogen production. Int J Energy Res 32:379-407
Turpin DH (1991) Effects of inorganic N availability on algal photosynthesis and carbon metabolism. J Phycol
27:14-20 doi:10.1111/j.0022-3646.1991.00014.x
Turpin DH, Bruce D (1990) Regulation of photosynthetic light harvesting by nitrogen assimilation in the green alga
Selenastrum minutum. Febs Lett 263:99-103 doi:10.1016/0014-5793(90)80714-T
Tuxhorn J, Daise T, Dentler WL (1998) Regulation of flagellar length in Chlamydomonas. Cell Motil Cytoskel
40:133-146
Ueno Y, Kurano N, Miyachi S (1998) Ethanol production by dark fermentation in the marine green alga,
Chlorococcum littorale. J Ferment Bioeng 86:38-43 doi:10.1016/S0922-338X(98)80031-7

125
Van K, Spalding MH (1999) Periplasmic carbonic anhydrase structural gene (Cah1) mutant in Chlamydomonas
reinhardtii. Plant Physiol 120:757-764
Varin L, Marsolais F, Richard M, Rouleau M (1997) Sulfation and sulfotransferases 6: Biochemistry and molecular
biology of plant sulfotransferases. FASEB journal 11:517-525
Vergara J, Bird K, Niell F (1995) Nitrogen assimilation following NH4+ pulses in the red alga Gracilariopsis
lemaneiformis: effect on C metabolism. Mar Ecol Prog Ser 122:253-263
Vieira Costa JA, Colla LM, Duarte Filho P, Kabke K, Weber A (2002) Modelling of Spirulina platensis growth in
fresh water using response surface methodology. World J Microb Biot 18:603-607 doi:10.1023/A:1016822717583
Vitova M, Bisova K, Hlavova M, Kawano S, Zachleder V, Cizkova M (2011) Chlamydomonas reinhardtii: duration
of its cell cycle and phases at growth rates affected by temperature. Planta 234:599-608 doi:10.1007/s00425-011-
1427-7
Vonshak A, Torzillo G, Masojidek J, Boussiba S (2001) Sub-optimal morning temperature induces photoinhibition
in dense outdoor cultures of the alga Monodus subterraneus (Eustigmatophyta). Plant Cell Environ 24:1113-1118
doi:10.1046/j.0016-8025.2001.00759.x
Walker DA (1993) Polarographic measurement of oxygen. In: Hall DO, Scurlock JMO, Bolhar-Nordenkampf HR,
Leegood RC, Long SP (eds) Photosynthesis and production in a changing environment. A field and laboratory
manual. 1st edn. Chapman & Hall, London, pp 168-247
Wang B, Li Y, Wu N, Lan CQ (2008) CO2 bio-mitigation using microalgae. Appl Microbiol Biot 79: 707-718
doi:10.1007/s00253-008-1518-y
Weis M, Haimovich G, Pic U (2001) Phosphate and sulfate uptake in the halotolerant alga Dunaliella tertiolecta are
driven by Na+ cotransport mechanism. J Plant Physiol 158:1519-1525
Weissenborn PK, Pugh RJ (1996) Surface tension of aqueous solutions of electrolytes: relationship with ion
hydration, oxygen solubility, and bubble coalescence. J Colloid Interface Sci 184:550-563
Whitman WG (1923) Preliminary experimental confirmation of the two film theory of gas absorption. Chem Metall
Eng 29:146-149
Woessner JP, Goodenough UW (1994) Volvocine cell walls and their constituent glycoproteins - an evolutionary
perspective. Protoplasma 181:245-258 doi:10.1007/Bf01666399
Wykoff DD, Davies JP, Melis A, Grossman AR (1998) The regulation of photosynthetic electron transport during
nutrient deprivation in Chlamydomonas reinhardtii. Plant Physiol 117:129-139
Wykoff DD, Grossman AR, Weeks DP, Usuda H, Shimogawara K (1999) Psr1, a nuclear localized protein that
regulates phosphorus metabolism in Chlamydomonas. PNAS 96:15336-15341
Xin L, Hu HY, Ke G, Sun YX (2010) Effects of different nitrogen and phosphorus concentrations on the growth,
nutrient uptake, and lipid accumulation of a freshwater microalga Scenedesmus sp. Bioresource technol 101:5494-
5500 doi:10.1016/j.biortech.2010.02.016
Yamano T, Fukuzawa H (2009) Carbon-concentrating mechanism in a green alga, Chlamydomonas reinhardtii,
revealed by transcriptome analyses. J Basic Microb 49:42-51 doi:10.1002/jobm.200800352
Yao C, Ai J, Cao X, Xue S, Zhang W (2012) Enhancing starch production of a marine green microalga Tetraselmis
subcordiformis through nutrient limitation. Bioresource Technol 118:438-444 doi:10.1016/j.biortech.2012.05.030
126
Yildiz FH, Davies JP, Grossman A (1996) Sulfur availability and the SAC1 gene control adenosine triphosphate
sulfurylase gene expression in Chlamydomonas reinhardtii Plant Physiol 112:669-675 doi:Doi 10.1104/Pp.112.2.669
Yoder JA (1979) Effect of temperature on light-limited growth and chemical composition of Skeletonema costatum
(Bacillariophyceae). J Phycol 15:362-370
Zachleder V, van den Ende H (1992) Cell cycle events in the green alga Chlamydomonas eugametos and their
control by environmental factors. J Cell Sci 102:469-474
Zhang L, Happe T, Melis A (2002) Biochemical and morphological characterization of sulfur-deprived and H2-
producing Chlamydomonas reinhardtii (green alga). Planta 214:552-561
Zhang Z, Shrager J, Jain M, Chang CW, Vallon O, Grossman AR (2004) Insights into the survival of
Chlamydomonas reinhardtii during sulfur starvation based on microarray analysis of gene expression. Eukaryot Cell
3:1331-1348 doi:10.1128/EC.3.5.1331-1348.2004
Zhu X-G, Long SP, Ort DR (2008) What is the maximum efficiency with which photosynthesis can convert solar
energy into biomass? Current Opinion in Biotechnology 2:153-159
Zonneveld C (1996) Modelling the kinetics of non-limiting nutrients in microalgae. Journal of Marine Systems
9:121-136
Zonneveld C (1998a) A cell-based model for the chlorophyll a to carbon ration in phytoplankton. Ecological
Modelling 113:55-70
Zonneveld C (1998b) Light-limited microalgal growth: a comparison of modelling approaches. Ecological Modelling
113:41-54
Zwietering MH, Jongenburger I, Rombouts FM, van 't Riet K (1990) Modeling of the bacterial growth curve. Appl
Environ Microbiol 56:1875-1881

Paper I

1
Effects of ammonium, phosphate, sulfate, and carbon dioxide 1
concentrations on starch, protein, and chlorophyll contents during 2
photoautotrophic growth of Chlamydomonas reinhardtii 3
Daria Markina*, Leiv M. Mortensen, Hans Ragnar Gislerød 4
Department of Plant Sciences, Norwegian University of Life Sciences, P.O. Box 5003, 1432 5
Ås, Norway. 6
*Corresponding author, e-mail address: [email protected], [email protected], tel.: 7
(+47) 64 96 61 38, fax: (+47) 64 96 56 01 8
Running title: Chlamydomonas: nutrients, growth and composition 9
Submitted to the Journal of Phycology 10
2
Abstract 11
The green microalga Chlamydomonas reinhardtii is able to produce hydrogen under 12
sulfur-deficient anaerobic conditions. The efficiency of hydrogen production is known to 13
depend on starch, protein, and chlorophyll contents of the culture. Microalgae are normally 14
grown mixotrophically for the purpose of hydrogen production, while in this work they were 15
grown under photoautotrophic conditions. We studied the effects of two ammonium (7.5 and 16
17.5 mM) and two sulfate (0.2 and 0.9 mM) concentrations at 2.0 and 5.0% CO2 on the dry 17
weight (DW in g L-1
) and the biochemical composition of C. reinhardtii. All treatments 18
included two high-level phosphate concentrations (10 and 20 mM) to avoid acidification of 19
the cultures. The biochemical composition of the cultures was much more affected by the 20
different nutrient treatments than was their growth. The cells accumulated quite a high 21
amount of starch (up to 40% of DW) in the low ammonium treatments, even though the 22
cultures did not become depleted of nitrogen (3 – 5 mM N remaining in the medium) after 96 23
h of growth. Low sulfate treatments also resulted in significantly higher starch content than 24
high sulfate treatments, especially in the high ammonium treatments. In the high ammonium 25
and sulfate treatments, the protein content of the cells was 35 – 50% of DW. High ammonium 26
concentration also had a significant, positive effect on the chlorophyll content of the cultures. 27
The information obtained in this study makes it possible to produce microalgae with a well-28
defined biochemical composition of relevance for studying the process of hydrogen 29
production. 30
Key-words 31
Chlamydomonas reinhardtii, chlorophyll, interaction effects, nutrients, photoautotrophic 32
growth, protein, starch. 33

3
Introduction 34
Concern about global warming and environmental pollution due to greenhouse gases, 35
and about energy supply and demand with projected shortage of fossil fuels in the 21st 36
century, has led to considerable interest in developing renewable and environmentally 37
friendly energy sources. Hydrogen (H2) gas is an attractive alternative clean fuel and energy 38
carrier, since its combustion only generates water vapor. The green microalga 39
Chlamydomonas reinhardtii has been shown to produce the highest levels of H2 reported to 40
date, and it has been used extensively as a model organism for studying microalgal H2 41
metabolism (Chochois et al. 2009; Ghysels and Franck 2010; Hemschemeier et al. 2008; 42
Laurinavichene et al. 2004; Tsygankov et al. 2006; Zhang et al. 2002). Species such as 43
Chlorella sorokiniana and Chlorella salina are also known to be capable of producing H2 44
(Chader et al. 2009; Roy et al. 2014). Until now, the majority of laboratories studying H2 45
production have supplied organic carbon substrate during the growth of C. reinhardtii. 46
However, this has been shown not to be necessary (Fouchard et al. 2005; Kosourov et al. 47
2007; Tolstygina et al. 2009; Tsygankov et al. 2006). 48
Sustained H2 production by C. reinhardtii is accomplished by means of a two-stage 49
cycle: an aerobic biomass growth stage, followed by an anaerobic H2 production stage under 50
sulfur deprivation (Melis et al. 2000). Photofermentation of both protein and starch is 51
recognized as contributing electrons for H2 production (Chochois et al. 2009; Fouchard et al. 52
2005; Melis et al. 2000; Zhang et al. 2002). In addition, Hahn et al. (2004) found that the 53
chlorophyll concentration in the culture played an important role, affecting the yield of H2 54
production in C. reinhardtii. The optimal chlorophyll concentration has been suggested to be 55
20 – 25 µg mL-1
culture (Giannelli et al. 2009; Hahn et al. 2004). Since good light penetration 56
into the culture is important for H2 production, cultures with small antenna size would be 57
preferred (Beckmann et al. 2009). 58
It is well known that the availability of nutrients in the growth medium greatly 59
influences the biochemical composition of microalgal cells (Grossman 2000; Richmond 60
2004). In order to produce biomass with high starch content, it is necessary to suppress cell 61
division through an environmental condition or by starvation of mineral nutrients (Markou et 62
al. 2012). The freshwater microalga Chlorella was found to accumulate high amounts of 63
starch (from 8.5% up to 40% of dry weight) as the photon flux density (PFD) increased from 64
a mean of 215 to 330 µmol m-2
s-1
prior to cell division (Branyikova et al. 2010). In the 65
marine microalga Tetraselmis subcordiformis, the starch content could reach 62% of dry 66
4
weight through sulfur depletion and 54% through nitrogen depletion (Yao et al. 2012). In the 67
same species, nitrogen starvation increased the starch content more than four times and the 68
hydrogen yield 5.5 times (Ji et al. 2011). Increasing the pH has also been found to increase the 69
starch content of C. reinhardtii cultures (Tolstygina et al. 2009). 70
This study aimed to investigate how the medium composition in the biomass growth 71
stage affects the growth and the biochemical composition of C. reinhardtii cultures. Eight 72
different nutrient media were used, with two different concentrations of ammonium, sulfate, 73
and phosphate under two concentrations of CO2 in the bubbled gas. K2HPO4/KH2PO4 was 74
used as a buffer system in order to reduce the acidification of the microalgae cultures as the 75
ammonium in the medium is consumed. The two phosphate concentrations (10 and 20 mM) 76
were therefore far above the requirement for this nutrient. The results were analyzed in order 77
to characterize the microalgae with respect to the desirable composition of starch, protein, and 78
chlorophyll before using them for H2 production. 79

5
Materials and methods 80
Organism and culture conditions 81
The Chlamydomonas reinhardtii P. A. Dangeard 137c strain was obtained from the 82
NIVA culture collection, Norway (CHL153). The microalgae were stored in sterile conditions 83
in a 1.5% agar Tris-Acetate-Phosphate (TAP) (Gorman and Levine 1965) solid growth 84
medium (Andersen 2005) on Petri dishes at room temperature and low light intensity. The 85
microalgae were pre-cultured in liquid High-Salt Sueoka (HS) medium (Sueoka 1960) at 25 86
°C under continuous illumination from cool white fluorescent tubes (Philips Master TLD 87
36W/840 Reflex, Eindhoven, Netherlands) at a PFD of 200 µmol m-2
s-1
. 88
Experimental setup 89
Sterile batch cultures of C. reinhardtii cells were carried out in Pyrex glass tubular 90
(coned at the bottom) photobioreactors (PBRs) with an inner diameter of 3.5 cm and a total 91
volume capacity of 380 mL. The temperature was maintained at 25.0 ± 0.5 °C using water 92
baths in aquaria. Cool white fluorescent tubes were used to provide continuous illumination at 93
a PFD of 200 µmol m-2
s-1
. The light intensity was measured using a LI-COR model LI-94
190SA instrument (LI-COR, Lincoln, NE, USA) with a quantum sensor (400 – 700 nm) 95
inside an empty PBR immersed in the water-bath aquarium, and the average PFD over the 96
height of the PBR was estimated. Filtered (Acro 37 TF Vent Device, 0.2 µm PTFE membrane 97
filters, PALL Life Sciences, Port Washington, NY, USA) air containing 2.0 ± 0.1% or 5.0 ± 98
0.1% CO2, according to the experimental design (Table 1), was injected at the bottom of the 99
PBRs (the bubble size was approximately 3 mm). The experimental medium was based on the 100
HS medium (9.35 mM NH4, 13.6 mM PO4, and 0.182 mM SO4) (Harris 2009), with varying 101
concentrations of NH4Cl, KH2PO4/K2HPO4 and K2SO4. Two CO2 concentrations in the 102
bubbled gas (2.0 and 5.0%), two concentrations of NH4 (7.5 and 17.5 mM), two 103
concentrations of PO4 (10.0 and 20.0 mM), and two concentrations of SO4 (0.2 and 0.9 mM) 104
were combined in the experiments in a 24 full factorial design, as shown in Table 1, a total of 105
sixteen treatments. Each treatment was carried out in three parallels. The treatments were 106
divided into two blocks and carried out successively, at two different CO2 concentrations. The 107
initial pH of the media was adjusted to 7.50 with 1 M NaOH prior to sterilization by 108
autoclaving. NaHCO3 was used in the medium as a pH buffer, at a concentration of 2 mM per 109
percent CO2 in the bubbled gas. Microalgae pre-grown at the same CO2 concentration as used 110
in the experiments were inoculated into the experimental medium (300 mL) in PBRs to give a 111
6
concentration of 104
cells mL-1
at the start of the experiments. The cells were counted under a 112
microscope, using a Fuchs-Rosenthal counting chamber. 113
Microalgae samples for pH and dry weight (DW) determination were collected at three 114
time points, 43 h, 67 h, and 96 h after the start of the experiments. In addition, samples 115
collected at 67 h and 96 h were analyzed for starch, protein, and chlorophyll contents. 116
Determination of dissolved CO2 concentration 117
The concentration of dissolved CO2 in the growth medium is important for microalgal 118
growth, and not the concentration in the gas bubbled into the culture, although a close 119
relationship is expected. A test was performed in order to document this relationship, where 120
different concentrations (0.04 – 9.0%) of pure CO2 mixed with air were bubbled through the 121
PBRs filled with 300 mL HS medium, at 25.0 °C. The concentration of the dissolved CO2 in 122
three parallel PBRs was measured at each CO2 concentration bubbled into the PBRs after a 123
stabilizing period of three hours, using hand-held titration cells for titrimetric analysis 124
(CHEMetrics Inc., Midland, VA, USA). The results showed a progressive increase in the 125
dissolved CO2 concentration from 100 to 430 mg L-1
, with an increasing CO2 concentration in 126
the bubbled gas, from 0.04% to 9.0% (Figure 1). In parallel to the increase in dissolved CO2 127
concentration, the pH decreased from 7.52 ± 0.01 to 6.59 ± 0.01 (mean ± SD, n = 3). The 128
linear regression curve (order 2) between the CO2 concentration in the bubbled gas and the 129
concentration of dissolved CO2 was highly correlated (R2
adj = 0.955) and followed the 130
function y = – 4.2 x2 + 73 x + 108, where y = dissolved CO2 concentration in the medium (mg 131
L-1
) and x = CO2 concentration in the bubbled gas (% v/v). By using this function, the 132
concentrations of dissolved CO2 were calculated to be 237 and 368 mg L-1
at 2.0 and 5.0% 133
CO2, respectively. 134
Biomass determination 135
The biomass of the cultures was determined by filtering 0.3 – 2.0 mL of the microalgal 136
culture through pre-washed and dried (at 103.5 °C) GF/F glass microfiber filters (0.7 µm pore 137
size, 25 mm diameter, GE Healthcare, Whatman, UK), using a vacuum pump. The filters 138
containing biomass were then washed with 30 mL de-ionized water to remove adhering salts 139
and dried for four hours at 103.5 °C. They were allowed to cool to room temperature inside 140
vacuum desiccators containing silica gel (Silica gel, Merck KGaA, Darmstadt, Germany) 141
prior to weighing (XP6, Mettler Toledo, Greifensee, Switzerland). The DW of the cultures 142

7
was calculated by subtracting the DW of the clean filter from the DW of the filter with 143
biomass. Based on this value, the biomass concentration in the culture was calculated in g L-1
. 144
Chlorophyll assay 145
Chlorophyll was extracted from the cells with ethanol and assayed using the method 146
described by Harris (1989). The amount of chlorophyll in the samples was normalized to the 147
DW of the culture and calculated as % of DW. 148
Starch assay 149
Cell pellets of 2 mL samples left after chlorophyll assay were used for starch assay. A 150
Megazyme total starch (amyloglucosidase/α-amylase method) assay kit (K-TSTA, Megazyme 151
International, Bray, Ireland) procedure was adapted to the small sample volume. 20 µL of 152
80% ethanol was added to the cell pellet and the pellet was dispersed on a vortex mixer. Cells 153
were disrupted by adding 0.2 mL DMSO (Sigma-Aldrich, St. Louis, MO, USA) and 0.5 mL 154
0.5 mm glass beads (Cell disruption media, SI-BG05, Scientific Industries Inc., New York, 155
NY, USA) to the samples and shaking them on a mixer mill (MM301, Retsch, Haan, 156
Germany) at 30 Hz frequency for 10 min. Samples were heated on thermo-shakers (TS-100, 157
Biosan, Riga, Latvia) to 100 °C for 5 min. for starch solubilization. 0.3 mL of α-amylase 158
(diluted 1/30 according to the Megazyme starch assay kit specifications) was added to the 159
samples and the tubes were incubated at 100 °C for 12 min. The content of the tubes was 160
mixed vigorously after 0, 4, 8, and 12 min. The tubes were placed at 50 °C, and 0.4 mL of 161
sodium acetate buffer (200 mM, pH 4.5) was added to the samples, followed by 10 µL of 162
amyloglucosidase. The samples were thoroughly mixed and incubated at 50 °C for 30 min. 163
Then, 70 µL of distilled water was added to the samples in order to adjust the total sample 164
volume to 1.0 mL. The samples were mixed thoroughly and centrifuged at 20800 x g 165
(Eppendorf centrifuge 5417R, Eppendorf, Hamburg, Germany) for 10 min. at 20 °C. Then, 166
33.4 µL of the supernatant was added to 1 mL GOPOD reagent and incubated at 50 °C for 20 167
min. The same procedure was used for two reagent blanks (33.4 µL distilled water) and four 168
glucose controls (33.4 µL D-glucose standard solution 1 mg mL-1
). The absorbance (optical 169
density) of each sample and the glucose controls was measured at λ = 510 nm against the 170
reagent blank. The starch content in the cultures was calculated as % of DW using the 171
formula supplied in the Megazyme starch assay kit. 172

8
Protein assay 173
Cell pellets of 1 mL samples left after chlorophyll assay were used for protein assay. 174
The cells were disrupted using 0.5 mL of 0.5 mm glass beads (Cell disruption media, SI-175
BG05, Scientific Industries Inc., New York, NY, USA) and shaking on a mixer mill (MM301, 176
Retsch, Haan, Germany) for 10 min. at a frequency of 30 Hz. Tris-HCl solubilization buffer 177
(50 mM, pH 8.3) containing 1% Triton X-100 was used to solubilize cell proteins. The Lowry 178
method (Lowry et al. 1951) was applied using a Bio-Rad DC protein microplate assay kit II 179
(#500-0112, Bio-Rad, Hercules, CA, USA) to determine the protein concentration in the 180
samples. BSA standard curve (6 point in the 0.0 – 0.75 mg mL-1
range) was used to calculate 181
the protein concentration in the samples. The protein concentration was normalized to the DW 182
of the samples and calculated as % of DW. 183
Element analysis 184
To determine the total nitrogen, phosphorous, and sulfur content of the microalgae 185
cultures, 15 mL samples were collected at 96 h after the start of the experiments and 186
centrifuged for 10 min. at 3220 x g, and the supernatant was discarded. The cell pellet was 187
washed twice with deionized water and frozen at -20 °C until analysis. The Norwegian 188
standard method, NS 4743 (Standard Norge 1993), was used to measure the total nitrogen in 189
the cells. The total phosphorous and sulfur content of the cells was analyzed using an 190
Inductively Coupled Plasma Optical Emission Spectrometer (Optima 5300 DV, Perkin Elmer, 191
Waltham, Massachusetts, USA), after the addition of HNO3 to 10% v/v and decomposition by 192
ultraclave (ultraClave III, Milestone, Sorisole, Italy) at 250 °C for 1.5 h. 193
Statistical analyses 194
The data were analyzed using the analysis of variance (ANOVA) procedure in the 195
MINITAB software (V16, Minitab Inc., State College, PA, USA). The figures were created 196
using SigmaPlot version 9.0 (Systat software Inc., San Jose, CA, USA). 197
9
Results 198
The pH of the cultures decreased progressively with time and the growth of the 199
microalgae (Figure 2). The Pearson correlation coefficients between the pH and DW of the 200
cultures were significant (p < 0.001) at 67 h and 96 h after the start of the experiments, they 201
were -0.681 and -0.556, respectively. The increase in ammonium concentration from 7.5 to 202
17.5 mM significantly (p < 0.01) decreased the pH of the cultures, at both 67 h and 96 h after 203
the start of the experiments, by 0.15 and 0.31, respectively. Increased sulfate concentration in 204
the medium also significantly (p < 0.05) decreased the pH of the cultures by 0.26, but only at 205
96 h after the start of the experiments. As expected, the increase in phosphate concentration 206
from 10 to 20 mM significantly (p < 0.01) increased the pH of the cultures, by 0.18 and 0.37 207
after 67 h and 96 h of growth, respectively (Table 2). Significant negative interaction effects 208
on the pH were detected between carbon dioxide and phosphate concentrations (p < 0.1), and 209
between ammonium and sulfate concentrations (p < 0.05) after 96 h of growth (Table 2). 210
The DW of the cultures increased throughout the growth period (Figure 3), except in 211
treatments 10 (5.0% CO2, 7.5 mM NH4, 10 mM PO4, and 0.9 mM SO4) and 11 (5.0% CO2, 212
7.5 mM NH4, 20 mM PO4, and 0.9 mM SO4), where the DW didn’t experience any change 213
between 67 and 96 h of growth. The maximum DW (1.39 g L-1
) after 96 h of growth was 214
registered for treatment 14 with high concentrations of ammonium, sulfate, and carbon 215
dioxide. The increase in concentrations of ammonium and sulfate had a significant (p < 0.001) 216
positive effect on the DW (about 0.15 g L-1
increase) of the cultures after 96 h of growth 217
(Table 2). On the contrary, the increase in phosphate concentration in the medium had a 218
significant negative effect on the DW of the cultures throughout the experimental period 219
(Table 2). Significant positive interaction effects on the DW were detected between carbon 220
dioxide and ammonium concentrations (p < 0.001), between ammonium and sulfate 221
concentrations (p < 0.01), and between phosphate and sulfate concentrations (p < 0.01) after 222
96 h of growth (Table 2). 223
From 67 to 96 h after the start of the experiments, the starch content of the cultures 224
strongly increased in the low ammonium (7.5 mM) treatments at both CO2 concentrations, 225
and it reached a higher content at 5.0% CO2 (37% of DW in average) as compared to 2.0% 226
CO2 (28% of DW in average) (Figure 4). The highest starch content (41.4% of DW) was 227
obtained at 7.5 mM ammonium and 20 mM phosphate concentrations after 96 h of growth. In 228
the high ammonium (17.5 mM) treatments, the starch content did not reach more than 20% of 229
DW after 96 h of growth. The cultures grown at 17.5 mM ammonium and 0.9 mM sulfate did 230
10
not accumulate starch at all, the maximum starch content being 12.5 and 5.0% of DW for 2.0 231
and 5.0% CO2, respectively. The statistical analysis showed that the concentration of 232
ammonium in the growth medium had a significant (p < 0.001) negative effect on the starch 233
content, as did the combinations of ammonium and carbon dioxide concentrations, and of 234
ammonium and sulfate concentrations (Table 2), both at 67 and 96 h of growth. After 96 h of 235
growth, the sulfate concentration and the combination of carbon dioxide, ammonium, and 236
sulfate concentrations had a negative effect on the starch content of the cultures (Table 2). 237
The protein content in the microalgae cultures decreased between 67 and 96 h of 238
growth in all treatments with 7.5 mM ammonium (Figure 5). On the contrary, at 17.5 mM 239
ammonium, the protein content of the cultures increased between 67 and 96 h of growth, 240
especially in the treatments with 0.9 mM sulfate. The highest protein content (52% of DW) 241
was measured in treatment 16 (5.0% CO2, 17.5 mM NH4, 20 mM PO4, and 0.9 mM SO4) after 242
96 h of growth. The statistical analysis showed that the same variables were affecting the 243
protein content as those affecting the starch content of the cultures, but this time in a positive 244
way (Table 2). Phosphate concentration also positively affected the protein content of the 245
microalgae (p < 0.05) (Table 2). 246
The starch and protein contents of C. reinhardtii cultures were negatively correlated, 247
with Pearson correlation coefficients of -0.544 (p < 0.001) and -0.867 (p < 0.001) after 67 h 248
and 96 h of growth, respectively. The linear regression analysis yielded the following 249
relationships between starch and protein contents: Starch (% of DW) = 31.1 – 0.64 * Protein 250
(% of DW) (R2 = 0.42) and Starch (% of DW) = 45.6 – 0.75 Protein (% of DW) (R
2 = 0.63) at 251
67 and 96 h of growth, respectively (Figure 6). The ANOVA showed significant negative 252
effects of ammonium concentration (p < 0.001) and of the combinations of carbon dioxide 253
and ammonium concentrations (p < 0.001); ammonium and sulfate concentrations (p < 254
0.001); and carbon dioxide, ammonium, and sulfate concentrations (p < 0.05) on the 255
starch/protein ratio of the microalgae (Table 2). 256
The total chlorophyll (a and b) content in the cultures (as % of DW) was significantly 257
higher when the microalgae were grown in the high ammonium (p < 0.001) treatments than in 258
the low ammonium treatments (Figure 7, Table 2). The interaction of carbon dioxide and 259
ammonium concentrations also had a significant (p < 0.05) positive effect on the total 260
chlorophyll content of the microalgae, as did the interaction between ammonium and sulfate 261
concentrations (p < 0.001) after 96 h of growth (Table 2). The chlorophyll content decreased 262
toward the end of the experiments (from 67 to 96 h of growth) in all treatments, except in 263

11
treatment 7 (2.0% CO2, 17.5 mM NH4, 20 mM PO4, and 0.2 mM SO4). The chlorophyll a/b 264
ratio varied between 1.55 at 67 h in treatment 2 (2.0% CO2, 7.5 mM NH4, 10 mM PO4, and 265
0.9 mM SO4) and 2.10 at 96 h in treatment 16 (5.0% CO2, 17.5 mM NH4, 20 mM PO4, and 266
0.9 mM SO4) (Figure 8). Larger differences in the chlorophyll a/b ratio between the 267
treatments were found in microalgae grown at 5.0% CO2 than in microalgae grown at 2.0% 268
CO2. The concentrations of all four nutrients had a significant positive effect on the 269
chlorophyll a/b ratio, as did the interaction of carbon dioxide and ammonium concentrations 270
(Table 2). 271
The dry weight of microalgae and the corresponding weight of starch and protein were 272
calculated so that the cultures would contain 20 mg chl L-1
(Figure 9) after proper dilution of 273
the microalgae harvested after 96 h of growth for hydrogen production. This chlorophyll 274
concentration was shown to be the optimal one for maximal hydrogen output (Hahn et al. 275
2004). While a microalgae dry weight of 1.5 – 2.7 g L-1
would be necessary to contain this 276
chlorophyll concentration after 96 h of growth for the low ammonium treatments and 5.0% 277
CO2, about 1 g L-1
would be sufficient for microalgae grown in high ammonium treatments 278
(Figure 9). High ammonium treatments would yield high protein content (32 – 52% of DW), 279
but low starch content (5 – 20% of DW). In the low ammonium treatment, on the other hand, 280
starch would contribute to a much greater part of the biomass (up to 42% of DW). 281
The N content in the microalgae after 96 h of growth varied between 6 and 11% of 282
DW in the high ammonium treatments, and between 3 and 6% of DW in the low ammonium 283
treatments (Figure 10). The P content varied between 0.8 and 2.4% of DW (Figure 10). The S 284
content in the microalgae varied between 0.27 and 0.73% of DW (Figure 10). The contents of 285
these three nutrients were negatively affected by the carbon dioxide concentration (p < 0.05 286
for N and p < 0.01 for P and S) (Table 2). A significant (p < 0.001 for N and S, p < 0.01 for P) 287
positive effect of the ammonium concentration was also observed (Table 2). The sulfate 288
concentration had a significant positive effect on the S content of the microalgae (p < 0.01), 289
but a negative effect on the P content (p < 0.001) (Table 2). We also observed significant (p < 290
0.05) negative interaction effect of carbon dioxide and phosphate concentrations on the N 291
content of the microalgae, and positive interaction effects of ammonium and phosphate 292
concentrations on the S content (p < 0.05), of ammonium and sulfate concentrations on all 293
three nutrients (p < 0.05), and, finally, of the combination of carbon dioxide, ammonium, and 294
sulfate concentrations on all three nutrients (p < 0.05 for P, p < 0.01 for N and S) (Table 2). 295

12
Calculations showed that 8.0 – 12.5 mM N was left in the medium after 96 h of 296
growth in high ammonium treatments, while 2.8 – 5.2 mM N was left in the medium after 96 297
h of growth in low ammonium treatments (Figure 11). The remaining S concentration after 96 298
h of growth was over 0.6 mM S in high sulfate treatments, while it varied between 0.05 and 299
0.12 mM S in the low sulfate treatments (Figure 11). 300

13
Discussion 301
It appears to be quite clear that the different nutrient treatments had a much greater 302
effect on the biochemical composition of the microalgae than on their growth. This is in 303
accordance with the results of Lee et al. (2012), who found that, while decreasing the 304
ammonium concentration in the medium from 6.2 to 4.7 or 3.1 mM had no effect on the 305
growth rate, a significant effect was measured on the primary metabolism and enzyme 306
expression in C. reinhardtii. The starch content of our cultures showed most variation 307
between the different treatments (up to ten times). Small differences in biomass were 308
measured between the two CO2 concentrations, as expected based on previous results with the 309
same strain (Mortensen and Gislerød 2014; Mortensen and Gislerød 2015). However, the 310
effect of the different nutrient treatments on the biochemical components was more marked at 311
5.0% than at 2.0% CO2 in the present study. 312
The availability of nitrogen and sulfur might have been the reason for the different 313
growth rates observed towards the end of the growth period at 5.0% CO2. This was the case 314
even when a quite high nitrogen concentration (over 2.8 mM) was left in the culture medium 315
in the low ammonium treatments (7.5 mM) at the end of the experiments. Xin et al. (2010) 316
found 0.86 mM N to be the half-saturation concentration for nitrogen uptake in Scenedesmus 317
sp, which is much lower than the remaining nitrogen concentration in our cultures. The 318
growth decrease in the low ammonium treatments was related to low sulfur concentrations 319
remaining in the culture. Sulfur deficiency in the growth medium is known to stimulate starch 320
accumulation in the microalgae cells (Yao et al. 2012). The high starch contents measured in 321
the present study (30 – 40% of DW) could have caused a negative feedback effect on 322
photosynthesis in spite of the high N concentration still remaining in the medium. It is 323
difficult to find literature on direct feedback downregulation of photosynthesis by high starch 324
contents in microalgae (when nutrients are not depleted). However, this is well described in 325
C3 plants, such as wheat and soybean, where starch accumulates in the chloroplasts and 326
inhibits photosynthesis (Sawada et al. 2001; Sinha et al. 2011). Therefore, it should not be 327
surprising if the high starch content, particularly occurring at high CO2 concentration, could 328
reduce photosynthesis and growth of the microalgae. Increasing the phosphate concentration 329
slightly (but not significantly) increased the starch content probably due to increased pH of 330
the culture, which is in line with previous results (Tolstygina et al. 2009). Though, in the 331
present study, this effect was small compared to the effect of low ammonium and sulfate 332
concentrations. 333

14
As expected, the protein content in the low ammonium and sulfate treatments 334
decreased, probably due to the limitation of availability of nitrogen and sulfur for protein 335
synthesis, at the same time as the starch content increased during the growth period (Guo et 336
al. 2014; Ji et al. 2011; Markou et al. 2012). A relative decrease in the protein content took 337
place since starch made up a greater part of the total biomass of the microalgae. Since 338
nitrogen is also part of the chlorophyll molecule, the concentration of chlorophyll generally 339
followed the same pattern as the protein content of the cultures. The chlorophyll a/b ratios 340
(1.55 – 2.1) recorded in the present study are similar to those described by Wood (1979). A 341
high chlorophyll a/b ratio is desirable, since this would mean more efficient photosynthesis, 342
due to more reaction center pigments relative to antenna pigments (Beckmann et al. 2009). 343
According to our results (Table 2), this would mean using high ammonium concentration to 344
produce microalgae for the purpose of H2 production, which would contradict the 345
recommendation of using low ammonium concentration in order to obtain cultures with 346
higher starch content. 347
For H2 production, the content of starch, protein, and chlorophyll is important, as is the 348
ability of the light to penetrate the microalgae culture. A chlorophyll concentration of 20 mg 349
L-1
has been suggested to be optimal for H2 production (Hahn et al. 2004). This means that, 350
the higher the chlorophyll content in the microalgae cell, the lower the biomass of the culture 351
needed, and the more light will penetrate into the culture. The combination of high 352
ammonium and low sulfate concentrations in the present experiment produced microalgae 353
that would give the desired chlorophyll concentration of 20 mg L-1
at a biomass concentration 354
of about 1 g L-1
. The corresponding starch content would be about 15 – 20% of DW. High 355
ammonium combined with high sulfate concentrations would yield about the same biomass 356
concentration, but with a much lower starch content (5.0 – 12.5% of DW). If a high starch 357
content of 30 – 40% of DW (obtained at low ammonium and low sulfate concentrations) is 358
desired, this would require a biomass concentration of 1.5 – 2.7 g L-1
in order to establish a 359
chlorophyll concentration of 20 mg L-1
. The light penetration in this case would be reduced by 360
2 – 3 times. 361
It can be concluded that different nutrient combinations that do not necessarily result 362
in different growth rates could change the relative content of starch, protein, and total 363
chlorophyll, as well as the chlorophyll a/b ratio. This information makes it possible to 364
produce microalgae with a well-defined biochemical composition of relevance to studying the 365
process of H2 production. 366
15
Acknowledgments 367
This study was financially supported by the Research Council of Norway (Project 368
203281: Use of solar energy for CO2 capture, algae cultivation and hydrogen production – 369
BioH2) and the Norwegian University of Life Sciences. We thank Dag Wenner and Silje 370
Roksti for their technical assistance. 371

16
References 372
Andersen RA (ed) (2005) Algal culturing techniques., 1st edn. Elsevier Academic Press, 373
London 374
Beckmann J, Lehr F, Finazzi G, Hankamer B, Posten C, Wobbe L, Kruse O (2009) 375
Improvement of light to biomass conversion by de-regulation of light-harvesting protein 376
translation in Chlamydomonas reinhardtii. J Biotechnol 142:70-77 377
doi:10.1016/j.jbiotec.2009.02.015 378
Branyikova I, Marsalkova B, Doucha J, Branyik T, Bisova K, Zachleder V, Vitova M (2010) 379
Microalgae - novel highly efficient starch producers. Biotechnol Bioeng 108:766-776 380
Chader S, Hacene H, Agathos SN (2009) Study of hydrogen production by three strains of 381
Chlorella isolated from the soil in the Algerian Sahara. Int J Hydrogen Energ 34:4941-4946 382
doi:10.1016/j.ijhydene.2008.10.058 383
Chochois V et al. (2009) Hydrogen production in Chlamydomonas: photosystem II-dependent 384
and -independent pathways differ in their requirement for starch metabolism. Plant Physiol 385
151:631-640 doi:10.1104/pp.109.144576 386
Fouchard S et al. (2005) Autotrophic and mixotrophic hydrogen photoproduction in sulfur-387
deprived Chlamydomonas cells. Appl Environ Microb 71:199-205 388
doi:10.1128/AEM.71.10.6199-6205.2005 389
Ghysels B, Franck F (2010) Hydrogen photo-evolution upon S deprivation stepwise: an 390
illustration of microalgal photosynthetic and metabolic flexibility and a step stone for future 391
biotechnological methods of renewable H2 production. Photosynth Res 106:145-154 392
doi:10.1007/s11120-010-9582-4 393
Giannelli L, Scoma A, Torzillo G (2009) Interplay between light intensity, chlorophyll 394
concentration and culture mixing on the hydrogen production in sulfur-deprived 395
Chlamydomonas reinhardtii cultures grown in laboratory photobioreactors. Biotechnol 396
Bioeng 104:76-90 doi:10.1002/bit.22384 397
Gorman DS, Levine RP (1965) Cytochrome f and plastocyanin: their sequence in the 398
photosynthetic electron transport chain of Chlamydomonas reinhardtii. P Natl Acad Sci USA 399
54:1665-1669 400

17
Grossman A (2000) Acclimation of Chlamydomonas reinhardtii to its nutrient environment. 401
Protist 151:201-224 doi:10.1078/1434-4610-00020 402
Guo F et al. (2014) Special biochemical responses to nitrogen deprivation of filamentous 403
oleaginous microalgae Tribonema sp. Bioresource technol 158:19-24 404
doi:10.1016/j.biortech.2014.01.144 405
Hahn JJ, Ghirardi ML, Jacoby WA (2004) Effect of process variables on photosynthetic algal 406
hydrogen production. Biotechnol Progr 20:989-991 doi:10.1021/bp03341287 407
Harris EH (1989) The Chlamydomonas sourcebook: a comprehensive guide to biology and 408
laboratory use., 1st edn. Academic Press, Inc., San Diego 409
Harris EH (2009) The Chlamydomonas sourcebook. Introduction to Chlamydomonas and its 410
laboratory use. vol 1. 2nd edn. Elseiver Inc, Oxford 411
Hemschemeier A, Fouchard S, Cournac L, Peltier G, Happe T (2008) Hydrogen production 412
by Chlamydomonas reinhardtii: an elaborate interplay of electron sources and sinks. Planta 413
227:397-407 doi:10.1007/s00425-007-0626-8 414
Ji C-F, Yu X-J, Chen Z-A, Xue S, Legrand J, Zhang W (2011) Effects of nutrient deprivation 415
on biochemical compositions and photo-hydrogen production of Tetraselmis subcordiformis. 416
Int J Hydrogen Energ 36:5817-5821 doi:10.1016/j.ijhydene.2010.12.138 417
Kosourov S, Patrusheva E, Ghirardi ML, Seibert M, Tsygankov A (2007) A comparison of 418
hydrogen photoproduction by sulfur-deprived Chlamydomonas reinhardtii under different 419
growth conditions. J Biotechnol 128:776-787 420
Laurinavichene T, Tolstygina I, Tsygankov A (2004) The effect of light intensity on hydrogen 421
production by sulfur-deprived Chlamydomonas reinhardtii. J Biotechnol 114:143-151 422
doi:10.1016/j.jbiotec.2004.05.012 423
Lee DY, Park JJ, Barupal DK, Fiehn O (2012) System response of metabolic networks in 424
Chlamydomonas reinhardtii to total available ammonium. Mol Cell Proteomics 11:973-988 425
doi:10.1074/mcp.M111.016733 426
Lowry OH, Rosebrough NJ, Farr AL, Randall RJ (1951) Protein measurement with the Folin 427
phenol reagent. J Biol Chem 193:265-275 428
18
Markou G, Angelidaki I, Georgakakis D (2012) Microalgal carbohydrates: an overview of the 429
factors influencing carbohydrates production, and of main bioconversion technologies for 430
production of biofuels. Appl Microbiol Biot 96:631-645 doi:10.1007/s00253-012-4398-0 431
Melis A, Zhang LP, Forestier M, Ghirardi ML, Seibert M (2000) Sustained photobiological 432
hydrogen gas production upon reversible inactivation of oxygen evolution in the green alga 433
Chlamydomonas reinhardtii. Plant Physiol 122:127-135 434
Mortensen LM, Gislerød HR (2014) The effect on growth of Chlamydomonas reinhardtii of 435
flue gas from a power plant based on waste combustion. A M B Express 4:49 436
doi:10.1186/s13568-014-0049-4 437
Mortensen LM, Gislerød HR (2015) The growth of Chlamydomonas reinhardtii as influenced 438
by high CO2 and low O2 in flue gas from a silicomanganese smelter. J Appl Phycol 27:633-439
638 doi:10.1007/s10811-014-0357-8 440
Richmond A (ed) (2004) Handbook of microalgal culture. Biotechnology and applied 441
phycology., 1st edn. Blackwell Science Ltd., Oxford 442
Roy S, Kumar K, Ghosh S, Das D (2014) Thermophilic biohydrogen production using pre-443
treated algal biomass as substrate. Biomass Bioenerg 61:157-166 444
doi:10.1016/j.biombioe.2013.12.006 445
Sawada S et al. (2001) The mechanism to suppress photosynthesis through end-product 446
inhibition in single-rooted soybean leaves during acclimation to CO2 enrichment. Plant Cell 447
Physiol 42:1093-1102 doi:10.1093/pcp/pce138 448
Sinha PG, Saradhi PP, Uprety DC, Bhatnagar AK (2011) Effect of elevated CO2 449
concentration on photosynthesis and flowering in three wheat species belonging to different 450
ploidies. Agr Ecosyst Environ 142:432-436 doi:10.1016/j.agee.2011.06.017 451
Standard Norge (1993) NS 4743:1993. 452
http://www.standard.no/no/nettbutikk/produktkatalogen/Produktpresentasjon/?ProductID=134453
377. 2012 454
Sueoka N (1960) Mitotic replication of deoxyribonucleic acid in Chlamydomonas reinhardtii. 455
P Natl Acad Sci USA 46:83-91 456

19
Tolstygina IV, Antal TK, Kosourov SN, Krendeleva TE, Rubin AB, Tsygankov AA (2009) 457
Hydrogen production by photoautotrophic sulfur-deprived Chlamydomonas reinhardtii pre-458
grown and incubated under high light. Biotechnol Bioeng 102:1055-1061 459
doi:10.1002/bit.22148 460
Tsygankov AA, Kosourov SN, Tolstygina IV, Ghirardi ML, Seibert M (2006) Hydrogen 461
production by sulfur-deprived Chlamydomonas reinhardtii under photoautotrophic 462
conditions. Int J Hydrogen Energ 31:1574-1584 doi:10.1016/j.ijhydene.2006.06.024 463
Wood AM (1979) Chlorophyll a:b ratios in marine planktonic algae. J Phycol 15:330-332 464
doi:10.1111/j.0022-3646.1979.00330.x 465
Xin L, Hu HY, Ke G, Sun YX (2010) Effects of different nitrogen and phosphorus 466
concentrations on the growth, nutrient uptake, and lipid accumulation of a freshwater 467
microalga Scenedesmus sp. Bioresource technol 101:5494-5500 468
doi:10.1016/j.biortech.2010.02.016 469
Yao C, Ai J, Cao X, Xue S, Zhang W (2012) Enhancing starch production of a marine green 470
microalga Tetraselmis subcordiformis through nutrient limitation. Bioresource Technol 471
118:438-444 doi:10.1016/j.biortech.2012.05.030 472
Zhang L, Happe T, Melis A (2002) Biochemical and morphological characterization of sulfur-473
deprived and H2-producing Chlamydomonas reinhardtii (green alga). Planta 214:552-561 474

20
List of tables 475
Table 1. Experimental design. Four variables (CO2 concentration in the bubbled gas (% v/v), 476
and the concentrations of NH4, PO4, and SO4 in the growth medium) were combined in a 24 477
full factorial design in order to investigate their effects on the growth kinetics and the 478
biochemical content of C. reinhardtii batch cultures. In total, sixteen treatments were applied. 479
The treatments were divided into two blocks and carried out successively, at two different 480
CO2 concentrations. Each treatment was repeated in three photobioreactors. 481
Table 2. Results of the ANOVA. Average effects and significance levels of the effects of 482
different nutrient treatments (C – CO2 concentration in the bubbled gas (% v/v), N – NH4 483
concentration in the growth medium (mM), P – PO4 concentration in the growth medium 484
(mM), S – SO4 concentration in the growth medium (mM)) and their interactions on pH, dry 485
weight (DW) per liter culture, the content of starch, protein, chlorophyll, nitrogen (N), 486
phosphorous (P), and sulfur (S) of the microalgae after 43, 67, and 96 h of growth of C. 487
reinhardtii. The experiments were carried out in two blocks at two different CO2 488
concentrations. The effect of the CO2 concentration and the effect of the block (time) were 489
therefore confounded. Significance levels: ^, p < 0.10; *, p < 0.05; **, p < 0.01; ***, p < 490
0.001. Not significant, p > 0.10 (not indicated). 491
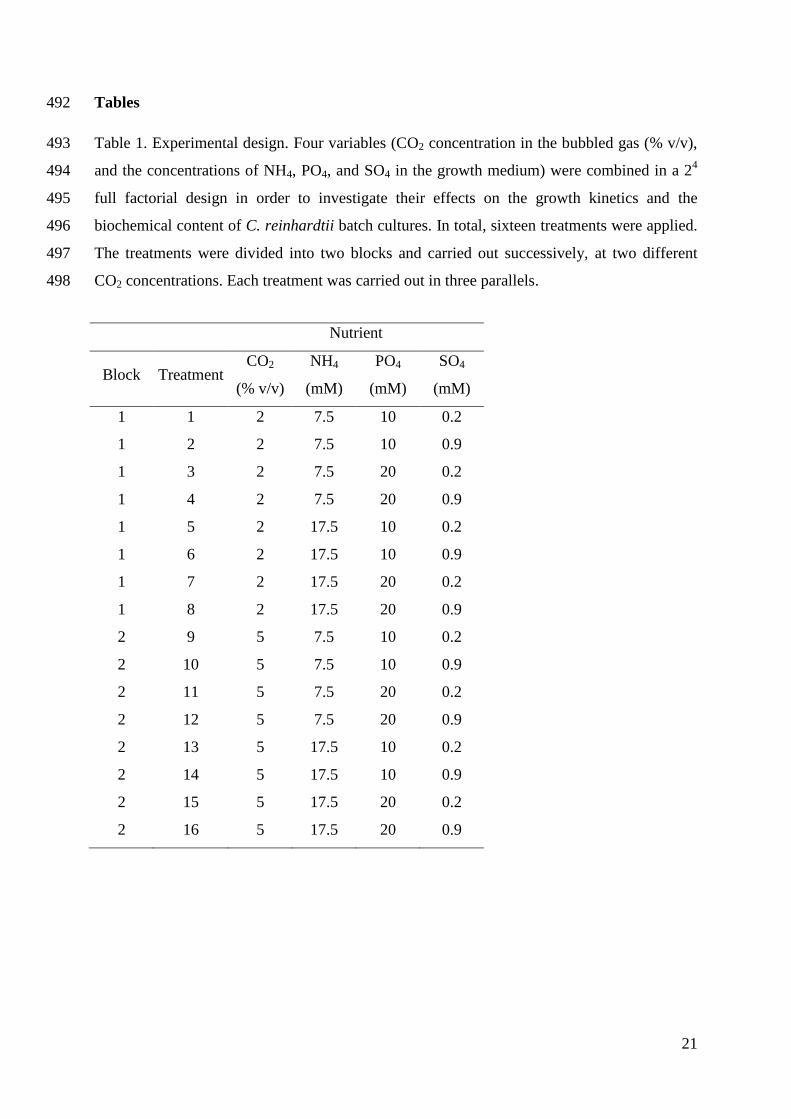
21
Tables 492
Table 1. Experimental design. Four variables (CO2 concentration in the bubbled gas (% v/v), 493
and the concentrations of NH4, PO4, and SO4 in the growth medium) were combined in a 24 494
full factorial design in order to investigate their effects on the growth kinetics and the 495
biochemical content of C. reinhardtii batch cultures. In total, sixteen treatments were applied. 496
The treatments were divided into two blocks and carried out successively, at two different 497
CO2 concentrations. Each treatment was carried out in three parallels. 498
Nutrient
Block Treatment CO2
(% v/v)
NH4
(mM)
PO4
(mM)
SO4
(mM)
1 1 2 7.5 10 0.2
1 2 2 7.5 10 0.9
1 3 2 7.5 20 0.2
1 4 2 7.5 20 0.9
1 5 2 17.5 10 0.2
1 6 2 17.5 10 0.9
1 7 2 17.5 20 0.2
1 8 2 17.5 20 0.9
2 9 5 7.5 10 0.2
2 10 5 7.5 10 0.9
2 11 5 7.5 20 0.2
2 12 5 7.5 20 0.9
2 13 5 17.5 10 0.2
2 14 5 17.5 10 0.9
2 15 5 17.5 20 0.2
2 16 5 17.5 20 0.9

22
Table 2. Results of the ANOVA. Average effects and significance levels of the effect of different nutrient treatments (C – CO2 concentration in 499
the bubbled gas (% v/v), N – NH4 concentration in the growth medium (mM), P – PO4 concentration in the growth medium (mM), S – SO4 500
concentration in the growth medium (mM)) and their interactions on pH, dry weight (DW) per liter culture, the content of starch, protein, 501
chlorophyll, nitrogen (N), phosphorous (P), and sulfur (S) in the microalgae after 43, 67, and 96 h of growth of C. reinhardtii. The experiments 502
were carried out in two blocks at two different CO2 concentrations. The effect of the CO2 concentration and the effect of the block (time) were, 503
therefore, confounded. Significance levels: ^, p < 0.10; *, p < 0.05; **, p < 0.01; ***, p < 0.001. Not significant, p > 0.10 (not indicated). 504
pH
Dry weight
(g L-1)
Starch content
(% of DW)
Protein content
(% of DW) Starch/protein
Total chlorophyll
(% of DW) Chlorophyll a/b
Nutrient content
(% of DW)
Nutrient 43 h 67 h 96 h 43 h 67 h 96 h 67 h 96 h 67 h 96 h 67 h 96 h 67 h 96 h 67h 96 h N P S
C -0.19*** -0.03 0.21^ 0.009 0.157*** -0.028 0.3 4.0** 3.5* -0.03 0.08^ 0.30*** -0.003 -0.013^ 0.10*** 0.10*** -0.97* -0.39** -0.10**
N -0.06 -0.15** -0.31** -0.004 -0.001 0.152*** -8.4*** -19.1*** 3.7* 19.0*** -0.38*** -1.37*** 0.052*** 0.088*** 0.14*** 0.13*** 3.38*** 0.41** 0.16***
P -0.05 0.18** 0.37** -0.022* -0.077^ -0.085** 1.3 0.5 4.1* 3.3* -0.03 -0.16* -0.010 0.009 0.04^ 0.05* 0.62 0.05 0.01
S 0.02 -0.07 -0.26* -0.003 0.070^ 0.142*** -1.8 -6.0*** -0.3 3.0* 0.05 0.10 0.003 0.004 0.05* 0.12*** -0.03 -0.32** 0.12***
C x N 0.06 -0.06 0.10 0.014 -0.014 0.130*** -4.8*** -5.2*** 3.4* 6.0*** -0.25*** -0.37*** 0.020* 0.02* 0.11*** 0.08** 0.46 -0.02 0.04
C x P 0.04 0.09^ -0.22^ 0.013 -0.005 -0.034 2.1^ 2.0^ -1.2 0.02 0.06 0.15^ -0.001 -0.008 -0.02 0.02 -1.12* -0.09 -0.04
C x S -0.04 0.04 0.10 0.013 -0.003 0.059 0.7 -0.8 -1.8 0.8 0.12** 0.05 -0.002 -0.008 0.07** -0.002 0.66 -0.03 0.01
N x P 0.05 0.04 0.16 0.002 0.051 0.032 -0.6 -0.5 -3.2^ 1.0 0.05 0.13^ -0.002 -0.010 0.01 0.11*** 0.52 -0.02 0.06*
N x S 0.04 0.02 -0.24* -0.003 0.004 0.102** -2.9* -4.1** 2.8^ 7.0*** -0.20*** -0.44*** 0.014 0.034*** 0.02 0.07** 0.96* -0.24* 0.08*
P x S 0.02 0.08 0.16 0.006 -0.032 0.105** 0.7 0.4 1.4 2.4^ 0.004 -0.13^ 0.001 0.006 0.04^ 0.01 0.15 -0.06 0.001
C x N x P -0.02 0.01 -0.13 -0.001 0.041 0042 -2.6* -1.7 -0.6 -0.3 -0.07 -0.15^ 0.002 0.010 0.02 -0.03 -0.33 -0.06 -0.08*
C x N x S 0.03 -0.06 0.09 -0.006 0.064 -0.038 -1.1 -4.2*** 0.7 3.3* -0.11* -0.18* -0.004 0.009 -0.001 0.07* 1.37** 0.26* 0.08**
C x P x S 0.03 -0.04 -0.1 -0.001 0.012 0.028 1.4 1.0 -1.3 -1.7 0.05 0.24** 0.002 -0.012 -0.01 -0.01 0.38 0.02 -0.01
N x P x S -0.02 -0.05 0.10 -0.013 -0.007 -0.051 -0.2 -1.8^ -0.3 -1.9 0.01 0.12 -0.007 -0.010 -0.03 -0.001 -0.80^ -0.04 0.01
C x N x P x S -0.04 0.06 -0.06 -0.016^ -0.097* -0.100** -1.9^ 0.2 -0.03 0.8 -0.07 -0.19* 0.020* 0.021** 0.03 -0.03 0.21 0.05 -0.03
23
List of figures 505
Figure 1. Effect of the CO2 concentration in the bubbled gas (% v/v) on the dissolved CO2 506
concentration (mg L-1
) in the High-Salt Sueoka medium (means ± SD, n = 3) and the linear 507
regression curve (y = - 4.2 x2 + 73 x +108, R
2adj = 0.955) fitted to the data. 508
Figure 2. Effect of the different nutrient treatments (NH4/PO4/SO4 concentrations in mM) on 509
the pH (means ± SD, n = 3) of C. reinhardtii cultures grown at 2.0% CO2 (a) and 5.0% CO2 510
(b). 511
Figure 3. Effect of the different nutrient treatments (NH4/PO4/SO4 concentrations in mM) on 512
the dry weight (g L-1
, means ± SD, n = 3) of the C. reinhardtii cultures grown at 2.0% CO2 (a) 513
and 5.0% CO2 (b). 514
Figure 4. Effect of the different nutrient treatments (NH4/PO4/SO4 concentrations in mM) on 515
the starch content (% of dry weight (DW), means ± SD, n = 3) of the C. reinhardtii cultures 516
grown at 2.0% CO2 (a) and 5.0% CO2 (b). 517
Figure 5. Effect of the different nutrient treatments (NH4/PO4/SO4 concentrations in mM) on 518
the protein content (% of dry weight (DW), means ± SD, n = 3) of the C. reinhardtii cultures 519
grown at 2.0% CO2 (a) and 5.0% CO2 (b). 520
Figure 6. Relationship between starch and protein contents (% of dry weight (DW)) in C. 521
reinhardtii cultures after 67 h (a) and 96 h (b) of growth. 522
Figure 7. Effect of the different nutrient treatments (NH4/PO4/SO4 concentrations in mM) on 523
the total chlorophyll (a + b) content (% of dry weight (DW), means ± SD, n = 3) of the C. 524
reinhardtii cultures grown at 2.0% CO2 (a) and 5.0% CO2 (b). 525
Figure 8. Effect of the different nutrient treatments (NH4/PO4/SO4 concentrations in mM) on 526
the chlorophyll a/b ratio (mean ± SD, n = 3) in the C. reinhardtii cultures grown at 2.0% CO2 527
(a) and 5.0% CO2 (b). 528
Figure 9. Dry weight of C. reinhardtii cultures, starch, and protein corresponding to 20 mg 529
chl L-1
calculated for the different nutrient treatments (NH4/PO4/SO4 concentrations in mM) at 530
2.0% CO2 (a) and 5.0% CO2 (b) after 96 h of growth. 531
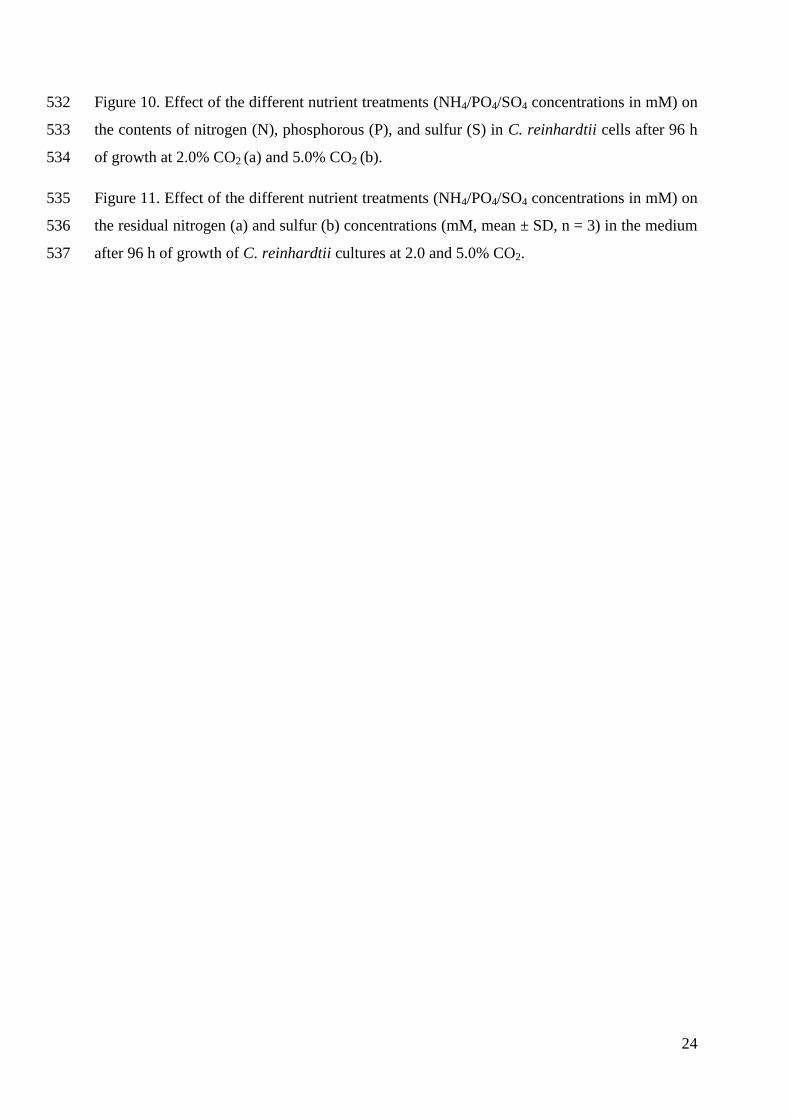
24
Figure 10. Effect of the different nutrient treatments (NH4/PO4/SO4 concentrations in mM) on 532
the contents of nitrogen (N), phosphorous (P), and sulfur (S) in C. reinhardtii cells after 96 h 533
of growth at 2.0% CO2 (a) and 5.0% CO2 (b). 534
Figure 11. Effect of the different nutrient treatments (NH4/PO4/SO4 concentrations in mM) on 535
the residual nitrogen (a) and sulfur (b) concentrations (mM, mean ± SD, n = 3) in the medium 536
after 96 h of growth of C. reinhardtii cultures at 2.0 and 5.0% CO2. 537

25
Figures 538
y = - 4.2 x2
+ 73 x + 108
R2
adj
= 0.955
CO2 concentration in the bubbled gas (% v/v)
0 1 2 3 4 5 6 7 8 9 10
Dis
solv
ed C
O2
co
nce
ntr
atio
n (
mg
L-1
)
0
100
200
300
400
500
539
Figure 1. Effect of the CO2 concentration in the bubbled gas (% v/v) on the dissolved CO2 540
concentration (mg L-1
) in the High-Salt Sueoka medium (means ± SD, n = 3) and the linear 541
regression curve (y = - 4.2 x2 + 73 x +108, R
2adj = 0.955) fitted to the data. 542
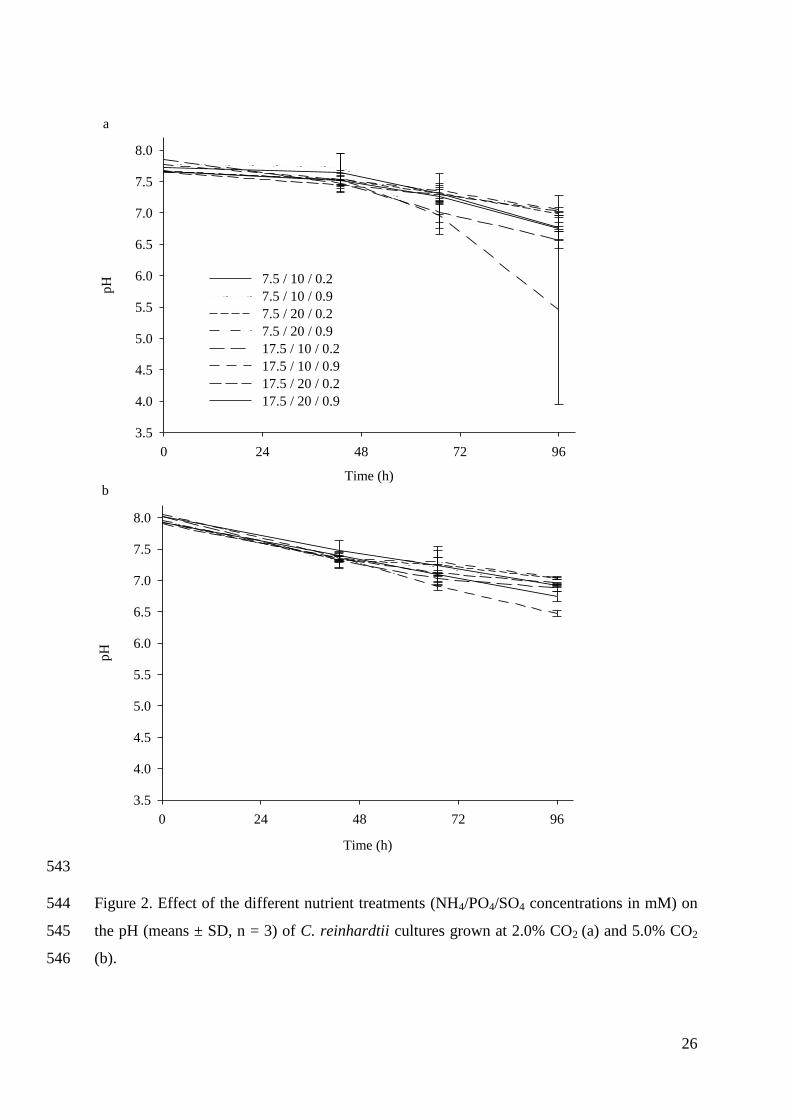
26
Time (h)
0 24 48 72 96
pH
3.5
4.0
4.5
5.0
5.5
6.0
6.5
7.0
7.5
8.0
a
Time (h)
0 24 48 72 96
pH
3.5
4.0
4.5
5.0
5.5
6.0
6.5
7.0
7.5
8.0
7.5 / 10 / 0.2
7.5 / 10 / 0.9
7.5 / 20 / 0.2
7.5 / 20 / 0.9
17.5 / 10 / 0.2
17.5 / 10 / 0.9
17.5 / 20 / 0.2
17.5 / 20 / 0.9
b
543
Figure 2. Effect of the different nutrient treatments (NH4/PO4/SO4 concentrations in mM) on 544
the pH (means ± SD, n = 3) of C. reinhardtii cultures grown at 2.0% CO2 (a) and 5.0% CO2 545
(b).546
27
Time (h)
48 72 96
Dry
wei
gh
t (g
L-1
)
0.0
0.2
0.4
0.6
0.8
1.0
1.2
1.4
Time (h)
48 72 96
Dry
wei
gh
t (g
L-1
)
0.0
0.2
0.4
0.6
0.8
1.0
1.2
1.4
7.5 / 10 / 0.2
7.5 / 10 / 0.9
7.5 / 20 / 0.2
7.5 / 20 / 0.9
17.5 / 10 / 0.2
17.5 / 10 / 0.9
17.5 / 20 / 0.2
17.5 / 20 / 0.9
a
b
547
Figure 3. Effect of the different nutrient treatments (NH4/PO4/SO4 concentrations in mM) on 548
the dry weight (g L-1
, means ± SD, n = 3) of the C. reinhardtii cultures grown at 2.0% CO2 (a) 549
and 5.0% CO2 (b). 550

28
7.5 / 10 / 0
.2
7.5 / 10 / 0
.9
7.5 / 20 / 0
.2
7.5 / 20 / 0
.9
17.5 / 10 / 0
.2
17.5 / 10 / 0
.9
17.5 / 20 / 0
.2
17.5 / 20 / 0
.9
Sta
rch c
on
ten
t (%
of
DW
)
0
5
10
15
20
25
30
35
40
4567 h
96 h
7.5 / 10 / 0
.2
7.5 / 10 / 0
.9
7.5 / 20 / 0
.2
7.5 / 20 / 0
.9
17.5 / 10 / 0
.2
17.5 / 10 / 0
.9
17.5 / 20 / 0
.2
17.5 / 20 / 0
.9
Sta
rch c
on
ten
t (%
of
DW
)
0
5
10
15
20
25
30
35
40
45
a
b
551
Figure 4. Effect of the different nutrient treatments (NH4/PO4/SO4 concentrations in mM) on 552
the starch content (% of dry weight (DW), means ± SD, n = 3) of the C. reinhardtii cultures 553
grown at 2.0% CO2 (a) and 5.0% CO2 (b). 554
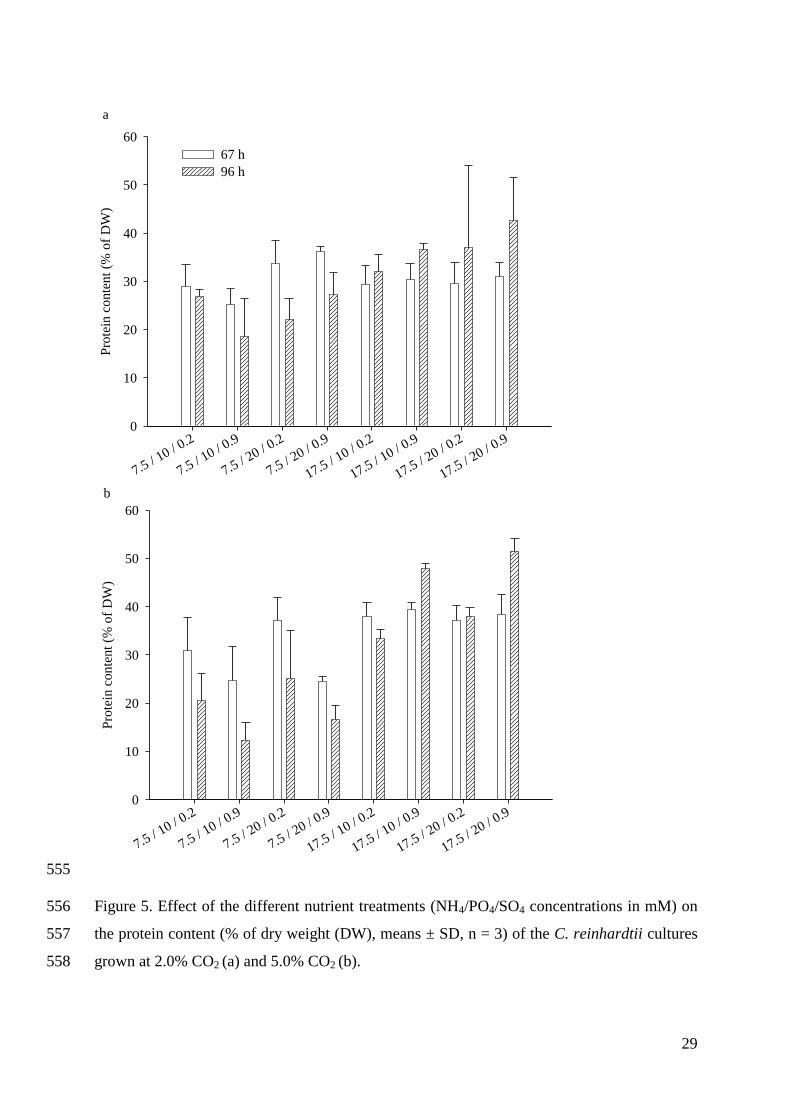
29
7.5 / 10 / 0
.2
7.5 / 10 / 0
.9
7.5 / 20 / 0
.2
7.5 / 20 / 0
.9
17.5 / 10 / 0
.2
17.5 / 10 / 0
.9
17.5 / 20 / 0
.2
17.5 / 20 / 0
.9
Pro
tein
co
nte
nt
(% o
f D
W)
0
10
20
30
40
50
60
67 h
96 h
7.5 / 10 / 0
.2
7.5 / 10 / 0
.9
7.5 / 20 / 0
.2
7.5 / 20 / 0
.9
17.5 / 10 / 0
.2
17.5 / 10 / 0
.9
17.5 / 20 / 0
.2
17.5 / 20 / 0
.9
Pro
tein
co
nte
nt
(% o
f D
W)
0
10
20
30
40
50
60
a
b
555
Figure 5. Effect of the different nutrient treatments (NH4/PO4/SO4 concentrations in mM) on 556
the protein content (% of dry weight (DW), means ± SD, n = 3) of the C. reinhardtii cultures 557
grown at 2.0% CO2 (a) and 5.0% CO2 (b). 558

30
Protein content (% of DW)
0 10 20 30 40 50 60
Sta
rch
co
nte
nt
(% o
f D
W)
0
5
10
15
20
25
30
35
40
45
Protein (% of DW)
0 10 20 30 40 50 60
Sta
rch
(%
of
DW
)
0
5
10
15
20
25
30
35
40
45
a
b
Starch (% of DW) = 31.1 - 0.64 * Protein (% of DW)
R2 = 0.42
Starch (% of DW) = 45.6 - 0.75 * Protein (% of DW)
R2 = 0.63
559
Figure 6. Relationship between starch and protein contents (% of dry weight (DW)) in C. 560
reinhardtii cultures after 67 h (a) and 96 h (b) of growth. 561

31
7.5 / 10 / 0
.2
7.5 / 10 / 0
.9
7.5 / 20 / 0
.2
7.5 / 20 / 0
.9
17.5 / 10 / 0
.2
17.5 / 10 / 0
.9
17.5 / 20 / 0
.2
17.5 / 20 / 0
.9
Tota
l ch
loro
ph
yll
(%
of
DW
)
0.0
0.5
1.0
1.5
2.0
2.5
3.0
3.5
4.067 h
96 h
7.5 / 10 / 0
.2
7.5 / 10 / 0
.9
7.5 / 20 / 0
.2
7.5 / 20 / 0
.9
17.5 / 10 / 0
.2
17.5 / 10 / 0
.9
17.5 / 20 / 0
.2
17.5 / 20 / 0
.9
Tota
l ch
loro
ph
yll
(%
of
DW
)
0.0
0.5
1.0
1.5
2.0
2.5
3.0
3.5
4.0
a
b
562
Figure 7. Effect of the different nutrient treatments (NH4/PO4/SO4 concentrations in mM) on 563
the total chlorophyll (a + b) content (% of dry weight (DW), means ± SD, n = 3) of the C. 564
reinhardtii cultures grown at 2.0% CO2 (a) and 5.0% CO2 (b). 565

32
7.5 / 10 / 0
.2
7.5 / 10 / 0
.9
7.5 / 20 / 0
.2
7.5 / 20 / 0
.9
17.5 / 10 / 0
.2
17.5 / 10 / 0
.9
17.5 / 20 / 0
.2
17.5 / 20 / 0
.9
Chlo
rop
hyll
a/b
1.5
1.6
1.7
1.8
1.9
2.0
2.1
2.2
67 h
96 h
7.5 / 10 / 0
.2
7.5 / 10 / 0
.9
7.5 / 20 / 0
.2
7.5 / 20 / 0
.9
17.5 / 10 / 0
.2
17.5 / 10 / 0
.9
17.5 / 20 / 0
.2
17.5 / 20 / 0
.9
Chlo
rop
hyll
a/b
1.5
1.6
1.7
1.8
1.9
2.0
2.1
2.2
a
b
566
Figure 8. Effect of the different nutrient treatments (NH4/PO4/SO4 concentrations in mM) on 567
the chlorophyll a/b ratio (mean ± SD, n = 3) in the C. reinhardtii cultures grown at 2.0% CO2 568
(a) and 5.0% CO2 (b). 569
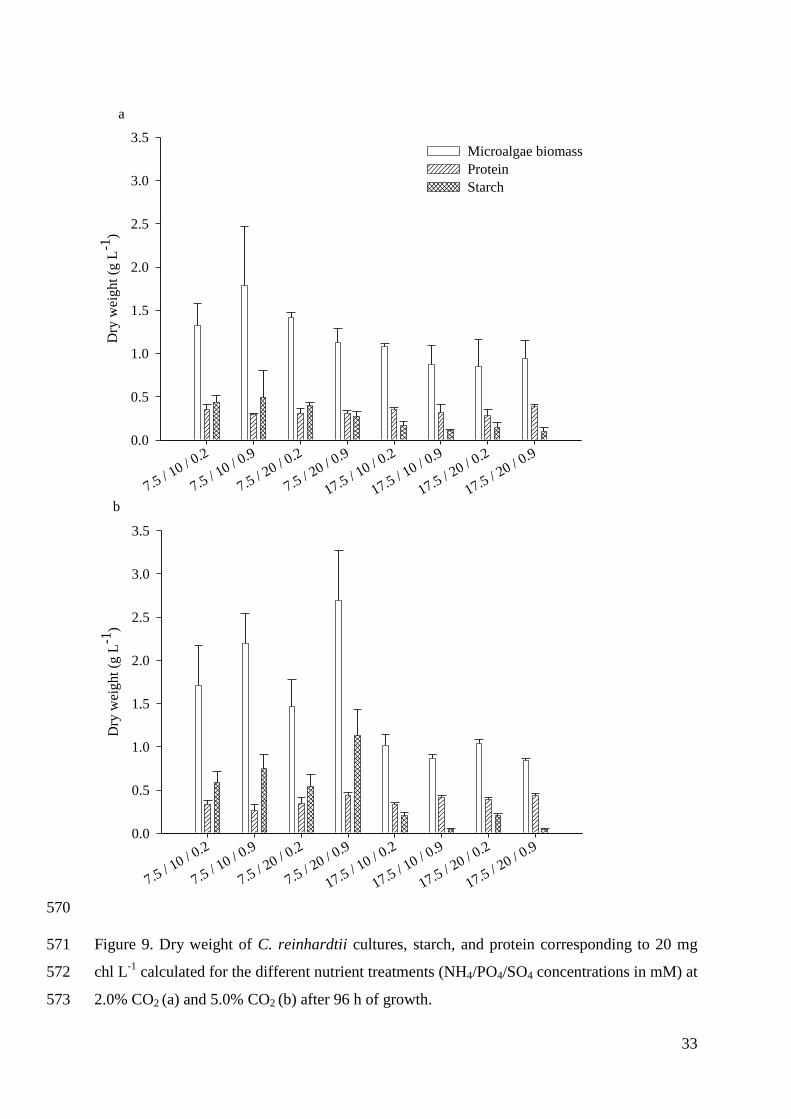
33
7.5 / 10 / 0
.2
7.5 / 10 / 0
.9
7.5 / 20 / 0
.2
7.5 / 20 / 0
.9
17.5 / 10 / 0
.2
17.5 / 10 / 0
.9
17.5 / 20 / 0
.2
17.5 / 20 / 0
.9
Dry
wei
gh
t (g
L-1
)
0.0
0.5
1.0
1.5
2.0
2.5
3.0
3.5
7.5 / 10 / 0
.2
7.5 / 10 / 0
.9
7.5 / 20 / 0
.2
7.5 / 20 / 0
.9
17.5 / 10 / 0
.2
17.5 / 10 / 0
.9
17.5 / 20 / 0
.2
17.5 / 20 / 0
.9
Dry
wei
gh
t (g
L-1
)
0.0
0.5
1.0
1.5
2.0
2.5
3.0
3.5
Microalgae biomass
Protein
Starch
a
b
570
Figure 9. Dry weight of C. reinhardtii cultures, starch, and protein corresponding to 20 mg 571
chl L-1
calculated for the different nutrient treatments (NH4/PO4/SO4 concentrations in mM) at 572
2.0% CO2 (a) and 5.0% CO2 (b) after 96 h of growth. 573
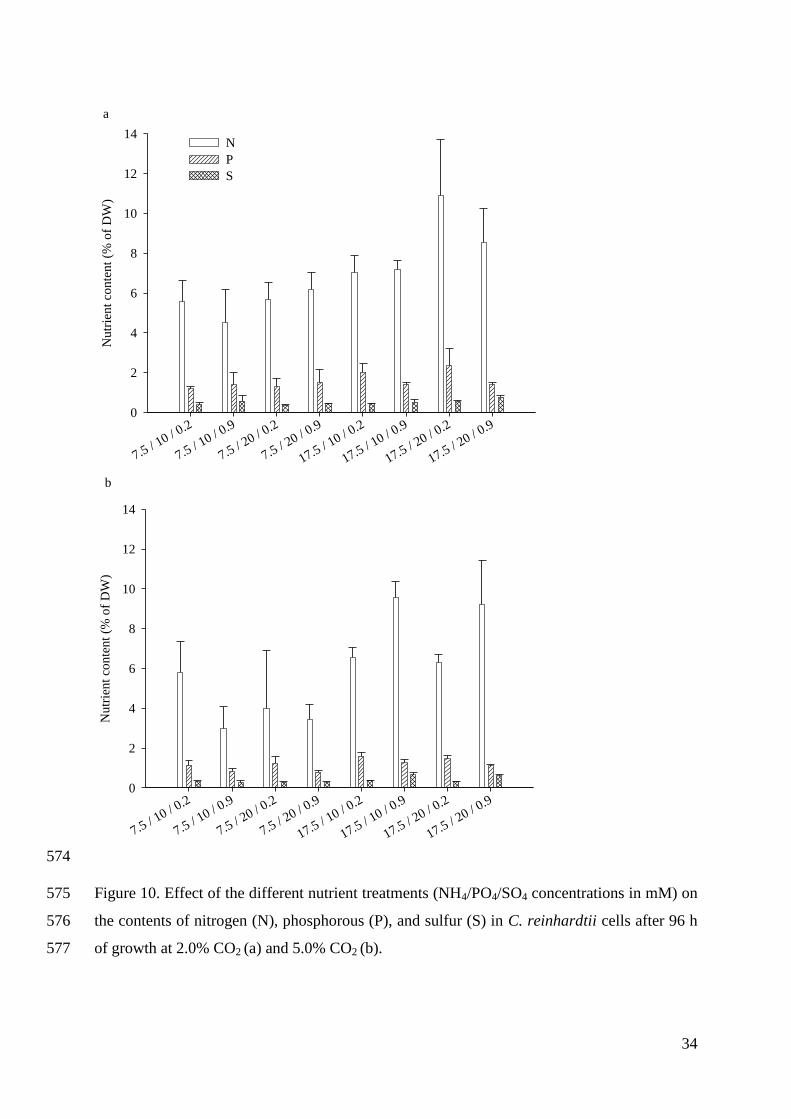
34
7.5 / 10 / 0
.2
7.5 / 10 / 0
.9
7.5 / 20 / 0
.2
7.5 / 20 / 0
.9
17.5 / 10 / 0
.2
17.5 / 10 / 0
.9
17.5 / 20 / 0
.2
17.5 / 20 / 0
.9
Nu
trie
nt
con
ten
t (%
of
DW
)
0
2
4
6
8
10
12
14
7.5 / 10 / 0
.2
7.5 / 10 / 0
.9
7.5 / 20 / 0
.2
7.5 / 20 / 0
.9
17.5 / 10 / 0
.2
17.5 / 10 / 0
.9
17.5 / 20 / 0
.2
17.5 / 20 / 0
.9
Nu
trie
nt
con
ten
t (%
of
DW
)
0
2
4
6
8
10
12
14
N
P
S
a
b
574
Figure 10. Effect of the different nutrient treatments (NH4/PO4/SO4 concentrations in mM) on 575
the contents of nitrogen (N), phosphorous (P), and sulfur (S) in C. reinhardtii cells after 96 h 576
of growth at 2.0% CO2 (a) and 5.0% CO2 (b). 577

35
7.5 / 10 / 0
.2
7.5 / 10 / 0
.9
7.5 / 20 / 0
.2
7.5 / 20 / 0
.9
17.5 / 10 / 0
.2
17.5 / 10 / 0
.9
17.5 / 20 / 0
.2
17.5 / 20 / 0
.9
Res
idu
al n
itro
gen
co
nce
ntr
atio
n (
mM
)
0
2
4
6
8
10
12
14
16
7.5 / 10 / 0
.2
7.5 / 10 / 0
.9
7.5 / 20 / 0
.2
7.5 / 20 / 0
.9
17.5 / 10 / 0
.2
17.5 / 10 / 0
.9
17.5 / 20 / 0
.2
17.5 / 20 / 0
.9
Res
idu
al s
ulf
ur
con
cen
trat
ion
(m
M)
0.0
0.2
0.4
0.6
0.8
1.0
2.0% CO2
5.0% CO2
a
b
578
Figure 11. Effect of the different nutrient treatments (NH4/PO4/SO4 concentrations in mM) on 579
the residual nitrogen (a) and sulfur (b) concentrations (mM, mean ± SD, n = 3) in the medium 580
after 96 h of growth of C. reinhardtii cultures at 2.0 and 5.0% CO2. 581


Paper II


1
Modeling the effects of nutrient concentrations on the photoautotrophic 1
growth and biochemical composition of Chlamydomonas reinhardtii 2
Daria Markina*, Hans Ragnar Gislerød 3
Department of Plant Sciences, Norwegian University of Life Sciences, P. O. Box 5003, 1432 4
Ås, Norway 5
*Corresponding author, e-mail: [email protected], [email protected], tel.: (+47) 6
64 96 61 38, fax: (+47) 64 96 56 15 7
Manuscript9
2
Abstract 10
The green microalga Chlamydomonas reinhardtii is able to produce hydrogen under 11
anaerobic conditions. The production depends on the biomass concentration and starch, 12
protein, and chlorophyll contents of the cultures. The aim of the present study was to model 13
the effects of ammonium, phosphate, and sulfate in the growth medium, and of carbon 14
dioxide in the gas bubbled into the culture, on the photoautotrophic growth and biochemical 15
composition of C. reinhardtii batch cultures. A central composite design, with five levels of 16
each variable, was used to combine the different concentrations of nutrients. Our models 17
predicted maximum productivity of 0.87 g L-1
d-1
with 5.0 mM NH4, 0.65 mM SO4, and 6.0% 18
CO2, maximum starch content of 55% of dry weight with 5.0 mM NH4, 22.5 mM PO4, 0.1 19
mM SO4, and 6.0% CO2 and 65% of dry weight for maximum protein content with 20.0 mM 20
NH4, 22.5 mM PO4, 1.0 mM SO4, and 4.4% CO2. These predictions were confirmed by the 21
model validation experiments. The results of this modeling make it possible to produce 22
microalgae with a well-defined biochemical composition for studying the process of 23
hydrogen production. 24
Key-words 25
Chlorophyll, modeling, nutrients, photoautotrophic growth, protein, starch. 26
3
Introduction 27
Cultures of Chlamydomonas reinhardtii with high biomass are required for 28
biohydrogen production (Tamburic et al. 2011). The starch and protein contents of the 29
cultures play a central role in the hydrogen (H2) production process, since the catabolism of 30
these two substrates contributes electrons to the hydrogenase enzyme for H2 formation 31
(Chochois et al. 2009; Melis et al. 2000; Zhang et al. 2002). In addition, products of starch 32
catabolism are substrates for mitochondrial respiration, and they therefore help to maintain 33
the anaerobiosis of the culture that is necessary for the function of the hydrogenase enzyme 34
(Kosourov et al. 2003; Zhang et al. 2002). Hahn et al. (2004) found that, at 20 µg chlorophyll 35
mL-1
, H2 production attained its maximum value and the yield was independent of increasing 36
chlorophyll concentration. Usually, C. reinhardtii is grown mixotrophically on acetate as an 37
organic carbon source for the purpose of H2 production. However, this has been shown not to 38
be necessary (Fouchard et al. 2005; Tolstygina et al. 2009; Tsygankov et al. 2006). We chose 39
therefore to use photoautotrophic cultures in this study, since this makes more sense from the 40
energy conversion point of view. 41
The nutrient status of the microalgae affects their photosynthesis (Falkowski and 42
Raven 2007) and, consequently, their growth rate, biomass yield (Richmond 2004), and 43
biochemical composition (Grossman 2000; Richmond 2004). The synthesis of many essential 44
cellular components, such as proteins and pigments, requires other nutrients than carbon, 45
hydrogen, and oxygen (Falkowski and Raven 2007). Nitrogen, phosphorous, and sulfur are 46
structural constituents of a number of cellular components. The uptake and assimilation of 47
these elements is closely associated with carbon fixation. A balance must exist between the 48
main macronutrients and carbon, so that these macronutrients are incorporated into carbon 49
skeletons in an equilibrated manner (Grossman and Takahashi 2001). When all the required 50
nutrients are provided in excess, microalgae grow in a balanced way and display a uniform 51
chemical and biochemical composition (Goldman 1980). 52
When the supply rate of one of the nutrient elements is lower than required for the 53
maximum biosynthetic capacity of the cell, that element becomes limiting for growth (Bailey 54
and Ollis 1986; Falkowski and Raven 2007). Growth of nutrient-limited populations slows 55
down before total exhaustion of a nutrient (Bailey and Ollis 1986). Several biochemical 56
processes are then affected. Photosynthetic and respiratory processes, as well as protein and 57

4
pigments synthesis, are reduced (Collier and Grossman 1992; Fogg 1956; Gordillo et al. 58
1999; Guo et al. 2014; Ji et al. 2011; Kilham et al. 1997; Klok et al. 2013; Kolber et al. 1988; 59
Lee et al. 2012; Lynn et al. 2000; Morris et al. 1974; Richardson et al. 1969; Siaut et al. 2011; 60
Turpin 1991; Wykoff et al. 1998). Under these conditions, the cells experience an energy 61
imbalance: the energy required for growth becomes lower than the energy supplied through 62
photosynthesis (Klok et al. 2013; Richmond 2004). This leads to over-reduction of the 63
photosynthetic machinery and formation of oxygen-reactive species (Klok et al. 2013; 64
Ledford and Niyogi 2005). Under these conditions, microalgae dissipate the excess energy as 65
heat and fluorescence (Kolber et al. 1988). The accumulation of highly reduced compounds, 66
such as lipids and carbohydrates, that do not contain the limiting nutrient serves as a sink for 67
the assimilated carbon and as an alternative sink for the excess energy (Ball et al. 1990; 68
Branyikova et al. 2010; Guo et al. 2014; Ji et al. 2011; Klok et al. 2013; Siaut et al. 2011; 69
Wykoff et al. 1998). This allows the cell to continue to harvest light energy, while at the same 70
time it reduces the formation of damaging reactive oxygen species (Klok et al. 2013). The 71
accumulation of lipids and carbohydrates is therefore not necessarily coupled to a complete 72
halt in growth as is often suggested (Ball et al. 1990; Branyikova et al. 2010; Guo et al. 2014; 73
Ji et al. 2011; Siaut et al. 2011; Yao et al. 2012). Klok et al. (2013) postulated that, if an 74
energy imbalance is created by reducing the nutrient supply to the cells, cell division 75
continues at the same time as lipids or carbohydrates accumulate, as they do in the classic 76
nutrient depletion experiments. 77
The development of an optimal medium for cultivation is specific to each species and 78
to each intended product (Mata et al. 2010). Medium formulation studies are usually time-79
consuming and expensive. Central composite design is a powerful statistical tool used to 80
model the relationships between a set of controllable experimental factors and observed 81
responses. It has therefore been frequently applied to improve the productivity and yield of 82
the desired product of various microalgal cultures (Burrows et al. 2008; Gong and Chen 83
1998; Hong and Lee 2008; Jeong et al. 2008; Nuutila et al. 1997; Wen and Chen 2001). The 84
advantages of this experimental procedure include its ability to identify interaction effects 85
between studied factors and that it reduces the number of experimental runs compared to ‘one 86
factor at a time’ experiments. It produces second-order response surfaces that can be used in 87
an optimization procedure. 88
5
The aim of this study was to model the responses of photoautotrophic batch cultures 89
of C. reinhardtii to different combinations of nutrient concentrations in the growth medium 90
and CO2 in the bubbled gas. This was done with the goal of improving the growth conditions 91
in order to obtain maximum biomass and desirable biochemical composition for further H2 92
production. In a previous study, we investigated the effects of two concentrations of CO2 (2.0 93
and 5.0%), NH4 (7.5 and 17.5 mM), SO4 (0.2 and 0.9 mM), and PO4 (10.0 and 20.0 mM) on 94
the contents of starch, protein, and chlorophyll in addition to the growth of photoautotrophic 95
batch cultures of C. reinhardtii (Markina et al., submitted). Two concentrations of phosphate 96
were used to avoid acidification of the cultures, and they were therefore much higher than the 97
phosphate concentration required for growth of this microalga. A central composite design 98
was used in the present study and the number of treatments was extended, with eight axial 99
points and one central point. The experiments were divided into blocks and carried out 100
successively over a seven-week period according to the CO2 concentration. The possible 101
effects of this blocking on the detection of interactions among the studied factors will be 102
discussed. The productivity of the cultures, total biomass, starch, protein, and chlorophyll 103
contents of the cultures were used as response parameters. The statistical models generated 104
were used to optimize these parameters. Model validation experiments were carried out in 105
order to confirm the predicted responses. 106

6
Materials and methods 107
Organism and culture conditions 108
The Chlamydomonas reinhardtii 137c strain was obtained from the NIVA culture 109
collection, Norway (CHL153). The microalgae were stored in sterile conditions on a 1.5% 110
agar Tris-Acetate-Phosphate (TAP) (Gorman and Levine 1965) solid growth medium 111
(Andersen 2005) on Petri dishes at room temperature and low light intensity. The microalgae 112
were pre-cultured in liquid High-Salt Sueoka (HS) medium (Sueoka 1960) at 25 °C and 113
continuously illuminated by cool white fluorescent tubes (Philips Master TLD 36W/840 114
Reflex, Eindhoven, the Netherlands) at a photon flux density (PFD) of 200 µmol m-2
s-1
. 115
Experimental setup 116
This work was based on an extension of previously obtained results (Markina et al., 117
submitted). In the present study, the number of treatments was extended from a 24
full 118
factorial design to a central composite design with eight axial points and one central point 119
(Table 1). 120
Sterile batch cultures of C. reinhardtii cells were carried out in bubble column Pyrex 121
glass tubular (coned at the bottom) photobioreactors (PBRs) with an inner diameter of 3.5 cm 122
and a total volume capacity of 380 mL. The temperature was maintained at 25.0 ± 0.5 °C 123
using water baths in aquaria. Cool white fluorescent tubes were used to provide continuous 124
illumination at a PFD of 200 µmol m-2
s-1
. The light was measures using a LI-COR model LI-125
190SA instrument (LI-COR, Lincoln, NE, USA) with a quantum sensor (400 – 700 nm) 126
inside an empty PBR immersed in the water-bath aquarium, and the average PFD over the 127
height of the PBR was estimated. Filtered (Acro 37 TF Vent Device, 0.2 µm PTFE 128
membrane, PALL Life Sciences, Port Washington, NY, USA) air containing CO2 at a 129
concentration (% v/v) in accordance with the experimental design (Table 1) was injected into 130
the bottom of the PBRs, allowing mixing by bubbling (the bubble size was approximately 3 131
mm). The concentration of the dissolved CO2 in three parallel PBRs containing 300 mL of 132
HS medium was measured for each CO2 concentration bubbled into the PBRs (eight points in 133
the 0.04 – 9% range) after a stabilizing period of three hours, using hand-held titration cells 134
for titrimetric analysis (CHEMetrics Inc., Midland, VA, USA). The linear regression curve 135
(order 2) between the CO2 concentration in the bubbled gas and the concentration of 136
dissolved CO2 was highly correlated (R2
adj = 0.955) and followed the function y = – 4.2 x2 + 137

7
73 x + 108, where y = dissolved CO2 concentration in the medium (mg L-1
), x = CO2 138
concentration in the bubbled gas (% v/v) (Markina et al., submitted). 139
The experimental media were based on the HS medium (9.35 mM NH4, 13.6 mM 140
PO4, and 0.182 mM SO4), with varying concentrations of NH4Cl, PO4KH2/PO4K2H, and 141
K2SO4 as shown in Table 1. Each treatment was carried out in three parallels, and the 142
experiments were carried out successively, divided into batches according to the 143
concentration of CO2 in the bubbled gas. PO4KH2/PO4K2H was used as a pH buffer to avoid 144
acidification of the cultures. The concentration of PO4 used in these experiments (7.5 – 22.5 145
mM) therefore greatly exceeded the microalgal requirement for this nutrient. The initial pH of 146
the media was adjusted to 7.5 with 1 M NaOH prior to sterilization by autoclaving. NaHCO3 147
was used in the medium as an additional pH buffer at a concentration of 2 mM per percent 148
CO2 in the bubbled gas. At the start of experiments (t = 0 h), cells from pre-grown cultures at 149
the linear growth phase were inoculated into 300 mL of medium at a cell density of 104
cells 150
mL-1
. The cells were counted under a microscope, using a Fuchs-Rosenthal counting 151
chamber. The experiments were carried out over a seven-week period. 152
Model validation experiments were performed in three parallel PBRs with the same 153
light and temperature conditions as previously. Nutrient concentrations in the model 154
validation experiments corresponded to the optimum concentrations predicted by the different 155
models. 156
Samples for dry weight determination and biochemical analyses were collected at 157
three time points: t1 = 43 h, t2 = 67 h, and t3 = 96 h (120 h for 1.0% CO2 treatments because 158
of slower growth). The pH of the cultures was monitored throughout the experiments. 159
Biomass determination 160
To collect the biomass, 0.3 – 2.0 mL of microalgal culture was filtered through pre-161
washed GF/F glass microfiber filters (0.7 µm pore size, 25 mm diameter, GE Healthcare, 162
Whatman, UK) dried at 103.5 °C. The filters containing biomass were then washed with 30 163
mL deionized water to remove adhering salts, and thereafter dried for 4 h at 103.5 °C. The 164
DW (g L-1
) of the sample was calculated by subtracting the DW of the empty filter from the 165
DW of the filter with biomass. It was normalized to the culture volume filtered. The 166
8
productivity (P) of the cultures (g L-1
d-1
) was calculated using formula (1), where DW1 (2) is 167
the DW determined at time t1 (2) (in days). 168
(1) 169
Chlorophyll assay 170
Chlorophyll was extracted from 1-2 mL samples using 95% ethanol and assayed using 171
the described method (Harris 1989). The chlorophyll concentration was determined by optical 172
density (OD) measurements (Heλios α, Thermo Fisher Scientific, Waltham, MA, USA) at λ = 173
649 nm and λ = 665 nm. 174
Starch assay 175
Cell pellets of 2 mL samples left after chlorophyll assay were used for starch assay. 176
The Megazyme total starch (the amyloglucosidase/α-amylase method) assay kit (K-TSTA, 177
Megazyme International, Bray, Ireland) procedure was adapted to a small sample volume. 20 178
µL of 80% ethanol was added to the cell pellet and the pellet was dispersed using a vortex 179
mixer. Cells were disrupted by adding 0.2 mL of DMSO (Sigma-Aldrich, St. Louis, MO, 180
USA) and 0.5 mL of 0.5 mm glass beads (Cell disruption media, SI-BG05, Scientific 181
Industries Inc., New York, NY, USA) to the samples and shaking them on a mixer mill 182
(MM301, Retsch, Haan, Germany) at 30 Hz frequency for 10 min. Samples were heated on 183
thermos-shakers (TS-100, Biosan, Riga, Latvia) to 100 °C for 5 min for starch solubilization. 184
Then, 0.3 mL of α-amylase (diluted 1:30 according to the Megazyme starch assay kit 185
specifications) was added to the samples and the tubes incubated at 100 °C for 12 min. The 186
contents of the tubes were mixed vigorously after 0, 4, 8, and 12 min. The tubes were placed 187
at 50 °C and 0.4 mL of sodium acetate buffer (200 mM, pH 4.5) was added to the samples, 188
followed by 10 µL of amyloglucosidase (20U). The samples were thoroughly mixed and 189
incubated at 50 °C for 30 min. Then, 70 µL of distilled water was added to the samples in 190
order to adjust the total sample volume to 1.0 mL. The contents of the tubes were mixed 191
thoroughly and centrifuged at 20800 x g (Eppendorf centrifuge 5417R, Eppendorf, Hamburg, 192
Germany) for 10 min at 20 °C. Then, 33.4 µL of the supernatant was added to 1 mL GOPOD 193
reagent and incubated at 50 °C for 20 min. The same procedure was used for two reagent 194
blanks (33.4 µL distilled water) and four glucose controls (33.4 µL D-glucose standard 195
solution at 1 mg mL-1
). The OD of each sample and of the glucose controls was measured at 196

9
λ = 510 nm against the reagent blank. Starch concentration was calculated as the percentage 197
of DW of the samples according to the formula supplied in the Megazyme starch assay kit. 198
Protein assay 199
Cell pellets of 1 mL samples left after chlorophyll assay were used for protein assay. 200
The cells were disrupted using 0.5 mL of 0.5 mm glass beads (Cell disruption media, SI-201
BG05, Scientific Industries Inc., New York, NY, USA) and shaken on a mixer mill (MM301, 202
Retsch, Haan, Germany) for 10 min at 30 Hz frequency. Then, Tris-HCl solubilization buffer 203
(50 mM, pH 8.3) containing 1% Triton was used to solubilize the proteins. The Lowry 204
method (1951) was applied using the Bio-Rad DC protein microplate assay kit II (#500-0112, 205
Bio-Rad, Hercules, CA, USA) to determine protein concentration in the samples. The OD (λ 206
= 750 nm) of the samples assayed on a microplate (CellBIND surface, Costar 3300, Corning 207
Incorporated, Corning, NY, USA) was measured using a microplate spectrophotometer (Asys 208
UVM340, Biochrom, Cambridge, UK) and Kim software (Kim32, 2004, Asys Hitech GmbH, 209
Cambridge, UK). A BSA standard curve (8 points in the 0.0 - 0.75 mg mL-1
range) was used 210
to calculate the protein concentration in the samples. The protein concentration was 211
normalized to the DW of the culture and calculated as the percentage of DW. 212
Element analysis 213
A 15 mL sample of C. reinhardtii was collected at the beginning of the stationary 214
growth phase (t3) and centrifuged for 10 min at 3220 x g (Eppendorf centrifuge 5810, 215
Eppendorf, Hamburg, Germany), and the supernatant discarded. The cell pellet was washed 216
twice with deionized water and frozen at -20 °C until analysis. The Norwegian standard 217
method, NS 4743, was used to measure total nitrogen. Total phosphorous and sulfur were 218
analyzed using an Inductively Coupled Plasma Optical Emission Spectrometer, ICP (Optima 219
5300 DV, Perkin Elmer, Waltham, MA, USA), after the addition of HNO3 to 10% v/v and 220
decomposition by ultraclave (ultraClave III, Milestone, Sorisole, Italy) at 250 °C for 1.5 h. 221
Statistical analysis 222
Three macronutrients were selected as studied variables: NH4, PO4, and SO4 in 223
addition to the percentage of CO2 bubbled into the cultures. Central composite design was 224
used to model the effects of the studied variables on the photoautotrophic growth and 225
biochemical composition of C. reinhardtii. The design matrix was a 24 full factorial design 226
10
with a central point and eight axial points. A total of 25 treatments, with each treatment 227
carried out in three parallels, were performed, with five levels of each variable. The coded 228
levels of the variables and their real values are shown in Table 1. The responses were 229
modeled using the second-order equation: 230
(2) 231
where ŷ is the estimated response, k is the number of variables (k = 4, concentrations of NH4, 232
PO4, SO4, and percentage CO2, in this study), β0, βi, βii, and βij are the intercept, linear, 233
quadratic, and interaction coefficients, respectively, and ε is the random error. 234
The results were analyzed using the analysis of variance (ANOVA) method and 235
regression analysis, which gives the regression equation of the estimated response as a 236
function of the studied variables. First, a full quadratic model of equation 2 was fitted to the 237
data. Then, the model was progressively reduced by backward elimination, discarding the 238
terms with a p-value > 0.1. The residuals of the models, which compared the predicted values 239
with the experimental response, were randomly distributed without any pattern, showing 240
constant variance, normality and independence. The models were evaluated using the p-value 241
of the regression coefficients (α = 10%) and the lack of fit test (α = 1%). The statistical 242
analyses were performed using MINITAB software (V16, Minitab Inc., State College, PA, 243
USA). 244

11
Results 245
pH 246
The pH of the cultures decreased throughout the experimental period (0 - 96 h) and 247
with the growth of the microalgae (Markina et al., submitted). The pH at the end of the 248
experiments (after 96 h of growth) ranged from 5.7 in treatment 20 (17.5 mM NH4, 10.0 mM 249
PO4, 0.9 mM SO4, and 2.0% CO2) to 7.1 in treatment 25 (7.5 mM NH4, 20.0 mM PO4, 0.9 250
mM SO4, and 2.0% CO2). Phosphate concentration in the medium was the factor that had the 251
largest influence on the pH after 96 h of growth. The pH increased with the increase in 252
phosphate concentration (Figure 1a). The concentration of ammonium and sulfate had the 253
opposite effect on the pH of the cultures (Figure 1a). 254
Productivity 255
The productivity of the cultures between 43 and 67 h of growth varied between 0.32 g 256
L-1
d-1
in treatment 10 (12.5 mM NH4, 15.0 mM PO4, 0.55 mM SO4, and 1.0% CO2) and 0.87 257
g L-1
d-1
in treatment 9 (12.5 mM NH4, 15.0 mM PO4, 0.55 mM SO4, and 6.0% CO2). Carbon 258
dioxide concentration had the largest positive effect on productivity compared to the other 259
studied variables (Figure 1b). 260
The regression equation obtained after the analysis of variance (ANOVA) gave the 261
estimated productivity as a function of the studied variables. First, a full quadratic model 262
(equation 2) was fitted to the data. Then, the model was reduced by backward elimination, 263
discarding the terms with a p-value > 0.1. Table 2 shows the retained terms after backward 264
elimination was completed. The p-value of the variables of the model calculated by ANOVA 265
gives the significance of each term in the model. The estimated regression coefficients of the 266
variables, using data in uncoded units, correspond to the β-coefficients in the model of 267
equation 2. The concentration of phosphate did not influence the productivity of the cultures 268
in the studied range, since the p-value of all the terms including PO4 was higher than 0.1. The 269
quadratic terms of sulfate and carbon dioxide concentrations were significant (p < 0.01). A 270
significant negative interaction effect (p < 0.05) on the biomass productivity was observed 271
between ammonium and carbon dioxide concentrations. The productivity increased with 272
increasing CO2 concentration in the bubbled gas and with decreasing ammonium 273
concentration in the growth medium (Figure 2a). 274
12
This model was used to determine the optimal values of the studied variables that 275
would give the highest productivity. The solution of the optimization procedure gave the 276
following optimal values for the studied variables: 5.0 mM NH4, 0.65 mM SO4, and 6.0% 277
CO2, and it predicted a productivity of 0.87 g L-1
d-1
for these values. Figure 2a shows the 278
contour plot of the response surface of productivity using the fitted model and holding the 279
sulfate concentration constant at its optimum value of 0.65 mM. The area of maximum 280
productivity is located in the top-left corner of the plot, corresponding to high carbon dioxide 281
and low ammonium concentrations (Figure 2a). To validate the results of the optimization 282
procedure, microalgae were grown in the predicted optimal concentrations of the nutrients 283
(5.0 mM NH4, 0.65 mM SO4, and 6.0% CO2. 7.5 mM PO4 were used for this experiment). 284
The measured productivity was 0.86 ± 0.06 g L-1
d-1
(mean ± SD, n = 3) (Figure 5a), which 285
did not differ significantly (p > 0.1, one sample t-test) from the predicted maximum 286
productivity of 0.87 g L-1
d-1
. 287
Biomass yield 288
The biomass of the cultures after 96 h of growth varied between 0.74 g L-1
in 289
treatment 5 (7.5 mM NH4, 20.0 mM PO4, 0.2 mM SO4, and 5.0% CO2) and 1.57 g L-1
in 290
treatment 14 (12.5 mM NH4, 7.5 mM PO4, 0.55 mM SO4, and 3.5% CO2). Concentrations of 291
carbon dioxide, phosphate, and sulfate had a significant effect on the total biomass of the 292
cultures (Figure 1c). 293
Table 2 shows the terms retained in the final model for the estimated biomass attained 294
after 96 h of growth as a function of concentrations of ammonium, phosphate, sulfate, and 295
carbon dioxide. All the studied variables were significant (p < 0.01), as were their quadratic 296
terms (p < 0.1 for x12, p < 0.001 for x2
2, x3
2, and x4
2) (Table 2). Significant positive interaction 297
effects on the attained biomass were observed between ammonium and sulfate concentrations 298
(p < 0.001), ammonium and carbon dioxide concentrations (p < 0.01), and also between 299
phosphate and sulfate concentrations (p < 0.01) (Table 2). 300
This model was used to determine the optimal values of the studied variables that 301
would yield the maximum biomass of the cultures at 96 h of growth. The optimization 302
procedure gave the following values for the studied variables: 20.0 mM NH4, 7.5 mM PO4, 303
0.66 mM SO4, and 4.5% CO2, and it predicted a maximum biomass of 1.66 g L-1
for these 304
values (Figure 2b). A model validation experiment was carried out with these nutrient 305

13
concentrations. The measured biomass after 96 h of growth was 1.26 ± 0.01 g L-1
(mean ± 306
SD, n = 3) (Figure 5b). This was 24% lower than predicted by the model. 307
Starch content 308
The concentration of ammonium was the factor that mainly affected the starch content 309
of the cultures after 96 h of growth, and the starch content increased with decreasing 310
ammonium concentration (Figure 3a). The maximum measured starch content was 42% of 311
DW in treatment 5 (7.5 mM NH4, 20.0 mM PO4, 0.2 mM SO4, and 5.0% CO2), which 312
corresponds to low concentrations in ammonium and sulfate, but high amounts of phosphate 313
and carbon dioxide. The productivity in this treatment was 0.55 g L-1
d-1
, and the total 314
biomass after 96 h of growth, when the sample for starch was collected, was 0.74 g L-1
, the 315
lowest measured in this study. The microalgae in treatment 13 (20.0 mM NH4, 15.0 mM PO4, 316
0.55 mM SO4, and 3.5% CO2) did not accumulate starch (3% of DW). This treatment 317
corresponds to the highest ammonium concentration tested. 318
Table 2 shows the terms retained for the starch content model after completing the 319
backward elimination procedure. The phosphate concentration term was not significant 320
according to ANOVA, but the interaction effect between phosphate and carbon dioxide 321
concentrations was significant (p < 0.05), so the phosphate concentration term was included 322
in the model (Table 2). The quadratic term of the sulfate concentration was significant (p < 323
0.001) (Table 2). Significant negative interaction effects were detected between the 324
concentrations of ammonium and sulfate (p < 0.001), ammonium and carbon dioxide (p < 325
0.001), and sulfate and carbon dioxide (p < 0.05) (Table 2). 326
The model used for optimization of the starch content after 96 h of growth yielded the 327
following values: 5.0 mM NH4, 22.5 mM PO4, 0.1 mM SO4, and 6.0% CO2, predicting 55% 328
of DW starch for these values (Figure 4a). This solution corresponds to the lowest 329
concentrations of ammonium and sulfate, and to the highest concentrations of phosphate and 330
carbon dioxide tested in this study (top-left corner in Figure 4a). A model validation 331
experiment with these nutrient concentrations yielded a starch content of 52 ± 3% of DW 332
(mean ± SD, n = 3) (Figure 5c). This was not significantly different from the value predicted 333
by the model (p > 0.1, one sample t-test). 334
14
Protein content 335
Ammonium concentration was the most important factor affecting the protein content 336
of the cultures at 96 h of growth, with the protein content increasing as the ammonium 337
concentration increased (Figure 3b). The maximum protein content measured in our samples 338
was 52% of DW in treatment 7 (17.5 mM NH4, 20.0 mM PO4, 0.9 mM SO4, and 5.0% CO2), 339
closely followed by treatments 3 (17.5 mM NH4, 10.0 mM PO4, 0.9 mM SO4, and 5.0% CO2) 340
and 13 (20.0 mM NH4, 15.0 mM PO4, 0.55 mM SO4, and 3.5% CO2), where 48% of DW was 341
protein. These three media corresponded to a high ammonium concentration. The minimum 342
protein content was 12.4% of DW in treatment 12 (5.0 mM NH4, 15.0 mM PO4, 0.55 mM 343
SO4, and 3.5% CO2), corresponding to the lowest ammonium concentration tested. 344
Table 2 shows the terms retained in the final model of estimated protein content in the 345
cultures after 96 h of growth as a function of concentrations of NH4, PO4, SO4, and CO2. The 346
quadratic terms of ammonium and carbon dioxide concentrations were significant (p < 347
0.001). Significant positive interaction effects (p < 0.001) were observed between the 348
concentrations of ammonium and sulfate (Figure 4b), ammonium and carbon dioxide, as well 349
as between the concentrations of phosphate and sulfate. Phosphate concentration was not 350
significant (p > 0.1) as a main effect. 351
This model was used for optimization of the protein content in the cultures after 96 h 352
of growth and gave the following values: 20.0 mM NH4, 22.5 mM PO4, 1.0 mM SO4, and 4.4 353
% CO2 and it predicted the maximum protein content of 65% of DW. Figure 4b shows the 354
contour plot of the response surface using the fitted model (Table 2) and holding the levels of 355
the studied variables not displayed in the plot at their optimal values. The maximum response 356
can be seen in the top-right corner of Figure 4b. A model validation experiment with these 357
nutrient concentrations yielded a protein content of 64 ± 2% of the DW (mean ± SD, n = 3) 358
(Figure 5d). This was not significantly different from the value predicted by the model (p > 359
0.1, one sample t-test). 360
Chlorophyll content 361
Ammonium concentration was the most influential factor in relation to the chlorophyll 362
concentration at 96 h of growth (Figure 3c). The minimum chlorophyll concentration (9 µg 363
mL-1
) was measured at the lowest ammonium concentration in treatment 12 (5.0 mM NH4, 364
15.0 mM PO4, 0.55 mM SO4, and 3.5% CO2) and the maximum chlorophyll conentration (37 365

15
µg mL-1
) was measured at high ammonium concentration in treatment 3 (17.5 mM NH4, 10.0 366
mM PO4, 0.9 mM SO4, and 5.0% CO2). Phosphate and sulfate concentrations also strongly 367
influenced the chlorophyll concentration of the cultures (Figure 3c). 368
Table 2 shows the β-coefficients of the terms retained in the model for chlorophyll 369
concentration in the cultures after 96 h of growth as a function of concentrations of NH4, PO4, 370
SO4, and CO2. All the linear and quadratic terms were significant, as well as the interaction 371
terms of ammonium and sulfate concentrations (p < 0.001), ammonium and carbon dioxide (p 372
< 0.001), phosphate and sulfate (p < 0.01), and phosphate and carbon dioxide concentrations 373
(p < 0.01). 374
Hahn et al. (2004) showed that a chlorophyll concentration of 20 µg chl mL-1
was 375
optimal for H2 production, giving the highest H2 yields. We therefore applied the 376
optimization procedure to the chlorophyll concentration model in Table 2 to obtain 20 µg chl 377
mL-1
. The predicted nutrient concentrations for 20 µg chl mL-1
were 5.0 mM NH4, 22.5 mM 378
PO4, 0.6 mM SO4, and 4.0% CO2. A model validation experiment was carried out with these 379
nutrient concentrations, and the total chlorophyll concentration of the cultures after 96 h of 380
growth was 5.5 ± 0.5 µg mL-1
(mean ± SD, n = 3) (Figure 5e). This was almost four times 381
lower than predicted by the model. 382

16
Discussion 383
The present models indicate a strong effect of CO2 concentration at an early growth 384
stage (up to 67 h after the start of experiments) and a smaller, but still significant effect of 385
CO2 concentration on the biomass attained after 96 h of growth. This is in accordance with 386
previous work on the same strain (Markina et al., submitted; Mortensen and Gislerød 2014; 387
2015). The strong effect of CO2 concentration observed in this experiment at the early stage 388
of growth could be related to the fact that the experiments were carried out successively over 389
a period of seven weeks, with a possible difference in cell vitality and with only one 390
treatment at 1.0 and 6.0% CO2. However, it is also possible that the effect of a high CO2 391
concentration could be very pronounced at an early stage of growth. Indeed, the 392
concentration of dissolved CO2 in our photobioreactors was twice as high at 6.0% CO2 in the 393
bubbled gas as it was at 1.0% (Markina et al., submitted). The difference in the availability of 394
CO2 between 1.0 and 6.0% was therefore much greater than the difference between 2.0 and 395
5.0% CO2 in the bubbled gas. In their early growth stage, the cultures might be more 396
sensitive to this difference in the availability of CO2 than denser cultures (such as after 96 h 397
of growth), which might have been limited by light or some of the nutrients in the growth 398
medium. 399
Markina et al. (submitted) showed that the concentration of ammonium was the most 400
influential on the starch content of the cultures grown at 7.5 and 17.5 mM NH4. The present 401
model confirmed this result, showing an almost linear curve, with the highest starch content 402
in the cultures grown at 5.0 mM NH4 and the lowest at 20.0 mM NH4. This is in accordance 403
with the results of Dragone et al. (2011), who found that the starch content (% of DW) was 404
enhanced by decreasing the initial concentration of the nitrogen source in photoautotrophic 405
batch cultures of Chlorella vulgaris. Similar results were obtained by Yao et al. (2012) in 406
Tetraselsmis subcordiformis cultures and by Guo et al. (2014) in Tribonema sp. Ji et al. 407
(2011) also found that T. subcordiformis cultures accumulated starch after two days of 408
nitrogen starvation. C. reinhardtii cells are also known to accumulate starch under nitrogen 409
starvation (Ball et al. 1990; Philipps et al. 2012; Siaut et al. 2011). 410
Sulfur deprivation is known to stimulate starch accumulation in several species of 411
microalgae (Ball et al. 1990; Branyikova et al. 2010). Yao et al. (2012) found that decreasing 412
sulfate concentration in the medium increased the starch content of T. subcordiformis 413

17
cultures. This was also the case in this study, although the effect of sulfate concentration on 414
the starch content of the cultures was much less than the effect of ammonium. 415
The model predicted a significant negative interaction effect between the 416
concentrations of ammonium and carbon dioxide on the starch content of the cultures, with 417
the high starch content at low ammonium and high carbon dioxide concentrations. This could 418
partly be related to the higher growth rate under high CO2 and thus to a faster reduction of the 419
nitrogen level in the growth medium. Markina et al. (submitted) showed that the level of 420
nitrogen left in the medium after 96 h of growth was 2.8 mM or higher and, even at that 421
nitrogen level, a high starch content (42% of DW) was observed in the cultures. This could be 422
explained by an energy imbalance between carbon and nitrogen metabolism (Klok et al. 423
2013). A significant negative interaction effect on the starch content of the cultures was also 424
predicted between the ammonium and sulfate concentrations, with the highest starch content 425
predicted for low ammonium concentration, at low or high sulfate concentrations, and the 426
lowest starch content predicted for high ammonium and sulfate concentrations (data not 427
shown). The same negative interaction effects were observed by Markina et al. (submitted). 428
Protein and chlorophyll content varied in the opposite direction to the starch content 429
under different growth conditions. Our models indicated that the content of both was 430
positively affected by increasing concentrations of ammonium and sulfate. This is in 431
accordance with the results by Lee et al. (2012), who found that increasing ammonium 432
concentrations increased the cellular content of protein and chlorophyll in C. reinhardtii 433
mixotrophic cultures. Protein content in Tribonema sp. displayed the same trend in the study 434
by Guo et al. (2014). Ji et al. (2011) also found that T. subcordiformis cultures starved of 435
sulfur or nitrogen showed a decreased protein content. Nitrogen starvation also reduced the 436
cellular chlorophyll content in C. reinhardtii cells (Siaut et al. 2011). Moreover, Collier and 437
Grossman (1992) showed that Synechococcus cells deprived of nitrogen, phosphorous, or 438
sulfur were chlorotic in comparison to nutrient-replete cells. 439
The increased phosphate concentration increased the pH of the cultures. The low pH 440
(5.9) observed at 7.5 mM PO4 was probably due to high growth at that concentration, which 441
was also reflected in the high chlorophyll concentration in the cultures. 442
18
This modeling provides mathematical tools for better understanding the physiology of 443
C. reinhardtii photoautotrophic batch cultures. The present modeling confirms to a great 444
extent the results of our previous study (Markina et al., submitted), namely that the different 445
nutrient treatments had a much greater effect on the biochemical composition of the 446
microalgae than on their growth. The maximum values of the response parameters reported in 447
this study corresponded in some cases to boundary values of the experimental range and they 448
may therefore not be the ultimate optimal values for these parameters. Moreover, the vitality 449
of the microalgae may have been different over the seven-week period of the experiments. 450
Furthermore, the maximum responses reported in this study are unique to a specific set of 451
light and temperature conditions and there is thus room for further optimization. 452
19
Acknowledgements 453
This study was financially supported by the Research Council of Norway (Project 454
203281: Use of solar energy for CO2 capture, algae cultivation and hydrogen production – 455
BioH2) and the Norwegian University of Life Sciences. We thank Leiv M. Mortensen and 456
Jorunn E. Olsen for their valuable assistance during preparation of the manuscript and Dag 457
Wenner and Silje E. Roksti for their technical assistance during the experiments.458
20
References 459
Andersen RA (ed) (2005) Algal culturing techniques., 1st edn. Elsevier Academic Press, 460
London 461
Bailey JE, Ollis DF (eds) (1986) Biochemical engineering fundamentals. McGraw-Hill, New 462
York 463
Ball SG, Dirick L, Decq A, Martiat JC, Matagne RF (1990) Physiology of starch storage in 464
the monocellular alga Chlamydomonas reinhardtii. Plant Sci 66:1-9 465
Branyikova I, Marsalkova B, Doucha J, Branyik T, Bisova K, Zachleder V, Vitova M (2010) 466
Microalgae - novel highly efficient starch producers. Biotechnol Bioeng 108:766-776 467
Burrows EH, Chaplen FWR, Ely RL (2008) Optimization of media nutrient composition for 468
increased photofermentative hydrogen production by Synechocystis sp PCC 6803. Int J 469
Hydrogen Energ 33:6092-6099 doi:10.1016/j.ijhydene.2008.07.102 470
Chochois V et al. (2009) Hydrogen production in Chlamydomonas: photosystem II-471
dependent and -independent pathways differ in their requirement for starch metabolism. Plant 472
Physiol 151:631-640 doi:10.1104/pp.109.144576 473
Collier JL, Grossman AR (1992) Chlorosis induced by nutrient deprivation in Synechococcus 474
sp. strain PCC 7942: not all bleaching is the same. J Bacteriol 174:4718-4726 475
Dragone G, Fernandez BD, Abreu AP, Vicente AA, Teixeira JA (2011) Nutrient limitation as 476
a strategy for increasing starch accumulation in microalgae. Appl Energ 88:3331-3335 477
doi:10.1016/j.apenergy.2011.03.012 478
Falkowski PG, Raven JA (eds) (2007) Aquatic photosynthesis. Princeton University Press, 479
New Jersey 480
Fogg G (1956) Photosynthesis and formation of fats in a diatom. Ann Bot 20:265-285 481
Fouchard S et al. (2005) Autotrophic and mixotrophic hydrogen photoproduction in sulfur-482
deprived Chlamydomonas cells. Appl Environ Microb 71:199-205 483
doi:10.1128/AEM.71.10.6199-6205.2005 484

21
Goldman JC (1980) Physiological aspects in algal mass cultures. In: Shelef G, Soeder CJ 485
(eds) Algal biomass. Elsevier/North-Holland Biomedical press, Amsterdam, pp 343-353 486
Gong XD, Chen F (1998) Influence of medium components on astaxanthin content and 487
production of Haematococcus pluvialis. Process Biochem 33:385-391 doi:10.1016/S0032-488
9592(98)00003-X 489
Gordillo FJL, Jimenez C, Figueroa FL, Niell FX (1999) Effects of increased atmospheric CO2 490
and N supply on photosynthesis, growth and cell composition of the cyanobacterium 491
Spirulina platensis (Arthrospira). J Appl Phycol 10:461-469 doi:10.1023/A:1008090402847 492
Gorman DS, Levine RP (1965) Cytochrome f and plastocyanin: their sequence in the 493
photosynthetic electron transport chain of Chlamydomonas reinhardtii. P Natl Acad Sci USA 494
54:1665-1669 495
Grossman A (2000) Acclimation of Chlamydomonas reinhardtii to its nutrient environment. 496
Protist 151:201-224 doi:10.1078/1434-4610-00020 497
Grossman A, Takahashi H (2001) Macronutrient utilization by photosynthetic eukaryotes and 498
the fabric of interactions. Annu Rev Plant Phys 52:163-210 499
doi:10.1146/annurev.arplant.52.1.163 500
Guo F et al. (2014) Special biochemical responses to nitrogen deprivation of filamentous 501
oleaginous microalgae Tribonema sp. Bioresource technol 158:19-24 502
doi:10.1016/j.biortech.2014.01.144 503
Hahn JJ, Ghirardi ML, Jacoby WA (2004) Effect of process variables on photosynthetic algal 504
hydrogen production. Biotechnol Progr 20:989-991 doi:10.1021/bp03341287 505
Harris EH (1989) The Chlamydomonas sourcebook: a comprehensive guide to biology and 506
laboratory use., 1st edn. Academic Press, Inc., San Diego 507
Hong SJ, Lee CG (2008) Statistical optimization of culture media for production of 508
phycobiliprotein by Synechocystis sp PCC 6701. Biotechnol Bioproc E 13:491-498 509
doi:10.1007/s12257-008-0154-9 510
22
Jeong SE, Park JK, Kim JD, Chang IJ, Hong SJ, Kang SH, Lee CG (2008) Statistical 511
optimization of the growth factors for Chaetoceros neogracile using fractional factorial 512
design and central composite design. J Microbiol Biotechnol 18:1919-1926 513
Ji C-F, Yu X-J, Chen Z-A, Xue S, Legrand J, Zhang W (2011) Effects of nutrient deprivation 514
on biochemical compositions and photo-hydrogen production of Tetraselmis subcordiformis. 515
Int J Hydrogen Energ 36:5817-5821 doi:10.1016/j.ijhydene.2010.12.138 516
Kilham S, Kreeger D, Goulden C, Lynn S (1997) Effects of nutrient limitation on 517
biochemical constituents of Ankistrodesmus falcatus. Freshwater biology 38:591-596 518
doi:10.1046/j.1365-2427.1997.00231.x 519
Klok AJ, Martens DE, Wijffels RH, Lamers PP (2013) Simultaneous growth and neutral lipid 520
accumulation in microalgae. Bioresour Technol 134:233-243 521
doi:10.1016/j.biortech.2013.02.006 522
Kolber Z, Zehr J, Falkowski P (1988) Effects of growth irradiance and nitrogen limitation on 523
photosynthetic energy conversion in photosystem II. Plant Physiol 88:923-929 524
Kosourov S, Seibert M, Ghirardi ML (2003) Effects of extracellular pH on the metabolic 525
pathways in sulfur-deprived, H2-producing Chlamydomonas reinhardtii cultures. Plant Cell 526
Physiol 44:146-155 527
Ledford HK, Niyogi KK (2005) Singlet oxygen and photo-oxidative stress management in 528
plants and algae. Plant Cell Environ 28:1037-1045 529
Lee DY, Park JJ, Barupal DK, Fiehn O (2012) System response of metabolic networks in 530
Chlamydomonas reinhardtii to total available ammonium. Mol Cell Proteomics 11:973-988 531
doi:10.1074/mcp.M111.016733 532
Lowry OH, Rosebrough NJ, Farr AL, Randall RJ (1951) Protein measurement with the Folin 533
phenol reagent. J Biol Chem 193:265-275 534
Lynn SG, Kilham SS, Kreeger DA, Interlandi SJ (2000) Effect of nutrient availability on the 535
biochemical and elemental stoichiometry in the freshwater diatom Stephanodiscus minutulus 536
(Bacillariophyceae) J Phycol 36:510-522 doi:DOI 10.1046/j.1529-8817.2000.98251.x 537

23
Markina D, Mortensen LM, Gislerød HR (2015) Effects of ammonium, phosphate, sulfate, 538
and carbon dioxide concentrations on starch, protein, and chlorophyll contents during 539
photoautotrophic growth of Chlamydomonas reinhardtii. Submitted to Journal of Phycology 540
Mata TM, Martins AA, Caetano NS (2010) Microalgae for biodiesel production and other 541
applications: A review. Renew Sust Energ Rev 14:217-232 doi:10.1016/j.rser.2009.07.020 542
Melis A, Zhang LP, Forestier M, Ghirardi ML, Seibert M (2000) Sustained photobiological 543
hydrogen gas production upon reversible inactivation of oxygen evolution in the green alga 544
Chlamydomonas reinhardtii. Plant Physiol 122:127-135 545
Morris I, Glover HE, Yentsch CS (1974) Products of photosynthesis by marine 546
phytoplankton - Effect of environmental factors on relative rates of protein synthesis. Mar 547
Biol 27:1-9 doi:10.1007/Bf00394754 548
Mortensen LM, Gislerød HR (2014) The effect on growth of Chlamydomonas reinhardtii of 549
flue gas from a power plant based on waste combustion. A M B Express 4:49 550
doi:10.1186/s13568-014-0049-4 551
Mortensen LM, Gislerød HR (2015) The growth of Chlamydomonas reinhardtii as influenced 552
by high CO2 and low O2 in flue gas from a silicomanganese smelter. J Appl Phycol 27:633-553
638 doi:10.1007/s10811-014-0357-8 554
Nuutila AM, Aura AM, Kiesvaara M, Kauppinen V (1997) The effect of salinity, nitrate 555
concentration, pH and temperature on eicosapentaenoic acid (EPA) production by the red 556
unicellular alga Porphyridium purpureum. J Biotechnol 55:55-63 doi:10.1016/S0168-557
1656(97)00060-6 558
Philipps G, Happe T, Hemschemeier A (2012) Nitrogen deprivation results in photosynthetic 559
hydrogen production in Chlamydomonas reinhardtii. Planta 235:729-745 560
doi:10.1007/s00425-011-1537-2 561
Richardson B, Orcutt DM, Schwertner HA, Martinez CL, Wickline HE (1969) Effects of 562
nitrogen limitation on the growth and composition of unicellular algae in continuous culture. 563
Appl Microbiol 18:245-250 564

24
Richmond A (ed) (2004) Handbook of microalgal culture. Biotechnology and applied 565
phycology., 1st edn. Blackwell Science Ltd., Oxford 566
Siaut M et al. (2011) Oil accumulation in the model green alga Chlamydomonas reinhardtii: 567
characterization, variability between common laboratory strains and relationship with starch 568
reserves. Bmc Biotechnol 11:7 doi:10.1186/1472-6750-11-7 569
Sueoka N (1960) Mitotic replication of deoxyribonucleic acid in Chlamydomonas reinhardtii. 570
P Natl Acad Sci USA 46:83-91 571
Tamburic B, Zemichael FW, Maitland GC, Hellgardt K (2011) Parameters affecting the 572
growth and hydrogen production of the green alga Chlamydomonas reinhardtii. Int J 573
Hydrogen Energ 36:7872-7876 doi:10.1016/j.ijhydene.2010.11.074 574
Tolstygina IV, Antal TK, Kosourov SN, Krendeleva TE, Rubin AB, Tsygankov AA (2009) 575
Hydrogen production by photoautotrophic sulfur-deprived Chlamydomonas reinhardtii pre-576
grown and incubated under high light. Biotechnol Bioeng 102:1055-1061 577
doi:10.1002/bit.22148 578
Tsygankov AA, Kosourov SN, Tolstygina IV, Ghirardi ML, Seibert M (2006) Hydrogen 579
production by sulfur-deprived Chlamydomonas reinhardtii under photoautotrophic 580
conditions. Int J Hydrogen Energ 31:1574-1584 doi:10.1016/j.ijhydene.2006.06.024 581
Turpin DH (1991) Effects of inorganic N availability on algal photosynthesis and carbon 582
metabolism. J Phycol 27:14-20 doi:10.1111/j.0022-3646.1991.00014.x 583
Wen ZY, Chen F (2001) Application of statistically-based experimental designs for the 584
optimization of eicosapentaenoic acid production by the diatom Nitzschia laevis. Biotechnol 585
Bioeng 75:159-169 doi:10.1002/Bit.1175 586
Wykoff DD, Davies JP, Melis A, Grossman AR (1998) The regulation of photosynthetic 587
electron transport during nutrient deprivation in Chlamydomonas reinhardtii. Plant Physiol 588
117:129-139 589
25
Yao C, Ai J, Cao X, Xue S, Zhang W (2012) Enhancing starch production of a marine green 590
microalga Tetraselmis subcordiformis through nutrient limitation. Bioresource Technol 591
118:438-444 doi:10.1016/j.biortech.2012.05.030 592
Zhang L, Happe T, Melis A (2002) Biochemical and morphological characterization of 593
sulfur-deprived and H2-producing Chlamydomonas reinhardtii (green alga). Planta 214:552-594
561595

26
List of tables 596
Table 1. Experimental design. Four variables (x1 – concentration of NH4+, x2 – concentration 597
of PO43-
, x3 – concentration of SO42-
in the growth medium (mM), and x4 – concentration of 598
CO2 in the bubbled gas (% v/v)) were combined in a central composite design, based on a 24 599
full factorial design with eight axial points and one central point, including five levels of each 600
variable in 25 treatments. The treatments were divided into five blocks, and carried out 601
successively, according to the CO2 concentration. Experimental setup and coded levels of the 602
studied variables for each treatment (A). Real values of the four studied variables (B). 603
Table 2. Estimated regression coefficients (β-coefficients in equation 2) of the model terms 604
according to the ANOVA using data in uncoded units. x1 – concentration of HN4+, x2 – 605
concentration of PO43-
, x3 – concentration of SO42-
in the growth medium (mM), and x4 – 606
concentration of CO2 in the bubbled gas (% v/v). The productivity (g L-1
d-1
) between 43 and 607
67 h of growth, the total biomass (dry weight (DW) in g L-1
) after 96 h of growth, starch and 608
protein contents (% of DW), as well as total chlorophyll (a + b) concentration (µg mL-1
) after 609
96 h of growth of the C. reinhardtii cultures grown in the different media tested, were 610
modeled. The experiments were divided into five blocks and carried out successively, 611
according to the CO2 concentration. The effect of the CO2 concentration and the effect of the 612
block (time) were therefore confounded. Significance levels: ^, p < 0.10; *, p < 0.05; **, p < 613
0.01; ***, p < 0.001. Not significant, p > 0.10 (not indicated). 614

27
Tables 615
Table 1. Experimental design. Four variables (x1 – concentration of NH4+, x2 – concentration 616
of PO43-
, x3 – concentration of SO42-
in the growth medium (mM), and x4 – concentration of 617
CO2 in the bubbled gas (% v/v)) were combined in a central composite design, based on a 24 618
full factorial design with eight axial points and one central point, including five levels of each 619
variable in 25 treatments. The treatments were divided into five blocks and carried out 620
successively, according to the CO2 concentration. Experimental setup and coded levels of the 621
studied variables for each treatment (a). Real values of the four studied variables (b). 622
a
Block Treatment
Coded levels
x1 x2 x3 x4
1 1 -1 -1 -1 1
1 2 1 -1 -1 1
1 3 1 -1 1 1
1 4 -1 -1 1 1
1 5 -1 1 -1 1
1 6 1 1 -1 1
1 7 1 1 1 1
1 8 -1 1 1 1
2 9 0 0 0 2
3 10 0 0 0 -2
4 11 0 0 0 0
4 12 -2 0 0 0
4 13 2 0 0 0
4 14 0 -2 0 0
4 15 0 2 0 0
4 16 0 0 -2 0
4 17 0 0 2 0
5 18 -1 -1 -1 -1
5 19 1 -1 -1 -1
5 20 1 -1 1 -1
5 21 -1 -1 1 -1
5 22 -1 1 -1 -1
5 23 1 1 -1 -1
5 24 1 1 1 -1
5 25 -1 1 1 -1
b

28
Variable Compound Real value
-2 -1 0 1 2
x1 NH4+ (mM) 5.0 7.5 12.5 17.5 20.0
x2 PO43-
(mM) 7.5 10.0 15.0 20.0 22.5
x3 SO42-
(mM) 0.1 0.2 0.55 0.9 1.0
x4 CO2 (%) 1.0 2.0 3.5 5.0 6.0
623

29
Table 2. Estimated regression coefficients (β-coefficients in equation 2) of the model terms 624
according to the ANOVA using data in uncoded units. x1 – concentration of HN4+, x2 – 625
concentration of PO43-
, x3 – concentration of SO42-
in the growth medium (mM), and x4 – 626
concentration of CO2 in the bubbled gas (% v/v). The productivity (g L-1
d-1
) between 43 and 627
67 h of growth, the total biomass (dry weight (DW) in g L-1
) after 96 h of growth, starch and 628
protein contents (% of DW), as well as total chlorophyll (a + b) concentration (µg mL-1
) after 629
96 h of growth of the C. reinhardtii cultures grown in the different media tested, were 630
modeled. The experiments were divided into five blocks and carried out successively, 631
according to the CO2 concentration. The effect of the CO2 concentration and the effect of the 632
block (time) were therefore confounded. Significance levels: ^, p < 0.10; *, p < 0.05; **, p < 633
0.01; ***, p < 0.001. Not significant, p > 0.10 (not indicated). 634
Variable Productivity
(g L-1
d-1
)
Biomass
(DW in g L-1
)
Starch
(% DW)
Protein
(% DW)
Chlorophyll
(µg mL-1
)
Constant -0.273*** 1.426*** 28.016*** 13.381*** 31.087***
x1 0.017 0.006*** 0.356*** 2.899*** 1.358***
x2 -1.12*** -0.689 -0.504 -4.814^
x3 0.786** 1.13*** -12.099*** -45.905** 29.653***
x4 0.271*** 0.203** 4.207*** 4.515^ 2.474*
x12 -0.001^ -0.14*** -0.072**
x22 0.003*** 0.173***
x32 -0.604** -1.56*** 31.532*** -53.108***
x42 -0.019** -0.036*** -1.466*** -0.523*
x1x3 0.038*** -1.643*** 2.567*** 1.839***
x1x4 -0.005* 0.006** -0.39*** 0.414*** 0.277***
x2x3 0.023** 1.216*** 0.737**
x2x4 0.22** -0.189**
x3x4 -2.41*

30
List of figures 635
Figure 1. Main effects of the concentrations of NH4, PO4, SO4, and CO2 on the pH of C. 636
reinhardtii cultures after 96 h of growth (a), on the productivity (g L-1
d-1
) of C. reinhardtii 637
cultures between 43 and 67 h of growth (b), and on the attained biomass (dry weight in g L-1
) 638
of C. reinhardtii cultures after 96 h of growth (c). The lines connect the average values of the 639
measured parameter of the cultures for each level of the studied variables. 640
Figure 2. Contour plot of the response surface of productivity (P in g L-1
d-1
) of C. reinhardtii 641
cultures between 43 and 67 h of growth vs. concentrations of NH4 and CO2, with the SO4 642
concentration being held constant at its optimum (0.65 mM) (a), and of the biomass (dry 643
weight (DW) in g L-1
) attained by the C. reinhardtii cultures after 96 h of growth vs. 644
concentrations of CO2 and SO4, with the concentrations of NH4 and PO4 being held constant 645
at their optimum (20.0 mM and 7.55 mM, respectively) (b). The optimization procedure 646
predicted a maximum productivity of 0.87 g L-1
d-1
for the optimal values of the studied 647
variables (5.0 mM NH4, 0.65 mM SO4, and 6.0% CO2). The maximum predicted dry weight 648
was 1.66 g L-1
for the optimal values of the four variables (20.0 mM NH4, 7.5 mM PO4, 0.66 649
mM SO4, and 4.5% CO2). 650
Figure 3. Main effects of the concentrations of NH4, PO4, SO4, and CO2 on the starch (% of 651
DW) (a), protein (% of DW) (b), and total chlorophyll (µg mL-1
) (c) contents of C. 652
reinhardtii cultures after 96 h of growth. The lines connect the average values of the 653
measured parameter of the cultures for each level of the studied variables. 654
Figure 4. Contour plot of the response surface of starch content (% of DW) in the C. 655
reinhardtii cultures after 96 h of growth vs. concentrations of CO2 and NH4, with the 656
concentrations of PO4 and SO4 being held constant at their optimum (22.5 mM and 0.1 mM, 657
respectively) (a), and of the protein content (% of DW) in the C. reinhardtii cultures after 96 658
h of growth vs. concentrations of SO4 and NH4, with the concentrations of PO4 and CO2 659
being held constant at their optimum (22.5 mM and 4.4%, respectively) (b). The optimization 660
procedure predicted a maximum starch content of 55% of DW for the optimal values of the 661
four nutrients (5.0 mM NH4, 22.5 mM PO4, 0.1 mM SO4, and 6.0% CO2). The maximum 662
predicted protein content was 65% of DW for the optimal values of the four nutrients (20.0 663
mM NH4, 22.5 mM PO4, 1.0 mM SO4, 4.4 % CO2). 664

31
Figure 5. Growth curves accompanied by the evolution of pH; the starch, protein, and 665
chlorophyll contents in C. reinhardtii cultures grown in the optimum predicted media for 666
maximum productivity (a), maximum biomass (b), maximum starch (c), maximum protein 667
(d), and 20 µg mL-1
chlorophyll (e). 668

32
Figures 669
670
Figure 1. Main effects of the concentrations of NH4, PO4, SO4, and CO2 on the pH of C. 671
reinhardtii cultures after 96 h of growth (a), on the productivity (g L-1
d-1
) of C. reinhardtii 672
cultures between 43 and 67 h of growth (b), and on the attained biomass (dry weight in g L-1
) 673
of C. reinhardtii cultures after 96 h of growth (c). The lines connect the average values of the 674
measured parameter of the cultures for each level of the studied variables. 675
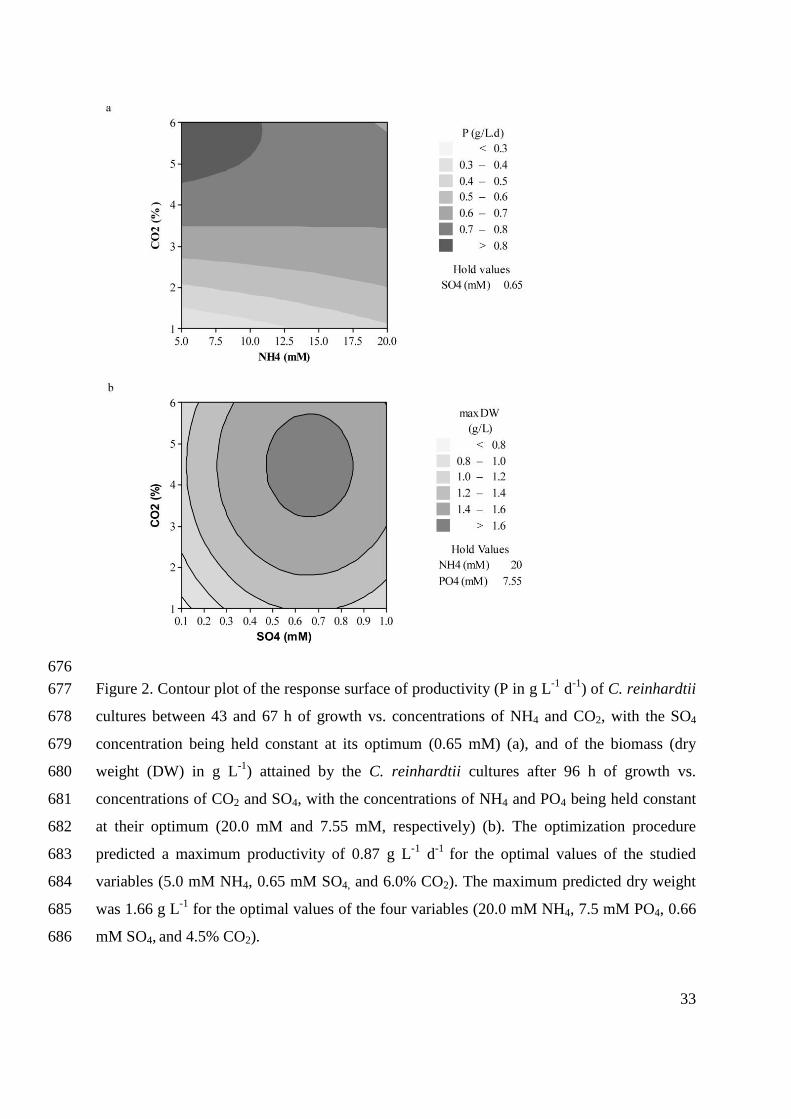
33
676
Figure 2. Contour plot of the response surface of productivity (P in g L-1
d-1
) of C. reinhardtii 677
cultures between 43 and 67 h of growth vs. concentrations of NH4 and CO2, with the SO4 678
concentration being held constant at its optimum (0.65 mM) (a), and of the biomass (dry 679
weight (DW) in g L-1
) attained by the C. reinhardtii cultures after 96 h of growth vs. 680
concentrations of CO2 and SO4, with the concentrations of NH4 and PO4 being held constant 681
at their optimum (20.0 mM and 7.55 mM, respectively) (b). The optimization procedure 682
predicted a maximum productivity of 0.87 g L-1
d-1
for the optimal values of the studied 683
variables (5.0 mM NH4, 0.65 mM SO4, and 6.0% CO2). The maximum predicted dry weight 684
was 1.66 g L-1
for the optimal values of the four variables (20.0 mM NH4, 7.5 mM PO4, 0.66 685
mM SO4, and 4.5% CO2). 686
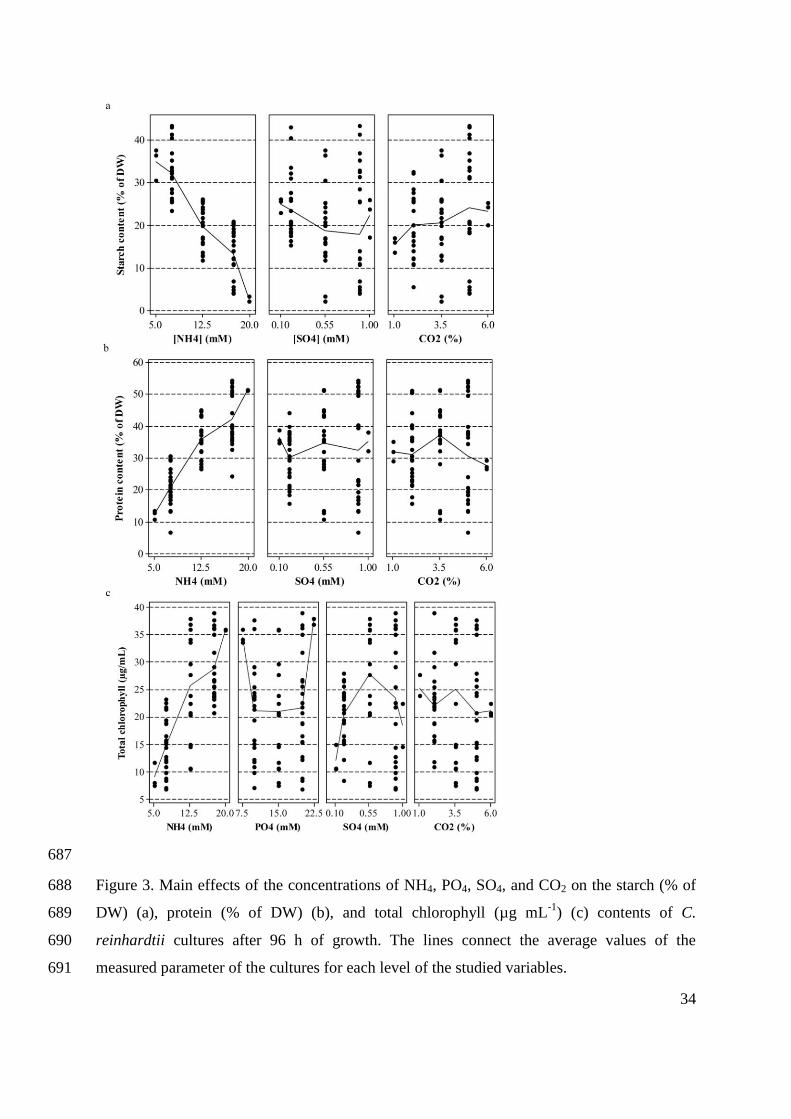
34
687
Figure 3. Main effects of the concentrations of NH4, PO4, SO4, and CO2 on the starch (% of 688
DW) (a), protein (% of DW) (b), and total chlorophyll (µg mL-1
) (c) contents of C. 689
reinhardtii cultures after 96 h of growth. The lines connect the average values of the 690
measured parameter of the cultures for each level of the studied variables. 691
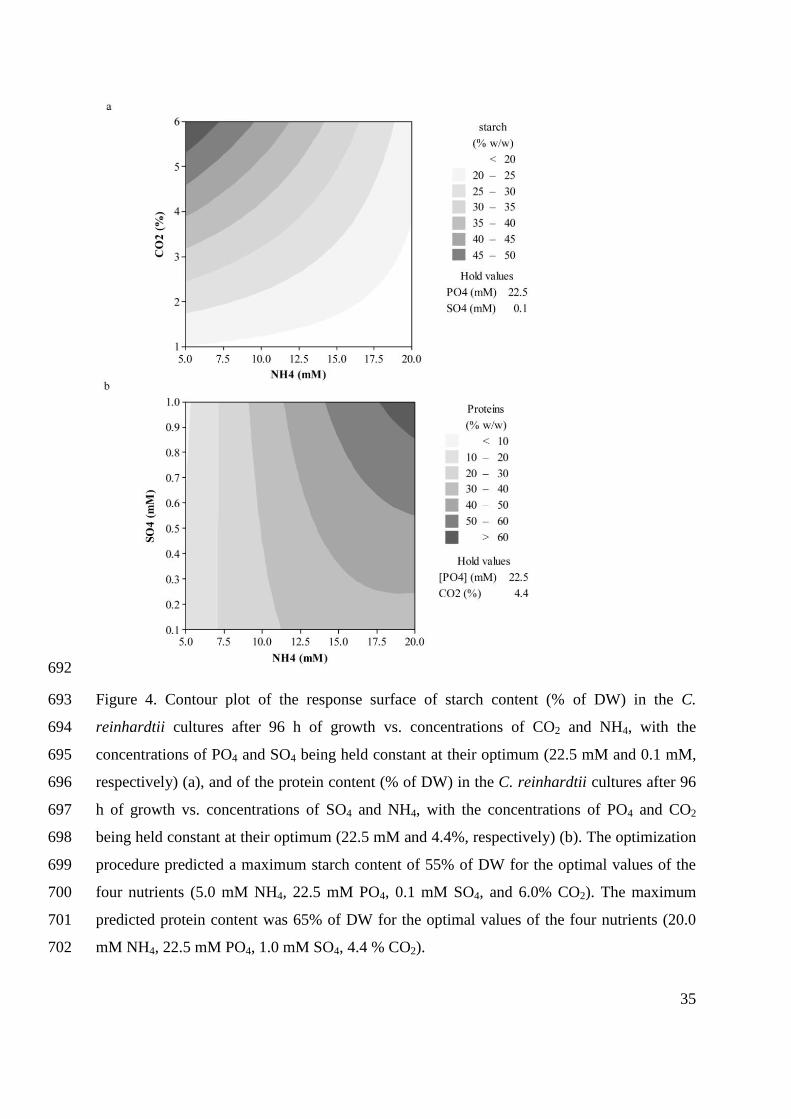
35
692
Figure 4. Contour plot of the response surface of starch content (% of DW) in the C. 693
reinhardtii cultures after 96 h of growth vs. concentrations of CO2 and NH4, with the 694
concentrations of PO4 and SO4 being held constant at their optimum (22.5 mM and 0.1 mM, 695
respectively) (a), and of the protein content (% of DW) in the C. reinhardtii cultures after 96 696
h of growth vs. concentrations of SO4 and NH4, with the concentrations of PO4 and CO2 697
being held constant at their optimum (22.5 mM and 4.4%, respectively) (b). The optimization 698
procedure predicted a maximum starch content of 55% of DW for the optimal values of the 699
four nutrients (5.0 mM NH4, 22.5 mM PO4, 0.1 mM SO4, and 6.0% CO2). The maximum 700
predicted protein content was 65% of DW for the optimal values of the four nutrients (20.0 701
mM NH4, 22.5 mM PO4, 1.0 mM SO4, 4.4 % CO2). 702

36
703
Figure 5. Growth curves accompanied by the evolution of pH; the starch, protein, and 704
chlorophyll contents of C. reinhardtii cultures grown in the optimum predicted media for 705
maximum productivity (a), maximum biomass (b), maximum starch (c), maximum protein 706
(d), and 20 µg mL-1
chlorophyll (e). 707

Paper III

1
Effects of light intensity, temperature, and carbon dioxide concentration on 1
the photoautotrophic growth and biochemical composition of 2
Chlamydomonas reinhardtii 3
Daria Markina*, Hans Ragnar Gislerød 4
Department of Plant Sciences, Norwegian University of Life Sciences, P.O. Box 5003, 1432, 5
Ås, Norway 6
* Corresponding author, e-mail: [email protected], [email protected], tel.: (+47) 7
64 96 61 38, fax: (+47) 64 96 56 15 8
Manuscript 9
2
Abstract 10
The green microalga Chlamydomonas reinhardtii is able to produce hydrogen under 11
sulfur-deficient anaerobic conditions. The efficiency of hydrogen production depends on the 12
biomass concentration and starch, protein, and chlorophyll contents of the cultures. The aim 13
of this study was to investigate the effects of the environmental factors on photoautotrophic 14
growth and biochemical composition of C. reinhardtii batch cultures. Light intensity (100 15
and 400 µmol m-2
s-1
), temperature (25 and 35 °C), and CO2 concentration (3 and 9% v/v) 16
were combined in a 23 full factorial design. Both light intensity and temperature significantly 17
enhanced the growth of the cultures: the maximum productivity (1.12 g L-1
d-1
) was measured 18
in the treatments with 400 µmol m-2
s-1
and 9% CO2. At 100 µmol m-2
s-1
, the biomass yield 19
was higher at 3% CO2. The chlorophyll content decreased with increasing light intensity. The 20
starch content of the cultures did not exceed 11% of dry weight, probably due to nutrient 21
sufficiency of the growth medium. The protein content increased from 30% of dry weight at 22
100 µmol m-2
s-1
to 41% of dry weight at 400 µmol m-2
s-1
, and reached 43% of dry weight in 23
the treatment with 400 µmol m-2
s-1
, 25 °C, and 9% CO2. The results of this study gave us a 24
better understanding of the interaction effects between light intensity, temperature, and CO2 25
concentration, which allows for better control of culture conditions. 26
Key-words 27
Carbon dioxide, Chlamydomonas reinhardtii, chlorophyll, light intensity, photoautotrophic 28
growth, protein, starch, temperature. 29

3
Introduction 30
Chlamydomonas reinhardtii is a model organism used in biohydrogen production 31
research (Antal et al. 2003; Fouchard et al. 2005; Hemschemeier et al. 2008; Kosourov et al. 32
2007; Kosourov et al. 2003; Kosourov et al. 2002; Laurinavichene et al. 2004; 33
Laurinavichene et al. 2002; Melis et al. 2000; Posewitz et al. 2004; Ruhle et al. 2008; 34
Tolstygina et al. 2009; Tsygankov et al. 2006; White and Melis 2006; Zhang et al. 2002). For 35
hydrogen production, high cell density cultures are required (Tamburic et al. 2011). The 36
biochemical content of the cultures also plays an essential role in this process (Burrows et al. 37
2008; Chochois et al. 2009; Doebbe et al. 2010; Giannelli et al. 2009; Hahn et al. 2004; Jo et 38
al. 2006; Lehr et al. 2012; Melis et al. 2000; Morsy 2011; Philipps et al. 2012; Posewitz et al. 39
2004; Tamburic et al. 2011; White and Melis 2006; Zhang et al. 2002). Namely, high cell 40
contents of starch and protein are desirable (Melis et al. 2000; Zhang et al. 2002). The 41
chlorophyll concentration in the culture is as well highly influential on the hydrogen 42
production yield (Giannelli et al. 2009; Hahn et al. 2004). 43
Environmental growth conditions are key factors that control both the growth and the 44
biochemical composition of microalgae. Light is often considered as the most important 45
factor affecting microalgal growth since it is the only energy source for photoautotrophic 46
organisms. It is also the most difficult factor to control with high cell density cultures in 47
photobioreactors due to the self-shading effect (Giannelli et al. 2009; Richmond et al. 2003). 48
The microalgal cells are exposed to rapidly varying levels of light intensity due to the mixing 49
of the cultures (Grobbelaar 1991; Ogbonna et al. 1995; Perner-Nochta and Posten 2007). The 50
major physiological outcome of the light-shade adaptation is the modification of growth rates 51
with variations in light intensity, due to the variations in the photosynthetic rates (Falkowski 52
1980; Sorokin and Krauss 1958). The growth-irradiance curves are therefore similar to 53
photosynthesis-irradiance curves (Falkowski 1980). Variation of growth rate under light 54
limitation of photosynthesis has relatively little effect on the overall cellular composition 55
(Falkowski and Owens 1980). However, there is often a tendency to accumulate more 56
carbohydrates at higher light intensity levels (Falkowski and Owens 1980; Richmond 2004). 57
This is due to the excess absorbed energy by the photosystems that the cells dissipate by 58
directing it towards carbon fixation and synthesis of energy-rich carbohydrates (Hu 2004; 59
Klok et al. 2013). Another response to high light intensity levels is the decrease in the 60
contents of photosynthetic pigments per cell, especially of chlorophylls a and b (Falkowski 61
4
1980; Falkowski and Owens 1980; Falkowski and Raven 2007; Geider et al. 1996; Geider et 62
al. 1998). This response is a cell strategy to reduce the amount of absorbed energy and avoid 63
photoinhibition when exposed to high light intensity (Baker and Bowyer 1994; Falkowski 64
1980; Falkowski and Owens 1980; Falkowski and Raven 2007; Melis et al. 1998). 65
Conversely, when microalgae are exposed to low light intensity, the amount of pigments per 66
cell increases so that the cells are able to harvest more of the available light energy from the 67
environment (Eppley and Sloan 1966; Falkowski 1980; Falkowski and Owens 1980; 68
Falkowski and Raven 2007). This ability of microalgae to adjust the amount of pigments in 69
their photosystems to the amount of light they are exposed to is commonly known as 70
photoacclimation (Falkowski and La Roche 1991). Photoacclimation also affects carbon 71
fixation, respiration rates, biochemical composition of the organism, as well as cell volume 72
(Falkowski and Raven 2007). Through these changes, photoacclimation leads to an increase 73
in photosynthetic efficiency and, thus, to an optimization of light harvesting and utilization 74
(Dubinsky et al. 1995; Falkowski and Raven 2007). 75
Temperature also influences the growth and the biochemical composition of 76
microalgal cells (Carvalho and Malcata 2003; Carvalho et al. 2009; Eppley 1972; Goldman 77
and Carpenter 1974; Goldman and Mann 1980; Li 1980; Raven and Geider 1988; Renaud et 78
al. 2002; Thompson 1999; Thompson et al. 1992; Yoder 1979). Temperature affects cellular 79
processes to a large extent through control of photosynthetic rate (Coles and Jones 2000; 80
Davison 1991; Lindström 1984; Setlík et al. 1972; Spudich and Sager 1980; Zachleder and 81
van den Ende 1992). While the light-driven redox reactions of photosynthesis are influenced 82
mainly by the amount of available light, the carbon fixation reactions of photosynthesis are 83
temperature-dependent enzymatic reactions. Growth at the optimum temperature results in 84
maximal growth rate, but in minimal cell size, and carbon and nitrogen contents (Rhee 1982). 85
Temperature also affects cell composition, short-term nutrient uptake, and, in particular, 86
nitrogen metabolism (Eppley 1972; Morris et al. 1974; Sakamoto and Bryant 1999; Terry 87
1983; Thompson et al. 1992; Yoder 1979). Berges et al. (2002) observed that cellular carbon 88
and nitrogen contents, protein, chlorophyll a, and C:N ratio increased with increasing 89
temperature from 17 to 25°C in Thalassiosira pseudonana cultures. 90
Equilibration of CO2 between aqueous solution and the gas phase is relatively slow. In 91
addition, CO2 diffusion in aqueous solution is about 104 times slower than in air (Raven 92
1977). Therefore microalgal cultures are often bubbled with gas containing relatively high 93
concentration of CO2, in the range of 1 to 5% v/v. It has been shown that C. reinhardtii cells 94

5
grown with high CO2 (5% v/v) take up CO2 from the medium, but not HCO3-, while cell 95
grown with air take up both, as part of the carbon dioxide concentrating mechanism (Badger 96
et al. 1977; Badger et al. 1980; Moroney and Tolbert 1985; Moroney and Ynalvez 2007). It 97
was postulated that the cells grown at high CO2 do not synthesize an inorganic carbon pump 98
responsible for HCO3- uptake (Moroney and Tolbert 1985), while CO2 is taken up via passive 99
diffusion (Berry et al. 1976). Carbon fixed by the cell can be utilized for respiration, as an 100
energy source, and as raw material in the formation of new cells (Berman-Frank and 101
Dubinsky 1999). Elevated CO2 concentrations have been found to decrease the relative 102
concentrations of proteins and pigments in the cells, but increase carbohydrate content 103
(Gordillo et al. 1999). 104
The effects of light intensity, temperature, and CO2 concentration on microalgal 105
growth and cell composition are known to be synergistic (Carvalho and Malcata 2003; 106
Carvalho and Malcata 2005; Carvalho et al. 2009; Eppley and Sloan 1966; Sandnes et al. 107
2005; Sorokin and Krauss 1962; Suzuki et al. 1991). The levels of temperature and CO2 are 108
key factors for high light use efficiency related to growth (Mortensen 2004). The optimum 109
light intensity for growth increases with increase in temperature (Shelef 1968; Sorokin and 110
Krauss 1962). High light intensity and temperature promote carbon fixation since this 111
pathway acts as a sink for excess energy (Parker and Armbrust 2005). On the other hand, at 112
high light intensity and low temperature cells become more sensitive to photoinhibition 113
(Coles and Jones 2000; Megard et al. 1984; Morgan and Kalff 1979; Tjahjono et al. 1994; 114
Vonshak et al. 2001). On the other hand, the effect of CO2 concentration on microalgal 115
growth strongly depends on the light intensity (Carvalho and Malcata 2005). Limitation in the 116
supply of light energy constrains the rate of transport and assimilation of inorganic carbon, so 117
cells grown under light-limited condition exhibit reduced capacity to accumulate carbon 118
(Beardall et al. 1998). In addition, the availability of CO2 in aqueous solution and the uptake 119
of CO2 by the cell are temperature-dependent, since temperature is the main factor affecting 120
diffusion. 121
Understanding the interaction effects between light intensity, temperature, and CO2 122
concentration is essential for optimization of microalgal growth in controlled production 123
systems. The use of factorial experimental designs permits to quantify the effect of each 124
variable independently as well as their interactions. In this study, we combined two levels of 125
light intensity (100 and 400 µmol m-2
s-1
), two CO2 concentrations (3 and 9% v/v), and two 126

6
levels of temperature (25 and 35 °C) in a 23 full factorial design experiment. We quantified 127
their effects on the growth of C. reinhardtii batch cultures and their contents of starch, 128
protein, and total chlorophyll (% of DW). 129
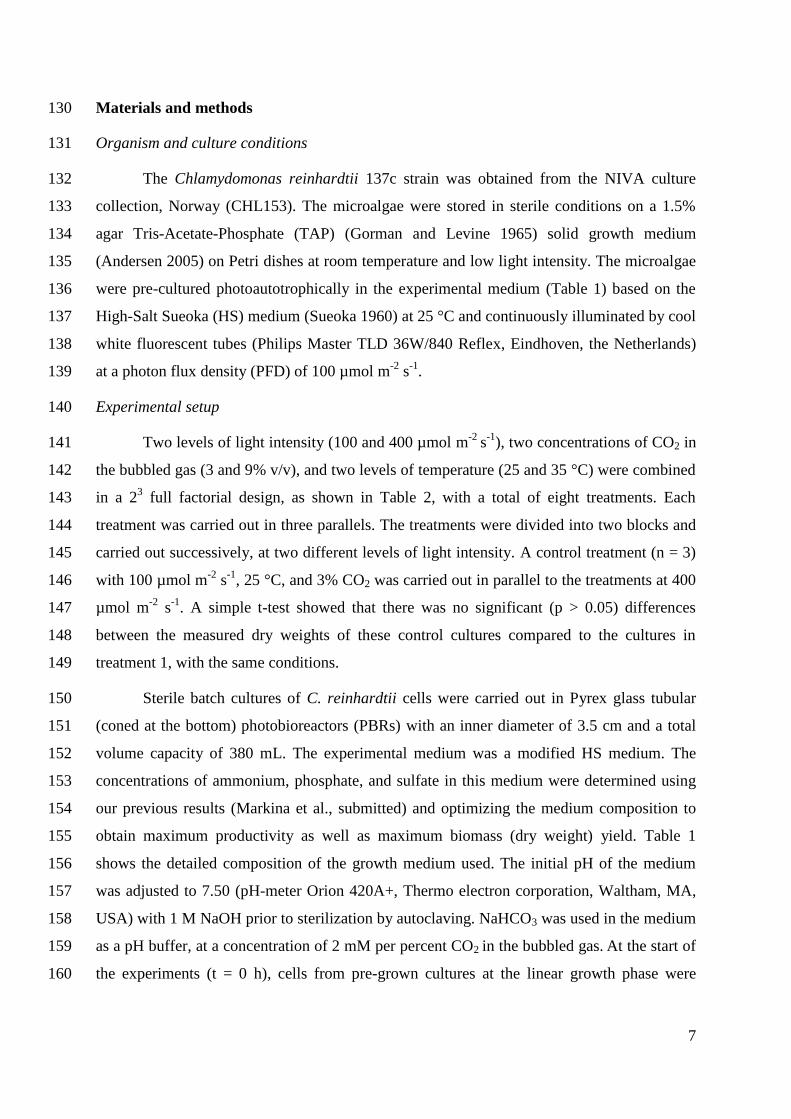
7
Materials and methods 130
Organism and culture conditions 131
The Chlamydomonas reinhardtii 137c strain was obtained from the NIVA culture 132
collection, Norway (CHL153). The microalgae were stored in sterile conditions on a 1.5% 133
agar Tris-Acetate-Phosphate (TAP) (Gorman and Levine 1965) solid growth medium 134
(Andersen 2005) on Petri dishes at room temperature and low light intensity. The microalgae 135
were pre-cultured photoautotrophically in the experimental medium (Table 1) based on the 136
High-Salt Sueoka (HS) medium (Sueoka 1960) at 25 °C and continuously illuminated by cool 137
white fluorescent tubes (Philips Master TLD 36W/840 Reflex, Eindhoven, the Netherlands) 138
at a photon flux density (PFD) of 100 µmol m-2
s-1
. 139
Experimental setup 140
Two levels of light intensity (100 and 400 µmol m-2
s-1
), two concentrations of CO2 in 141
the bubbled gas (3 and 9% v/v), and two levels of temperature (25 and 35 °C) were combined 142
in a 23 full factorial design, as shown in Table 2, with a total of eight treatments. Each 143
treatment was carried out in three parallels. The treatments were divided into two blocks and 144
carried out successively, at two different levels of light intensity. A control treatment (n = 3) 145
with 100 µmol m-2
s-1
, 25 °C, and 3% CO2 was carried out in parallel to the treatments at 400 146
µmol m-2
s-1
. A simple t-test showed that there was no significant (p > 0.05) differences 147
between the measured dry weights of these control cultures compared to the cultures in 148
treatment 1, with the same conditions. 149
Sterile batch cultures of C. reinhardtii cells were carried out in Pyrex glass tubular 150
(coned at the bottom) photobioreactors (PBRs) with an inner diameter of 3.5 cm and a total 151
volume capacity of 380 mL. The experimental medium was a modified HS medium. The 152
concentrations of ammonium, phosphate, and sulfate in this medium were determined using 153
our previous results (Markina et al., submitted) and optimizing the medium composition to 154
obtain maximum productivity as well as maximum biomass (dry weight) yield. Table 1 155
shows the detailed composition of the growth medium used. The initial pH of the medium 156
was adjusted to 7.50 (pH-meter Orion 420A+, Thermo electron corporation, Waltham, MA, 157
USA) with 1 M NaOH prior to sterilization by autoclaving. NaHCO3 was used in the medium 158
as a pH buffer, at a concentration of 2 mM per percent CO2 in the bubbled gas. At the start of 159
the experiments (t = 0 h), cells from pre-grown cultures at the linear growth phase were 160

8
inoculated into 300 mL of medium at a cell density of 104 cells mL
-1. The cells were counted 161
under a microscope, using a Fuchs-Rosenthal counting chamber. 162
Cool white fluorescent tubes, placed at approximately 15 cm from the PBRs, were 163
used to provide continuous illumination from one side at a PFD of 100 µmol m-2
s-1
and 400 164
µmol m-2
s-1
, according to the experimental design (Table 2). The light intensity was 165
measured using a LI-COR model LI-190SA instrument (LI-COR, Lincoln, NE, USA) with a 166
quantum sensor (400 – 700 nm) inside an empty PBR immersed in the water-bath aquarium, 167
and the average PFD over the height of the PBR was estimated. 168
Filtered (Acro 37 TF Vent Device, 0.2 µm PTFE membrane filters, PALL Life 169
Sciences, Port Washington, NY, USA) air containing 3 and 9% v/v CO2, according to the 170
experimental design, shown in Table 2, was injected at the bottom of the PBRs (the bubble 171
size was approximately 3 mm). The CO2 concentration in the gas mixture was recorded every 172
five minutes by the PicoLog software (Picolog, Pico Technology, St Neots, UK). The 173
concentration of dissolved CO2 in three parallel PBRs filled with 300 mL of experimental 174
growth medium at 25 °C was measured using hand-held titration cells for titrimetric analysis 175
(CHEMetrics Inc., Midland, VA, USA). The dissolved CO2 concentration was 130 ± 5 mg L-
176
1 at 3% of CO2 in the bubbled gas and 187 mg L
-1 at 9% CO2, at 25 °C. These two 177
concentrations were significantly different at p < 0.001. Increase in temperature to 35 °C did 178
not significantly (p > 0.1) influence the dissolved CO2 concentration. 179
The temperature was maintained at a 25.0 ± 0.5 °C or 35.0 ± 0.5 °C, according to the 180
experimental design (Table 2) using water baths in aquaria. The room temperature was 181
maintained at 15 ± 2 °C and the water in the aquaria heated to the desired temperature by 182
tubular aquarium heaters (Eheim Jager 3619, Eheim, Daizisau, Germany). The temperature in 183
each aquarium was recorded every five minutes by the PicoLog software. 184
The pH, the optical density (OD at λ = 750 nm, Heλios α, Thermo Fisher Scientific, 185
Waltham, MA, USA), and the dry weight (DW in g L-1
) of the cultures were measured every 186
12 h after 24 h from the start of the experiment. Samples for chlorophyll, starch (2 mL), and 187
protein (1 mL) assays were collected at 60 and 96 h of growth, except for the treatments 5, 6, 188
and 8, where they were collected at 48 and 72 h, due to faster growth. These samples were 189
centrifuged at 20800 x g, (Eppendorf centrifuge 5417R, Eppendorf, Hamburg, Germany), at 4 190
°C, for 20 min and the cell pellets stored at -20 °C until analysis. 191

9
Biomass determination 192
To collect the biomass, 0.3 – 2.0 mL of microalgal culture was filtered through pre-193
washed GF/F glass microfiber filters (0.7 µm pore size, 25 mm diameter, GE Healthcare, 194
Whatman, UK) dried at 103.5 °C. The filters containing biomass were then washed with 30 195
mL deionized water to remove adhering salts, and thereafter dried for 4 h at 103.5 °C. The 196
DW (g L-1
) of the sample was calculated by subtracting the DW of the empty filter from the 197
DW of the filter with biomass. It was normalized to the culture volume filtered. The 198
productivity (P) of the cultures (g L-1
d-1
) was calculated using formula (1), where DW1 (2) is 199
the DW determined at time t1 (2) (in days). 200
Chlorophyll assay 201
Chlorophyll was extracted from 1-2 mL samples using 95% ethanol and assayed using 202
the method described by Harris (1989). The chlorophyll concentration was determined by 203
optical density (OD) measurements (Heλios α, Thermo Fisher Scientific, Waltham, MA, 204
USA) at λ = 649 nm and λ = 665 nm. 205
Starch assay 206
Cell pellets of 2 mL samples left after chlorophyll assay were used for starch assay. 207
The Megazyme total starch (the amyloglucosidase/α-amylase method) assay kit (K-TSTA, 208
Megazyme International, Bray, Ireland) procedure was adapted to a small sample volume. 20 209
µL of 80% ethanol was added to the cell pellet and the pellet was dispersed using a vortex 210
mixer. Cells were disrupted by adding 0.2 mL of DMSO (Sigma-Aldrich, St. Louis, MO, 211
USA) and 0.5 mL of 0.5 mm glass beads (Cell disruption media, SI-BG05, Scientific 212
Industries Inc., New York, NY, USA) to the samples and shaking them on a mixer mill 213
(MM301, Retsch, Haan, Germany) at 30 Hz frequency for 10 min. Samples were heated on 214
thermos-shakers (TS-100, Biosan, Riga, Latvia) to 100 °C for 5 min for starch solubilization. 215
Then, 0.3 mL of α-amylase (diluted 1:30 according to the Megazyme starch assay kit 216
specifications) was added to the samples and the tubes incubated at 100 °C for 12 min. The 217
contents of the tubes were mixed vigorously after 0, 4, 8, and 12 min. The tubes were placed 218
at 50 °C and 0.4 mL of sodium acetate buffer (200 mM, pH 4.5) was added to the samples, 219
followed by 10 µL of amyloglucosidase (20U). The samples were thoroughly mixed and 220

10
incubated at 50 °C for 30 min. Then, 70 µL of distilled water was added to the samples in 221
order to adjust the total sample volume to 1.0 mL. The contents of the tubes were mixed 222
thoroughly and centrifuged at 20800 x g (Eppendorf centrifuge 5417R, Eppendorf, Hamburg, 223
Germany) for 10 min at 20 °C. Then, 33.4 µL of the supernatant was added to 1 mL GOPOD 224
reagent and incubated at 50 °C for 20 min. The same procedure was used for two reagent 225
blanks (33.4 µL distilled water) and four glucose controls (33.4 µL D-glucose standard 226
solution at 1 mg mL-1
). The OD of each sample and of the glucose controls was measured at 227
λ = 510 nm against the reagent blank. Starch concentration was calculated as the percentage 228
of DW of the samples according to the formula supplied in the Megazyme starch assay kit. 229
Protein assay 230
Cell pellets of 1 mL samples left after chlorophyll assay were used for protein assay. 231
The cells were disrupted using 0.5 mL of 0.5 mm glass beads (Cell disruption media, SI-232
BG05, Scientific Industries Inc., New York, NY, USA) and shaken on a mixer mill (MM301, 233
Retsch, Haan, Germany) for 10 min at 30 Hz frequency. Then, Tris-HCl solubilization buffer 234
(50 mM, pH 8.3) containing 1% Triton was used to solubilize the proteins. The Lowry 235
method (1951) was applied using the Bio-Rad DC protein microplate assay kit II (#500-0112, 236
Bio-Rad, Hercules, CA, USA) to determine protein concentration in the samples. The OD (λ 237
= 750 nm) of the samples assayed on a microplate (CellBIND surface, Costar 3300, Corning 238
Incorporated, Corning, NY, USA) was measured using a microplate spectrophotometer (Asys 239
UVM340, Biochrom, Cambridge, UK) and Kim software (Kim32, 2004, Asys Hitech GmbH, 240
Cambridge, UK). A BSA standard curve (8 points in the 0.0 - 0.75 mg mL-1
range) was used 241
to calculate the protein concentration in the samples. The protein concentration was 242
normalized to the DW of the culture and calculated as the percentage of DW. 243
Statistical analysis 244
The data were analyzed using the analysis of variance (ANOVA) procedure in the 245
MINITAB software (V16, Minitab Inc., State College, PA, USA). The figures were created 246
using SigmaPlot version 9.0 (Systat software Inc., San Jose, CA, USA). 247
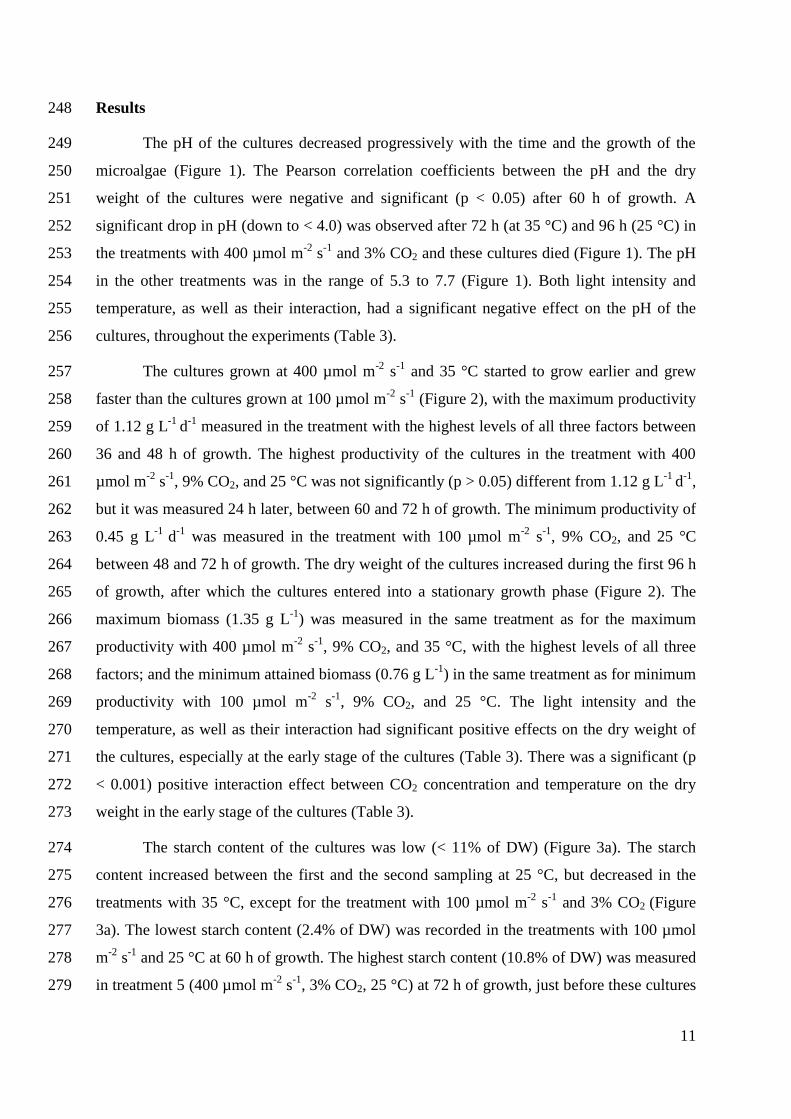
11
Results 248
The pH of the cultures decreased progressively with the time and the growth of the 249
microalgae (Figure 1). The Pearson correlation coefficients between the pH and the dry 250
weight of the cultures were negative and significant (p < 0.05) after 60 h of growth. A 251
significant drop in pH (down to < 4.0) was observed after 72 h (at 35 °C) and 96 h (25 °C) in 252
the treatments with 400 µmol m-2
s-1
and 3% CO2 and these cultures died (Figure 1). The pH 253
in the other treatments was in the range of 5.3 to 7.7 (Figure 1). Both light intensity and 254
temperature, as well as their interaction, had a significant negative effect on the pH of the 255
cultures, throughout the experiments (Table 3). 256
The cultures grown at 400 µmol m-2
s-1
and 35 °C started to grow earlier and grew 257
faster than the cultures grown at 100 µmol m-2
s-1
(Figure 2), with the maximum productivity 258
of 1.12 g L-1
d-1
measured in the treatment with the highest levels of all three factors between 259
36 and 48 h of growth. The highest productivity of the cultures in the treatment with 400 260
µmol m-2
s-1
, 9% CO2, and 25 °C was not significantly (p > 0.05) different from 1.12 g L-1
d-1
, 261
but it was measured 24 h later, between 60 and 72 h of growth. The minimum productivity of 262
0.45 g L-1
d-1
was measured in the treatment with 100 µmol m-2
s-1
, 9% CO2, and 25 °C 263
between 48 and 72 h of growth. The dry weight of the cultures increased during the first 96 h 264
of growth, after which the cultures entered into a stationary growth phase (Figure 2). The 265
maximum biomass (1.35 g L-1
) was measured in the same treatment as for the maximum 266
productivity with 400 µmol m-2
s-1
, 9% CO2, and 35 °C, with the highest levels of all three 267
factors; and the minimum attained biomass (0.76 g L-1
) in the same treatment as for minimum 268
productivity with 100 µmol m-2
s-1
, 9% CO2, and 25 °C. The light intensity and the 269
temperature, as well as their interaction had significant positive effects on the dry weight of 270
the cultures, especially at the early stage of the cultures (Table 3). There was a significant (p 271
< 0.001) positive interaction effect between CO2 concentration and temperature on the dry 272
weight in the early stage of the cultures (Table 3). 273
The starch content of the cultures was low (< 11% of DW) (Figure 3a). The starch 274
content increased between the first and the second sampling at 25 °C, but decreased in the 275
treatments with 35 °C, except for the treatment with 100 µmol m-2
s-1
and 3% CO2 (Figure 276
3a). The lowest starch content (2.4% of DW) was recorded in the treatments with 100 µmol 277
m-2
s-1
and 25 °C at 60 h of growth. The highest starch content (10.8% of DW) was measured 278
in treatment 5 (400 µmol m-2
s-1
, 3% CO2, 25 °C) at 72 h of growth, just before these cultures 279

12
died. Light intensity and temperature had a significant (p < 0.001) positive effect on the 280
starch content in the first sampling, however, their interaction was negative (Table 3). 281
The protein content varied between 16% of DW in the treatment with 100 µmol m-2
s-
282
1, 9% CO2, and 25 °C at 60 h of growth and 43% of DW in the treatment with 400 µmol m
-2 283
s-1
, 9% CO2, and 25 °C at 96 h of growth (Figure 3b). The protein content of the cultures 284
increased between the first and the second sampling times (Figure 3b) and it was significantly 285
(p < 0.001) higher at 400 µmol m-2
s-1
than at 100 µmol m-2
s-1
, at both sampling times (Table 286
3). 287
The total chlorophyll (a and b) content varied between 1.7 and 3.9% of DW (Figure 288
3c). The total chlorophyll content in the cultures was significantly (p < 0.05) higher at 100 289
µmol m-2
s-1
than at 400 µmol m-2
s-1
(Figure 3c, Table 3). CO2 concentration also had a 290
significant (p < 0.001) negative effect on the chlorophyll content at the first time of sampling, 291
while the effects of the temperature and its interactions with light intensity and CO2 292
concentration were significantly (p < 0.05) positive (Table 3). 293

13
Discussion 294
The growth of the cultures was positively influenced by the light intensity and the 295
temperature, and their interaction. The maximum productivity (1.12 g L-1
d-1
) was measured 296
in the treatment with the highest level of all three studied variables. This is in accordance 297
with the results of Lien and Knutsen (1979), who concluded that 390 µmol m-2
s-1
and 35 °C 298
were the optimal conditions for C. reinhardtii synchronous cultures. Mortensen and Gislerød 299
(2014) compared the productivity of C. reinhardtii cultures at 75 and 300 µmol m-2
s-1
and 300
found that 300 µmol m-2
s-1
yielded the highest productivity and that the productivity was the 301
same at 24 and 33 °C. 302
The biomass yields measured in this study (0.76 – 1.35 g L-1
) were in the same range 303
as measured previously for the same strain (Markina and Gislerød, unpublished; Markina et 304
al., submitted). The growth of our cultures was limited by calcium and magnesium, with the 305
use of a modified HS medium (Sueoka 1960) as indicated in Table 1, when the biomass 306
increased over 1 g L-1
, as discussed by Markina and Gislerød (submitted). An increase in CO2 307
concentration to 9%, at a light intensity of 100 µmol m-2
s-1
, led to a decrease in the dry 308
weight of the cultures, in accordance with previous results obtained with the same strain 309
(Mortensen and Gislerød 2014; 2015). 310
The cultures grown at 400 µmol m-2
s-1
and 3% CO2 had a significant drop in pH that 311
started after 48 h of growth, became chlorotic and died. These treatments had an intensive 312
growth during the first days of the experiment, which needs a strong buffer for maintaining a 313
stable pH. 2 mM NaHCO3 per percent CO2 was used in this experiment. This showed to not 314
be enough buffer added for the fast growing cultures with 3% CO2. However, cultures at 400 315
µmol m-2
s-1
and 9% CO2 had a relatively stable pH and grew well until the end of the 316
experiment, especially the ones at 35 °C, showing for the synergistic effect of light intensity, 317
temperature, and CO2 concentration. 318
The most obvious effect of the studied variables on the biochemical composition was 319
on the chlorophyll content, which decreased with increasing light intensity. Andersen and 320
Pedersen (2002) argued that the reduction in chlorophyll is not necessarily in contradiction 321
with the observed increase in growth at high light intensity, because it is mainly the antennae 322
pigments that are reduced, while the number of reaction centers remains constant or even 323
increases (Falkowski and La Roche 1991; Fogg and Thake 1987). At 400 µmol m-2
s-1
, the 324
chlorophyll content increased with increase in temperature. Shuter (1979) concluded that the 325
14
increase in chlorophyll content with increasing temperature was a common response in 326
microalgae. Thompson et al. (1992) studied the effect of temperature on the biochemical 327
composition of eight species of marine phytoplankton and came to the same conclusion. The 328
maximum chlorophyll content (3.9% of DW) was observed in the treatments with 100 µmol 329
m-2
s-1
, where it varied very little with variation in temperature and CO2 concentration, 330
corresponding to the treatments with low productivity and biomass. This value was higher 331
than in the previously obtained results with the same strain grown at 200 µmol m-2
s-1
and in 332
a medium with similar nutrient composition (Markina and Gislerød, submitted; Markina and 333
Gislerød, unpublished; Markina et al., submitted), which confirms the negative effect of 334
increase in light intensity on the chlorophyll content of the cultures. 335
The starch content of the cultures was low (< 11% of DW), probably due to the 336
sufficiency of nutrients in the used medium. This is in accordance with the previous results 337
obtained with the same strain grown in a medium with a similar composition (Markina and 338
Gislerød, submitted; Markina and Gislerød, unpublished; Markina et al., submitted). Starch is 339
known to accumulate in cells exposed to a nutrient limitation, nitrogen and sulfur limitations 340
being the most effective (Ball et al. 1990; Branyikova et al. 2010; Dragone et al. 2011; 341
Grossman 2000; Ji et al. 2011; Melis et al. 2000; Philipps et al. 2012; Yao et al. 2012; Zhang 342
et al. 2002). Nonetheless, the starch content did increase with increasing light intensity. The 343
freshwater microalga Chlorella was found to accumulate high amounts of starch (from 8.5% 344
up to 40% of DW) as the photon flux density increased from a mean of 215 to 330 µmol m-2
345
s-1
prior to cell division (Branyikova et al. 2010). However, the environmental factors seem to 346
have much less influence on the starch content than does the nutrient status of a culture 347
(Markina and Gislerød, unpublished; Markina et al. 2015, submitted). 348
The protein content was positively influenced by the increase in light intensity. 349
Carvalho et al. (2009) found that the cultures of Pavlova lutheri increased their cellular 350
protein content from about 8 pg cell-1
to 33.7 pg cell-1
as response to an increase in light 351
intensity up to 195 µmol m-2
s-1
. The protein range (16 – 43% of DW) measured in this study 352
is in accordance with the previous results obtained with the same strain (Markina and 353
Gislerød, submitted; Markina and Gislerød, unpublished; Markina et al., submitted). 354
It can be concluded that the increase in light intensity from 100 to 400 µmol m-2
s-1
355
and in temperature from 25 to 35 °C had a significant effect on the biomass of the cultures, 356
considerably accelerating their growth. With the use of 100 µmol m-2
s-1
, the biomass yield 357
15
was higher at 3% CO2 than at 9%. The contents of starch and protein increased with light 358
intensity, contrary to the chlorophyll content. The results of this study gave us a better 359
understanding of the interaction effects between light intensity, temperature, and CO2 360
concentration, which allows for better control of culture conditions. 361
16
Acknowledgements 362
This study was financially supported by the Research Council of Norway (Project 363
203281: Use of solar energy for CO2 capture, algae cultivation and hydrogen production – 364
BioH2) and the Norwegian University of Life Sciences. We thank Leiv M. Mortensen for his 365
valuable assistance during preparation of the manuscript, and Dag Wenner and Silje E. Roksti 366
for their technical assistance during the experiments. 367

17
References 368
Andersen RA (ed) (2005) Algal culturing techniques., 1st edn. Elsevier Academic Press, 369
London 370
Andersen T, Pedersen O (2002) Interactions between light and CO2 enhance the growth of 371
Riccia fluitans. Hydrobiologia 477:163-170 doi:10.1023/A:1021007124604 372
Antal TK et al. (2003) The dependence of algal H2 production on Photosystem II and O2 373
consumption activities in sulfur-deprived Chlamydomonas reinhardtii cells. Biochim 374
Biophys Acta 1607:153-160 doi:S0005272803001427 375
Badger MR, Kaplan A, A. BJ (1977) The internal CO2 pool of Chlamdomonas reinhardtii: 376
response to external CO2. Carnegie Inst Year Book:362-336 377
Badger MR, Kaplan A, Berry JA (1980) Internal inorganic carbon pool of Chlamydomonas 378
reinhardtii: Evidence for a carbon dioxide-concentrating mechanism. Plant Physiol 66:407-379
413 380
Baker NK, Bowyer JR (eds) (1994) Photoinhibition of photosynthesis: from molecular 381
mechanisms to the field. BIOS Scientific, Oxford 382
Ball SG, Dirick L, Decq A, Martiat JC, Matagne RF (1990) Physiology of starch storage in 383
the monocellular alga Chlamydomonas reinhardtii. Plant Sci 66:1-9 384
Beardall J, Johnston A, Raven J (1998) Environmental regulation of CO2-concentrating 385
mechanisms in microalgae. Can J Bot 76:1010-1017 386
Berges JA, Varela DE, Harrison PJ (2002) Effects of temperature on growth rate, cell 387
composition and nitrogen metabolism in the marine diatom Thalassiosira pseudonana 388
(Bacillariophyceae). Mar Ecol Prog Ser 225:139-146 doi:10.3354/Meps225139 389
Berman-Frank I, Dubinsky Z (1999) Balanced growth in aquatic plants: Myth or reality? 390
Phytoplankton use the imbalance between carbon assimilation and biomass production to 391
their strategic advantage. Bioscience 49:29-37 doi:10.2307/1313491 392
Berry J, Boynton J, Kaplan A, Badger M (1976) Growth and photosynthesis of 393
Chlamydomonas reinhardtii as a function of CO2 concentration. Carnegie Inst Wash Year 394
Book 75:423-432 395
Branyikova I, Marsalkova B, Doucha J, Branyik T, Bisova K, Zachleder V, Vitova M (2010) 396
Microalgae - novel highly efficient starch producers. Biotechnol Bioeng 108:766-776 397
18
Burrows EH, Chaplen FWR, Ely RL (2008) Optimization of media nutrient composition for 398
increased photofermentative hydrogen production by Synechocystis sp PCC 6803. Int J 399
Hydrogen Energ 33:6092-6099 doi:10.1016/j.ijhydene.2008.07.102 400
Carvalho AP, Malcata FX (2003) Kinetic modeling of the autotrophic growth of Pavlova 401
lutheri: study of the combined influence of light and temperature. Biotechnol Prog 19:1128-402
1135 doi:10.1021/bp034083+ 403
Carvalho AP, Malcata FX (2005) Optimization of w-3 fatty acid production by microalgae: 404
crossover effects of CO2 and light intensity under batch and continuous cultivation modes. 405
Marine Biotechnology 7:381-388 doi:10.1007/s10126-004-4047-4 406
Carvalho AP, Monteiro CM, Malcata FX (2009) Simultaneous effect of irradiance and 407
temperature on biochemical composition of the microalga Pavlova lutheri. J Appl Phycol 408
21:543-552 doi:10.1007/s10811-009-9415-z 409
Chochois V et al. (2009) Hydrogen production in Chlamydomonas: photosystem II-410
dependent and -independent pathways differ in their requirement for starch metabolism. Plant 411
Physiol 151:631-640 doi:10.1104/pp.109.144576 412
Coles JF, Jones RC (2000) Effect of temperature on photosynthesis-light response and 413
growth of four phytoplankton species isolated from a tidal freshwater river. J Phycol 36:7-16 414
Davison IR (1991) Environmental effects on algal photosynthesis - temperature. J Phycol 415
27:2-8 doi:10.1111/j.0022-3646.1991.00002.x 416
Doebbe A et al. (2010) The interplay of proton, electron, and metabolite supply for 417
photosynthetic H2 production in Chlamydomonas reinhardtii. J Biol Chem 285:30247-30260 418
doi:10.1074/jbc.M110.122812 419
Dragone G, Fernandez BD, Abreu AP, Vicente AA, Teixeira JA (2011) Nutrient limitation as 420
a strategy for increasing starch accumulation in microalgae. Appl Energ 88:3331-3335 421
doi:10.1016/j.apenergy.2011.03.012 422
Dubinsky Z, Matsukawa R, Karube I (1995) Photobiological aspects of algal mass culture. J 423
Mar Biotechnol 2:61-65 424
Eppley RW (1972) Temperature and phytoplankton growth in the sea. Fishery Bull 70:1063-425
1085 426

19
Eppley RW, Sloan PR (1966) Growth rates of marine phytoplankton correlation with light 427
absorption by cell chlorophyll a. Physiol Plant 19:47-59 428
Falkowski PG (1980) Light-shade adaptation in marine phytoplankton. In: Falkowski PG (ed) 429
Primary production in the sea. Plenum press, New York, pp 99-119 430
Falkowski PG, La Roche J (1991) Acclimation to spectral irradiance in algae. J Phycol 27:8-431
14 doi:10.1111/j.0022-3646.1991.00008.x 432
Falkowski PG, Owens TG (1980) Light-shade adaptation: two strategies in marine 433
phytoplankton. Plant Physiol 66:592-595 434
Falkowski PG, Raven JA (eds) (2007) Aquatic photosynthesis. Princeton University Press, 435
New Jersey 436
Fogg GE, Thake B (eds) (1987) Algal cultures and phytoplankton ecology., 3rd edn. The 437
University of Wisconsin press, Madison 438
Fouchard S et al. (2005) Autotrophic and mixotrophic hydrogen photoproduction in sulfur-439
deprived Chlamydomonas cells. Appl Environ Microb 71:199-205 440
doi:10.1128/AEM.71.10.6199-6205.2005 441
Geider RJ, Mac Intyre HL, Kana TM (1996) A dynamic model of photoadaptation in 442
phytoplankton. Limnology and Oceanography 41:1-15 443
Geider RJ, MacIntyre HL, Kana TM (1998) A dynamic regulatory model of phytoplanktonic 444
acclimation to light, nutrients, and temperature. Limnology and Oceanography 43:679-694 445
Giannelli L, Scoma A, Torzillo G (2009) Interplay between light intensity, chlorophyll 446
concentration and culture mixing on the hydrogen production in sulfur-deprived 447
Chlamydomonas reinhardtii cultures grown in laboratory photobioreactors. Biotechnol 448
Bioeng 104:76-90 doi:10.1002/bit.22384 449
Goldman JC, Carpenter EJ (1974) A kinetic approach to the effect of temperature on algal 450
growth. Limnology and Oceanography 19:756-766 451
Goldman JC, Mann R (1980) Temperature-influenced variations in speciation and chemical 452
composition of marine phytoplankton in outdoor mass culture. J Exp Mar Biol Ecol 46:29-40 453
Gordillo FJL, Jimenez C, Figueroa FL, Niell FX (1999) Effects of increased atmospheric CO2 454
and N supply on photosynthesis, growth and cell composition of the cyanobacterium 455
Spirulina platensis (Arthrospira). J Appl Phycol 10:461-469 doi:10.1023/A:1008090402847 456

20
Gorman DS, Levine RP (1965) Cytochrome f and plastocyanin: their sequence in the 457
photosynthetic electron transport chain of Chlamydomonas reinhardtii. P Natl Acad Sci USA 458
54:1665-1669 459
Grobbelaar JU (1991) The influence of light/dark cycles in mixed algal cultures on their 460
productivity. Bioresource Technol 38:189-194 doi:10.1016/0960-8524(91)90153-B 461
Grossman A (2000) Acclimation of Chlamydomonas reinhardtii to its nutrient environment. 462
Protist 151:201-224 doi:10.1078/1434-4610-00020 463
Hahn JJ, Ghirardi ML, Jacoby WA (2004) Effect of process variables on photosynthetic algal 464
hydrogen production. Biotechnol Progr 20:989-991 doi:10.1021/bp03341287 465
Harris EH (1989) The Chlamydomonas sourcebook: a comprehensive guide to biology and 466
laboratory use., 1st edn. Academic Press, Inc., San Diego 467
Hemschemeier A, Fouchard S, Cournac L, Peltier G, Happe T (2008) Hydrogen production 468
by Chlamydomonas reinhardtii: an elaborate interplay of electron sources and sinks. Planta 469
227:397-407 doi:10.1007/s00425-007-0626-8 470
Hu Q (2004) Environmental effects on cell composition. In: Richmond A (ed) Microalgal 471
culture. Biotechnology and applied phycology. Blackwell Science Ltd., Oxford, UK., pp 83-472
93 473
Ji C-F, Yu X-J, Chen Z-A, Xue S, Legrand J, Zhang W (2011) Effects of nutrient deprivation 474
on biochemical compositions and photo-hydrogen production of Tetraselmis subcordiformis. 475
Int J Hydrogen Energ 36:5817-5821 doi:10.1016/j.ijhydene.2010.12.138 476
Jo JH, Lee DS, Park JM (2006) Modeling and optimization of photosynthetic hydrogen gas 477
production by green alga Chlamydomonas reinhardtii in sulfur-deprived circumstance. 478
Biotechnol Prog 22:431-437 doi:10.1021/bp050258z 479
Klok AJ, Martens DE, Wijffels RH, Lamers PP (2013) Simultaneous growth and neutral lipid 480
accumulation in microalgae. Bioresour Technol 134:233-243 481
doi:10.1016/j.biortech.2013.02.006 482
Kosourov S, Patrusheva E, Ghirardi ML, Seibert M, Tsygankov A (2007) A comparison of 483
hydrogen photoproduction by sulfur-deprived Chlamydomonas reinhardtii under different 484
growth conditions. J Biotechnol 128:776-787 485
21
Kosourov S, Seibert M, Ghirardi ML (2003) Effects of extracellular pH on the metabolic 486
pathways in sulfur-deprived, H2-producing Chlamydomonas reinhardtii cultures. Plant Cell 487
Physiol 44:146-155 488
Kosourov S, Tsygankov A, Seibert M, Ghirardi ML (2002) Sustained hydrogen 489
photoproduction by Chlamydomonas reinhardtii: effects of culture parameters. Biotechnol 490
Bioeng 78:731-740 doi:10.1002/bit.10254 491
Laurinavichene T, Tolstygina I, Tsygankov A (2004) The effect of light intensity on 492
hydrogen production by sulfur-deprived Chlamydomonas reinhardtii. J Biotechnol 114:143-493
151 doi:10.1016/j.jbiotec.2004.05.012 494
Laurinavichene TV, Tolstygina IV, Galiulina RR, Ghirardi ML, Seibert M, Tsygankov AA 495
(2002) Dilution methods to deprive Chlamydomonas reinhardtii cultures of sulfur for 496
subsequent hydrogen photoproduction. Int J Hydrogen Energ 27:1245-1249 doi:S0360-497
3199(02)00101-5 498
Lehr F, Morweiser M, Rosello Sastre R, Kruse O, Posten C (2012) Process development for 499
hydrogen production with Chlamydomonas reinhardtii based on growth and product 500
formation kinetics. J Biotechnol 162:89-96 doi:10.1016/j.jbiotec.2012.06.002 501
Li WKW (1980) Temperature adaptation in phytoplankton: cellular and photosynthetic 502
characteristics. In: Falkowski PG (ed) Primary productivity in the sea. Plenum press, New 503
York, pp 259-279 504
Lien T, Knutsen G (1979) Synchronous growth of Chlamydomonas reinhardtii 505
(Chlorophyceae): a review of optimal conditions. J Phycol 15:191-200 doi:10.1111/j.1529-506
8817.1979.tb02984.x 507
Lindström K (1984) Effect of temperature, light and pH on growth, photosynthesis and 508
respiration of the dinoflagellate Peridinium cinctum fa. Westii in laboratory cultures. J Phycol 509
20:212-220 doi:10.1111/j.0022-3646.1984.00212.x 510
Lowry OH, Rosebrough NJ, Farr AL, Randall RJ (1951) Protein measurement with the Folin 511
phenol reagent. J Biol Chem 193:265-275 512
Markina D, Gislerød HR (2015a) The importance of calcium and magnesium for the growth 513
of Chlamydomonas reinhardtii. Submitted to Journal of Plant Physiology 514
22
Markina D, Gislerød HR (2015b) Modeling the effects of nutrient concentrations on the 515
photoautotrophic growth and biochemical composition of Chlamydomonas reinhardtii. 516
Unpublished 517
Markina D, Mortensen LM, Gislerød HR (2015) Effects of ammonium, phosphate, sulfate, 518
and carbon dioxide concentrations on starch, protein, and chlorophyll contents during 519
photoautotrophic growth of Chlamydomonas reinhardtii. Submitted to Journal of Phycology 520
Megard RO, Tonkyn DW, Senft WH (1984) Kinetics of oxygenic photosynthesis in 521
planktonic algae. J Plankton Res 6:325-337 522
Melis A, Neidhardt J, Benemann JR (1998) Dunaliella salina (Chlorophyta) with small 523
chlorophyll antenna sizes exhibit higher photosynthetic productivities and photon use 524
efficiencies than normally pigmented cells. J Appl Phycol 10:515-525 525
doi:10.1023/A:1008076231267 526
Melis A, Zhang LP, Forestier M, Ghirardi ML, Seibert M (2000) Sustained photobiological 527
hydrogen gas production upon reversible inactivation of oxygen evolution in the green alga 528
Chlamydomonas reinhardtii. Plant Physiol 122:127-135 529
Morgan KC, Kalff J (1979) Effect of light and temperature interactions on growth of 530
Cryptomonas erosa (Cryptophyceae). J Phycol 15:127-134 531
Moroney JV, Tolbert NE (1985) Inorganic carbon uptake by Chlamydomonas reinhardtii. 532
Plant Physiol 77:253-260 533
Moroney JV, Ynalvez RA (2007) Proposed carbon dioxide concentrating mechanism in 534
Chlamydomonas reinhardtii. Eukaryotic Cell 6:1251-1259 doi:10.1128/EC.00064-07 535
Morris I, Glover HE, Yentsch CS (1974) Products of photosynthesis by marine 536
phytoplankton - Effect of environmental factors on relative rates of protein synthesis. Mar 537
Biol 27:1-9 doi:10.1007/Bf00394754 538
Morsy FM (2011) Acetate versus sulfur deprivation role in creating anaerobiosis in light for 539
hydrogen production by Chlamydomonas reinhardtii and Spirulina platensis: Two different 540
organisms and two different mechanisms. Photochem Photobiol 87:137-142 541
doi:10.1111/j.1751-1097.2010.00823.x 542
Mortensen LM (2004) Growth and light utilization of pot plants at variable day-to-day 543
irradiances. Eur J Hortic Sci 69:89-95 544

23
Mortensen LM, Gislerød HR (2014) The effect on growth of Chlamydomonas reinhardtii of 545
flue gas from a power plant based on waste combustion. A M B Express 4:49 546
doi:10.1186/s13568-014-0049-4 547
Mortensen LM, Gislerød HR (2015) The growth of Chlamydomonas reinhardtii as influenced 548
by high CO2 and low O2 in flue gas from a silicomanganese smelter. J Appl Phycol 27:633-549
638 doi:10.1007/s10811-014-0357-8 550
Ogbonna JC, Yada H, Tanaka H (1995) Effect of cell movement by random mixing between 551
the surface and bottom of photobioreactors on algal productivity. J Ferment Bioeng 72:152-552
157 doi:10.1016/0922-338X(95)94083-4 553
Parker MS, Armbrust EV (2005) Synergistic effects of light, temperature, and nitrogen 554
source on transcription of genes for carbon and nitrogen metabolism in the centric diatom 555
Thalassiosira pseudonana (Bacillariophyceae). J Phycol 41:1142-1153 doi:10.1111/j.1529-556
8817.2005.00139.x 557
Perner-Nochta I, Posten C (2007) Simulations of light intensity variation in photobioreactors. 558
J Biotechnol 131:276-285 doi:10.1016/j.jbiotec.2007.05.024 559
Philipps G, Happe T, Hemschemeier A (2012) Nitrogen deprivation results in photosynthetic 560
hydrogen production in Chlamydomonas reinhardtii. Planta 235:729-745 561
doi:10.1007/s00425-011-1537-2 562
Posewitz MC, Smolinski SL, Kanakagiri S, Melis A, Seibert M, Ghirardi ML (2004) 563
Hydrogen photoproduction is attenuated by disruption of an isoamylase gene in 564
Chlamydomonas reinhardtii. Plant Cell 16:2151-2163 doi:10.1105/tpc.104.021972 565
Raven JA (1977) The evolution of vascular land plants in relation to supracellular transport 566
processes. Adv Bot Res 5:153-219 567
Raven JA, Geider RJ (1988) Temperature and algal growth. New Phytol 110:441-461 568
Renaud SM, Thinh L-V, Lambrinidis G, Parry DL (2002) Effect of temperature on growth, 569
chemical composition and fatty acid composition of tropical Australian microalgae grown in 570
batch cultures. Aquaculture 211:195–214 doi:10.1016/S0044-8486(01)00875-4 571
Rhee G-Y (1982) Effects of environmental factors and their interactions on phytoplankton 572
growth. Advances in Microbial Ecology 6:33-74 doi:10.1007/978-1-4615-8318-9_2 573

24
Richmond A (ed) (2004) Handbook of microalgal culture. Biotechnology and applied 574
phycology., 1st edn. Blackwell Science Ltd., Oxford 575
Richmond A, Zhang CW, Zarmi Y (2003) Efficient use of strong light for high 576
photosynthetic productivity: interrelationships between the optical path, the optimal 577
population density and cell-growth inhibition. Biomolecular Engineering 20:229-236 578
doi:10.1016/S1389-0344(03)00060-1 579
Ruhle T, Hemschemeier A, Melis A, Happe T (2008) A novel screening protocol for the 580
isolation of hydrogen producing Chlamydomonas reinhardtii strains. BMC Plant Biol 8:107 581
doi:10.1186/1471-2229-8-107 582
Sakamoto T, Bryant DA (1999) Nitrate transport and not photoinhibition limits growth of the 583
freshwater cyanobacterium Synechococcus species PCC 6301 at low temperature. Plant 584
Physiol 119:785-794 585
Sandnes JM, Kallqvist T, Wenner D, Gislerød HR (2005) Combined influence of light and 586
temperature on growth rates of Nannochloropsis oceanica: linking cellular responses to 587
large-scale biomass production. J Appl Phycol 17:515-525 doi:10.1007/s10811-005-9002-x 588
Setlík I, Berková E, Doucha J, Kubín K, Vendlová J, Zachleder V (1972) The coupling of 589
synthetic and reproduction processes in Scenedesmus quadricauda. Algolog Stud 7:172-217 590
Shelef G (1968) Kinetics of algal systems in waste treatment. Light intensity and nitrogen 591
concentration as growth-limiting factors. Ph.D., University of California 592
Shuter B (1979) A model of physiological adaptation in unicellular algae. J Theor Biol 593
78:519-552 doi:10.1016/0022-5193(79)90189-9 594
Sorokin C, Krauss RW (1958) The effects of light intensity on the growth rates of green 595
algae. Plant Physiol 33:109-113 doi:10.1104/Pp.33.2.109 596
Sorokin C, Krauss RW (1962) Effects of temperature and illuminance on Chlorella growth 597
uncoupled from cell division. Plant Physiol 37:37-42 598
Spudich JL, Sager R (1980) Regulation of the Chlamydomonas cell cycle by light and dark. J 599
Cell Biol 85:136-145 600
Sueoka N (1960) Mitotic replication of deoxyribonucleic acid in Chlamydomonas reinhardtii. 601
P Natl Acad Sci USA 46:83-91 602

25
Suzuki T, Nishimura K, Ohtaguchi K, Koide K (1991) Chemometrics approach to the 603
analysis of a synergism of temperature, light intensity and carbon dioxide concentration on 604
the growth of Anacystis nidulans. J Chem Eng Jpn 24:563-568 doi:0.1252/jcej.24.563 605
Tamburic B, Zemichael FW, Maitland GC, Hellgardt K (2011) Parameters affecting the 606
growth and hydrogen production of the green alga Chlamydomonas reinhardtii. Int J 607
Hydrogen Energ 36:7872-7876 doi:10.1016/j.ijhydene.2010.11.074 608
Terry K (1983) Temperature dependence of ammonium and phosphate uptake and their 609
interaction in the marine diatom Phaeodactylum tricornutum. Bohlin Mar Biol Lett 4:309-610
320 611
Thompson P (1999) The response of growth and biochemical composition to variations in 612
daylength, temperature, and irradiance in the marine diatom Thalassiosira pseudonana 613
(Bacillariophyceae). J Phycol 35:1215-1223 doi:10.1046/j.1529-8817.1999.3561215.x 614
Thompson PA, Guo M, Harrison PJ (1992) Effects of variation in temperature. I. On the 615
biochemical composition of eight species of marine phytoplankton. J Phycol 28:481-488 616
doi:10.1111/j.0022-3646.1992.00481.x 617
Tjahjono AE, Hayama Y, Kakizono T, Terada Y, Nishio N, Nagai S (1994) Hyper-618
accumulation of astaxanthin in a green alga Haematococcus pluvialis at elevated 619
temperatures. Biotechnol Lett 16:133-138 doi:10.1007/Bf01021659 620
Tolstygina IV, Antal TK, Kosourov SN, Krendeleva TE, Rubin AB, Tsygankov AA (2009) 621
Hydrogen production by photoautotrophic sulfur-deprived Chlamydomonas reinhardtii pre-622
grown and incubated under high light. Biotechnol Bioeng 102:1055-1061 623
doi:10.1002/bit.22148 624
Tsygankov AA, Kosourov SN, Tolstygina IV, Ghirardi ML, Seibert M (2006) Hydrogen 625
production by sulfur-deprived Chlamydomonas reinhardtii under photoautotrophic 626
conditions. Int J Hydrogen Energ 31:1574-1584 doi:10.1016/j.ijhydene.2006.06.024 627
Vonshak A, Torzillo G, Masojidek J, Boussiba S (2001) Sub-optimal morning temperature 628
induces photoinhibition in dense outdoor cultures of the alga Monodus subterraneus 629
(Eustigmatophyta). Plant Cell Environ 24:1113-1118 doi:10.1046/j.0016-8025.2001.00759.x 630
White AL, Melis A (2006) Biochemistry of hydrogen metabolism in Chlamydomonas 631
reinhardtii wild type and a Rubisco-less mutant. Int J Hydrogen Energ 31:455-464 doi:DOI 632
10.1016/j.ijhydene.2005.04.028 633
26
Yao C, Ai J, Cao X, Xue S, Zhang W (2012) Enhancing starch production of a marine green 634
microalga Tetraselmis subcordiformis through nutrient limitation. Bioresource Technol 635
118:438-444 doi:10.1016/j.biortech.2012.05.030 636
Yoder JA (1979) Effect of temperature on light-limited growth and chemical composition of 637
Skeletonema costatum (Bacillariophyceae). J Phycol 15:362-370 638
Zachleder V, van den Ende H (1992) Cell cycle events in the green alga Chlamydomonas 639
eugametos and their control by environmental factors. J Cell Sci 102:469-474 640
Zhang L, Happe T, Melis A (2002) Biochemical and morphological characterization of 641
sulfur-deprived and H2-producing Chlamydomonas reinhardtii (green alga). Planta 214:552-642
561 643

27
List of tables 644
Table 1. Experimental growth medium composition used in the present experiments. The 645
growth medium was based on the High-Salt Sueoka medium (Sueoka 1960). The 646
concentrations of ammonium, phosphate, and sulfate in the experimental medium were 647
determined using our previous results (Markina and Gislerød, unpublished) and optimizing 648
the medium composition to obtain maximum productivity as well as maximum biomass (dry 649
weight) yield. 650
Table 2. Experimental design. Three variables (light intensity (µmol m-2
s-1
), CO2 651
concentration (% v/v), and temperature (°C)) were combined in a 23 full factorial design in 652
order to investigate their effects on the growth kinetics and the biochemical composition of 653
C. reinhardtii photoautotrophic batch cultures. The eight treatments were divided into two 654
blocks and carried out successively, at two different light intensity levels. Each treatment was 655
carried out in three parallels. 656
Table 3. Results of the ANOVA. Average effects and significance levels of the effects of 657
light intensity (‘Light’ in µmol m-2
s-1
), CO2 concentration (‘CO2’ in % v/v), and temperature 658
(‘T’ in °C) and their interactions on the pH, the dry weight (DW) per liter culture, and on the 659
contents of starch, protein, and chlorophyll of the cultures. The samples for starch, protein, 660
and chlorophyll were collected at 60 and 96 h of growth, except for the treatments 5, 6, and 8, 661
where they were collected at 48 and 72 h, due to faster growth. The experiments were carried 662
out in two blocks at two different light intensities. The effect of the light intensity and the 663
effect of the block (time) were therefore confounded. Significance levels: ^, p < 0.10; *, p < 664
0.05; **, p < 0.01; ***, p < 0.001. Not significant, p > 0.10 (not indicated). 665
28
Tables 666
Table 1. Experimental growth medium composition used in the present experiments. The 667
growth medium was based on the High-Salt Sueoka medium (Sueoka 1960). The 668
concentrations of ammonium, phosphate, and sulfate in the experimental medium were 669
determined using our previous results (Markina and Gislerød, unpublished) and optimizing 670
the medium composition to obtain maximum productivity as well as maximum biomass (dry 671
weight) yield. 672
673
Nutrient Concentration (mM)
NH4 17.5
PO4 7.5
SO4 0.65
Ca 0.068
Mg 0.081
K 12.45
Cl 17.838
Na 2 mM / % CO2
HCO3 2 mM / % CO2
Hutner trace
elements solution 1 mL / L medium
29
Table 2. Experimental design. Three variables (light intensity (µmol m-2
s-1
), CO2 674
concentration (% v/v), and temperature (°C)) were combined in a 23 full factorial design in 675
order to investigate their effects on the growth kinetics and the biochemical composition of 676
C. reinhardtii photoautotrophic batch cultures. The eight treatments were divided into two 677
blocks and carried out successively, at two different light intensity levels. Each treatment was 678
carried out in three parallels. 679
Treatment
Light intensity
(µmol m-2
s-1
)
CO2 concentration
(% v/v)
Temperature
(°C)
1 100 3 25
2 100 3 35
3 100 9 25
4 100 9 35
5 400 3 25
6 400 3 35
7 400 9 25
8 400 9 35

30
Table 3. Results of the ANOVA. Average effects and significance levels of the effects of light intensity (‘Light’ in µmol m-2
s-1
), CO2 680
concentration (‘CO2’ in % v/v), and temperature (‘T’ in °C) and their interactions on the pH, the dry weight (DW) per liter culture, and on the 681
contents of starch, protein, and chlorophyll of the cultures. The samples for starch, protein, and chlorophyll were collected at 60 and 96 h of 682
growth, except for the treatments 5, 6, and 8, where they were collected at 48 and 72 h, due to faster growth. The experiments were carried out in 683
two blocks at two different light intensities. The effect of the light intensity and the effect of the block (time) were therefore confounded. 684
Significance levels: ^, p < 0.10; *, p < 0.05; **, p < 0.01; ***, p < 0.001. Not significant, p > 0.10 (not indicated). 685
pH Dry weight (g L-1
) Starch (% of DW) Protein (% of DW) Chlorophyll (% of DW)
Factor 48 h 60 h 72 h 96 h 48 h 60 h 72 h 96 h 48/60 h 72/96 h 48/60 h 72/96 h 48/60 h 72/96 h
Light -0.02 -0.49 *** -1.31 *** -1.71 *** 0.41 *** 0.43 *** 0.44 *** 0.39 *** 3.26 *** 1.95 13.45 *** 10.05 *** -0.99 * -1.39 ***
CO2 -0.14 ** 0.12 1.08 *** 1.71 *** -0.03 -0.09 ** -0.01 -0.23 *** 0.30 -1.41 -2.9 2.79 -0.36 *** 0.28
T -0.11 ^ -0.27 ** -0.47 ** -0.01 0.39 *** 0.33 *** 0.16 * 0.1 * 3.27 *** -0.29 -1.96 -1.49 0.58 *** -0.23
Light x CO2 -0.12 * 0.11 0.86 *** 1.26 *** 0.01 -0.04 0.05 0.01 0.33 -0.02 -0.23 1.63 -0.15 ^ 0.22
Light x T -0.20 *** -0.40 *** -0.56 ** -0.04 0.27 *** 0.17 *** 0.01 0.08 * -1.79 ** -2.79 * -1.7 0.49 0.38 *** 0.04
CO2 x T 0.14 ** 0.03 0.33 ^ 0.12 * 0.17 *** 0.17 *** 0.09 0.08 * -0.31 -0.06 0.51 -1.14 0.20 * 0.26
Light x CO2 x T 0.12 * -0.01 0.34 * - 0.13 ** 0.10 ** 0.001 - -0.25 0.6 -6.46 * 0.08 -0.02 0.27

31
List of figures 686
Figure 1. Effect of light intensity (µmol m-2
s-1
), CO2 concentration (% v/v), and temperature 687
(°C) on the pH (means ± SD, n = 3) of C. reinhardtii photoautotrophic batch cultures. 688
Figure 2. Effect of light intensity (µmol m-2
s-1
), CO2 concentration (% v/v), and temperature 689
(°C) on the optical density (OD, λ = 750 nm, means ± SD, n = 3) (a) and the dry weight (g L-
690
1, means ± SD, n = 3) of C. reinhardtii photoautotrophic batch cultures. 691
Figure 3. Effect of light intensity (µmol m-2
s-1
), CO2 concentration (% v/v), and temperature 692
(°C) on the starch (a), protein (b), and total chlorophyll (c) contents (% of DW, means ± SD, 693
n = 3) of C. reinhardtii photoautotrophic batch cultures. 694
32
Figures 695
Time (h)
0 24 48 72 96 120
pH
3
4
5
6
7
8
100 / 3 / 25
100 / 3 / 35
100 / 9 / 25
100 / 9 / 35
400 / 3 / 25
400 / 3 / 35
400 / 9 / 25
400 / 9 / 35
696
Figure 1. Effect of light intensity (µmol m-2
s-1
), CO2 concentration (% v/v), and temperature 697
(°C) on the pH (means ± SD, n = 3) of C. reinhardtii photoautotrophic batch cultures. 698

33
Time (h)
0 24 48 72 96 120
OD
(7
50
nm
)
0.0
0.5
1.0
1.5
2.0
2.5
3.0100 / 3 / 25
100 / 3 / 35
100 / 9 / 25
100 / 9 / 35
400 / 3 / 25
400 / 3 / 35
400 / 9 / 25
400 / 9 / 35
Time (h)
0 24 48 72 96 120
Dry
wei
gh
t (g
L-1
)
0.0
0.2
0.4
0.6
0.8
1.0
1.2
1.4
1.6
a
b
699
Figure 2. Effect of light intensity (µmol m-2
s-1
), CO2 concentration (% v/v), and temperature 700
(°C) on the optical density (OD, λ = 750 nm, means ± SD, n = 3) (a) and the dry weight (g L-
701
1, means ± SD, n = 3) of C. reinhardtii photoautotrophic batch cultures. 702
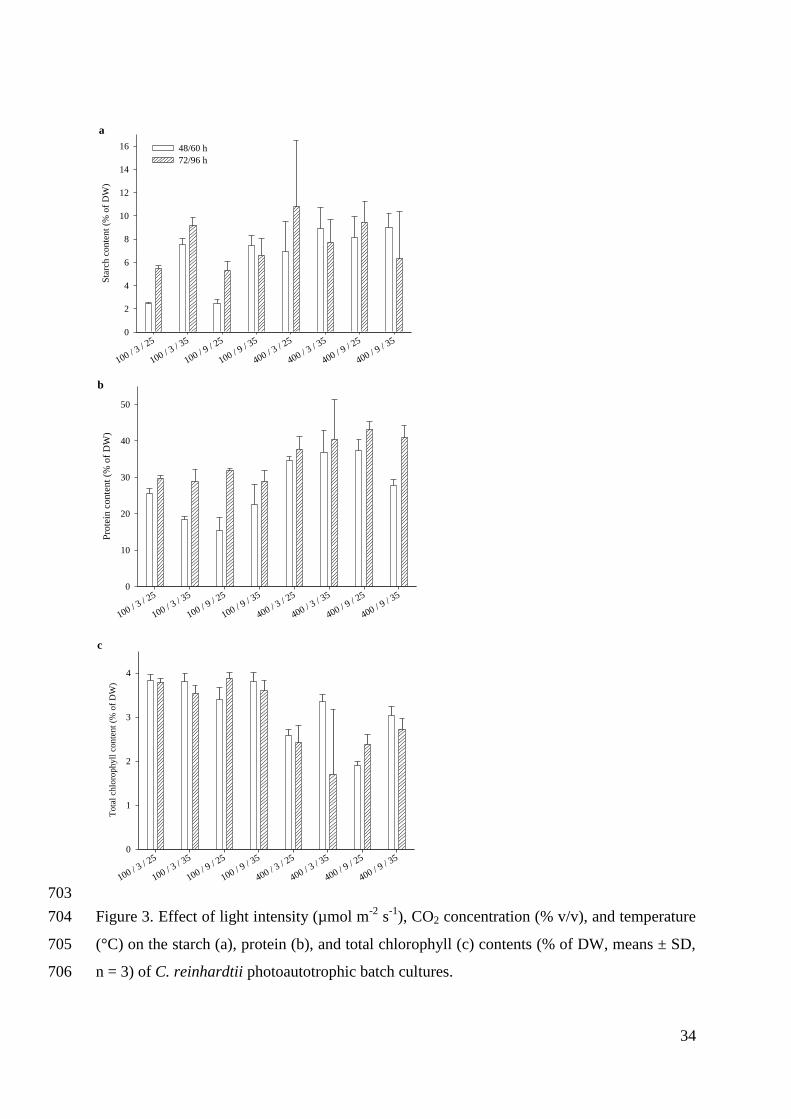
34
100 / 3 / 2
5
100 / 3 / 3
5
100 / 9 / 2
5
100 / 9 / 3
5
400 / 3 / 2
5
400 / 3 / 3
5
400 / 9 / 2
5
400 / 9 / 3
5
Sta
rch
co
nte
nt
(% o
f D
W)
0
2
4
6
8
10
12
14
16 48/60 h
72/96 h
100 / 3 / 2
5
100 / 3 / 3
5
100 / 9 / 2
5
100 / 9 / 3
5
400 / 3 / 2
5
400 / 3 / 3
5
400 / 9 / 2
5
400 / 9 / 3
5
Tota
l ch
loro
ph
yll
con
tent
(% o
f D
W)
0
1
2
3
4
100 / 3 / 2
5
100 / 3 / 3
5
100 / 9 / 2
5
100 / 9 / 3
5
400 / 3 / 2
5
400 / 3 / 3
5
400 / 9 / 2
5
400 / 9 / 3
5
Pro
tein
co
nte
nt
(% o
f D
W)
0
10
20
30
40
50
a
b
c
703
Figure 3. Effect of light intensity (µmol m-2
s-1
), CO2 concentration (% v/v), and temperature 704
(°C) on the starch (a), protein (b), and total chlorophyll (c) contents (% of DW, means ± SD, 705
n = 3) of C. reinhardtii photoautotrophic batch cultures. 706

Paper IV

1
The importance of calcium and magnesium for the growth of 1
Chlamydomonas reinhardtii 2
Daria Markina*, Hans Ragnar Gislerød 3
Department of Plant Sciences, Norwegian University of Life Sciences, P. O. Box 5003, 1432 4
Ås, Norway 5
*Corresponding author, e-mail: [email protected], [email protected], tel.: (+47) 6
64 96 61 38, fax: (+47) 64 96 56 15 7
Submitted to the Journal of Plant Physiology8
2
Abstract 9
The efficiency of hydrogen production by Chlamydomonas reinhardtii depends on the 10
biomass concentration and starch, protein, and chlorophyll contents of the cultures. The 11
growth media used for culturing C. reinhardtii vary widely in calcium and magnesium 12
content, with the High-Salt Sueoka (HS) medium being particularly low in these two 13
nutrients (0.068 mM calcium and 0.081 mM magnesium). The aim of this study was to 14
examine whether these concentrations are limiting for the growth of C. reinhardtii batch 15
cultures. Experiments were carried out with four different concentrations of calcium and 16
magnesium, ranging from 0.068 to 0.68 mM calcium and from 0.081 to 0.81 mM 17
magnesium. The results show that the calcium and magnesium concentrations of the HS 18
medium do not affect the growth up to a biomass concentration of about 1 g L-1
, but inhibit 19
further growth. By increasing the concentrations of calcium and magnesium tenfold, we 20
obtained a biomass of 4.83 g L-1
. The starch content of the cultures also increased (from 17 to 21
32% of dry weight) with increasing concentrations of calcium and magnesium, probably due 22
to nitrogen limitation. The chlorophyll concentration followed the same pattern. The protein 23
content in the treatment with the lowest concentrations of calcium and magnesium was higher 24
than in the other three treatments. It can be concluded that the concentrations of calcium and 25
magnesium in the HS medium are not growth-limiting up to a biomass concentration of 1 g L-
26
1, but that they are so for higher biomass concentrations, and we recommend increasing them 27
at least tenfold. 28
Key-words 29
Calcium, Chlamydomonas reinhardtii, chlorophyll, growth, magnesium, protein, starch.30

3
Introduction 31
Cultures of Chlamydomonas reinhardtii with high biomass are required for 32
biohydrogen production (Tamburic et al. 2011). The starch and protein contents of the 33
cultures play a central role in the hydrogen (H2) production process, since the catabolism of 34
these two substrates contributes electrons to the hydrogenase enzyme for H2 formation 35
(Chochois et al. 2009; Melis et al. 2000; Zhang et al. 2002). The chlorophyll concentration in 36
the culture is also highly influential on the H2 production yield (Giannelli et al. 2009; Hahn et 37
al. 2004). 38
The availability of the nutrients in the growth medium greatly influences the growth 39
and the biochemical composition of microalgal cultures (Grossman 2000; Richmond 2004). 40
Calcium and magnesium are both essential nutrients for microalgae. In earlier work by 41
Markina et al. (submitted) and Markina and Gislerød (unpublished (b)), where we examined 42
the effects of nitrogen, phosphorous, and sulfur on the growth of C. reinhardtii by using a 43
modified High-Salt Sueoka (HS) medium (Sueoka 1960), the question rose of whether the 44
low concentrations of calcium and magnesium could have a negative influence on the growth 45
of the microalga. Knowledge about the effects of the concentrations of calcium and 46
magnesium on the physiology of different species of microalgae is very limited as compared 47
to other macronutrients, such as carbon, nitrogen, phosphorous, and sulfur. 48
The fraction of calcium in the elementary composition of microalgae is in the range of 49
0 - 80 mg Ca2+
g-1
dry biomass (0.0 – 8.0% of dry weight) (Healey and Stewart 1973). 50
Calcium is required for cell membrane integrity and cell transport mechanisms (Fujii 1994). 51
Calcium is also implicated as a second messenger in signal transduction of a wide variety of 52
biotic and abiotic stimuli in both lower and higher plants (Rudd and Franklin-Tong 1999; 53
Sanders et al. 1999). In Chlamydomonas, calcium signaling has been shown to be associated 54
with motile responses (flagellar beat, phototaxis, chemotaxis), sensory responses (flagellar 55
adhesion during mating), and the maintenance and removal of the flagella (flagellar length 56
control, flagella excision) (Ermilova et al. 1998; Goodenough et al. 1993; Harz and 57
Hegemann 1991; Kamiya and Witman 1984; Quarmby and Hartzell 1994; Tuxhorn et al. 58
1998). In addition to its role in signal transduction, calcium is an essential co-factor in 59
photosystem II-driven oxygenic photosynthesis (Boussac et al. 1989; Krieger et al. 1993). 60

4
Calcium starvation induces lipid accumulation in microalgae cultures (Deng et al. 2011; 61
Gorain et al. 2013). 62
The fraction of magnesium in the elementary composition of microalgae is in the 63
range of 0.5 – 75 mg Mg2+
g-1
dry biomass (0.05 – 7.5 % of dry weight) (Healey and Stewart 64
1973). The magnesium content reported for Chlorella sp. ranges between 0.36 and 0.8% on a 65
dry weight basis (Oh-Hama and Miyachi 1988). Chlorophyll molecules contain magnesium 66
in their structure, making the supply of magnesium indispensable for the photosynthetic 67
activities of plants and algae. Furthermore, magnesium activates more enzymes than any 68
other mineral nutrient (Epstein and Bloom 2004), some of which are ATPases, RubisCO, 69
RNA polymerase and protein kinases (Marschner 1995; Shaul 2002). The absence of 70
magnesium, on the other hand, is expected to prevent cell division and chlorophyll synthesis 71
and, thus, to reduce growth yields (Finkle and Appleman 1953b). In plants, magnesium 72
deficiency in leaves is associated with a massive accumulation of carbohydrates and elevated 73
susceptibility to high light intensity (Cakmak and Kirkby 2008; Marschner and Cakmak 74
1989). In C. reinhardtii, magnesium deprivation decreases the protein content of the cells, but 75
increases carbohydrates and lipids (Çakmak et al. 2014). 76
The concentrations of calcium and magnesium vary widely in the different recipes for 77
growth media of microalgae. Grobbelaar (2013) provided an overview of the variation of 78
CaCl2 in the growth media for microalgae from 0.22 mM to 0.56 mM and for MgSO4 from 79
0.3 mM to 4.9 mM. The High-Salt Sueoka (HS) medium (Sueoka 1960) is particularly low in 80
calcium (0.068 mM) and magnesium (0.081 mM) compared to other media used for C. 81
reinhardtii cultures (Harris 2009). In a strategy for optimizing the growth and the 82
biochemical composition of C. reinhardtii for the purpose of further H2 production, it was 83
essential to examine whether the concentrations of calcium and magnesium had an effect on 84
these parameters. Experiments were carried out with four different concentrations of calcium 85
and magnesium, with the concentrations ranging from the original concentration in the HS 86
medium up to a concentration that was ten time higher. It was chosen to increase the 87
concentrations of calcium and magnesium simultaneously, since their cellular fractions in 88
microalgae are very similar (Healey and Stewart 1973; Ho et al. 2003). Their effects on the 89
dry weight and on the contents of starch, protein, and chlorophyll of photoautotrophic batch 90
cultures of C. reinhardtii were evaluated. 91
5
Materials and methods 92
Organism and culture conditions 93
The Chlamydomonas reinhardtii 137c strain was obtained from the NIVA culture 94
collection, Norway (CHL153). The microalgae were stored in sterile conditions on a 1.5% 95
agar Tris-Acetate-Phosphate (TAP) (Gorman and Levine 1965) solid growth medium 96
(Andersen 2005) on Petri dishes at room temperature and low light intensity. The microalgae 97
were pre-cultured in liquid High-Salt Sueoka (HS) medium (Sueoka 1960) at 25 °C and 98
continuously illuminated by cool white fluorescent tubes (Philips Master TLD 36W/840 99
Reflex, Eindhoven, the Netherlands) at a photon flux density (PFD) of 200 µmol m-2
s-1
. 100
Experimental setup 101
Sterile batch cultures of C. reinhardtii cells were carried out in bubble column Pyrex 102
glass tubular (coned at the bottom) photobioreactors (PBRs) with an inner diameter of 3.5 cm 103
and a total volume capacity of 380 mL. The temperature was maintained at 25.0 ± 0.5 °C 104
using water baths in aquaria. Cool white fluorescent tubes were used to provide continuous 105
illumination at a PFD of 200 µmol m-2
s-1
. The light intensity was measured using a LI-COR 106
model LI-190SA instrument (LI-COR, Lincoln, NE, USA) with a quantum sensor (400 – 700 107
nm) inside an empty PBR immersed in the water-bath aquarium, and the average PFD over 108
the height of the PBR was estimated. Filtered (Acro 37 TF Vent Device, 0.2 µm PTFE 109
membrane, PALL Life Sciences, Port Washington, NY, USA) air containing 5% v/v CO2 was 110
injected into the bottom of the PBRs, allowing mixing by bubbling (the bubble size was 111
approximately 3 mm). The concentration of the dissolved CO2 in the PBRs was determined to 112
be 368 mg L-1
(Markina et al., submitted). 113
The experimental media were based on the HS medium, with 17.5 mM NH4, 15.0 mM 114
PO4, 1.0 mM SO4, and four different concentrations of CaCl2 and MgCl2. These 115
concentrations corresponded to 1 x the concentrations in the HS medium (0.068 mM Ca, 116
0.081 mM Mg), 2.5 x (0.17 mM Ca, 0.203 mM Mg), 5 x (0.34 mM Ca, 0.405 mM Mg), and 117
10 x (0.68 mM Ca, 0.81 mM Mg), giving a wide range of tested concentrations. Each 118
treatment was carried out in three parallels. The initial pH of the media was adjusted to 7.5 119
with 1 M NaOH prior to sterilization by autoclaving. NaHCO3 was used in the medium as an 120
additional pH buffer, at a concentration of 2 mM per percent CO2 in the bubbled gas. At the 121
6
start of the experiments (t = 0 d), cells from pre-grown cultures at the linear growth phase 122
were inoculated into 300 mL of medium at a cell density of 104
cells mL-1
. The cells were 123
counted under a microscope, using a Fuchs-Rosenthal counting chamber. 124
Biomass determination 125
To collect the biomass, 0.1 – 1.0 mL of microalgal culture was filtered through pre-126
washed GF/F glass microfiber filters (0.7 µm pore size, 25 mm diameter, GE Healthcare, 127
Whatman, UK) dried at 103.5 °C. The filters containing biomass were then washed with 30 128
mL deionized water to remove adhering salts and thereafter dried for 4 h at 103.5 °C. The dry 129
weight (DW in g L-1
) of the sample was calculated by subtracting the DW of the empty filter 130
from the DW of the filter with biomass. It was normalized to the filtered culture volume. 131
Chlorophyll assay 132
Chlorophyll was extracted from 1 – 2 mL samples using 95% ethanol and assayed 133
using the method described by Harris (1989). The chlorophyll concentration was determined 134
by optical density (OD) measurements (Heλios α, Thermo Fisher Scientific, Waltham, MA, 135
USA) at λ = 649 nm and λ = 665 nm. 136
Starch assay 137
Cell pellets of 2 mL samples left after chlorophyll assay were used for starch assay. A 138
Megazyme total starch (amyloglucosidase/α-amylase method) assay kit (K-TSTA, 139
Megazyme International, Bray, Ireland) procedure was adapted to a small sample volume. 20 140
µL of 80% ethanol was added to the cell pellet, which was dispersed using a vortex mixer. 141
Cells were disrupted by adding 0.2 mL of DMSO (Sigma-Aldrich, St. Louis, MO, USA) and 142
0.5 mL of 0.5 mm glass beads (Cell disruption media, SI-BG05, Scientific Industries Inc., 143
New York, NY, USA) to the samples and shaking them on a mixer mill (MM301, Retsch, 144
Haan, Germany) at a frequency of 30 Hz for 10 min. Samples were heated on thermos-145
shakers (TS-100, Biosan, Riga, Latvia) to 100 °C for 5 min for starch solubilization purposes. 146
Then, 0.3 mL of α-amylase (diluted 1:30 according to the Megazyme starch assay kit 147
specifications) was added to the samples and the tubes incubated at 100 °C for 12 min. The 148
contents of the tubes were mixed vigorously after 0, 4, 8, and 12 min. The tubes were placed 149
at 50 °C, and 0.4 mL of sodium acetate buffer (200 mM, pH 4.5) was added to the samples, 150
followed by 10 µL of amyloglucosidase (20U). The samples were thoroughly mixed and 151

7
incubated at 50 °C for 30 min. Then, 70 µL of distilled water was added to the samples in 152
order to adjust the total sample volume to 1.0 mL. The contents of the tubes were mixed 153
thoroughly and centrifuged at 20800 x g (Eppendorf centrifuge 5417R, Eppendorf, Hamburg, 154
Germany) for 10 min at 20 °C. An appropriate volume (10 - 33.4 µL) of the supernatant was 155
added to 1 mL GOPOD reagent and incubated at 50 °C for 20 min. The same procedure was 156
used for two reagent blanks (10 - 33.4 µL distilled water) and four glucose controls (10 - 33.4 157
µL D-glucose standard solution at 1 mg mL-1
). The OD of each sample and of glucose 158
controls was measured at λ = 510 nm against the reagent blank. The starch concentration in 159
the cells was calculated as a percentage of DW of the samples according to the formula 160
supplied in the Megazyme starch assay kit. 161
Protein assay 162
Cell pellets of 1 mL samples left after the chlorophyll assay were used for protein 163
assay. The cells were disrupted using 0.5 mL of 0.5 mm glass beads (Cell disruption media, 164
SI-BG05, Scientific Industries Inc., New York, NY, USA) and shaken on a mixer mill 165
(MM301, Retsch, Haan, Germany) for at a frequency of 30 Hz for 10 min. Then, Tris-HCl 166
solubilization buffer (50 mM, pH 8.3) containing 1% Triton was used to solubilize the 167
proteins. The Lowry method (1951) was applied, using Bio-Rad DC protein microplate assay 168
kit II (#500-0112, Bio-Rad, Hercules, CA, USA) to determine the protein concentration in the 169
samples. The OD (λ = 750 nm) of the samples assayed on a microplate (CellBIND surface, 170
Costar 3300, Corning Incorporated, Corning, NY, USA) was measured using a microplate 171
spectrophotometer (Asys UVM340, Biochrom, Cambridge, UK) and Kim software (Kim32, 172
2004, Asys Hitech GmbH, Cambridge, UK). A BSA standard curve (8 points in the 0.0 – 173
1.75 mg mL-1 range) was used to calculate the protein concentration in the samples. The 174
protein concentration was normalized to the DW of the culture and calculated as a percentage 175
of DW. 176
177

8
Results 178
A significant drop in the pH of the cultures was observed between days 2 and 3 179
(Figure 1), which was parallel to the maximum increase in biomass (Figure 2). The pH of the 180
cultures grown at the lowest concentrations of calcium and magnesium decreased more 181
slowly than in the other cultures (Figure 1). The pH was stable at around 6.25 from day 6 and 182
until the end of the experiments (Figure 1). 183
The cultures in all four treatments showed a rapid growth during the first days of the 184
experiment, and the productivity increased from 1.16 to 1.97 g L-1
d-1
with increasing 185
concentrations of calcium and magnesium (Figure 2b). The maximum dry weight was 186
recorded on day 6. It was 4.83 g L-1
in the treatment with highest concentrations and 2.28 g L-
187
1 in the treatment with the lowest concentrations (Figure 2b). A stationary phase was 188
observed in all treatments from day 6 and until the end of the experiment (Figure 2), 189
coinciding with the stabilized pH. 190
The starch content of the cultures increased sharply between days 3 and 4 of the three 191
treatments with higher concentrations of calcium and magnesium (Figure 3a). In the 192
treatment with the lowest concentrations of calcium and magnesium the highest increase was 193
observed between days 4 and 5 (Figure 3a). After five days of growth, the starch content 194
attained its maximum in all the cultures, except in the treatment with the lowest calcium and 195
magnesium concentrations, where it continued to increase until the end of the experiment, 196
while it decreased in the other treatments (Figure 3a). At the fifth day of growth, the starch 197
content of the cultures increased with the increasing calcium and magnesium concentrations 198
in the medium (Figure 3a). It varied from 17% of DW in the treatment with the lowest 199
concentrations of calcium and magnesium to 32% of DW in the treatment with the highest 200
concentrations of calcium and magnesium. 201
The protein content varied less than the starch content between the different 202
treatments (Figure 3b). It decreased sharply between days 3 and 4, i. e. the opposite of the 203
starch content, in the three treatments with higher concentrations of calcium and magnesium, 204
and it increased from that point onwards, especially in the two middle treatments (Figure 3b). 205
In the treatment with the lowest calcium and magnesium concentrations, the sharp decrease in 206
protein content did not occur until day 6, reaching a minimum at day 10 (Figure 3b). 207

9
The chlorophyll concentration in the cultures increased with increasing concentrations 208
of calcium and magnesium (Figure 4a). The treatment with the lowest calcium and 209
magnesium concentrations had lower chlorophyll content (as % of DW) than the other 210
treatments after eight days of growth (Figure 4b). The cultures in this treatment became 211
almost completely chlorotic by day 15 of the experiment (data not shown). 212
213

10
Discussion 214
In the context of optimization of the growth and the biochemical composition of C. 215
reinhardtii for the purpose of further H2 production, we examined the effects of increasing 216
calcium and magnesium concentrations on these parameters. 217
The biomass attained by the cultures increased with increasing concentrations of 218
calcium (0.068 – 0.68 mM) and magnesium (0.081 – 0.81 mM) in the growth medium. Under 219
increased concentration of magnesium (up to 6 mM), a significant rise in the biomass of 220
Chlorella vulgaris and Scenedesmus obliquus was recorded in the study by Gorain et al. 221
(2013). In Dunaliella tertiolecta, both calcium (up to 0.3 mM) and magnesium (up to 5.6 222
mM) enhanced cell growth (Chow et al. 2015). 223
At 2.5 days of growth, the biomass was in the range of 0.95 – 1.18 g L-1
, comparable 224
to the dry weight measured for the same strain under similar growth conditions (Markina and 225
Gislerød, unpublished (a, b); Markina et al., submitted). Up to this biomass concentration of 226
0.95 – 1.18 g L-1
, there was no significant (p > 0.01) difference in growth between the 227
different calcium and magnesium concentrations tested, which indicates that the calcium and 228
magnesium contents (0.068 mM Ca and 0.081 mM Mg) in the High-Salt Sueoka medium 229
(Sueoka 1960) are sufficient up to this biomass concentration of C. reinhardtii. 230
The cultures in the treatment with the highest concentrations of calcium and 231
magnesium, on the other hand, attained a biomass as high as 4.83 g L-1
after six days. The 232
growth of these cultures might have been limited by nitrogen and/or sulfur. The supplied 233
amounts of these two nutrients were sufficient to yield 2.6 g L -1
biomass with 9.4% of DW 234
of nitrogen and 5.0 g L-1
at 0.64% of DW of sulfur, which were the nutrient contents of this 235
strain grown in a medium with a similar composition to the one used in this study, not limited 236
by nitrogen or sulfur (Markina et al., submitted). This means that the cultures with the three 237
higher concentrations of calcium and magnesium would start to experience nitrogen 238
limitation already at day 4. The cultures in the treatment with the highest concentration of 239
calcium and magnesium might have become sulfur-limited at day 6 and would only contain 240
about 5% of DW of nitrogen at that time point, which may explain the growth arrest of these 241
cultures and the onset of a stationary growth phase. The onset of the stationary growth phase 242
attained in the other treatments might be explained by the limitation of growth by calcium or 243

11
magnesium, since the attained biomass in these cultures increased with increasing 244
concentrations of calcium and magnesium. 245
This possible nutrient limitation might also be what caused the accumulation of 246
relatively high amounts of starch after three to five days of growth in the cultures with the 247
three higher concentrations of calcium and magnesium. The starch content in these treatments 248
increased with increasing biomass, probably due to an increase in the degree of nitrogen 249
limitation as the biomass increased. Nutrient limitation by nitrogen, sulfur, or phosphorous 250
has been reported to induce accumulation of carbohydrates, and particularly starch, in several 251
strains of microalgae (Ball et al. 1990; Branyikova et al. 2010; Dragone et al. 2011; 252
Grossman 2000; Hu 2004; Ji et al. 2011; Markou et al. 2012; Philipps et al. 2012; Siaut et al. 253
2011; Yao et al. 2012; Zhang et al. 2002). The starch content in the cultures grown at the 254
lowest concentrations of calcium and magnesium was only 7% of DW after four days of 255
growth. This is in line with previous results obtained with the same strain grown in media 256
with a similar composition, with no limitation by nitrogen or sulfur (Markina and Gislerød, 257
unpublished (a, b); Markina et al., submitted). 258
The protein content of the cultures grown in the three treatments with higher 259
concentrations of calcium and magnesium was low after day 4 (14 – 20% of DW). This result 260
would be expected for cultures suffering from nitrogen and/or sulfur limitation and with high 261
starch content, since a negative correlation has previously been found between the amounts of 262
these two cellular components in response to varying concentrations of ammonium and 263
sulfate in the medium (Markina et al., submitted). The cultures growth at the lowest 264
concentrations of calcium and magnesium had a protein content of 42% of DW after four 265
days of growth. This is also in line with previous results obtained with the same strain grown 266
un nutrient-replete conditions (Markina and Gislerød, unpublished (a, b); Markina et al., 267
submitted). 268
The chlorophyll concentration increased with increasing concentrations of calcium 269
and magnesium. The chlorophyll concentration in Chlorella cultures increased linearly about 270
fifteen-fold when the initial magnesium concentration was increased from 8 µM to 115 µM 271
(Finkle and Appleman 1953a). A further two-fold increase in the chlorophyll content was 272
observed when the magnesium concentration was increased up to 2 mM (Finkle and 273
Appleman 1953a). In these cultures, the chlorophyll content attained by the cells represented 274
approximately 70-80% of the total magnesium that had been added to the growth media 275

12
(Finkle and Appleman 1953a). In a study carried out with tomato plants, the chlorophyll 276
content in leaves also increased when the magnesium concentration in the nutrient solution 277
was increased from 0.82 mM to 3.3 mM, but decreased when the calcium concentration was 278
increased from 3.75 mM to 7.5 mM, probably due to the antagonistic effect of calcium on the 279
uptake of magnesium (Hao and Papadopoulos 2004). 280
In this study, we chose to increase the concentrations of calcium and magnesium 281
simultaneously, due to the similarity in their cellular fractions in microalgae (Healey and 282
Stewart 1973; Ho et al. 2003), even if the metabolic roles of these two metals are quite 283
different. In higher plants, their uptake is known to be antagonistic (Hao and Papadopoulos 284
2004; Ho et al. 1999; Paiva et al. 1998). Therefore, increasing the concentration of both 285
calcium and magnesium simultaneously would probably be the correct strategy to avoid 286
growth limitation by one of these two cations. On the other hand, transport antagonism 287
between monovalent and divalent cations (Adams et al. 1992; Çakmak et al. 2014; Marcelle 288
1995; Marschner 1995) also needs to be considered when designing a growth medium. 289
It can be concluded that the increase in calcium and magnesium concentrations had a 290
much larger effect on the growth than on the biochemical composition of C. reinhardtii 291
photoautotrophic batch cultures. The concentrations of calcium and magnesium in the HS 292
medium are not growth-limiting up to a biomass concentration of about 1 g L-1
, but that they 293
are so for higher biomass concentrations, and we recommend increasing them at least tenfold 294
for obtaining C. reinhardtii cultures with high biomass. 295
296

13
Acknowledgements 297
This study was financially supported by the Research Council of Norway (Project 298
203281: Use of solar energy for CO2 capture, algae cultivation and hydrogen production – 299
BioH2) and the Norwegian University of Life Sciences. We thank Leiv M. Mortensen, Jorunn 300
E. Olsen, and Sissel Torre for their valuable assistance during preparation of the manuscript, 301
and Dag Wenner and Silje E. Roksti for their technical assistance during the experiments.302

14
References 303
Adams P, Graves CJ, Winsor GW (1992) Some responses of cucumber, grown in beds of 304
peat, to N, K and Mg. J Hortic Sci 67:877-884 305
Andersen RA (ed) (2005) Algal culturing techniques., 1st edn. Elsevier Academic Press, 306
London 307
Ball SG, Dirick L, Decq A, Martiat JC, Matagne RF (1990) Physiology of starch storage in 308
the monocellular alga Chlamydomonas reinhardtii. Plant Sci 66:1-9 309
Boussac A, Zimmermann JL, Rutherford AW (1989) EPR signals from modified charge 310
accumulation states of the oxygen-evolving enzyme in calcium-deficient photosystem II. 311
Biochemistry 28:8984-8989 doi:10.1021/bi00449a005 312
Branyikova I, Marsalkova B, Doucha J, Branyik T, Bisova K, Zachleder V, Vitova M (2010) 313
Microalgae - novel highly efficient starch producers. Biotechnol Bioeng 108:766-776 314
Cakmak I, Kirkby EA (2008) Role of magnesium in carbon partitioning and alleviating 315
photooxidative damage. Physiologia Plantarum 133:692-704 doi:10.1111/j.1399-316
3054.2007.01042.x 317
Çakmak ZE, Ölmez TT, Çakmak T, Menemen Y, Tekinay T (2014) Induction of 318
triacylglycerol production in Chlamydomonas reinhardtii: comparative analysis of different 319
element regimes. Bioresour Technol 155:379-387 doi:10.1016/j.biortech.2013.12.093 320
Chochois V et al. (2009) Hydrogen production in Chlamydomonas: photosystem II-321
dependent and -independent pathways differ in their requirement for starch metabolism. Plant 322
Physiol 151:631-640 doi:10.1104/pp.109.144576 323
Chow Y, Tu WY, Wang D, Ng DHP, Lee YK (2015) The role of macroinutrients and 324
strategies for optimized continual glycerol production from carbon dioxide Dunaliella 325
tertiolecta. Engineering Science of Biological Systems doi:10.1002/bit.25608 326
Deng X, Fei X, Li Y (2011) The effects of nutritional restriction on neutral lipid 327
accumulation in Chlamydomonas and Chlorella. African J Microbiol Res 5:260-270 328
15
Dragone G, Fernandez BD, Abreu AP, Vicente AA, Teixeira JA (2011) Nutrient limitation as 329
a strategy for increasing starch accumulation in microalgae. Appl Energ 88:3331-3335 330
doi:10.1016/j.apenergy.2011.03.012 331
Epstein E, Bloom AJ (2004) Mineral nutrition of plants: principles and perspectives., 2nd 332
edn. Sinauer Associates, Sunderland, MA 333
Ermilova E, Zalutskaya Z, Munnik T, van den Ende H, Gromov B (1998) Calcium in the 334
control of chemotaxis in Chlamydomonas. Biologia 53:577-581 335
Finkle BJ, Appleman D (1953a) The effect of magnesium concentration on chlorophyll and 336
catalase development in Chlorella. Plant Physiol 28:652-663 337
Finkle BJ, Appleman D (1953b) The effect of magnesium concentration on growth of 338
Chlorella. Plant Physiol 28:664-673 339
Fujii S (1994) Effect of Ca2+
on the retention of glycerol and amino acids in Dunaliella 340
tertiolecta. Plant Cell Environ 17:227-230 doi:10.1111/j.1365-3040.1994.tb00287.x 341
Giannelli L, Scoma A, Torzillo G (2009) Interplay between light intensity, chlorophyll 342
concentration and culture mixing on the hydrogen production in sulfur-deprived 343
Chlamydomonas reinhardtii cultures grown in laboratory photobioreactors. Biotechnol 344
Bioeng 104:76-90 doi:10.1002/bit.22384 345
Goodenough UW, Shames B, Small L, Saito T, Crain RC, Sanders MA, Salisbury JL (1993) 346
The role of calcium in the Chlamydomonas reinhardtii mating reaction. J Cell Biol 121:365-347
374 348
Gorain PC, Bagchi SK, Mallick N (2013) Effects of calcium, magnesium and sodium 349
chloride in enhancing lipid accumulation in two green microalgae. Environ Technol 34:1887-350
1894 doi:10.1080/09593330.2013.812668 351
Gorman DS, Levine RP (1965) Cytochrome f and plastocyanin: their sequence in the 352
photosynthetic electron transport chain of Chlamydomonas reinhardtii. P Natl Acad Sci USA 353
54:1665-1669 354

16
Grossman A (2000) Acclimation of Chlamydomonas reinhardtii to its nutrient environment. 355
Protist 151:201-224 doi:10.1078/1434-4610-00020 356
Hahn JJ, Ghirardi ML, Jacoby WA (2004) Effect of process variables on photosynthetic algal 357
hydrogen production. Biotechnol Progr 20:989-991 doi:10.1021/bp03341287 358
Hao X, Papadopoulos AP (2004) Effects of calcium and magnesium on plant growth, 359
biomass partitioning, and fruit yield of winter greenhouse tomato. Hort Science 39:512-515 360
Harris EH (1989) The Chlamydomonas sourcebook: a comprehensive guide to biology and 361
laboratory use., 1st edn. Academic Press, Inc., San Diego 362
Harris EH (2009) The Chlamydomonas sourcebook. Introduction to Chlamydomonas and its 363
laboratory use. vol 1. 2nd edn. Elseiver Inc, Oxford 364
Harz H, Hegemann P (1991) Rhodopsin-regulated calcium currents in Chlamydomonas. 365
Nature 351:489-491 366
Healey FP, Stewart WPD (1973) Inorganic nutrient uptake and deficiency in algae. C R C 367
Critical reviews in microbiology 3:69-113 doi:10.3109/10408417309108746 368
Ho LC, Hand DJ, Fussell M (1999) Improvement of tomato fruit quality by calcium nutrition. 369
Acta Hort 481:463-468 370
Ho TY, Quigg A, Finkel ZV, Milligan AJ, Wyman K, Falkowski PG, Morel FMM (2003) 371
The elemental composition of some marine phytoplankton. J Phycol 39:1145-1159 372
doi:10.1111/j.0022-3646.2003.03-090.x 373
Hu Q (2004) Environmental effects on cell composition. In: Richmond A (ed) Microalgal 374
culture. Biotechnology and applied phycology. Blackwell Science Ltd., Oxford, UK., pp 83-375
93 376
Ji C-F, Yu X-J, Chen Z-A, Xue S, Legrand J, Zhang W (2011) Effects of nutrient deprivation 377
on biochemical compositions and photo-hydrogen production of Tetraselmis subcordiformis. 378
Int J Hydrogen Energ 36:5817-5821 doi:10.1016/j.ijhydene.2010.12.138 379

17
Kamiya R, Witman GB (1984) Submicromolar levels of calcium control the balance of 380
beating between the 2 flagella in demembranated models of Chlamydomonas. J Cell Biol 381
98:97-107 382
Krieger A, Weis E, Demeter S (1993) Low-pH-induced Ca2+
ion release in the water-splitting 383
system is accompanied by a shift in the midpoint redox potential of the primary quinone 384
acceptor QA. BBA-Bioenergetics 1144:411-418 doi:10.1016/0005-2728(93)90128-3 385
Lowry OH, Rosebrough NJ, Farr AL, Randall RJ (1951) Protein measurement with the Folin 386
phenol reagent. J Biol Chem 193:265-275 387
Marcelle RD (1995) Mineral nutrition and fruit quality. Acta Hort 383:219-226 388
Markina D, Gislerød HR (2015a) Effects of light intensity, temperature, and CO2 389
concentration on photoautotrophic growth and biochemical composition of Chlamydomonas 390
reinhardtii. Unpublished 391
Markina D, Gislerød HR (2015b) Modeling the effects of nutrient concentrations on the 392
photoautotrophic growth and biochemical composition of Chlamydomonas reinhardtii. 393
Unpublished 394
Markina D, Mortensen LM, Gislerød HR (2015) Effects of ammonium, phosphate, sulfate, 395
and carbon dioxide concentrations on starch, protein, and chlorophyll contents during 396
photoautotrophic growth of Chlamydomonas reinhardtii. Submitted to Journal of Phycology 397
Markou G, Angelidaki I, Georgakakis D (2012) Microalgal carbohydrates: an overview of the 398
factors influencing carbohydrates production, and of main bioconversion technologies for 399
production of biofuels. Appl Microbiol Biot 96:631-645 doi:10.1007/s00253-012-4398-0 400
Marschner H (1995) Mineral nutrition of higher plants., 2nd edn. Academic Press, San Diego, 401
CA 402
Marschner H, Cakmak I (1989) High light intensity enhances chlorosis and necrosis in leaves 403
of zinc, potassium, and magnesium deficient bean (Phaseolus vulgaris L.) plants. J Plant 404
Physiol 134:308-315 405

18
Melis A, Zhang LP, Forestier M, Ghirardi ML, Seibert M (2000) Sustained photobiological 406
hydrogen gas production upon reversible inactivation of oxygen evolution in the green alga 407
Chlamydomonas reinhardtii. Plant Physiol 122:127-135 408
Oh-Hama T, Miyachi S (1988) Chlorella. In: Borowitzka MA, Borowitzka LJ (eds) Micro-409
algal biotechnology. Cambridge University Press. , Cambridge, pp 3-26 410
Paiva EAS, Arruda Sampaio R, Prieto Martinez HE (1998) Composition and quality of 411
tomato fruit cultivated in nutrient solutions containing different calcium concentrations. J 412
Plant Nutr 21:2653-2661 doi:10.1080/01904169809365595 413
Philipps G, Happe T, Hemschemeier A (2012) Nitrogen deprivation results in photosynthetic 414
hydrogen production in Chlamydomonas reinhardtii. Planta 235:729-745 415
doi:10.1007/s00425-011-1537-2 416
Quarmby LM, Hartzell HC (1994) Two distinct, calcium-mediated, signal transduction 417
pathways can trigger deflagellation in Chlamydomonas reinhardtii. J Cell Biol 124:807-815 418
Richmond A (ed) (2004) Handbook of microalgal culture. Biotechnology and applied 419
phycology., 1st edn. Blackwell Science Ltd., Oxford 420
Rudd JJ, Franklin-Tong VE (1999) Calcium signaling in plants. Cell Mol Life Sci 55:214-421
232 422
Sanders D, Brownlee C, F. HJ (1999) Communicating with calcium. Plant Cell 11:691-706 423
Shaul O (2002) Magnesium transport and function in plants: the tip of the iceberg. Biometals 424
15:309-323 425
Siaut M et al. (2011) Oil accumulation in the model green alga Chlamydomonas reinhardtii: 426
characterization, variability between common laboratory strains and relationship with starch 427
reserves. Bmc Biotechnol 11:7 doi:10.1186/1472-6750-11-7 428
Sueoka N (1960) Mitotic replication of deoxyribonucleic acid in Chlamydomonas reinhardtii. 429
P Natl Acad Sci USA 46:83-91 430

19
Tamburic B, Zemichael FW, Maitland GC, Hellgardt K (2011) Parameters affecting the 431
growth and hydrogen production of the green alga Chlamydomonas reinhardtii. Int J 432
Hydrogen Energ 36:7872-7876 doi:10.1016/j.ijhydene.2010.11.074 433
Tuxhorn J, Daise T, Dentler WL (1998) Regulation of flagellar length in Chlamydomonas. 434
Cell Motil Cytoskel 40:133-146 435
Yao C, Ai J, Cao X, Xue S, Zhang W (2012) Enhancing starch production of a marine green 436
microalga Tetraselmis subcordiformis through nutrient limitation. Bioresource Technol 437
118:438-444 doi:10.1016/j.biortech.2012.05.030 438
Zhang L, Happe T, Melis A (2002) Biochemical and morphological characterization of 439
sulfur-deprived and H2-producing Chlamydomonas reinhardtii (green alga). Planta 214:552-440
561441
20
List of figures 442
Figure 1. Effect of different concentrations of calcium and magnesium (mM) on the pH 443
(means ± SD, n = 3) of the C. reinhardtii batch cultures. 444
Figure 2. Effect of different concentrations of calcium and magnesium (mM) on the optical 445
density (OD, λ = 750 nm, means ± SD, n = 3) (a), and dry weight (g L-1
, means ± SD, n = 3) 446
(b) of the C. reinhardtii batch cultures. 447
Figure 3. Effect of different concentrations of calcium and magnesium (mM) on the starch (a) 448
and protein (b) contents (% of DW, means ± SD, n = 3) of the C. reinhardtii batch cultures. 449
Figure 4. Effect of different concentrations of calcium and magnesium (mM) on the total 450
chlorophyll concentration (µg mL-1
, means ± SD, n = 3) (a) and on the total chlorophyll 451
content (% of DW, means ± SD, n = 3) of the C. reinhardtii batch cultures. 452
453

21
Figures 454
Time (d)
0 1 2 3 4 5 6 7 8 9 10
pH
6.0
6.2
6.4
6.6
6.8
7.0
7.2
0.068 Ca - 0.081 Mg
0.17 Ca - 0.203 Mg
0.34 Ca - 0.405 Mg
0.68 Ca - 0.81 Mg
455
Figure 1. Effect of different concentrations of calcium and magnesium (mM) on the pH 456
(means ± SD, n = 3) of the C. reinhardtii batch cultures. 457
458
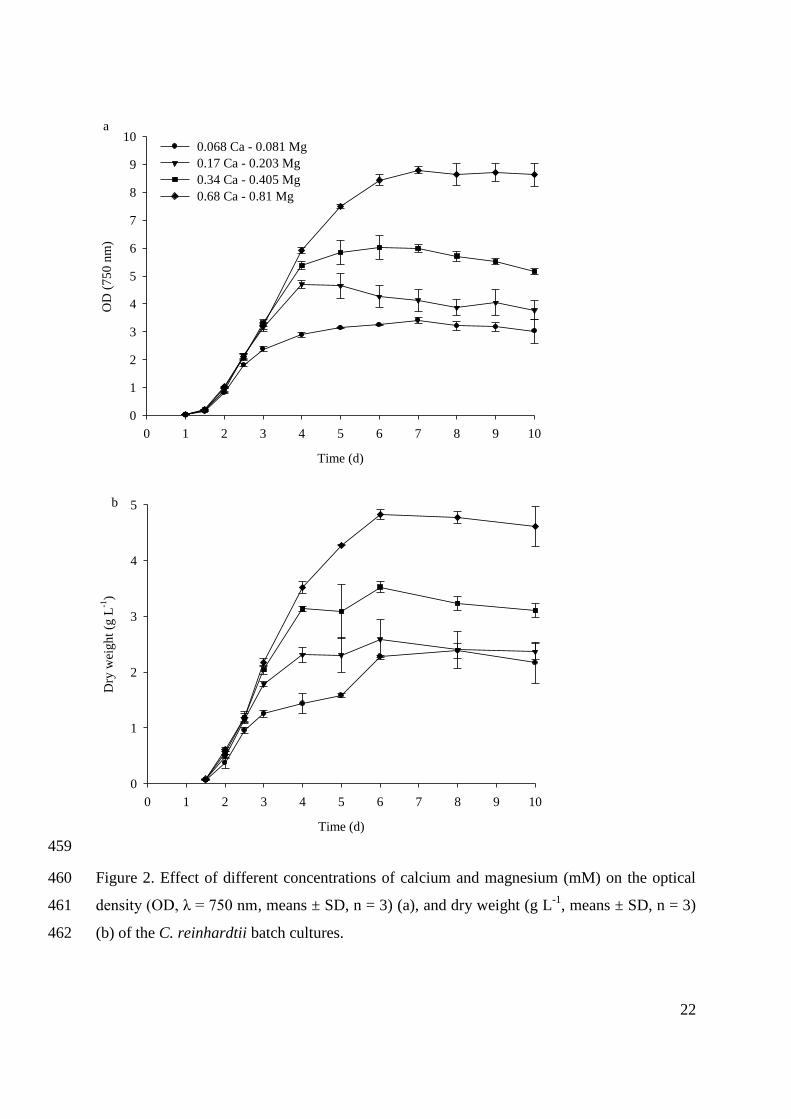
22
Time (d)
0 1 2 3 4 5 6 7 8 9 10
OD
(7
50
nm
)
0
1
2
3
4
5
6
7
8
9
100.068 Ca - 0.081 Mg
0.17 Ca - 0.203 Mg
0.34 Ca - 0.405 Mg
0.68 Ca - 0.81 Mg
Time (d)
0 1 2 3 4 5 6 7 8 9 10
Dry
wei
gh
t (g
L-1
)
0
1
2
3
4
5b
a
459
Figure 2. Effect of different concentrations of calcium and magnesium (mM) on the optical 460
density (OD, λ = 750 nm, means ± SD, n = 3) (a), and dry weight (g L-1
, means ± SD, n = 3) 461
(b) of the C. reinhardtii batch cultures. 462

23
Time (d)
0 1 2 3 4 5 6 7 8 9 10
Sta
rch
co
nte
nt
(% o
f D
W)
0
5
10
15
20
25
30
35 0.068 Ca - 0.081 Mg
0.17 Ca - 0.203 mg
0.34 Ca - 0.405 Mg
0.68 Ca - 0.81 Mg
a
Time (d)
0 1 2 3 4 5 6 7 8 9 10
Pro
tein
co
nte
nt
(% o
f D
W)
0
10
20
30
40
50
b
463
Figure 3. Effect of different concentrations of calcium and magnesium (mM) on the starch (a) 464
and protein (b) contents (% of DW, means ± SD, n = 3) of the C. reinhardtii batch cultures. 465

24
Time (d)
1 2 3 4 5 6 7 8 9 10
Tota
l ch
loro
phy
ll (
µg m
L-1
)
0
10
20
30
40
50
60
70
80
90
0.068 Ca - 0.081 Mg
0.17 Ca - 0.203 Mg
0.34 Ca - 0.405 Mg
0.68 Ca - 0.81 Mg
a
Time (d)
1 2 3 4 5 6 7 8 9 10
Tota
l ch
loro
phyll
(%
of
DW
)
0.0
0.5
1.0
1.5
2.0
2.5
3.0
3.5b
466
Figure 4. Effect of different concentrations of calcium and magnesium (mM) on the total 467
chlorophyll concentration (µg mL-1
, means ± SD, n = 3) (a) and on the total chlorophyll 468
content (% of DW, means ± SD, n = 3) of the C. reinhardtii batch cultures. 469