Embed Size (px)
Citation preview

Effects of Corporate Diversificationon Productivity
ANTOINETTE SCHOAR*
ABSTRACT
Using plant-level observations from the Longitudinal Research Database I showthat conglomerates are more productive than stand-alone firms at a given point intime. Dynamically, however, firms that diversify experience a net reduction in pro-ductivity. While the acquired plants increase productivity, incumbent plants suffer.Moreover, stock prices track firm productivity and this tracking is equally strongfor diversified and stand-alone firms. Therefore, lower transparency of conglom-erates is unlikely to explain the discrepancy between productivity and stock priceson average. Finally, I offer some evidence that this discrepancy may arise becauseconglomerates dissipate rents in the form of higher wages.
CORPORATE DIVERSIFICATION HAS RECEIVED much attention from academics aswell as management practitioners. Several papers over the last decade haveargued that diversification is related to lower valuation for shareholders.Lang and Stulz ~1994!, for example, find that diversified firms trade at anaverage discount of about eight percent relative to a portfolio of comparablestand-alone firms.1 A number of recent studies, however, question the inter-pretation of these findings or even their validity. Graham, Lemmon, andWolf ~1998! or Campa and Kedia ~1999! suggest that the discount should notbe interpreted as value destruction due to diversification, since firms whichdiversify are already discounted prior to diversifying. Moreover, Harris ~1998!or Villalonga ~2000! argue that COMPUSTAT segment data are systemati-cally biased in favor of finding a diversification discount.
* Sloan School of Management, MIT. I am indebted to my advisors Steve Kaplan, RaghuRajan, Sherwin Rosen ~Chairman!, and Luigi Zingales for their encouragement and numerousdiscussions throughout my dissertation. Also I would like to acknowledge helpful commentsfrom Judy Chevalier, Matthias Doepke, Luis Garicano, Owen Lamont, Guilherme Marone, Gor-don Phillips, David Scharfstein, René Stulz, and participants of finance seminars at Chicago,Columbia, Duke, HBS, Michigan, MIT, Northwestern, NYU, Ohio State, Princeton, Stanford,UCLA, Wharton, and Yale. Finally, many thanks are due to Sendhil Mullainathan and Mari-anne Bertrand for data and helpful comments. The research in this paper was conducted whilethe author was a research associate at the Boston Research Data Center. Research results andconclusions expressed are those of the author and do not necessarily indicate concurrence of theBureau of the Census. This paper has been screened to insure that no confidential data isrevealed. Any errors and omissions are the responsibility of the author.
1 Berger and Ofek ~1995!, Servaes ~1997!, and Lamont and Polk ~2001! provide additionalevidence on the diversification discount. Negative stock price reactions for the acquirer in adiversifying takeover announcement are documented by Môrck, Shleifer, and Vishny ~1990! andMatsusaka ~1993!.
THE JOURNAL OF FINANCE • VOL. LVII, NO. 6 • DECEMBER 2002
2379
Since the evidence from market valuations is inconclusive and might notbe adequate given the above mentioned data limitations, the current papertakes a different approach. Using detailed plant-level information from theLongitudinal Research Database ~LRD!, I look inside the black box of con-glomerates. The goal of this study is to determine the real effects of diver-sification and to tie them back to cross-sectional differences in market valuesbetween diversified firms.
Examining the productive efficiency of firms, measured by total factorproductivity, I find that contrary to what the diversification discount mightsuggest, plants in diversified firms are, on average, seven percent more pro-ductive than plants in comparable single-segment firms. Increases in diver-sif ication, however, are associated with a decline in the firm’s overallproductivity. While the newly acquired plants increase their productivity bythree percent, incumbent plants show productivity declines of almost twopercent. Since there are many more incumbent than acquired plants, thetotal effect on firm productivity is negative. In other words, diversified firmsexperience a “new toy” effect, whereby management focus shifts towardsnew segments at the expense of existing divisions. As a whole, these resultsindicate that diversified firms have a productivity advantage over their stand-alone counterparts. They even increase the productivity of their acquiredassets. With each diversifying move, however, these firms lose some of theirproductivity advantage.
This paper contributes to a small group of empirical studies on the pro-ductivity of diversified firms.2 Using a much smaller sample of LRD plantsin 1980, Lichtenberg ~1992! finds ambiguous results on the productivitydifference between diversified and stand-alone firms. A more recent paperby Maksimovic and Phillips ~2002! compares productivity between the dif-ferent segments within a conglomerate. The authors find that main seg-ments are more productive than peripheral segments and that the salesgrowth of a division varies with its productivity and industry businesscycle. Moreover, Maksimovic and Phillips ~2001! shows that acquired as-sets had low productivity before and experience an increase in productivityafter the ownership change. The extent of this increase depends on theproductivity of the acquiring firm and the type of division ~main or periph-eral! that is buying or selling the plants. In a related paper, McGuckin andNguyen ~1995! study the productivity of plants that change owners in thefood manufacturing industry. The paper contrasts the productivity of smalland large plants that change owners: Large plants have low productivitywhile small plants have high productivity before an acquisition. The au-thors attribute this contrast to differences in the motives for buying largeversus small plants.
2 A related body of literature on real distortion in diversified firms studies the efficiency ofinternal capital markets; see Ravencraft and Scherer ~1987!, Lamont ~1997!, Scharfstein ~1997!,Shin and Stulz ~1998!, Chevalier ~1999!, and Hubbard and Palia ~1999!.
2380 The Journal of Finance

The work that follows complements the existing literature by analyzingthe overall productivity of conglomerates relative to stand-alone firms. Itbuilds on prior results by studying the effects of diversifying acquisitions onthe productivity of the firm’s incumbent plants and by contrasting it withthe productivity of newly acquired plants.
This paper takes the current literature a step further by linking stockmarket performance back to a firm’s productivity. I find that market values,such as excess value, correlate strongly with firm productivity, both in thecross section and over time. Interestingly, this correlation is at least as strongfor conglomerates as for stand-alone firms. This suggests that differences intransparency between conglomerates and stand-alone firms cannot explainthe diversification discount. Despite the high correlation between stock pricesand productivity, I still find a diversification discount of about 10 percentalongside the seven percent productivity premium in this sample.
Finally, I examine whether rent dissipation by conglomerates can explainthis discrepancy. I find that conglomerates do not dissipate rents in the formof higher overheads. But I offer suggestive evidence that conglomerates leavemore rents to their workers. Employees in diversified firms are paid roughlyeight percent more than in comparable stand-alone firms.3 Under reason-able assumptions, this wage differential can account for about 30 percent ofthe discount. In other words, rent dissipation in the form of higher wagesmay help explain why conglomerates trade at a discount despite their higheraverage productivity.
The remainder of the paper is structured as follows. Section I describesthe data sample and the construction of variables used in this analysis. Sec-tion II lays out the findings on the productivity differential of diversifiedfirms, and Section III examines the dynamic effects of diversification. Sec-tion IV reports the results of several robustness checks. Section V ties thefindings on stock market valuations back to the productivity premium. Sec-tion VI analyzes the wage premium for workers in diversified firms, andSection VII concludes.
I. Data Sample and Construction of Variables
The data for this study is obtained from the Longitudinal Research Data-base ~LRD! at the U.S. Bureau of the Census. The LRD is a large microdatabase containing plant level information for firms in the manufacturingsector ~SIC codes 2,000 to 3,999!. McGuckin and Pascoe ~1988! provide adetailed description of the LRD and the method of data collection. Thereare two major advantages to using LRD data relative to COMPUSTATdata in this study. First, the LRD gives much more detailed information on
3 Pure redistribution does not necessarily constitute inefficiency from a social point of view.But if rent dissipation distorts the cost of capital, it can lead to misallocation of resources indiversified firms.
Effects of Corporate Diversification on Productivity 2381

plants within a segment. Second, plant level data allows me to identify theindividual performance of acquired plants before and after the ownershipchange.
I use a subsample of LRD plants that belong to publicly traded firms andcan be matched to COMPUSTAT data. The only available merge betweenthe LRD and COMPUSTAT files includes all the firms that were listed inthe COMPUSTAT files in 1987 and matches the corresponding plants in theLRD to these firms. This match is repeated for all sample years to create apanel of all plants belonging to the COMPUSTAT firms that existed in 1987.The advantage of this sample selection is that it allows me to match LRDdata to financial variables from COMPUSTAT and thus ensures compara-bility with results from prior studies. Moreover, it helps obtain a homo-geneous sample of manufacturing establishments, since a large fraction ofthe manufacturing firms contained in the LRD are very small businesses.The disadvantage of using this LRD–COMPUSTAT match is that only firmsthat were present in 1987 are included in the sample. In principle, this couldintroduce bias, if there are differences in the survival probability of diversi-fied and stand-alone firms. However, when I reestimate my results for the1987 sample alone, all the results are unchanged. Moreover, under the mostplausible assumptions, a diversified firm should have a greater likelihood ofsurvival than a stand-alone firm, since only one of its segments has to sur-vive. If a single-segment firm underperforms, it is more likely to be shutdown completely. Therefore, the single-segment firms in the sample shouldoverrepresent above-average performers. This will left-censor the perfor-mance of single-segment firms and bias the sample against my results.
A. Productivity Measures
My primary measure of firm performance is total factor productivity ~TFP!at the three-digit industry level.4 TFP measures are obtained at the plantlevel by estimating a log-linear Cobb–Douglas production function for eachindustry and year. Here individual plants are indexed i, industries j for eachyear t in the sample:
ln~ yijt ! � ajt � bjt ln~Kijt !� cjt ln~Lijt !� djt ln~Mijt !� eijt . ~1!
Since coefficients on capital, labor, and material inputs can vary by in-dustry and year, this specification allows for different factor intensities indifferent industries. Industry is defined at the level of three-digit SIC codes.These production function estimates are pooled across plants of diversified
4 I reestimate my results using value-added production functions and return on capital andfind equivalent results. The results also hold when using industry classifications at the two- orfour-digit SIC level.
2382 The Journal of Finance

and stand-alone firms.5 The TFP measure for each individual plant is theestimated residual from these regressions. It can be understood as the rel-ative productivity rank of a plant within its industry. Since these regres-sions include a constant term, TFP only contains the idiosyncratic part ofplant productivity.
LRD data is used to match the variables in the production function asclosely as possible. Output ~ y! is constructed as plant sales ~total value ofshipments in the LRD! plus changes in the value of inventories for finishedgoods and work in process. Ideally, TFP would be constructed from actualquantities. If product markets are not perfectly competitive, the residualmight ref lect variations in efficiency as well as differences in markups. How-ever, I do not find evidence that diversified firms are more likely to operatein concentrated industries nor that they perform better in these industries.
Labor inputs ~L! are formed as production worker equivalent man hours.I also reestimate the TFP regression specifying labor wage bill to proxy forworker quality. Results remain qualitatively the same. Values for the capitalstock ~K ! are generated by the recursive perpetual inventory formula. Toreduce the impact of potential accounting manipulations of book values ofcapital stock, I use the earliest available book value of capital as the initialvalue ~this is either the value in 1963, the first year this information wascollected, or the first year a plant appears in the LRD sample!. These valuesare written forward annually with nominal capital expenditure and depre-ciated with the economic depreciation rate at the industry level obtainedfrom the Bureau of Economic Analysis.6 Finally, inputs ~M! are expenses forparts and intermediate goods, fuel, and energy purchased as well as inputsfrom contracted work.7
B. Measures of Diversification
Although explicit diversification measures for the firms surveyed are notprovided in the LRD, they can be constructed from firm identifiers. Oneimportant caveat is that the LRD contains only information for establish-ments in the manufacturing sector; the nonmanufacturing segments of acompany that is diversified outside of the manufacturing sector will not besurveyed in the LRD. For example, a car manufacturer that also operates inbanking will appear as a nondiversified firm in the LRD. To identify diver-
5 This specification could introduce bias if these two types of firms used different productiontechnologies. Therefore, I repeat these estimates separately for plants of diversified and stand-alone firms. The results remain qualitatively unchanged. I also compare factor intensities ofplants in diversified and stand-alone firms within the same industry and find no significantdifference.
6 Estimates of economic depreciation rates for buildings and structures, as well as def latorsfor capital stock at the four-digit SIC level, are available from the Bureau of Economic Analysis.The Bartelsman and Gray database at the NBER provides yearly price def lators for output,material, and investment at the four-digit SIC level.
7 For a detailed description of the construction of TFP measures from LRD variables, seeLichtenberg ~1992!.
Effects of Corporate Diversification on Productivity 2383

sification outside of manufacturing, I supplement the diversification mea-sures from the LRD with information on nonmanufacturing segments fromthe COMPUSTAT Business Segment Information Files.
The most straightforward measure of diversification counts the number ofsegments per year at the two-digit SIC level. To incorporate information onthe relative size of segments, I calculate Herfindahl-based indices of firmdiversification, where the segment weights are either total value of ship-ments or total capital stock. This measure is one minus a Herfindahl indexfor the firm’s business segments in manufacturing. It increases with thenumber of segments, holding constant the variance of segment size.8
II. Are Diversified Firms More Efficient?
A. Descriptive Statistics
The descriptive statistics in Table I document size differences betweenhighly diversified, diversified, and nondiversified firms.9 On average, non-diversified firms operate three plants, while diversified firms operate 10plants, and highly diversified firms average 43 plants. Similarly, this differ-ence is observable at the segment level: Diversified firms have more thantwice as many plants per segment than nondiversified firms. For individualplants, however, this trend is not as pronounced. The average plant size fora diversified firm, measured by the total value of shipments or capital stock,is only 10 percent larger than the plant size of stand-alone firms.
Moreover, Table I shows that diversified firms tend to operate more cap-ital intensively than nondiversified firms. Capital per worker is $51,000 instand-alone firms and $57,000 and $54,000 in diversified and highly diver-sified firms, respectively. This means diversified firms are about five per-cent more capital intensive than nondiversified firms. Looking at partialproductivity measures, I find that output per worker, measured by totalvalue of shipments divided by total hours worked, is about five percent lowerfor stand-alone firms compared to diversified firms. Capital productivity,measured by total value of shipments per unit of capital, is slightly lower fordiversified firms relative to stand-alone ones. Finally, hourly wages for bluecollar workers is $10.00 in stand-alone firms versus $10.50 in diversifiedfirms. This five percent wage difference could be due to higher labor pro-ductivity in diversified firms. Yet labor productivity should be higher in di-versified firms, since they are also more capital intensive. Therefore, thedescriptive statistics cannot help determine whether workers in diversified
8 Several authors have voiced concern that relatedness between industries might not besatisfactorily controlled when using SIC codes; see, for example, Matsusaka ~1993! or Scharf-stein ~1997!. Therefore, I use data from the input–output tables at the Bureau of EconomicAnalysis to adjust the diversification measures for vertical relatedness. See the robustnesschecks in Section VII for more details.
9 Due to the disclosure rules of the Census Bureau, I cannot show median numbers or quar-tile ranges.
2384 The Journal of Finance

firms are compensated for higher productivity or whether they earn rents.Generally, partial productivity measures are problematic when comparingplants across different industries, because production functions and factorintensities vary systematically.
B. Productivity Premium for Diversified Firms
I use TFP as a comprehensive index of efficiency. To analyze systematic dif-ferences in the productivity of diversified versus stand-alone firms, I regressplant-level TFP on different measures of diversification ~DIV! and controls:10
TFPijt � a � b~DIVit !� c~SIZEit !� d~AGEit !� eijt . ~2!
I include controls for segment as well as firm size in the regression, sincea number of prior studies have argued that economies of scope affect plantproductivity ~see, e.g., Lichtenberg ~1992! or Demsetz ~1973!!. Ex ante, how-
10 The results are qualitatively unchanged if I estimated the relationship between TFP andproductivity in a one-step regression.
Table I
Descriptive StatisticsPlant-level characteristics for the sample firms in the LRD between 1977 and 1995. Total valueof shipments and capital stock are in million dollars, hours worked in millions, and productionwages are in dollars. Total value of shipments is plant sales in the LRD and contains interfirmtransfers valued at market prices. Capital stock includes book values of machinery and build-ings. Hours worked is defined as production-worker hours per year. Diversification is definedas number of segments at the two-digit SIC level. Stand-alone firms operates in only one in-dustry. Multisegment firms are subdivided into diversified firm ~have more than one but lessthan the mean number of segments of diversified firms! versus highly diversified firms ~abovemean number of segments!.
Sample
All Firms Stand-Alone Diversified Highly Diversified
Mean SD Mean SD Mean SD Mean SD
Plant levelTotal value of shipments 40.43 43.91 38.53 41.56 41.25 44.30 40.80 43.46Capital stock 16.70 14.78 13.03 14.65 17.77 14.79 16.81 14.86Hours worked 0.26 0.25 0.25 0.24 0.25 0.25 0.27 0.26Capital0worker 55.08 46.47 51.59 46.65 57.16 47.07 53.71 45.61Production wage 10.45 3.69 10.08 3.72 10.62 3.71 10.35 3.66Total value of shipments0hour 172.59 123.56 163.31 122.07 182.59 128.57 164.95 118.09Total value of shipments0capital 7.82 5.65 8.39 5.69 7.87 5.66 7.61 5.62
Number of observations 245,006 23,770 112,669 108,567
Firm Level:Plants per firm 12.03 20.38 3.46 5.76 10.29 14.21 42.64 34.89Plants per segment 6.31 10.19 3.46 5.76 6.28 9.98 14.17 15.09Two-digit diversification 2.87 2.30 1.00 0.00 2.90 1.97 7.82 1.98
Number of observations 20,366 6,869 10,951 2,546
Effects of Corporate Diversification on Productivity 2385

ever, it is not clear whether economies of scope in diversified firms shouldoccur at the segment or firm level. The measure of firm ~segment! size is theoverall number of plants a firm ~segment! operates in.11
Since the descriptive statistics indicate significant size differences be-tween diversified and stand-alone firms, I allow the slope of the size controlsto vary across size quintiles. Plant age is included to control for vintageeffects. It is not necessary to control for plant size, since I do not imposerestrictions on the coefficients of the production function in the TFP regres-sions. Economies of scale at the plant level are indicated by the sum of theinput coefficients in the Cobb–Douglas production function being greaterthan one. I correct the variance–covariance matrix for correlation at thefirm-year level. This is important, since the diversification index as well asthe controls for firm size vary only at the firm level, while the unit of ob-servation for the dependent variable is the individual plant. TFP measuresare windsorized at the 1st and 99th percentiles.
The results in Table II, columns ~1! to ~4! show that the coefficient ondiversification is positive and significant. The outcome is robust to differentmeasures of diversification and economically significant. For example, incolumn ~1! of Table II, moving from the first quartile of the distribution ofdiversification to the mean results in a productivity increase of seven per-cent. Under certain assumptions this can be translated into a more familiarmeasure of firm performance, like accounting profits. Holding input costsconstant, seven percent higher productivity translates into a seven percentincrease in revenues, ceteris paribus. An increase in revenues leads to amore than proportional increase in profits, since the elasticity of profits toproductivity is greater than one. Intuitively, an increase in productivity hold-ing all else constant leads to higher revenues without changing costs. Sinceprofits are revenues minus costs, the smaller the profit margin, the higherthe elasticity of profits to productivity.12 If I assume a revenue margin ofabout 40 percent over costs, profits increase by roughly 10 percent annually.All else equal, diversified firms should experience a percent diversificationpremium in the stock market.
The results presented in columns ~1! to ~4! of Table II are based on a panelregression which includes cross-sectional and longitudinal variation. To sep-arate the cross-sectional differences between plants from the effect of changesin diversification, I reestimate model ~2! with plant fixed effects. Two sourcesof variation in diversification remain in the sample when introducing plant
11 I do not use capital stock or total value of shipments at the firm or segment level as acontrol for size. This could induce a mechanical correlation with the dependent variable, sincethese values are used in the construction of TFP. In fact, when reestimating the model withfirm and segment size controls specified as total capital stock or sales, the coefficient on di-versification does not change qualitatively.
12 As an additional robustness check, I use a size-weighted regression, where each plant isweighted by its relative size within its firm. This specification reduces the impact of very smallsegments in the productivity regression. All results are qualitatively unchanged under thisspecification.
2386 The Journal of Finance

Table II
Effect of Diversification on ProductivityThe dependent variable is total factor productivity ~TFP! at the three-digit SIC level. TFP is theresidual from estimating a log linear Cobb–Douglas production function for each industry andyear at the plant level, where one regresses the value of output ~total value of shipmentsadjusted for changes in inventories! on labor ~production worker hours!, capital stock ~con-structed via the perpetual inventory method!, and material inputs ~intermediate inputs, fuels,and energy consumed!. Two-digit diversification is the logarithm of the number of segments atthe two-digit SIC level. Herfindahl is an assets-weighted measure of diversification. The dummyvariable Down is equal to one if a plant is a downstream segment in a vertically integratedfirm. Similarly, Up equals one if a plant is an upstream segment in a diversified firm, and zerootherwise. Controls for Segment size and Firm size are constructed as the number of plants atthe segment or firm level, respectively. These size controls are splined. Age is the logarithm ofplant age. Heteroskedasticity-robust standard errors are in parentheses. Standard errors arecorrected to allow for group effects within firms.
~1! ~2! ~3! ~4! ~5! ~6!
Two-digit diversification 0.064*** 0.034** �0.070** 0.042**~0.015! ~0.016! ~0.030! ~0.020!
Herfindahl 0.154*** 0.134**~0.043! ~0.049!
Age 0.142*** 0.142*** 0.135*** 0.136*** �0.018*** 0.135***~0.012! ~0.012! ~0.012! ~0.012! ~0.010! ~0.012!
Segment size1 0.167*** 0.165*** �0.047 0.168***~0.029! ~0.028! ~0.035! ~0.029!
Segment size2 0.158*** 0.161*** �0.082 0.157***~0.036! ~0.036! ~0.039! ~0.036!
Segment size3 0.080 0.087 0.113* 0.081~0.059! ~0.059! ~0.058! ~0.058!
Segment size4 �0.79 �0.066 �0.017 �0.082~0.070! ~0.070! ~0.067! ~0.070!
Segment size5 �0.034 �0.017 0.089 �0.036~0.072! ~0.072! ~0.083! ~0.072!
Firm size1 0.014 0.010 0.080** 0.010***~0.026! ~0.024! ~0.034! ~0.009!
Firm size2 0.016 0.016 0.136** 0.008~0.050! ~0.050! ~0.051! ~0.050!
Firm size3 �0.007 �0.008 �0.136* �0.013~0.078! ~0.076! ~0.067! ~0.078!
Firm size4 �0.009 �0.024 0.191** �0.011~0.101! ~0.101! ~0.083! ~0.100!
Firm size5 �0.037 �0.042 0.112 �0.045~0.109! ~0.108! ~0.089! ~0.110!
Down 0.025~0.035!
Up 0.019~0.042!
Plant fixed effects No No No No Yes NoAdjusted R2 0.035 0.036 0.041 0.042 0.542 0.561Number of observations 245,006 245,006 245,006 245,006 245,006 245,006
The symbols ***, **, and * indicate statistical significance at the 1, 5, and 10 percent levels,respectively.
Effects of Corporate Diversification on Productivity 2387

fixed effects: ~1! the effect of a firm’s diversification on incumbent plantsand ~2! the effect of ownership changes on plants that move from a more toa less diversified firm or vice versa.13
Columns ~5! and ~6! of Table II show that the effect of changes in diver-sification on productivity is very different from the effect of variation inlevels of diversification. When including plant fixed effects, the coefficienton diversification becomes negative. The findings in this section introduce arecurrent theme of this paper: There is a substantial difference in the staticeffect of being diversified and the dynamic effect of becoming more diversi-fied. The positive correlation between diversification and productivity in themodel without plant fixed effects is primarily driven by heterogeneity be-tween plants in diversified versus stand-alone firms. In contrast, the spec-ification with plant fixed effects provides a first piece of evidence that thereexist dynamic inefficiencies from diversification.
C. Acquisitions of New Plants
The productivity premium found in the cross section may be due to thefact that diversified firms are cash rich and can buy more productive plants,even though subsequently they run their plants down. In contrast, if diver-sified firms are more efficient at running their operation, the productivity ofthe assets they acquire should increase.
To differentiate between these alternatives, I analyze the subsample ofplants that are acquired between 1977 and 1995. These are diversifying aswell as related acquisitions. There are about 12,000 ownership changes inthe sample.14 I choose a three-year window before and after the acquisitionevent. Included are only acquisitions for which at least one observation inthree years before and after the event is available. I estimate the followingmodel:
TFPijt � ai � b~AFTER!� c~AFTER * DIVERS!
� d~DIVERS!� e~SIZEit !� eijt .~3!
AFTER is a dummy variable equal to one in each of the three periods afterthe acquisition and zero in the three periods before the acquisition. DIVERSdifferentiates acquisitions by the type of their acquirer. It is equal to one fora move from a less to a more diversified firm and zero for a move in theother direction. About 60 percent of the acquisitions in the sample involve amove from a less diversified to a more diversified firm.
13 A concern in this context is that acquisitions might lead to changes in production inputs,which could show up as changes in TFP. In this case, the interpretation of the results should bevery different. However, I find no evidence that input levels or factor intensities vary signifi-cantly after a change in the level of diversification.
14 This is the number of individual plants that change owners. Included are acquisitions ofsingle plants as well as ownership changes of multiple plants at the same time.
2388 The Journal of Finance

First, I estimate the model without the interaction term to get a bench-mark for the full sample of acquisitions. The first column of Table III showsthat after the change in ownership, the productivity of the acquired plantsincreases slightly. This positive effect may result from a reallocation of plantsto the owners that have superior management abilities. This result is con-sistent with Maksimovic and Phillips ~2001!, who use a different sample ofplants. Interestingly, column ~2! of Table III shows a positive coefficient onthe interaction term. Plants that move into a diversified firm experience astronger positive effect on productivity after an acquisition than do plantsthat move from a diversified into a stand-alone firm. This change in pro-ductivity of about 0.4 percent translates to almost a one percent increase inprofits at the plant level.
Moreover, I find ~not reported here! that, on average, the productivity ofacquired plants in the three periods prior to an ownership change is declin-ing and lower than the mean productivity of plants in the sample. It is alsolower than the productivity of the acquirer. These results correspond to thefindings of Graham et al. ~1998! showing that the market value of acquisi-tion targets is declining in the periods before the ownership change. More-over, there is no significant difference in the ex ante productivity betweenplants that are bought by diversified firms and those bought by stand-alonefirms. These findings do not support the hypothesis that higher productivityin diversified firms is achieved by buying very productive plants and run-ning them down subsequently.
III. Dynamic Effects of Diversification
These results indicate that diversified firms have higher productivity thanstand-alone firms. However, this finding is driven by cross-sectional differ-ences between firms. In this section, I analyze the dynamic implications onfirm productivity of becoming more diversified, that is, diversification as acorporate strategy.
A. Incumbent Plants after Diversification
To isolate the effect on the incumbent plants of a diversifying firm, I es-timate a before–after estimator on the subsample of plants that were ownedby the firm before the diversifying move. These are benchmarked with theeffect of related acquisitions on the incumbents. Without this comparisongroup, a simple before–after estimator might just be picking up the fact thatany major acquisition leads to a drop in firm productivity; the effect neednot be specific to diversification. I estimate the following model:
TFPijt � ai � b~AFTER!� c~AFTER * DIVERS!
� d~DIVERS!� e~SIZEit !� eijt .~4!
Effects of Corporate Diversification on Productivity 2389

Table III
Effect of Ownership Changes on Acquired PlantsThe sample contains only observations for plants that change owners in the three periods be-fore and after the acquisition. Columns ~1! and ~2! include diversifying as well as related ac-quisition events, column ~3! is based on the subsample of diversifying acquisitions. A diversifyingmove is characterized as an acquisition of a plant in a two-digit industry other than the existingindustries of the firm. Only acquisitions that constitute at least 10 percent of the firm’s pre-existing capital stock are included. The dependent variable is total factor productivity ~TFP! atthe three-digit SIC level ~as described in Table II!. After is a dummy variable equal to one inthe three periods after the acquisition and zero in the three periods before. Divers is a dummyvariable equal to one, if the acquired plant moves from a less to a more diversified firm, andzero otherwise. Controls for Segment size and Firm size are constructed as the number ofplants at the segment level or the firms level, respectively. The size variables are splined.Heteroskedasticity-robust standard errors are in parentheses. Standard errors are corrected toallow for group effects within firms, since diversification varies only at the firm level.
Specification
All Acquisitions Only Diversifications
~1! ~2! ~3!
After 0.004*** 0.000 0.029**~0.000! ~0.004! ~0.013!
Divers * After 0.006***~0.002!
Segment size1 0.031* 0.033** 0.033~0.016! ~0.016! ~0.027!
Segment size2 0.010 �0.009 �0.087*~0.021! ~0.021! ~0.046!
Segment size3 �0.006 �0.003 0.033*~0.029! ~0.037! ~0.019!
Segment size4 �0.007 �0.004 �0.071***~0.028! ~0.029! ~0.017!
Segment size5 0.040 0.048 0.045~0.042! ~0.042! ~0.050!
Firm size1 �0.011 �0.012 �0.060~0.013! ~0.013! ~0.039!
Firm size2 0.011 0.012 0.052~0.017! ~0.018! ~0.039!
Firm size3 �0.006 �0.009 �0.013~0.010! ~0.010! ~0.025!
Firm size4 �0.014 �0.016 �0.039~0.011! ~0.011! ~0.030!
Firm size5 0.013 0.010 0.024~0.010! ~0.010! ~0.023!
Plant fixed effects Yes Yes YesAdjusted R2 0.467 0.421 0.507Number of observations 28,118 28,118 3,542
The symbols ***, **, and * indicate statistical significance at the 1, 5, and 10 percent levels,respectively.
2390 The Journal of Finance

AFTER is a dummy variable equal to one in the three periods after anacquisition and zero otherwise. DIVERS indicates whether an event is adiversifying ~DIVERS equals one! or related expansion ~DIVERS equals zero!.A diversifying move can take the form of either an acquisition or plant birthin an industry that the firm did not operate in previously.15
I choose a three-year window before and after the acquisition event andrequire at least one observation in the three years before as well as after theevent. Incumbent plants that are divested by a firm within three years afteran acquisition are excluded from the sample. Furthermore, if a firm diver-sifies more than once within the three years following the first diversifica-tion, only the first event is considered. In fact, these selection criteria shouldbias the sample against finding a decline in productivity in incumbent plants,since plants that are divested have deteriorating productivity. Finally, I ex-clude events for which the capital stock of the new addition is less than10 percent of the firm’s capital stock prior to the event. The results are un-changed when I include the observations that are omitted in this specification.
Table IV, column ~2!, shows that diversifying events have a much largernegative effect on the incumbent plants of a firm than expansions into re-lated industries. The coefficient on the interaction term is negative and sta-tistically significant. This indicates a differential impact of diversificationon firm performance. If the decline in productivity were common to anychange in the firm’s organization, the development of TFP would not differbetween related and diversifying expansions. Additionally the results inTable IV show that firms which choose to diversify have slightly higher pro-ductivity than those that undertake related acquisitions. The coefficient onthe direct effect of DIVERS in column ~2! is positive but not significant.
To identify the size of the drop in productivity, column ~3! of Table IVreestimates the model only for the sample of diversifying acquisition. Theresults of this before–after estimator show that the productivity of incum-bent plants in the three periods after a diversifying event is three percentlower on average than in the three periods before. Column ~4! of Table IVrepeats this estimation at the firm level. Plant level TFP measures are ag-gregated up to the firm level by weighting these TFP measures with thecapital stock of the plant. This includes the incumbent as well as the ac-quired plants of the firm. The findings suggest that the overall productivityof a diversifying firm declines by more than two percent relative to the threeperiods before the diversification.16
15 A third source of increased diversification results from firms changing the SIC code ofexisting plants. I exclude these types of diversifying moves, since they seem most prone tomeasurement errors. When I include these types of diversifying moves in the estimation, theresults are qualitatively similar to the ones reported here.
16 To get a more detailed understanding of the productivity dynamics after a diversifyingmove, I reestimate the same model with separate dummies for each year in the event window.This specification ~not reported! shows that productivity rises in each of the three years beforediversification, but decreases afterwards. The most pronounced drop in productivity happens,however, in the two periods after the diversifying move.
Effects of Corporate Diversification on Productivity 2391

Table IV
Effect of Diversification on TFP of Incumbent PlantsThe dependent variable is total factor productivity ~TFP! at the three-digit SIC level ~as de-scribed in Table II!. After is a dummy variable equal to one in the three periods after a diver-sifying move and equal to zero in the three periods before. Controls for Segment size and Firmsize are constructed as the number of plants at the segment level or the firm level, respectively.The size variables are splined. The sample in columns ~1! and ~2! contains observations for theincumbent plants of a firm in the three periods before and after a related or diversifying ac-quisition. The results in column ~3! are based only on the subsample of diversifying acquisi-tions. The sample in column ~4! contains firm level observations, where firm TFP indexes areformed as the weighted average of the plant level TFP measures. A diversifying event is definedas an acquisition of a plant in a two-digit industry other than the firm’s existing industries.Heteroskedasticity-robust standard errors are in parentheses. Standard errors are corrected toallow for group effects within firms.
Specification
All Acquisitions Only Diversifications
~1! ~2! ~3! ~4!
After �0.002 0.001 �0.026*** �0.023***~0.002! ~0.003! ~0.004! ~0.006!
Divers 0.002~0.005!
Divers * After �0.010**~0.005!
Segment size1 0.025** 0.024* 0.032*~0.012! ~0.012! ~0.018!
Segment size2 �0.001 �0.001 �0.026~0.016! ~0.017! ~0.024!
Segment size3 �0.010 �0.010 0.001~0.007! ~0.007! ~0.009!
Segment size4 0.007 0.006 0.016~0.008! ~0.009! ~0.012!
Segment size5 0.017* 0.016* 0.013~0.009! ~0.009! ~0.013!
Firm size1 �0.003 �0.003 �0.006 0.009~0.011! ~0.011! ~0.039! ~0.015!
Firm size2 0.006 0.006 0.052 �0.052**~0.016! ~0.016! ~0.039! ~0.019!
Firm size3 0.003 0.004 �0.013 0.002~0.008! ~0.008! ~0.025! ~0.013!
Firm size4 �0.008 �0.006 �0.039 �0.006~0.009! ~0.009! ~0.030! ~0.016!
Firm size5 �0.003 �0.002 0.024 0.007~0.011! ~0.011! ~0.023! ~0.017!
Plant fixed effects Yes Yes Yes NoFirm fixed effects No No No YesAdjusted R2 0.537 0.536 0.572 0.545Number of observations 51,313 51,313 23,065 2,855
The symbols ***, **, and * indicate statistical significance at the 1, 5, and 10 percent level,respectively.
2392 The Journal of Finance

B. The “New Toy” Effect
Two theories of managerial behavior seem most promising for explainingthe decline in productivity of incumbent plants after a firm diversifies andhow this effect relates to the acquisition of new plants.
Imagine that once a firm diversifies managers shift their focus towardsthe new segments, while incumbent segments receive less attention. Thisbehavior, which I call the “new toy” effect, predicts that productivity in in-cumbent plants suffers, while the new segments improve. Similarly, Prala-had and Hamel ~1990! argue that diversification leads to the neglect of “corecompetencies.” A slightly different theory argues that an addition of newsegments increases the sheer number of tasks dealt with by the firm’s man-agement. Since a manager ’s time is limited, diversification forces managersto spread themselves too thin ~see Rosen ~1982! on the optimal allocation ofmanagerial talent in corporate hierarchies!. Both theories predict a declinein the productivity of the incumbent plants but differ in their predictionsabout the productivity development of new plants.
To distinguish between these two possible explanations, I estimate thechange in productivity for the plants that are acquired by a diversifyingfirm. The diversifying events coincide with the ones in Table III. Table IIIcolumn ~3! presents the results from the before–after regression of produc-tivity on an AFTER dummy for the plants that are acquired in a two-digitindustry not previously operated in by the acquirer. The coefficient on theAFTER dummy is positive and significant. On average the productivity ofthe new plants is about three percent higher after an ownership change.This is a substantial increase in productivity and is much larger than therise in productivity after a related acquisition. These results support the“new toy” effect. Diversification is accompanied by an increase in the pro-ductivity of the new segments, yet a decline in the productivity of the in-cumbent segments. One can speculate that the foundations for this productivitypattern are that new segments receive either more attention from top man-agement or that more talented managers get transferred to these segments.
Is this shift of focus rational? Put differently, is the move into “new toys”the cause of lower productivity in the incumbent plants, or merely a responseof managers to a decline in their original segments? If the goal of diversifi-cation is to move away from declining industries, one would expect growthopportunities to be higher, on average, in the new industries. I measure thegrowth opportunities of an industry as the median Tobin’s Q at the level oftwo-digit SIC codes. The results are qualitatively unchanged when usingindustry Q at the three- and four-digit SIC code level. I find ~not reported!that the industry Q of the new segments is below the average industry Q ofthe firm’s initial segments and also below the average Q within the fullsample. Graham et al. ~1998! find similar results for a sample of merger andacquisition transactions. This does not support the hypothesis that diversi-fication is an optimal response to low growth opportunities in the initialsegments.
Effects of Corporate Diversification on Productivity 2393

Another source of endogeneity occurs, if management moves into new in-dustries, when the firm is losing its competitive edge within its industry,even though the industry might be doing well. In this case, firms should bediscounted relative to other firms in their industry before the diversifica-tion, but improve afterwards. However, the observed patterns of market val-uations are exactly opposite. Firms that undertake diversifying movesexperience a decline in market value only after the event. This drop in val-uation after diversification is consistent with the results in Graham et al.~1998!, which show that the decline in excess value is due partly to buyingalready discounted assets. A similar pattern can be found for productivity.Before diversification, the performance of the incumbent plants is increas-ing, but after the acquisition, it is declining, with the sharpest decreaseoccurring in the first two periods after the event.
In summary, the evidence suggests that the “new toy” effect is more likelyto be a symptom of agency problems at the management level than an op-timal refocusing of corporate strategy. Although diversified firms are notbad per se, diversification reduces the productivity advantage these firmshave in the cross section.
IV. Robustness Checks
A couple of concerns may arise that are due to the plant level nature of thedata. I perform several robustness checks to rule out the most serious concerns.
A. Corporate Overhead
The LRD does not include information on firm facilities that are locatedaway from a manufacturing establishment, for example, administrative head-quarters or off-site marketing and sales departments. This might be of par-ticular concern for diversified firms, if they tend to centralize administrativefunctions and locate them separately from any of the manufacturing estab-lishments. Resulting productivity measures would systematically overstatethe efficiency of diversified companies.
The Bureau of the Census, in a separate survey, collects information onauxiliary facilities of manufacturing plants. The Central Auxiliary Organi-zations ~CAO! survey is conducted every five years and contains informationon the nonproduction facilities of manufacturing firms in the LRD. The vari-ables that are of interest to this study are employment, physical assets, andmaterial inputs at auxiliary facilities. The sample contains 3,625 firm-yearobservations for the four years surveyed. I can match over 80 percent of thefirms in each of the four years in which CAO data is available. I only includepure manufacturing firms in this sample so that resources from the LRD arerepresentative of the whole firm.
Since it is impossible to allocate overhead costs in the CAO to specificplants, I aggregate capital, labor, and material inputs up to the firm levelfor each year that is available in the CAO. I form a measure of excess over-
2394 The Journal of Finance

head costs for each firm and type of input, similar to the excess value mea-sures of Lang and Stulz ~1994!. These are constructed as the difference betweenthe actual ratio of inputs from the CAO to inputs from the LRD relative toa benchmark of imputed overhead cost. The latter is formed as the size-weighted sum of input ratios from the median stand-alone firm in the cor-responding industry. This method controls for differences in the utilizationof overhead facilities due to industry differences.
Excess overhead indices are regressed on the measure of diversificationand controls for firm size and year fixed effects. Table V shows that thefraction of inputs outside of manufacturing plants is negatively correlated tothe level of diversification. This holds for all types of inputs: employment,capital, and material. Columns ~2!, ~4!, and ~6! of Table V show that evenafter controlling for firm size, diversified firms use less overhead inputsthan stand-alone firms. These findings illustrate that omitted overhead costsdo not explain the productivity premium for diversified firms in the LRD.17
17 I also performed several additional robustness checks to rule out that diversified firmsreport lower inputs in the LRD. For example, the ratio of white collar to blue collar workers’hours might be lower for diversified firms indicating that they locate administrative jobs morefrequently at auxiliary facilities. However, I do not find significant differences in this ratio fordiversified relative to stand-alone firms.
Table V
Overhead CostsData on overhead inputs are obtained from the CAO ~Central Auxiliary Organizations! data-base at the Bureau of the Census for the years 1977, 1982, 1987, and 1992. Separate informa-tion on labor, capital, and material used are available. The dependent variables, Excess overheadcosts, are measured as the difference between the ratio of productive inputs in auxiliary facil-ities and the LRD and compared to a benchmark of imputed inputs. The benchmark of imputedinputs is constructed as the weighted sum of inputs from the median stand-alone firm in thecorresponding industry. Two-digit diversification is the logarithm of the number of segments atthe two-digit SIC level. Firm size is measured as the total value of capital at the firm level.Heteroskedasticity-robust standard errors are in parentheses.
Specification
Labor Capital Material
~1! ~2! ~3! ~4! ~5! ~6!
Two-digit diversification �0.018*** �0.016*** �0.003** �0.003* �0.001* �0.001*~0.003! ~0.004! ~0.001! ~0.002! ~0.000! ~0.000!
Firm size �0.002 �0.001 �0.001**~0.002! ~0.001! ~0.000!
Year fixed effects Yes Yes Yes Yes Yes YesAdjusted R2 0.073 0.074 0.069 0.069 0.089 0.089Number of observations 3,625 3,625 3,625 3,625 3,625 3,625
The symbols ***, **, and * indicate statistical significance at the 1, 5, and 10 percent levels,respectively.
Effects of Corporate Diversification on Productivity 2395

B. Transfer Pricing
Another problem with plant-level data is that transfer-pricing betweensegments might distort productivity measures. A large fraction of inputs indiversified firms might be supplied by other segments of the same firm. Ifprices for these transfers are strategically distorted, productivity measuresof the downstream segments might be biased upward ~or vice versa!.
Unfortunately, comprehensive information about the actual transfers isnot available from the LRD. Instead, I use the input–output tables at theBureau of Economic Analysis to create a matrix of vertical relatedness at theindustry level. Industries are considered vertically related if they receive atleast five percent of their inputs from another industry or supply more thanfive percent of their own outputs to one other industry. For each firm, I forma dummy variable, Down, equal to one if a plant belongs to a downstreamsegment in a vertically integrated firm, and zero otherwise. Similarly, Up isa dummy variable indicating a plant in an upstream segment. The diversi-fication measure used here is corrected for segments that are verticallyintegrated.
I repeat the basic productivity regression specified in Section III, includ-ing controls for whether plants belong to a downstream or upstream seg-ment within a diversified firm. Column ~6! of Table II shows that the coefficienton diversification remains positive even after controlling for vertical relat-edness. Moreover, the coefficients on the dummies are positive but not sig-nificant. Productivity is not significantly higher in related industries thatare integrated within a diversified firm.
Additionally, I compare material productivity ~output per unit of material!of plants in diversified firms to plants of stand-alone firms in the samedownstream industry. If diversified firms benefit from lower input prices,they should display higher output per dollar of materials used. Again, I donot find that diversified firms differ in their use of material inputs ~resultsare not reported!. It seems that transfer prices do not systematically distortproductivity measures in diversified firms.
V. Stock Market Valuations and the Productivity Premium
The productivity premium for diversified firms seems surprising giventhat, on average, these firms trade at a discount in the stock market. There-fore, it is important to determine whether information about the underlyingproductivity of a firm is embedded in its market value. Moreover, there mightbe a differential effect for diversified and stand-alone firms if the former aremore difficult for the market to evaluate.
To relate market values back to the underlying productivity of a firm, Iaggregate plant level TFP measures up to the firm level. Individual plantsare weighted by their relative size within the firm, measured as the capitalstock or the total value of shipments. I only include pure manufacturingfirms and firms that have all of their operations in the United States. This
2396 The Journal of Finance

ensures that the productivity measures present a comprehensive picture ofthe firms’ operations. I follow Lang and Stulz ~1994! in constructing excessvalue measures.
I regress excess values on these aggregate TFP measures controlling forfirm size.18 Columns ~1! and ~2! of Table VI show that the correlation ispositive and highly significant. The coefficient on average TFP at the firmlevel is 0.374. TFP measures calculated from LRD data are cross-sectionallyrelated to financial measures of economic performance. Similarly, I find thatmarket prices track changes in productivity over time: When including firmfixed effects in the specification, the coefficient on TFP remains positive andsignificant, though it becomes somewhat smaller. Table VI, columns ~3! and~4!, shows that the coefficient on average TFP now is 0.106. The positive andhigh significance of the coefficient on aggregate TFP is particularly surpris-ing, because TFP is constructed as a regression residual and thus, by defi-
18 The results do not change when using other measures of firm performance like return oncapital or operating profits.
Table VI
Excess Value and ProductivityThe dependent variable is excess value ~the logarithm of the ratio of a firm’s individual Tobin’sq to its imputed benchmark of size weighted industry qs from COMPUSTAT industry segmentfiles!. Two-digit diversification is the logarithm of the number of segments at the two-digitlevel. Herfindahl is an assets-weighted measure of diversification. Firm TFP is the weightedaverage of plant level total factor productivity ~TFP! at the two-digit SIC level. Controls forFirm size are constructed as the number of plants at the firm level. Heteroskedasticity-robuststandard errors are in parentheses.
~1! ~2! ~3! ~4! ~5! ~6!
Firm TFP 0.374*** 0.365*** 0.106*** 0.108*** 0.276*** 0.280***~0.021! ~0.021! ~0.021! ~0.021! ~0.028! ~0.024!
Two-digit diversification �0.043***~0.009!
Two-digit div * TFP 0.178***~0.038!
Herfindahl �0.100***~0.022!
Herfindahl * TFP 0.756***~0.110!
Firm size 0.012** 0.016** 0.024*** 0.018***~0.004! ~0.006! ~0.005! ~0.004!
Firm fixed effect No No Yes Yes No NoAdjusted R2 0.053 0.054 0.567 0.567 0.061 0.065Number of observations 8,561 8,561 8,561 8,561 8,561 8,561
The symbols ***, **, and * indicate statistical significance at the 1, 5, and 10 percent level,respectively.
Effects of Corporate Diversification on Productivity 2397
nition, contains measurement error. Due to attenuation bias, the resultingcoefficient on TFP is biased towards zero, making it more difficult to find aneffect.
I also interact aggregate TFP with the measure of diversification in theregressions of excess values on mean firm productivity. The interaction termcaptures differences in the sensitivity of stock market values to productivityin diversified firms relative to stand-alone firms. If stock prices of diversi-fied firms contain less information about firm fundamentals, one shouldexpect the coefficient on the interaction term to be negative. However, Table VI,columns ~5! and ~6!, shows that the coefficient on the interaction term ispositive, and significant. Stock prices of diversified firms are more sensitiveto the firm’s underlying productivity than stock prices of stand-alone firms.But the coefficient on the direct effect of diversification in columns ~5! and~6! is negative and significant, suggesting there exists a diversification dis-count in this sample. These results make it difficult to rely solely on lack oftransparency to explain the diversification discount.
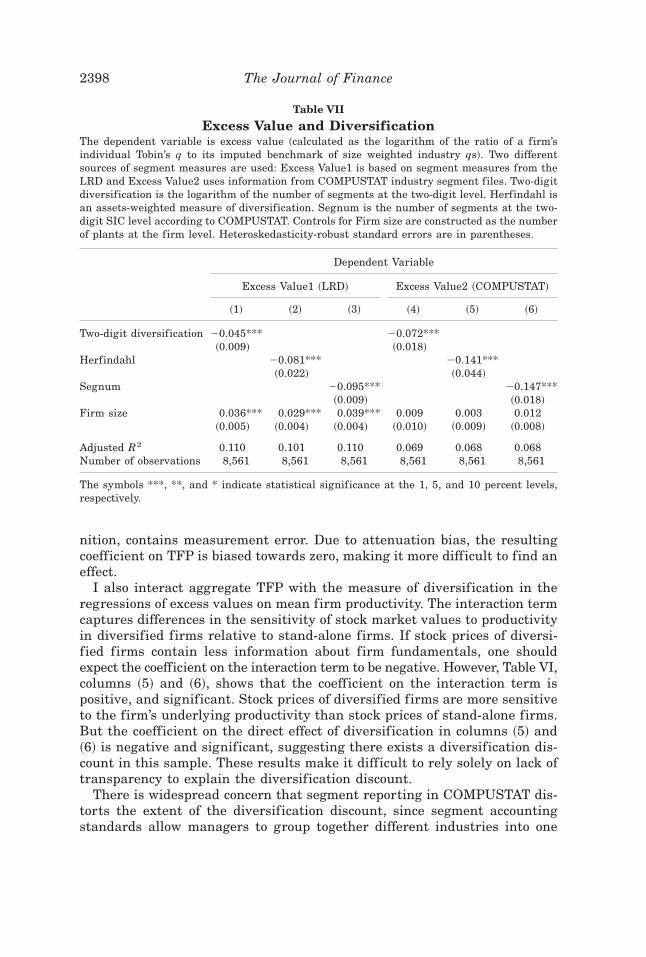
There is widespread concern that segment reporting in COMPUSTAT dis-torts the extent of the diversification discount, since segment accountingstandards allow managers to group together different industries into one
Table VII
Excess Value and DiversificationThe dependent variable is excess value ~calculated as the logarithm of the ratio of a firm’sindividual Tobin’s q to its imputed benchmark of size weighted industry qs!. Two differentsources of segment measures are used: Excess Value1 is based on segment measures from theLRD and Excess Value2 uses information from COMPUSTAT industry segment files. Two-digitdiversification is the logarithm of the number of segments at the two-digit level. Herfindahl isan assets-weighted measure of diversification. Segnum is the number of segments at the two-digit SIC level according to COMPUSTAT. Controls for Firm size are constructed as the numberof plants at the firm level. Heteroskedasticity-robust standard errors are in parentheses.
Dependent Variable
Excess Value1 ~LRD! Excess Value2 ~COMPUSTAT!
~1! ~2! ~3! ~4! ~5! ~6!
Two-digit diversification �0.045*** �0.072***~0.009! ~0.018!
Herfindahl �0.081*** �0.141***~0.022! ~0.044!
Segnum �0.095*** �0.147***~0.009! ~0.018!
Firm size 0.036*** 0.029*** 0.039*** 0.009 0.003 0.012~0.005! ~0.004! ~0.004! ~0.010! ~0.009! ~0.008!
Adjusted R2 0.110 0.101 0.110 0.069 0.068 0.068Number of observations 8,561 8,561 8,561 8,561 8,561 8,561
The symbols ***, **, and * indicate statistical significance at the 1, 5, and 10 percent levels,respectively.
2398 The Journal of Finance

segment. In fact, I find that manufacturing firms that are reported as single-segment firms in COMPUSTAT on average have plants in four differentindustries in the LRD. Thus the measures of diversification derived fromCOMPUSTAT grossly understate the true extent of conglomeration. Also, itseems problematic to use these firms as benchmarks for industry Tobin Qs.
To address these worries I use the much more precise information on in-dustry segments from the LRD to recalculate the discount. Ideally I wouldlike to form median industry Tobin’s Q based on firms that are stand-aloneaccording to the LRD. However, this restriction largely reduces the numberof observations in each industry year cell and leads to a very noisy industrybenchmark. Instead I use median industry Qs from COMPUSTAT. Table VII,columns ~1! through ~3!, shows that the discount based on LRD segmentmeasures is about 10 percent. It is smaller than the one computed purelyfrom COMPUSTAT in columns ~4! to ~6! of Table VII. However, the magni-tude of the discount is similar to the one generally reported for the fullCOMPUSTAT universe. So even for the presumably more accurate segmentmeasures from the LRD, the diversification discount still holds.
VI. Wage Premium for Workers in Diversified Firms
To explore the coexistence of a productivity premium with lower marketvaluation of diversified firms, I analyze the distribution of rents betweenthe different stakeholders of the firm. Even if diversified firms create morevalue at the production level, shareholders might receive a smaller fractionof these cash f lows. Stein ~1997! describes a model where managers candivert rents from the firm’s operation, but still have an incentive to maxi-mize efficiency, since the total rents they can divert is positively related tothe revenues of the company.19
Employees make up one of the largest constituencies of a firm. I estimatea standard wage regression at the plant level to analyze whether workers indiversified firms receive rents relative to workers in stand-alone firms. Hourlywages for production workers are regressed on a measure of diversification.I control for the usual firm and plant level characteristics that are known toaffect wages. These are firm size ~again measured as number of plants!,plant age, and capital inputs, as well as industry and year fixed effects.Several studies have shown that workers in large firms enjoy a wage pre-mium relative to workers with similar observable characteristics in smallerfirms ~see, e.g., Idson and Oi ~1999!!.
19 Several papers have documented a different avenue of value destruction in diversifiedfirms. Scharfstein ~1997! argues that internal capital markets in diversified firms practice“socialism” by channeling funds from high-growth to low-growth segments. Similarly, Lamont~1997! or Shin and Stulz ~1998! show investment patterns that are consistent with cross-subsidization of segments within diversified firms. Rajan, Servaes, and Zingales ~1998! findthat greater heterogeneity in the investment opportunities of segments within a firm lead to agreater discount in the market.
Effects of Corporate Diversification on Productivity 2399

Table VIII, columns ~1! to ~4!, documents that the coefficient on diversi-fication is positive and significant in all specifications. The point estimatein column ~1! is 0.023. Column ~2! of Table VIII shows that, even after con-trolling for labor productivity at the plant level, the coefficient on diversifi-cation does not change substantially.
Additionally, columns ~3! and ~4! in Table VIII report the results using amore comprehensive measure of hourly wages which include legally requiredand voluntary supplementary labor costs. The LRD has information on sup-plementary labor costs only in the form of total expenditures, but not sep-arately broken down by white collar or blue collar workers. I imputesupplementary labor costs for production workers in proportion to the totalwage bill of production workers. Again the coefficient on diversification is
Table VIII
WagesDependent variable: production worker wages. Hourly Wage is constructed at the plant level astotal wage bill for production worker divided by hours worked in production. Hourly Wage2includes wages plus additional labor costs measured as the sum of legally required and volun-tary supplementary labor costs. Two-digit diversification is the number of segments at thetwo-digit industry level. Firm size and Segment size are measured as the number of plants perfirm or segment, respectively. Age is measured as years since a plant was set up. If the setupdate precedes the first year of the sample ~1977!, that year is taken as the setup year. Totalvalue of shipments per hour worked is calculated at the plant level. Heteroskedasticity-robuststandard errors are in parentheses. Standard errors are corrected to allow for group effectswithin firms, since diversification varies only at firm level.
Specification
Hourly Wage Hourly Wage2
~1! ~2! ~3! ~4!
Two-digit diversification 0.023*** 0.022*** 0.041*** 0.039***~0.005! ~0.005! ~0.006! ~0.006!
Segment size 0.016*** 0.015*** 0.014*** 0.013***~0.002! ~0.002! ~0.002! ~0.002!
Firm size 0.011*** 0.012*** 0.002 0.004~0.003! ~0.003! ~0.003! ~0.003!
Plant age 0.063*** 0.057*** 0.054*** 0.050***~0.002! ~0.002! ~0.003! ~0.003!
Capital 0.084*** 0.085*** 0.093*** 0.093***~0.001! ~0.001! ~0.001! ~0.001!
Total value of shipment0hours worked 0.179*** 0.160***~0.004! ~0.005!
Industry fixed effects Yes Yes Yes YesYear fixed effects Yes Yes Yes YesAdjusted R2 0.539 0.544 0.508 0.509Number of observations 245,006 245,006 245,006 245,006
The symbols ***, **, and * indicate statistical significance at the 1, 5, and 10 percent levels,respectively.
2400 The Journal of Finance

positive and significant. In fact, the gap between wages in diversified andstand-alone firms almost doubles; the coefficient on the diversification mea-sure increases to 0.04. It seems intuitive that workers receive a large frac-tion of rents in the form of fringe benefits or supplementary labor costs.Moreover, the magnitude of the wage difference between diversified and stand-alone firms is economically significant. A move of one standard deviation inthe diversification distribution increases this measure by two. So, on aver-age, diversified firms pay their workers roughly eight percent higher wagesthan stand-alone firms with similar characteristics.
What fraction of the diversification can be explained by this wage dif-ferential? From the results above, we know that diversified firms on aver-age are about 7 percent more productive than stand-alone firms, whichtranslates into 10 percent higher profits per year under the assumptions inSection III. At the same time, a discount of 10 percent implies roughly 10percent lower annual profits in diversified firms. On net, diversified firmswould have to dissipate more than 20 percent of their profits. As an ex-treme example, assume that rent dissipation was the sole source of ineffi-ciency in diversified firms. To justify a 10 percent diversification discount,conglomerates would have to incur 10 percent higher input costs, given ourassumptions about the revenue–cost margin. Let’s go further to assumethat higher labor costs alone were responsible for the difference in thefirms’ cost structures. If labor constitutes about 30 percent of total costs,wages in diversified firms should be 33 percent higher than in stand-alonefirms. Therefore, the 8 percent wage gap that I estimated for the firms inmy sample can potentially explain a large part of the discount, but not theentire amount.
However, the results from these plant level wage regressions should onlybe interpreted as suggestive evidence for the hypothesis that workers indiversified firms earn rents. For a cleaner test of the rent dissipation hy-pothesis, one would ideally want to use exogenous controls of labor qualityfor individual workers within a plant, for example, years of schooling orexperience on the job. Unfortunately the LRD does not provide this infor-mation. Therefore, it is not possible to fully rule out the alternative expla-nation that wage levels in diversified firms are higher due to differences inthe labor force composition within these plants. Moreover, this limitation ofthe data does not allow me to causally link rent dissipation to measures ofexcess value.20
VII. Conclusion
In summary, this paper shows that diversified firms are not bad per se,but diversification as a corporate strategy is. In fact, diversified firms aremore productive than stand-alone firms. This productivity difference is not
20 I thank an anonymous referee for alerting me to this issue. In future work, I hope toexplore these questions in greater detail.
Effects of Corporate Diversification on Productivity 2401

the result of conglomerates’ buying into high productivity plants. But it seemsthat diversified firms actually add value to the plants they acquire. Giventhis productivity premium, I argue that lower efficiency cannot be the pri-mary explanation for the level of the diversification discount. Differences inproductivity do, however, explain a large fraction of the variance in the di-versification discount between firms. Stock prices closely track differencesin productivity between firms and within firms across time.
I identify two sources of value destruction in diversified firms. First, thedynamic effects of diversification are negative. The productivity of the in-cumbent plants of a firm decreases in the aftermath of a diversifying move,while the new plants experience an increase in their productivity. Yet the neteffect on productivity from the acquisition of the “new toys” is negative. Thisindicates that diversifying moves on average are not optimal for the firms inquestion. Even though becoming more diversified reduces firm productivityrelative to the ex ante level, in the cross section, diversified firms still aremore productive than stand-alone firms.
Second, I offer suggestive evidence that diversified firms distribute a largerfraction of revenues to employees by paying higher wages and fringe ben-efits than stand-alone firms. One can argue that pure redistribution doesnot need to be inefficient from a social welfare point of view, as long as itdoes not lead to a distortion in the allocation of resources. From the point ofview of existing shareholders, however, this behavior seems to be suboptimal.
This paper provides a glimpse into the internal workings of diversifiedfirms. Clearly, much more needs to be done to develop a precise understand-ing of how value is created and distributed between the different stakehold-ers in diversified firms. The results suggest that higher productive efficiencydoes not automatically translate into more value creation for shareholders.In particular, it seems crucial to understand how governance structures withina firm interact with managerial decisions at different levels of the corporatehierarchy.
REFERENCES
Berger, Philip, and Eli Ofek, 1995, Diversification’s effect on firm value, Journal of FinancialEconomics 37, 39–65.
Campa, Jose Manuel, and Simi Kedia, 1999, Explaining the diversification discount, Workingpaper, Harvard Business School.
Chevalier, Judy, 1999, Why do firms undertake diversifying mergers? An examination of theinvestment policies of merging firms, Working paper, University of Chicago.
Demsetz, Harold, 1973, Industry structure, market rivalry and public policy, Journal of Lawand Economics 16, 1–9.
Graham, John R., Michael L. Lemmon, and Jack Wolf, 1998, Does corporate diversificationdestroy value? Working paper, Duke University.
Harris, Mary S., 1998, The association between competition and managers’ business segmentreporting decisions, Journal of Accounting Research 36, 111–128.
Hubbard, Glen, and Darius Palia, 1999, A reexamination of the conglomerate merger wave inthe 1960s: An internal capital markets view, Journal of Finance 54, 1131–1152.
Idson, Todd L., and Walter Oi, 1999, Workers are more productive in large firms, AmericanEconomic Review 89, 104–108.
2402 The Journal of Finance
Lamont, Owen, 1997, Cash f low and investment: Evidence from internal capital markets, Jour-nal of Finance 52, 83–109.
Lamont, Owen, and Christopher Polk, 2001, The diversification discount: Cash f lows versusreturns, Journal of Finance 56, 1693–1721.
Lang, Larry, and René M. Stulz, 1994, Tobin’s q, corporate diversification and firm perfor-mance, Journal of Political Economy 102, 1248–1280.
Lichtenberg, Frank R., 1992, Corporate Takeovers and Productivity ~MIT Press, Cambridge,MA!.
Maksimovic, Vojislav, and Gordon Phillips, 2001, The market for corporate assets: Who engagesin mergers and asset sales and are there gains? Journal of Finance 56, 2919–2065.
Maksimovic, Vojislav, and Gordon Phillips, 2002, Do conglomerate firms allocate resources in-efficiently across industries? Journal of Finance 57, 721–767.
Matsusaka, John G., 1993, Takeover motives during the conglomerate merger wave, Rand Jour-nal of Economics 24, 357–379.
McGuckin, Robert H., and G. Pascoe, 1988, The Longitudinal Research Database: Status andresearch possibilities, Survey of Current Business 68, 30–37.
McGuckin, Robert, and Sang Nguyen, 1995, On productivity and plant ownership change: Newevidence from the Longitudinal Research Database, Rand Journal of Economics 26, 257–276.
Môrck, Randal, Andrei Shleifer, and Robert W. Vishny, 1990, Do managerial objectives drivebad acquisitions? Journal of Finance 45, 31–48.
Pralahad, C. K., and Gary Hamel, 1990, Core competence of the corporation, Harvard BusinessReview 3, 79–91.
Rajan, Raghu, Henri Servaes, and Luigi Zingales, 1998, The cost of diversity: The diversifica-tion discount and inefficient investment, Journal of Finance 55, 35–80.
Ravenscraft, David J., and F. M. Sherer, 1987, Mergers, Selloffs, and Economic Efficiency ~Brook-ings Institution, Washington, DC!.
Rosen, Sherwin, 1982, Authority, control and the distribution of earnings, Bell Journal of Eco-nomics 13, 311–323.
Scharfstein, David S., 1997, The dark side of internal capital markets II, NBER Working paperNo. 6352.
Servaes, Henri, 1997, The value of diversification during the conglomerate merger wave, Jour-nal of Finance 51, 1201–1225.
Shin, Hyan-Han, and René Stulz, 1998, Are internal capital markets efficient? Quarterly Jour-nal of Economics 113, 531–552.
Stein, Jeremy, 1997, Internal capital markets and the competition for corporate resources, Jour-nal of Finance 52, 111–133.
Villalonga, Belén, 2000, Diversification discount or premium? New evidence from BITS estab-lishment level data, Unpublished manuscript, University of California, Los Angeles.
Effects of Corporate Diversification on Productivity 2403

2404