Embed Size (px)
Citation preview
Atmos. Chem. Phys., 16, 6609–6626, 2016www.atmos-chem-phys.net/16/6609/2016/doi:10.5194/acp-16-6609-2016© Author(s) 2016. CC Attribution 3.0 License.
Effectiveness of replacing catalytic converters in LPG-fueledvehicles in Hong KongXiaopu Lyu1, Hai Guo1, Isobel J. Simpson2, Simone Meinardi2, Peter K. K. Louie3, Zhenhao Ling4, Yu Wang1,Ming Liu1, Connie W. Y. Luk3, Nan Wang5, and Donald R. Blake2
1Department of Civil and Environmental Engineering, The Hong Kong Polytechnic University, Hong Kong2Department of Chemistry, University of California at Irvine, Irvine, CA, USA3Environmental Protection Department, Hong Kong Special Administrative Region, Hong Kong4School of Atmospheric Sciences, Sun Yat-sen University, Guangzhou, China5Guangdong Provincial Key Laboratory of Regional Numerical Weather Prediction,Institute of Tropical and Marine Meteorology, Guangzhou, China
Correspondence to: Hai Guo ([email protected])
Received: 6 October 2015 – Published in Atmos. Chem. Phys. Discuss.: 21 December 2015Revised: 29 March 2016 – Accepted: 11 May 2016 – Published: 31 May 2016
Abstract. Many taxis and public buses are powered by liq-uefied petroleum gas (LPG) in Hong Kong. With more ve-hicles using LPG, they have become the major contribu-tor to ambient volatile organic compounds (VOCs) in HongKong. An intervention program which aimed to reduce theemissions of VOCs and nitrogen oxides (NOx) from LPG-fueled vehicles was implemented by the Hong Kong govern-ment in September 2013. Long-term real-time measurementsindicated that the program was remarkably effective in re-ducing LPG-related VOCs, NOx and nitric oxide (NO) inthe atmosphere. Receptor modeling results further revealedthat propane, propene, i-butane, n-butane and NO in LPG-fueled vehicle exhaust emissions decreased by 40.8± 0.1,45.7± 0.2, 35.7± 0.1, 47.8± 0.1 and 88.6± 0.7 %, respec-tively, during the implementation of the program. In contrast,despite the reduction of VOCs and NOx , O3 following theprogram increased by 0.40± 0.03 ppbv (∼ 5.6 %). The LPG-fueled vehicle exhaust was generally destructive to OH andHO2. However, the destruction effect weakened for OH andit even turned to positive contribution to HO2 during the pro-gram. These changes led to the increases of OH, HO2 andHO2 / OH ratio, which might explain the positive O3 incre-ment. Analysis of O3–VOCs–NOx sensitivity in ambient airindicated VOC-limited regimes in the O3 formation beforeand during the program. Moreover, a maximum reductionpercentage of NOx (i.e., 69 %) and the lowest reduction ra-tio of VOCs / NOx (i.e., 1.1) in LPG-fueled vehicle exhaust
were determined to give a zero O3 increment. The findingsare of great help to future formulation and implementationof control strategies on vehicle emissions in Hong Kong, andcould be extended to other regions in China and around theworld.
1 Introduction
Vehicular exhaust is a major source of air pollutants such asparticulate matter (PM), volatile organic compounds (VOCs)and trace gases including carbon monoxide (CO), carbondioxide (CO2), sulfur dioxide (SO2) and nitrogen oxides(NOx) (Xie et al., 2003; Barletta et al., 2002; Ruellan andCachier, 2001). Apart from primary pollutants, secondarypollutants formed from vehicular exhausts, i.e., ozone (O3)
and secondary organic aerosols (SOAs), are of high concerndue to their detrimental effects on atmospheric environmentand human health (Ciccone et al., 1998).
Fuel substitution is a universal and effective method toconstrain vehicular emissions. As relatively clean energy,liquefied petroleum gas (LPG), has been widely used ei-ther alone or combined with petrol and diesel (Lau et al.,2011; Lai et al., 2009; Gamas et al., 1999), for the benefitof emission reduction of CO2, fine PM and VOCs (Chikhiet al., 2014; Myung et al., 2012). However, one must bear inmind that maintenance status, conversion method, composi-
Published by Copernicus Publications on behalf of the European Geosciences Union.
6610 X. Lyu et al.: Effectiveness of replacing catalytic converters in LPG-fueled vehicles
tion and driving speed all influence the emissions of air pol-lutants (Schifter et al., 2000; Gamas et al., 1999). Therefore,regular on-site measurements are necessary to monitor traf-fic emission profiles and rates. Although LPG is a relativelyclean fuel, the emission of LPG-related VOCs (i.e., propane,propene and n- and i-butanes) from evaporation and incom-plete combustion cannot be neglected. For example, sourceapportionment analysis indicated that LPG accounted fora considerable percentage of ambient VOCs in Guangzhou(8–16 %) (Liu et al., 2008) and Hong Kong (32.6± 5.8 %)(Ou et al., 2015). Furthermore, the LPG-related VOCs cancontribute to O3 formation and cause photochemical smog.Blake and Rowland (1995) emphasized the importance ofLPG leakage in OH reactivity and O3 formation in urbanMexico. Farmer et al. (2011) reported that the increase ofLPG-related VOCs led to O3 increments even though thetotal VOCs (TVOCs) were reduced, as the peroxyl radicals(RO2) generated from VOCs with low vapor pressure had ahigher branching ratio leading to NO2 formation from NO,rather than reserving nitrogen in the form of organic nitrates.On the other hand, NO emitted from LPG combustion maytitrate O3. Therefore, it still remains undecided as to whetherthe LPG usage is contributive or destructive to O3 formation,especially in Hong Kong.
Hong Kong has experienced rapid development during thepast decades, and increasingly suffers from crowded trafficand population, with nearly 0.7 million vehicles traveling onthe total road length of 2.1× 10³ km and 7.2 million peopleliving in a territory 1.1× 10³ km2 in size. The road usage ratein Hong Kong is among the highest in the world, transportingapproximately 1.2 million passengers per day. As such, traf-fic emissions significantly influence the air quality in HongKong. Apart from local emissions, air quality in Hong Kongis also affected by regional transport. In autumn and winter,prevailing northerly and northeasterly winds bring anthro-pogenic emissions from mainland China to Hong Kong, en-hancing local pollution burden. In summer, clean oceanic airmasses dilute the levels of air pollutants under the influenceof southerly winds (Ling et al., 2013; Guo et al., 2009; Wanget al., 2005; So and Wang, 2003; Chan and Chan, 2000). Linget al. (2013) quantified the contribution of regional transportas 0–61 % for summer O3 and 0–56 % for autumn O3 onhigh O3 days in Hong Kong. Guo et al. (2006) found thatover 45 % of VOC samples collected from August 2001 toDecember 2002 at Tai O, Hong Kong, were influenced by re-gional transport from inland China. Based on numerical sim-ulations, Wang et al. (2006) quantified regional contributionsof 40–90 % to O3 formation in Hong Kong, and Huang etal. (2006) indicated that the regional contribution was < 50 %when a trough was over the South China Sea (SCS), and itincreased to > 50 % in the presence of an anticyclone overmainland China and/or a tropical cyclone over SCS. Further-more, Wang et al. (2006) revealed that the regional contri-bution was lower during daytime than that at night, whileLam et al. (2005) found that the contribution decreased from
> 50 % during an O3 episode to 30–50 % after the episode. Inaddition, Jiang et al. (2008) reported that the contribution ofhorizontal transport to surface O3 in Hong Kong was negli-gible during a typhoon-induced O3 episode. However, all thestudies focused on the regional contribution at non-roadsidesites, and the O3 chemistry at roadside sites in Hong Kongwas seldom reported. Given high NOx levels, tall buildingsand low wind speeds along the main roads in Hong Kong,it is expected that the regional impact on air pollutants in aroadside environment is relatively minor, especially duringdaytime hours on non-O3 episode days.
To improve the air quality, the Hong Kong EnvironmentalProtection Department (HKEPD) launched a series of pro-grams including a stepwise LPG replacement program fortaxis and light buses from 1997. By the end of 2010, > 99 %of the registered taxis (i.e., 17 950 vehicles) and 51 % of theregistered public and private light buses (i.e., 3280 vehicles)were powered by LPG (HKCSD, 2010). Due to the usageof LPG as vehicle fuel, the ambient VOC profile in HongKong changed substantially, with the most abundant speciesswitching from toluene to propane and n/i-butanes (Ou etal., 2015; Guo et al., 2007; Ho et al., 2004). In addition,studies consistently confirmed an increased contribution ofLPG-fueled vehicle emissions to ambient VOC levels, whichwas 11 % at an urban site in 2001 (Guo et al., 2004), 15 %at a suburban site during 2002–2003 (Guo et al., 2007) and26.9± 0.6 % and 40.8± 0.8 % at an urban site during 2002–2003 and 2006–2007, respectively (Lau et al., 2010). More-over, O3 has been experiencing an increasing trend in HongKong over the last 2 decades (Wang et al., 2009; Guo et al.,2009). As O3 formation was generally VOC-limited in HongKong (Cheng et al., 2010; Zhang et al., 2007), the contribu-tion of LPG-fueled vehicle emissions to O3 was not negligi-ble, in view of the dominance of propane and n/i-butanes inambient air and the high contribution of LPG-fueled vehicleemissions to ambient VOC levels. As such, an interventionprogram which aimed to reduce VOCs and NOx emitted byLPG-fueled vehicles was initiated in September 2013. Thissubsidy program promoted the replacement of aging catalyticconverters in LPG-fueled vehicles, and the catalytic convert-ers in ∼ 75 % of LPG-fueled vehicles were replaced by theend of May 2014. Although laboratory studies identified ahigh removal efficiency of the new catalytic converter onVOCs and NOx emissions (Table S1 in the Supplement), theimpact of the program on roadside air quality, which is morecomplex, required investigation.
In this study, the effectiveness of the intervention programon the reduction of LPG-related VOCs and NOx , on O3 pro-duction and on the photochemical reactivity driving the O3formation was evaluated. Furthermore, the sensitivity of O3variation (i.e., the difference of net O3 production by LPGbefore and during the program) relative to the reduction per-centage of LPG-related VOCs and NOx was studied, andsubsequently a maximum NOx reduction percentage and a
Atmos. Chem. Phys., 16, 6609–6626, 2016 www.atmos-chem-phys.net/16/6609/2016/
X. Lyu et al.: Effectiveness of replacing catalytic converters in LPG-fueled vehicles 6611
reasonable reduction ratio of VOCs / NOx were proposed forachieving the best O3 reduction.
2 Methodology
2.1 Site description
Hong Kong, located on the coast of the South China Sea(SCS), constitutes the greater Pearl River Delta (PRD) to-gether with Macao and nine mainland cities in Guang-dong province (i.e., Guangzhou, Shenzhen, Zhuhai, Fos-han, Dongguan, Zhongshan, Huizhou, Jiangmen and Zhao-qing). Hong Kong has a typical coastal hilly terrain, with alarge area of water (∼ 60 %) and large vegetation coverage(∼ 70 % of land area). A marine subtropical monsoon climatedominates, and the prevailing winds are north and northeastin winter, east in spring and autumn and south and southwestin summer.
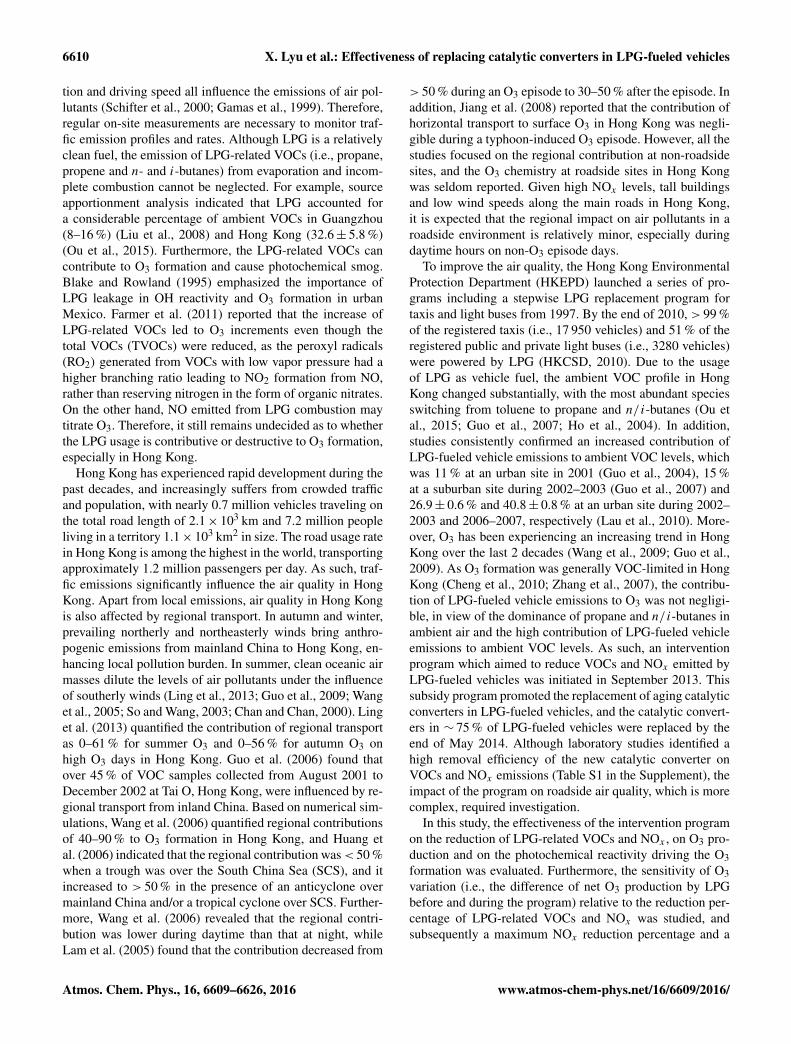
This study involves three roadside sites (Mong Kok (MK,22.32◦ N, 114.17◦ E), Causeway Bay (CWB, 22.28◦ N,114.19◦ E) and Central (22.28◦ N, 114.16◦ E)), a generalsite (Tap Mun (TM, 22.47◦ N, 114.36◦ E)) and a back-ground site (Hok Tsui (HT, 22.22◦ N, 114.25◦ E)). MK,CWB and Central are in mixed residential/commercialareas with heavy traffic and are surrounded by densetall buildings. TM is a rural site surrounded by countryparks, and is upwind of Hong Kong in autumn/winterseasons. These four sites have air quality monitor-ing stations deployed by Hong Kong EnvironmentalProtection Department (HKEPD) (more details are pro-vided at http://www.aqhi.gov.hk/en/monitoring-network/air-quality-monitoring-stations9c57.html?stationid=81).HT is a remote site at the tip of southeastern Hong Kong,∼ 25 km from the urban core. It receives air masses fromSCS in summer and from continental areas including HongKong and PRD in autumn/winter. Therefore, air masses atHT are a mix of marine and continental background air.Indeed, HT has been serving as a background site and isextensively used for air quality studies in Hong Kong (Wanget al., 2009; Ho et al., 2006; Lee et al., 2002). Figure 1 showsthe geographical location of the sampling sites.
2.2 Continuous measurements
2.2.1 Trace gases
Five trace gases (i.e., CO, SO2, NO, NO2 and O3) were con-tinuously measured at all the sites from 2011 to 2014. Theanalyzers were deployed in the air quality monitoring sta-tions, with a height of 3.0 m (MK and CWB), 4.5 m (Cen-tral), 11.0 m (TM) and 20.0 m (HT) above ground level. Airsamples were drawn through a perfluoroalkoxy (PFA) Teflontube with an outside diameter (OD) of 12.7 mm and an insidediameter (ID) of 9.6 mm. The inlet of the tube was approxi-mately 0.5 m above the rooftop of the monitoring station, and
Figure 1. Geographical location of the sampling sites. The yellowline represents the border between Hong Kong and mainland China.
the outlet was connected to a PFA manifold with a bypasspump, drawing air into the analyzers at a rate of 5 L min−1.Details about the analyzers are provided elsewhere (HKEPD,2014; So and Wang, 2003).
Briefly, CO was analyzed using the method of non-dispersive infrared absorption with gas filter correlation(TECO 48C/API 300); SO2 was detected with UV fluores-cence analyzers (TECO 43A/API 100E/TECO 43I); NO–NO2–NOx were measured by chemiluminescence technique(API 200A); and O3 was monitored with the UV absorptionmethod (API 400/API 400A). The detection limits for CO,SO2, NO, NO2 and O3 were 50.0, 1.0, 0.5, 0.5 and 2.0 ppbv,respectively.
2.2.2 VOCs
Thirty C2–C10 non-methane hydrocarbons (NMHCs), in-cluding 11 alkanes, 10 alkenes and 9 aromatics, were con-tinuously measured at MK and HT from 2011 to 2014. TheVOC samples were collected and analyzed every 30 min withan online analytical system (Syntech Spectra GC 955, Se-ries 600/800, the Netherlands). The data were averaged intohourly values. The detection limits varied by VOC speciesand were in the range of 0.002–0.787 ppbv.
Table S2 summarizes average mixing ratios of the mainVOCs and trace gases, and their OH reactivity at the road-side (MK) and background site (HT) before (October 2012–September 2013) and during the program (October 2013–May 2014) in Hong Kong. The much higher OH reactivityat MK (before: 86.6± 6.0 s−1; during: 77.9± 6.1 s−1) thanat HT (before: 5.0± 0.3 s−1; during: 4.9± 0.1 s−1) meantthat the OH lifetime was much shorter at MK (∼ 0.01 s) thanat HT (0.2 s), and even shorter than that at an urban site inNew York (0.05 s) (Ren et al., 2003), indicating that reactivespecies were extremely abundant in the roadside environ-ment of Hong Kong. The LPG-related VOCs (i.e., propaneand n/i-butanes) contributed 56.5± 2.7 and 46.0± 3.1 % tototal VOCs, and 18.7± 1.2 and 15.1± 1.1 % to the total OHreactivity of VOCs at MK, before and during the program,
www.atmos-chem-phys.net/16/6609/2016/ Atmos. Chem. Phys., 16, 6609–6626, 2016

6612 X. Lyu et al.: Effectiveness of replacing catalytic converters in LPG-fueled vehicles
respectively. These fractional contributions suggest the im-portance of LPG-related VOCs in the budgets of VOCs andO3 in Hong Kong. Consistent with the decreases of frac-tional contributions once the program started, the mixing ra-tios (29.4± 3.3 and 21.0± 2.2 ppbv for before and duringthe program, respectively) and OH reactivity (1.12± 0.04and 0.79± 0.02 s−1 before and during the program, respec-tively) of LPG-related VOCs significantly declined at MK(p < 0.05), while at HT, their mixing ratios increased from1.5± 0.1 to 1.9± 0.04 ppbv, and the OH reactivity increasedfrom 0.06± 0.004 to 0.07± 0.003 s−1. The minor variationof background LPG-related VOCs relative to the decreasesat MK (4.8 % in mixing ratios and 3.0 % in OH reactivity ofVOCs) indicated that the influences of the background con-centrations on the variations of LPG-related VOCs and O3 atMK were minimal and can be neglected.
2.2.3 Quality assurance and control (QA/QC)
To guarantee the quality of the data acquired from the on-line monitoring systems, the instruments and QA/QC proce-dures for trace gases measurements were identical to those inthe US air quality monitoring program (http://epic.epd.gov.hk/ca/uid/airdata). The measurements have been accreditedby the Hong Kong Laboratory Accreditation Scheme (HOK-LAS). All the instruments were regularly calibrated, testedand audited by standards with known traceability for mea-surements of trace gases. According to HOKLAS criteria, aquality system was established to control the accuracy andprecision within the limits of ±15 and ±20 %, respectively(HKEPD, 2014). For VOC analysis, a built-in computer-ized program, including auto-linearization, auto-calibrationand calibration with span gas, was adopted to control thequality. The accuracy and precision of VOC measurementswere 1.0–10 % and 2.5–20 %, respectively. The accuracy wasbased on weekly span checks, monthly calibration and an-nual auto-linearization using the National Physical Labora-tory (NPL) span gas. The precision was based on quarterlyprecision check results (the 95 % probability limits for theintegrated precision based on weekly precision check resultsof the latest 3 months). Moreover, the online measurementsof VOCs were regularly compared with whole-air canistersamples collected and analyzed by University of Californiaat Irvine (UCI). Good agreements were identified for thealkanes (e.g., R2
= 0.95 and 0.85, slope= 1.14 and 0.97 forpropane and butanes, respectively), while the agreements forthe more reactive alkenes and aromatics were also reasonable(e.g., R2
= 0.64 and 0.94, slope= 1.34 and 0.86 for propeneand toluene, respectively).
2.3 Theoretical calculation and model description
2.3.1 Primary emissions of VOCs and NOx
The measured concentrations of VOCs and trace gases werecomposed of the backgrounds, primary emissions and sec-ondary formation (applicable to O3 and NO2). To obtain theconcentrations of LPG-related VOCs and NOx emitted fromprimary sources at the roadside sites, the background con-centrations and the concentrations elevated by the secondaryformation (if applicable) in this study were excluded usingEqs. (1)–(5) (Takekawa et al., 2013):
[VOC]prim. = [VOC]obs.− [VOC]bg. (1)
[NO2]sec. = [O3]bg.− [O3]obs. (2)[NO2]prim. = [NO2]obs.− [NO2]sec.− [NO2]bg. (3)[NOx]prim. = [NOx]obs.− [NOx]bg. (4)[NO]prim. = [NOx]prim.− [NO2]prim., (5)
where [xx]obs., [xx]prim., [xx]sec. and [xx]bg. represent theobserved concentrations, the concentrations emitted fromprimary sources, secondary formation and the backgrounds,respectively. In this study, the hourly measured VOCs at HTwere considered as the background levels for VOCs. For O3and NOx , the 8 h averages at TM were treated as backgroundvalues because (1) O3 and NOx are highly reactive, and theuse of 8 h averages would minimize the impact of abruptchanges; (2) TM is located at the upwind location of HongKong, and is a rural coastal site; (3) 8 h averages of O3 andNOx showed good correlations (R2
= 0.75 and 0.57 for O3and NOx , respectively) between TM and HT, and not all thedata were available at HT during the entire study period.
2.3.2 Impact of regional and super-regional air masses
Since MK was the only roadside site with VOC and trace gasdata, this study mainly focused on the data analysis of thissite. As a roadside site, MK was expected to be strongly influ-enced by fresh vehicular emissions. VOC ratios can indicatethe relative ages of air masses and regional transport of airpollutants. For example, the ratios of VOCs with higher re-activity to those with lower reactivity (e.g., toluene / benzeneand xylenes / ethylbenzene) imply more fresh air when val-ues are higher, which has been extensively used in previ-ous studies (Guo et al., 2007; Ho et al., 2004). Therefore,ratios of toluene / benzene and xylenes / ethylbenzene werecalculated here to roughly estimate the age of air masses atMK. Table 1 summarizes the ratios at MK (roadside site),Tung Chung (TC) and Yuen Long (YL) (both general am-bient sites) and HT (background site) in Hong Kong fromOctober 2012 to May 2014. It is noteworthy that ambientVOCs at all the four sites were simultaneously measured.The ratios of toluene / benzene and xylenes / ethylbenzeneat MK were significantly higher than those at the other threesites (p < 0.05). Furthermore, these ratios at MK were even
Atmos. Chem. Phys., 16, 6609–6626, 2016 www.atmos-chem-phys.net/16/6609/2016/

X. Lyu et al.: Effectiveness of replacing catalytic converters in LPG-fueled vehicles 6613
Figure 2. Hourly ratio of propane / CO at MK during 2011–2014.
higher after the background values were deducted. The re-sults suggested that air masses at MK were dominated byfresh emissions.
However, regional and super-regional transport cannot becompletely eliminated only with the VOC ratios, and the in-fluence of regional/super-regional air should be further ex-amined when studying the emissions of local LPG-fueledvehicles. Using the propane / CO ratio method proposed byGuo et al. (2006), i.e., the ratio range of 5.0–300 pptv ppbv−1
for air masses in Hong Kong, the influence of regional/super-regional air masses on local air was evaluated. Figure 2shows the ratios of propane / CO at MK from 2011 to 2014.The propane / CO ratios of ∼ 96 % air masses were between5.0 and 300 pptv ppbv−1. Further inspection of the values ofLPG-related VOCs and NOx with ratios of 5.0–300 showedinsignificant differences (p > 0.1) to those with ratios be-yond 5–300, suggesting that the air masses at MK wereseldom influenced by regional/super-regional air. Moreover,wind speeds were lower than 2.0 m s−1 for more than 95 % ofthe time (i.e., calm or light air according to the Beaufort WindScale) (http://www.spc.noaa.gov/faq/tornado/beaufort.html),and the values of LPG-related VOCs and NOx in all airmasses were not different to those in the air masses with windspeeds lower than 2.0 m s−1 (p > 0.1), confirming a minorimpact of regional/super-regional pollution on air at MK. In-deed, the prevailing wind direction was from the east, wherelocal urban areas are located.
2.3.3 PMF model
Positive matrix factorization (PMF) is a receptor model forsource apportionment and has been extensively used in manyfields (i.e., PM, VOCs and sediment) (Brown et al., 2007;Lee et al., 1999). Based on the principle of mass balance,it decomposes the matrix of measurement (X) into the ma-trices of factor contributions (G) and factor profiles (F) inp sources, as shown in Eq. (6) (Paatero, 1997; Paatero and
Tapper, 1994):
xij =
p∑k=1
gikfkj + eij , (6)
where xij is the measured concentration of j species in i
sample, gik represents the contribution of kth source to i sam-ple, fkj indicates the fraction of j species in kth source andeij is the residual for j species in i sample.
The matrices of G and F are obtained in the case of theminimum of objective function Q, as shown in Eq. (7):
Q=n∑
i=1
m∑j=1
xij −
p∑k=1
gikfkj
uij
2
, (7)
where m and n represent the number of species and samples,respectively, and uij is the uncertainty of j species in i sam-ple. Q (robust) is automatically calculated by excluding thepoints not fit by the model, and the run with lowest Q (ro-bust) value is selected as the optimum solution by the model.
2.3.4 PBM-MCM model
The photochemical box model incorporating the masterchemical mechanism (PBM-MCM) is a computing modelbased on the chemical reactions of observed species. It hasbeen introduced and successfully applied in many previousstudies in reproducing the observed values, describing theproduction and destruction mechanisms and simulating thephotochemical reactivity (Ling et al., 2014; Lam et al., 2013;Cheng et al., 2010). Briefly, the observations of VOCs, tracegases and meteorological parameters are input to constructand constrain the model, which consists of 5900 reactionsand 16 500 species in the latest version (MCM 3.2). How-ever, it is noteworthy that the heterogeneous reactions are notincluded, and the model does not consider the transport pro-cesses (i.e., horizontal and vertical transport).
In this study, CO, SO2, NO, NO2, O3, 27 VOCs andtwo meteorological parameters (i.e., temperature and relativehumidity) were used to construct and constrain the model.Hourly data were used as input (i.e. 24 h per day) and theoutputs were from 07:00 to 19:00 by each hour. To better de-scribe the photochemical reactions in Hong Kong, the modelwas modified; i.e., the photolysis rates were calibrated us-ing the photon fluxes from the Tropospheric Ultraviolet andVisible Radiation (TUV-v5) model (Madronich and Flocke,1997), according to the location of Hong Kong and the mod-eling period, and the height of the mixing layer was set as300–1400 m. The concentrations of some species in the freetroposphere, which may influence the mixing ratios of airpollutants in the lower troposphere with the development ofboundary layer, were set according to the real conditions inHong Kong (Lam et al., 2013).
www.atmos-chem-phys.net/16/6609/2016/ Atmos. Chem. Phys., 16, 6609–6626, 2016

6614 X. Lyu et al.: Effectiveness of replacing catalytic converters in LPG-fueled vehicles
Table 1. Ratios of toluene / benzene and xylenes / ethylbenzene at MK and other sites in Hong Kong from October 2012 to May 2014 (unit:ppbv ppbv−1).
Toluene / benzene Xylenes / ethylbenzene
MK (roadside site) 4.1± 0.04 3.0± 0.02MK∗ (roadside site) 11.3± 0.9 5.7± 0.2TC (general site) 0.7± 0.1 –YL (general site) 3.7± 0.04 2.4± 0.02HT (background site) 2.5± 0.1 1.8± 0.03
MK∗ refers to VOCs at MK with the background values removed.
Table 2. Formation and loss pathways of OH and HO2 consideredin this study.
OH HO2
Formation pathways HO2+ NO RO2+ NOHONO +hv OH + COO (1D) + H2O OH + HCHOO3+ alkenes HCHO +hv
O3+ alkenes
Loss pathways OH + VOCs HO2+ NOOH + NO2OH + COOH + NO
A base case was established to simulate O3 and the pho-tochemical reactivity (i.e., the formation and loss pathwaysof OH and HO2 listed in Table 2). The observed VOCs andtrace gases were input to construct the base case, and thesimulated O3 was compared with the observed levels to val-idate the model and check the influence of regional transportduring daytime hours. At low wind speed (1.3± 0.01 m s−1)and high NOx (223.2± 1.8 ppbv) at MK, the majority of re-gional O3 would be completely consumed before being de-tected by measurement instruments. In fact, the PBM-MCMmodel considered the regionally transported concentrationsof O3 precursors, as the observed concentrations input intothe model included the regional fractions. Moreover, sinceO3 levels were higher at night (8.1± 0.2 ppbv) than thoseduring daytime (5.9± 0.1 ppbv) at MK, it suggests the ex-istence of nocturnal regional transport. Hence, the observedO3 at 07:00 was input into the model to initiate the simula-tion for daytime hours; i.e., the nocturnal regional transportof O3 was also considered.
To simulate the contribution of LPG source to O3 for-mation, the following approach was adopted to avoid alter-ing the real ambient environment for atmospheric chemistry.Briefly, the concentration of species X in the whole air and inthe assigned LPG source was defined as Xwhole air and XLPG,respectively. Hence, the concentration of Xwhole air−XLPGwas the input for the constrained cases, while Xwhole air wasthe input for the base case. The three constrained cases were
as follows: (i) only VOCs in the LPG source were excludedfrom the whole air; (ii) only NOx in the LPG source was ex-cluded; and (iii) both VOCs and NOx were removed simulta-neously. As such, the differences of the outputs between thebase case and the three constrained cases were the contribu-tions of (i) VOCs, (ii) NOx and (iii) VOCs + NOx in theLPG source to the O3 formation, respectively. The changesof these contributions from the period before the program toduring the program represented the impact of the interven-tion program on O3 formation. Table S3 in the Supplementlists the configurations of the model input for the base caseand the three constrained cases.
2.3.5 Relative incremental reactivity (RIR)
RIR, initially proposed by Carter and Atkinson (1989), hasbeen extensively used to describe the relationship betweenO3 and its precursors, i.e., VOCs, NOx and CO. Although theobservation-based models incorporating carbon bond mech-anisms were often utilized to simulate the O3 production rate(Ling et al., 2011; Zhang et al., 2007; Martien et al., 2003),a more explicit PBM-MCM model was applied in this study.The RIR and RIR (weighted concentration) were calculatedusing Eqs. (8) and (9) (Ling et al., 2011):
RIRS(X)=[P S
O3−NO (X)−P SO3−NO (X−1X)
]/P S
O3−NO (X)
1S(X)/S(X)(8)
RIR (weighted concentration)= RIR(X)
× concentration RIR (weighted concentration)= RIR(X)× concentration, (9)
where PSO3−NO (X) and PS
O3−NO (X−1X) represent theoriginal O3 production rate, and that in the scenario,with a hypothetical change (1X) (10 % in this study) insource/species X, respectively, both of which considered O3titration by NO. 1S(X) is the change in the concentration ofX (S(X)). The concentration refers to the observed or PMF-extracted concentration of source/species X.
Atmos. Chem. Phys., 16, 6609–6626, 2016 www.atmos-chem-phys.net/16/6609/2016/

X. Lyu et al.: Effectiveness of replacing catalytic converters in LPG-fueled vehicles 6615
Table 3. Mixing ratios of LPG-related VOCs and NOx during theperiod before the program, the matched period and the period duringthe program (unit: ppbv).
Species Before During Matched
Propane 8.5± 0.1 5.8± 0.1 9.1± 0.1i-butane 6.6± 0.1 4.7± 0.1 6.9± 0.1n-butane 13.2± 0.2 8.4± 0.1 13.7± 0.2NO 201.7± 2.1 172.0± 2.7 201.9± 2.7NO2 25.9± 0.3 23.8± 0.4 26.8± 0.4NOx 229.4± 2.3 197.7± 3.0 231.2± 2.9
3 Results and discussion
3.1 Variations of LPG-related VOCs and NOx duringthe intervention program
3.1.1 Concentrations of primary LPG-related VOCsand NOx
Table 3 shows the mixing ratios of the primarily emittedLPG-related VOCs and NOx before and during the program.The LPG-related VOCs and NOx were reduced significantlyfrom the period before the program to during the program(p < 0.05). To investigate the meteorological influences onthese reductions, we looked into the average geopotentialheight (HGT) and wind field on 1000 hPa for East Asia forthe matched period and the period during the program, asshown in Fig. S1 in the Supplement (the matched period (Oc-tober 2012–May 2013) was defined as the same time spanas that during the program, but in different years.) Notice-ably, the meteorological conditions were fairly similar be-tween the two periods; i.e., the pressure decline (indicatedby the decrease of HGT) from northern China to SCS led tothe prevailing northeasterly winds in Hong Kong, and the dif-ferences of HGT and wind speed between the two periods forHong Kong were only 0–2 gpm and less than 1 m s−1, respec-tively. Ground monitoring data also indicated insignificantdifferences of temperature (matched: 21.9± 0.5 ◦C; during:21.2± 0.7 ◦C) between the two periods (p > 0.05). However,the mixing ratios of LPG-related VOCs and NOx during thematched period were comparable to those before the pro-gram, and absolutely higher than those during the program(p < 0.05) (see Table 3). Given the similar meteorologicalconditions between the matched period and during the pro-gram, the significant decreases of LPG-related VOCs andNOx were caused by the interventional program, rather thanmeteorological variations.
To further understand the effectiveness of the program,the monthly reductions of LPG-related VOCs after the com-mencement of the converter replacement were calculated andcompared with those before the program (Fig. 3). Since theprogram was initiated in October 2013, the averages of VOCspecies in September in each year were taken as the base-
lines for the calculation of monthly reduction. Briefly, themonthly reductions of LPG-related VOCs were the differ-ences between their averages in September and those in theother months. Hence, positive and negative values indicatereductions and increments of the corresponding species, re-spectively. It was found that the monthly averages of LPG-related VOCs consistently decreased from September 2013to May 2014 except for n-butane in October 2013 when theprogram was just initiated. Compared to those before the pro-gram (i.e. September 2013), the mixing ratios of propane,i-butane and n-butane decreased 3.2± 0.2, 2.8± 0.2 and4.9± 0.2 ppbv by May 2014, respectively, when 99.2 % ofcatalytic converters participating in the program had beenexchanged. Furthermore, the monthly reductions correlatedwell with the cumulative converter replacements (R2
= 0.92,0.93 and 0.89 for propane, i-butane and n-butane, respec-tively). In contrast, no consistent reduction was observedfrom September 2012 to May 2013 for LPG-related VOCs,suggesting the effectiveness of the program on the reductionof LPG-related VOCs. On the other hand, although the aver-age mixing ratios of NOx decreased significantly during theprogram as shown in Table 3, no consistent reductions werefound for their monthly averages. This might be due to thefact that NOx emitted from LPG-fueled vehicles was minorcompared to gasoline- and diesel-fueled vehicles (∼ 4.0 %from emission inventory, and 1.1–7.3 % from source appor-tionment. See Sect. 3.2.2).
3.1.2 Temporal variations of primary LPG-relatedVOCs and NOx
Figure 4 presents the temporal variations of propane and n/i-butanes at MK from June 2013 to May 2014 covering theperiods of both before (i.e., June–September 2013) and dur-ing the intervention program (i.e., October 2013–May 2014).The abnormally low alkane levels in late June 2013 might becaused by the anticyclone over southern China and a tropicalstorm over the SCS, leading to extremely high temperatureon 18–20 June (i.e., favorable for photochemical reactions),and stronger winds (i.e., conducive to atmospheric disper-sion) on the following days, respectively. In contrast, HongKong was strongly influenced by an active ocean flow anda low pressure trough over the SCS in late July 2013. Theconsequently heavy rain and low temperature suppressed thephotochemical reactions and caused the unusually high levelsof VOCs (Fig. S2 in the Supplement illustrates these events).Generally, the LPG-related VOCs experienced a significant(p < 0.05) reduction throughout the year. The daily changingrates of LPG-related VOCs in two periods, i.e., September–December and January–May, in different years at MK areshown in Table 4. It is noteworthy that the two periods wereselected based on data availability each year, and the min-imized influence of meteorological parameters in the samemonth of different years. The LPG-related VOCs decreasedfrom September to December in 2011 and 2013, but there
www.atmos-chem-phys.net/16/6609/2016/ Atmos. Chem. Phys., 16, 6609–6626, 2016

6616 X. Lyu et al.: Effectiveness of replacing catalytic converters in LPG-fueled vehicles
Figure 3. Monthly reductions of LPG-related VOCs at MK before(blue bar) and during (red bar) the program. (The average value ofVOC species in September is the baseline. The values along the dotline were the cumulative numbers of converters replaced. The barsabove and below the x axis refer to the reduction and increase ofVOC mixing ratio, respectively.)
was no significant difference in 2012. In general, the lev-els of VOCs in the atmosphere are associated with sourceemissions, photochemical reactions and regional transport.As the regional influence was excluded in this study, sourceemissions and photochemical reactions became the main fac-tors determining the ambient concentrations of VOCs. Thedecreasing and unchanged trends in 2011 and 2012 respec-tively might be related to the integrated influence of reducedphotochemical degradation (which increases ambient VOClevels) and temperature decrease (which reduces evapora-tive emissions of VOCs) from September to December. It isnoticeable that the LPG-related VOCs had the highest de-creasing rates in September–December 2013, compared to
Figure 4. Variation trends of the daily average propane and n/i-butanes at MK from June 2013 to May 2014. In the equation, labelx has a unit of days.
those in previous years. The higher decreasing rates of LPG-related VOCs in September–December 2013 implied the pos-sible effectiveness of the interventional program on VOCsreduction. For the period of January–May, the LPG-relatedVOCs increased in January–May 2013, except for propanewhich did not show significant change from January to May.However, significant decreasing trends (p < 0.05) were ob-served for propane and n/i-butanes during the same pe-riod in 2014, which was likely owing to the continuous re-placement of catalytic converters on LPG-fueled vehicles.By comparison, the reduction rates of LPG-related VOCs inJanuary–May 2014 were all lower than those in September–December 2013. This was mainly attributable to the factthat a large portion (i.e. ∼ 69 %) of the converter replace-ments were completed by the end of December 2013, andthere were much fewer replaced converters (i.e. ∼ 31 %) inJanuary–May 2014.
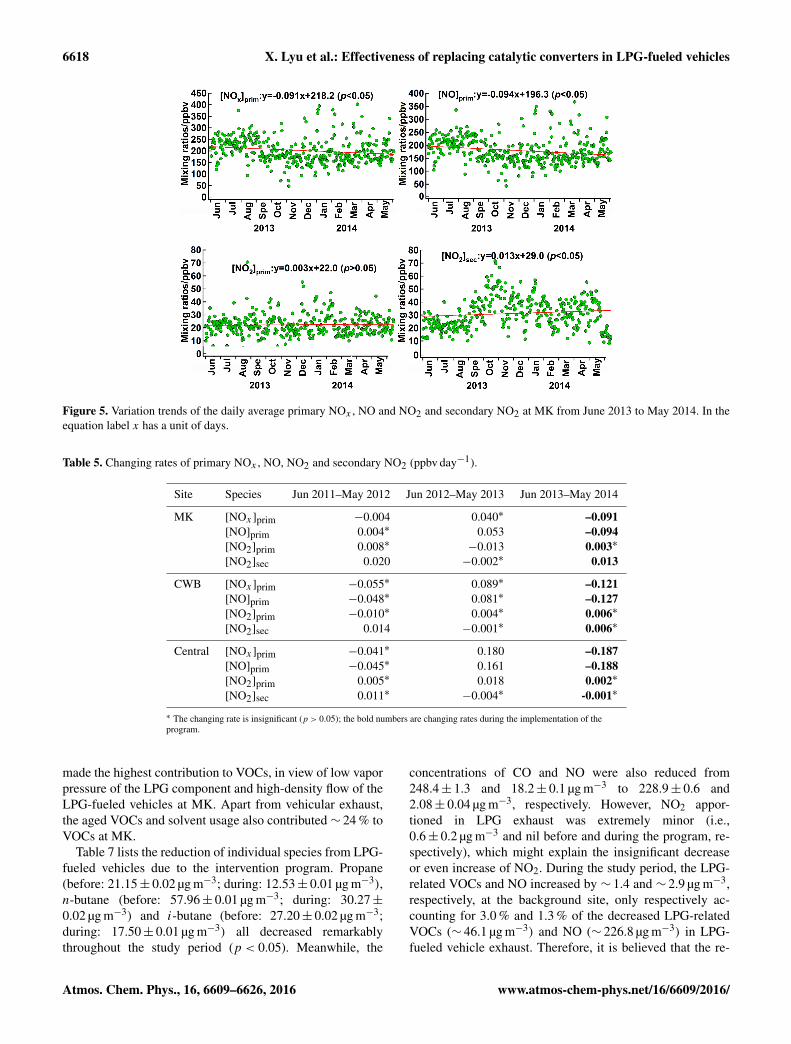
Figure 5 shows the temporal variations of primary NOx ,NO, NO2 and secondary NO2 at MK from June 2013 toMay 2014. The primary NOx and NO mixing ratios de-creased significantly (p < 0.05), implying the possible effec-tiveness of the intervention program on NO / NOx reduction.However, the secondary NO2 levels increased, while therewas no significant change (p > 0.05) for primary NO2. Toexplore the reasons of NO–NO2–NOx variations, the chang-ing rates of primary NOx , NO, NO2 and secondary NO2 dur-ing the same period (i.e., June in the previous year to Mayin the following year) in different years were compared. Ta-ble 5 shows the statistics of changing rates of NOx–NO–NO2 at the roadside sites (i.e., MK, CWB and Central) fromJune 2011 to May 2014. Taking MK as an example, theprimary NOx and NO decreased much faster (i.e., 91 and94 pptv day−1, respectively) from June 2013 to May 2014
Atmos. Chem. Phys., 16, 6609–6626, 2016 www.atmos-chem-phys.net/16/6609/2016/

X. Lyu et al.: Effectiveness of replacing catalytic converters in LPG-fueled vehicles 6617
Table 4. Changing rates of propane and n/i-butanes in September–December and January–May in different years (ppbv day−1).
Time period Sep–Dec Jan–MaySite Species 2011 2012 2013 2013 2014
MK Propane −0.015 −0.004∗ –0.017 0.004∗ –0.014i-butane −0.010 −0.008∗ –0.021 0.012 –0.005n-butane −0.023 −0.009∗ –0.039 0.016 –0.028
∗ The changing rate insignificant (p > 0.05); the bold numbers are changing rates during theimplementation of the program.
than during the same period in 2011–2012 and 2012–2013,suggesting the effectiveness of the program in reducing NOx
and NO. Compared to the decreasing rate in June 2012–May 2013 (i.e., 13 pptv day−1), no significant change (p >
0.05) was observed for primary NO2 from June 2013 toMay 2014. However, it cannot be concluded that the programcaused the increase of primary NO2, in view of the same in-significant variation in June 2011–May 2012 and the fact thatLPG-fueled vehicles emit negligible NO2 (see Sect. 3.2.2).In contrast, secondary NO2 significantly increased (with arate of 13 pptv day−1) from June 2013 to May 2014, whichwas also observed in June 2011–May 2012 (i.e., increasingrate of 20 pptv day−1). Since secondary NO2 is formed byNO reacting with O3, inspection of the O3 production wouldprovide more comprehensive interpretation on the secondaryNO2 increment during the program. Similar variations wereobserved at CWB and Central, where primary NOx and NOshowed significant decreasing trends, whereas the variationsof primary and secondary NO2 were insignificant (p > 0.05).
In summary, the LPG-related VOCs were significantlylowered during the program with monthly reductions of3.2± 0.2, 2.8± 0.2 and 4.9± 0.2 ppbv for propane, i-butaneand n-butane by the end of this study, respectively. Continu-ous decreasing trends were observed for LPG-related VOCs,and the reduction rates were almost unprecedented, e.g.,39 pptv day−1 for n-butane. Furthermore, the mixing ratiosof NO and NOx decreased as well during the program. Thereduction rates of NO and NOx during June 2013–May 2014at the three roadside sites were much higher than those inprevious years. Overall, the field measurement data indicatedthat the program was effective in reducing emissions of LPG-related VOCs and NOx .
3.2 Variations of LPG contributions to VOCs and NOx
3.2.1 Source identification
To investigate the change of the contributions of LPG-fueledvehicles to VOCs and NOx , the online data of 15 VOCsand three trace gases at MK before (i.e., 8753 samples dur-ing October 2012–September 2013) and during the inter-vention program (i.e., 5833 samples during October 2013–May 2014) were separately applied to PMF for source ap-portionments. It is noteworthy that the whole-air ambient
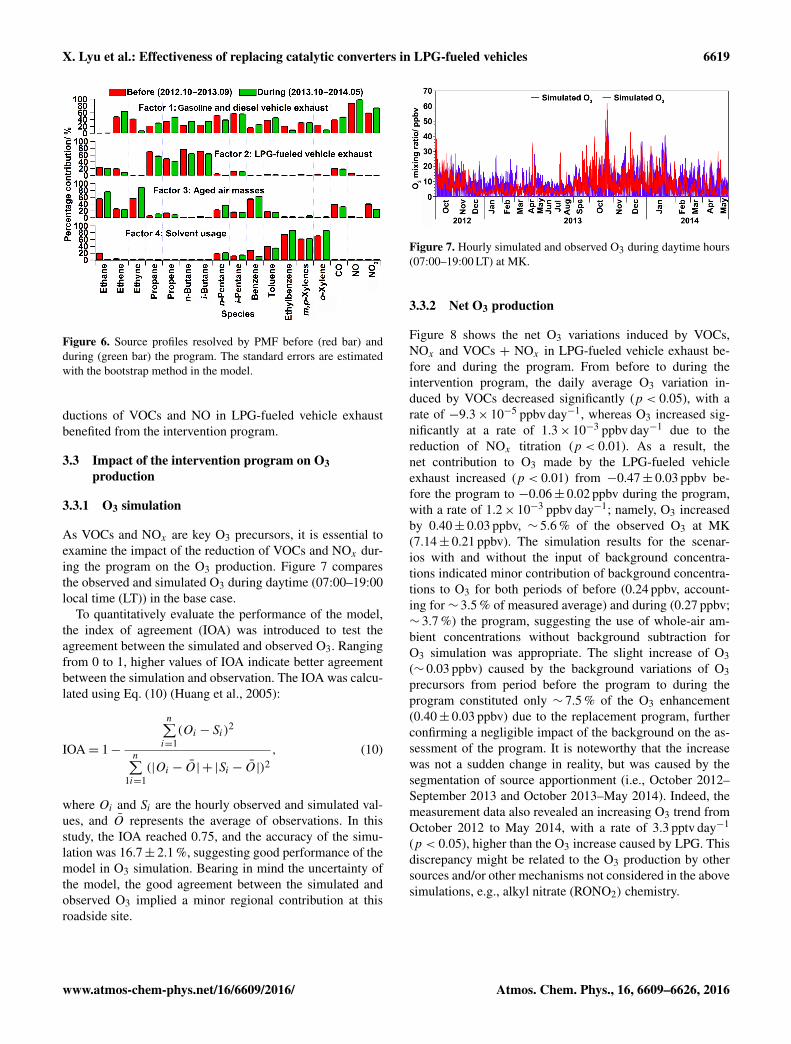
concentrations of VOCs and trace gases, rather than thosewith the backgrounds deducted were used here, in order tokeep consistency with the simulations of whole-air ambientO3 and photochemical reactivity. Figure 6 shows the sourceprofiles of the four factors that best reproduced the concen-trations of the input species before and during the interven-tion program, respectively. The first factor had high loadingsof C3–C5 hydrocarbons and toluene, and was dominated byCO, NO and NO2, which are all main components of vehi-cle exhaust (Guo et al., 2011a; Ho et al., 2009). The n/i-pentanes and toluene indicated emissions from gasoline ve-hicles, while the high NOx loading was a signature of dieselexhaust. Since propane and n/i-butanes were not prominent,this factor was assigned as gasoline and diesel-fueled vehi-cle exhaust. Factor 2 was closely associated with LPG-fueledvehicle exhaust, with the dominance of propane, n/i-butanesand propene, the major components and combustion productof LPG (Guo et al., 2011b; Blake and Rowland, 1995). Fac-tor 3 was distinguished by NO2 and the long-lived species,i.e., ethane, ethyne, benzene and CO. The long-lived specieswere the indicators of aged air masses, in which NO2 was ac-cumulated due to photochemical reactions. Hence, this factorrepresented aged air masses. Indeed, this profile highly coin-cided with the aged air in Hong Kong identified by Lau etal. (2010). The last factor explained most of the TEX com-pounds (toluene / ethylbenzene / xylenes), the tracers of sol-vent usage (Guo et al., 2007; Borbon et al., 2002). Therefore,factor 4 was identified as solvent usage.
3.2.2 Source contribution
Based on the VOC loadings in each source, Table 6 summa-rizes the mass and percentage contributions of the sources toVOCs at MK. LPG-fueled vehicle exhaust was the greatestcontributor to VOCs at MK, with the mass contribution of114.2± 0.1 µg m−3 (51.51± 0.05 %) and 64.8± 0.1 µg m−3
(39.07± 0.05 %) before and during the program, respec-tively. These contributions were higher than those quantifiedat other sites in Hong Kong, i.e., suburban TC (32.6± 5.8 %)(Ou et al., 2015), urban site Tsuen Wan (TW) (21± 2 %)(Ling and Guo, 2014) and suburban YL (15 %) (Guo et al.,2007). It is noteworthy that factors such as study period,chemical species, source profiles and models used all in-fluence the source apportionment. Bearing these factors inmind, the higher contributions of LPG-fueled vehicle ex-haust in this study were likely due to the fact that MK wasa roadside site closer to the emission sources. On the otherhand, though gasoline/diesel vehicles emitted considerableVOCs (i.e., 60.5± 0.1 and 56.8± 0.2 µg m−3 before and dur-ing the program, respectively), they were significantly lowerthan those emitted by LPG-fueled vehicles (p < 0.05), par-ticularly before the replacement of the catalytic converters.While LPG-fueled vehicles only accounted for a small num-ber of the registered vehicles (∼ 3.1 %) in Hong Kong (Ta-ble S4 in the Supplement), it was not unreasonable that LPG
www.atmos-chem-phys.net/16/6609/2016/ Atmos. Chem. Phys., 16, 6609–6626, 2016
6618 X. Lyu et al.: Effectiveness of replacing catalytic converters in LPG-fueled vehicles
Figure 5. Variation trends of the daily average primary NOx , NO and NO2 and secondary NO2 at MK from June 2013 to May 2014. In theequation label x has a unit of days.
Table 5. Changing rates of primary NOx , NO, NO2 and secondary NO2 (ppbv day−1).
Site Species Jun 2011–May 2012 Jun 2012–May 2013 Jun 2013–May 2014
MK [NOx ]prim −0.004 0.040∗ –0.091[NO]prim 0.004∗ 0.053 –0.094[NO2]prim 0.008∗ −0.013 0.003∗[NO2]sec 0.020 −0.002∗ 0.013
CWB [NOx ]prim −0.055∗ 0.089∗ –0.121[NO]prim −0.048∗ 0.081∗ –0.127[NO2]prim −0.010∗ 0.004∗ 0.006∗[NO2]sec 0.014 −0.001∗ 0.006∗
Central [NOx ]prim −0.041∗ 0.180 –0.187[NO]prim −0.045∗ 0.161 –0.188[NO2]prim 0.005∗ 0.018 0.002∗[NO2]sec 0.011∗ −0.004∗ -0.001∗
∗ The changing rate is insignificant (p > 0.05); the bold numbers are changing rates during the implementation of theprogram.
made the highest contribution to VOCs, in view of low vaporpressure of the LPG component and high-density flow of theLPG-fueled vehicles at MK. Apart from vehicular exhaust,the aged VOCs and solvent usage also contributed ∼ 24 % toVOCs at MK.
Table 7 lists the reduction of individual species from LPG-fueled vehicles due to the intervention program. Propane(before: 21.15± 0.02 µg m−3; during: 12.53± 0.01 µg m−3),n-butane (before: 57.96± 0.01 µg m−3; during: 30.27±0.02 µg m−3) and i-butane (before: 27.20± 0.02 µg m−3;during: 17.50± 0.01 µg m−3) all decreased remarkablythroughout the study period (p < 0.05). Meanwhile, the
concentrations of CO and NO were also reduced from248.4± 1.3 and 18.2± 0.1 µg m−3 to 228.9± 0.6 and2.08± 0.04 µg m−3, respectively. However, NO2 appor-tioned in LPG exhaust was extremely minor (i.e.,0.6± 0.2 µg m−3 and nil before and during the program, re-spectively), which might explain the insignificant decreaseor even increase of NO2. During the study period, the LPG-related VOCs and NO increased by ∼ 1.4 and ∼ 2.9 µg m−3,respectively, at the background site, only respectively ac-counting for 3.0 % and 1.3 % of the decreased LPG-relatedVOCs (∼ 46.1 µg m−3) and NO (∼ 226.8 µg m−3) in LPG-fueled vehicle exhaust. Therefore, it is believed that the re-
Atmos. Chem. Phys., 16, 6609–6626, 2016 www.atmos-chem-phys.net/16/6609/2016/
X. Lyu et al.: Effectiveness of replacing catalytic converters in LPG-fueled vehicles 6619
Figure 6. Source profiles resolved by PMF before (red bar) andduring (green bar) the program. The standard errors are estimatedwith the bootstrap method in the model.
ductions of VOCs and NO in LPG-fueled vehicle exhaustbenefited from the intervention program.
3.3 Impact of the intervention program on O3production
3.3.1 O3 simulation
As VOCs and NOx are key O3 precursors, it is essential toexamine the impact of the reduction of VOCs and NOx dur-ing the program on the O3 production. Figure 7 comparesthe observed and simulated O3 during daytime (07:00–19:00local time (LT)) in the base case.
To quantitatively evaluate the performance of the model,the index of agreement (IOA) was introduced to test theagreement between the simulated and observed O3. Rangingfrom 0 to 1, higher values of IOA indicate better agreementbetween the simulation and observation. The IOA was calcu-lated using Eq. (10) (Huang et al., 2005):
IOA= 1−
n∑i=1
(Oi − Si)2
n∑1i=1
(|Oi − O| + |Si − O|)2, (10)
where Oi and Si are the hourly observed and simulated val-ues, and O represents the average of observations. In thisstudy, the IOA reached 0.75, and the accuracy of the simu-lation was 16.7± 2.1 %, suggesting good performance of themodel in O3 simulation. Bearing in mind the uncertainty ofthe model, the good agreement between the simulated andobserved O3 implied a minor regional contribution at thisroadside site.
Figure 7. Hourly simulated and observed O3 during daytime hours(07:00–19:00 LT) at MK.
3.3.2 Net O3 production
Figure 8 shows the net O3 variations induced by VOCs,NOx and VOCs + NOx in LPG-fueled vehicle exhaust be-fore and during the program. From before to during theintervention program, the daily average O3 variation in-duced by VOCs decreased significantly (p < 0.05), with arate of −9.3× 10⁻⁵ ppbv day−1, whereas O3 increased sig-nificantly at a rate of 1.3× 10⁻³ ppbv day−1 due to thereduction of NOx titration (p < 0.01). As a result, thenet contribution to O3 made by the LPG-fueled vehicleexhaust increased (p < 0.01) from −0.47± 0.03 ppbv be-fore the program to −0.06± 0.02 ppbv during the program,with a rate of 1.2× 10⁻³ ppbv day−1; namely, O3 increasedby 0.40± 0.03 ppbv, ∼ 5.6 % of the observed O3 at MK(7.14± 0.21 ppbv). The simulation results for the scenar-ios with and without the input of background concentra-tions indicated minor contribution of background concentra-tions to O3 for both periods of before (0.24 ppbv, account-ing for ∼ 3.5 % of measured average) and during (0.27 ppbv;∼ 3.7 %) the program, suggesting the use of whole-air am-bient concentrations without background subtraction forO3 simulation was appropriate. The slight increase of O3(∼ 0.03 ppbv) caused by the background variations of O3precursors from period before the program to during theprogram constituted only ∼ 7.5 % of the O3 enhancement(0.40± 0.03 ppbv) due to the replacement program, furtherconfirming a negligible impact of the background on the as-sessment of the program. It is noteworthy that the increasewas not a sudden change in reality, but was caused by thesegmentation of source apportionment (i.e., October 2012–September 2013 and October 2013–May 2014). Indeed, themeasurement data also revealed an increasing O3 trend fromOctober 2012 to May 2014, with a rate of 3.3 pptv day−1
(p < 0.05), higher than the O3 increase caused by LPG. Thisdiscrepancy might be related to the O3 production by othersources and/or other mechanisms not considered in the abovesimulations, e.g., alkyl nitrate (RONO2) chemistry.
www.atmos-chem-phys.net/16/6609/2016/ Atmos. Chem. Phys., 16, 6609–6626, 2016

6620 X. Lyu et al.: Effectiveness of replacing catalytic converters in LPG-fueled vehicles
Table 6. Mass concentration and percentage contribution of the four sources to VOCs at MK before and during the program.
Source Before During
Mass (µg m−3) Percentage (%) Mass (µg m−3) Percentage (%)
Gasoline/diesel vehicle exhaust 60.5± 0.1 27.30± 0.05 56.8± 0.2 34.3± 0.1LPG-fueled vehicle exhaust 114.2± 0.1 51.51± 0.05 64.8± 0.1 39.07± 0.05Aged air masses 19.8± 0.2 8.9± 0.1 24.6± 0.1 14.8± 0.1Solvent usage 27.30± 0.04 12.31± 0.01 19.6± 0.1 11.84± 0.04
Table 7. VOCs and trace gases emitted from LPG-fueled vehiclesbefore and during the intervention program (unit: µg m−3 unlessotherwise specified). The standard errors are estimated with thebootstrap method in the PMF model. The bold fonts demonstratesignificant reductions of LPG related VOCs and NOx .
Before During
Ethane 1.192± 0.001 1.19± 0.01Ethene 1.327± 0.005 0.431± 0.004Ethyne 0.0000± 0.0004 0.000± 0.001Propane 21.15± 0.02 12.53± 0.01Propene 2.860± 0.004 1.553± 0.001n-butane 57.96± 0.01 30.27± 0.02i-butane 27.20± 0.02 17.50± 0.01n-pentane 0.251± 0.003 0.039± 0.002i-pentane 1.04± 0.01 0.786± 0.002Benzene 0.00± 0.01 0.000± 0.001Toluene 0.66± 0.02 0.50± 0.01Ethylbenzene 0.000± 0.001 0.000± 0.004m,p-xylene 0.416± 0.003 0.00± 0.01o-xylene 0.144± 0.001 0.006± 0.001CO 248.4± 1.3 228.9± 0.6NO 18.2± 0.1 2.08± 0.04NO2 0.6± 0.2 0.00± 0.08Sum of VOCs 114.2± 0.1 64.8± 0.1Contribution to VOCs (%) 51.5± 0.1 39.1± 0.1
3.4 Photochemical reactivity
3.4.1 OH, HO2 and their formation/loss rates in wholeair
As the “detergent” of atmosphere, OH initiates the oxidationof air pollutants including VOCs, CO and NOx , leading toO3 formation, and the cycling between OH and HO2 acceler-ates the propagation of the chain reactions. Thus, the budgetof OH and HO2 is an important parameter of a photochem-ical system. Figure 9 presents the average daytime patternsof OH and HO2 before and during the program. Typical bell-shaped patterns were observed for OH and HO2, which in-creased from morning to noon, peaked at 12:00–13:00 andthen decreased to low levels in the afternoon.
The average simulated concentrations ofOH and HO2 were 1.64± 0.78× 10⁵ and2.49± 1.28× 10⁵ molecules cm−3 before the program, and
Figure 8. Net O3 variation as a function of VOCs, NOx and VOCs+ NOx emitted from LPG-fueled vehicles.
1.80± 0.85× 10⁵ and 4.18± 2.03× 10⁵ molecules cm−3
during the program, respectively. Compared tothose modeled at an urban site in Hong Kong(2.3–3.6× 10⁶ molecules cm−3 for OH and 3.4–4.4× 10⁸ molecules cm−3 for HO2) (Ling et al., 2014),and those measured at a VOC-rich site in PRD (15× 106 and18× 108 molecules cm−3 for OH and HO2, respectively) (Luet al., 2012; Lou et al., 2010), the OH and HO2 levels weremuch lower at MK. This is not surprising because much OHand HO2 were consumed by high levels of VOCs and NOx
at the roadside MK (Fig. S3 in the Supplementary materialshows the simulated OH and HO2 at different sites with thePBM-MCM model). In addition, this study covered differentseasons of the study years, rather than the O3 episodes inLing et al. (2014) and summer only in Lu et al. (2012) andLou et al. (2010) when photochemical reactivity was usuallystronger. Apart from the increase of OH and HO2 from theperiod before the program to during the program, the ratioof HO2 / OH was significantly higher during the program(i.e., 3.7± 0.5) than that before (i.e., 1.9± 0.3) (p < 0.05),which might partly explain the increase of O3 throughout thestudy period. Nevertheless, since the OH, HO2 and HO2/OHwere simulated using the whole-air concentrations of O3precursors, whether their increases were mainly caused bythe intervention program requires further investigation, asshown below.
Since the changes in the formation/loss rates fromthe period before the program to during the program
Atmos. Chem. Phys., 16, 6609–6626, 2016 www.atmos-chem-phys.net/16/6609/2016/

X. Lyu et al.: Effectiveness of replacing catalytic converters in LPG-fueled vehicles 6621
Figure 9. Daytime patterns of OH and HO2 (a) before and (b) dur-ing the program.
Figure 10. Average formation and loss pathways of OH and HO2at MK during the study period.
were minor for each pathway of OH and HO2, Fig. 10presents their average pathway-specific formation and lossrates over the whole study period. The total forma-tion/loss rates of OH and HO2 were 5.8± 2.4× 10⁶ and2.6± 1.0× 10⁶ molecules cm−3 s−1, respectively. The reac-tion of HO2 with NO, HONO photolysis, O3 photoly-sis and ozonolysis of alkenes were the main sources ofOH, with contributions of 56.7± 11.6, 31.7± 10.7, 6.6± 3.3and 5.0± 1.7 %, respectively. On the other hand, OHwas consumed by reaction with NO (36.5± 5.5 %), NO2(35.1± 4.6 %), VOCs (14.8± 1.2 %) and CO (13.6± 1.0 %).For HO2 formation, the reaction between RO2 and NO wasthe most predominant pathway (54.8± 8.8 %), followed bythe reaction of OH with CO (23.3± 3.9 %), HCHO photol-ysis (13.1± 4.6 %), ozonolysis of alkenes (7.9± 2.1 %) andthe reaction of OH with HCHO (0.8± 0.2 %). Meanwhile,HO2 was almost exclusively consumed by reacting with NO.
3.4.2 Influence of the program on photochemicalreactivity
The differences between the simulation outputs of the sce-narios with and without LPG VOCs and NOx inputs deter-mined the contributions of LPG-fueled vehicle exhaust tothe formation/loss rates of OH and HO2, as summarized inTable 8. Generally, the formation/loss rates of OH and HO2contributed by the LPG source decreased from the period be-fore the program to during the program, which was caused bythe reduction of VOCs and NOx in the LPG source. Further-more, since the sum of the formation rates was lower than the
Figure 11. (a) Net production of OH and HO2 by LPG-fueled ve-hicle exhaust (negative values indicate net destruction); and (b) in-creases of OH and HO2 from the period before the program to dur-ing the program.
loss rates for OH for both before and during the program, butfor only HO2 before the program, the net effects of the LPGsource to OH and HO2 were destructive. However, the HO2formation rate exceeded its loss rate for the period of duringthe program, indicating a net production of HO2 by the LPGsource.
Figure 11a shows the net effects of the LPG source onthe production of OH and HO2. From before to during theprogram, the destruction rate of OH decreased, while thedestruction of HO2 switched to production. These varia-tions led to the increases of OH and HO2 from the pe-riod before the program to during the program, as shownin Fig. 11b. Different from the increases of OH and HO2in the whole air as shown in Fig. 9, the increases herewere caused by the intervention program. The OH andHO2 levels increased by 6.9± 1.1× 10³ molecules cm−3 and3.4± 1.2× 10⁴ molecules cm−3, respectively. The higher in-crease of HO2 than OH led to a higher ratio of HO2 / OHduring the program, resulting in a consequent O3 increment.
3.5 Improvement of the intervention program
3.5.1 O3–VOCs–NOx sensitivity in the whole air
O3–VOCs–NOx sensitivity can reflect the O3 variation rel-ative to the change of VOCs and NOx , from which VOC-limited regimes and NOx-limited regimes in O3 formationcan be indicated. Figure 12a and b show the O3–VOCs–NOx sensitivity in the air at MK between 40 and 100 and0.5 and 40 % of the observed average NOx , respectively. Theranges were selected according to the O3 levels and behav-iors responding to the variations of VOCs and NOx (detailswere given below). This sensitivity diagram was obtainedwith the aid of the PBM-MCM model, and based on theaverage diurnal profiles of air pollutants in the atmospherebefore the intervention program. The abscissa and longi-tudinal coordinates represent the percentages of NOx andVOCs relative to the real average values measured at MK(i.e., 100 % NOx = 235.6 ppbv; 100 % VOCs= 51.2 ppbv).In other words, they reflect the reduction percentages. Forexample, 80 % NOx or VOCs means NOx or VOCs was cut
www.atmos-chem-phys.net/16/6609/2016/ Atmos. Chem. Phys., 16, 6609–6626, 2016

6622 X. Lyu et al.: Effectiveness of replacing catalytic converters in LPG-fueled vehicles
Table 8. Contributions of LPG-fueled vehicle exhaust to the formation and loss of OH and HO2 before and during the program. The boldfonts demonstrate the sum of OH/HO2 formation/loss rates or the net formation rate of OH / HO2.
Reaction Before During(molecules cm−3 s−1) (molecules cm−3 s−1)
OH formation HO2 + NO (1.8± 0.8)× 105 (2.8± 1.2)× 104
O3 + alkenes (3.3± 1.2)× 104 (3.1± 1.2)× 104
Sum of OH formation (2.2± 0.9)× 105 (5.2± 1.9)× 104
OH loss OH + CO (1.4± 0.6)× 104 (1.5± 0.6)× 105
OH + NO2 (5.0± 2.0)× 103 –OH + NO (1.9± 0.02)× 105 (2.4± 1.0)× 104
OH + VOCs (2.3± 0.02)× 105 (1.5± 0.6)× 105
Sum of OH loss (5.7± 1.6)× 105 (3.2± 1.4)× 105
Net OH formation −(3.6± 0.8)× 105−(2.7± 1.2)× 105
HO2 formation RO2 + NO (8.1± 3.4)× 104 (1.3± 0.5)× 104
O3+ alkenes (3.3± 1.2)× 104 (3.1± 1.2)× 104
Sum of HO2formation (1.1± 0.4)× 105 (3.6± 1.3)× 104
HO2 loss HO2 + NO (1.8± 0.8)× 105 (2.8± 1.2)× 104
Sum of HO2 loss (1.8± 0.8)× 105 (2.8± 1.2)× 104
Net HO2 formation −(7.0± 3.1)× 104 (7.8± 3.1)× 103
by 20 %. O3 was simulated in 220 cases (i.e., 10 VOCs× 22NOx), and the maximum O3 in each case was extracted.
It was found that within the cutting range of 0–60 % ofNOx (Fig. 12a), O3 increased with the increase of VOCs andthe decrease of NOx , indicating a VOC-limited regime in O3formation. The black curve, perpendicular to the isopleths ofO3, demonstrated the most sensitive response of O3 to VOCsand NOx . Namely, O3 reduction could be achieved most effi-ciently towards the abscissa. Using the absolute value of RIR(i.e., |RIR|) as a measure of the O3–VOCs–NOx sensitivity, itincreased with the reduction of VOCs and NOx . For example,|RIR| for VOCs and NOx increased from 0.09 and 0.22 inthe scenario of 90 % VOCs and 90 % NOx , to 0.25 and 0.90in the scenario of 50 % VOCs and 50 % NOx , respectively.From before to during the program, VOCs and NOx de-creased ∼ 12 and ∼ 15 %, respectively (i.e., from point A toB), causing a slight O3 increment as described in Sect. 3.3.2.The red and green curves in the lower right corner of Fig. 12ashow the O3 production as a function of VOCs cut before(NOx = 100 %) and during the program (NOx =∼ 85 %), re-spectively. With the reduction of VOCs, O3 decreased. SinceO3–VOCs–NOx sensitivity increased during the program, O3decreased by 45.5 and 67.6 pptv with 10 % cut of VOCs be-fore and during the program, respectively, which means thatO3 reduction could be achieved more efficiently by furthercutting VOCs during the program.
With the continuous reduction of NOx , it was expectedthat the O3–VOCs–NOx sensitivity might change substan-tially due to the dual role of NOx in O3 formation and titra-tion. Figure 12b shows the O3–VOCs–NOx sensitivity in the
cutting range of 60–99.5 % of NOx . It is noticeable that inthe cutting range of ∼ 60–89.5 % of NOx , O3 increased withthe increase of VOCs and decrease of NOx , similar to thatin the cutting range of 0-60 % of NOx . However, a tran-sition area appeared when NOx was further cut, where O3stayed relatively stable with NOx variations, and decreasedwith VOC reductions. This transition area changed from∼ 5.5–10.5 % (i.e., VOCs = 100 %) to ∼ 2.5–6 % of NOx
(i.e., VOCs = 10 %). The appearance of the transition areaimplied that the titration of O3 by NOx reached the mini-mum level, and further cutting of NOx might actually causeO3 reduction. As expected, O3 decreased with the reductionof NOx when NOx was reduced to lower than ∼ 2.5–5.5 %(i.e., ∼ 2.5 % and ∼ 5.5 % for 10 % and 100 % VOCs, re-spectively), and responded weakly to VOC variations. Thismeans that O3 formation switched to a NOx-limited regime.It should be emphasized that this is the first attempt on thestudy of O3–VOCs–NOx sensitivity at roadsides in HongKong, which could be a reference for the formulation andimplementation of future air pollution control strategies inHong Kong.
Atmos. Chem. Phys., 16, 6609–6626, 2016 www.atmos-chem-phys.net/16/6609/2016/

X. Lyu et al.: Effectiveness of replacing catalytic converters in LPG-fueled vehicles 6623
Figure 12. (a) O3–VOCs–NOx sensitivity within the cutting rangeof 0–60 % of NOx . The black curve demonstrates the most sen-sitive response of O3 to VOCs and NOx . Points A and B representthe O3–VOCs–NOx relationship before and during the program, re-spectively. The red and green curves in the small legend show theO3 production as a function of VOC cuts before and during the pro-gram, respectively. (b) O3–VOCs–NOx sensitivity within the cut-ting range of 60–99.5 % of NOx.
Table 9. RIR and RIR (weighted concentration) of LPG-relatedVOCs.
RIR RIR(%/ %× 10−2) (weighted concentration)
(µg m−3)
Propane 3.47 1.04Propene 5.21 0.30i-butane 3.47 1.33n-butane 3.47 2.61
3.5.2 O3–VOCs–NOx sensitivity in LPG
Figure 13 shows the net O3 increment (i.e., positive and neg-ative values indicate the increase and decrease of O3, respec-tively) as a response of the reduction of VOCs and NOx inLPG-fueled vehicle exhaust. It was found that the net O3 in-crement uniformly increased with the increase of NOx cutand the decrease of VOCs cut. To ensure that O3 would notincrease during the program, the reduction of VOCs and NOx
should be within the highlighted area; that is, the highest cut-ting percentage of NOx should be less than 68.9 % (i.e., point
Figure 13. Net O3 increment as a function of the reduction per-centages of VOCs and NOx in LPG-fueled vehicle exhaust. Thehighlighted area indicates zero O3 increment.
A). Furthermore, when the cutting percentage of VOCs in-creased from 20 to 100 %, the maximum cutting percentageof NOx for zero O3 increment was between 18.2 and 68.9 %,and the cutting ratio of VOCs / NOx increased from 1.1 to1.45, suggesting that the cutting ratio of VOCs / NOx shouldbe > 1.1 in order to maintain zero O3 increment. Duringthe program, VOCs and NOx in LPG-fueled vehicle exhaustwere cut by∼ 43 and∼ 89 % (i.e., point B), respectively. Ac-cording to the cutting ratios of VOCs / NOx (∼ 1.45) in thehigh cutting range of NOx , the minimum reduction percent-age of VOCs should be ∼ 129 % when NOx was cut by ∼89 %. In other words, O3 would inevitably increase in thiscase.
Indeed, NO2 experienced an overall increase from 1999to 2013 at the roadsides in Hong Kong (HKEPD, 2014).According to this study, secondary NO2 might be moreresponsible for the increase. Considering nil emission ofNO2 (Sect. 3.2.2) and low emission of NO from LPG us-age (i.e., 4.0 and 1.1–7.3 % based on the emission inven-tory and source apportionment, respectively), an alternativescheme was proposed; namely, reasonable cutting ratio ofVOCs / NOx was used to fulfill zero O3 increase when VOCand NOx were cut. Although the O3 production increase wasminor (i.e., 0.4 ppbv or 5.6 %) in this study, this scheme couldbe applicable in future programs. Moreover, since the reac-tivity and concentration of VOCs influenced their O3 forma-tion potential, the relative incremental reactivity (RIR) andRIR (weighted concentration) of LPG-related VOCs werecalculated. Table 9 shows the RIR and RIR-weighted con-centration of propane, propene and n/i-butanes. Propene hadthe highest RIR (i.e., 5.21× 10⁻²), suggesting the highestsensitivity of O3 production to propene. However, n-butanein LPG was found to have the highest RIR (weighted con-centration) (2.61 µg m−3), indicating that cutting n-butane inLPG source was optimal for O3 pollution control.
www.atmos-chem-phys.net/16/6609/2016/ Atmos. Chem. Phys., 16, 6609–6626, 2016
6624 X. Lyu et al.: Effectiveness of replacing catalytic converters in LPG-fueled vehicles
4 Conclusions
In this study, an intervention program, initiated in Septem-ber 2013, and which aimed to reduce emissions of VOCs andNOx from LPG-fueled vehicles in Hong Kong, was evalu-ated. The results indicated that LPG-related VOCs and NOx
decreased significantly during the program, when higher re-duction rates were observed for LPG-related VOCs and NOx
compared to those in previous years. Source apportionmentrevealed that propane, n/i-butanes and NO in LPG-fueledvehicle emissions were significantly lower during than be-fore the program. It was therefore concluded that the pro-gram was remarkably effective in reducing VOCs and NOx .To evaluate the program more comprehensively, the varia-tion of O3 production was simulated with the PBM-MCMmodel. It was found that LPG-fueled vehicular emission wasgenerally O3-destructive at the roadside MK site, and the O3destruction decreased from 0.47 to 0.06 ppbv due to the in-tervention program, causing an hourly average O3 increase of0.40 ppbv (∼ 5.6 %). The LPG-fueled vehicle exhaust gener-ally made negative contributions to the production of OH andHO2. During the program, the destructive effect weakenedand even turned to a positive contribution to HO2 produc-tion, resulting in the increases of OH, HO2 and HO2 / OH.This was in line with the fact that O3 increased slightly dur-ing the implementation of the program. To improve the pro-gram for future application, an O3–VOCs–NOx sensitivityanalysis was conducted for ambient air that is not partitionedto sources, and the individual source of LPG-fueled vehicleexhaust. The NOx-limited regime in O3 formation was onlyfound when NOx was reduced to less than 5.5 %. Further-more, for the emission reductions in LPG-fueled vehicle ex-haust, the maximum NOx cutting percentage of 68.9 % andthe lowest cutting ratio of VOCs / NOx (i.e., 1.1) were deter-mined to maintain zero O3 increment.
The Supplement related to this article is available onlineat doi:10.5194/acp-16-6609-2016-supplement.
Acknowledgements. This study was supported by the ResearchGrants Council of the Hong Kong Special Administrative Regionvia grants PolyU5154/13E and PolyU152052/14E, and the HongKong Polytechnic University PhD scholarships (project no. RTUP).This study is partly supported by the Public Policy ResearchFunding Scheme (2013.A6.012.13A), Hong Kong PolyU internalgrant (87UB) and the National Natural Science Foundation ofChina (no. 41275122).
Edited by: A. B. Guenther
References
Barletta, B., Meinardi, S., Simpson, I. J., Khwaja, H. A., Blake, D.R., and Rowland, F. S.: Mixing ratios of volatile organic com-pounds (VOCs) in the atmosphere of Karachi, Pakistan, Atmos.Environ., 36, 3429–3443, 2002.
Blake, D. R. and Rowland, F. S.: Urban Leakage of LiquefiedPetroleum Gas and Its Impact on Mexico City Air Quality, Sci-ence, 269, 953-956, 1995.
Borbon, A., Locoge, N., Veilerot, M., Galloo, J. C., and Guillermo,R.: Characterization of NMHCs in a French urban atmospheric:overview of the main sources, Sci. Total Environ., 292, 177–191,2002.
Brown, S. G., Frankel, A., and Hafner, H. R.: Source apportionmentof VOCs in Los Angeles area using positive matrix factorization,Atmos. Environ., 41, 227–237, 2007.
Carter, W. L. and Atkinson, R.: Computer modeling study of incre-mental hydrocarbon reactivity, Environ. Sci. Tech., 23, 864–880,1989.
Chan, C. Y. and Chan, L. Y.: Effect of meteorology and air pollutanttransport on ozone episodes at a subtropical coastal Asian city,Hong Kong, J. Geophys. Res., 105, 20707–20724, 2000.
Cheng, H. R., Guo, H., Wang, X. M., Saunders, S. M., Lam, S. H.M., Jiang, F., Wang, T., Ding, A., Lee, S. C., and Ho, K. F.: Onthe relationship between ozone and its precursors in the PearlRiver Delta: application of an observation-based model (OBM),Environ. Sci. Pollut. Res., 17, 547–560, 2010.
Chikhi, S., Boughedaoui, M., Kerbachi, R., and Joumard, R.: On-board measurement of emissions from liquefied petroleum gas,gasoline and diesel powered passenger cars in Algeria, J. Envi-ron. Sci., 26, 1651–1659, 2014.
Ciccone, G., Forastiere, F., Agabiti, N., Biggeri, A., Bisanti, L.,Chellini, E., Corbo, G., Dell’Orco, V., Dalmasso, P., Volante, T.F., Galassi, C., Piffer, S., Renzoni, E., Rusconi, F., Sestini, P., andViegi, G.: Road traffic and adverse respiratory effects in children,J. Occup. Environ. Med., 55, 771-778, 1998.
Farmer, D. K., Perring, A. E., Wooldridge, P. J., Blake, D. R., Baker,A., Meinardi, S., Huey, L. G., Tanner, D., Vargas, O., and Co-hen, R. C.: Impact of organic nitrates on urban ozone production,Atmos. Chem. Phys., 11, 4085–4094, doi:10.5194/acp-11-4085-2011, 2011.
Gamas, E. D., Diaz, L., Rodriguez, R., Lopez-Salinas, E., andSchifter, I.: Exhaust emissions from gasoline- and LPG-poweredvehicles operating at the altitude of Mexico city, J. Air WasteManage., 49, 1179–1189, 1999.
Guo, H., Wang, T., and Louie, P. K. K.: Source apportionment ofambient non-methane hydrocarbons in Hong Kong: Applicationof a principal component analysis/absolute principal componentscores (PCA/APCS) receptor model, Environ. Pollut., 129, 489–498, 2004.
Guo, H., Wang, T., Blake, D. R., Simpson, I. J., Kwok, Y. H., and Li,Y. S.: Regional and local contributions to ambient non-methanevolatile organic compounds at a polluted rural/coastal site inPearl River Delta, China, Atmos. Environ., 40, 2345–2359, 2006.
Guo, H., So, K. L., Simpson, I. J., Barletta, B., Meinardi, S., andBlake, D. R.: C1-C8 volatile organic compounds in the atmo-sphere of Hong Kong: Overview of atmospheric processing andsource apportionment, Atmos. Environ., 41, 1456–1472, 2007.
Guo, H., Jiang, F., Cheng, H. R., Simpson, I. J., Wang, X. M., Ding,A. J., Wang, T. J., Saunders, S. M., Wang, T., Lam, S. H. M.,
Atmos. Chem. Phys., 16, 6609–6626, 2016 www.atmos-chem-phys.net/16/6609/2016/

X. Lyu et al.: Effectiveness of replacing catalytic converters in LPG-fueled vehicles 6625
Blake, D. R., Zhang, Y. L., and Xie, M.: Concurrent observa-tions of air pollutants at two sites in the Pearl River Delta and theimplication of regional transport, Atmos. Chem. Phys., 9, 7343–7360, doi:10.5194/acp-9-7343-2009, 2009.
Guo, H., Cheng, H. R., Ling, Z. H., Louie, P. K. K., and Ayoko,G. A.: Which emission sources are responsible for the volatileorganic compounds in the atmosphere of Pearl River Delta?, J.Hazard. Mater., 188, 116–124, 2011a.
Guo, H., Zou, S.C ., Tsai, W. Y., Chan, L. Y., and Blake, D. R.:Emission characteristics of non-methane hydrocarbons from pri-vate cars and taxis at different driving speeds in Hong Kong, At-mos. Environ., 45, 2711–2721, 2011b.
HKCSD (Hong Kong Census and Statistics Department): HongKong Energy Statistics: Annual Report, available at: http://www.censtatd.gov.hk (last access: 15 March 2016), 2010.
HKEPD (Hong Kong Environmental Protection Depart-ment): Air quality in Hong Kong 2013, available at:http://www.aqhi.gov.hk/en/download/air-quality-reportse469.html?showall=_&start=_1) (last access: 15 March 2016), 2014.
Ho, K. F., Lee, S. C., Guo, H., and Tsai, W. Y.: Seasonal and diurnalvariations of volatile organic compounds (VOCs) in the atmo-sphere of Hong Kong, Sci. Total Environ., 322, 155–166, 2004.
Ho, K. F., Lee, S. C., Cao, J. J., Chow J. C., Watson, J. G., andChan, C. K.: Seasonal variations and mass closure analysis ofparticulate matter in Hong Kong, Sci. Total Environ., 355, 276–287, 2006.
Ho, K. F., Lee, S. C., Ho, W. K., Blake, D. R., Cheng, Y., Li, Y.S., Ho, S. S. H., Fung, K., Louie, P. K. K., and Park, D.: Ve-hicular emission of volatile organic compounds (VOCs) from atunnel study in Hong Kong, Atmos. Chem. Phys., 9, 7491–7504,doi:10.5194/acp-9-7491-2009, 2009.
Huang, J. P., Fung, J. C. H., Lau, A. K. H., and Qin, Y.:Numerical simulation and process analysis of typhoon-relatedO3 episodes in Hong Kong, J. Geophys. Res., 110, D05301,doi:10.1029/2004JD004914, 2005.
Huang, J. P., Fung, J. C. H. and Lau, A. K. H.: Integrated pro-cesses analysis and systematic meteorological classification ofozone episodes in Hong Kong, J. Geophys. Res., 111, D20309,doi:10.1029/2005JD007012, 2006.
Jiang, F., Wang, T. J., Wang, T. T., Xie, M., and Zhao, H.: Numeri-cal modeling of a continuous photochemical pollution episode inHong Kong using QRF-chem, Atmos. Environ., 42, 8717–8727,2008.
Lai, C. H., Chang, C. C., Wang, C. H., Shao, M., Zhang, Y. H., andWang, J. L.: Emissions of liquefied petroleum gas (LPG) frommotor vehicles, Atmos. Environ., 43, 1456–1463, 2009.
Lam, K. S., Wang, T. J., Wu, C. L., and Li, Y. S.: Study on an ozoneepisode in hot season in Hong Kong and transboundary air pol-lution over Pearl River Delta region of China, Atmos. Environ.,39, 1967–1977, 2005.
Lam, S. H. M., Saunders, S. M., Guo, H., Ling, Z. H., Jiang, F.,Wang, X. M., and Wang, T. J.: Modelling VOC source impactson high ozone episode days observed at a mountain summit inHong Kong under the influence of mountain-valley breezes, At-mos. Environ., 81, 166–176, 2013.
Lau, A. K. H., Yuan, Z. B., Yu, J. Z., and Louie, P. K. K.: Sourceapportionment of ambient volatile organic compounds in HongKong, Sci. Total Environ., 408, 4138–4149, 2010.
Lau, J., Hung, W. T., and Cheung, C. S.: On-board gaseous emis-sions of LPG taxis and estimation of taxi fleet emissions, Sci.Total Environ., 409, 5292–5300, 2011.
Lee, E., Chan, C. K., and Paatero, P.: Application of positive matrixfactorization in source apportionment of particulate pollutants inHong Kong, Atmos. Environ., 33, 3201–3212, 1999.
Lee, S. C., Chiu, M. Y., Ho, K. F., Zou, S. C., and Wang, X.M.: Volatile organic compounds (VOCs) in urban atmosphere ofHong Kong, Chemosphere, 48, 375–382, 2002.
Ling, Z. H. and Guo, H.: Contribution of VOC sources to photo-chemical ozone formation and its control policy implication inHong Kong, Environ. Sci. Policy, 38, 180–191, 2014.
Ling, Z. H., Guo, H., Cheng, H. R., and Yu, Y. F.: Sources of am-bient volatile organic compounds and their contributions to pho-tochemical ozone formation at a site in the Pearl River Delta,southern China, Environ. Pollut., 159, 2310–2319, 2011.
Ling, Z. H., Guo, H., Zheng, J. Y., Louie, P. K. K., Cheng, H. R.,Jiang, F., Cheung, K., Wong, L. C., and Feng, X. Q.: Establishinga conceptual model for photochemical ozone pollution in sub-tropical Hong Kong, Atmos. Environ., 76, 208–220, 2013.
Ling, Z. H., Guo, H., Lam, S. H. M., Saunders, S. M., and Wang,T.: Atmospheric photochemical reactivity and ozone productionat two sites in Hong Kong: Application of a Master ChemicalMechanism-photochemical box model, J. Geophys. Res. Atmos.,119, 10567–10582, doi:10.1002/2014JD021794, 2014.
Liu, Y., Shao, M., Lu, S. H., Chang, C. C., Wang, J. L., and Fu, L. L.:Source apportionment of ambient volatile organic compounds inthe Pearl River Delta, China: Part II, Atmos. Environ., 42, 6261–6274, 2008.
Lou, S., Holland, F., Rohrer, F., Lu, K., Bohn, B., Brauers, T.,Chang, C. C., Fuchs, H., Häseler, R., Kita, K., Kondo, Y.,Li, X., Shao, M., Zeng, L., Wahner, A., Zhang, Y., Wang,W., and Hofzumahaus, A.: Atmospheric OH reactivities inthe Pearl River Delta – China in summer 2006: measurementand model results, Atmos. Chem. Phys., 10, 11243–11260,doi:10.5194/acp-10-11243-2010, 2010.
Lu, K. D., Rohrer, F., Holland, F., Fuchs, H., Bohn, B., Brauers, T.,Chang, C. C., Häseler, R., Hu, M., Kita, K., Kondo, Y., Li, X.,Lou, S. R., Nehr, S., Shao, M., Zeng, L. M., Wahner, A., Zhang,Y. H., and Hofzumahaus, A.: Observation and modelling of OHand HO2 concentrations in the Pearl River Delta 2006: a missingOH source in a VOC rich atmosphere, Atmos. Chem. Phys., 12,1541–1569, doi:10.5194/acp-12-1541-2012, 2012.
Madronich, S. and Flocke, S.: Theoretical estimation of biologicallyeffective UV radiation at the Earth’s surface, in: Solar Ultravio-let Radiation-Modeling, Measurements and Effects, edited by:Zerefos, C., NATO ASI Series, vol. I52. Springer-Verlag, Berlin,1997.
Martien, P. T., Harley, R. A., Milford, J. B., and Russell, A. G.:Evaluation of incremental reactivity and its uncertainty in South-ern California, Environ. Sci. Technol., 37, 1598–1608, 2003.
Myung, C. L., Kim, J., Choi, K., Hwang, I. G., and Park, S.: Com-parative study of engine control strategies for particulate emis-sions from direct injection light-duty vehicle fueled with gaso-line and liquid phase liquefied petroleum gas (LPG), Fuel, 94,348–355, 2012.
Ou, J. M., Guo, H., Zheng, J. Y., Cheung, K., Louie, P. K. K., Ling,Z. H., and Wang, D. W.: Concentrations and sources of non-methane hydrocarbons (NMHCs) from 2005 to 2013 in Hong
www.atmos-chem-phys.net/16/6609/2016/ Atmos. Chem. Phys., 16, 6609–6626, 2016

6626 X. Lyu et al.: Effectiveness of replacing catalytic converters in LPG-fueled vehicles
Kong: A multi-year real-time data analysis, Atmos. Environ.,103, 196–206, 2015.
Paatero, P.: Least squares formulation of robust non-negative factoranalysis, Chemom. Intell. Lab. Sys., 37, 23–35, 1997.
Paatero, P. and Tapper, U.: Positive matrix factorization: A non-negative factor model with optimal utilization of error estimatesof data values, Environmetrics, 5, 111–126, 1994.
Ren, X. R., Harder, H., Martinez, M., Lesher, R. L., Oliger, A., Sim-pas, J. B., Brune, W. H., Schwab, J. J., Demerjian, K. L., He, Y.,Zhou, X. L., and Gao, H. L.: OH and HO2 chemistry in the urbanatmosphere of New York City, Atmos. Environ., 37, 3639–3651,2003.
Ruellan, S. and Cachier, H.: Characterisation of fresh particulatevehicular exhausts near a Paris high flow road, Atmos. Environ.,35, 453–468, 2001.
Schifter, I., Diaz, L., Lopez-Salinas, E., Rodriguez, R., Avalos, S.,and Guerrero, V.: An evaluation of the LPG vehicles program inthe metropolitan area of Mexico city, J. Air Waste Manage., 50,301–309, 2000.
So, K. L. and Wang, T.: On the local and regional influence onground-level ozone concentrations in Hong Kong, Environ. Pol-lut., 123, 307–317, 2003.
Takekawa, H., Chatani, S., and Akiyoshi, I.: A new approach forestimation of the effect of NOx emission reduction on road-side NO2 concentration in Tokyo, Atmos. Environ., 68, 92–102,2013.
Wang, T., Guo, H., Blake, D. R., Kwok, Y. H., Simpson, I. J., and Li,Y. S.: Measurements of trace gases in the inflow of South ChinaSea background air and outflow of regional pollution at Tai O,southern China, J. Atmos. Chem. 52, 295–317, 2005.
Wang, T., Wei, X. L., Ding, A. J., Poon, C. N., Lam, K. S., Li, Y. S.,Chan, L. Y., and Anson, M.: Increasing surface ozone concen-trations in the background atmosphere of Southern China, 1994–2007, Atmos. Chem. Phys., 9, 6217–6227, doi:10.5194/acp-9-6217-2009, 2009.
Wang, T. J., Lam, K. S., Xie, M., Wang, X. M., Carmichael, G., andLi, Y. S.: Integrated studies of a photochemical smog episode inHong Kong and regional transport in the Pearl River Delta ofChina, Tellus B, 58, 31–40, 2006.
Xie, S. D., Zhang, Y. H., Li, Q., and Tang, X. Y.: Spatial distribu-tion of traffic-related pollutant concentrations in street canyons,Atmos. Environ., 37, 3213–3224, 2003.
Zhang, J., Wang, T., Chameides, W. L., Cardelino, C., Kwok, J.,Blake, D. R., Ding, A., and So, K. L.: Ozone production andhydrocarbon reactivity in Hong Kong, Southern China, Atmos.Chem. Phys., 7, 557–573, doi:10.5194/acp-7-557-2007, 2007.
Atmos. Chem. Phys., 16, 6609–6626, 2016 www.atmos-chem-phys.net/16/6609/2016/