Embed Size (px)
Citation preview
NDIA Systems Engineering EffectivenessNovember 15, 2007
1
Effective Systems Engineering: Effective Systems Engineering: What’s the Payoff for Program What’s the Payoff for Program
Performance?Performance?
NDIA Systems Engineering NDIA Systems Engineering Effectiveness CommitteeEffectiveness Committee
CMMI Technology ConferenceCMMI Technology ConferenceNovember 15, 2007November 15, 2007
NDIA Systems Engineering EffectivenessNovember 15, 2007
2
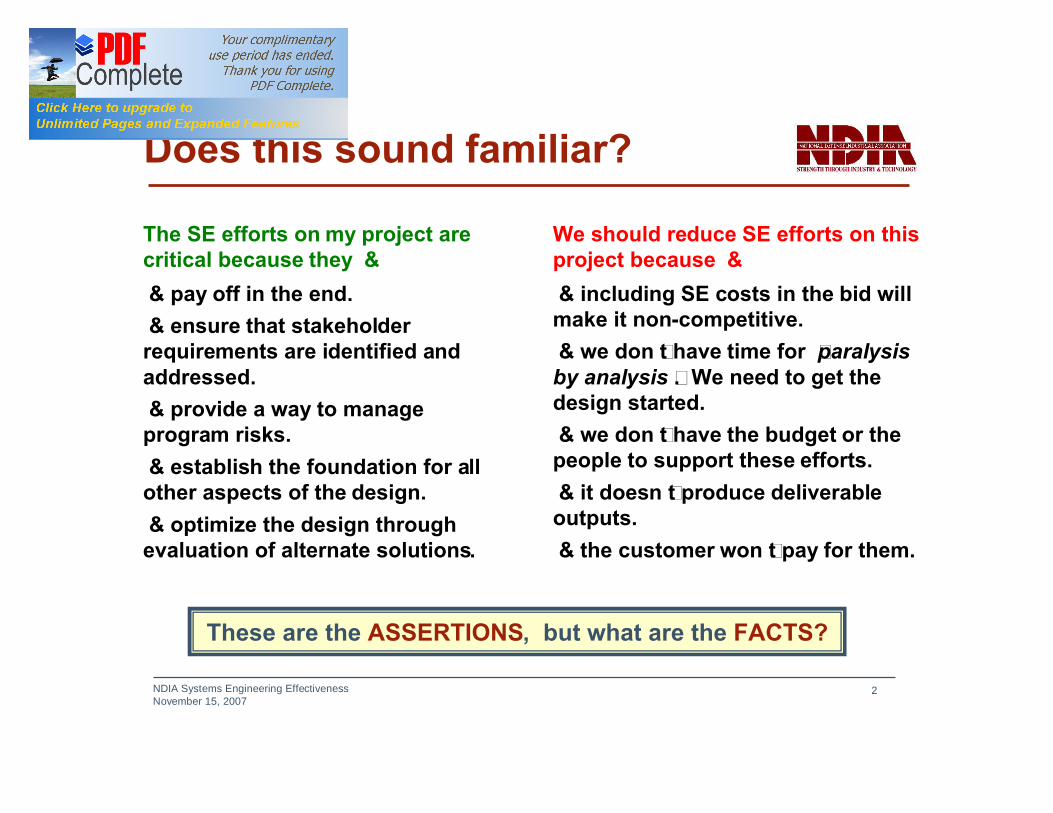
Does this sound familiar?
… including SE costs in the bid will make it non-competitive.… we don’t have time for ‘paralysis by analysis’. We need to get the design started.… we don’t have the budget or the people to support these efforts.… it doesn’t produce deliverable outputs.… the customer won’t pay for them.
… pay off in the end.… ensure that stakeholder requirements are identified and addressed.… provide a way to manage program risks.… establish the foundation for all other aspects of the design.… optimize the design through evaluation of alternate solutions.
We should reduce SE efforts on this project because …
The SE efforts on my project are critical because they …
These are the ASSERTIONS, but what are the FACTS?
NDIA Systems Engineering EffectivenessNovember 15, 2007
3
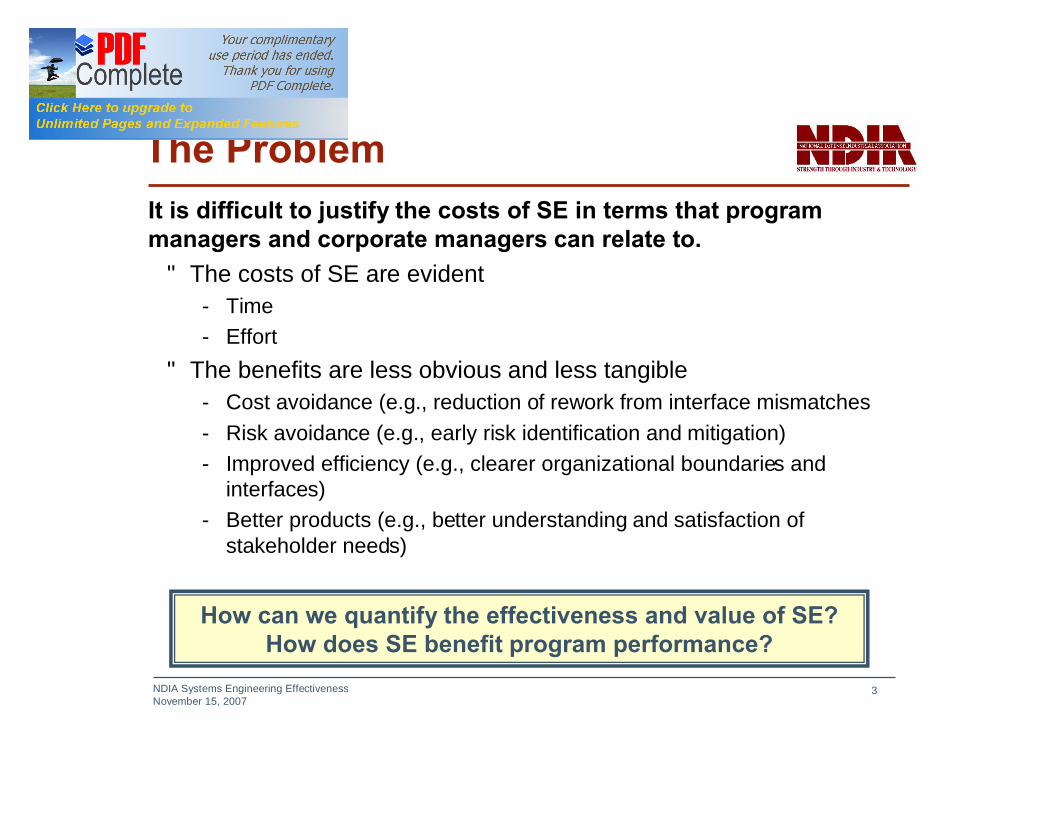
The ProblemIt is difficult to justify the costs of SE in terms that programmanagers and corporate managers can relate to.• The costs of SE are evident
- Time- Effort
• The benefits are less obvious and less tangible- Cost avoidance (e.g., reduction of rework from interface mismatches- Risk avoidance (e.g., early risk identification and mitigation)- Improved efficiency (e.g., clearer organizational boundaries and
interfaces)- Better products (e.g., better understanding and satisfaction of
stakeholder needs)
How can we quantify the effectiveness and value of SE?How does SE benefit program performance?

NDIA Systems Engineering EffectivenessNovember 15, 2007
4
Systems Engineering Effectiveness Survey(2004-2007)
Hypothesis: The effective performance of SE best practices on a development program yields quantifiable improvements in the program execution (e.g., improved cost performance, schedule performance, technical performance).
Objectives:• Characterize effective SE practices • Correlate SE practices with measures
of program performance
Approach:• Distribute survey to NDIA companies• SEI analysis and correlation of responses
Survey Areas:Process definition Trade studies Project reviewsProject planning Interfaces ValidationRisk management Product structure Configuration mgmtRequirements development Product integration MetricsRequirements management Test and verification
NDIA Systems Engineering EffectivenessNovember 15, 2007
5
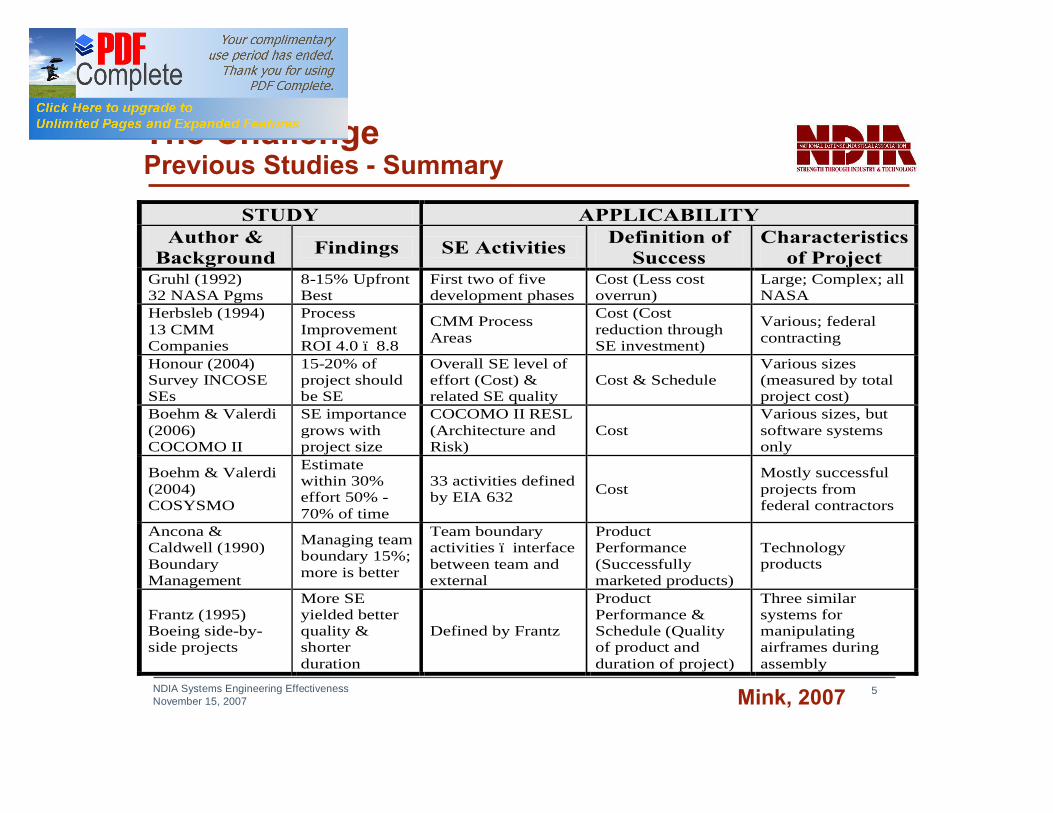
The ChallengePrevious Studies - Summary
Mink, 2007
STUDY APPLICABILITY Author &
Background Findings SE Activities Definition of Success
Characteristics of Project
Gruhl (1992) 32 NASA Pgms
8-15% Upfront Best
First two of five development phases
Cost (Less cost overrun)
Large; Complex; all NASA
Herbsleb (1994) 13 CMM Companies
Process Improvement ROI 4.0 – 8.8
CMM Process Areas
Cost (Cost reduction through SE investment)
Various; federal contracting
Honour (2004) Survey INCOSE SEs
15-20% of project should be SE
Overall SE level of effort (Cost) & related SE quality
Cost & Schedule Various sizes (measured by total project cost)
Boehm & Valerdi (2006) COCOMO II
SE importance grows with project size
COCOMO II RESL (Architecture and Risk)
Cost Various sizes, but software systems only
Boehm & Valerdi (2004) COSYSMO
Estimate within 30% effort 50% - 70% of time
33 activities defined by EIA 632 Cost
Mostly successful projects from federal contractors
Ancona & Caldwell (1990) Boundary Management
Managing team boundary 15%; more is better
Team boundary activities – interface between team and external
Product Performance (Successfully marketed products)
Technology products
Frantz (1995) Boeing side-by-side projects
More SE yielded better quality & shorter duration
Defined by Frantz
Product Performance & Schedule (Quality of product and duration of project)
Three similar systems for manipulating airframes during assembly

NDIA Systems Engineering EffectivenessNovember 15, 2007
6
The Challenge -Supporting Evidence
Honour, Eric (2004), Understanding the Value of Systems Engineering, Proceedings of the 14th Annual INCOSE International Symposium
Gruhl, Werner (1992), Lessons Learned: Cost/Schedule Assessment, Internal Presentation, NASA Comptroller’s Office
NDIA Systems Engineering EffectivenessNovember 15, 2007
7
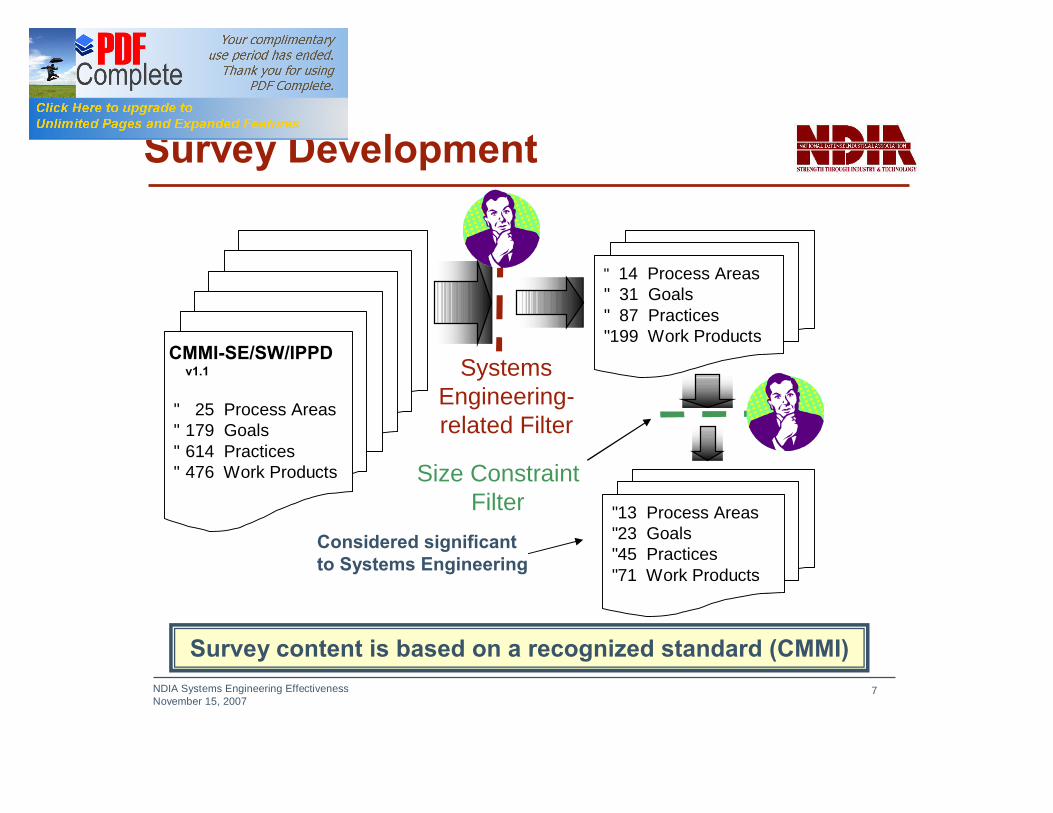
Survey Development
• 14 Process Areas• 31 Goals• 87 Practices• 199 Work Products
CMMI-SE/SW/IPPD v1.1
• 25 Process Areas• 179 Goals• 614 Practices• 476 Work Products
SystemsEngineering-related Filter
• 13 Process Areas• 23 Goals• 45 Practices• 71 Work Products
Size Constraint Filter
Considered significant to Systems Engineering
Survey content is based on a recognized standard (CMMI)

NDIA Systems Engineering EffectivenessNovember 15, 2007
8
Survey Methodology(Conducted: 2004-2007)
1. Public NDIA/SEI report awaiting approval.2. Restricted attachment, details provided to respondents only.
Reports
Raw data analyzed by Software Engineering Institute.Analysis results reviewed by NDIA SE Effectiveness Committee.
Analysis
64 survey responses (46 complete; 18 partial, but usable)Responses
30 – 60 minutesTarget Response Time
1. Characterization of the project /program under consideration2. Evidence of Systems Engineering Best Practices3. Project / Program Performance Metrics
Questionnaire Structure
Program Manager or designee(s) from individual projectsTarget Respondent
Web deployment (open August 10, 2006 - November 30, 2006). Anonymous response. Questions based on CMMI-SE/SW/IPPD v1.1
Survey Deployment
Invitation to qualifying active members of NDIA Systems Engineering Division. Random sampling within organization.
Sampling Method
Organizations developing products in support of government contracts (prime or subcontractors).
Survey Population
NDIA Systems Engineering EffectivenessNovember 15, 2007
9
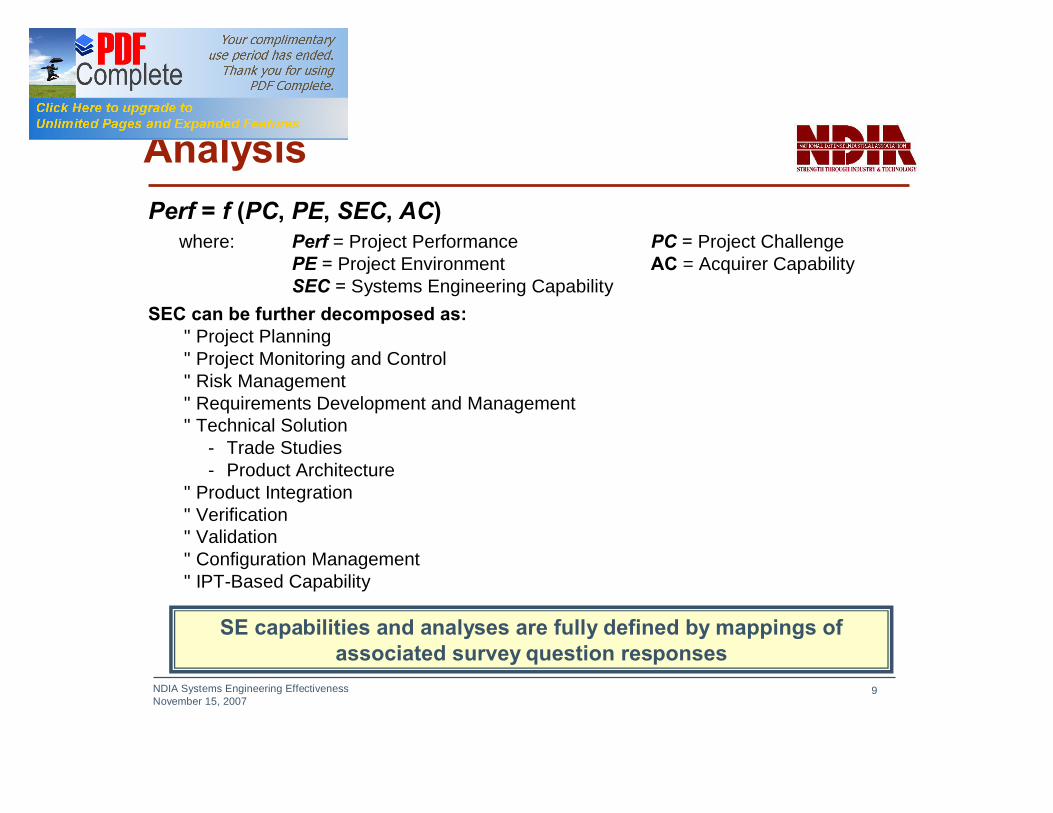
AnalysisPerf = f (PC, PE, SEC, AC)
where: Perf = Project Performance PC = Project ChallengePE = Project Environment AC = Acquirer CapabilitySEC = Systems Engineering Capability
SEC can be further decomposed as: • Project Planning• Project Monitoring and Control• Risk Management• Requirements Development and Management• Technical Solution
- Trade Studies- Product Architecture
• Product Integration• Verification• Validation • Configuration Management• IPT-Based Capability
SE capabilities and analyses are fully defined by mappings of associated survey question responses
NDIA Systems Engineering EffectivenessNovember 15, 2007
10
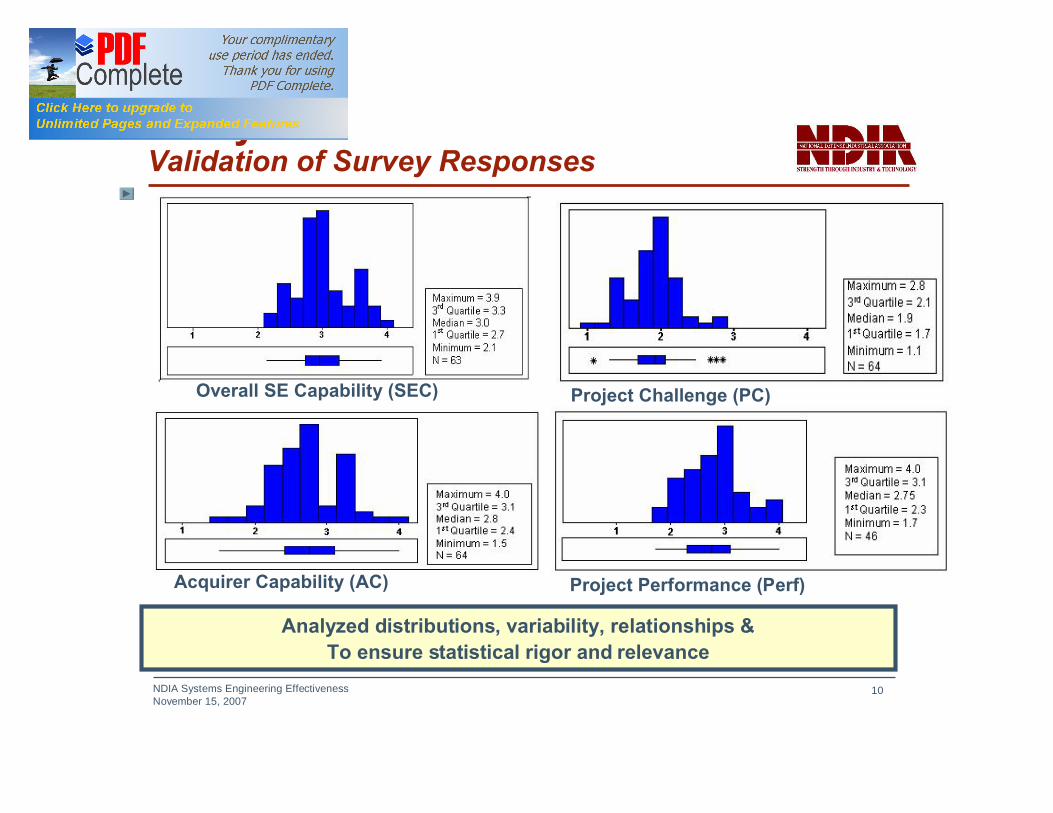
Analysis -Validation of Survey Responses
Analyzed distributions, variability, relationships…To ensure statistical rigor and relevance
Project Challenge (PC)
Project Performance (Perf)
Overall SE Capability (SEC)
Acquirer Capability (AC)
NDIA Systems Engineering EffectivenessNovember 15, 2007
11
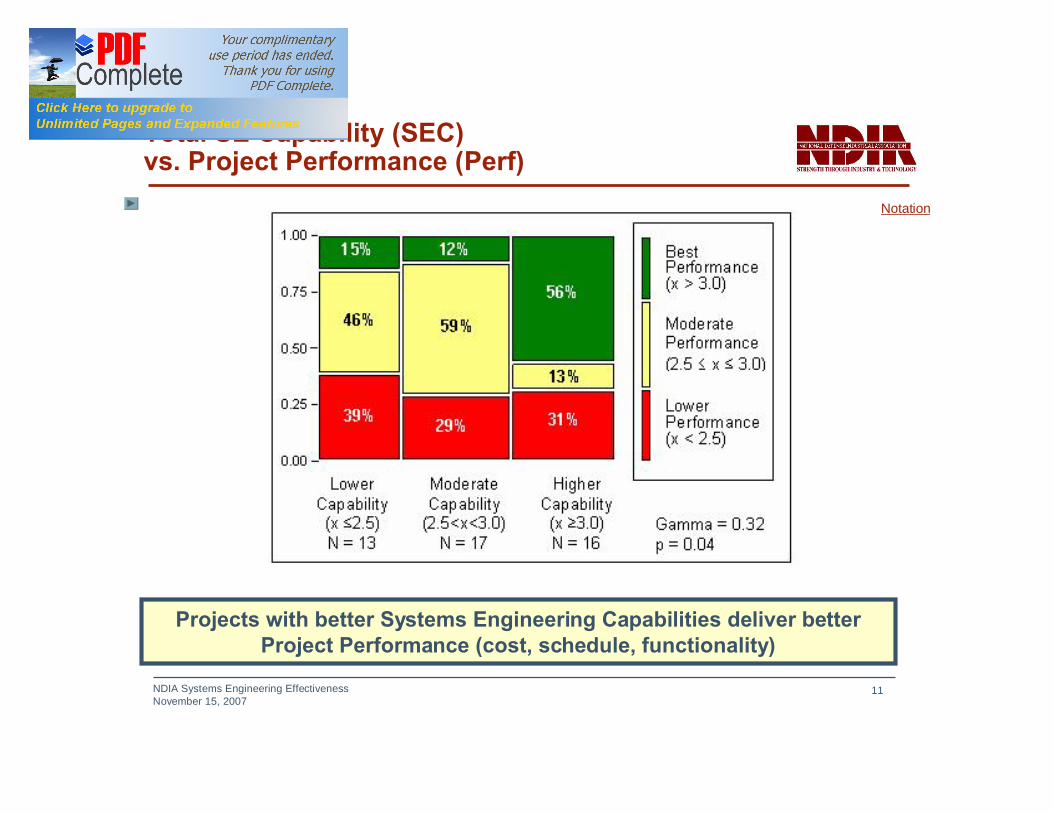
Total SE Capability (SEC) vs. Project Performance (Perf)
Projects with better Systems Engineering Capabilities deliver better Project Performance (cost, schedule, functionality)
Notation

NDIA Systems Engineering EffectivenessNovember 15, 2007
12
Relating Project Performance to Project Challenge and SE Capability
Project challenge factors:•Life cycle phases•Project characteristics
(e.g., size, effort, duration, volatility)
•Technical complexity•Teaming relationships
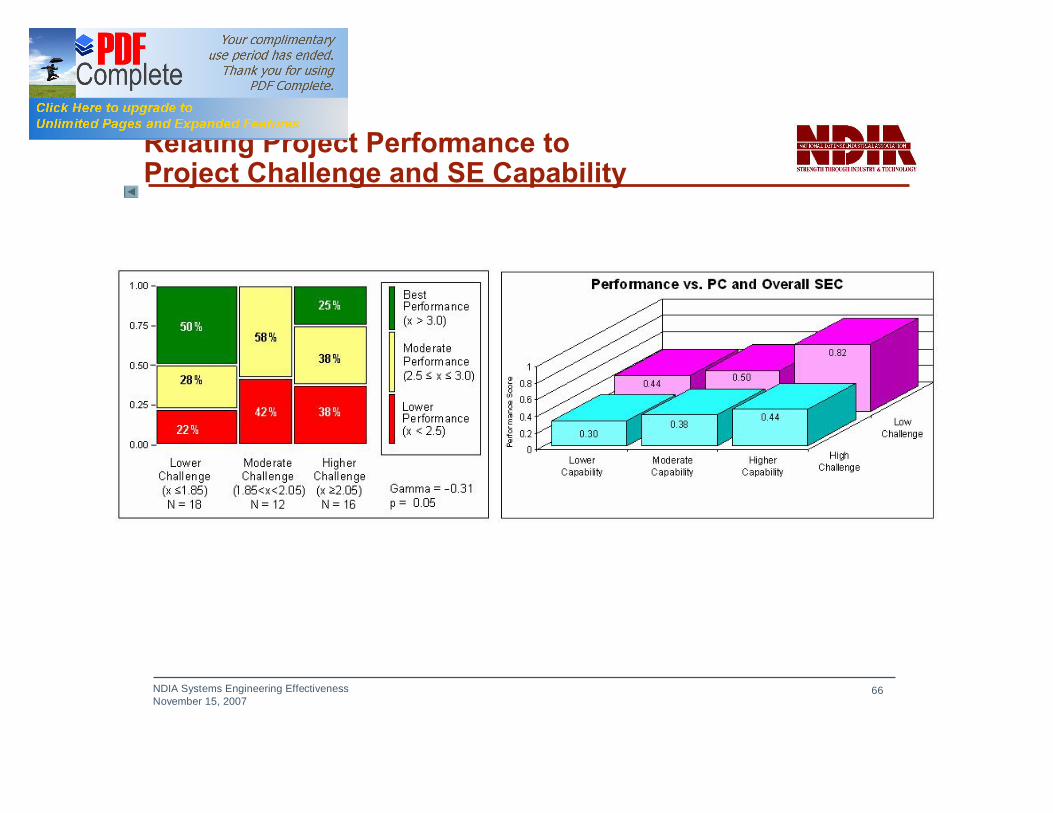
Projects with better Systems Engineering Capabilities are better able to overcome challenging environments
NDIA Systems Engineering EffectivenessNovember 15, 2007
13
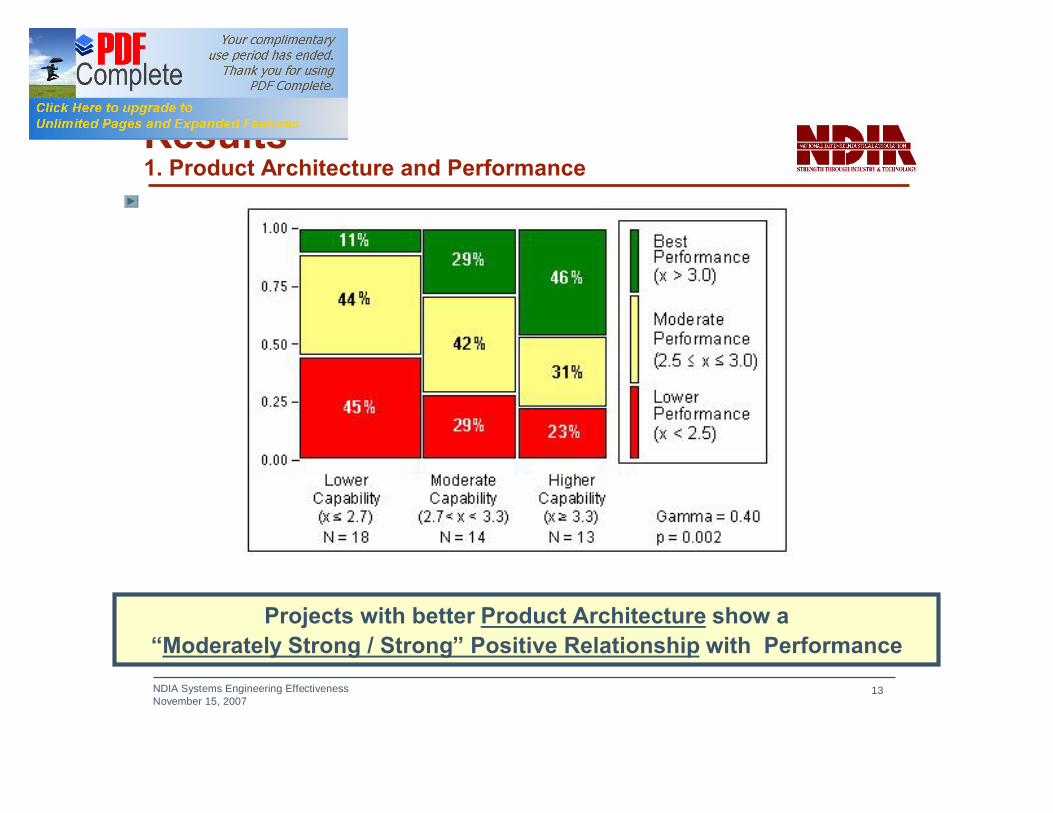
Results1. Product Architecture and Performance
Projects with better Product Architecture show a “Moderately Strong / Strong” Positive Relationship with Performance
NDIA Systems Engineering EffectivenessNovember 15, 2007
14
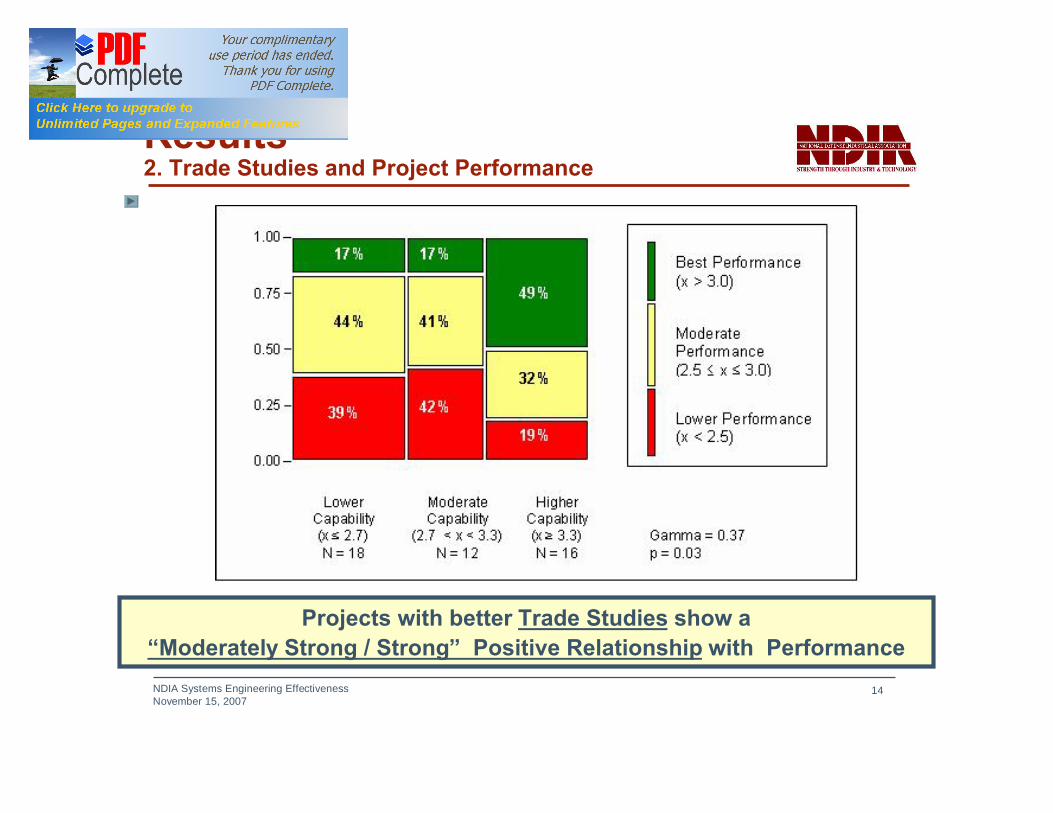
Results2. Trade Studies and Project Performance
Projects with better Trade Studies show a“Moderately Strong / Strong” Positive Relationship with Performance
NDIA Systems Engineering EffectivenessNovember 15, 2007
15
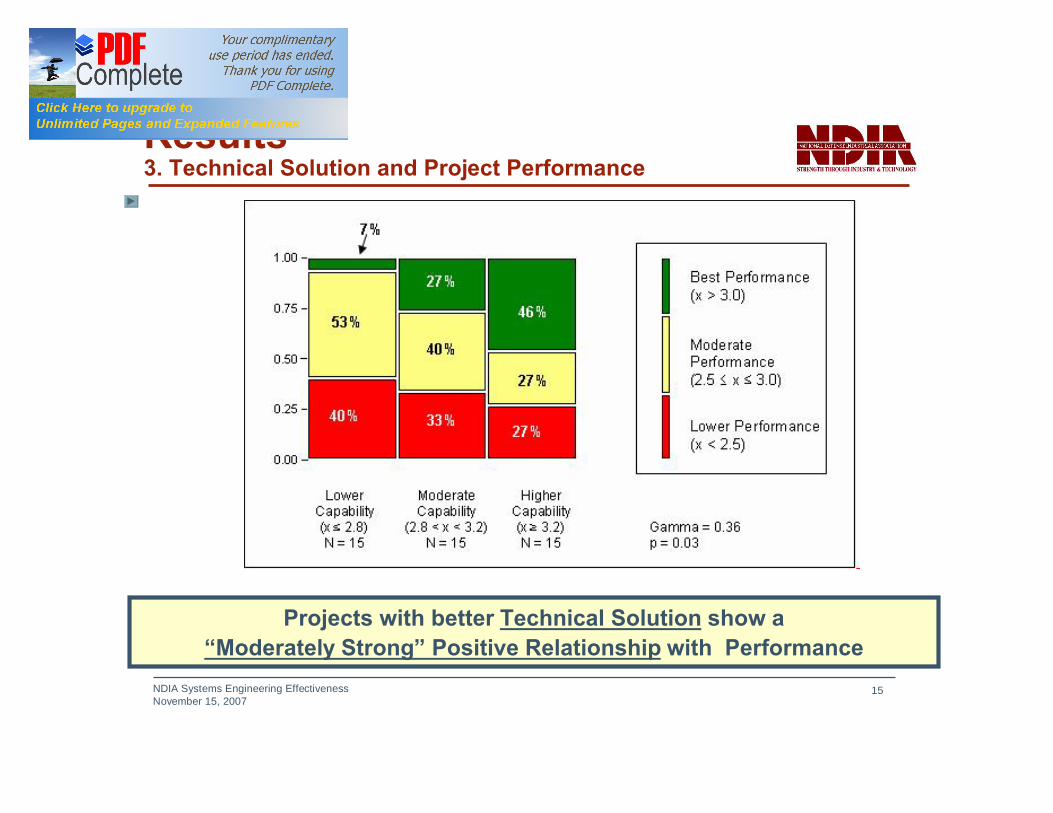
Results3. Technical Solution and Project Performance
Projects with better Technical Solution show a“Moderately Strong” Positive Relationship with Performance
NDIA Systems Engineering EffectivenessNovember 15, 2007
16
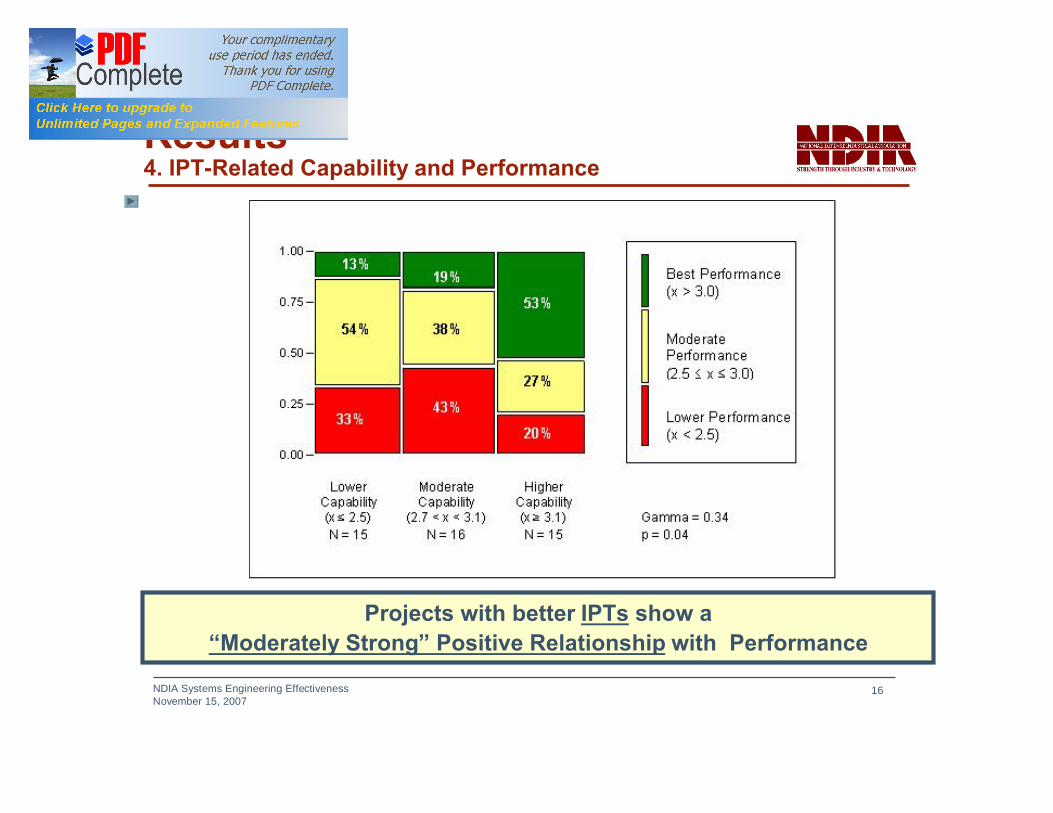
Results4. IPT-Related Capability and Performance
Projects with better IPTs show a“Moderately Strong” Positive Relationship with Performance
NDIA Systems Engineering EffectivenessNovember 15, 2007
17
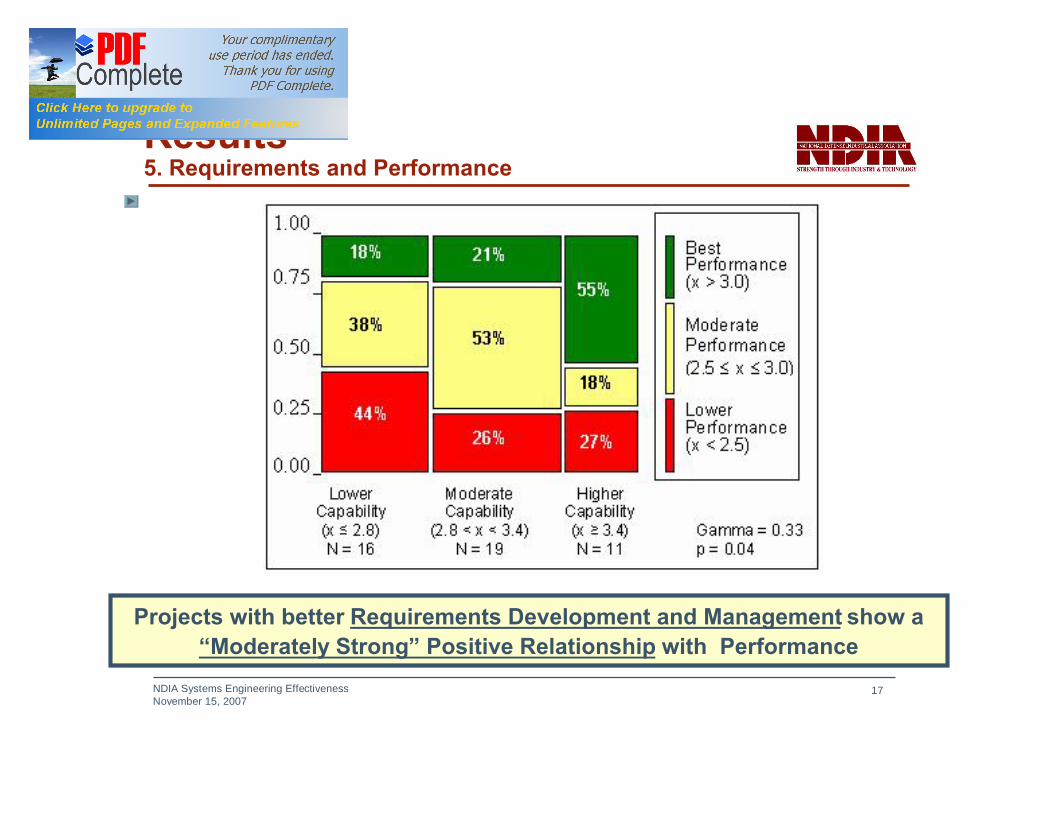
Results5. Requirements and Performance
Projects with better Requirements Development and Management show a“Moderately Strong” Positive Relationship with Performance
NDIA Systems Engineering EffectivenessNovember 15, 2007
18
Details
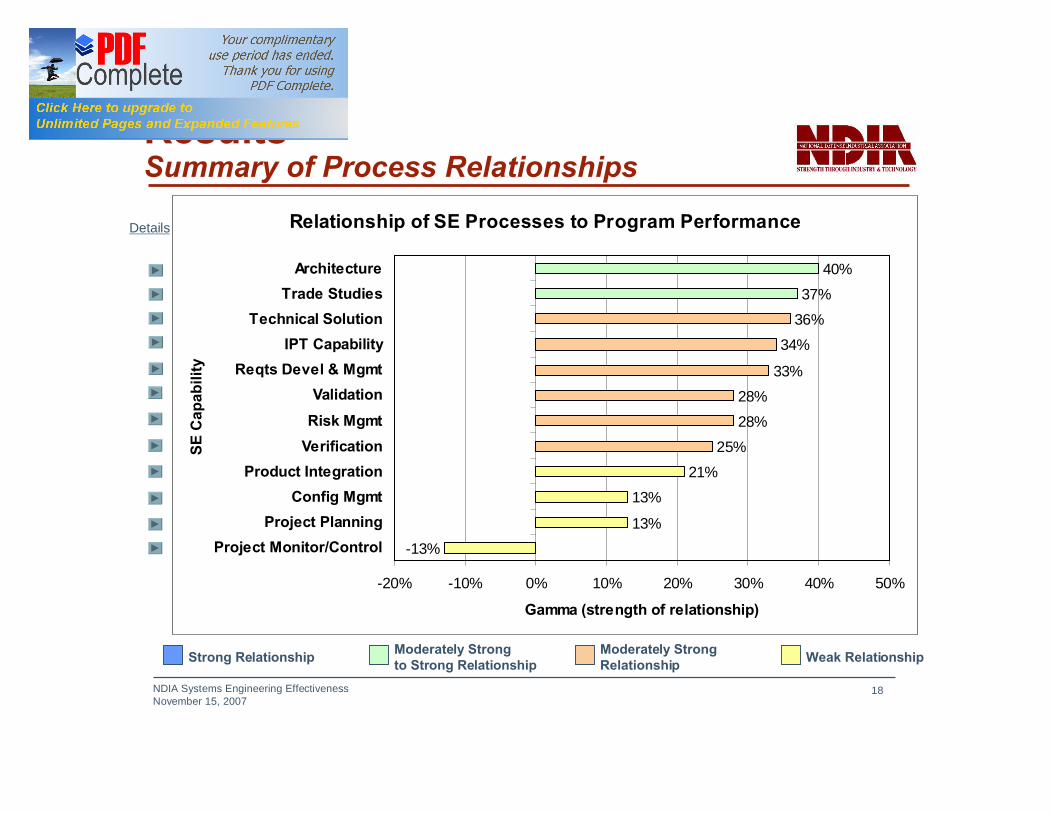
ResultsSummary of Process Relationships
Strong Relationship Moderately Strongto Strong Relationship
Moderately StrongRelationship Weak Relationship
Relationship of SE Processes to Program Performance
-13%
13%
13%
21%
25%
28%
28%
33%
34%
36%
37%
40%
-20% -10% 0% 10% 20% 30% 40% 50%
Project Monitor/ControlProject Planning
Config MgmtProduct Integration
VerificationRisk MgmtValidation
Reqts Devel & MgmtIPT Capability
Technical SolutionTrade Studies
Architecture
SE C
apab
ility
Gamma (strength of relationship)

NDIA Systems Engineering EffectivenessNovember 15, 2007
19
Relationship of SE Processes to Program Performance
-13%13%13%
21%25%
28%28%
32%33%34%
36%37%
40%49%
63%
-20% -10% 0% 10% 20% 30% 40% 50% 60% 70%
Project Monitor/ControlProject Planning
Config MgmtProduct Integration
VerificationRisk MgmtValidation
Overall SE CapabilityReqts Devel & Mgmt
IPT CapabilityTechnical Solution
Trade StudiesArchitecture
Reqts + Tech SolutionReqts + Tech Sol + Challenge
Gamma (strength of relationship)Composite Measures
Details
ResultsSummary of Relationships - Composite
Strong Relationship Moderately Strongto Strong Relationship
Moderately StrongRelationship Weak Relationship
NDIA Systems Engineering EffectivenessNovember 15, 2007
20
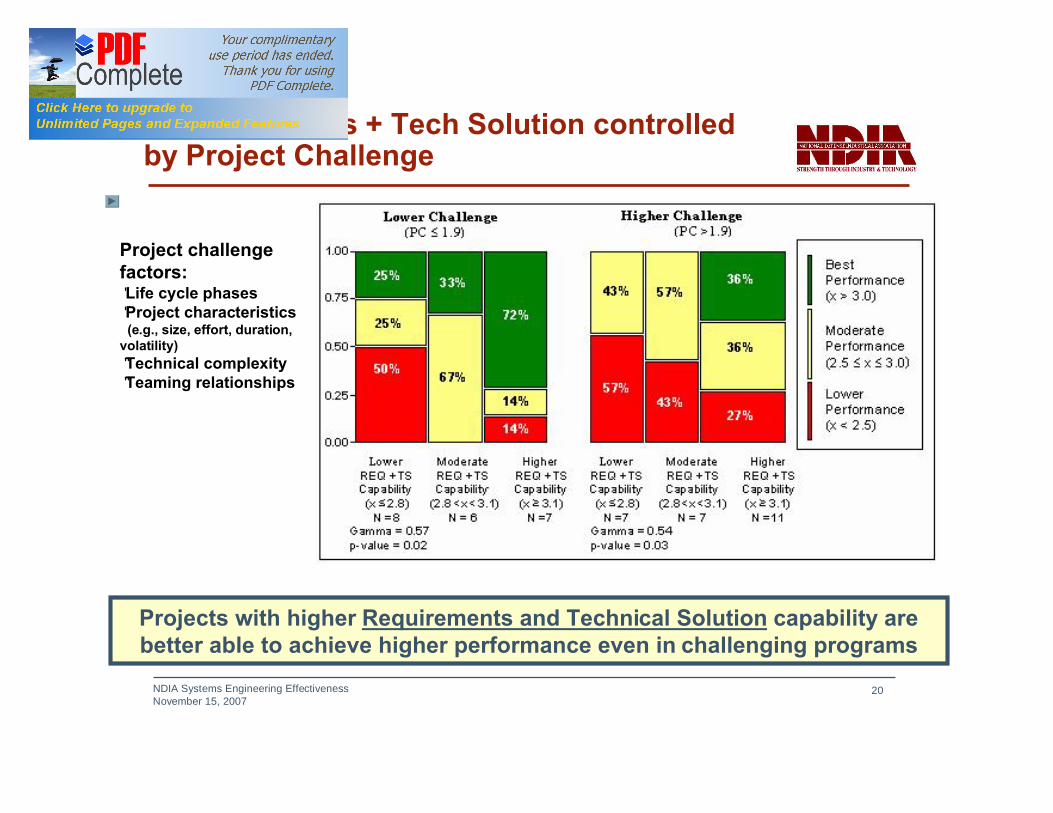
Results - Reqts + Tech Solution controlled by Project Challenge
Project challenge factors:•Life cycle phases•Project characteristics
(e.g., size, effort, duration, volatility)•Technical complexity•Teaming relationships
Projects with higher Requirements and Technical Solution capability are better able to achieve higher performance even in challenging programs

NDIA Systems Engineering EffectivenessNovember 15, 2007
21
Summary
SE Effectiveness• Provides credible measured evidence about the value of
disciplined Systems Engineering• Affects success of systems-development projects
Specific Systems Engineering Best Practices• Highest relationships to activities on the “left side of SE Vee”• The environment (Project Challenge) affects performance too:
- Some projects are more challenging than others ... and higher challenge affects performance negatively in spite of better SE
- Yet good SE practices remain crucial for both high and low challenge projects
NDIA Systems Engineering EffectivenessNovember 15, 2007
22
Potential Next StepsProvide recommendations for action upon survey findings
Conduct additional follow-on surveys and analysis of collected data• IV&V• Broadened sample space• Trending• Improvements to survey instrument
Survey system acquirers

NDIA Systems Engineering EffectivenessNovember 15, 2007
23
Acknowledgements
Dennis Ahearn Col. Warren Anderson Marvin Anthony Ben Badami David P. BallAlan R. Brown Al Bruns Robert Bruff Thomas Christian John ColombiJack Crowley Greg DiBennedetto Jim Dietz Brian Donahue Terry DoranGeoffrey Draper Joseph Elm Jefferey Forbes John P. Gaddie Donald J. GantzerDennis Goldenson Dennis E. Hecht Ellis Hitt James Holton Sherwin JacobsonGeorge Kailiwai Ed Kunay Dona M. Lee Jeff Loren David MaysJohn Miller Al Mink Gordon F. Neary Brad Nelson Rick NeupertOdis Nicoles Brooks Nolan Ken Ptack Michael Persson Arthur PysterBob Rassa James “Rusty” Rentsch Paul Robitaille Garry Roedler Rex SalladeJ. R. Schrand Sarah Sheard Jack Stockdale Jason Stripinis Mike UcchinoRuth Wuenschel Brenda Zettervall
NDIA SE Effectiveness Committee Members
Robert Ferguson Mike Konrad Brian Gallagher Keith Kost James McCurley Tom Merendino Gerald Miller Mike Phillips Dave Zubrow Larry Farrell
Supporters
Alan R. Brown Robert Bruff Brian Donahue Nicole Donatelli Geoffrey Draper Terry DoranKhaled El Emam Joseph Elm Dennis Goldenson Sherwin Jacobson Al Mink Angelica Neisa Gordon F. Neary Brad Nelson Ken Ptack Mike Ucchino
Primary Contributors
NDIA Systems Engineering EffectivenessNovember 15, 2007
24
SE EffectivenessPoints of Contact
Al Brown [email protected]
Geoff Draper [email protected]
Joe Elm [email protected]
Dennis Goldenson [email protected]
Al Mink [email protected]
Ken Ptack [email protected]
Mike Ucchino [email protected]

NDIA Systems Engineering EffectivenessNovember 15, 2007
25
Backup
NDIA SE Effectiveness SurveyAnalysis Slides

NDIA Systems Engineering EffectivenessNovember 15, 2007
26
Conclusions & CaveatsConsistent with “Top 10 Reasons Projects Fail*”
1. Lack of user involvement2. Changing requirements3. Inadequate Specifications4. Unrealistic project estimates5. Poor project management6. Management change control7. Inexperienced personnel8. Expectations not properly set9. Subcontractor failure10.Poor architectural design
* Project Management Institute Matching items noted in RED
Above Items Can Cause Overall Program Cost and Schedule to Overrun
Above Items Can Cause Overall Program Cost and Schedule to Overrun
NDIA Systems Engineering EffectivenessNovember 15, 2007
27
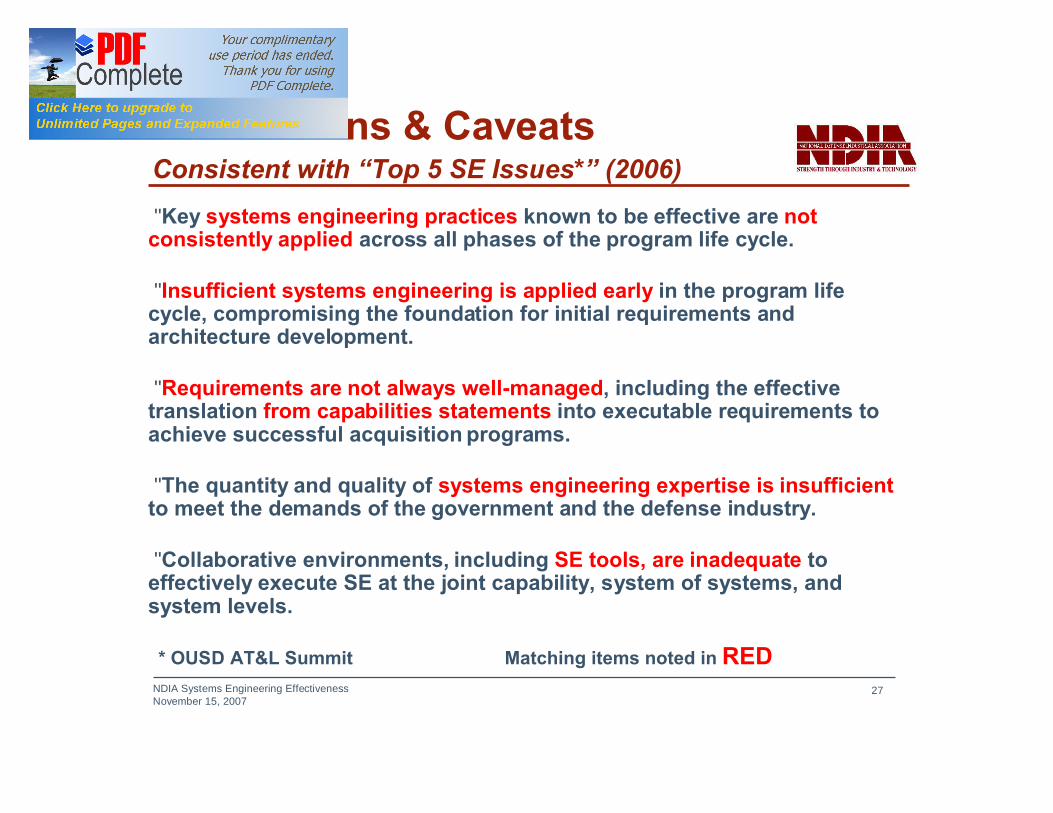
Conclusions & CaveatsConsistent with “Top 5 SE Issues*” (2006)• Key systems engineering practices known to be effective are not consistently applied across all phases of the program life cycle.
• Insufficient systems engineering is applied early in the program life cycle, compromising the foundation for initial requirements and architecture development.
• Requirements are not always well-managed, including the effective translation from capabilities statements into executable requirements to achieve successful acquisition programs.
• The quantity and quality of systems engineering expertise is insufficientto meet the demands of the government and the defense industry.
• Collaborative environments, including SE tools, are inadequate to effectively execute SE at the joint capability, system of systems, and system levels.
* OUSD AT&L Summit Matching items noted in RED
NDIA Systems Engineering EffectivenessNovember 15, 2007
28
Relative Project Performance
Min. Range
# Lo # Med
#Hi
Max. Range
Min. Range
# Lo # Med
#Hi
Max. Range
Min. Range
# Lo # Med
#Hi
Max. Range
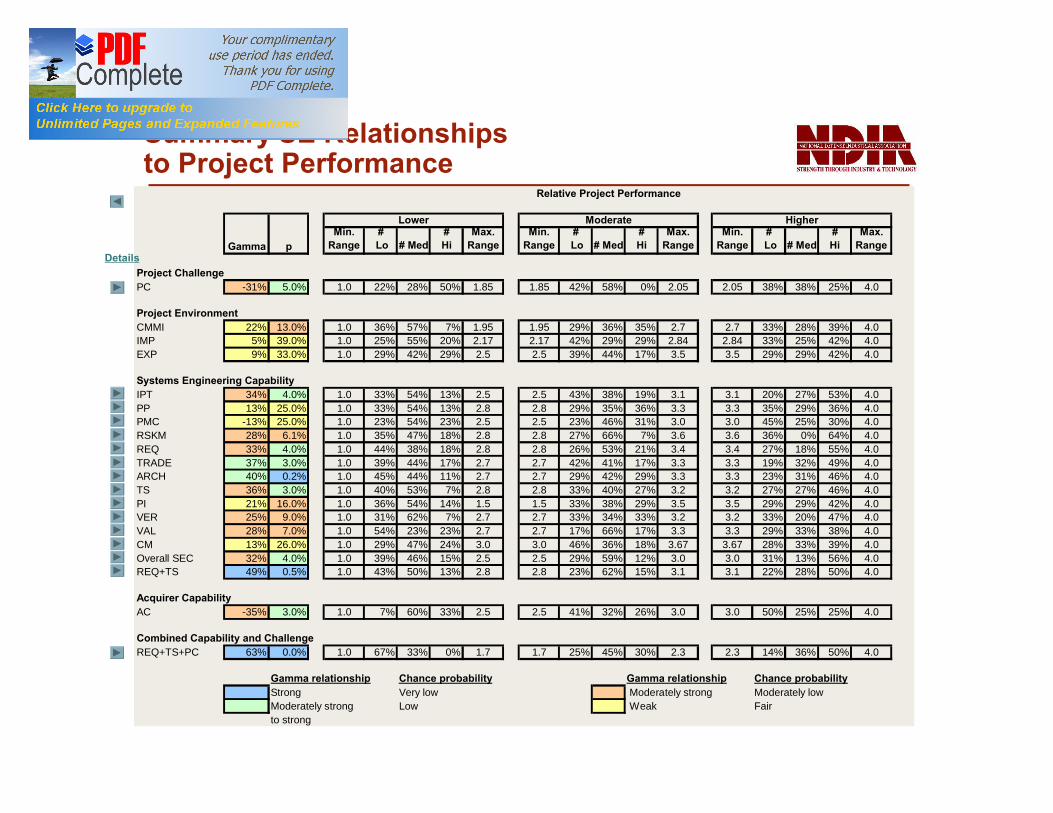
Project ChallengePC -31% 5.0% 1.0 22% 28% 50% 1.85 1.85 42% 58% 0% 2.05 2.05 38% 38% 25% 4.0
Project EnvironmentCMMI 22% 13.0% 1.0 36% 57% 7% 1.95 1.95 29% 36% 35% 2.7 2.7 33% 28% 39% 4.0IMP 5% 39.0% 1.0 25% 55% 20% 2.17 2.17 42% 29% 29% 2.84 2.84 33% 25% 42% 4.0EXP 9% 33.0% 1.0 29% 42% 29% 2.5 2.5 39% 44% 17% 3.5 3.5 29% 29% 42% 4.0
Systems Engineering CapabilityIPT 34% 4.0% 1.0 33% 54% 13% 2.5 2.5 43% 38% 19% 3.1 3.1 20% 27% 53% 4.0PP 13% 25.0% 1.0 33% 54% 13% 2.8 2.8 29% 35% 36% 3.3 3.3 35% 29% 36% 4.0PMC -13% 25.0% 1.0 23% 54% 23% 2.5 2.5 23% 46% 31% 3.0 3.0 45% 25% 30% 4.0RSKM 28% 6.1% 1.0 35% 47% 18% 2.8 2.8 27% 66% 7% 3.6 3.6 36% 0% 64% 4.0REQ 33% 4.0% 1.0 44% 38% 18% 2.8 2.8 26% 53% 21% 3.4 3.4 27% 18% 55% 4.0TRADE 37% 3.0% 1.0 39% 44% 17% 2.7 2.7 42% 41% 17% 3.3 3.3 19% 32% 49% 4.0ARCH 40% 0.2% 1.0 45% 44% 11% 2.7 2.7 29% 42% 29% 3.3 3.3 23% 31% 46% 4.0TS 36% 3.0% 1.0 40% 53% 7% 2.8 2.8 33% 40% 27% 3.2 3.2 27% 27% 46% 4.0PI 21% 16.0% 1.0 36% 54% 14% 1.5 1.5 33% 38% 29% 3.5 3.5 29% 29% 42% 4.0VER 25% 9.0% 1.0 31% 62% 7% 2.7 2.7 33% 34% 33% 3.2 3.2 33% 20% 47% 4.0VAL 28% 7.0% 1.0 54% 23% 23% 2.7 2.7 17% 66% 17% 3.3 3.3 29% 33% 38% 4.0CM 13% 26.0% 1.0 29% 47% 24% 3.0 3.0 46% 36% 18% 3.67 3.67 28% 33% 39% 4.0Overall SEC 32% 4.0% 1.0 39% 46% 15% 2.5 2.5 29% 59% 12% 3.0 3.0 31% 13% 56% 4.0REQ+TS 49% 0.5% 1.0 43% 50% 13% 2.8 2.8 23% 62% 15% 3.1 3.1 22% 28% 50% 4.0
Acquirer CapabilityAC -35% 3.0% 1.0 7% 60% 33% 2.5 2.5 41% 32% 26% 3.0 3.0 50% 25% 25% 4.0
Combined Capability and ChallengeREQ+TS+PC 63% 0.0% 1.0 67% 33% 0% 1.7 1.7 25% 45% 30% 2.3 2.3 14% 36% 50% 4.0
Gamma relationship Chance probability Gamma relationship Chance probabilityStrong Very low Moderately strong Moderately lowModerately strong Low Weak Fairto strong
Gamma p
Lower Moderate Higher
Summary SE Relationshipsto Project Performance
Details
NDIA Systems Engineering EffectivenessNovember 15, 2007
29
Relative Project Performance
Min. Range
# Lo # Med
#Hi
Max. Range
Min. Range
# Lo # Med
#Hi
Max. Range
Min. Range
# Lo # Med
#Hi
Max. Range
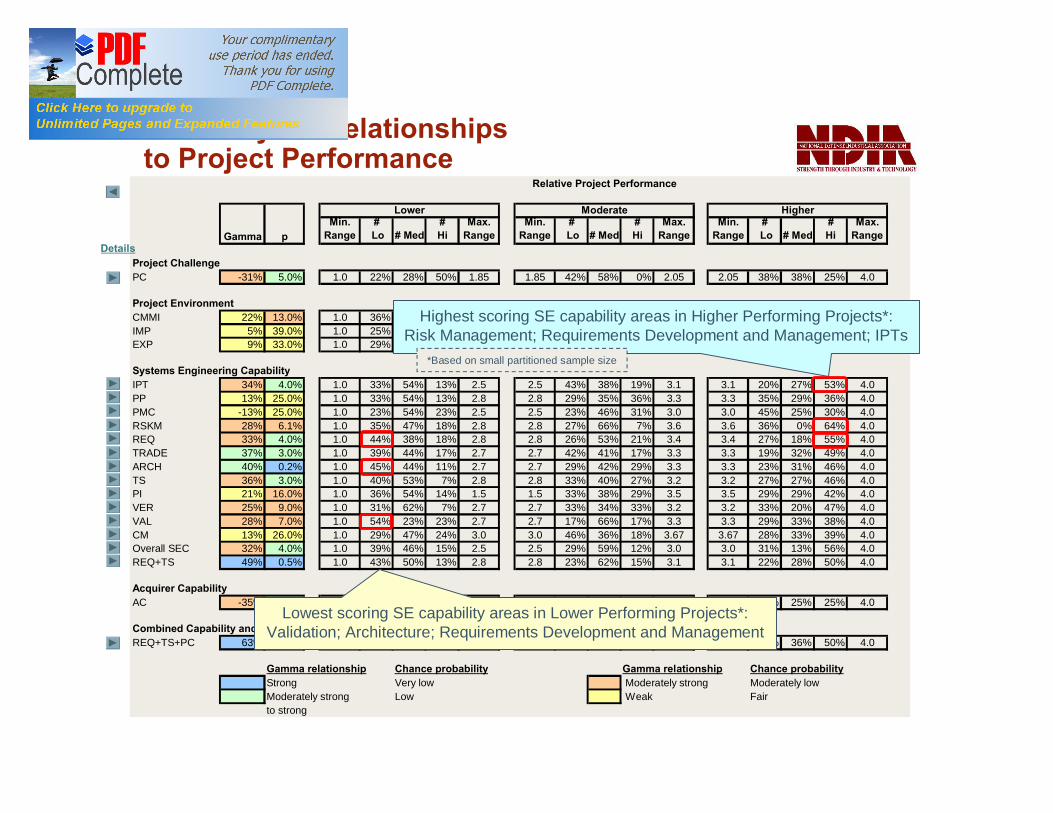
Project ChallengePC -31% 5.0% 1.0 22% 28% 50% 1.85 1.85 42% 58% 0% 2.05 2.05 38% 38% 25% 4.0
Project EnvironmentCMMI 22% 13.0% 1.0 36% 57% 7% 1.95 1.95 29% 36% 35% 2.7 2.7 33% 28% 39% 4.0IMP 5% 39.0% 1.0 25% 55% 20% 2.17 2.17 42% 29% 29% 2.84 2.84 33% 25% 42% 4.0EXP 9% 33.0% 1.0 29% 42% 29% 2.5 2.5 39% 44% 17% 3.5 3.5 29% 29% 42% 4.0
Systems Engineering CapabilityIPT 34% 4.0% 1.0 33% 54% 13% 2.5 2.5 43% 38% 19% 3.1 3.1 20% 27% 53% 4.0PP 13% 25.0% 1.0 33% 54% 13% 2.8 2.8 29% 35% 36% 3.3 3.3 35% 29% 36% 4.0PMC -13% 25.0% 1.0 23% 54% 23% 2.5 2.5 23% 46% 31% 3.0 3.0 45% 25% 30% 4.0RSKM 28% 6.1% 1.0 35% 47% 18% 2.8 2.8 27% 66% 7% 3.6 3.6 36% 0% 64% 4.0REQ 33% 4.0% 1.0 44% 38% 18% 2.8 2.8 26% 53% 21% 3.4 3.4 27% 18% 55% 4.0TRADE 37% 3.0% 1.0 39% 44% 17% 2.7 2.7 42% 41% 17% 3.3 3.3 19% 32% 49% 4.0ARCH 40% 0.2% 1.0 45% 44% 11% 2.7 2.7 29% 42% 29% 3.3 3.3 23% 31% 46% 4.0TS 36% 3.0% 1.0 40% 53% 7% 2.8 2.8 33% 40% 27% 3.2 3.2 27% 27% 46% 4.0PI 21% 16.0% 1.0 36% 54% 14% 1.5 1.5 33% 38% 29% 3.5 3.5 29% 29% 42% 4.0VER 25% 9.0% 1.0 31% 62% 7% 2.7 2.7 33% 34% 33% 3.2 3.2 33% 20% 47% 4.0VAL 28% 7.0% 1.0 54% 23% 23% 2.7 2.7 17% 66% 17% 3.3 3.3 29% 33% 38% 4.0CM 13% 26.0% 1.0 29% 47% 24% 3.0 3.0 46% 36% 18% 3.67 3.67 28% 33% 39% 4.0Overall SEC 32% 4.0% 1.0 39% 46% 15% 2.5 2.5 29% 59% 12% 3.0 3.0 31% 13% 56% 4.0REQ+TS 49% 0.5% 1.0 43% 50% 13% 2.8 2.8 23% 62% 15% 3.1 3.1 22% 28% 50% 4.0
Acquirer CapabilityAC -35% 3.0% 1.0 7% 60% 33% 2.5 2.5 41% 32% 26% 3.0 3.0 50% 25% 25% 4.0
Combined Capability and ChallengeREQ+TS+PC 63% 0.0% 1.0 67% 33% 0% 1.7 1.7 25% 45% 30% 2.3 2.3 14% 36% 50% 4.0
Gamma relationship Chance probability Gamma relationship Chance probabilityStrong Very low Moderately strong Moderately lowModerately strong Low Weak Fairto strong
Gamma p
Lower Moderate Higher
Summary SE Relationshipsto Project Performance
Details
Lowest scoring SE capability areas in Lower Performing Projects*:Validation; Architecture; Requirements Development and Management
Highest scoring SE capability areas in Higher Performing Projects*:Risk Management; Requirements Development and Management; IPTs
*Based on small partitioned sample size
NDIA Systems Engineering EffectivenessNovember 15, 2007
30
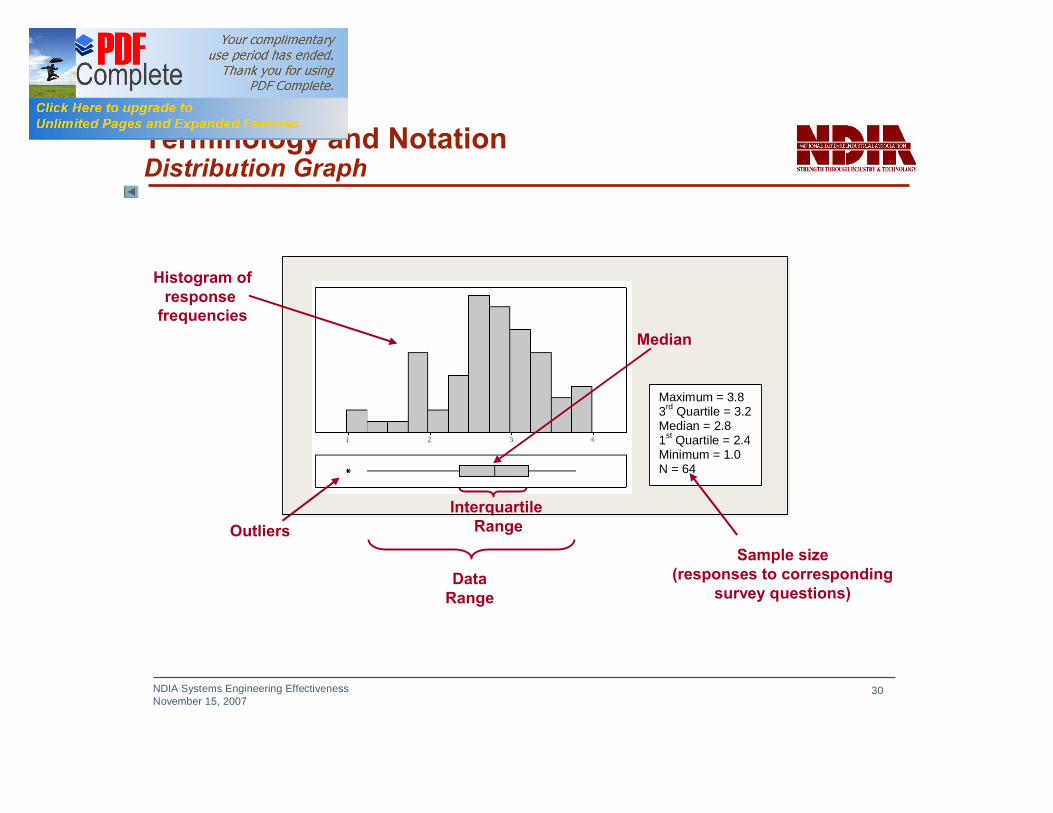
Terminology and NotationDistribution Graph
Maximum = 3.8 3rd Quartile = 3.2 Median = 2.8 1st Quartile = 2.4 Minimum = 1.0 N = 64
Outliers
Median
Histogram ofresponse
frequencies
Interquartile Range
DataRange
Sample size (responses to corresponding
survey questions)
NDIA Systems Engineering EffectivenessNovember 15, 2007
31
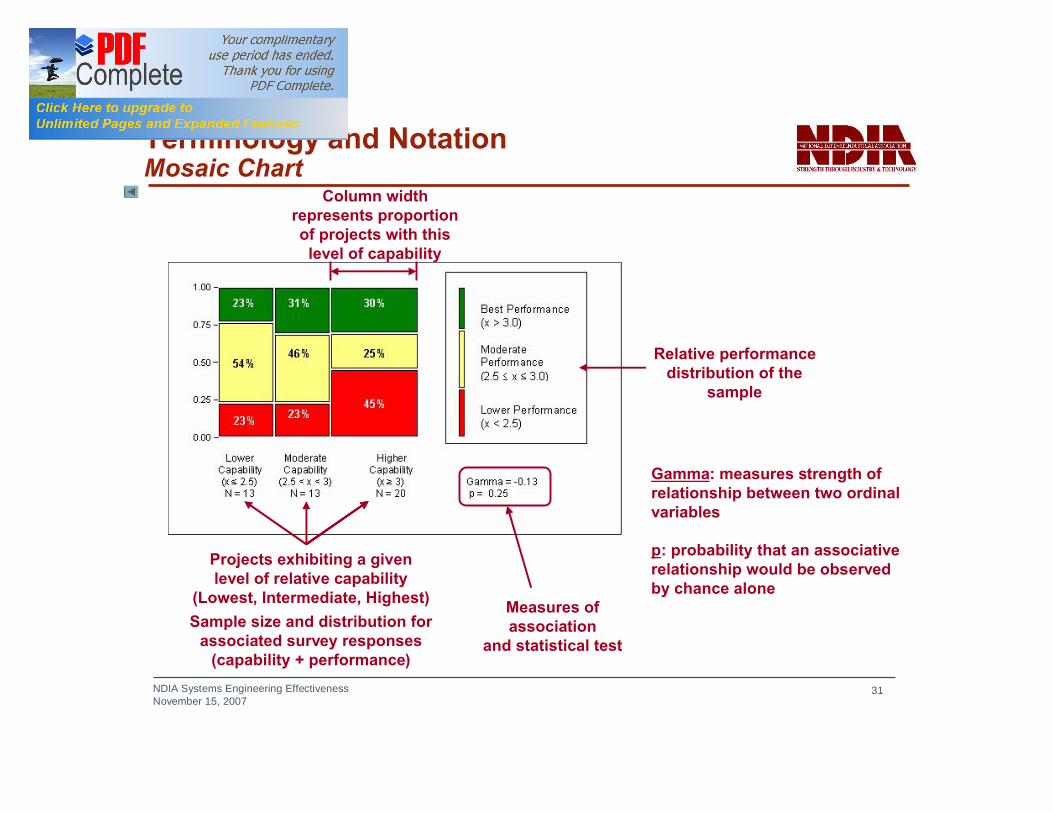
Terminology and NotationMosaic Chart
Projects exhibiting a given level of relative capability
(Lowest, Intermediate, Highest)Sample size and distribution for
associated survey responses (capability + performance)
Relative performance distribution of the
sample
Column width represents proportion of projects with this
level of capability
Measures of association
and statistical test
Gamma: measures strength of relationship between two ordinal variables
p: probability that an associative relationship would be observed by chance alone
NDIA Systems Engineering EffectivenessNovember 15, 2007
32
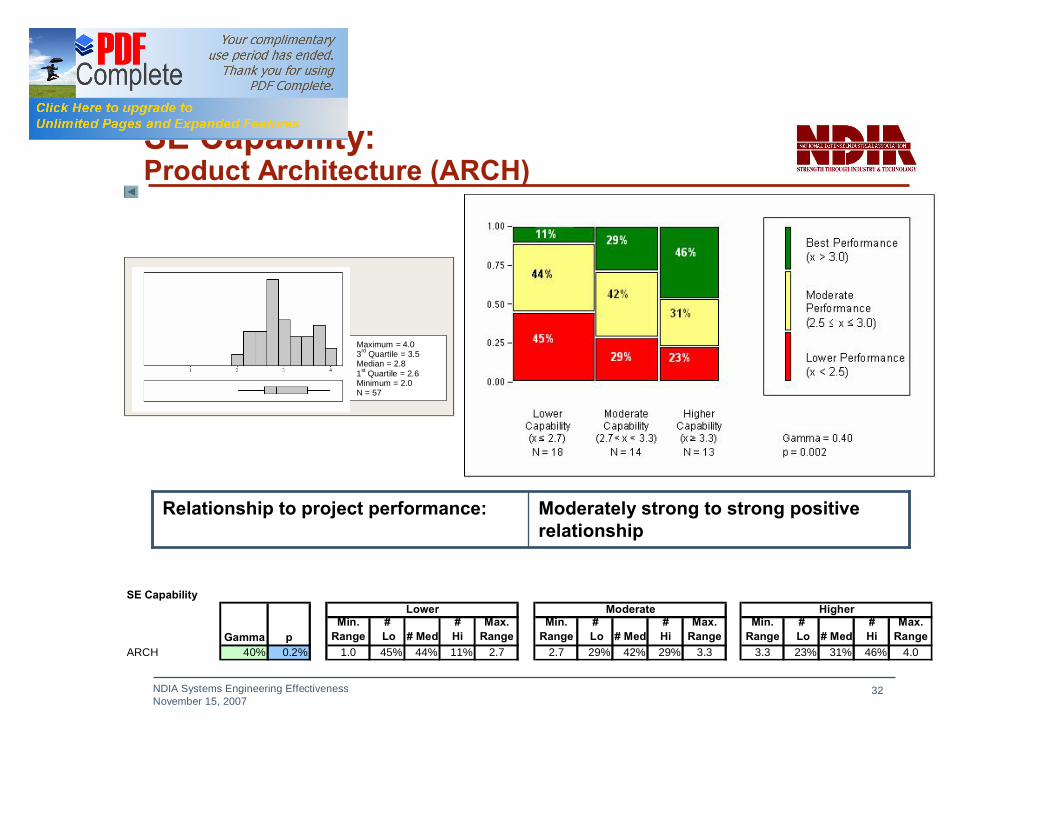
SE Capability: Product Architecture (ARCH)
Moderately strong to strong positive relationship
Relationship to project performance:
Maximum = 4.0 3rd Quartile = 3.5 Median = 2.8 1st Quartile = 2.6 Minimum = 2.0 N = 57
SE Capability
Min. Range
# Lo # Med
#Hi
Max. Range
Min. Range
# Lo # Med
#Hi
Max. Range
Min. Range
# Lo # Med
#Hi
Max. Range
ARCH 40% 0.2% 1.0 45% 44% 11% 2.7 2.7 29% 42% 29% 3.3 3.3 23% 31% 46% 4.0
Higher
Gamma p
Lower Moderate

NDIA Systems Engineering EffectivenessNovember 15, 2007
33
SE Capability: Product Architecture (ARCH)
Survey Questions
•strongly disagree•disagree•agree•strongly agree
This project has defined and documented guidelines for choosing COTS product components
IF04
•strongly disagree•disagree•agree•strongly agree
For this project, the product high-level structure is accessible to all relevant project personnel
IF03c
•strongly disagree•disagree•agree•strongly agree
For this project, the product high-level structure is documented using multiple views (e.g. functional views, module views, etc.
IF03b
•strongly disagree•disagree•agree•strongly agree
For this project, the product high-level structure is documented, kept up to date, and managed under configuration control
IF03a
•strongly disagree•disagree•agree•strongly agree
Interface definition descriptions are maintained in a designated location, under configuration management, and accessible to all who need them
IF02
•strongly disagree•disagree•agree•strongly agree
This project maintains accurate and up-to-date descriptions (e.g. interface control documents, models, etc.) defining interfaces in detail
IF01
Response rangeQuestionID
NDIA Systems Engineering EffectivenessNovember 15, 2007
34
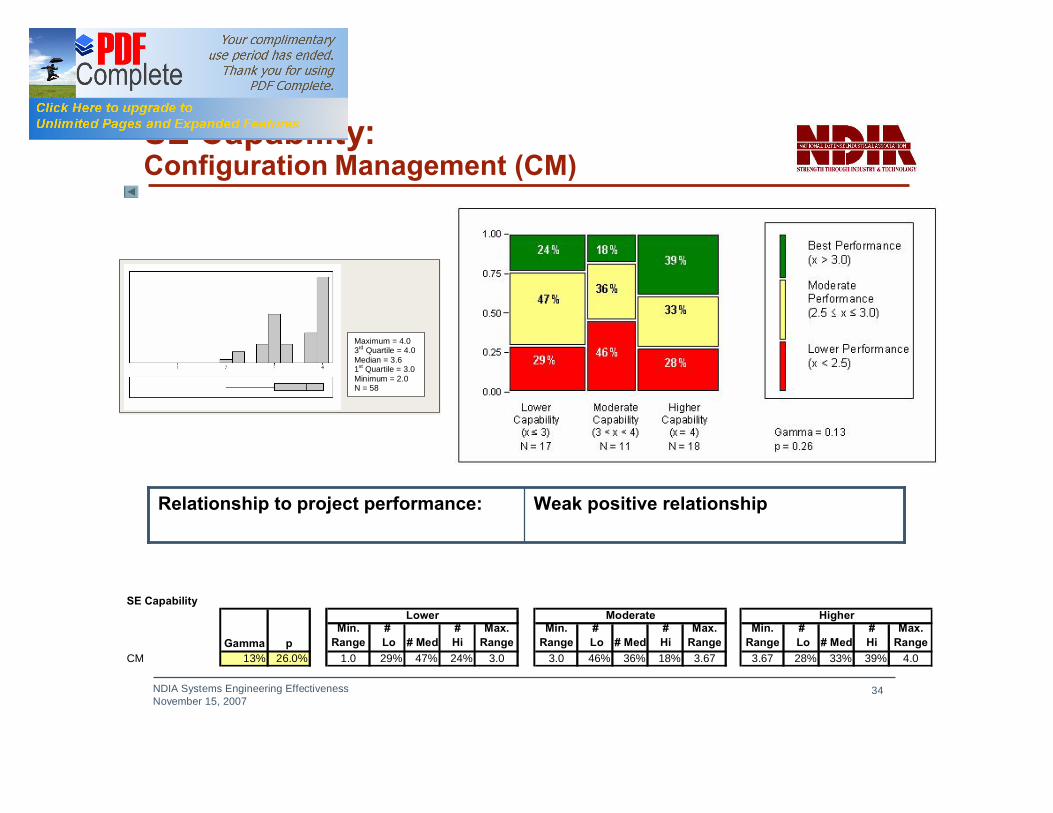
SE Capability: Configuration Management (CM)
Weak positive relationshipRelationship to project performance:
Maximum = 4.0 3rd Quartile = 4.0 Median = 3.6 1st Quartile = 3.0 Minimum = 2.0 N = 58
SE Capability
Min. Range
# Lo # Med
#Hi
Max. Range
Min. Range
# Lo # Med
#Hi
Max. Range
Min. Range
# Lo # Med
#Hi
Max. Range
CM 13% 26.0% 1.0 29% 47% 24% 3.0 3.0 46% 36% 18% 3.67 3.67 28% 33% 39% 4.0
Higher
Gamma p
Lower Moderate
NDIA Systems Engineering EffectivenessNovember 15, 2007
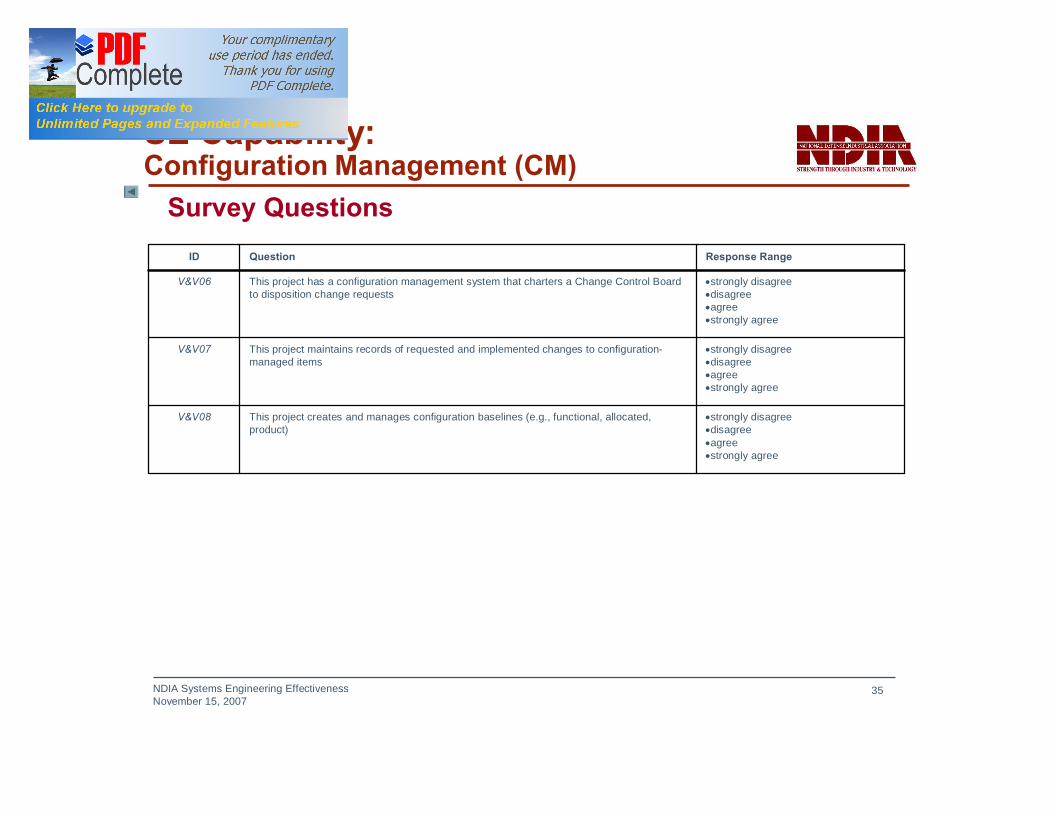
35
SE Capability: Configuration Management (CM)
Survey Questions
•strongly disagree•disagree•agree•strongly agree
This project creates and manages configuration baselines (e.g., functional, allocated, product)
V&V08
•strongly disagree•disagree•agree•strongly agree
This project maintains records of requested and implemented changes to configuration-managed items
V&V07
•strongly disagree•disagree•agree•strongly agree
This project has a configuration management system that charters a Change Control Board to disposition change requests
V&V06
Response RangeQuestionID
NDIA Systems Engineering EffectivenessNovember 15, 2007
36
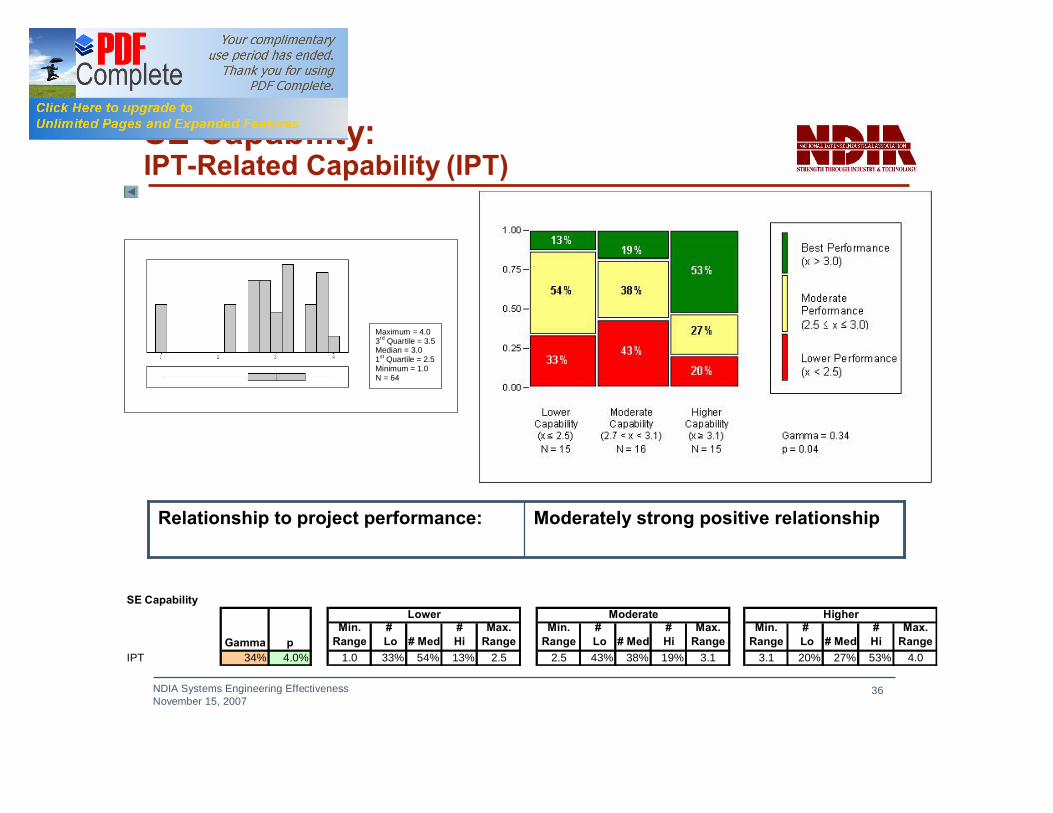
SE Capability: IPT-Related Capability (IPT)
Moderately strong positive relationshipRelationship to project performance:
Maximum = 4.0 3rd Quartile = 3.5 Median = 3.0 1st Quartile = 2.5 Minimum = 1.0 N = 64
SE Capability
Min. Range
# Lo # Med
#Hi
Max. Range
Min. Range
# Lo # Med
#Hi
Max. Range
Min. Range
# Lo # Med
#Hi
Max. Range
IPT 34% 4.0% 1.0 33% 54% 13% 2.5 2.5 43% 38% 19% 3.1 3.1 20% 27% 53% 4.0
Higher
Gamma p
Lower Moderate
NDIA Systems Engineering EffectivenessNovember 15, 2007
37
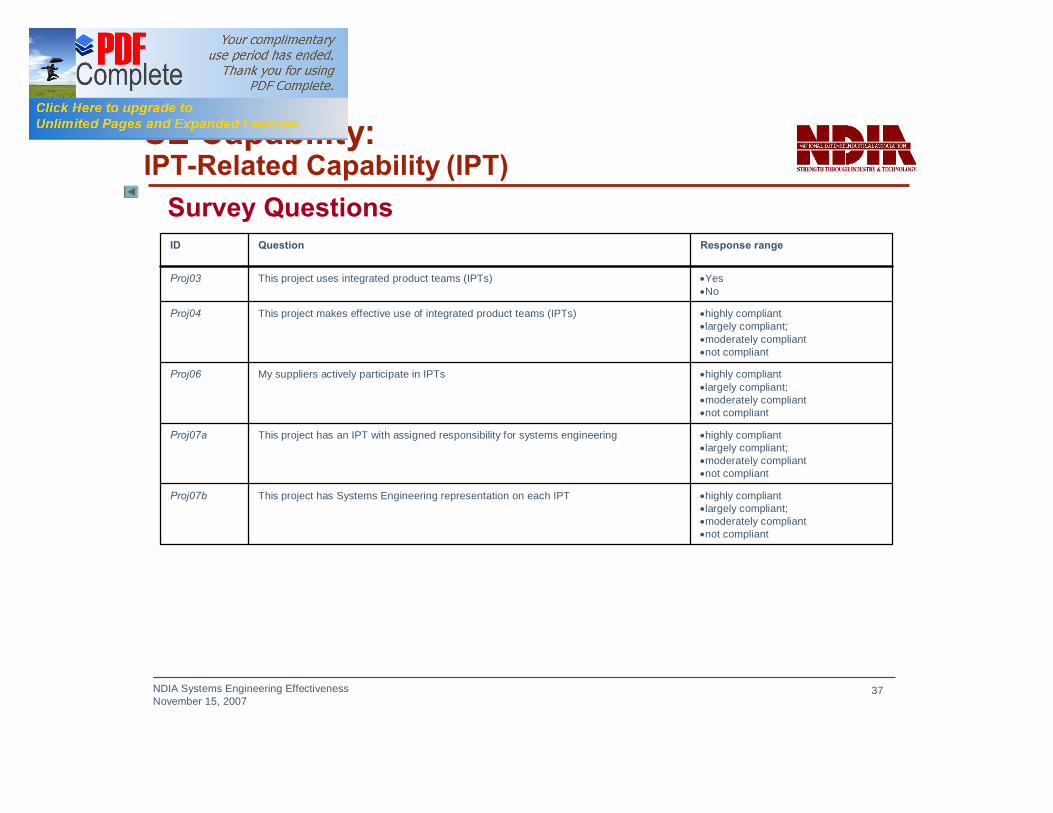
SE Capability: IPT-Related Capability (IPT)
•highly compliant•largely compliant;•moderately compliant•not compliant
This project has Systems Engineering representation on each IPTProj07b
•highly compliant•largely compliant;•moderately compliant•not compliant
This project has an IPT with assigned responsibility for systems engineeringProj07a
•highly compliant•largely compliant;•moderately compliant•not compliant
My suppliers actively participate in IPTsProj06
•highly compliant•largely compliant;•moderately compliant•not compliant
This project makes effective use of integrated product teams (IPTs)Proj04
•Yes•No
This project uses integrated product teams (IPTs)Proj03
Response rangeQuestionID
Survey Questions
NDIA Systems Engineering EffectivenessNovember 15, 2007
38
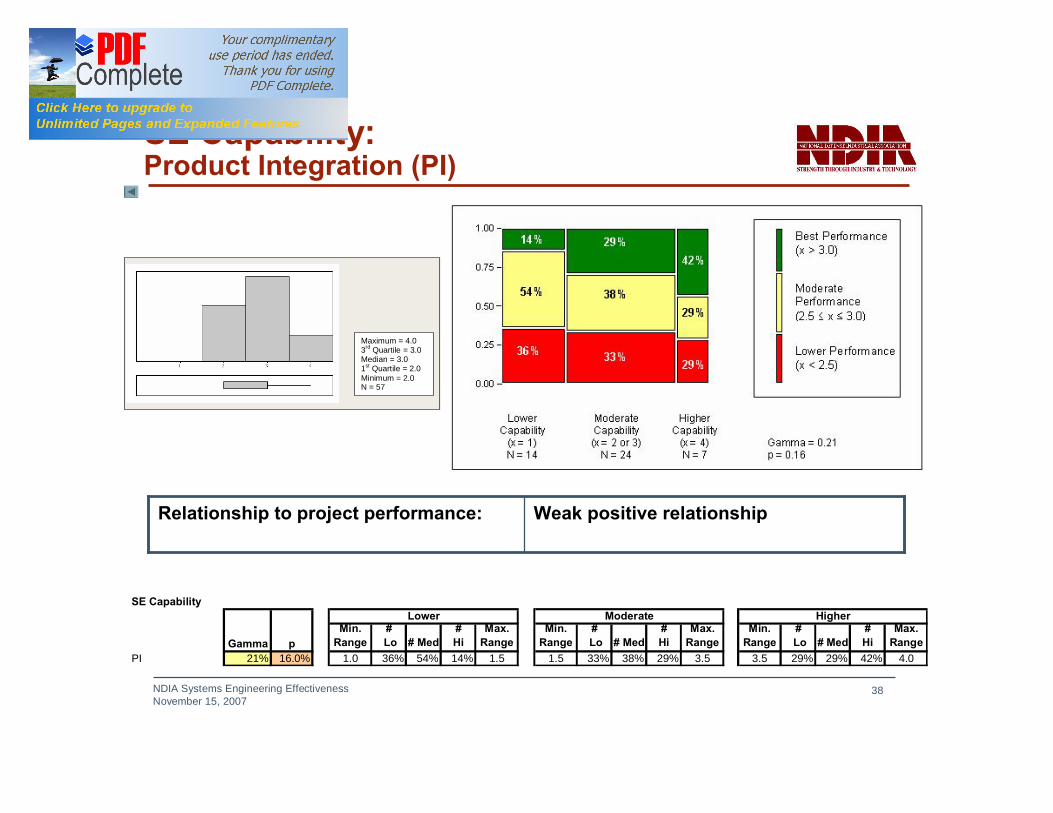
SE Capability: Product Integration (PI)
Weak positive relationshipRelationship to project performance:
Maximum = 4.0 3rd Quartile = 3.0 Median = 3.0 1st Quartile = 2.0 Minimum = 2.0 N = 57
SE Capability
Min. Range
# Lo # Med
#Hi
Max. Range
Min. Range
# Lo # Med
#Hi
Max. Range
Min. Range
# Lo # Med
#Hi
Max. Range
PI 21% 16.0% 1.0 36% 54% 14% 1.5 1.5 33% 38% 29% 3.5 3.5 29% 29% 42% 4.0
Higher
Gamma p
Lower Moderate
NDIA Systems Engineering EffectivenessNovember 15, 2007
39
SE Capability: Product Integration (PI)
Survey Question
•strongly disagree•disagree•agree•strongly agree
This project has accurate and up-to-date documents defining its product integration process, plans, criteria, etc. throughout the life cycle
IF05
Response rangeQuestionID
NDIA Systems Engineering EffectivenessNovember 15, 2007
40
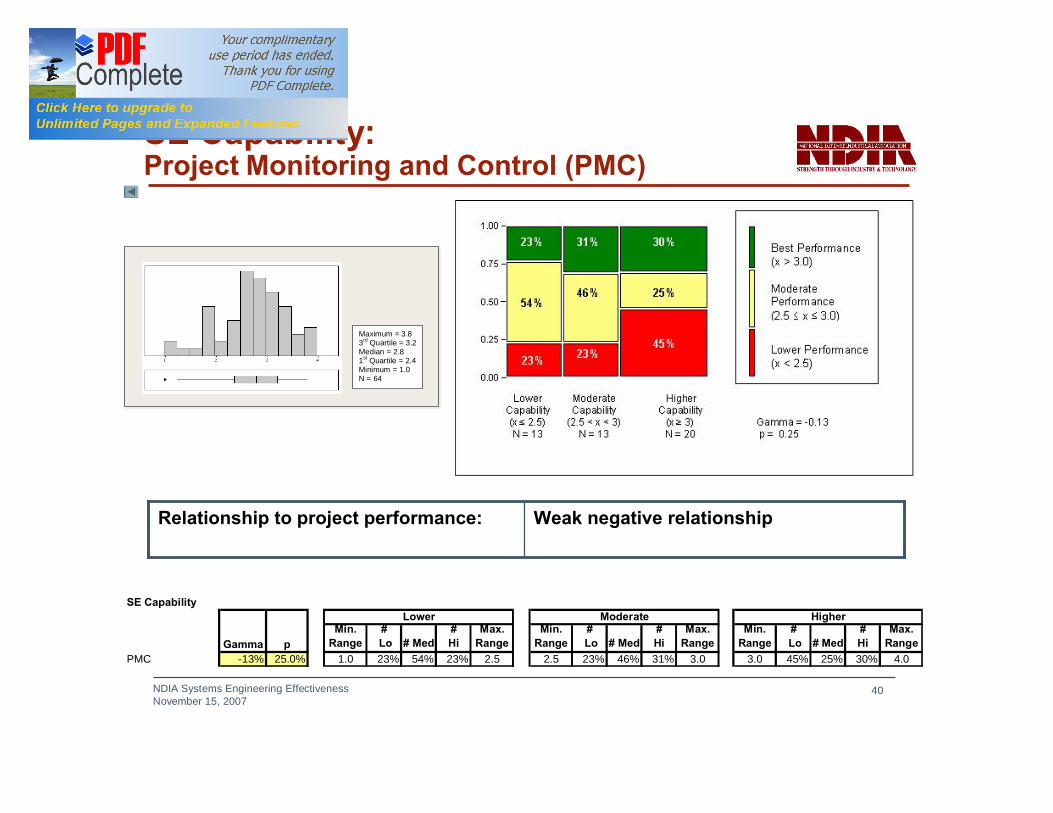
SE Capability: Project Monitoring and Control (PMC)
Weak negative relationshipRelationship to project performance:
Maximum = 3.8 3rd Quartile = 3.2 Median = 2.8 1st Quartile = 2.4 Minimum = 1.0 N = 64
SE Capability
Min. Range
# Lo # Med
#Hi
Max. Range
Min. Range
# Lo # Med
#Hi
Max. Range
Min. Range
# Lo # Med
#Hi
Max. Range
PMC -13% 25.0% 1.0 23% 54% 23% 2.5 2.5 23% 46% 31% 3.0 3.0 45% 25% 30% 4.0
Higher
Gamma p
Lower Moderate
NDIA Systems Engineering EffectivenessNovember 15, 2007
41
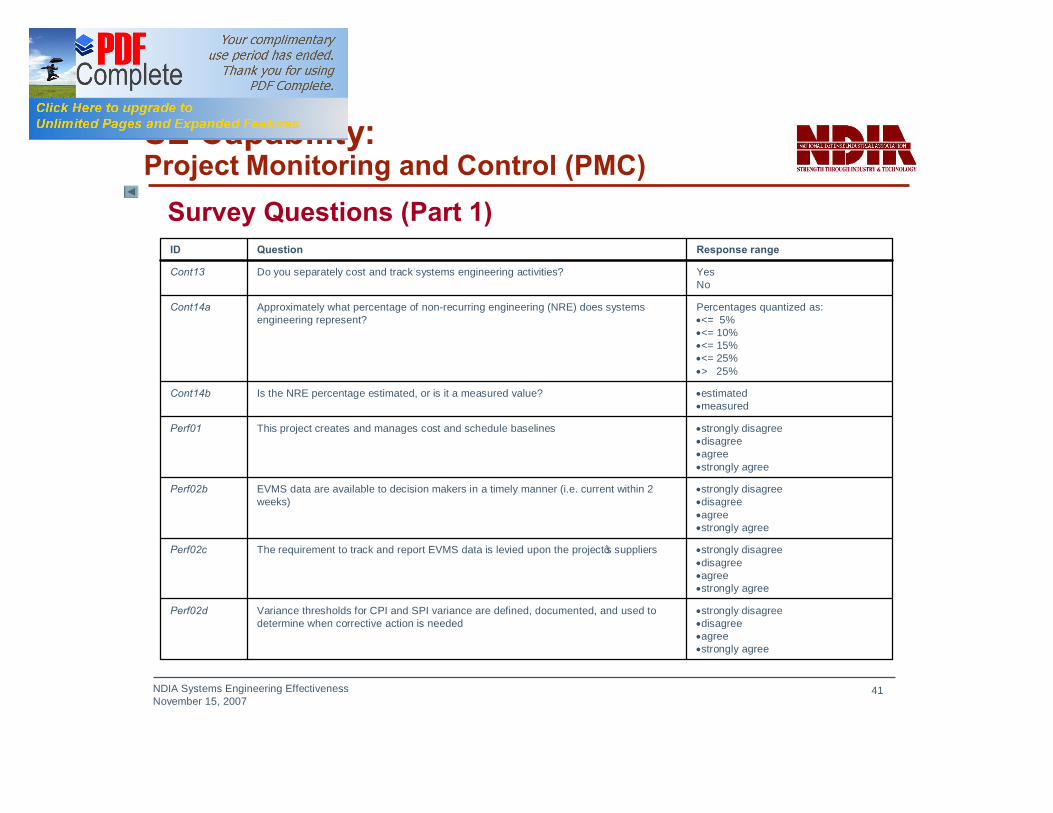
SE Capability: Project Monitoring and Control (PMC)
Survey Questions (Part 1)
•strongly disagree•disagree•agree•strongly agree
Variance thresholds for CPI and SPI variance are defined, documented, and used to determine when corrective action is needed
Perf02d
•strongly disagree•disagree•agree•strongly agree
The requirement to track and report EVMS data is levied upon the project’s suppliersPerf02c
•strongly disagree•disagree•agree•strongly agree
EVMS data are available to decision makers in a timely manner (i.e. current within 2 weeks)
Perf02b
•strongly disagree•disagree•agree•strongly agree
This project creates and manages cost and schedule baselinesPerf01
•estimated•measured
Is the NRE percentage estimated, or is it a measured value?Cont14b
Percentages quantized as:•<= 5%•<= 10%•<= 15%•<= 25%•> 25%
Approximately what percentage of non-recurring engineering (NRE) does systems engineering represent?
Cont14a
YesNo
Do you separately cost and track systems engineering activities?Cont13
Response rangeQuestionID
NDIA Systems Engineering EffectivenessNovember 15, 2007
42
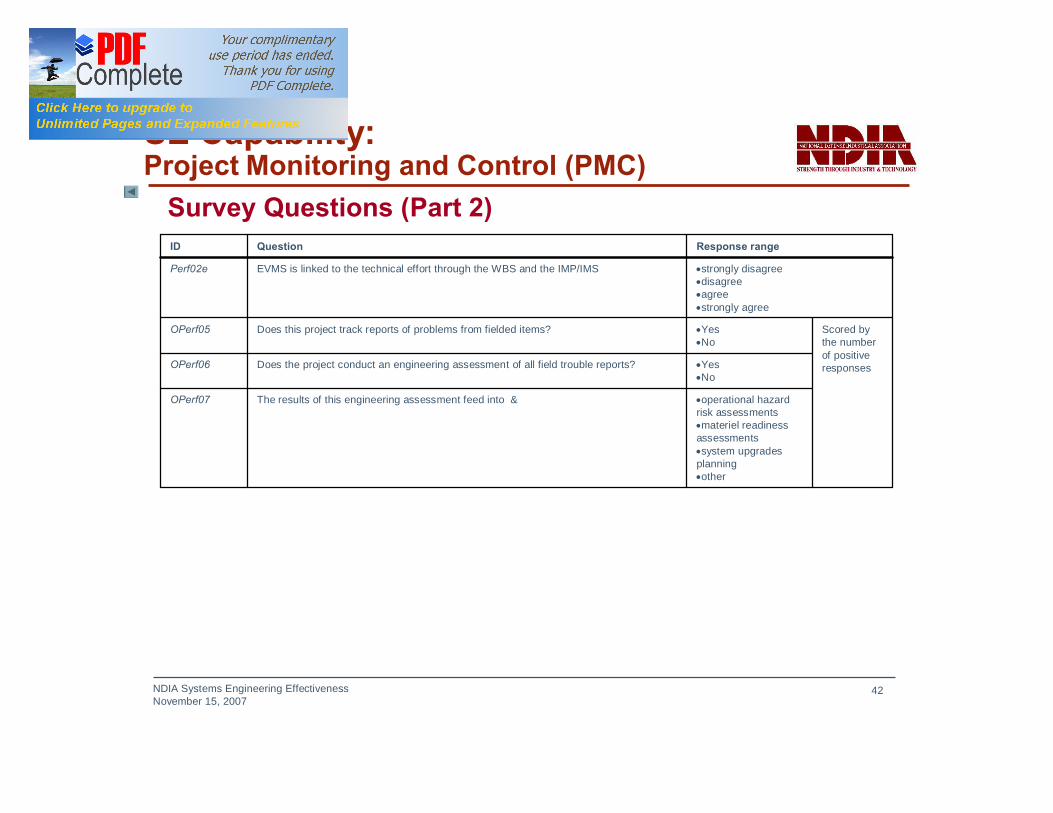
SE Capability: Project Monitoring and Control (PMC)
Survey Questions (Part 2)
•operational hazard risk assessments•materiel readiness assessments •system upgrades planning•other
The results of this engineering assessment feed into …OPerf07
•Yes•No
Does the project conduct an engineering assessment of all field trouble reports?OPerf06
Scored by the number of positive responses
•Yes•No
Does this project track reports of problems from fielded items?OPerf05
•strongly disagree•disagree•agree•strongly agree
EVMS is linked to the technical effort through the WBS and the IMP/IMSPerf02e
Response rangeQuestionID

NDIA Systems Engineering EffectivenessNovember 15, 2007
43
SE Capability: Project Planning (PP)
Weak positive relationshipRelationship to project performance:
Maximum = 4.0 3rd Quartile = 3.4 Median = 3.0 1st Quartile = 2.6 Minimum = 2.0 N = 63
SE Capability
Min. Range
# Lo # Med
#Hi
Max. Range
Min. Range
# Lo # Med
#Hi
Max. Range
Min. Range
# Lo # Med
#Hi
Max. Range
PP 13% 25.0% 1.0 33% 54% 13% 2.8 2.8 29% 35% 36% 3.3 3.3 35% 29% 36% 4.0
Higher
Gamma p
Lower Moderate
NDIA Systems Engineering EffectivenessNovember 15, 2007
44
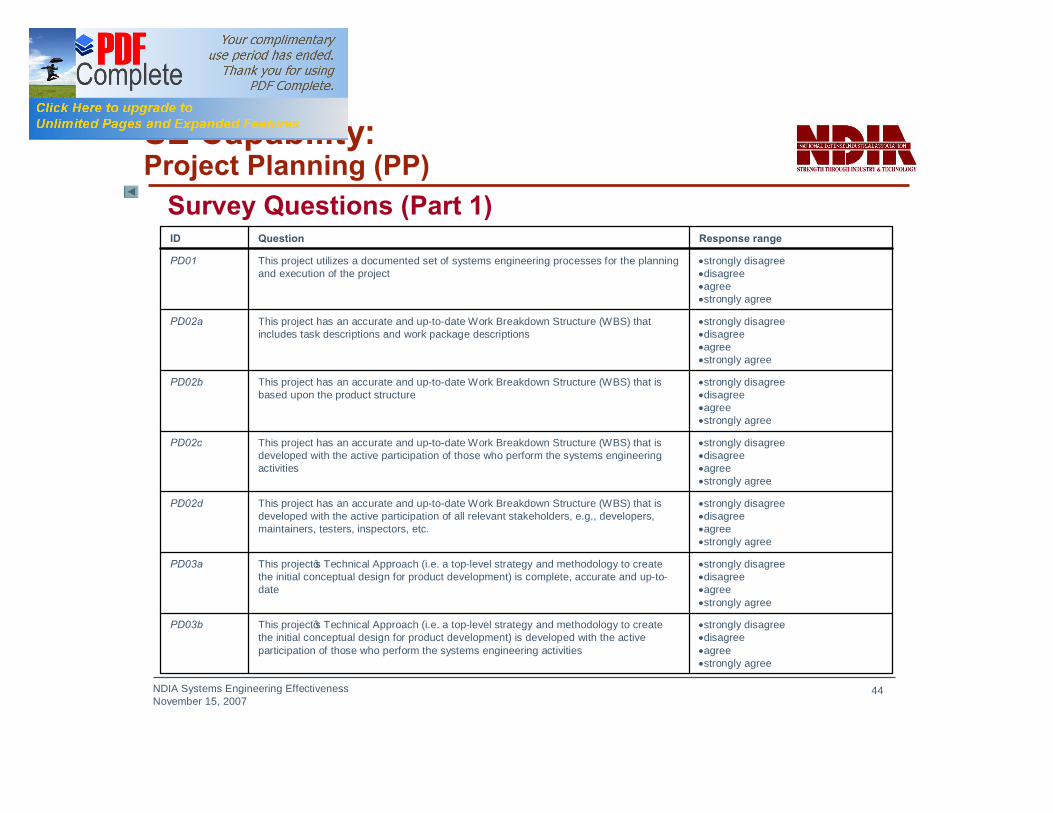
SE Capability: Project Planning (PP)
Survey Questions (Part 1)
•strongly disagree•disagree•agree•strongly agree
This project’s Technical Approach (i.e. a top-level strategy and methodology to create the initial conceptual design for product development) is developed with the active participation of those who perform the systems engineering activities
PD03b
•strongly disagree•disagree•agree•strongly agree
This project’s Technical Approach (i.e. a top-level strategy and methodology to create the initial conceptual design for product development) is complete, accurate and up-to-date
PD03a
•strongly disagree•disagree•agree•strongly agree
This project has an accurate and up-to-date Work Breakdown Structure (WBS) that is developed with the active participation of all relevant stakeholders, e.g., developers, maintainers, testers, inspectors, etc.
PD02d
•strongly disagree•disagree•agree•strongly agree
This project has an accurate and up-to-date Work Breakdown Structure (WBS) that is developed with the active participation of those who perform the systems engineering activities
PD02c
•strongly disagree•disagree•agree•strongly agree
This project has an accurate and up-to-date Work Breakdown Structure (WBS) that is based upon the product structure
PD02b
•strongly disagree•disagree•agree•strongly agree
This project has an accurate and up-to-date Work Breakdown Structure (WBS) that includes task descriptions and work package descriptions
PD02a
•strongly disagree•disagree•agree•strongly agree
This project utilizes a documented set of systems engineering processes for the planning and execution of the project
PD01
Response rangeQuestionID
NDIA Systems Engineering EffectivenessNovember 15, 2007
45
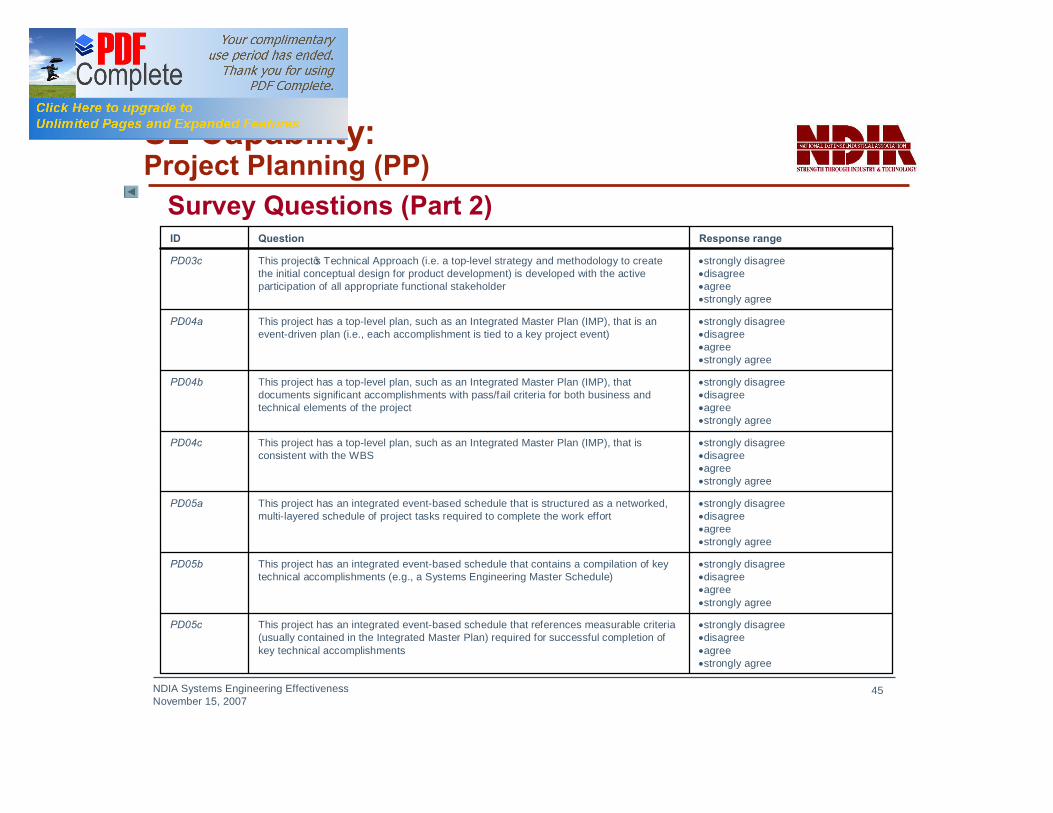
SE Capability: Project Planning (PP)
Survey Questions (Part 2)
•strongly disagree•disagree•agree•strongly agree
This project’s Technical Approach (i.e. a top-level strategy and methodology to create the initial conceptual design for product development) is developed with the active participation of all appropriate functional stakeholder
PD03c
•strongly disagree•disagree•agree•strongly agree
This project has an integrated event-based schedule that references measurable criteria (usually contained in the Integrated Master Plan) required for successful completion of key technical accomplishments
PD05c
•strongly disagree•disagree•agree•strongly agree
This project has an integrated event-based schedule that contains a compilation of key technical accomplishments (e.g., a Systems Engineering Master Schedule)
PD05b
•strongly disagree•disagree•agree•strongly agree
This project has an integrated event-based schedule that is structured as a networked, multi-layered schedule of project tasks required to complete the work effort
PD05a
•strongly disagree•disagree•agree•strongly agree
This project has a top-level plan, such as an Integrated Master Plan (IMP), that is consistent with the WBS
PD04c
•strongly disagree•disagree•agree•strongly agree
This project has a top-level plan, such as an Integrated Master Plan (IMP), that documents significant accomplishments with pass/fail criteria for both business and technical elements of the project
PD04b
•strongly disagree•disagree•agree•strongly agree
This project has a top-level plan, such as an Integrated Master Plan (IMP), that is an event-driven plan (i.e., each accomplishment is tied to a key project event)
PD04a
Response rangeQuestionID
NDIA Systems Engineering EffectivenessNovember 15, 2007
46
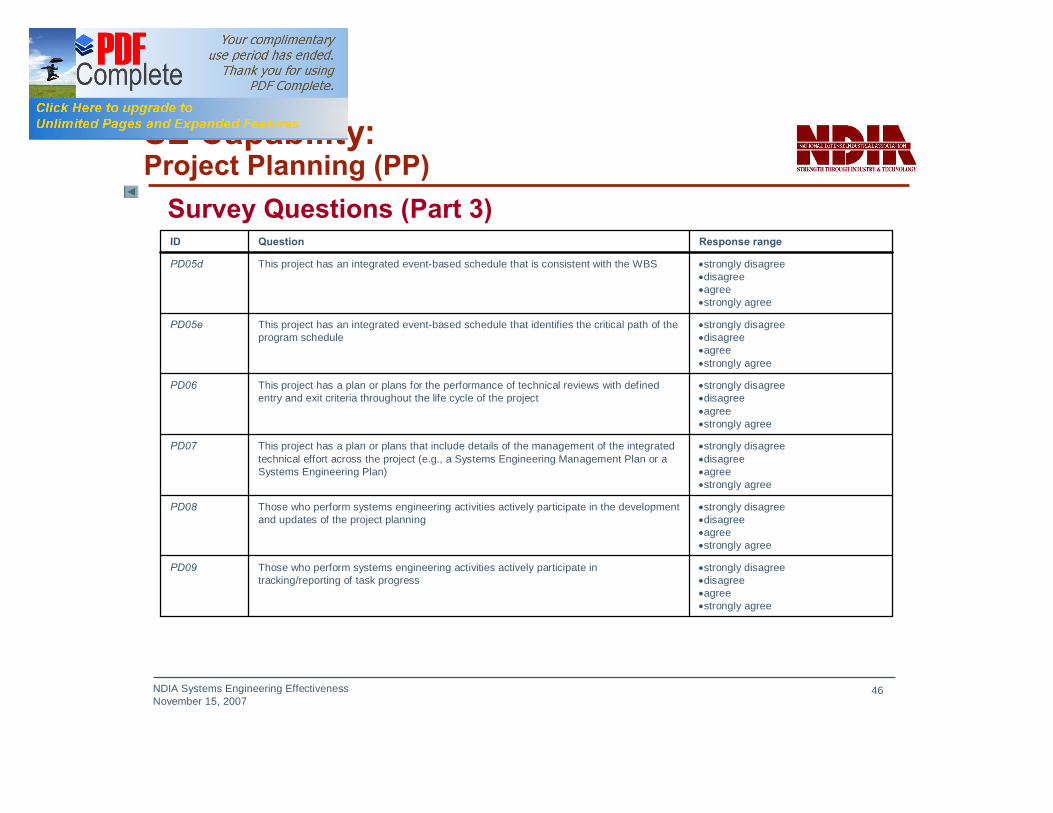
SE Capability: Project Planning (PP)
Survey Questions (Part 3)
•strongly disagree•disagree•agree•strongly agree
This project has an integrated event-based schedule that is consistent with the WBSPD05d
•strongly disagree•disagree•agree•strongly agree
Those who perform systems engineering activities actively participate in tracking/reporting of task progress
PD09
•strongly disagree•disagree•agree•strongly agree
Those who perform systems engineering activities actively participate in the development and updates of the project planning
PD08
•strongly disagree•disagree•agree•strongly agree
This project has a plan or plans that include details of the management of the integrated technical effort across the project (e.g., a Systems Engineering Management Plan or a Systems Engineering Plan)
PD07
•strongly disagree•disagree•agree•strongly agree
This project has a plan or plans for the performance of technical reviews with defined entry and exit criteria throughout the life cycle of the project
PD06
•strongly disagree•disagree•agree•strongly agree
This project has an integrated event-based schedule that identifies the critical path of the program schedule
PD05e
Response rangeQuestionID
NDIA Systems Engineering EffectivenessNovember 15, 2007
47
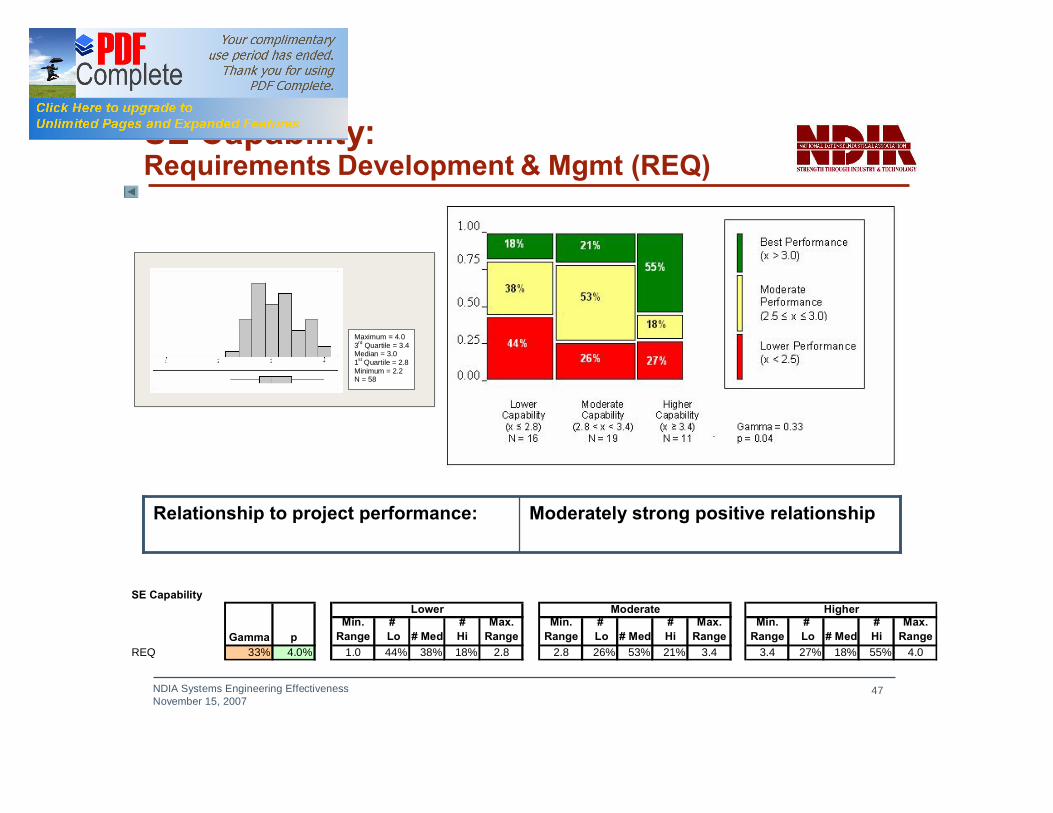
SE Capability: Requirements Development & Mgmt (REQ)
Moderately strong positive relationshipRelationship to project performance:
Maximum = 4.0 3rd Quartile = 3.4 Median = 3.0 1st Quartile = 2.8 Minimum = 2.2 N = 58
SE Capability
Min. Range
# Lo # Med
#Hi
Max. Range
Min. Range
# Lo # Med
#Hi
Max. Range
Min. Range
# Lo # Med
#Hi
Max. Range
REQ 33% 4.0% 1.0 44% 38% 18% 2.8 2.8 26% 53% 21% 3.4 3.4 27% 18% 55% 4.0
Higher
Gamma p
Lower Moderate

NDIA Systems Engineering EffectivenessNovember 15, 2007
48
SE Capability: Requirements Development & Mgmt (REQ)
Survey Questions (Part 1)
•strongly disagree•disagree•agree•strongly agree
This project has documented criteria for identifying authorized requirements providers to avoid requirements creep and volatility
RD04
•strongly disagree•disagree•agree•strongly agree
This project documents and maintains accurate and up-to-date descriptions of product installation, maintenance and support concepts
RD03c
•strongly disagree•disagree•agree•strongly agree
This project documents and maintains accurate and up-to-date descriptions of use cases (or their equivalent)
RD03b
•strongly disagree•disagree•agree•strongly agree
This project documents and maintains accurate and up-to-date descriptions of operational concepts and their associated scenarios
RD03a
•strongly disagree•disagree•agree•strongly agree
This project maintains up-to-date and accurate documentation clearly reflecting the hierarchical allocation of both customer and derived requirements to each element (subsystem, component, etc.) of the system in the configuration baselines
RD02
•strongly disagree•disagree•agree•strongly agree
This project maintains an up-to-date and accurate listing of all requirements derived from those specified by the customer
RD01b
•strongly disagree•disagree•agree•strongly agree
This project maintains an up-to-date and accurate listing of all requirements specified by the customer, to include regulatory, statutory, and certification requirements
RD01a
Response rangeQuestionID
NDIA Systems Engineering EffectivenessNovember 15, 2007
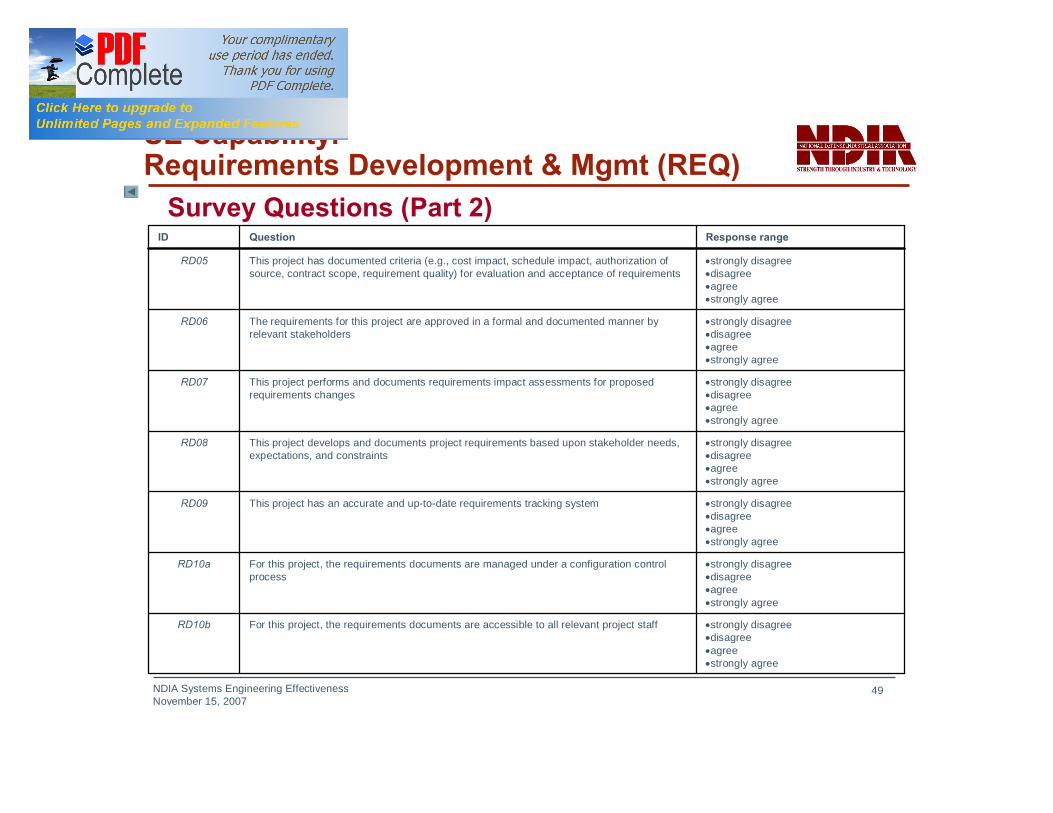
49
SE Capability: Requirements Development & Mgmt (REQ)
•strongly disagree•disagree•agree•strongly agree
For this project, the requirements documents are accessible to all relevant project staffRD10b
•strongly disagree•disagree•agree•strongly agree
For this project, the requirements documents are managed under a configuration control process
RD10a
•strongly disagree•disagree•agree•strongly agree
This project has an accurate and up-to-date requirements tracking systemRD09
•strongly disagree•disagree•agree•strongly agree
This project develops and documents project requirements based upon stakeholder needs, expectations, and constraints
RD08
•strongly disagree•disagree•agree•strongly agree
This project performs and documents requirements impact assessments for proposed requirements changes
RD07
•strongly disagree•disagree•agree•strongly agree
The requirements for this project are approved in a formal and documented manner by relevant stakeholders
RD06
•strongly disagree•disagree•agree•strongly agree
This project has documented criteria (e.g., cost impact, schedule impact, authorization of source, contract scope, requirement quality) for evaluation and acceptance of requirements
RD05
Response rangeQuestionID
Survey Questions (Part 2)

NDIA Systems Engineering EffectivenessNovember 15, 2007
50
SE Capability: Risk Management (RSKM)
Moderately strong positive relationshipRelationship to project performance:
Maximum = 4.0 3rd Quartile = 3.4 Median = 3.0 1st Quartile = 2.8 Minimum = 2.2 N = 58
SE Capability
Min. Range
# Lo # Med
#Hi
Max. Range
Min. Range
# Lo # Med
#Hi
Max. Range
Min. Range
# Lo # Med
#Hi
Max. Range
RSKM 28% 6.1% 1.0 35% 47% 18% 2.8 2.8 27% 66% 7% 3.6 3.6 36% 0% 64% 4.0
Higher
Gamma p
Lower Moderate

NDIA Systems Engineering EffectivenessNovember 15, 2007
51
SE Capability: Risk Management (RSKM)
Survey Questions
•strongly disagree•disagree•agree•strongly agree
This project's Risk Management process is integrated with program decision-makingPD12
•strongly disagree•disagree•agree•strongly agree
This project has a Risk Management process that assesses risk against achievement of an event-based schedule
PD11d
•strongly disagree•disagree•agree•strongly agree
This project has a Risk Management process that monitors and reports the status of risk mitigation activities and resources
PD11c
•strongly disagree•disagree•agree•strongly agree
This project has a Risk Management process that creates and maintains up-to-date documentation of risk mitigation plans and contingency plans for selected risks
PD11b
•strongly disagree•disagree•agree•strongly agree
This project has a Risk Management process that creates and maintains an accurate and up-to-date list of risks affecting the project (e.g., risks to cost, risks to schedule, risks to performance)
PD11a
Response rangeQuestionID

NDIA Systems Engineering EffectivenessNovember 15, 2007
52
SE Capability: Trade Studies (TRADE)
Moderately strong to strong positive relationship
Relationship to project performance:
Maximum = 4.0 3rd Quartile = 3.7 Median = 3.0 1st Quartile = 2.3 Minimum = 1.0 N = 58
SE Capability
Min. Range
# Lo # Med
#Hi
Max. Range
Min. Range
# Lo # Med
#Hi
Max. Range
Min. Range
# Lo # Med
#Hi
Max. Range
TRADE 37% 3.0% 1.0 39% 44% 17% 2.7 2.7 42% 41% 17% 3.3 3.3 19% 32% 49% 4.0
Higher
Gamma p
Lower Moderate

NDIA Systems Engineering EffectivenessNovember 15, 2007
53
SE Capability: Trade Studies (TRADE)
Survey Questions
•strongly disagree•disagree•agree•strongly agree
Documentation of trade studies is maintained in a defined repository and is accessible to all relevant project staff
RD13
•strongly disagree•disagree•agree•strongly agree
This project performs and documents trade studies between alternate solutions based upon definitive and documented selection criteria
RD12
•strongly disagree•disagree•agree•strongly agree
Stakeholders impacted by trade studies are involved in the development and performance of those trade studies
RD11
Response rangeQuestionID

NDIA Systems Engineering EffectivenessNovember 15, 2007
54
SE Capability: Technical Solution (TS)
Moderately strong positive relationshipRelationship to project performance:
Maximum = 4.0 3rd Quartile = 3.3 Median = 2.9 1st Quartile = 2.6 Minimum = 2.1 N = 57
Note: TS is a composite measure equivalent to ARCH + TRADE.
SE Capability
Min. Range
# Lo # Med
#Hi
Max. Range
Min. Range
# Lo # Med
#Hi
Max. Range
Min. Range
# Lo # Med
#Hi
Max. Range
TS 36% 3.0% 1.0 40% 53% 7% 2.8 2.8 33% 40% 27% 3.2 3.2 27% 27% 46% 4.0
Higher
Gamma p
Lower Moderate
NDIA Systems Engineering EffectivenessNovember 15, 2007
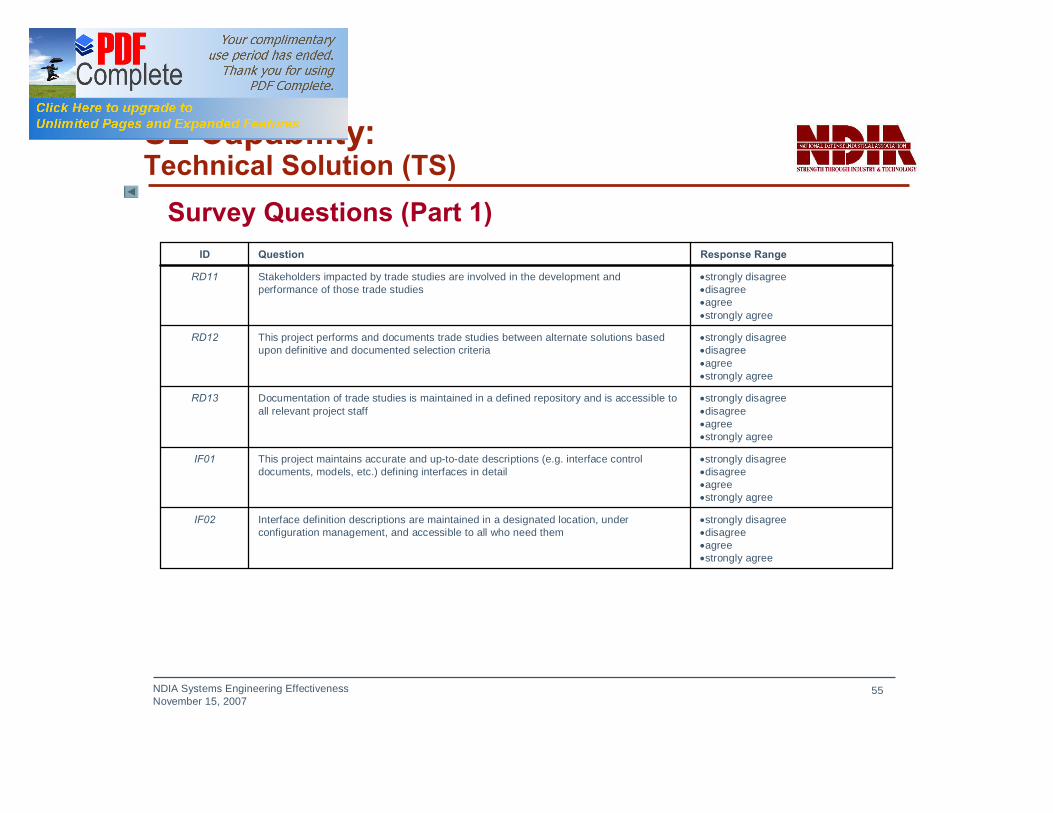
55
SE Capability: Technical Solution (TS)
Survey Questions (Part 1)
•strongly disagree•disagree•agree•strongly agree
Interface definition descriptions are maintained in a designated location, under configuration management, and accessible to all who need them
IF02
•strongly disagree•disagree•agree•strongly agree
This project maintains accurate and up-to-date descriptions (e.g. interface control documents, models, etc.) defining interfaces in detail
IF01
•strongly disagree•disagree•agree•strongly agree
Documentation of trade studies is maintained in a defined repository and is accessible to all relevant project staff
RD13
•strongly disagree•disagree•agree•strongly agree
This project performs and documents trade studies between alternate solutions based upon definitive and documented selection criteria
RD12
•strongly disagree•disagree•agree•strongly agree
Stakeholders impacted by trade studies are involved in the development and performance of those trade studies
RD11
Response RangeQuestionID
NDIA Systems Engineering EffectivenessNovember 15, 2007
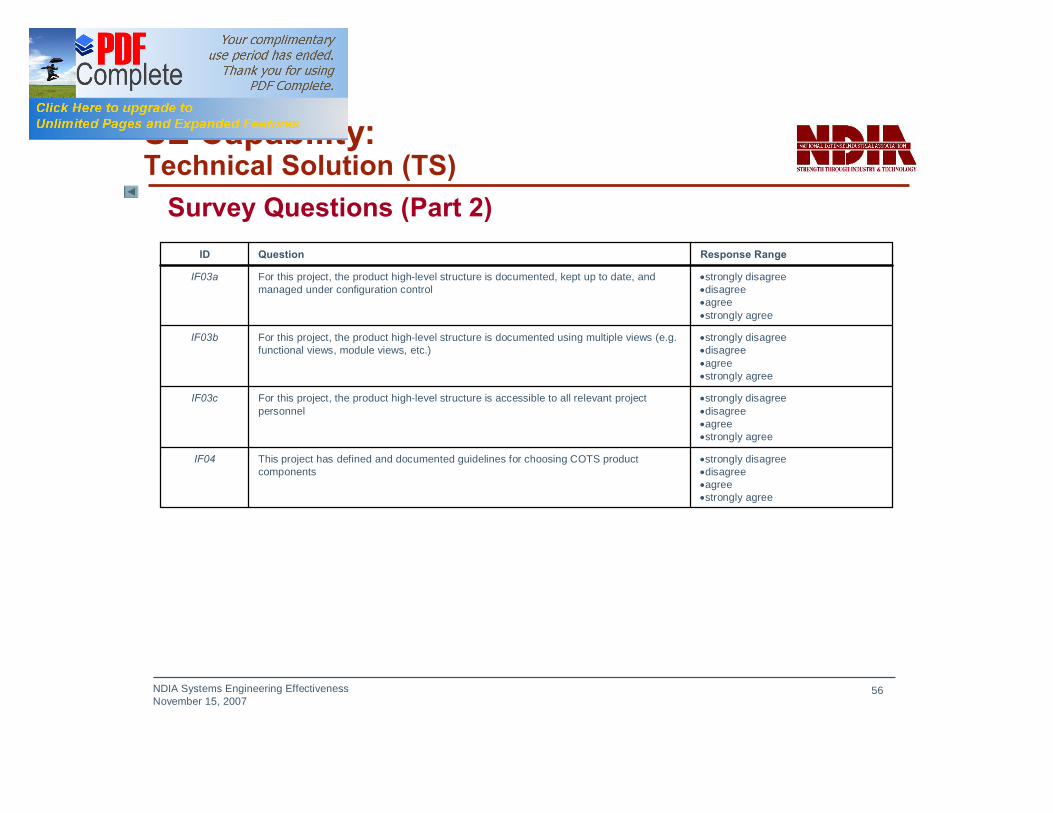
56
SE Capability: Technical Solution (TS)
Survey Questions (Part 2)
•strongly disagree•disagree•agree•strongly agree
This project has defined and documented guidelines for choosing COTS product components
IF04
•strongly disagree•disagree•agree•strongly agree
For this project, the product high-level structure is accessible to all relevant project personnel
IF03c
•strongly disagree•disagree•agree•strongly agree
For this project, the product high-level structure is documented using multiple views (e.g. functional views, module views, etc.)
IF03b
•strongly disagree•disagree•agree•strongly agree
For this project, the product high-level structure is documented, kept up to date, and managed under configuration control
IF03a
Response RangeQuestionID
NDIA Systems Engineering EffectivenessNovember 15, 2007
57
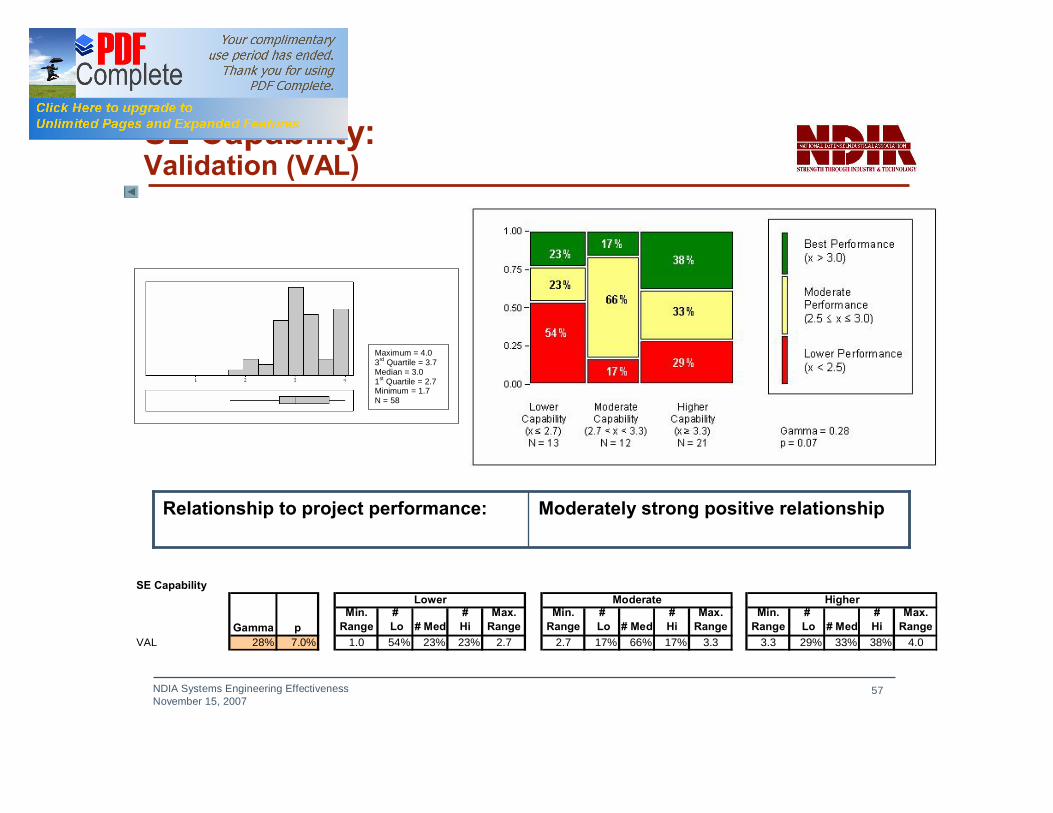
SE Capability: Validation (VAL)
Moderately strong positive relationshipRelationship to project performance:
Maximum = 4.0 3rd Quartile = 3.7 Median = 3.0 1st Quartile = 2.7 Minimum = 1.7 N = 58
SE Capability
Min. Range
# Lo # Med
#Hi
Max. Range
Min. Range
# Lo # Med
#Hi
Max. Range
Min. Range
# Lo # Med
#Hi
Max. Range
VAL 28% 7.0% 1.0 54% 23% 23% 2.7 2.7 17% 66% 17% 3.3 3.3 29% 33% 38% 4.0
Higher
Gamma p
Lower Moderate
NDIA Systems Engineering EffectivenessNovember 15, 2007
58
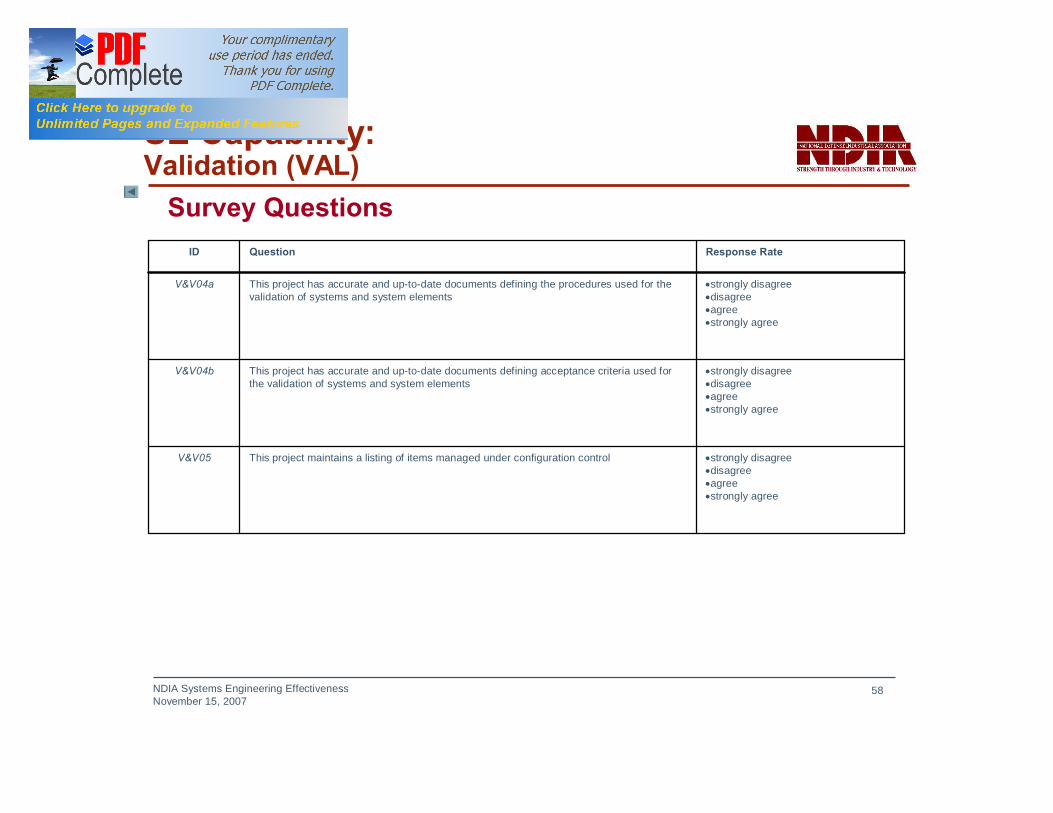
SE Capability: Validation (VAL)
Survey Questions
•strongly disagree•disagree•agree•strongly agree
This project maintains a listing of items managed under configuration controlV&V05
•strongly disagree•disagree•agree•strongly agree
This project has accurate and up-to-date documents defining acceptance criteria used for the validation of systems and system elements
V&V04b
•strongly disagree•disagree•agree•strongly agree
This project has accurate and up-to-date documents defining the procedures used for the validation of systems and system elements
V&V04a
Response RateQuestionID
NDIA Systems Engineering EffectivenessNovember 15, 2007
59
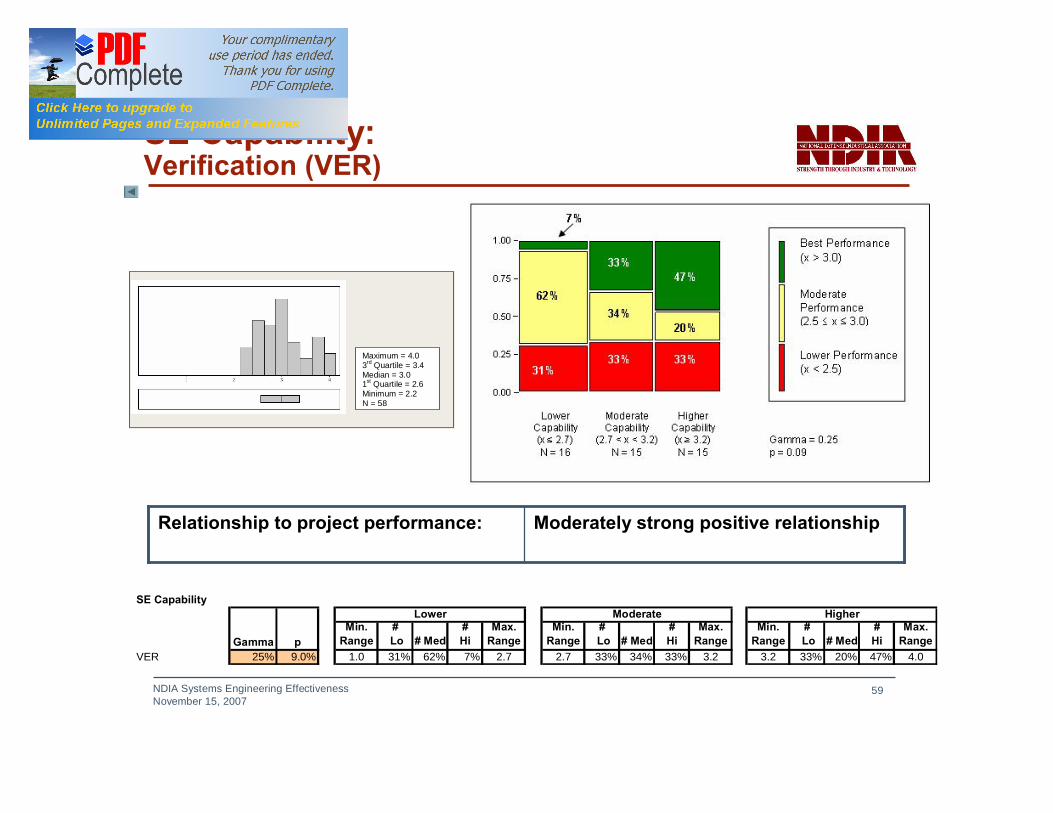
SE Capability: Verification (VER)
Moderately strong positive relationshipRelationship to project performance:
Maximum = 4.0 3rd Quartile = 3.4 Median = 3.0 1st Quartile = 2.6 Minimum = 2.2 N = 58
SE Capability
Min. Range
# Lo # Med
#Hi
Max. Range
Min. Range
# Lo # Med
#Hi
Max. Range
Min. Range
# Lo # Med
#Hi
Max. Range
VER 25% 9.0% 1.0 31% 62% 7% 2.7 2.7 33% 34% 33% 3.2 3.2 33% 20% 47% 4.0
Higher
Gamma p
Lower Moderate

NDIA Systems Engineering EffectivenessNovember 15, 2007
60
SE Capability: Verification (VER)
Survey Questions (Part 1)
•strongly disagree•disagree•agree•strongly agree
This project has a documented and practiced review (e.g. peer reviews, design reviews, etc.) process that examines completeness of configuration baselines
V&V02f
•strongly disagree•disagree•agree•strongly agree
This project has a documented and practiced review (e.g. peer reviews, design reviews, etc.) process that addresses identified risks and risk mitigation activities during reviews
V&V02e
•strongly disagree•disagree•agree•strongly agree
This project has a documented and practiced review (e.g. peer reviews, design reviews, etc.) process that includes training requirements for the reviewers
V&V02b
•strongly disagree•disagree•agree•strongly agree
This project has a documented and practiced review (e.g. peer reviews, design reviews, etc.) process that defines entry and exit criteria for work products
V&V02a
•strongly disagree•disagree•agree•strongly agree
This project has accurate and up-to-date documents defining acceptance criteria used for the verification of systems and system elements
V&V01b
•strongly disagree•disagree•agree•strongly agree
This project has accurate and up-to-date documents defining the procedures used for the test and verification of systems and system elements
V&V01a
Response rangeQuestionID
NDIA Systems Engineering EffectivenessNovember 15, 2007
61
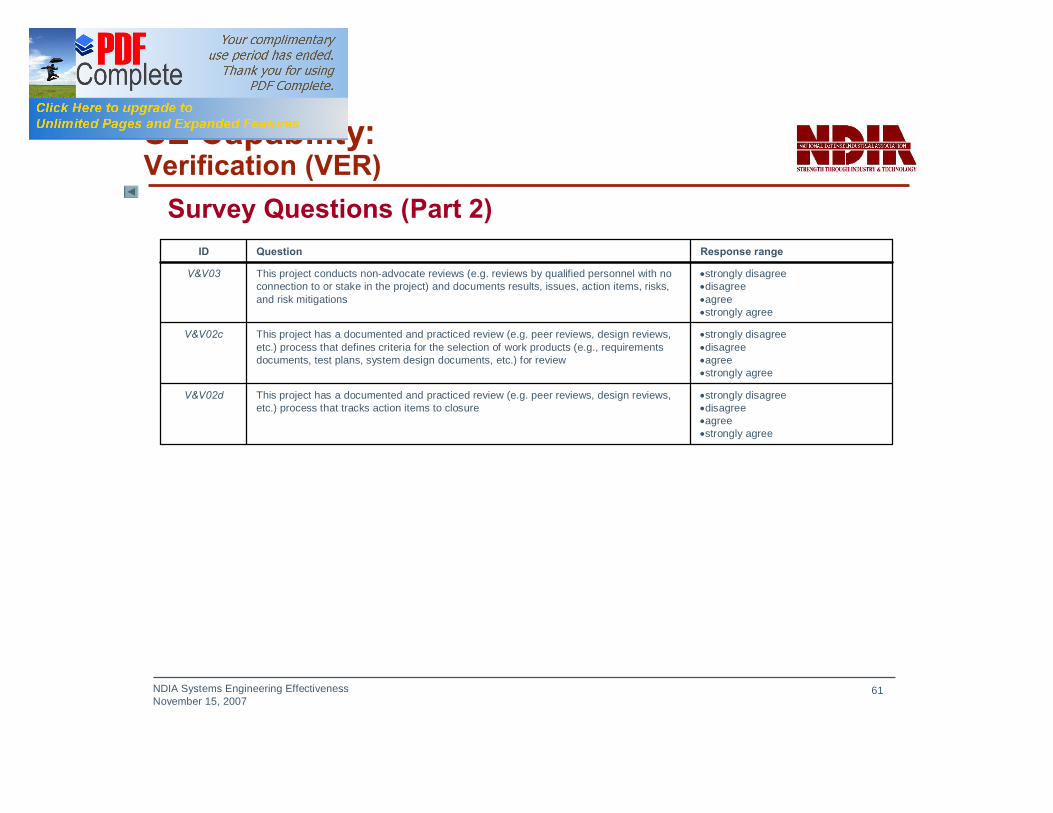
SE Capability: Verification (VER)
Survey Questions (Part 2)
•strongly disagree•disagree•agree•strongly agree
This project has a documented and practiced review (e.g. peer reviews, design reviews, etc.) process that tracks action items to closure
V&V02d
•strongly disagree•disagree•agree•strongly agree
This project has a documented and practiced review (e.g. peer reviews, design reviews, etc.) process that defines criteria for the selection of work products (e.g., requirements documents, test plans, system design documents, etc.) for review
V&V02c
•strongly disagree•disagree•agree•strongly agree
This project conducts non-advocate reviews (e.g. reviews by qualified personnel with no connection to or stake in the project) and documents results, issues, action items, risks, and risk mitigations
V&V03
Response rangeQuestionID
NDIA Systems Engineering EffectivenessNovember 15, 2007
62
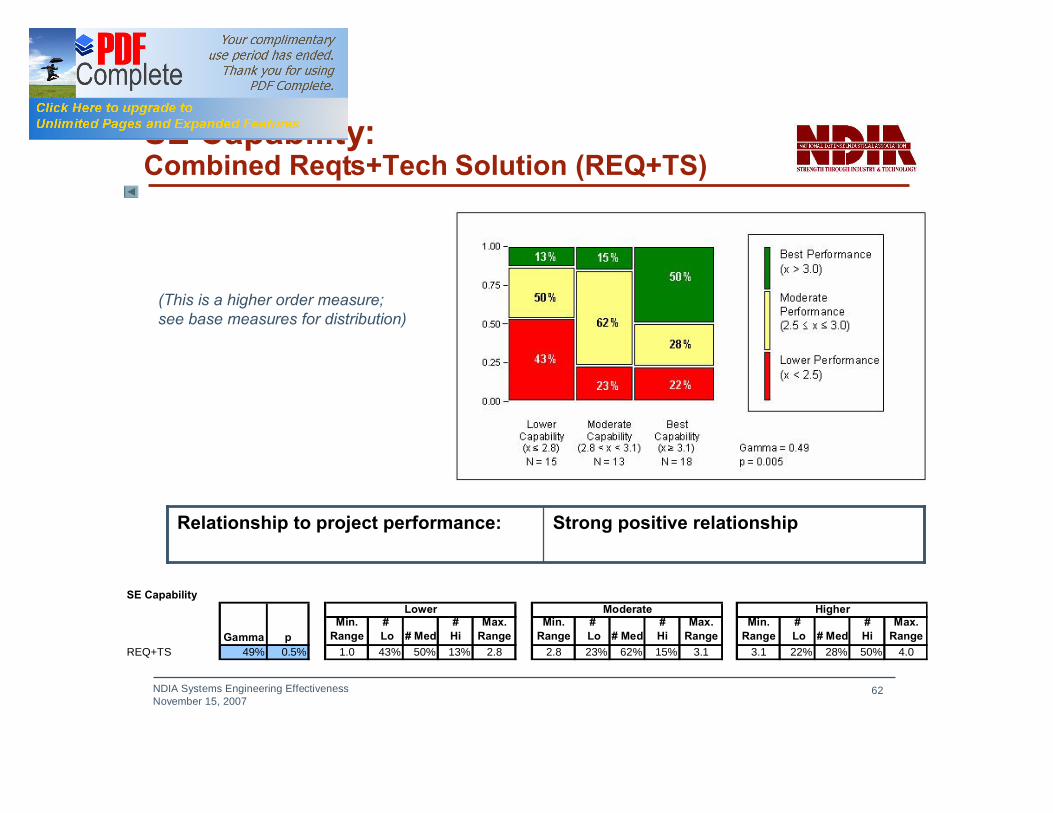
SE Capability: Combined Reqts+Tech Solution (REQ+TS)
Strong positive relationshipRelationship to project performance:
(This is a higher order measure; see base measures for distribution)
SE Capability
Min. Range
# Lo # Med
#Hi
Max. Range
Min. Range
# Lo # Med
#Hi
Max. Range
Min. Range
# Lo # Med
#Hi
Max. Range
REQ+TS 49% 0.5% 1.0 43% 50% 13% 2.8 2.8 23% 62% 15% 3.1 3.1 22% 28% 50% 4.0
Higher
Gamma p
Lower Moderate

NDIA Systems Engineering EffectivenessNovember 15, 2007
63
SE Capability: Total Systems Engineering Capability
Moderately strong positive relationshipRelationship to project performance:
Maximum = 3.9 3rd Quartile = 3.3 Median = 3.0 1st Quartile = 2.7 Minimum = 2.1 N = 63
SE Capability
Min. Range
# Lo # Med
#Hi
Max. Range
Min. Range
# Lo # Med
#Hi
Max. Range
Min. Range
# Lo # Med
#Hi
Max. Range
Overall SEC 32% 4.0% 1.0 39% 46% 15% 2.5 2.5 29% 59% 12% 3.0 3.0 31% 13% 56% 4.0
Higher
Gamma p
Lower Moderate
NDIA Systems Engineering EffectivenessNovember 15, 2007
64
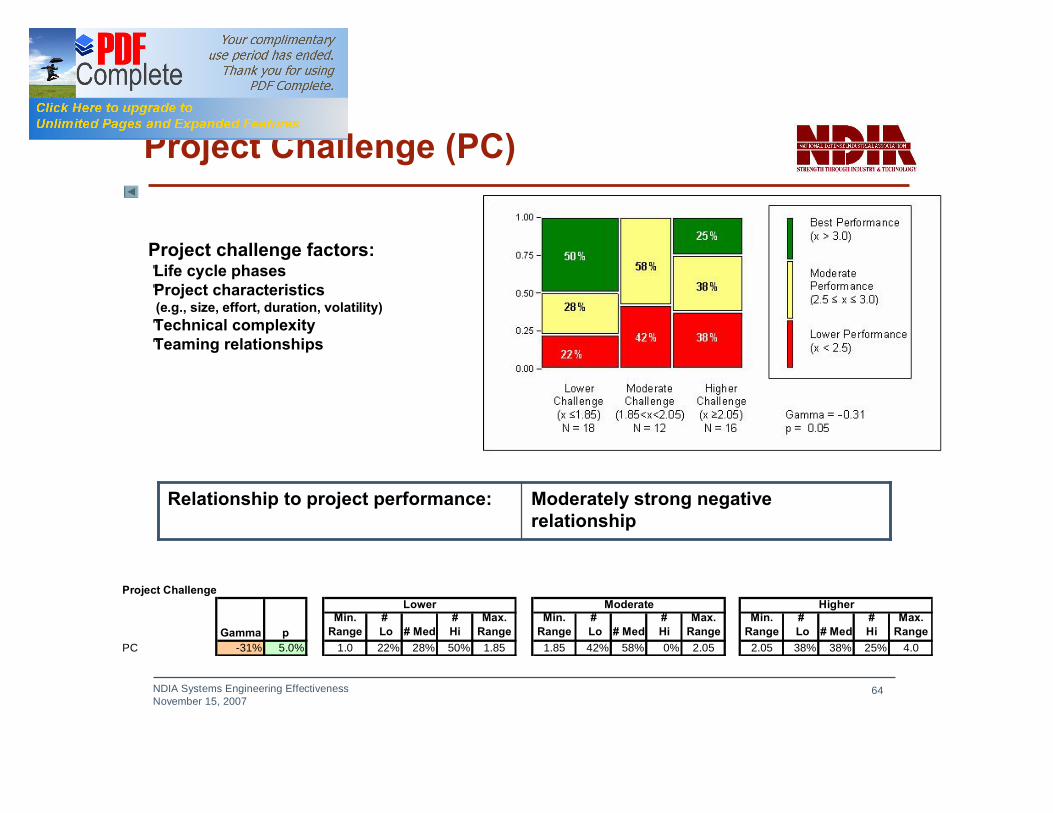
Project Challenge (PC)
Project challenge factors:•Life cycle phases•Project characteristics
(e.g., size, effort, duration, volatility)•Technical complexity•Teaming relationships
Moderately strong negative relationship
Relationship to project performance:
Project Challenge
Min. Range
# Lo # Med
#Hi
Max. Range
Min. Range
# Lo # Med
#Hi
Max. Range
Min. Range
# Lo # Med
#Hi
Max. Range
PC -31% 5.0% 1.0 22% 28% 50% 1.85 1.85 42% 58% 0% 2.05 2.05 38% 38% 25% 4.0
Higher
Gamma p
Lower Moderate
NDIA Systems Engineering EffectivenessNovember 15, 2007
65
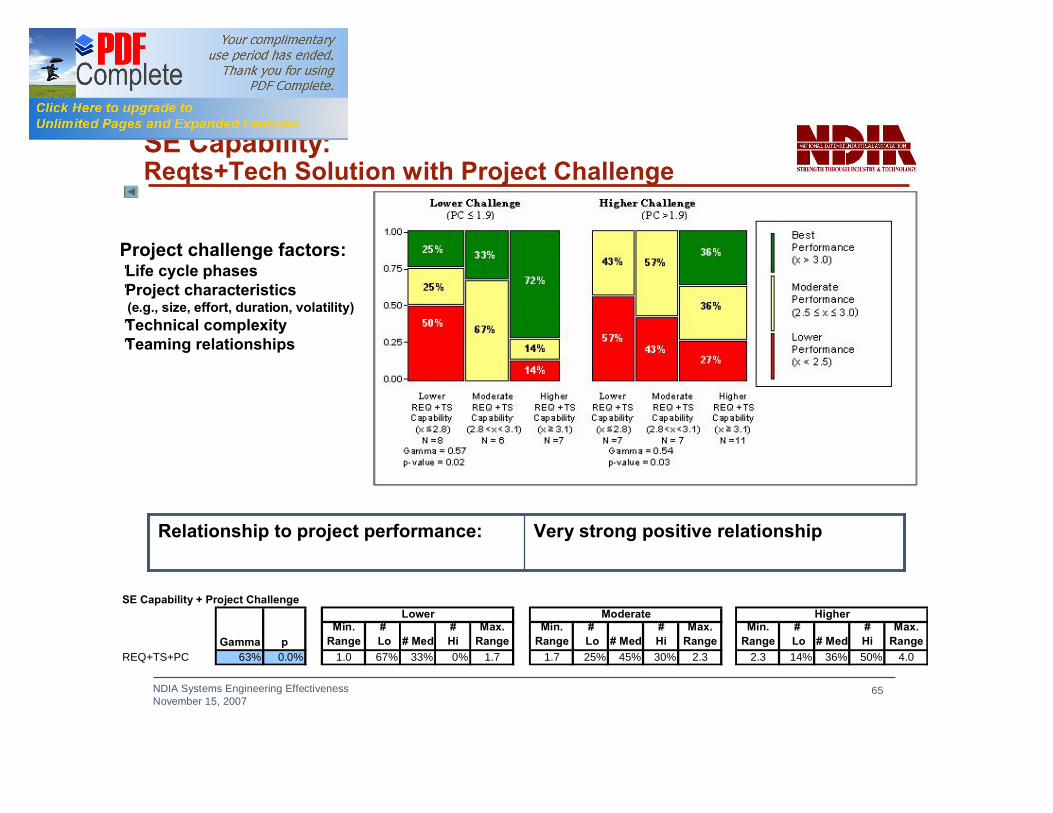
SE Capability:Reqts+Tech Solution with Project Challenge
Very strong positive relationshipRelationship to project performance:
SE Capability + Project Challenge
Min. Range
# Lo # Med
#Hi
Max. Range
Min. Range
# Lo # Med
#Hi
Max. Range
Min. Range
# Lo # Med
#Hi
Max. Range
REQ+TS+PC 63% 0.0% 1.0 67% 33% 0% 1.7 1.7 25% 45% 30% 2.3 2.3 14% 36% 50% 4.0
Higher
Gamma p
Lower Moderate
Project challenge factors:•Life cycle phases•Project characteristics
(e.g., size, effort, duration, volatility)•Technical complexity•Teaming relationships
NDIA Systems Engineering EffectivenessNovember 15, 2007
66
Relating Project Performance to Project Challenge and SE Capability

NDIA Systems Engineering EffectivenessNovember 15, 2007
67
Reqts + Tech Solution + Project Challenge and Performance
Project challenge factors:•Life cycle phases•Project characteristics
(e.g., size, effort, duration, volatility)•Technical complexity•Teaming relationships
NDIA Systems Engineering EffectivenessNovember 15, 2007
68
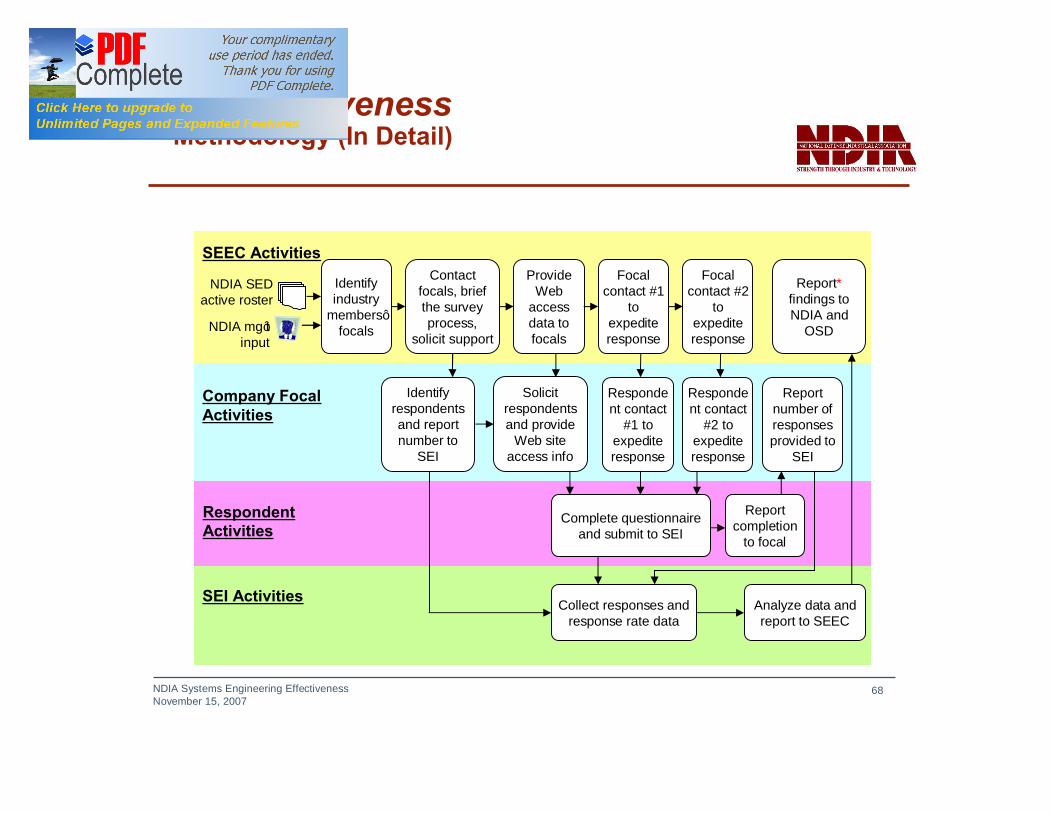
SE EffectivenessMethodology (In Detail)
NDIA SED active roster
Identify industry
members’focalsNDIA mg’t
input
Contact focals, brief the survey process,
solicit support
Identify respondents and report number to
SEI
Provide Web
access data to focals
Solicit respondents and provide
Web site access info
Complete questionnaire and submit to SEI
SEEC Activities
Company FocalActivities
Respondent Activities
SEI Activities Collect responses and response rate data
Report number of responses provided to
SEI
Analyze data and report to SEEC
Report*findings to NDIA and
OSD
Report completion
to focal
Focal contact #1
to expedite response
Focal contact #2
to expedite response
Respondent contact
#1 to expedite response
Respondent contact
#2 to expedite response
NDIA Systems Engineering EffectivenessNovember 15, 2007
69
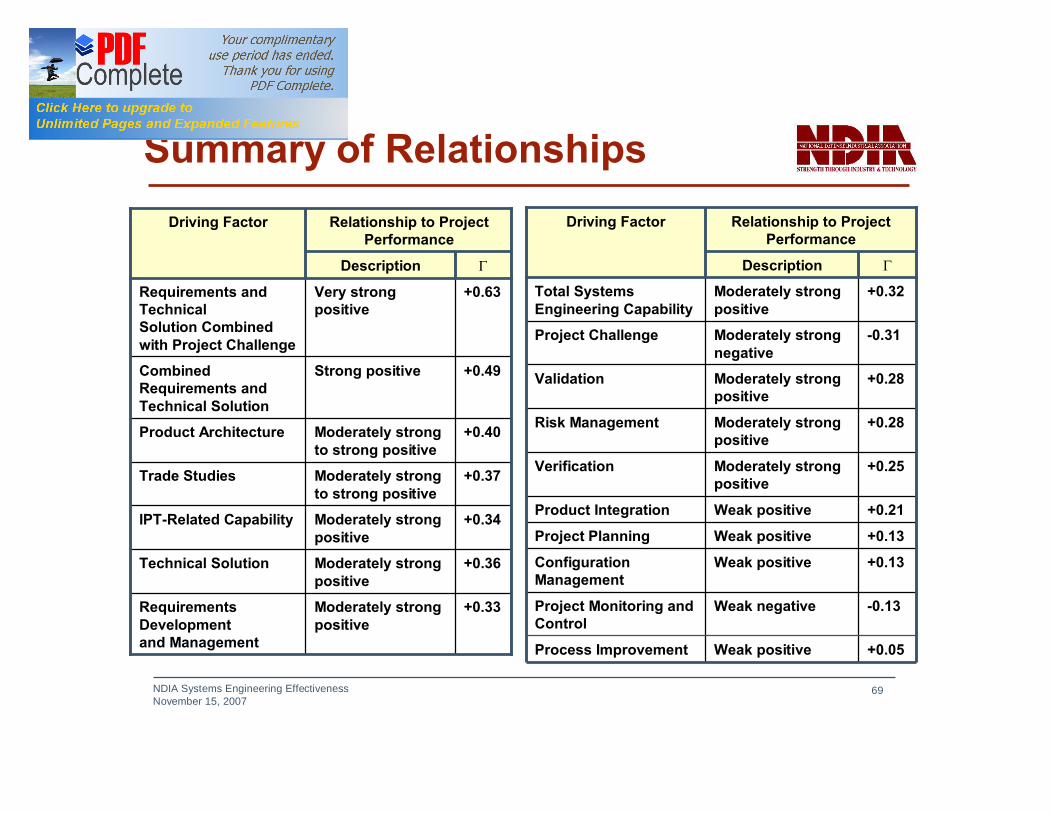
Summary of Relationships
+0.33Moderately strong positive
Requirements Development and Management
+0.36Moderately strong positive
Technical Solution
+0.34Moderately strong positive
IPT-Related Capability
+0.37Moderately strong to strong positive
Trade Studies
+0.40Moderately strong to strong positive
Product Architecture
+0.49Strong positiveCombined Requirements and Technical Solution
+0.63Very strong positive
Requirements and TechnicalSolution Combined with Project Challenge
ΓDescription
Relationship to Project Performance
Driving Factor
-0.13Weak negative Project Monitoring and Control
ΓDescription
Relationship to Project Performance
Driving Factor
+0.05Weak positive Process Improvement
+0.13Weak positive Configuration Management
+0.13Weak positive Project Planning
+0.21Weak positive Product Integration
+0.25Moderately strong positive
Verification
+0.28Moderately strong positive
Risk Management
+0.28Moderately strong positive
Validation
-0.31Moderately strong negative
Project Challenge
+0.32Moderately strong positive
Total Systems Engineering Capability